Submitted:
10 March 2026
Posted:
11 March 2026
You are already at the latest version
Abstract
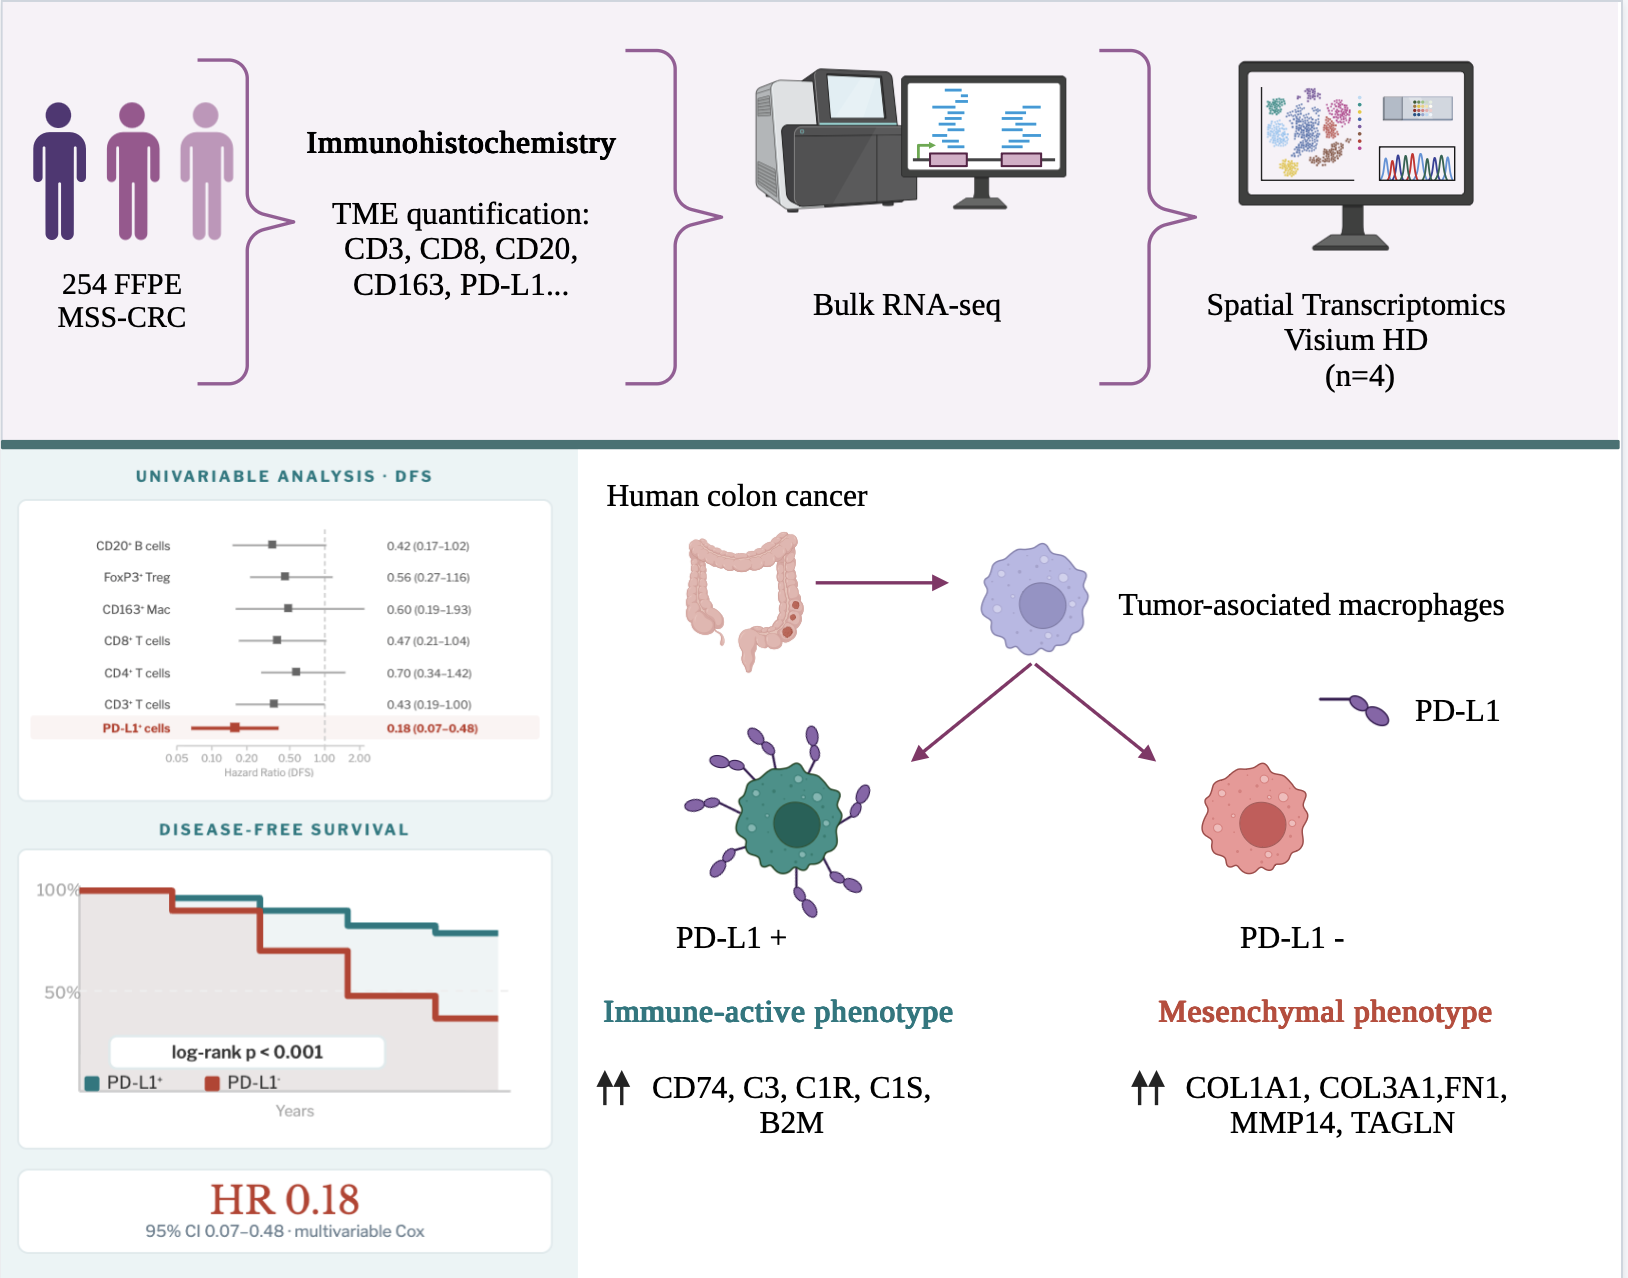
Background/Objectives: MSS-CRC comprises a heterogeneous group of tumors generally considered “immune cold” due to limited neoantigen generation and T-cell exclusion or inactivation. Current evidence indicates that the composition of T and B immune cells within the tumor microenvironment represents a prognostically relevant factor, significantly associated with both tumor expression profiles and molecular subtypes. Methods: We conducted an exploratory analysis to identify prognostically relevant immune cell components in this group of tumors and to investigate corresponding differences in RNA-based bulk expression and high-resolution spatial transcriptomic profiles. Results: A total of 254 cases of localized mismatch repair-proficient colorectal cancer cases were evaluated. Our findings revealed PD-L1 expression as a robust, independent prognostic biomarker associated with favorable outcomes in this specific population. Bulk RNA expression analysis showed that PD-L1–negative tumors exhibited an expression profile consistent with abundant cancer-associated fibroblast infiltration, increased matrix stiffness, and impaired immune activation—features aligned with tumor progression and poorer clinical outcomes. In contrast, PD-L1–positive tumors displayed stromal programs enriched in immune activation and controlled remodeling, consistent with an immunologically active microenvironment. Spatial transcriptomics added an additional layer of evidence, revealing that epithelial-to-mesenchymal transition–related programs can dominate stromal niches in PD-L1–negative tumors, particularly within macrophage-enriched stromal regions. Conclusions: Our observations suggest a crosstalk link between PD-L1 expression on immune cells and immune-activated vs mesenchymal-dominant states driven within tumor-associated macrophage-enriched stromal niches. These results provide insight into the biological mechanisms underlying disease progression and highlight tumor-associated macrophages as a potential therapeutic target to overcome immune resistance particularly in PD-L1–negative MSS-CRC tumors.
Keywords:
microsatellite stable
; colorectal cancer
; PD-L1
; Tumor-associated macrophages
; mesenchymal
1. Introduction
Colorectal cancer (CRC) remains the most common gastrointestinal cancer and the third leading cause of cancer-related death in both men and women [1]. Although early-onset (new diagnosis in individuals <50 years) CRC incidence rates are rising, the overall prognosis has improved considerably over the past two decades, largely due to advances in surgical and clinical management, the development of novel therapeutic agents, refinement of patient selection, and early detection through screening programs [2,3,4,5]. The recognition of microsatellite instability (MSI) as a key prognostic and predictive biomarker in both localized and metastatic CRC has also contributed significantly to this trend [6]. MSI-positive CRC is highly immunogenic, characterized by strong tumor-specific immune activation, and demonstrates substantial clinical benefit from treatment with immune checkpoint inhibitors (ICI) [7]. However, most CRC cases (80-85% localized and <5% metastatic) show no significant alterations in microsatellite length (microsatellite stable, MSS). These tumors are generally considered “immune cold” due to limited neoantigen generation and T-cell exclusion or inactivation [8]. Nevertheless, MSS CRC represents a heterogeneous group of tumors, and novel drug combinations—including immunotherapy—have thus far yielded only modest clinical efficacy [8,9].
In 2006, Galon et al. demonstrated the type, location, and density of immune T cells within the tumor microenvironment (TME) are strong predictors of patients’ survival in CRC, independent of MSI status [10,11,12]. An activated B-cell response also plays a significant role in CRC progression allowing the generation of effector memory B cells and antibody-producing plasma cells within tertiary lymphoid structures (TLSs) [13]. Bulk transcriptomic analyses led to the identification of four consensus molecular subtypes (CMS) that differ in molecular profile and clinical outcomes, each of them associated with distinct immune signatures [14]. More recent advances in single-cell technologies have further revealed intricate crosstalk among several immune cell types, tumor cells and other components of the TME leading cancer progression and immune evasion in CRC [15,16,17,18].
Based on these insights, we designed an exploratory analysis to uncover prognostically relevant TME features in MSS CRC and to investigate corresponding differences in RNA-based expression bulk and high-definition spatial transcriptomics profiles. Gaining deeper insights into the TME composition may be critical for uncovering targetable pathways to overcome immune evasion in this challenging tumor subset.
2. Materials and Methods
2.1. Patient Cohorts
Two cohorts of patients with localized mismatch repair-proficient (MMRp) CRC who underwent curative-intent surgery at the Hospital Clínico Universitario of Valencia (Spain) were analyzed. The first cohort, collected retrospectively, included all cases diagnosed between January 2015 and December 2017. The second cohort was prospectively recruited between March 2021 and December 2023. All cases with loss of expression of any mismatch repair (MMR) protein detected by immunohistochemistry (IHC) were excluded from the analysis. For each case, 2–3 formalin-fixed, paraffin-embedded (FFPE) representative tissue blocks were collected. Clinical and follow-up data were retrieved from medical records. Ethical approval was granted by the INCLIVA Health Research Institute Ethics Committee. No formal comparison of clinical or pathological features between cohorts was performed, as the prospective cohort was used solely for clinical and immunohistochemical validation.
2.2. Histological Evaluation
2.2.1. Morphological Assessment
All hematoxylin and eosin (HE)–stained sections from each case were reviewed to assess histological differentiation, lymphovascular invasion (LVI), perineural invasion (PNI), depth of invasion (pT) and number of involved lymph nodes (pN). Tumor budding (TB) and tumor stroma (TS) were analyzed as previously described [19].
2.2.2. Immune Infiltrate Assessment
Quantitative assessment of the TME composition was performed by IHC. All IHC procedures were carried out on an automated platform (Autostainer Link 48, Agilent Technologies, Glostrup, Denmark). The following monoclonal antibodies were used: CD3 (Dako, IR503, Ready-to-Use, high pH), CD4 clone 4B12 (Dako, IR649, Ready-to-Use, high pH), CD8 clone C8/144B (Dako, IR623, Ready-to-Use, high pH), CD20cy clone L26 (Dako, IR604, Ready-to-Use, high pH), CD23 clone DAK-CD23 (Dako, IR781, Ready-to-Use, high pH), CD163 (Cell Signaling Technology, D6U1J, 1:400 dilution, high pH), FoxP3 (Cell Signaling Technology, D2W8E, 1:100 dilution, high pH), and PD-L1 clone 22C3 (Dako, SK006, Ready-to-Use, low pH).
Slides were digitized at 20× magnification (3DHistech P250, Hungary). Positive immune cells were quantified using QuPath (v4.0.0) [20] with a 1.5 µm cell expansion and a 0.15 positivity threshold. Three circular regions (800 µm × 800 µm) with the highest density of positive cells were manually annotated at both the invasive front (IF) and tumor center (TC). Lymphocyte content for CD3, CD4, CD8, and FoxP3 was categorized as high or low according to the mean value. CD163-positive macrophages were quantified manually at the IF and TC in one 20X hotspot microscopic field.
2.2.3. Tertiary Lymphoid Structures
TLSs were defined as nodular aggregates of ≥50 lymphocytes located at the IF in HE-stained sections or CD20 IHC. TLSs were manually quantified in a 1 mm² area. CD23 staining was used to classify TLSs containing follicular dendritic cells (FDCs) as mature (mTLS) and those lacking FDCs as immature (iTLS) [21]. CD20-positive cell density was also measured using QuPath (v4.0.0) across the IF including TLSs within 7 mm of the IF [20]. TLS density and CD20-positive B-cell infiltration were categorized into high and low based on the mean value.
2.2.4. PD-L1 Assessment
PD-L1 expression was evaluated visually as the percentage of positive immune cells (lymphocytes and macrophages) across the tumor area. Cases presenting staining in >1% immune cells were considered as PD-L1 positive. This threshold was selected after evaluating multiple cut-off values (1%, 5%, and 10%) based on their association with disease-free survival. The percentage of tumor cells showing membranous PD-L1 expression was recorded separately.
2.3. Transcriptomic Analysis
2.3.1. RNA Extraction
Representative tumor tissue was macrodissected from FFPE blocks. Total RNA was extracted using the RNeasy FFPE Kit (Qiagen) on the automated Qiacube Connect system, eluted in 30 µL RNase-free water, and assessed for quality and concentration using TapeStation (Agilent). Samples were stored at –80 °C.
2.3.2. CMS Subtype Analysis
Consensus Molecular Subtypes (CMS) were determined for 100 tumor samples in the retrospectively collected cohort by using a custom 38- gene NanoCRCA assay in a NanoString nCounter® platform (NanoString Technologies) as previously described [22].
2.3.3. mRNA Sequencing
Libraries were prepared and sequenced by Macrogen Inc. using the Illumina NovaSeq platform. FastQ data were aligned to the human reference genome (GRCh38), and gene expression was quantified using standard pipelines. Differentially expressed genes were identified using DESeq2 in R (v4.3.0), with significance defined as FDR-adjusted p < 0.05. Functional enrichment analysis was performed via over-representation analysis (ORA) using MSigDB Hallmarks. Epithelial to mesenchymal transition (EMT) score R package was used to evaluate EMT-related gene signatures [23]. EMTscore assigns a score based on epithelial and mesenchymal gene expression, allowing classification into epithelial or mesenchymal phenotypes. Transcriptomic analyses were performed exclusively in the retrospective cohort.
2.3.4. Spatial Transcriptomics
Spatial transcriptomics was performed using the Visium HD Spatial Gene Expression platform (10x Genomics). Four representative cases (two PD-L1 positive, two PD-L1 negative) were selected. FFPE blocks were sectioned (5 µm) hybridized with probes, captured via CytAssist, and libraries constructed using the Visium HD Spatial Gene Expression for FFPE Kit. Libraries were sequenced at Macrogen Inc. (150 bp paired end reads). Raw FastQ data were processed with the Space Ranger pipeline, aligning reads to GRCh38 and the probe-specific reference. The workflow included barcode and UMI extraction, error correction, spatial binning (8 µm × 8 µm), and tissue barcode filtering. HE references images were aligned to CytAssist images using fiducial markers. Clusters were automatically generated via dimensionality reduction and supervised clustering visualized in Loupe Browser (v8.1.2). Macrophage-associated clusters (CD163, CD68, CD14, F3, LYZ) and stromal clusters were selected, and cluster-specific gene expression was compared between PD-L1 positive and negative samples using Seurat R package (v4.4.0) [24].
2.3.5. Functional Analysis of Gene Interactions
To explore functional interactions among differentially expressed genes, a network analysis was performed using STRING (Search Tool for the Retrieval of Interacting Genes/Proteins) version 12.0 [25,26]. The list of overexpressed genes obtained from spatial transcriptomics was used, with “Homo sapiens” as the reference organism. Default parameters were applied (“full STRING network”) with a medium confidence threshold of 0.4. The generated network represents known and predicted interactions among the proteins encoded by the genes of interest, including direct and indirect associations based on co-expression, databases, literature, and bioinformatic predictions. The network was exported as an image for visualization and interpretation, allowing the identification of highly connected functional clusters.
2.4. Statistical Analysis
All statistical analyses were performed using R software (v4.3.0, R Core Team, Vienna, Austria). A significance threshold of p ≤ 0.05 was applied for all tests [24].
2.4.1. Descriptive and Association Analyses
A comprehensive statistical analysis was conducted for clinical, histological, immunohistochemical, and transcriptomic variables. Associations between categorical variables were assessed using Pearson’s chi-square test (χ²). Odds ratios (OR) with 95% confidence intervals (CI) were calculated using binary logistic regression. Correlations between numerical variables were assessed according to their distribution. Normality was tested using the Shapiro-Wilk test. If normality was rejected (p < 0.05), non-parametric tests were applied: Wilcoxon test for two groups or Kruskal-Wallis test for more than two groups. For normally distributed data, homogeneity of variances was tested using Levene’s test, followed by independent samples Student’s t-test as appropriate. Relationships between quantitative variables were further analyzed using Spearman’s correlation coefficient, with values near 1 or –1 indicating strong direct or inverse correlations, respectively.
2.4.2. Survival Analysis
Disease-free survival (DFS) was defined as the time from curative-intent colectomy to the occurrence of the first relapse or metastasis. Survival functions were compared between groups using the log-rank test. DFS was visualized using Kaplan-Meier curves, and p-values were calculated with the χ² test to assess differences between curves. Hazard ratios (HR) and 95% CIs were estimated using the Cox proportional hazards model. Potential interactions among variables significantly associated with recurrence or progression were further evaluated using multivariate Cox regression models to identify independent predictors.
3. Results
3.1. General Clinicopathological Features
A total of 254 cases of localized MMRp CRC were evaluated, of which 185 were collected retrospectively and 69 prospectively. (Table 1). The mean age at diagnosis was 65 years (range 37–82), and the sex distribution was balanced. Most tumors were in the left colon (58.3%), followed by the right colon (29.9%) and rectum (11.8%). Classical adverse pathological features, such as LVI, PNI, and poor differentiation, were observed in 27.2%, 18.9%, and 21.3% of cases, respectively.
Although MMR deficient cases were excluded during case selection, 15 (15%) of the series were still classified as CMS1. Cases classified as CMS1 were re-evaluated, confirming preserved MMR protein expression in all instances. In addition, all cases were confirmed as MSS through PCR (Idylla™, Biocartis).
3.2. Tumor Microenvironment Composition
The density of CD3+, CD4+, CD8+, CD163+, and FoxP3+ immune cells was significantly higher at the IF compared with the TC (all p < 0.001) (Figure 1A-E). A strong positive correlation was found between CD3 and CD8 cell densities at the IF (Spearman’s ρ = 0.61, p < 0.001). No significant associations were observed between immune cell densities and adverse histopathological features.
TLSs were identified in 71.6% of cases using HE and in 90.3% of cases by CD20 IHC, demonstrating a moderate correlation between the two methods (ρ = 0.44, p < 0.001). By IHC, 43.2% of cases were classified as TLS-high versus 37.7% by HE. Most cases (66%) presented mTLS, characterized by the presence of CD23+ follicular dendritic cells (Figure 1F-K).
CD20+ B-cell density at the IF was high in 49.7% of cases, strongly correlating with the number of TLSs (ρ = 0.74, p < 0.001). Tumors with TLSs were significantly enriched in CD3+ T cells at the IF (mean 1,348.8 vs 780.5 cells/mm², p = 0.032) (Figure 1L). 78.4% of TLS-positive cases had high CD3 density compared to 50% of TLS-negative cases (p = 0.007). TLS presence was also associated with higher CD4+ T-cell density at the TC (12.6 vs 1.3 cells/mm², p = 0.026) (Figure 1M), a similar pattern was observed at the IF (p = 0.052). Regulatory T cells (FoxP3+) tended to be more abundant in TLS-positive tumors at both TC and IF, although without statistical significance (data not shown). Conversely, macrophage density (CD163+) was significantly lower at the IF in TLS-positive tumors (310 vs 517.5 cells/mm², p = 0.019) (Figure 1N). TLS-negative tumors were more frequently associated with high CD163+ density (87.5% vs 48.8%, p = 0.036).
Mature TLSs were linked to significantly higher infiltration of CD3+ T cells at the IF (53.05 vs 20.22 cells/mm², p = 0.009) and increased CD8+ T-cell density at both TC and IF (p = 0.003 and p = 0.022, respectively) compared to iTLSs (Figure 1Ñ-O). Mesenchymal CMS4 cases showed the highest TLS content compared with CMS2/3 subtypes, both in analyses based on HE (p = 0.020) and CD20 IHC (p = 0.003). (Figure 1P)
3.3. PD-L1 Expression in Immune Cells: Clinical and Prognostic Implications
Tumor cell PD-L1 positivity was rare (<5% of cases) and showed no significant association with clinical outcome. In contrast, PD-L1 expression in immune cells was observed in 70% of cases, predominantly within the lymphoid infiltrate at the tumor IF (Figure 2A-B). PD-L1–positive immune cell cases were strongly linked to higher densities of CD163 positive macrophages at the IF (p = 0.019; mean 380 in PD-L1–positive vs 220 in PD-L1–negative cases, p = 0.001; CD163 low odd ratio [OR] 0.37 [0.13-0.96] p=0.049; CD163 high OR [2.14-11.28] p<0.001) (Figure 2C-D) Moreover, CD163 density was positively correlated with the content of CD3 (p=0.018) and CD8 (p=0.013) positive cells at the IF (Supplementary figure A1 A-B).
In univariable analysis, immune cell PD-L1 expression was significantly associated with early clinical stage and absence of adverse prognostic factors. (Table 2) PD-L1 expression was the only TME factor significantly associated with prognosis (Figure 2E). Patients with PD-L1–positive immune cells showed significantly improved DFS compared with PD-L1–negative cases (HR = 0.18, 95% CI 0.07–0.48, p = 0.001; 5-year DFS: 73% vs 52%, log-rank p < 0.001) (Figure 2F). Among the evaluated thresholds, the 1% cut-off was the only one significantly associated with DFS. Low CD3+ T-cell density in the TC and low CD20+ B-cell density showed only borderline associations with increased risk of recurrence (CD3 in TC: HR = 2.32, 95% CI 1.00–5.39, p = 0.050; CD20: HR = 2.41, 95% CI 0.98–5.89, p = 0.054) (Supplementary figure A1 C-D). Lymph node invasion was significantly associated with DFS (HR = 4.52, 95% CI 2.09–9.78, p=0.000).
No other clinical or histological variables were associated with prognosis. Both, lymph node invasion and PD-L1 expression retained their prognostic value in multivariable analysis (lymph node invasion HR = 3.23, 95% CI 1.14-9.31, p=0.028; PD-L1 positive HR = 0.24, 95% CI 0.08-0.66, p = 0.006).
Finally, we explored the clinical value of the combination of PD-L1 expression in immune cells (positive/negative) and the clinical stage into one stratification system feasible to implement in clinical practice. For this, patients were stratified in four groups: PD-L1–positive / stage I–II, PD-L1–positive / stage III, PD-L1–negative / stage I–II and PD-L1–negative / stage III. In the survival analysis, the four categories demonstrated a significant correlation with DFS (HR = 10.46, CI 1.22-89.61, p=0.032 for PD-L1–positive / stage III; HR = 15.56, CI 1.74-139.31, p= 0.014 for PD-L1–negative / stage I–II; and HR = 29.12, CI 3.63-233.77, p = 0.002 for PD-L1–negative / stage III respectively) (Figure 2G). Interestingly, negative PD-L1 expression was significantly associated with the worse-prognosis subgroup defined by the tumor budding–stromal content (TBS) score, previously published by our group (data not shown) [19].
Importantly, in multivariable analysis including clinical stage and classical pathological features, immune cell PD-L1 positivity emerged as the strongest independent prognostic factor (HR 0.45, 95% CI 0.27–0.74, p = 0.002).
Among PD-L1–negative tumors, 50% corresponded to the CMS4 subtype, whereas only 4% were classified as CMS2. In contrast, PD-L1–positive tumors were predominantly assigned to the CMS2 subtype (41%), with 36% corresponding to CMS4. This association was statistically significant (p = 0.002; Figure 2H).
3.4. Bulk Transcriptomic Profiling of PD-L1-Defined Subgroups
Bulk RNA expression profiles were analyzed based on PD-L1 IHC expression in immune cells. PD-L1 immune positive tumors exhibited significant upregulation of genes involved in immune response, including lectin-type receptors (CLEC18A/B/C), inflammatory molecules (CASP5, IL31RA), and adhesion-related genes (ITGA10) [26] These cases showed overrepresentation of cell adhesion and cilium movement-related processes (Figure 3A). Additionally, molecular function enrichment revealed upregulated pathways associated with ion transport and synaptic signaling, suggesting enhanced immune and intercellular communication activity in PD-L1 positive tumors [27,28,29,30,31,32,33]. In contrast, PD-L1–negative tumors were enriched in genes related to cell adhesion, cytoskeletal organization, and invasiveness, including ADAM15, THBS1, FLNA, ACTG1, TUBA1C and PKM, which have been previously linked to EMT [34,35], cell motility and poor prognosis [35,36]. Gene ontology enrichment confirmed overrepresentation of molecular functions related to cell structural support, particularly ‘’structural constituent of cytoskeleton’’, cadherin binding’’ and ‘’structural constituent of synapse’’ (Figure 3B). These findings suggest that PD-L1-negative cases are more closely associated with a transcriptional program favoring mesenchymal plasticity and structural remodeling of the tumor microenvironment.
Using the EMTscore package, logistic regression analysis revealed that mesenchymal tumors were more frequently PD-L1–negative compared with epithelial tumors. Notably, 69% of PD-L1–negative cases exhibited a mesenchymal profile (OR = 0.37, p = 0.033, Figure 3C).
3.5. Spatial Transcriptomics Reveals Compartment-Specific EMT–Immune Interactions
To achieve spatial resolution, we applied spatial transcriptomics (Visium HD, 10x Genomics) in four representative cases (two PD-L1–positive, two PD-L1–negative) selected from the retrospective cohort, all corresponding to stage II disease. Using Loupe Browser, multiple transcriptionally distinct clusters were automatically identified in each sample. To perform a comparative analysis, we selected stromal regions and, separately, the cluster with the highest expression of macrophage-associated genes, based on the strong link between PD-L1 and CD163 described previously (Figure 3D).
3.5.1. Spatial Transcriptomic Profile of the Stromal Compartment
In the stromal compartment, clear transcriptomic differences were observed between PD-L1–positive and PD-L1–negative cases. PD-L1–positive tumors showed overexpression of genes associated with innate immunity and antigen presentation (e.g., LYZ, CST3, CD74, B2M, TAPBP), along with tissue remodeling–related genes (IGFBP7, TIMP1) [37,38,39,40,41,42]. In contrast, PD-L1–negative cases showed predominant overexpression of genes related to the extracellular matrix (COL1A1, COL3A1, COL5A1, COL6A1, COL6A2) cytoskeletal components, actin, and myofilaments (FN1, VIM, TAGLN, MYH11, ACTB, CALD1, DES) [27,28,29,30,31,32,33,43], as well as remodeling enzymes such as metalloproteinases (MMP2) [44] (Figure 3E).
STRING network analysis of the most significantly overexpressed genes in PD-L1 positive cases revealed two well-connected functional clusters associated with immune response, antigen processing, and tissue remodeling-core processes that shape an immunologically active tumor microenvironment (Figure 3F). Cluster 1 (Immune response and antigen presentation; pink ellipse) included CD74, B2M, TAPBP, APP, LYZ, CST3, PSAP, CTSZ, and others. These genes are pivotal for antigen presentation, inflammation, and immune activation. Notably, CD74 regulates MHC class II antigen presentation and interacts with MIF, influencing PD-L1 expression. B2M and TAPBP are essential for MHC class I peptide presentation, while LYZ and CST3 contribute to innate immune defense and regulation of tumor cell migration [45,46,47,48]. Cluster 2 (Tissue remodeling and response; green ellipse) included TIMP1, IGFBP7, LUM, CCN1 and SULF1. These genes are linked to ECM remodeling, angiogenesis, and cell adhesion. TIMP1 not only inhibits metalloproteinases but also promotes immune infiltration by macrophages and neutrophils, while IGFBP7 has been associated with tumor suppression and EMT inhibition in CRC [40,41]
In contrast, on STRING network analysis PD-L1–negative tumors overexpressed genes related ECM components (COL1A1, COL3A1, COL5A1, COL6A1, COL6A2) [49], cytoskeletal and contractile elements (FN1, VIM, ACTA2, TAGLN, MYH11, CALD1, DES) [26,35,50,51], and remodeling enzymes (MMP2) (Figure 3G) [36]. Importantly, FN1, VIM, and MMP2 are classical mesenchymal markers [52], reinforcing the mesenchymal phenotype observed in PD-L1–negative cases. STRING network analysis highlighted a robust interaction cluster dominated by ECM and cytoskeletal genes, reflecting a contractile and reactive stroma.
3.5.2. Spatial transcriptomic profile of macrophage-rich stromal clusters
This analysis confirmed that the macrophage-rich stromal cluster was enriched in immune-related genes, with PD-L1–positive tumors showing marked overexpression of LYZ, CD74, and CST3, all previously linked to an immunoreactive phenotype (Figure 3H) [37,38,39,40].
STRING network of overexpressed genes in PD-L1-positive cases, again revealed two well-connected functional clusters related to a more robust immune profile, incorporating additional genes involved in inflammation (C3, A2M, C1R, C1S) and stromal modulation (Figure 3I). Complement 3 (C3) is a central member of the complement system, capable of promoting macrophage and dendritic cell recruitment, enhancing phagocytosis, and contributing to antitumor innate immune responses [53]. A2M (alpha-2-macroglobulin), is a protease inhibitor and cytokine carrier that can regulate inflammation by sequestering pro-inflammatory mediators [54]. C1R/C1S subunits of the C1 complex initiates the classical complement pathway, facilitating phagocytosis, inflammation, and cell lysis [55] DCN (Decorin) is an extracellular matrix proteoglycan with structural and immunomodulatory functions, able to inhibit TGF-β, stimulate autophagy, and modulate angiogenesis and tumor progression [56].
By contrast, the equivalent macrophage-rich stromal clusters in PD-L1–negative tumors showed a fundamentally different profile (Figure 3J): despite high macrophage content, these clusters predominantly overexpressed extracellular matrix structural genes (COL1A1, COL5A1, COL6A1), remodeling enzymes (MMP14), and classical cancer-associated fibroblasts (CAFs) markers (FN1, TAGLN). without evidence of immune-related transcriptional activity [36,49,50,51,57,58]. The STRING network confirmed a tightly connected structural and contractile stromal module, characteristic of an active mesenchymal phenotype.
4. Discussion
We performed an integrative analysis of MSS CRC cases at localized stages focusing on classical morphological prognostic features, TME composition and RNA-based bulk and high-definition spatial expression profiles.
According to our findings, immune PD-L1 expression in MSS CRC emerged as a robust, independent prognostic biomarker, associated with the absence of histopathological risk factors and favorable prognosis in this specific population. PD-L1 positivity was most seen in early clinical stages, whereas cases with lymph node metastasis were more often PD-L1 negative. Despite this association, PD-L1 remained significantly linked with prognosis independent of pN status. Furthermore, combining PD-L1 immune status (positive/negative) with clinical stage (I-II/III) demonstrated PD-L1–negative tumors, even at early stages (I–II), exhibited significantly shorter DFS than PD-L1–positive tumors, even at stage III. However, independently published series have reported inconsistent association between PD-L1 status and clinical outcomes [59,60,61]. These discrepancies may be explained by the inclusion of both MSI and MSS patients within the same analyses, as MSI-CRC is typically associated with high PD-L1 expression [62]. In addition, differences in the cellular source of PD-L1 expression (tumor cells versus immune cells) and the antibody clones used for detection may further contribute to the variability in reported results [59].
In our series, 50% of PD-L1 negative cases were classified as mesenchymal CMS4 molecular subtype and 69% presented a mesenchymal phenotype following the EMT score on bulk RNA transcriptomic analysis. PD-L1–negative tumors displayed an expression profile consistent with abundant CAFs infiltration, increased matrix stiffness, and impaired immune activation aligning with their worse outcomes. EMT is a major biological process driving MSS CRC progression by driving the conversion of epithelial cells into motile mesenchymal phenotypes [63]. Emerging evidence suggests that EMT is intricately linked to multiple tumor hallmarks, including the tumor microenvironment by reshaping stromal and immune cell interactions contributing to the establishment of an immunosuppressive microenvironment [64,65,66]. Furthermore, histological features indicative of mesenchymal transition—namely TB and TS—are linked to reduced immune infiltration and adverse prognosis [66,67,68].
Our spatial transcriptomic analysis prioritized stromal and macrophage niches, driven by the strong association between immune PD-L1 expression and a mesenchymal phenotype and by the enrichment of CD163⁺ tumor-associated macrophages density in PD-L1–positive cases. Importantly, using clustering analysis, spatial transcriptomics added a novel layer of evidence, revealing that EMT-related programs can dominate stromal niches in PD-L1–negative tumors, specifically in macrophage-enriched stromal areas. In contrast, PD-L1–positive tumors harbor stromal programs enriched in immune activation and controlled remodeling, consistent with an immunologically active microenvironment. This characterization, invisible to bulk transcriptomic analysis, supports the important role of tumor-associated macrophages in EMT and PD1/PD-L1 axis modulation, as has been previously proposed [69,70,71,72]. These results raise the possibility that targeting tumor-associated macrophages could offer therapeutic benefit particularly in PD-L1–negative MSS CRC by modulating EMT-associated immunosuppressive states and promoting features of host immune reactivation that may enhance responsiveness to immunotherapy [73].
Interestingly, 15% of cases in which the CMS status was assessed were classified as CMS1 despite being MMRp. This finding is consistent with the observations of Guinney et al., in which 24% of CMS1 tumors did not show an MSI profile, as molecular subtypes are not defined by a single feature but rather by a combination of complex molecular characteristics [14].
Although no other immune cell component demonstrated prognostic relevance, the density and composition of TLSs was significantly associated with more abundant CD4+ and CD163+ cells infiltration and presented a borderline positive DFS association. TLSs have been demonstrated as significantly associated with MSI and better prognosis in CRC cases [74], however, its prognosis significance specifically in MSS cases have not been previously explored. Interestingly, when CMS1 cases were excluded from the analysis, TLSs were more frequently observed in CMS4 tumors, a finding that may be explored in future research as a potential stratification factor within this poor-prognosis molecular subtype.
Although spatial transcriptomics has been previously applied in colorectal cancer, to our knowledge, this represents one of the first study focusing exclusively on MSS-CRC cases, providing valuable insights into EMT–immune crosstalk at the microregional level. The exploratory and observational design of this study represents its main limitation, emphasizing the necessity for functional investigations to establish causality and for prospective validation of the prognostic significance of immune PD-L1 expression in independent cohorts. The small number of cases included in the high-resolution transcriptomic analysis served primarily as a proof of concept to support the bulk transcriptomic findings and to better characterize the role of the stromal compartment and macrophages in the EMT profile.
5. Conclusions
In conclusion, our observations suggest a crosstalk link between PD-L1 expression on immune cells and immune-activated vs mesenchymal-dominant states driven within tumor-associated macrophage-enriched stromal niches. These results provide insight into the biological mechanisms underlying disease progression and highlight tumor-associated macrophages as a potential therapeutic target for future investigation aimed at overcoming immune resistance, particularly in PD-L1–negative MSS colorectal cancer.
Supplementary Materials
The following supporting information can be downloaded at the website of this paper posted on Preprints.org, Figure A1: (A, B) CD163 density was positively correlated with the content of CD3 and CD8 positive cells at the invasive front; (C, D) CD3+ and CD20+ cell densities demonstrated only borderline prognos-tic value.
Author Contributions
Conceptualization, CMC and BP conceived and designed the study. CMC, BP and AB conducted the histopathological evaluation. BP, JG and AB performed the dissection, nucleic acid extraction and sample preparation for sequencing. BP, MO, DGC, and FGV processed and analyzed the bulk and spatial transcriptomic data. DM, MH, SR and DR coordinated sample acquisition and the collection of clinical data. CMC, BP, NT and AC interpreted the findings and supervised the research. CMC and BP drafted the manuscript. All authors reviewed and approved the final version of the manuscript. All authors have read and agreed to the published version of the manuscript.
Funding
This work was supported by a grant from the Institute of Health Carlos III (grant number PI21/00695 to CMC and PI24/00103 to NT and AC). DGC is supported by a grant from the Spanish Association Against Cancer at Valencia (PRDVA245884GONZ). FGV is supported by a grant from the Scientific Foundation of the Spanish Association Against Cancer (POSTD245843GIME). AB is supported by a grant from CIBERONC (PMP21/00107). NT is supported by a Joan Rodes contract from ISCIII (JR20/00005).
Institutional Review Board Statement
The study was conducted in accordance with the Declaration of Helsinki and approved by the INCLIVA Health Research Institute Ethics Committee (No.2021/084, date 25 March 2021).
Informed Consent Statement
Informed consent was obtained from all subjects involved in the study.
Data Availability Statement
The bulk RNA sequencing data generated in this study have been deposited in the Gene Expression Omnibus (GEO) repository under accession number GSE319722 and are currently under embargo during peer review. The data will be made publicly available upon publication of the article. Processed data files and additional supporting materials are publicly available in Zenodo at https://doi.org/10.5281/zenodo.18620435.
Acknowledgments
During the preparation of this manuscript, the author used BioRender to prepare the graphical abstract. The authors have reviewed and edited the output and take full responsibility for the content of this publication.
Conflicts of Interest
The authors declare no conflicts of interest. The funders had no role in the design of the study; in the collection, analyses, or interpretation of data; in the writing of the manuscript; or in the decision to publish the results.
Abbreviations
The following abbreviations are used in this manuscript:
| CI | Confidence intervals |
| CMS | Consensus molecular subtypes |
| CRC | Colorectal cancer |
| DFS | Disease-free survival |
| EMT | Epithelial to mesenchymal transition |
| FDCs | Follicular dendritic cells |
| FFPE | Formalin-fixed paraffin embedded |
| HE | Hematoxylin and eosin |
| HR | Hazard ratios |
| ICI | Immune checkpoint inhibitors |
| IF | Invasive front |
| IHC | Immunohistochemistry |
| iTLS | Immature tertiary lymphoid structures |
| LVI | Lymphovascular invasion |
| MMRp | Mismatch repair-proficient |
| MSI | Microsatellite instability |
| MSS-CRC | Microsatellite-stable colorectal cancer |
| mTLS | Mature tertiary lymphoid structures |
| OR | Odds ratio |
| ORA | Over-representation analysis |
| pN | Lymph nodes |
| PNI | Perineural invasion |
| pT | Depth of invasion |
| TB | Tumor budding |
| TC | Tumor center |
| TLSs | Tertiary lymphoid structures |
| TME | Tumor microenvironment |
| TS | Tumor stroma |
Appendix A
Figure A1.
CD163 density was positively correlated with the content of CD3 and CD8 positive cells at the invasive front; (C, D) CD3+ and CD20+ cell densities demonstrated only borderline prognostic value.
Figure A1.
CD163 density was positively correlated with the content of CD3 and CD8 positive cells at the invasive front; (C, D) CD3+ and CD20+ cell densities demonstrated only borderline prognostic value.

References
- Bray, F.; Laversanne, M.; Sung, H.; Ferlay, J.; Siegel, R.L.; Soerjomataram, I.; Jemal, A. Global cancer statistics 2022: GLOBOCAN estimates of incidence and mortality worldwide for 36 cancers in 185 countries. CA Cancer J. Clin. 2024, 74, 229–263. [CrossRef]
- Cardoso, R.; Guo, F.; Heisser, T.; Hackl, M.; Ihle, P.; De Schutter, H.; et al. Colorectal cancer incidence, mortality, and stage distribution in European countries in the colorectal cancer screening era: An international population-based study. Lancet Oncol. 2021, 22, 1002–1013. [CrossRef]
- Sung, H.; Siegel, R.L.; Laversanne, M.; Soerjomataram, I.; Jemal, A.; Bray, F. Colorectal cancer incidence trends in younger versus older adults: An analysis of population-based cancer registry data. Lancet Oncol. 2025, 26, 51–63. [CrossRef]
- Siegel, R.L.; Miller, K.D.; Goding Sauer, A.; Fedewa, S.A.; Butterly, L.F.; Anderson, J.C.; et al. Colorectal cancer statistics, 2020. CA Cancer J. Clin. 2020, 70, 145–164. [CrossRef]
- Malvezzi, M.; Carioli, G.; Bertuccio, P.; Boffetta, P.; Levi, F.; La Vecchia, C.; et al. European cancer mortality predictions for the year 2018 with focus on colorectal cancer. Ann. Oncol. 2018, 29, 1016–1022. [CrossRef]
- Gupta, R.; Sinha, S.; Paul, R.N. The impact of microsatellite stability status in colorectal cancer. Curr. Probl. Cancer 2018, 42, 548–559. [CrossRef]
- Taieb, J.; Svrcek, M.; Cohen, R.; Basile, D.; Tougeron, D.; Phelip, J.M. Deficient mismatch repair/microsatellite unstable colorectal cancer: Diagnosis, prognosis and treatment. Eur. J. Cancer 2022, 175, 136–157. [CrossRef]
- Sahin, I.H.; Ciombor, K.K.; Diaz, L.A., Jr.; Yu, J.; Kim, R. Immunotherapy for microsatellite stable colorectal cancers: Challenges and novel therapeutic avenues. Am. Soc. Clin. Oncol. Educ. Book 2022, 42, 242–253. [CrossRef]
- Guven, D.C.; Kavgaci, G.; Erul, E.; Ozkan, M.; Ozturk, M.A.; Yazici, O.; et al. The efficacy of immune checkpoint inhibitors in microsatellite stable colorectal cancer: A systematic review. Oncologist 2024, 29, e580–e600. [CrossRef]
- Galon, J.; Costes, A.; Sanchez-Cabo, F.; Kirilovsky, A.; Mlecnik, B.; Lagorce-Pagès, C.; et al. Type, density, and location of immune cells within human colorectal tumors predict clinical outcome. Science 2006, 313, 1960–1964. [CrossRef]
- Pagès, F.; Mlecnik, B.; Marliot, F.; Bindea, G.; Ou, F.S.; Bifulco, C.; et al. International validation of the consensus Immunoscore for the classification of colon cancer: A prognostic and accuracy study. Lancet 2018, 391, 2128–2139. [CrossRef]
- Wu, X.; Hou, S.; Ye, Y.; Gao, Z. The prognostic value of immunoscore in the early-onset colorectal cancer. BMC Gastroenterol. 2025, 25, 513. [CrossRef]
- Sautès-Fridman, C.; Petitprez, F.; Calderaro, J.; Fridman, W.H. Tertiary lymphoid structures in the era of cancer immunotherapy. Nat. Rev. Cancer 2019, 19, 307–325. [CrossRef]
- Guinney, J.; Dienstmann, R.; Wang, X.; de Reyniès, A.; Schlicker, A.; Soneson, C.; et al. The consensus molecular subtypes of colorectal cancer. Nat. Med. 2015, 21, 1350–1356. [CrossRef]
- Chu, X.; Li, X.; Zhang, Y.; Zhang, Q.; Yu, C.; Hu, Y.; et al. Integrative single-cell analysis of human colorectal cancer reveals patient stratification with distinct immune evasion mechanisms. Nat. Cancer 2024, 5, 1409–1426. [CrossRef]
- Mei, Y.; Xiao, W.; Hu, H.; Zhang, J.; Li, Z.; Zhao, H.; et al. Single-cell analyses reveal suppressive tumor microenvironment of human colorectal cancer. Clin. Transl. Med. 2021, 11, e422. [CrossRef]
- Qian, J.; Olbrecht, S.; Boeckx, B.; Vos, H.; Laoui, D.; Etlioglu, E.; et al. A pan-cancer blueprint of the heterogeneous tumor microenvironment revealed by single-cell profiling. Cell Res. 2020, 30, 745–762. [CrossRef]
- Wang, R.; Li, J.; Zhou, X.; Chen, Q.; Yang, Z.; Lin, X.; et al. Single-cell genomic and transcriptomic landscapes of primary and metastatic colorectal cancer tumors. Genome Med. 2022, 14, 93. [CrossRef]
- Palomar de Lucas, B.; Heras, B.; Tarazona, N.; Martí, R.; Algaba, A.; Gimeno-Valiente, F.; et al. Extended tumor area-based stratification score combining tumor budding and stroma identifies a high-risk, immune-depleted group in localized microsatellite-stable colon cancer patients. Pathol. Res. Pract. 2025, 269, 155871. [CrossRef]
- Bankhead, P.; Loughrey, M.B.; Fernández, J.A.; Dombrowski, Y.; McArt, D.G.; Dunne, P.D.; et al. QuPath: Open source software for digital pathology image analysis. Sci. Rep. 2017, 7, 16878. [CrossRef]
- Vanhersecke, L.; Brunet, M.; Guégan, J.P.; Charon-Barra, C.; Naltet, C.; Leblanc, R.; et al. Mature tertiary lymphoid structures predict immune checkpoint inhibitor efficacy in solid tumors independently of PD-L1 expression. Nat. Cancer 2021, 2, 794–802. [CrossRef]
- Tarazona, N.; Gimeno-Valiente, F.; Gambardella, V.; Font, A.; Heras, B.; Sastre, J.; et al. Detection of postoperative plasma circulating tumour DNA and lack of CDX2 expression as markers of recurrence in patients with localised colon cancer. ESMO Open 2020, 5, e000847. [CrossRef]
- Chakraborty, P.; George, J.T.; Tripathi, S.; Levine, H.; Jolly, M.K. Comparative study of transcriptomics-based scoring metrics for the epithelial-hybrid-mesenchymal spectrum. Front. Bioeng. Biotechnol. 2020, 8, 220. [CrossRef]
- R Core Team. R: A Language and Environment for Statistical Computing; R Foundation for Statistical Computing: Vienna, Austria, 2023. Available online: https://www.R-project.org/.
- Szklarczyk, D.; Kirsch, R.; Koutrouli, M.; Fonseca, N.; Bork, P.; Jensen, L.J.; von Mering, C. The STRING database in 2023: Protein–protein association networks and functional enrichment analyses for any sequenced genome of interest. Nucleic Acids Res. 2023, 51, D638–D646. [CrossRef]
- Stelzer, G.; Rosen, N.; Plaschkes, I.; Zimmerman, S.; Twik, M.; Fishilevich, S.; et al. The GeneCards Suite: From gene data mining to disease genome sequence analyses. Curr. Protoc. Bioinformatics 2016, 54, 1–30. [CrossRef]
- Omatsu, M.; Nakanishi, Y.; Iwane, K.; Tanaka, T.; Matsuda, H.; Akita, H.; et al. THBS1-producing tumor-infiltrating monocyte-like cells contribute to immunosuppression and metastasis in colorectal cancer. Nat. Commun. 2023, 14, 1–15. [CrossRef]
- Cheng, M.; Jiang, Y.; Yang, H.; Zhao, D.; Li, L.; Liu, X. FLNA promotes chemoresistance of colorectal cancer through inducing epithelial-mesenchymal transition and Smad2 signaling pathway. Am. J. Cancer Res. 2020, 10, 1–15. Available online: www.ajcr.us.
- Puig-Blasco, L.; Piotrowski, K.B.; Michaelsen, S.R.; Di Caro, G.; Perren, A.; de Visser, K.E.; et al. Loss of cancer cell-derived ADAM15 alters the tumor microenvironment in colorectal tumors. Int. J. Cancer 2023, 153, 2068–2081. [CrossRef]
- Zheng, L.; Xu, Z.; Zhang, W.; Li, Y.; Wu, J.; Chen, H. Identification and validation of a prognostic signature based on six immune-related genes for colorectal cancer. Discov. Oncol. 2024, 15, 192. [CrossRef]
- Li, J.; Chen, M.; Tong, M.; Cao, Q. TUBA1C orchestrates the immunosuppressive tumor microenvironment and resistance to immune checkpoint blockade in clear cell renal cell carcinoma. Front. Immunol. 2024, 15, 1457691. [CrossRef]
- Hu, X.; Zhu, H.; Chen, B.; Li, Q.; Zhang, L.; Li, W. The oncogenic role of tubulin alpha-1c chain in human tumours. BMC Cancer 2022, 22, 1–13. [CrossRef]
- Palsson-McDermott, E.M.; Dyck, L.; Zaslona, Z.; Menon, D.; McGettrick, A.F.; Mills, K.H.G.; et al. Pyruvate kinase M2 is required for the expression of the immune checkpoint PD-L1 in immune cells and tumors. Front. Immunol. 2017, 8, 1300. [CrossRef]
- Bruneel, K.; Verstappe, J.; Vandamme, N.; Berx, G. Intrinsic balance between ZEB family members is important for melanocyte homeostasis and melanoma progression. Cancers (Basel) 2020, 12, 2248. [CrossRef]
- Berr, A.L.; Wiese, K.; dos Santos, G.; Hendriks, W.; Klemke, M.; et al. Vimentin is required for tumor progression and metastasis in a mouse model of non–small cell lung cancer. Oncogene 2023, 42, 2074–2087. [CrossRef]
- Wolosowicz, M.; Prokopiuk, S.; Kaminski, T.W. The complex role of matrix metalloproteinase-2 (MMP-2) in health and disease. Int. J. Mol. Sci. 2024, 25, 13691. [CrossRef]
- Jiang, X.; Zhang, H.; Zhang, H.; Zhang, Y.; Zhang, Q.; et al. Microcystin-LR-induced interaction between M2 tumor-associated macrophage and colorectal cancer cell promotes colorectal cancer cell migration through regulating the expression of TGF-β1 and CST3. Int. J. Mol. Sci. 2023, 24, 10527. [CrossRef]
- Liu, Z.; Chen, M.; Zheng, W.; Yuan, S.; Zhao, W. Insights into the prognostic value and immunological role of CD74 in pan-cancer. Discover Oncol. 2024, 15, 1–17. [CrossRef]
- Imaoka, M.; Tanese, K.; Masugi, Y.; Hayashi, M.; Sakamoto, M. Macrophage migration inhibitory factor-CD74 interaction regulates the expression of programmed cell death ligand 1 in melanoma cells. Cancer Sci. 2019, 110, 2273–2283. [CrossRef]
- Ruan, W.J.; Lin, J.; Xu, E.P.; Chen, X.; et al. IGFBP7 plays a potential tumor suppressor role against colorectal carcinogenesis with its expression associated with DNA hypomethylation of exon 1. J. Zhejiang Univ. Sci. B 2006, 7, 929–932. [CrossRef]
- Li, Y.; Xi, Y.; Zhu, G.; Zhang, X.; Chen, Y.; et al. Downregulated IGFBP7 facilitates liver metastasis by modulating epithelial-mesenchymal transition in colon cancer. Oncol. Rep. 2019, 42, 1935–1945. [CrossRef]
- Qiu, X.; Quan, G.; Ou, W.; Chen, Y.; et al. Unraveling TIMP1: a multifaceted biomarker in colorectal cancer. Front. Genet. 2023, 14, 1265137. [CrossRef]
- Chen, M.; Liu, H.; Li, Z.; Ming, A.L.; Chen, H. Mechanism of PKM2 affecting cancer immunity and metabolism in tumor microenvironment. J. Cancer 2021, 12, 3566–3574. [CrossRef]
- Rodríguez, D.; Morrison, C.J.; Overall, C.M. Matrix metalloproteinases: What do they not do? New substrates and biological roles identified by murine models and proteomics. Biochim. Biophys. Acta Mol. Cell Res. 2010, 1803, 39–54. [CrossRef]
- Peddle, A.M.; Rasschaert, G.; Tejpar, S. Immunosensitivity cuts across mismatch repair status in colorectal cancer. Cancer Cell 2025, 43, 175–177. [CrossRef]
- Ragland, S.A.; Criss, A.K. From bacterial killing to immune modulation: Recent insights into the functions of lysozyme. PLoS Pathog. 2017, 13, e1006512. [CrossRef]
- Gao, P.; Liu, H.; Huang, H.; Zhang, W.; et al. The Crohn disease-associated ATG16L1T300A polymorphism regulates inflammatory responses by modulating TLR- and NLR-mediated signaling. Autophagy 2022, 18, 2561–2575. [CrossRef]
- Ahn, S.B.; Sharma, S.; Mohamedali, A.; et al. Potential early clinical stage colorectal cancer diagnosis using a proteomics blood test panel. Clin. Proteomics 2019, 16, 1–13. [CrossRef]
- De Martino, D.; Bravo-Cordero, J.J. Collagens in cancer: Structural regulators and guardians of cancer progression. Cancer Res. 2023, 83, 1–13. [CrossRef]
- Elsafadi, M.; Manikandan, M.; Almalki, S.; et al. Transgelin is a poor prognostic factor associated with advanced colorectal cancer (CRC) stage promoting tumor growth and migration in a TGFβ-dependent manner. Cell Death Dis. 2020, 11, 1–16. [CrossRef]
- Lee, H.W.; Park, Y.M.; Lee, S.J.; Kim, S.Y.; et al. Alpha-smooth muscle actin (ACTA2) is required for metastatic potential of human lung adenocarcinoma. Clin. Cancer Res. 2013, 19, 5879–5889. [CrossRef]
- Lee, J.M.; Dedhar, S.; Kalluri, R.; Thompson, E.W. The epithelial-mesenchymal transition: New insights in signaling, development, and disease. J. Cell Biol. 2006, 172, 973–981. [CrossRef]
- Afshar-Kharghan, V. The role of the complement system in cancer. J. Clin. Investig. 2017, 127, 780–789. [CrossRef]
- Vandooren, J.; Itoh, Y. Alpha-2-Macroglobulin in inflammation, immunity and infections. Front. Immunol. 2021, 12, 803244. [CrossRef]
- Almitairi, J.O.M.; Venkatraman Girija, U.; Furze, C.M.; et al. Structure of the C1r–C1s interaction of the C1 complex of complement activation. Proc. Natl. Acad. Sci. USA 2018, 115, 768–773. [CrossRef]
- Zhang, W.; Ge, Y.; Cheng, Q.; Zhang, Q.; Fang, L.; Zheng, J. Decorin is a pivotal effector in the extracellular matrix and tumour microenvironment. Oncotarget 2018, 9, 5480–5491. [CrossRef]
- Chen, X.; Song, E. Turning foes to friends: Targeting cancer-associated fibroblasts. Nat. Rev. Drug Discov. 2019, 18, 99–115. [CrossRef]
- Liu, T.; Zhou, L.; Li, D.; Andl, T.; Zhang, Y. Cancer-associated fibroblasts build and secure the tumor microenvironment. Front. Cell Dev. Biol. 2019, 7, 60. [CrossRef]
- Nobin, H.; Garvin, S.; Hagman, H.; Nodin, B.; Jirström, K.; Brunnström, H. The prognostic value of programmed death-ligand 1 (PD-L1) expression in resected colorectal cancer without neoadjuvant therapy—Differences between antibody clones and cell types. BMC Cancer 2024, 24, 1051. [CrossRef]
- Shan, T.; Chen, S.; Wu, T.; Yang, Y.; Li, S.; Chen, X. PD-L1 expression in colon cancer and its relationship with clinical prognosis. Int. J. Clin. Exp. Pathol. 2019, 12, 1764–1769. PMID: 31933995.
- Zhong, G.; Peng, C.; Chen, Y.; et al. Expression of STING and PD-L1 in colorectal cancer and their correlation with clinical prognosis. Int. J. Clin. Exp. Pathol. 2018, 11, 1256–1264. PMID: 31938220.
- Rosenbaum, M.W.; Bledsoe, J.R.; Morales-Oyarvide, V.; Huynh, T.G.; Mino-Kenudson, M. PD-L1 expression in colorectal cancer is associated with microsatellite instability, BRAF mutation, medullary morphology and cytotoxic tumor-infiltrating lymphocytes. Mod. Pathol. 2016, 29, 1104–1112. [CrossRef]
- Nie, F.; Sun, X.; Sun, J.; Zhang, J.; Wang, Y. Epithelial-mesenchymal transition in colorectal cancer metastasis and progression: Molecular mechanisms and therapeutic strategies. Cell Death Discov. 2025, 11, 336. [CrossRef]
- Gu, Y.; Zhang, Z.; ten Dijke, P. Harnessing epithelial-mesenchymal plasticity to boost cancer immunotherapy. Cell Mol. Immunol. 2023, 20, 318–340. [CrossRef]
- Martinez-Ciarpaglini, C.; Oltra, S.; Roselló, S.; et al. Low miR200c expression in tumor budding of invasive front predicts worse survival in patients with localized colon cancer and is related to PD-L1 overexpression. Mod. Pathol. 2019, 32, 306–313. [CrossRef]
- Fan, S.; Cui, X.; Zheng, L.; et al. Prognostic value of desmoplastic stromal reaction, tumor budding and tumor-stroma ratio in stage II colorectal cancer. J. Gastrointest. Oncol. 2022, 13, 2903–2921. [CrossRef]
- Huijbers, A.; Tollenaar, R.A.E.M.; van Pelt, G.W.; et al. The proportion of tumor-stroma as a strong prognosticator for stage II and III colon cancer patients: Validation in the VICTOR trial. Ann. Oncol. 2013, 24, 179–185. [CrossRef]
- Polack, M.; Smit, M.A.; van Pelt, G.W.; et al. Results from the UNITED study: A multicenter study validating the prognostic effect of the tumor–stroma ratio in colon cancer. ESMO Open 2024, 9, 102988. [CrossRef]
- Marcuello, M.; Mayol, X.; Felipe-Fumero, E.; et al. Modulation of the colon cancer cell phenotype by pro-inflammatory macrophages: A preclinical model of surgery-associated inflammation and tumor recurrence. PLoS ONE 2018, 13, e0192958. [CrossRef]
- Chen, X.; Yang, M.; Yin, J.; et al. Tumor-associated macrophages promote epithelial–mesenchymal transition and the cancer stem cell properties in triple-negative breast cancer through CCL2/AKT/β-catenin signaling. Cell Commun. Signal. 2022, 20, 92. [CrossRef]
- Wei, C.; Yang, C.; Wang, S.; et al. Crosstalk between cancer cells and tumor associated macrophages is required for mesenchymal circulating tumor cell-mediated colorectal cancer metastasis. Mol. Cancer 2019, 18, 64. [CrossRef]
- Yerolatsite, M.; Torounidou, N.; Amylidi, A.L.; Zarkavelis, G.; Hadjigeorgiou, L.; Lampri, E.; Bali, C.; Georvasili, V.; Kampletsas, E.; Mauri, D. The role of tumor-associated macrophages and PD-1/PD-L1 networking in colorectal cancer. Contemp. Oncol. (Pozn) 2025, 29, 123–130. [CrossRef]
- Xiang, J.; Wang, J.; Xiao, H.; Huang, C.; Wu, C.; Zhang, L.; Qian, C.; Xiang, D. Targeting tumor-associated macrophages in colon cancer: Mechanisms and therapeutic strategies. Front. Immunol. 2025, 16, 1573917. [CrossRef]
- Posch, F.; Silina, K.; Leibl, S.; et al. Maturation of tertiary lymphoid structures and recurrence of stage II and III colorectal cancer. Oncoimmunology 2018, 7, e1378844. [CrossRef]
Figure 1.
Immune cell densities and tertiary lymphoid structures in MSS CRC. (A–E) CD3+, CD4+, CD8+, CD163+, and FoxP3+ immune cells were significantly more abundant at the invasive front (IF) than at the tumor center (TC); (F) Representative case showing high CD20+ TLS content (CD20, 4×), (G-H) most of which contained CD23+ follicular dendritic cell networks categorized as mature TLSs (mTLSs) (CD23, 4× and 20×, respectively); (I) Representative case showing high CD20+ TLS content (CD20, 4×), (J-K) with complete absence of CD23+ dendritic cells, categorized as immature TLSs (iTLSs) (CD23, 4× and 20×, respectively); (L-P) TLS-positive tumors showed higher CD3+ (L) and CD4+ (M) T-cell densities and lower CD163+ (N) macrophage density at the IF. Mature TLSs were associated with increased CD4+ (Ñ) and CD8+ (O) T-cell infiltration compared with immature TLSs. TLS content was highest in mesenchymal CMS4 cases compared with CMS2/3 subtypes (P). (Wilcoxon rank sum test).

Figure 2.
Prognostic impact of PD-L1 expression in MSS colorectal cancer. (A,B) PD-L1 expression was mainly observed within lymphoid aggregates at the invasive front (PD-L1, 4× and 20×, respectively), (C,D) and was associated with high CD163+ macrophage density (C, CD163, 20×). (E,F) PD-L1 expression in immune cells was the only tumor microenvironment feature significantly associated with significantly improved DFS. (G) Combined PD-L1 immune expression and clinical stage stratification identified four prognostic groups. (H) PD-L1–negative tumors were enriched in the CMS4 subtype.

Figure 3.
Transcriptomic characterization of PD-L1–positive and PD-L1–negative MSS colorectal cancers. (A) Bulk RNA-seq analysis revealed an overrepresentation of cell junction and motility processes in PD-L1–positive cases; (B) PD-L1–negative tumors presented overrepresentation of molecular functions related to structural constituent of cytoskeleton and cadherin binding; (C) Logistic regression using the EMTscore package showed that mesenchymal tumors were predominantly PD-L1–negative; (D) Spatial transcriptomics identified multiple transcriptionally distinct clusters; stromal and macrophage-rich regions were selected for comparison; (E) PD-L1–positive tumors significantly overexpressed innate immunity and antigen-presentation genes, whereas PD-L1–negative tumors upregulated extracellular matrix and contractile genes; (F) STRING analysis confirmed two interconnected functional clusters related to immune activation (pink ellipse) and tissue remodeling (green ellipse) in PD-L1–positive tumors, (G) versus structural and ECM modules in PD-L1–negative cases; (H) The macrophage-rich stroma showed a distinct expression profile according to PD-L1 status; (I) PD-L1–positive cases exhibited significantly overexpression of genes related to strong immune activity (pink ellipse) and tissue remodeling (green ellipse), forming two closely interconnected clusters in the STRING analysis, (J) whereas PD-L1–negative counterparts displayed a functional cluster of genes associated with a mesenchymal, CAF-like profile.


Table 1.
Clinical and pathological features of the whole series (n=254 patients).
 |
Table 2.
Association analysis of clinicopathological variables and PD-L1 expression in immune cells (≥1%).
Table 2.
Association analysis of clinicopathological variables and PD-L1 expression in immune cells (≥1%).
 |
Disclaimer/Publisher’s Note: The statements, opinions and data contained in all publications are solely those of the individual author(s) and contributor(s) and not of MDPI and/or the editor(s). MDPI and/or the editor(s) disclaim responsibility for any injury to people or property resulting from any ideas, methods, instructions or products referred to in the content. |
© 2026 by the authors. Licensee MDPI, Basel, Switzerland. This article is an open access article distributed under the terms and conditions of the Creative Commons Attribution (CC BY) license.
Copyright: This open access article is published under a Creative Commons CC BY 4.0 license, which permit the free download, distribution, and reuse, provided that the author and preprint are cited in any reuse.


