

Submitted:
08 March 2026
Posted:
10 March 2026
You are already at the latest version
Abstract
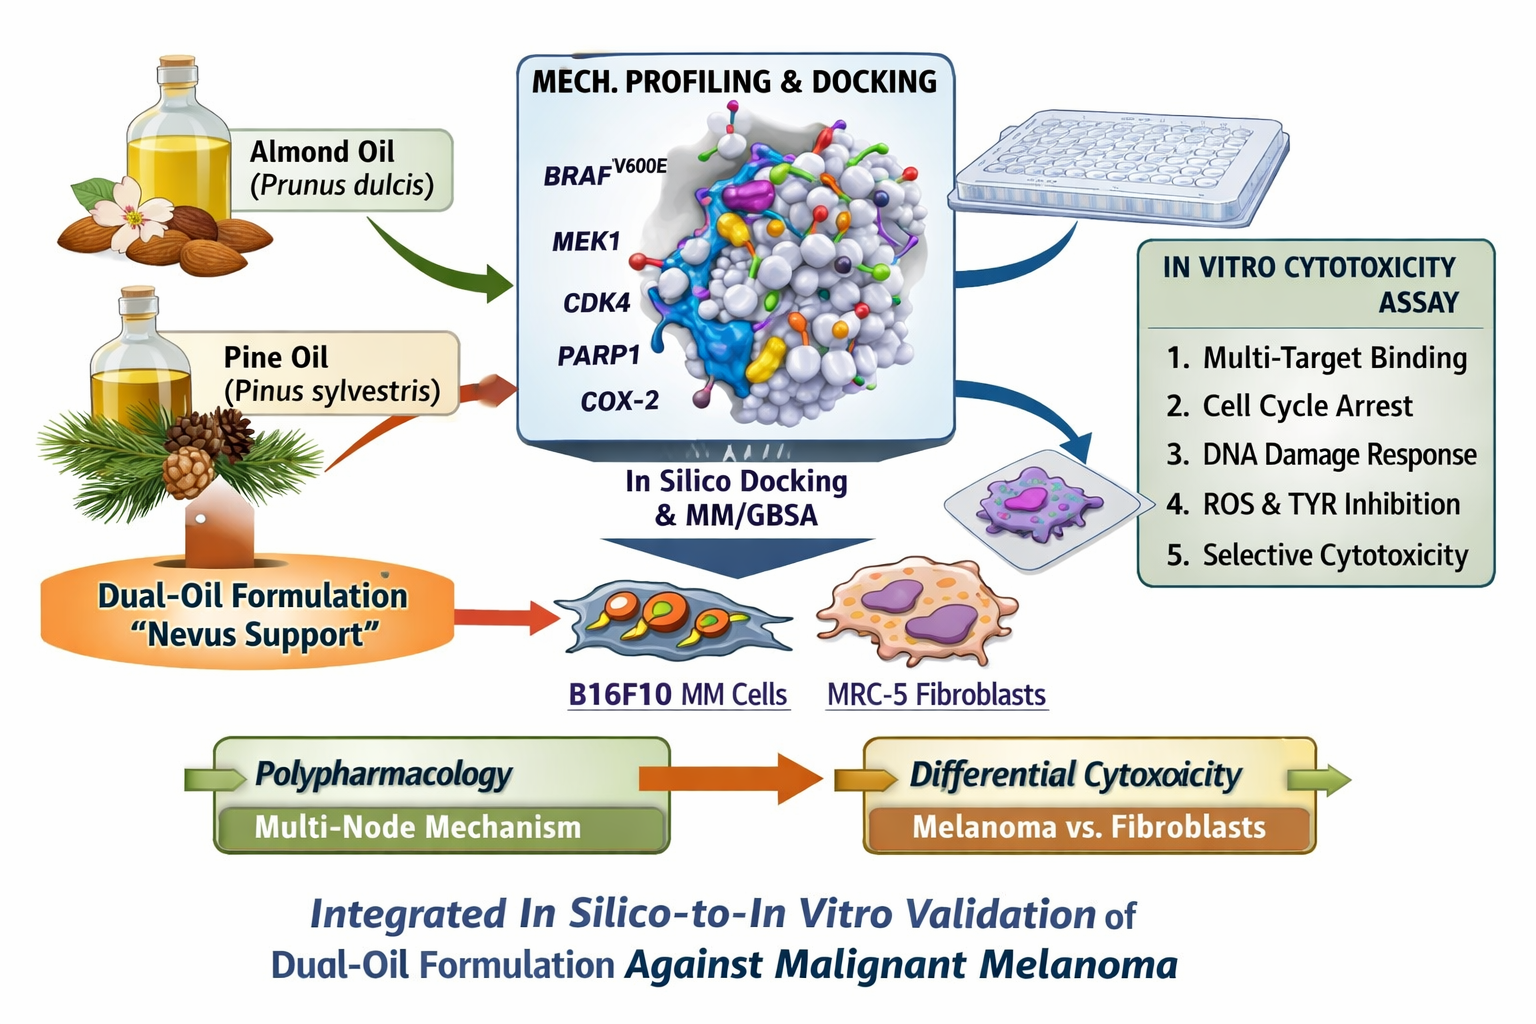
This study integrates a multi-target in silico screening campaign with in vitro experimental validation to assess a dual-oil phytochemical formulation (cold-pressed Prunus dulcis oil combined with Pinus sylvestris essential oil enriched in α-pinene; commercially referred to as “Naevus Support”) as a candidate adju-vant/alternative strategy against malignant melanoma. First, a comparative molecular docking workflow was applied across a melanoma-relevant target panel spanning the MAPK axis (BRAF, MEK1, ERK2), cell-cycle control (CDK4/6), DNA damage signaling (PARP1), inflammatory lipid signaling (COX-2), and melanogenesis-associated enzymes (tyrosinase), benchmarking major oil constituents and derived chemo-types against standard-of-care inhibitors. Docking energetics and pose-level interaction forensics supported a polypharmacology profile consistent with concurrent suppression of oncogenic signaling nodes and mi-croenvironmental permissive pathways. Second, the same formulation was tested in a Neutral Red Uptake (NRU) viability assay on B16F10 malignant melanoma cells and MRC-5 human fibroblasts, using cisplatin as a reference cytotoxic agent. Across a concentration range of 3–0.045% (v/v) for oils and 20–0.18 mM for cisplatin, the dual-oil formulation induced a dose-dependent reduction of melanoma viability while main-taining comparatively lower toxicity on fibroblasts, indicating a therapeutically relevant selectivity window. Individual-oil profiling suggested that the combined formulation’s anticancer activity cannot be explained by single-oil effects alone, supporting a true inter-oil synergistic enhancement that aligns with the mul-ti-node in silico predictions. Collectively, these data provide a coherent in silico-to-in vitro rationale for further mechanistic follow-up (target deconvolution, pathway readouts, and lipidomic/ROS endpoints) and in vivo translation.
Keywords:
malignant melanoma
; α-pinene
; essential oil formulation
; molecular docking
; neutral red uptake assay
; cisplatin
1. Introduction
Malignant melanoma (MM) is a systems-oncology malignancy in which oncogenic signaling, stress-adaptive programs, and melanocytic lineage states cooperate to drive rapid therapeutic escape. Sustained MAPK throughput (often initiated by BRAF V600E and reinforced by feedback-mediated RTK rebound) underpins proliferation, survival, and phenotypic plasticity. [1,2,3,4,5,6,7,8]
Because resistance frequently arises through network rerouting rather than single-point lesions, durable control is more plausibly achieved by multi-node perturbation than by single-target inhibition. Polypharmacology—whether by rational combinations or chemically heterogeneous formulations—is therefore a defensible strategy to constrain redundancy and adaptive bypass. [9,10,11,12,13,14,15,16,17,18]
Natural-product chemical space supports this logic. Lipid-borne phytochemicals can access hydrophobic channels and lipophilic subpockets in kinases and lipid-signaling enzymes (e.g., COX-2), while monoterpene-rich essential-oil fractions provide compact apolar scaffolds that interrogate hydrophobic niches poorly addressed by many polar drug-like ligands. [19,20,21,22]
We evaluated a dual-oil formulation (“Naevus Support”) composed of cold-pressed Prunus dulcis oil combined with Pinus sylvestris essential-oil fraction enriched in alpha-pinene. The study was designed as an integrated in silico-to-in vitro validation chain: multi-target docking across melanoma-relevant receptors (MAPK axis, KIT, CDK4/6, PARP1, COX-2, and tyrosinase) followed by phenotypic corroboration in melanoma versus fibroblast cell models. [23,24,25,26,27,28,46,47,48,49,50,51,52,53] (Table 5) (Table 6) (Image/Figure 1)–(Image/Figure 6) (Table 7).
The goal is to establish a mechanistic bridge in which predicted multi-target engagement and formulation complementarity are reflected by dose-dependent melanoma cytotoxicity, relative sparing of fibroblasts, and mixture behavior not explained by either single oil alone. This integrated evidence is used to motivate mechanistic adjudication and predictive modeling toward future in vivo translation. [29,30,31,32,33,34,35,36,37,38,39,40,41,42,43,44,45,54,55,56,57,58,59,60,61,62,63] (Table 1) (Table 2) (Table 3) (Graph 1 / Figure 7) (Graph 2 / Figure 8) (Table 8).
Figure 1.
a & b: BRAF–Vemurafenib (left image). The docking pose of Vemurafenib within BRAF shows the inhibitor deeply buried in the ATP-binding cleft, aligned along the hinge region. Its sulfonamide and heteroaromatic scaffolds establish multiple directional hydrogen bonds with backbone atoms of the hinge/catalytic loop and π–π stacking with nearby aromatic side chains. Halogenated phenyl groups are stabilized by extensive hydrophobic contacts with non-polar residues of the gatekeeper region and activation segment. The overall geometry is compatible with a type-I/II kinase inhibitor that locks BRAF in a catalytically inactive conformation.
Figure 1.
a & b: BRAF–Vemurafenib (left image). The docking pose of Vemurafenib within BRAF shows the inhibitor deeply buried in the ATP-binding cleft, aligned along the hinge region. Its sulfonamide and heteroaromatic scaffolds establish multiple directional hydrogen bonds with backbone atoms of the hinge/catalytic loop and π–π stacking with nearby aromatic side chains. Halogenated phenyl groups are stabilized by extensive hydrophobic contacts with non-polar residues of the gatekeeper region and activation segment. The overall geometry is compatible with a type-I/II kinase inhibitor that locks BRAF in a catalytically inactive conformation.
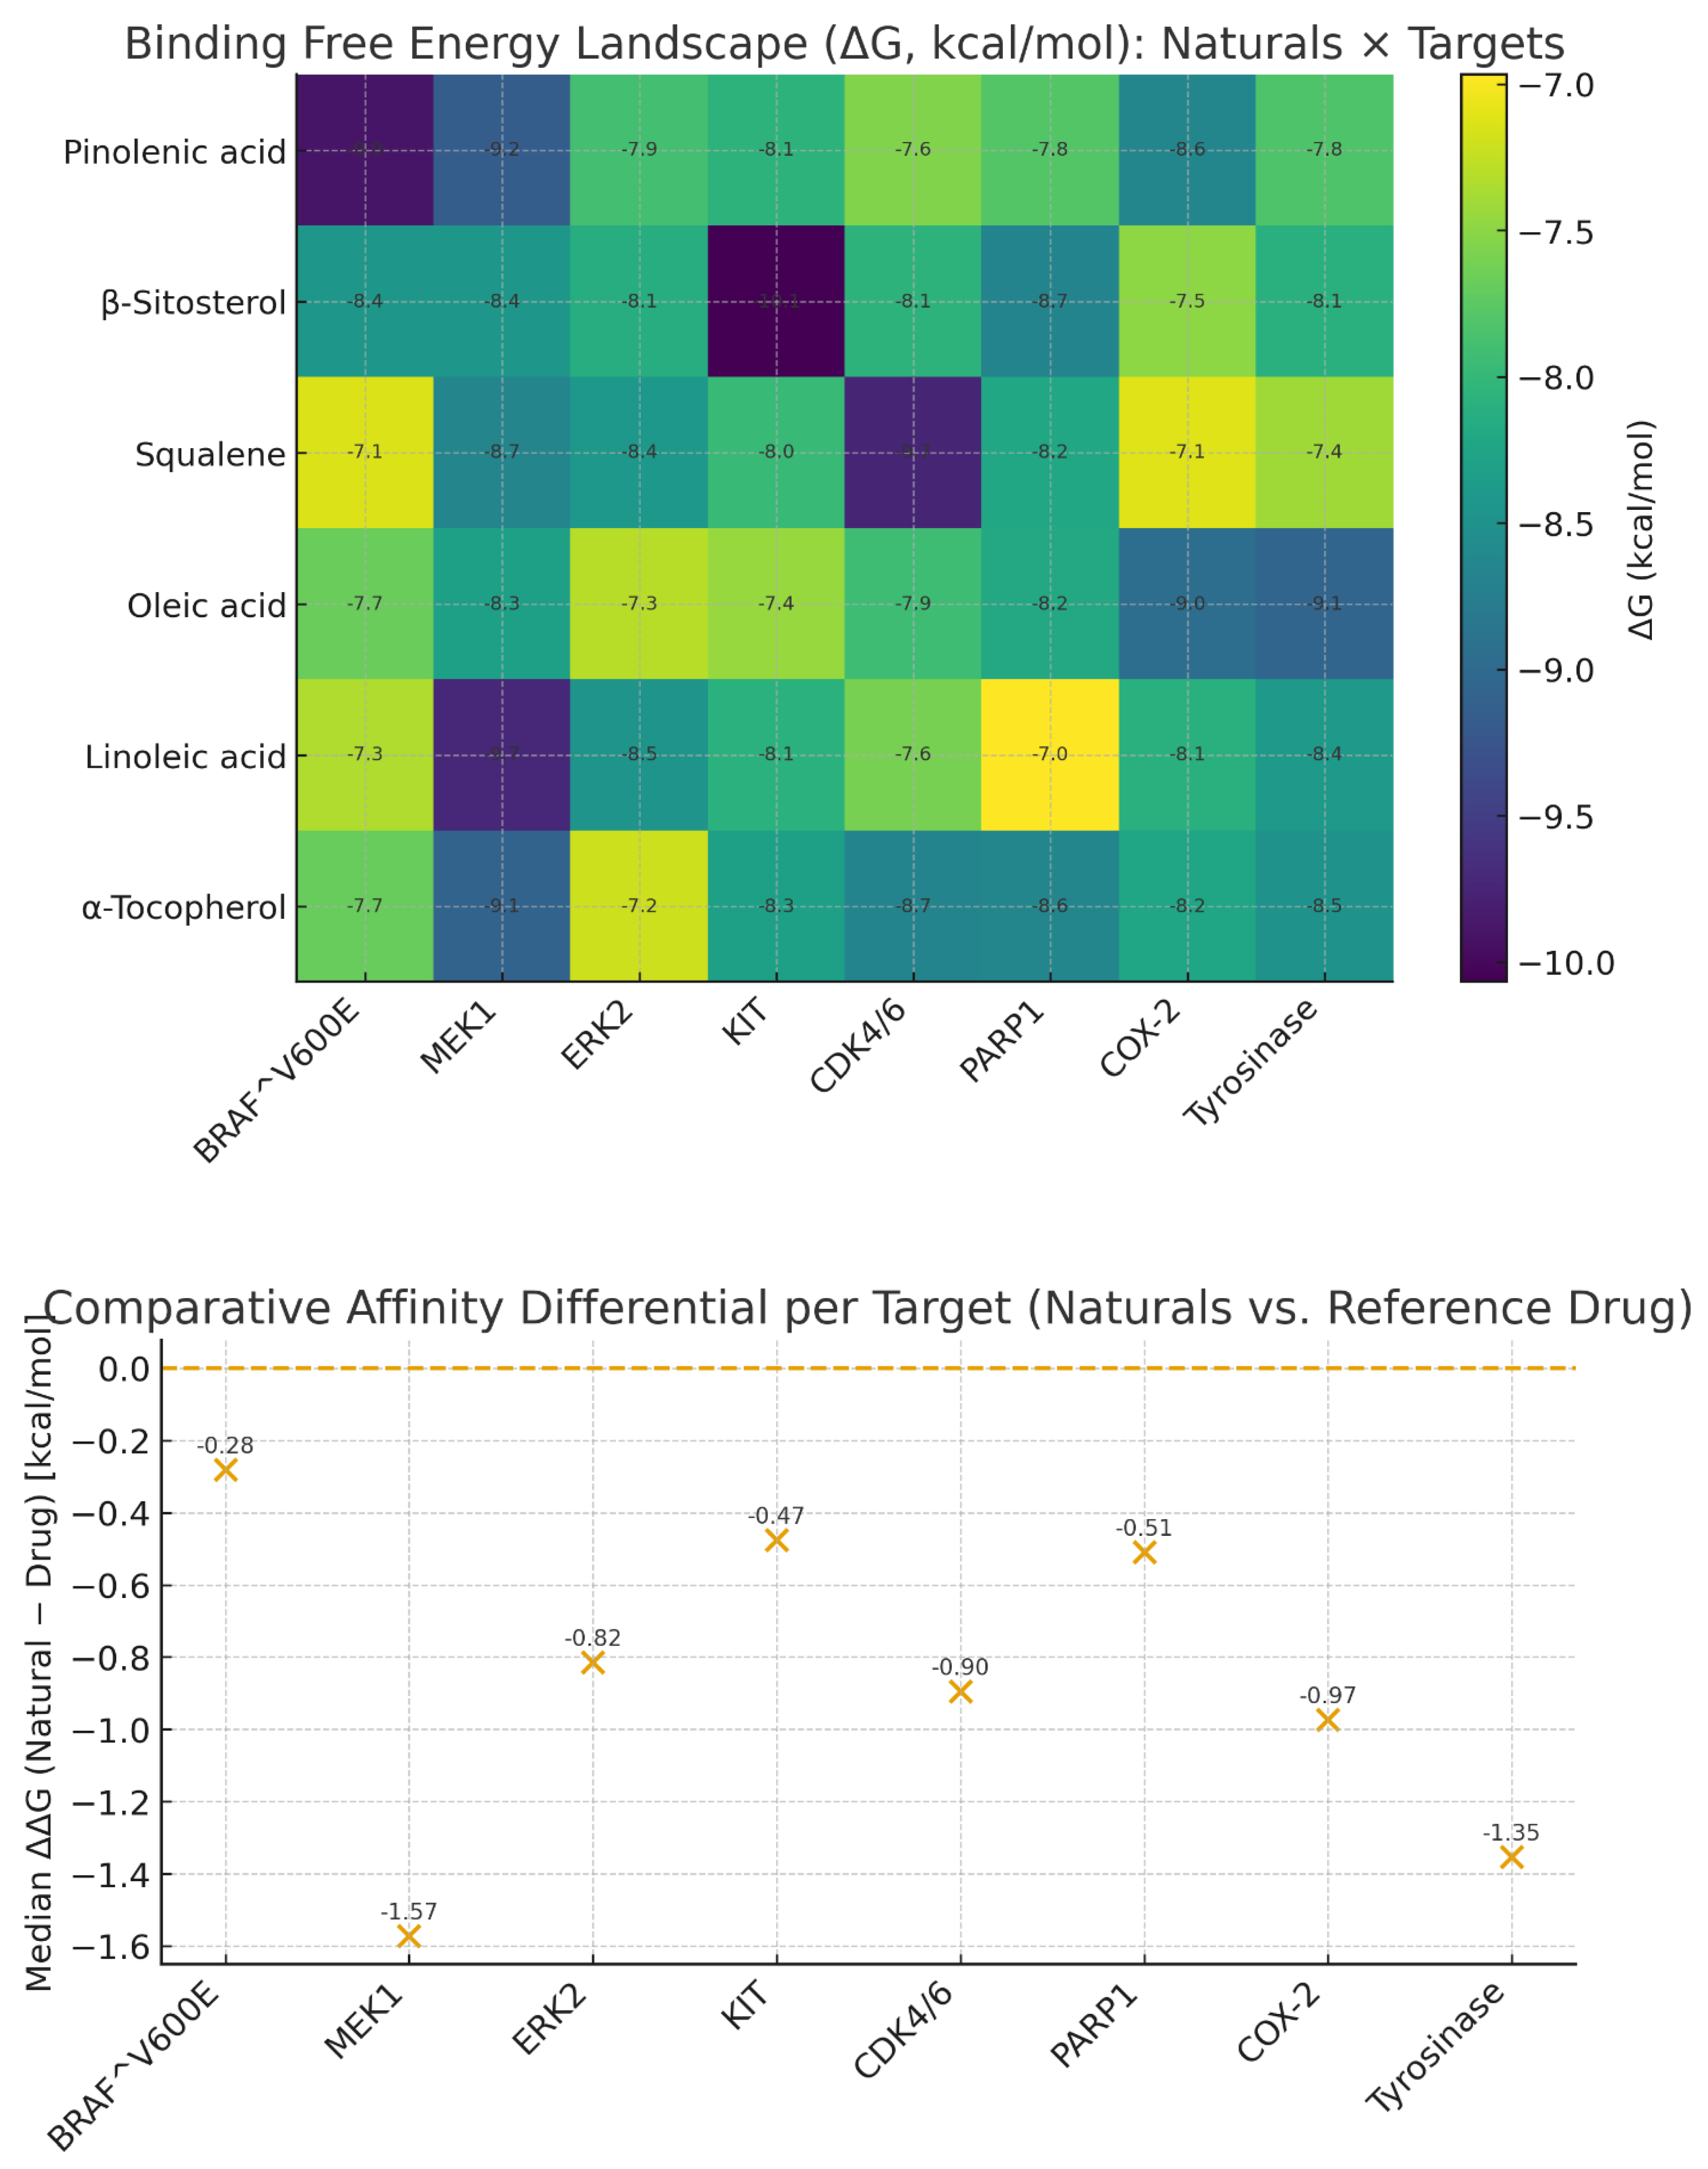
Figure 2.
a & b: ERK2–Ulixertinib (left image). Ulixertinib occupies the ATP-binding cleft of ERK2, oriented along the hinge and catalytic loop, with its heteroaromatic core deeply buried in the active site. The central scaffold forms key hydrogen bonds with backbone donors/acceptors of the hinge region, while terminal aryl/halogenated groups establish π–π stacking and hydrophobic contacts with nearby aromatic and aliphatic residues. Additional polar interactions between the inhibitor’s heteroatoms and side chains in the conserved Lys–Glu salt-bridge region further stabilize the pose. This geometry is consistent with a high-affinity, ATP-competitive inhibitor that locks ERK2 in a catalytically inactive conformation.
Figure 2.
a & b: ERK2–Ulixertinib (left image). Ulixertinib occupies the ATP-binding cleft of ERK2, oriented along the hinge and catalytic loop, with its heteroaromatic core deeply buried in the active site. The central scaffold forms key hydrogen bonds with backbone donors/acceptors of the hinge region, while terminal aryl/halogenated groups establish π–π stacking and hydrophobic contacts with nearby aromatic and aliphatic residues. Additional polar interactions between the inhibitor’s heteroatoms and side chains in the conserved Lys–Glu salt-bridge region further stabilize the pose. This geometry is consistent with a high-affinity, ATP-competitive inhibitor that locks ERK2 in a catalytically inactive conformation.
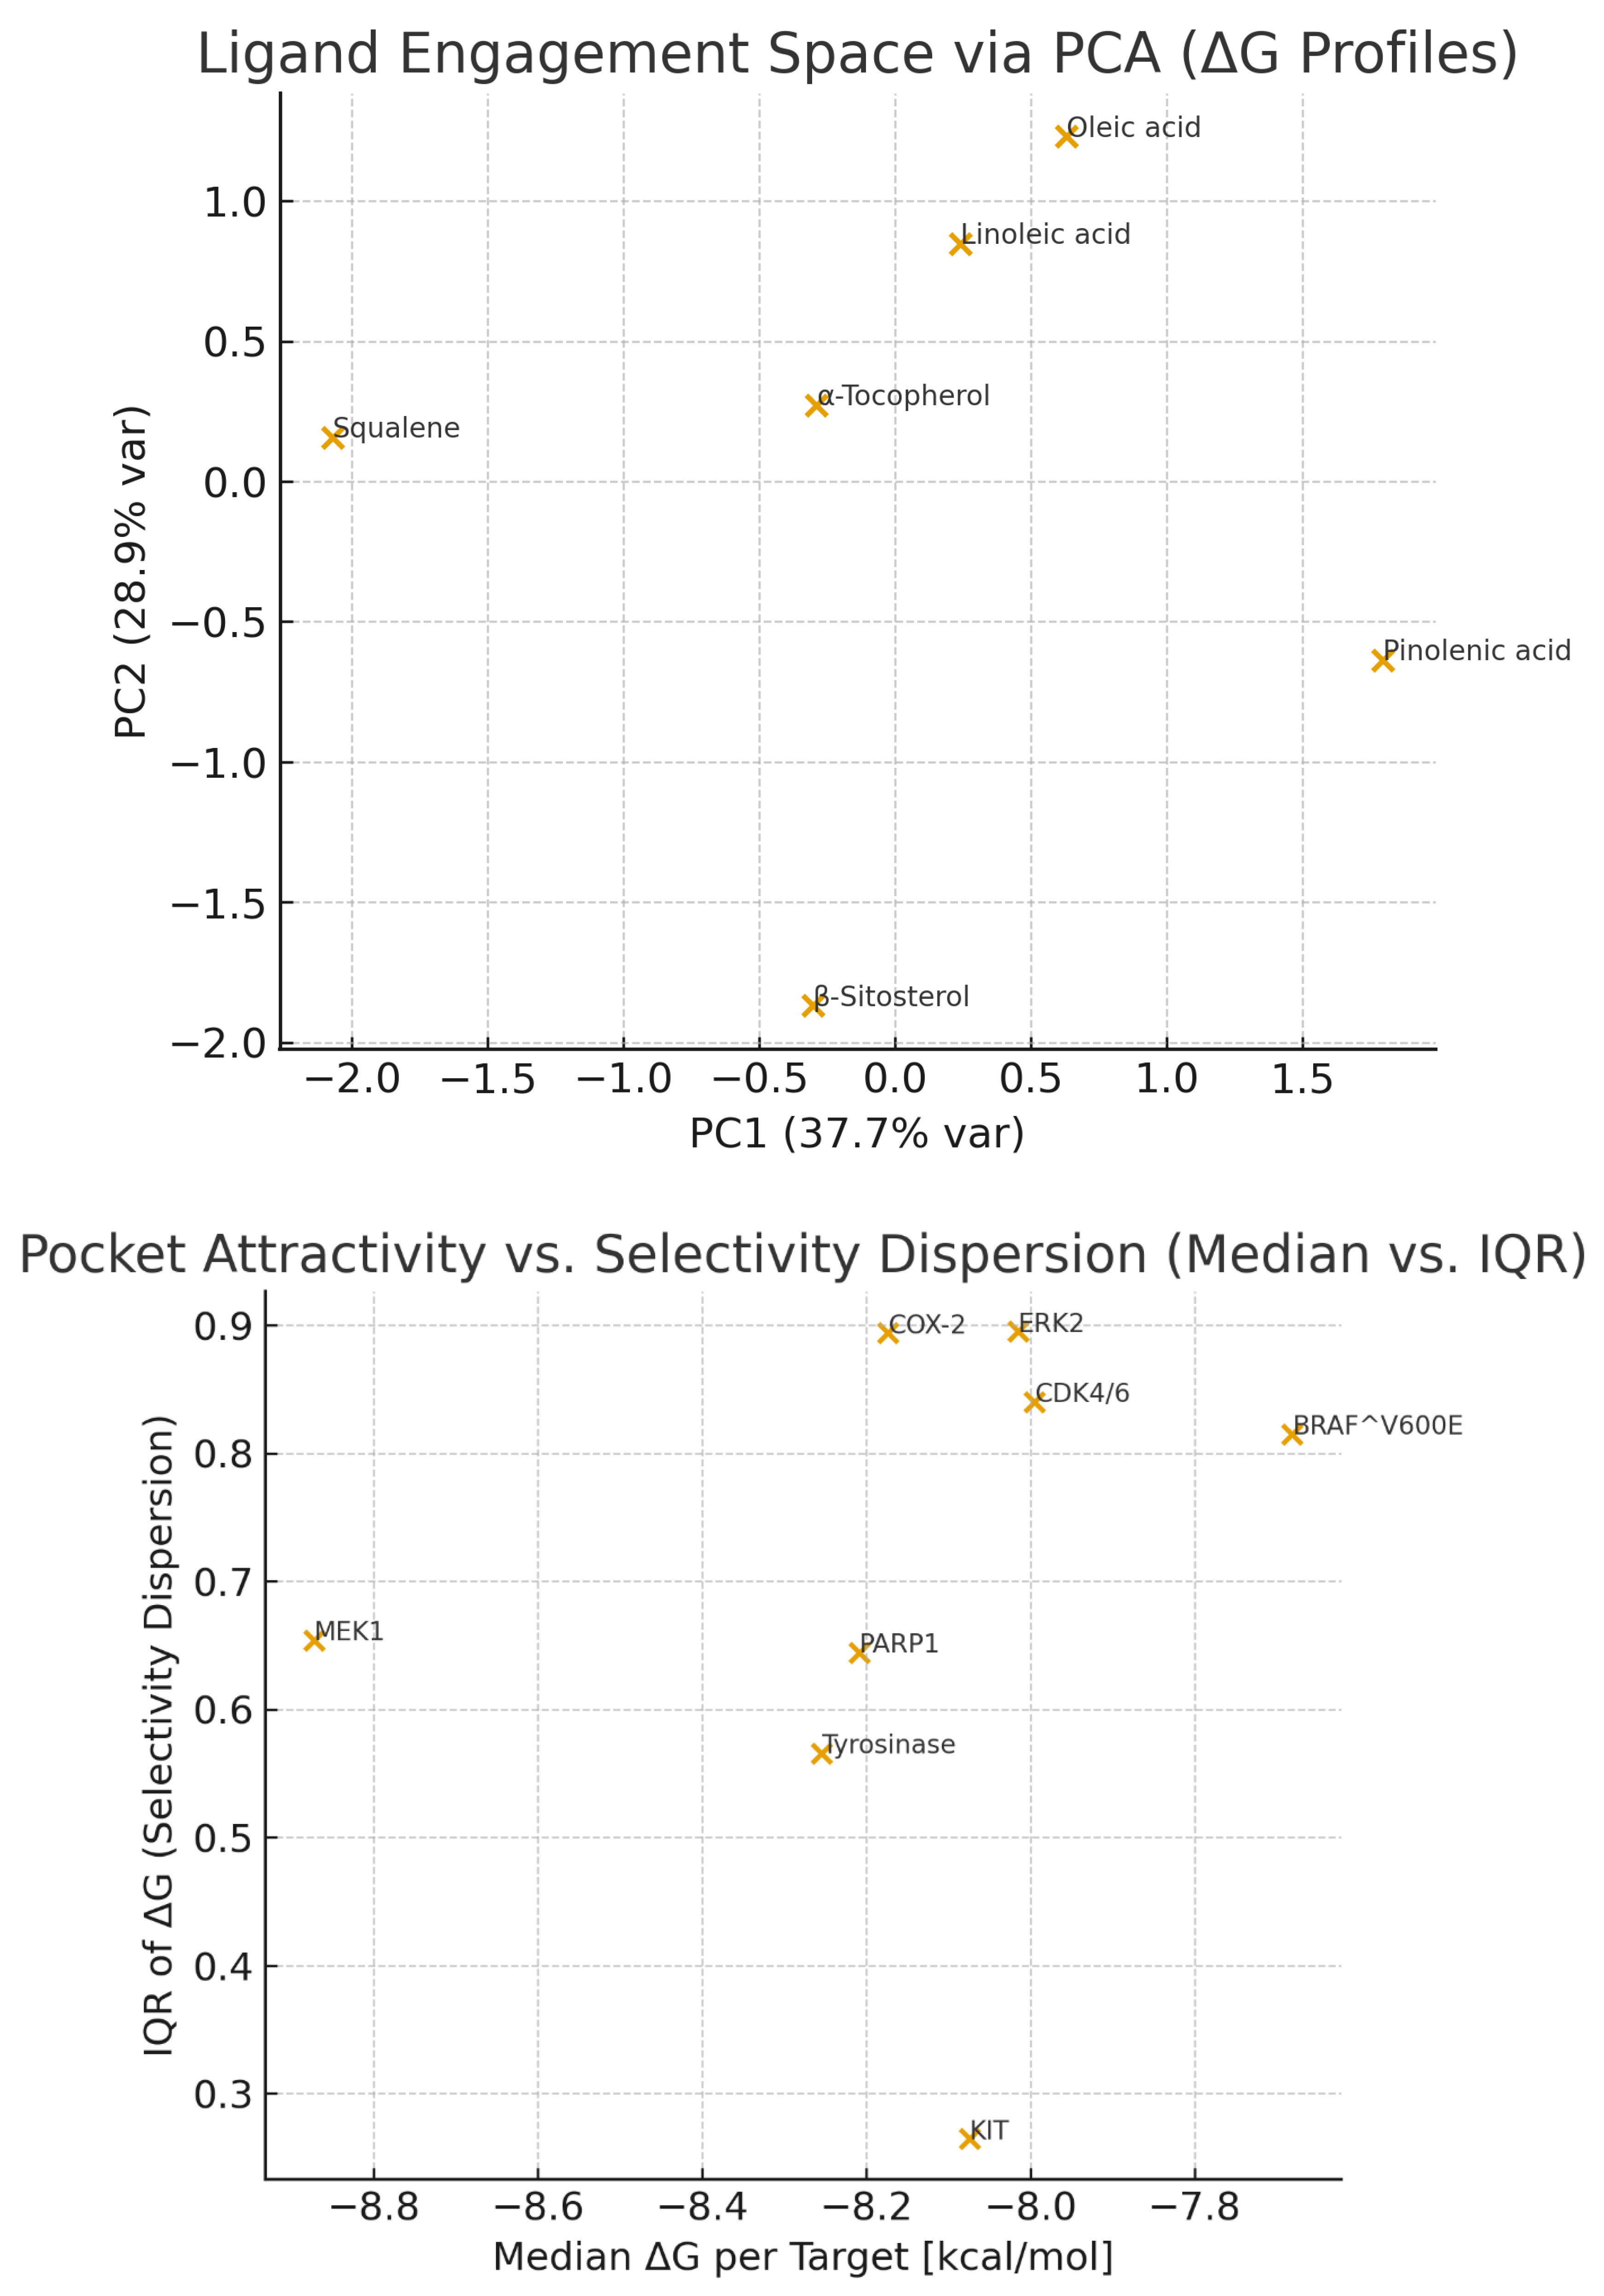
Figure 3.
a & b: MEK1–Trametinib (left image). Trametinib is docked in the canonical allosteric pocket of MEK1, adjacent to but distinct from the ATP-binding site, nestled between α-helical elements of the N- and C-lobes. Its heteroaromatic core establishes key hydrogen bonds with backbone/side-chain residues of the activation loop, while substituted aryl moieties engage in π–π and hydrophobic contacts with nearby aromatic and aliphatic residues. Additional polar contacts involving sulfonamide/amine functionalities stabilize the pose and favor an inactive conformation of the kinase.
Figure 3.
a & b: MEK1–Trametinib (left image). Trametinib is docked in the canonical allosteric pocket of MEK1, adjacent to but distinct from the ATP-binding site, nestled between α-helical elements of the N- and C-lobes. Its heteroaromatic core establishes key hydrogen bonds with backbone/side-chain residues of the activation loop, while substituted aryl moieties engage in π–π and hydrophobic contacts with nearby aromatic and aliphatic residues. Additional polar contacts involving sulfonamide/amine functionalities stabilize the pose and favor an inactive conformation of the kinase.
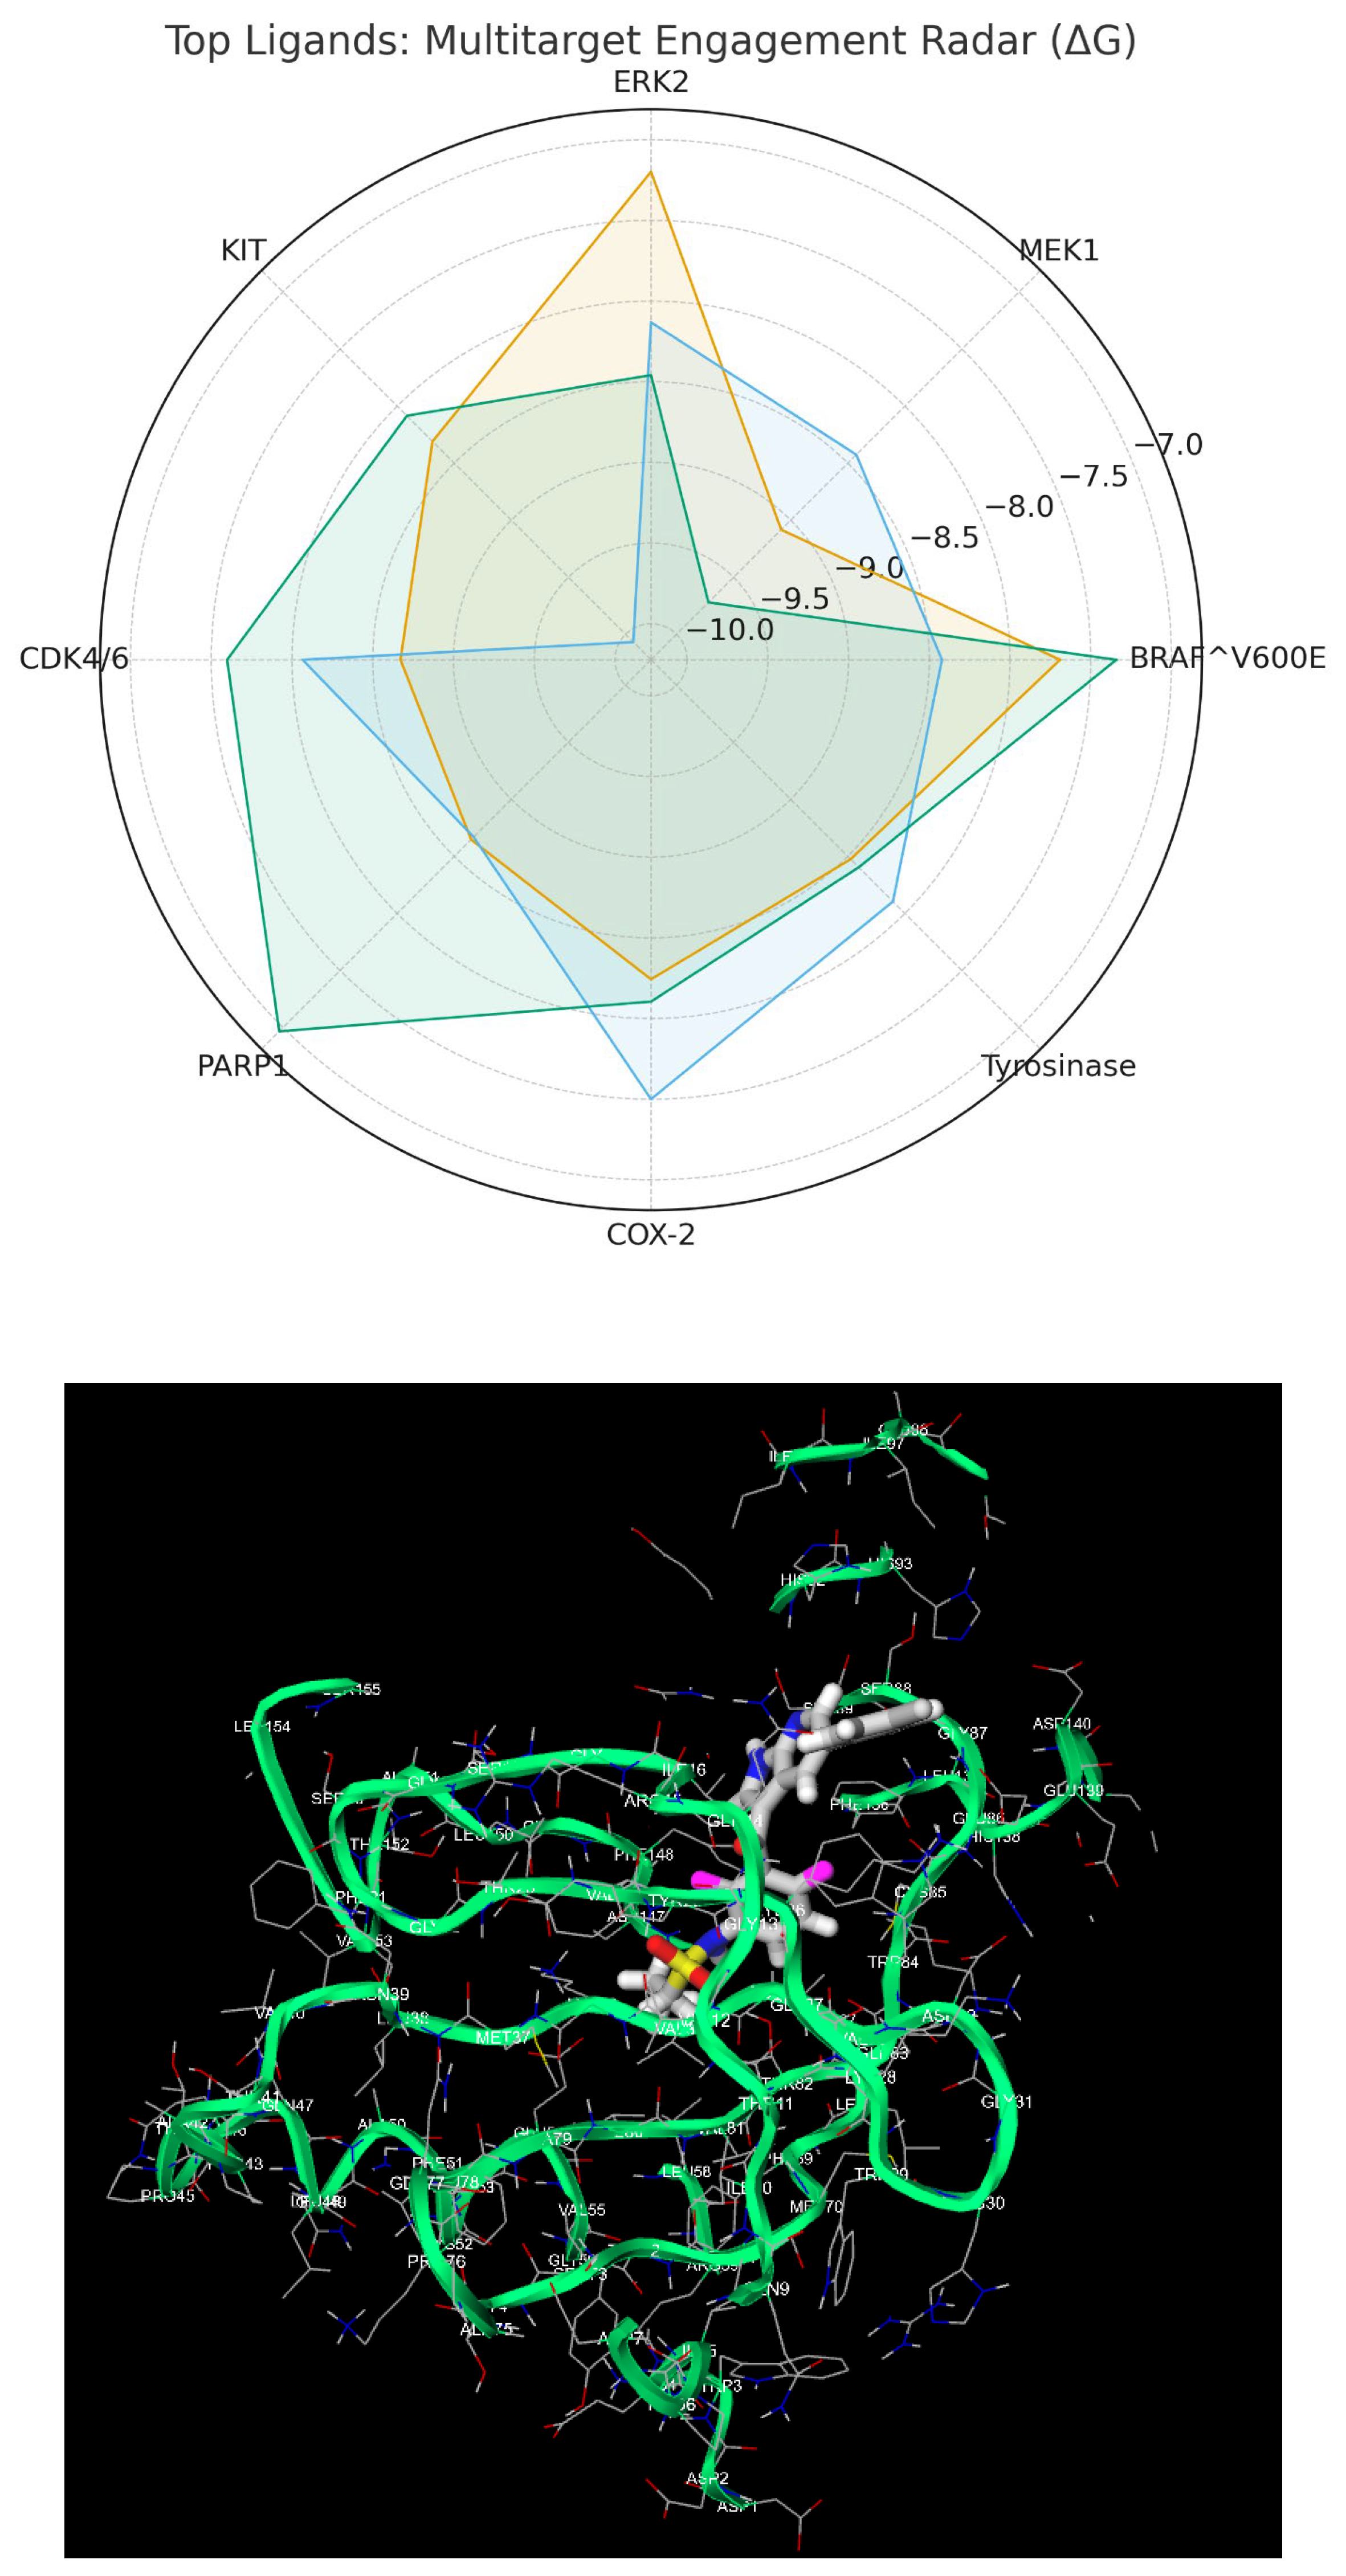
Figure 4.
a & b: PARP1–Olaparib (left image). Olaparib is bound in the canonical nicotinamide-binding pocket of the PARP1 catalytic domain, extending along the NAD+ channel. Its phthalazinone core forms key hydrogen bonds with backbone atoms in the glycine-rich loop and residues lining the donor–acceptor site, mimicking the nicotinamide moiety. Flanking aromatic rings engage in π–π stacking and hydrophobic contacts with adjacent aromatic and aliphatic residues, tightly packing the inhibitor in the cleft. The pose is consistent with a high-affinity, competitive blockade of PARP1 catalytic activity.
Figure 4.
a & b: PARP1–Olaparib (left image). Olaparib is bound in the canonical nicotinamide-binding pocket of the PARP1 catalytic domain, extending along the NAD+ channel. Its phthalazinone core forms key hydrogen bonds with backbone atoms in the glycine-rich loop and residues lining the donor–acceptor site, mimicking the nicotinamide moiety. Flanking aromatic rings engage in π–π stacking and hydrophobic contacts with adjacent aromatic and aliphatic residues, tightly packing the inhibitor in the cleft. The pose is consistent with a high-affinity, competitive blockade of PARP1 catalytic activity.
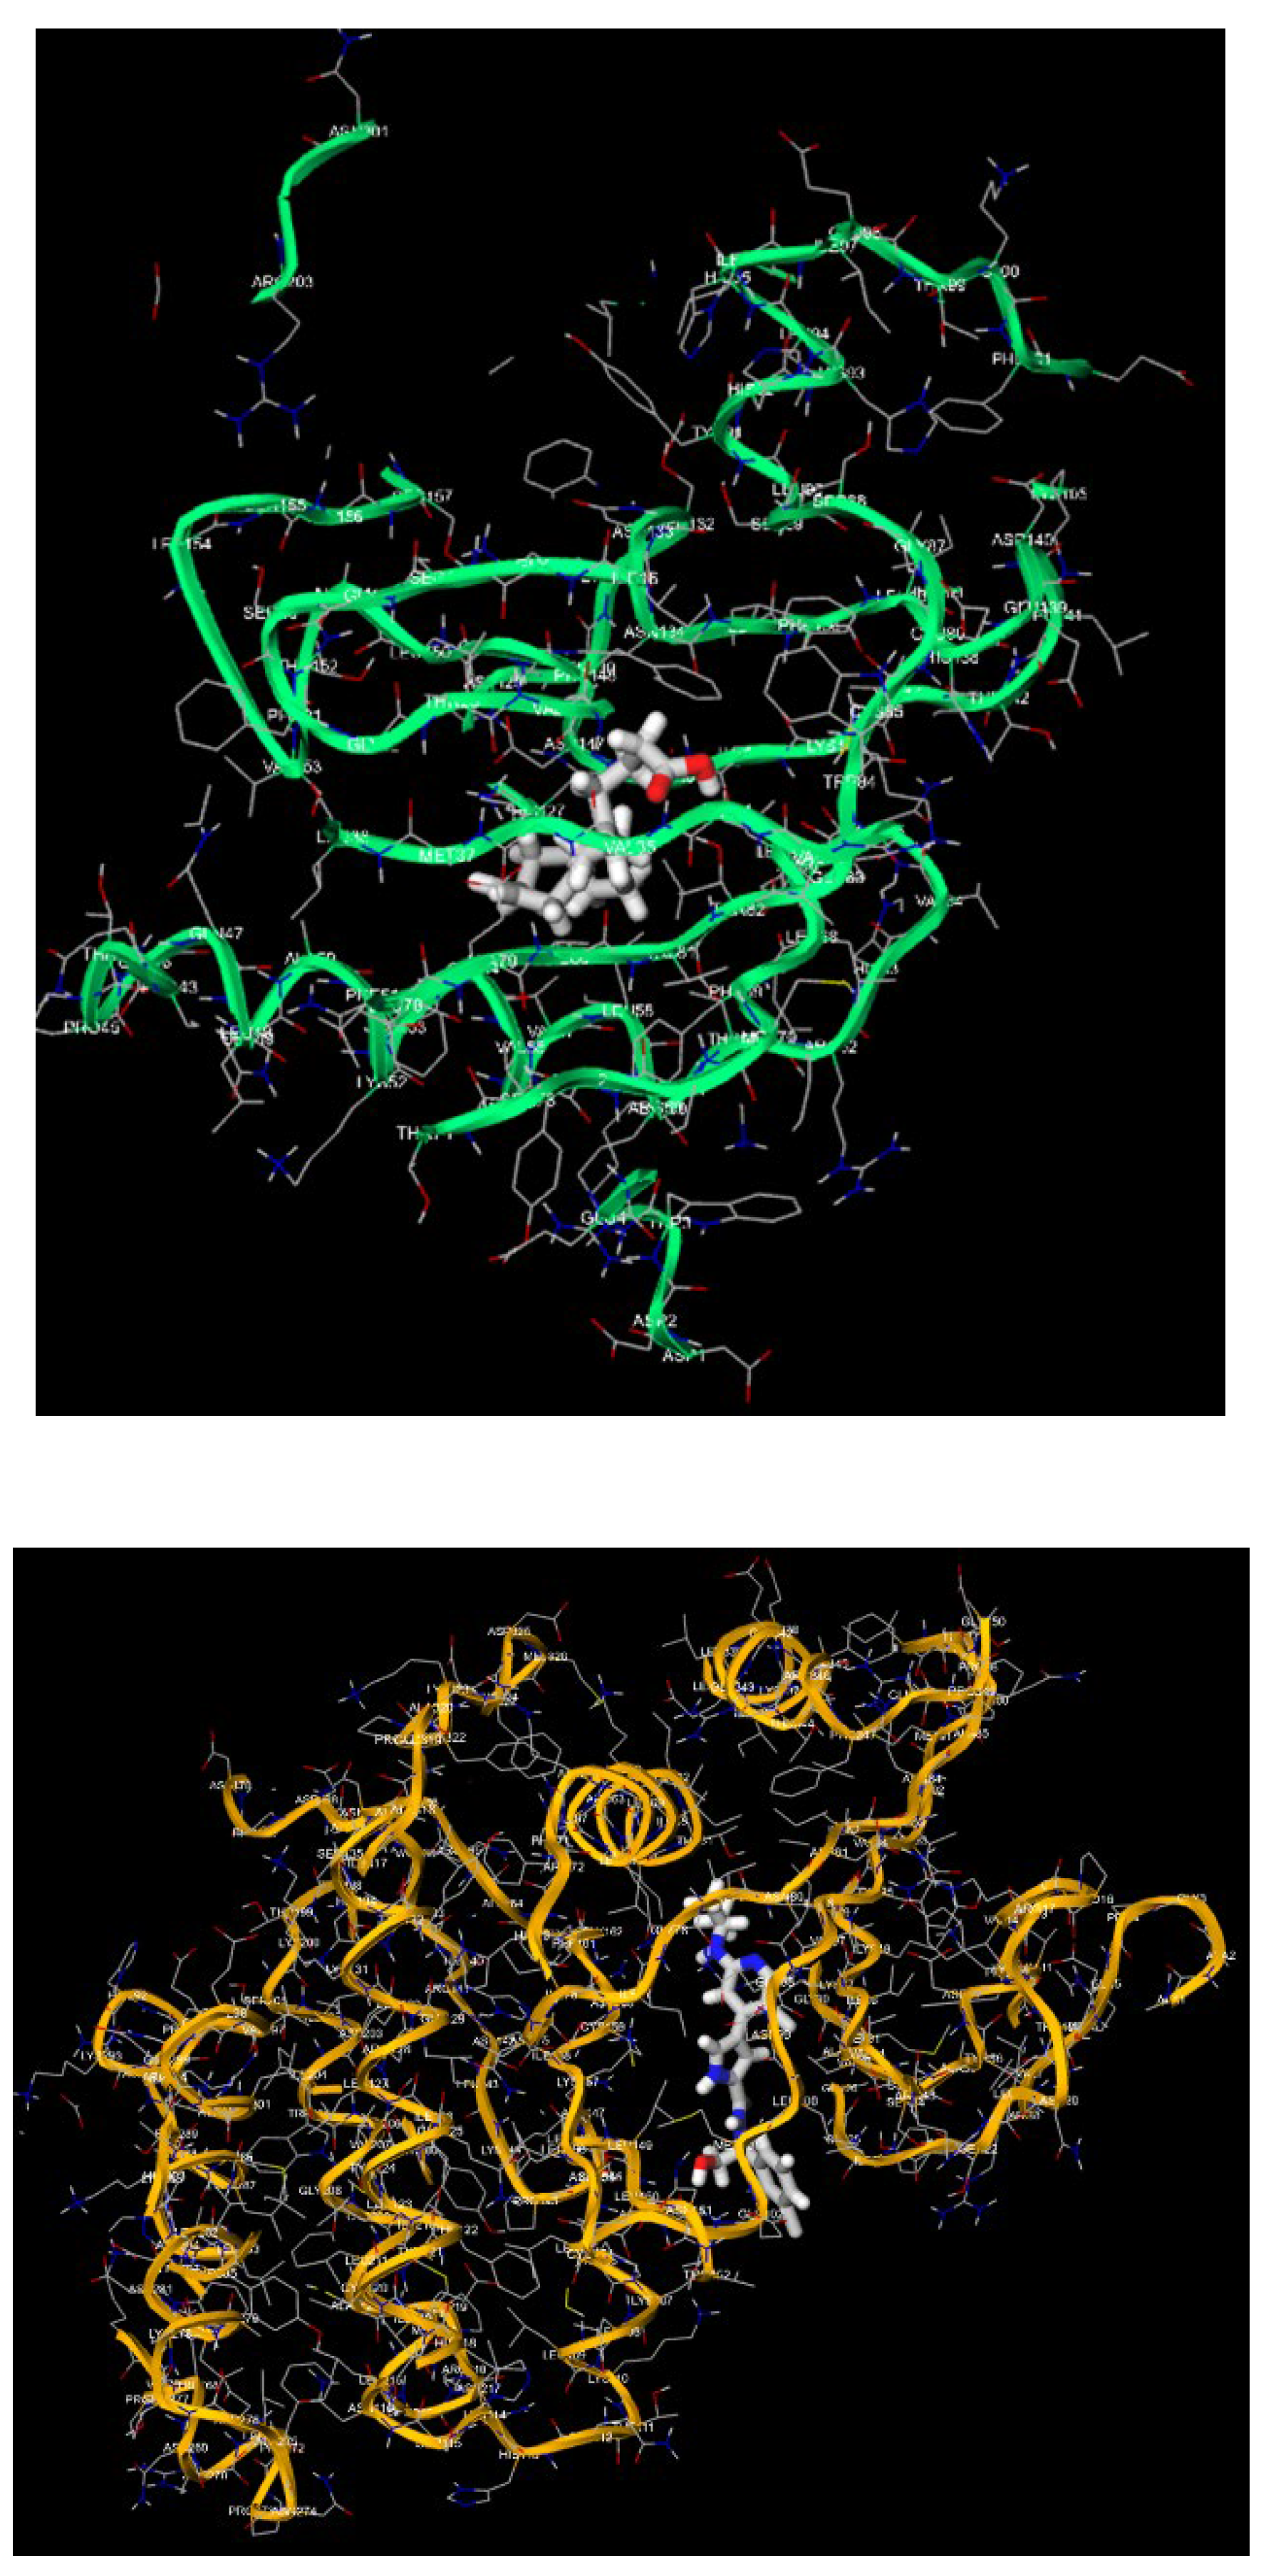
Figure 5.
a & b: Tyrosinase–Kojic Acid (left image). Kojic acid is docked in the catalytic pocket of tyrosinase, in close proximity to the dinuclear copper center that mediates ortho-hydroxylation of phenolic substrates. The hydroxypyranone core forms bidentate hydrogen bonds with histidine and other polar residues lining the active site, while its O-donor atoms are appropriately oriented to chelate/coordinate the metal ions. Additional weak van der Waals contacts with surrounding hydrophobic residues further stabilize the pose. This configuration is consistent with a high-affinity competitive inhibitor that directly blocks access of physiological phenolic substrates to the copper center.
Figure 5.
a & b: Tyrosinase–Kojic Acid (left image). Kojic acid is docked in the catalytic pocket of tyrosinase, in close proximity to the dinuclear copper center that mediates ortho-hydroxylation of phenolic substrates. The hydroxypyranone core forms bidentate hydrogen bonds with histidine and other polar residues lining the active site, while its O-donor atoms are appropriately oriented to chelate/coordinate the metal ions. Additional weak van der Waals contacts with surrounding hydrophobic residues further stabilize the pose. This configuration is consistent with a high-affinity competitive inhibitor that directly blocks access of physiological phenolic substrates to the copper center.
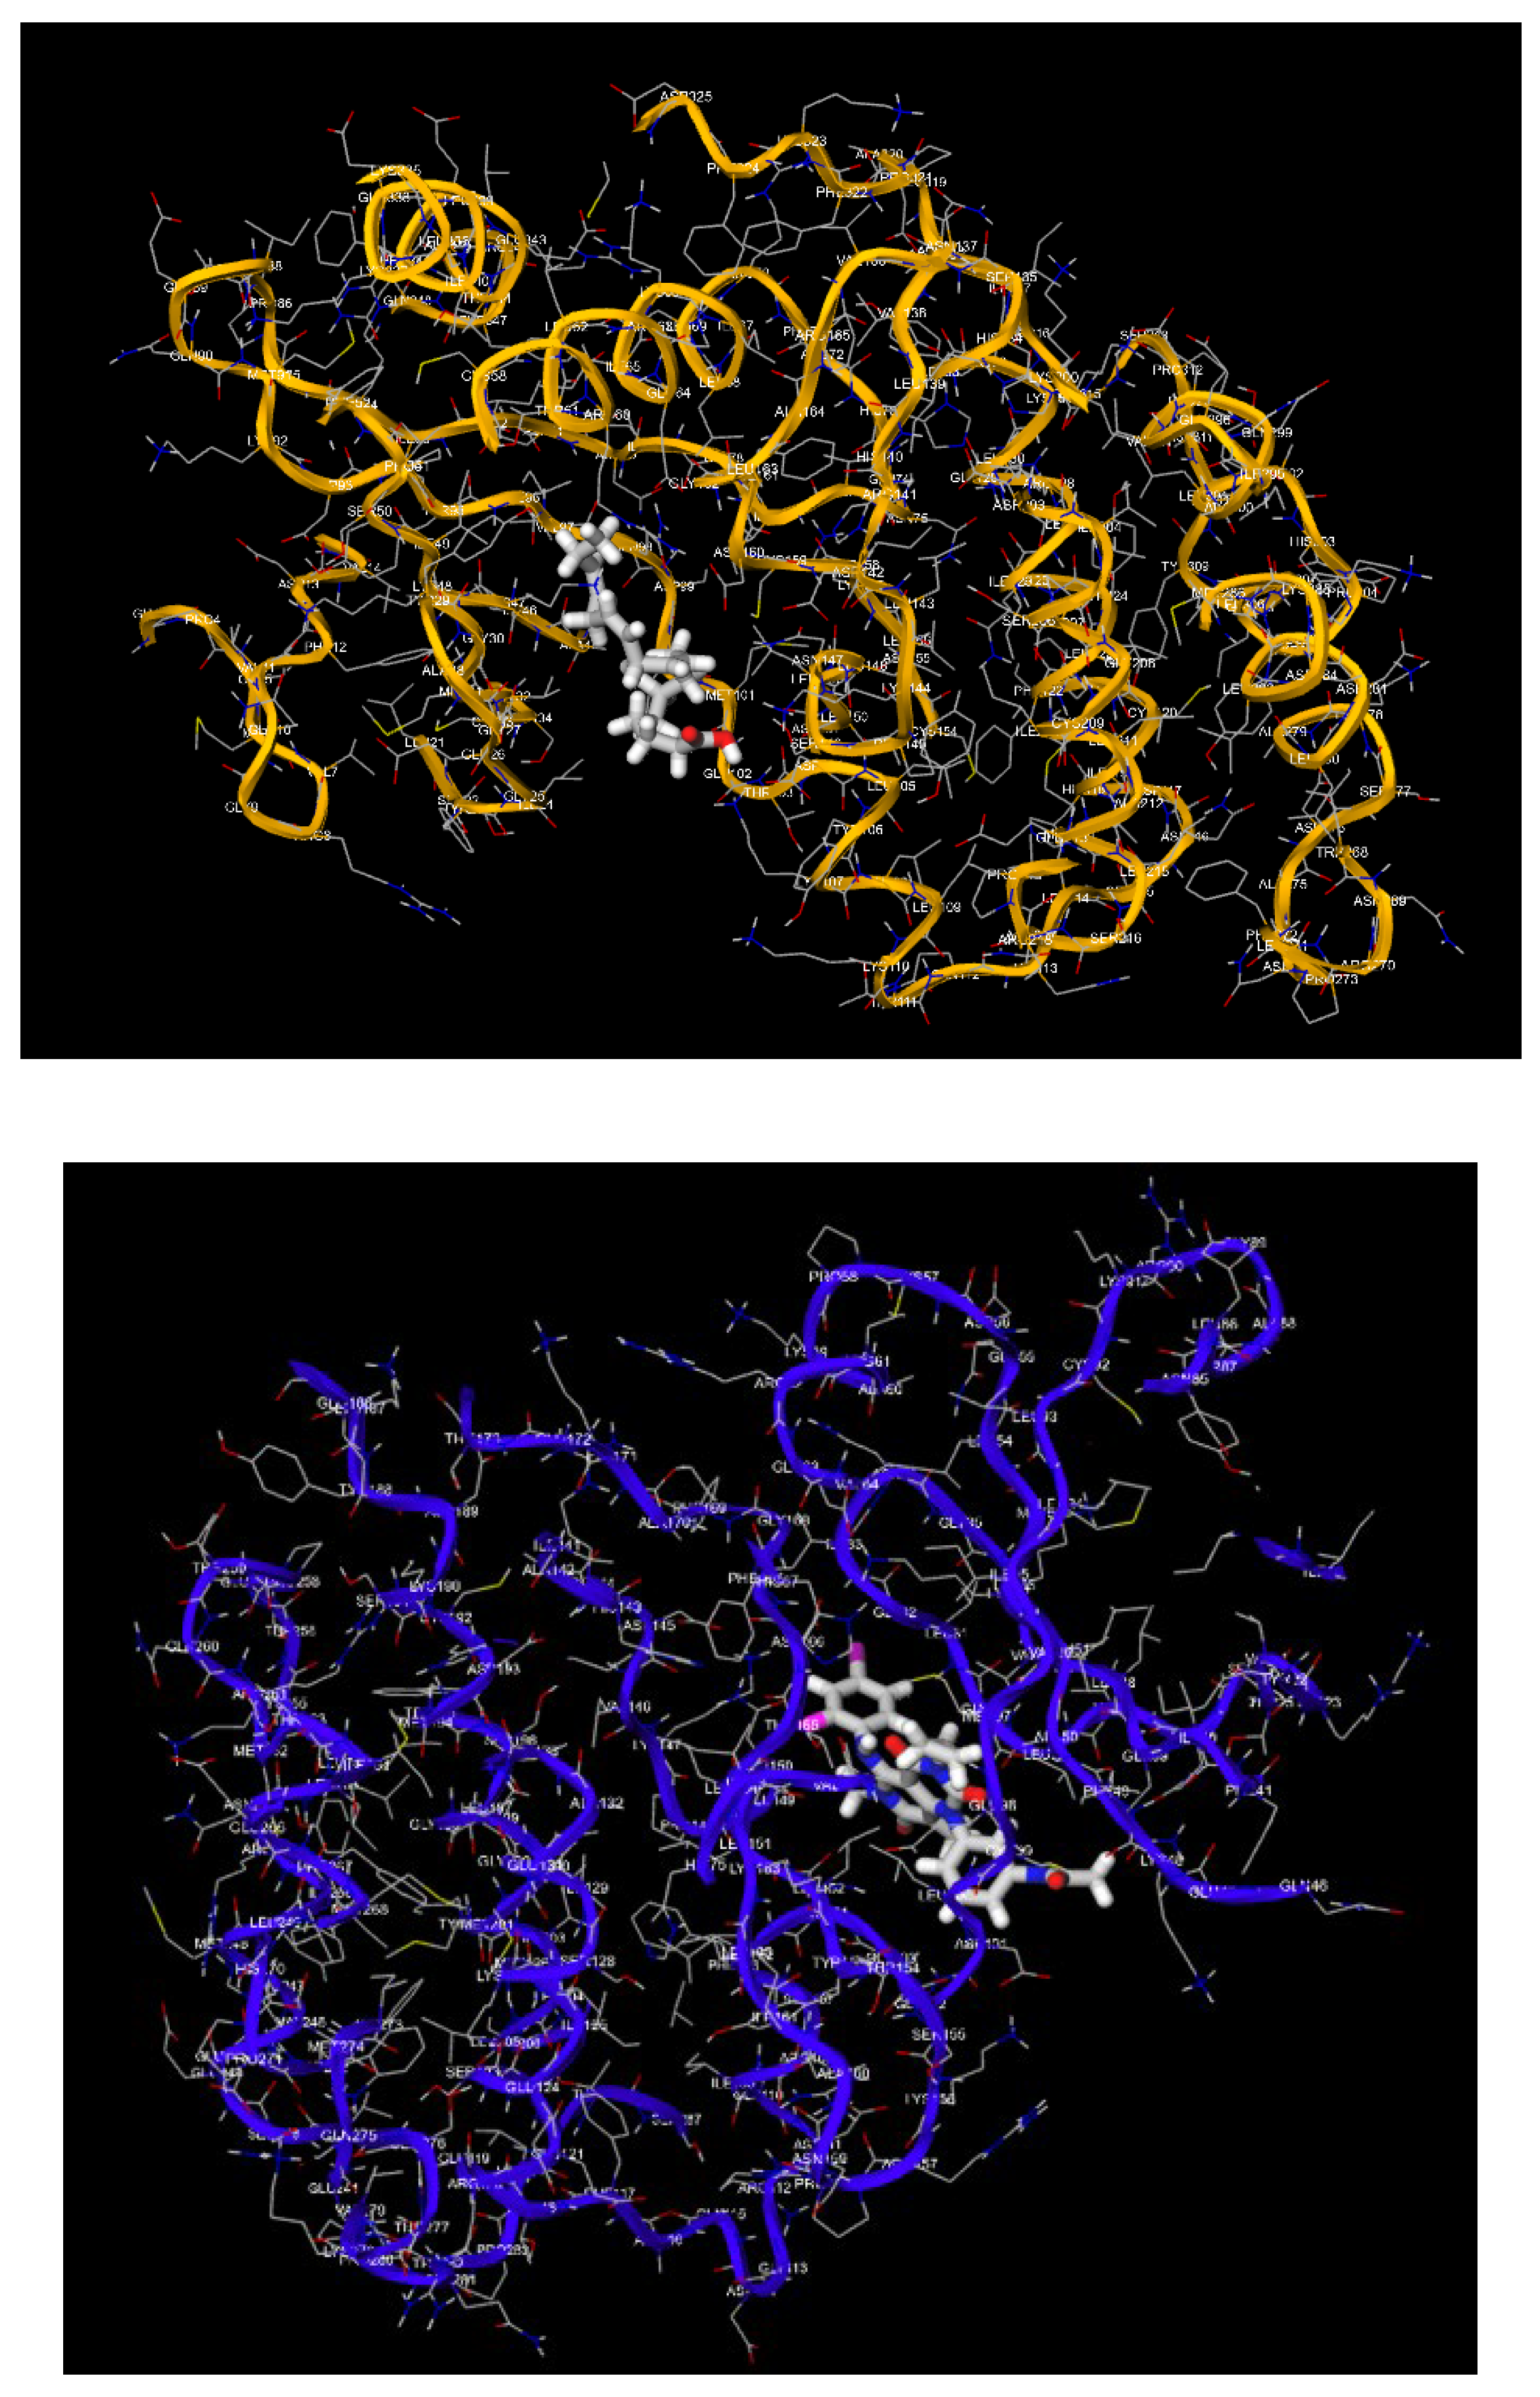
Figure 6.
Additional docking/interaction visualization extracted from the in silico manuscript.
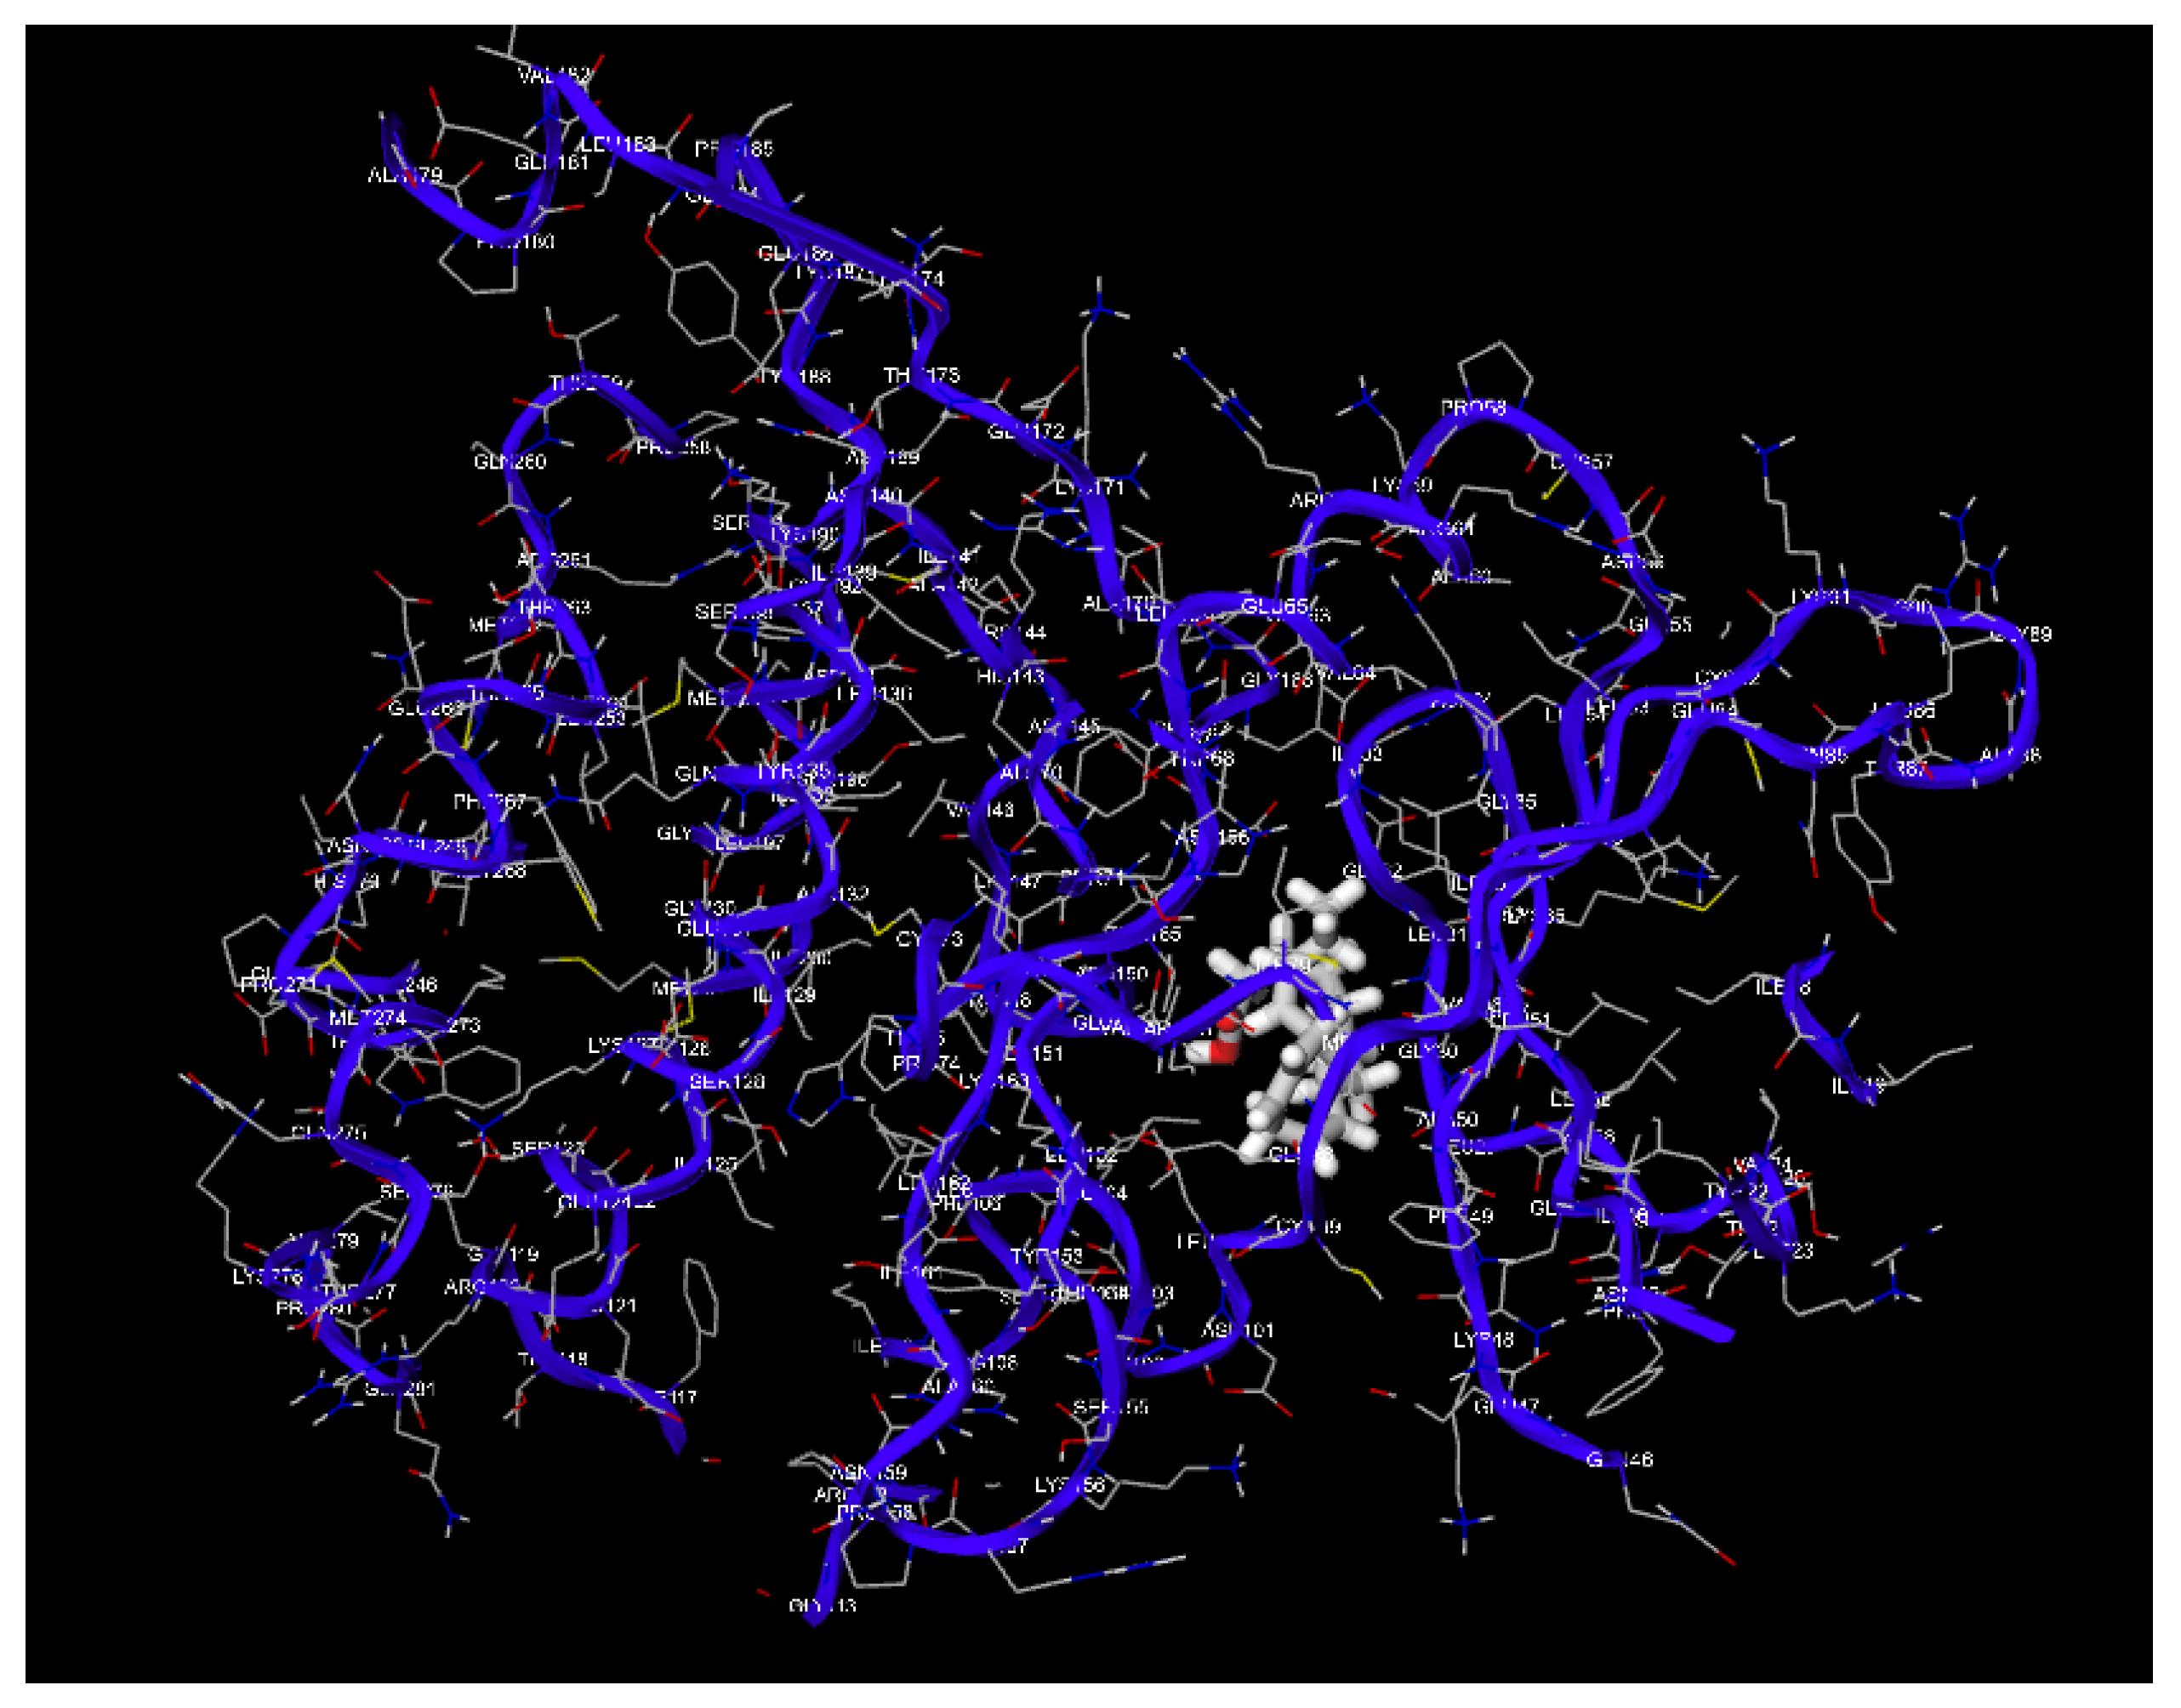
Figure 7.
Additional docking/interaction visualization extracted from the in silico manuscript.
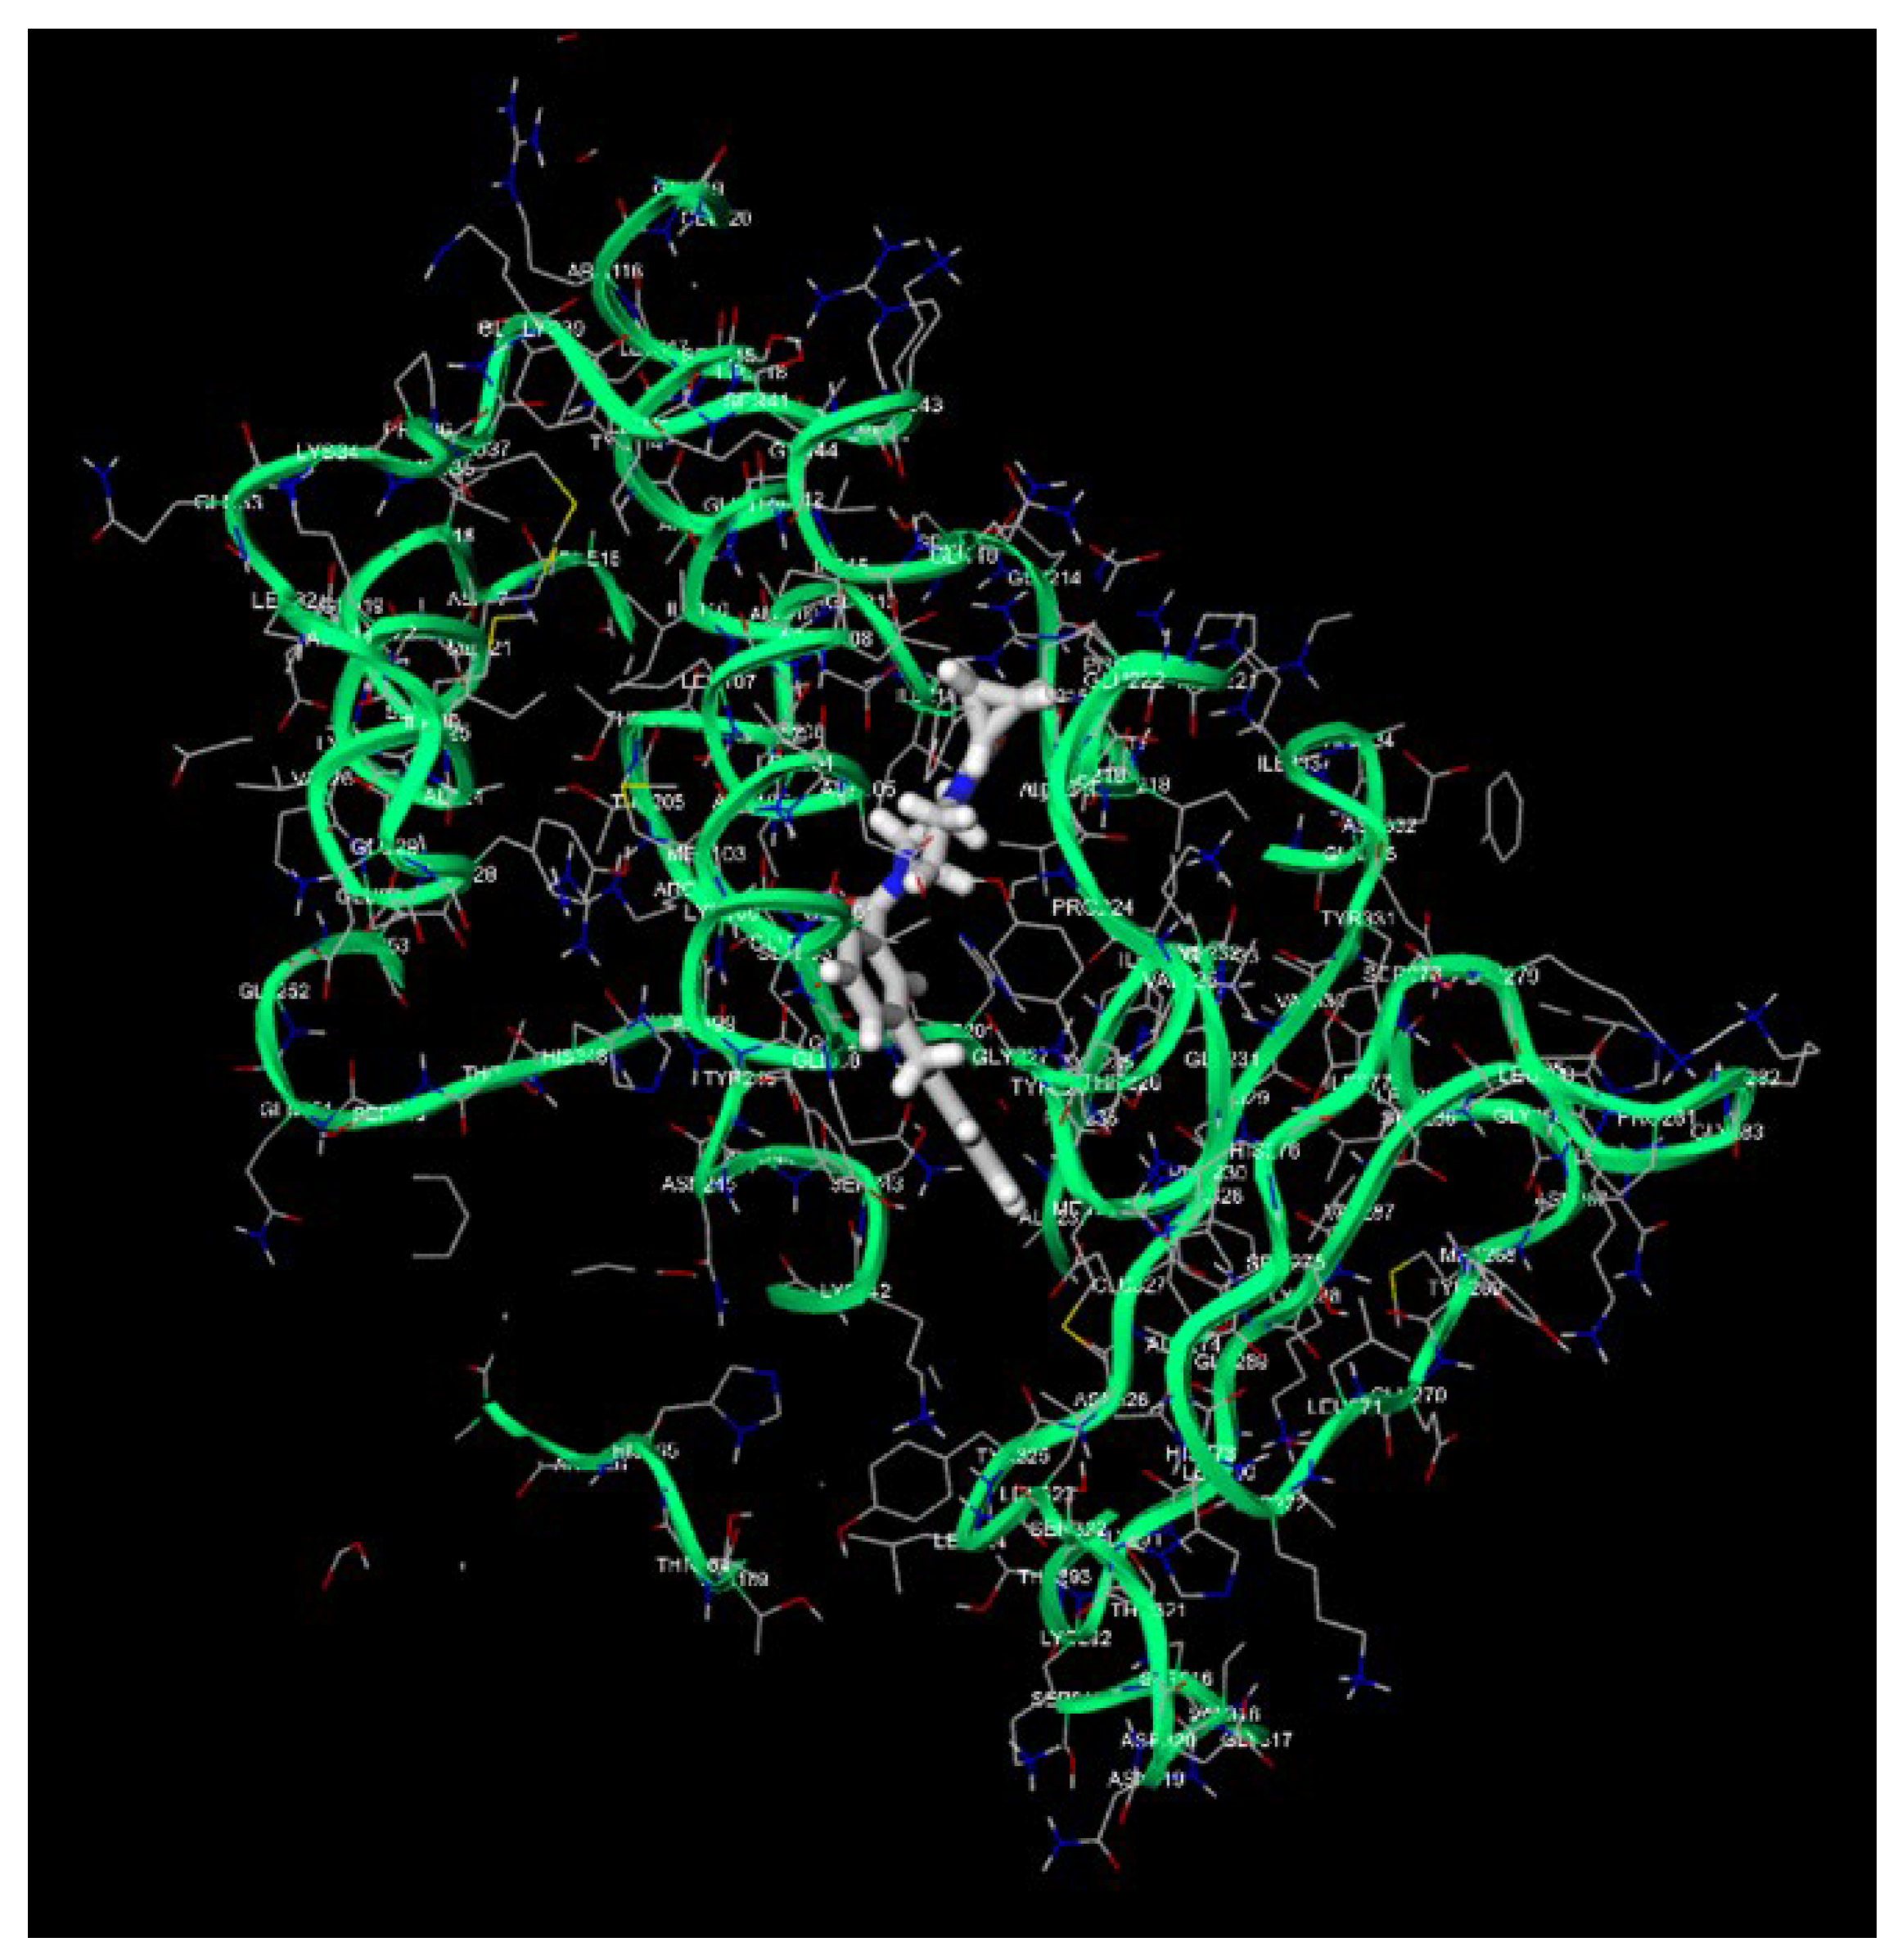
Figure 8.
Additional docking/interaction visualization extracted from the in silico manuscript.
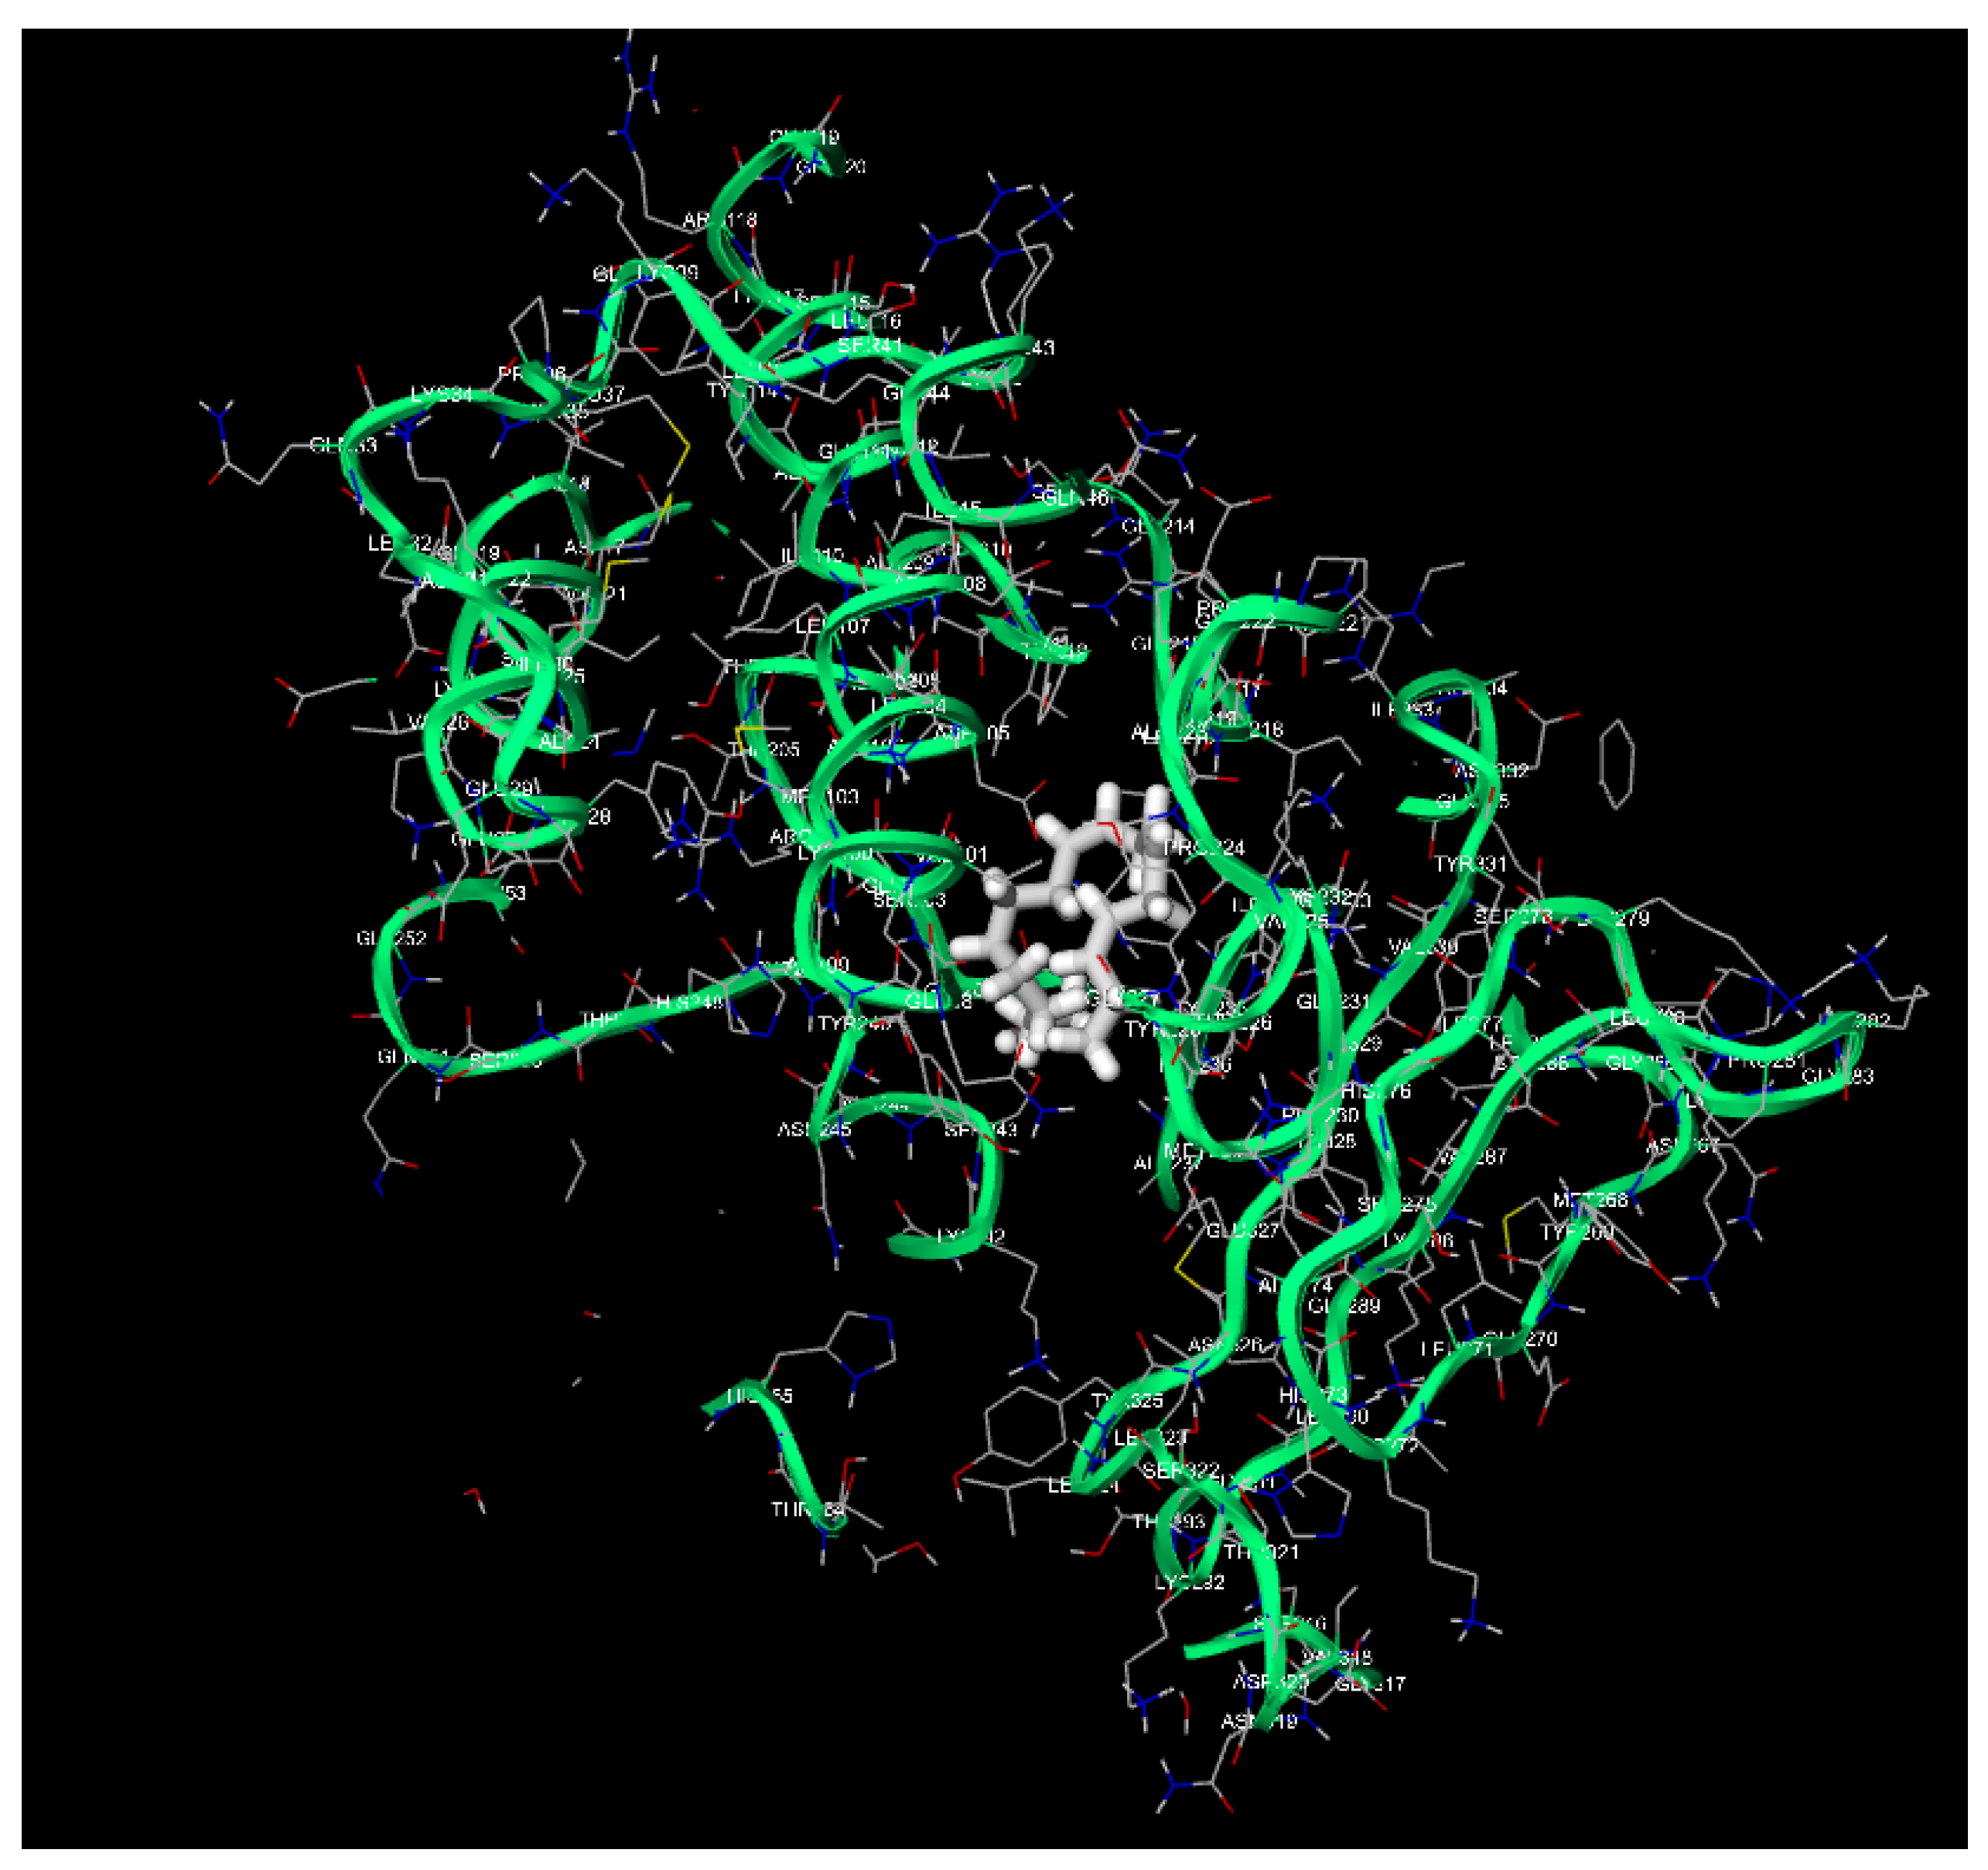
Figure 9.
Additional docking/interaction visualization extracted from the in silico manuscript.
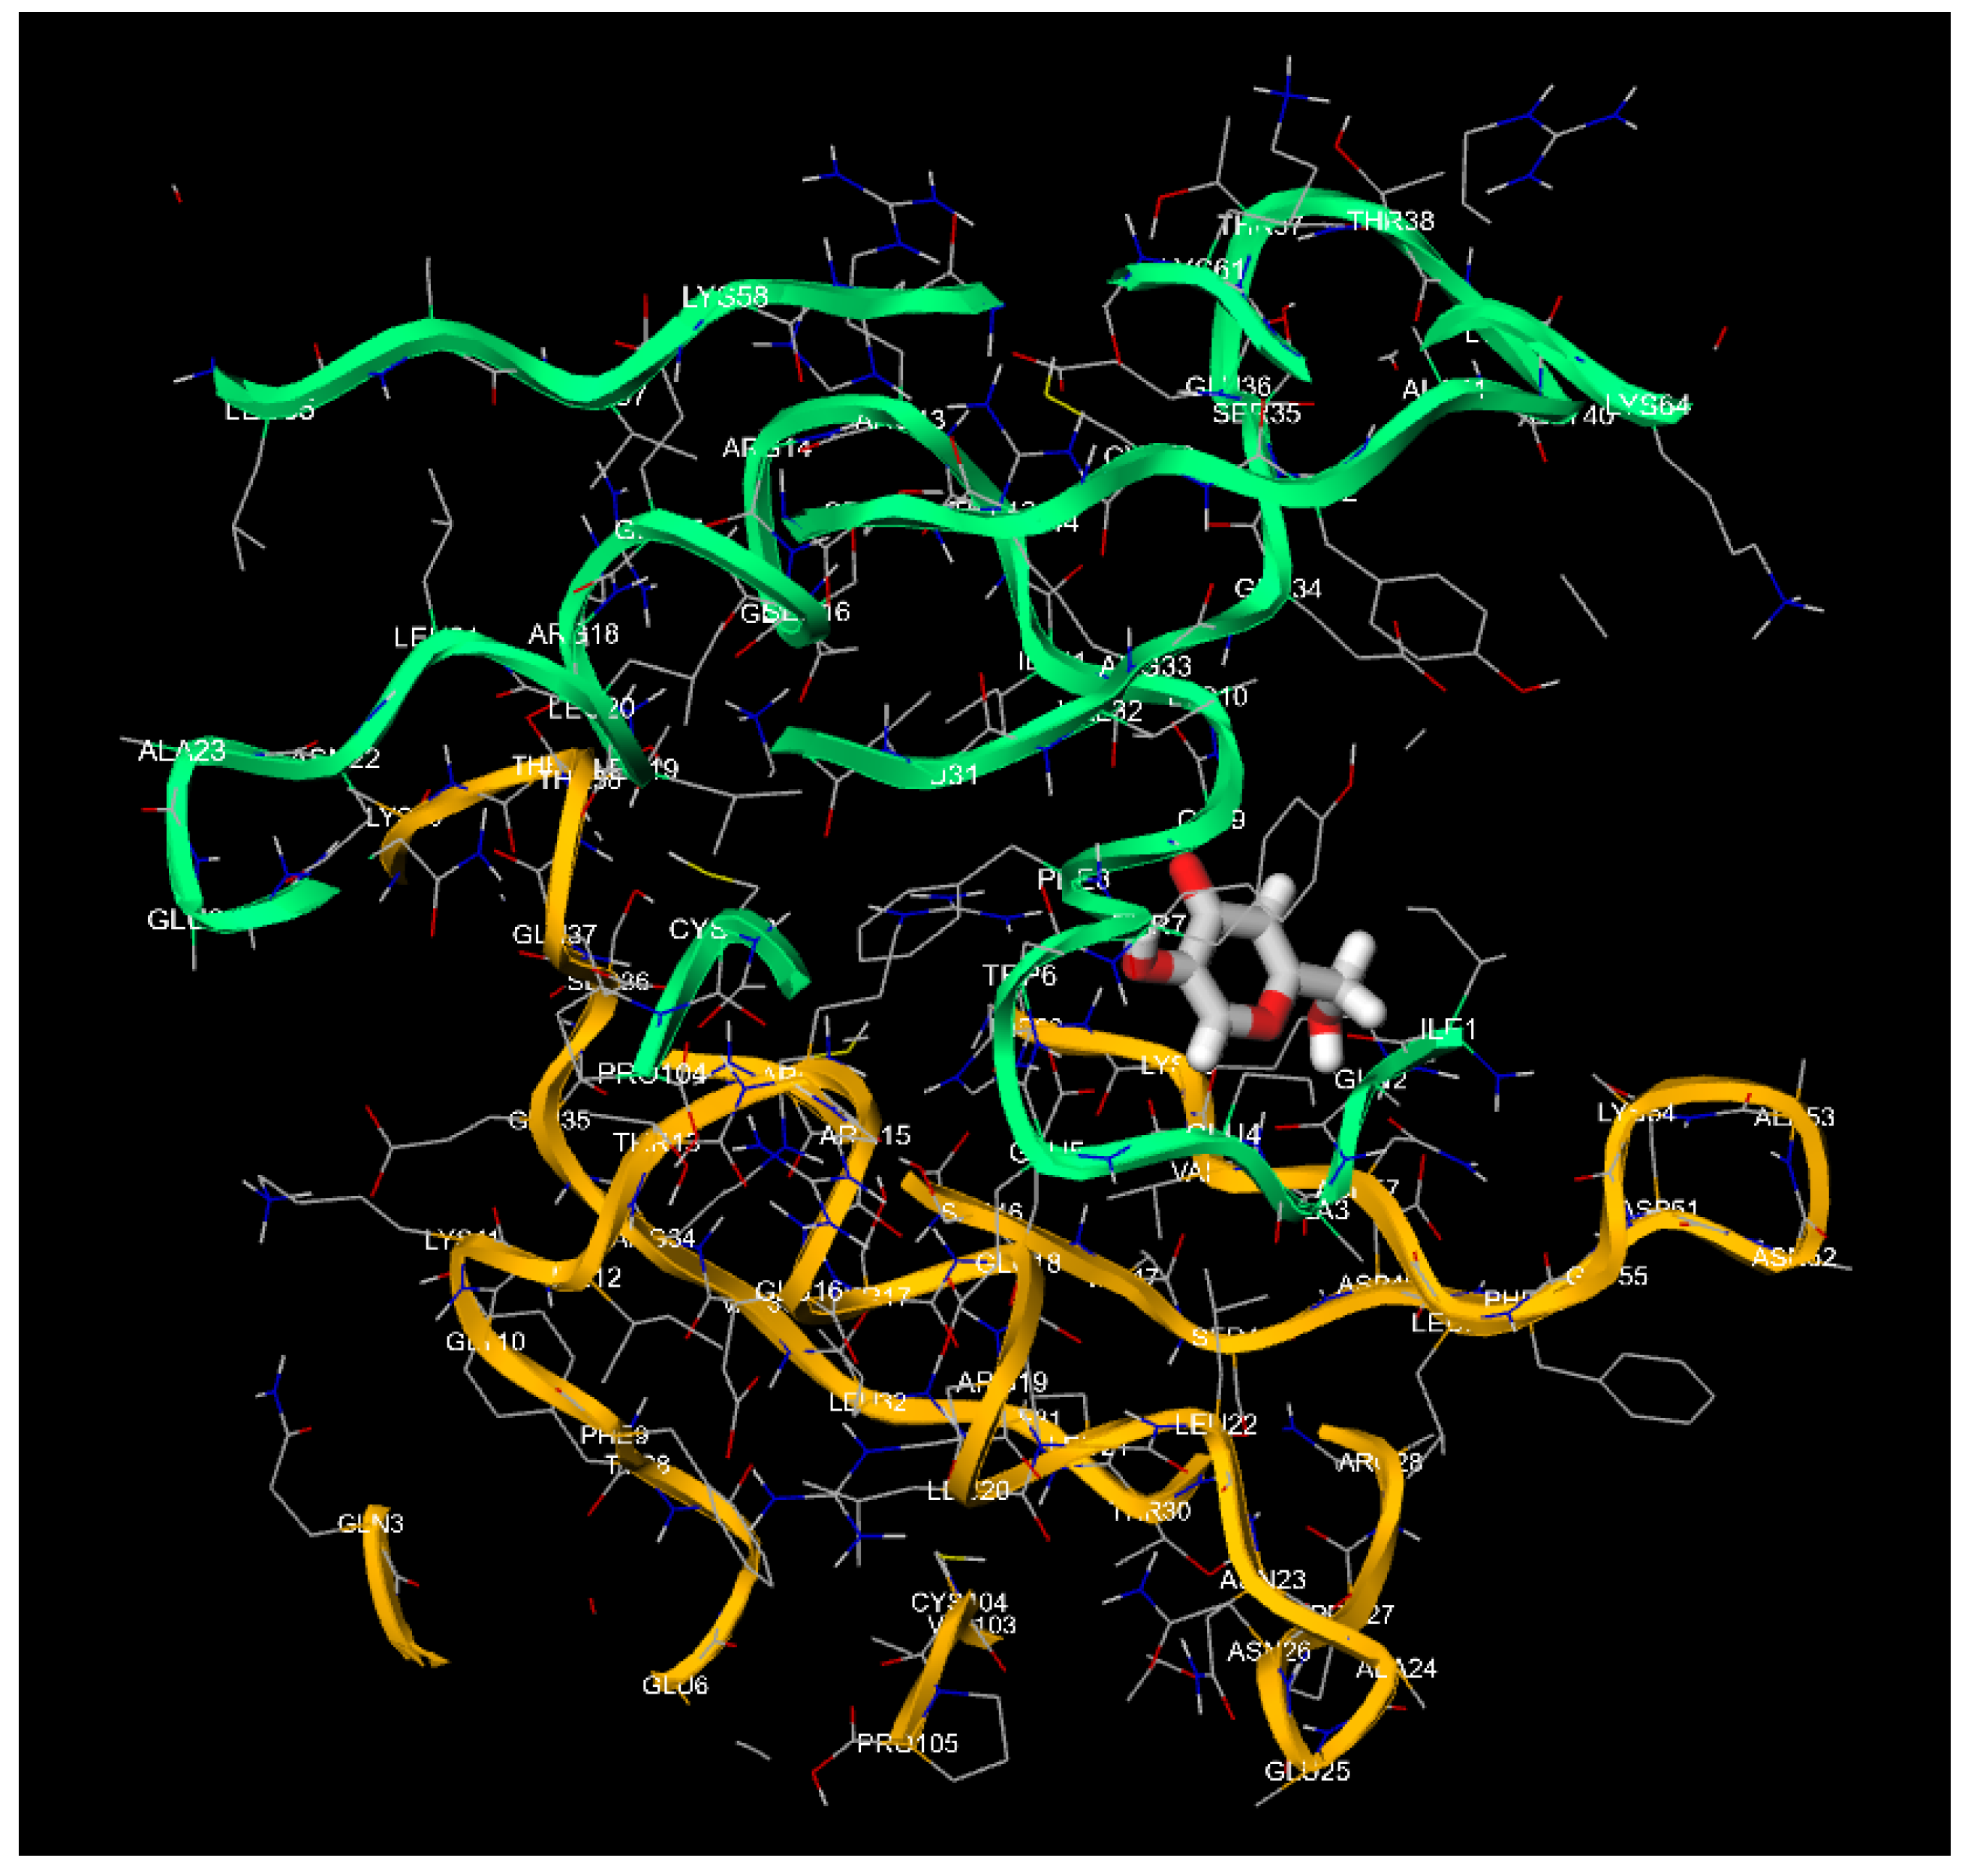
Figure 10.
Additional docking/interaction visualization extracted from the in silico manuscript.
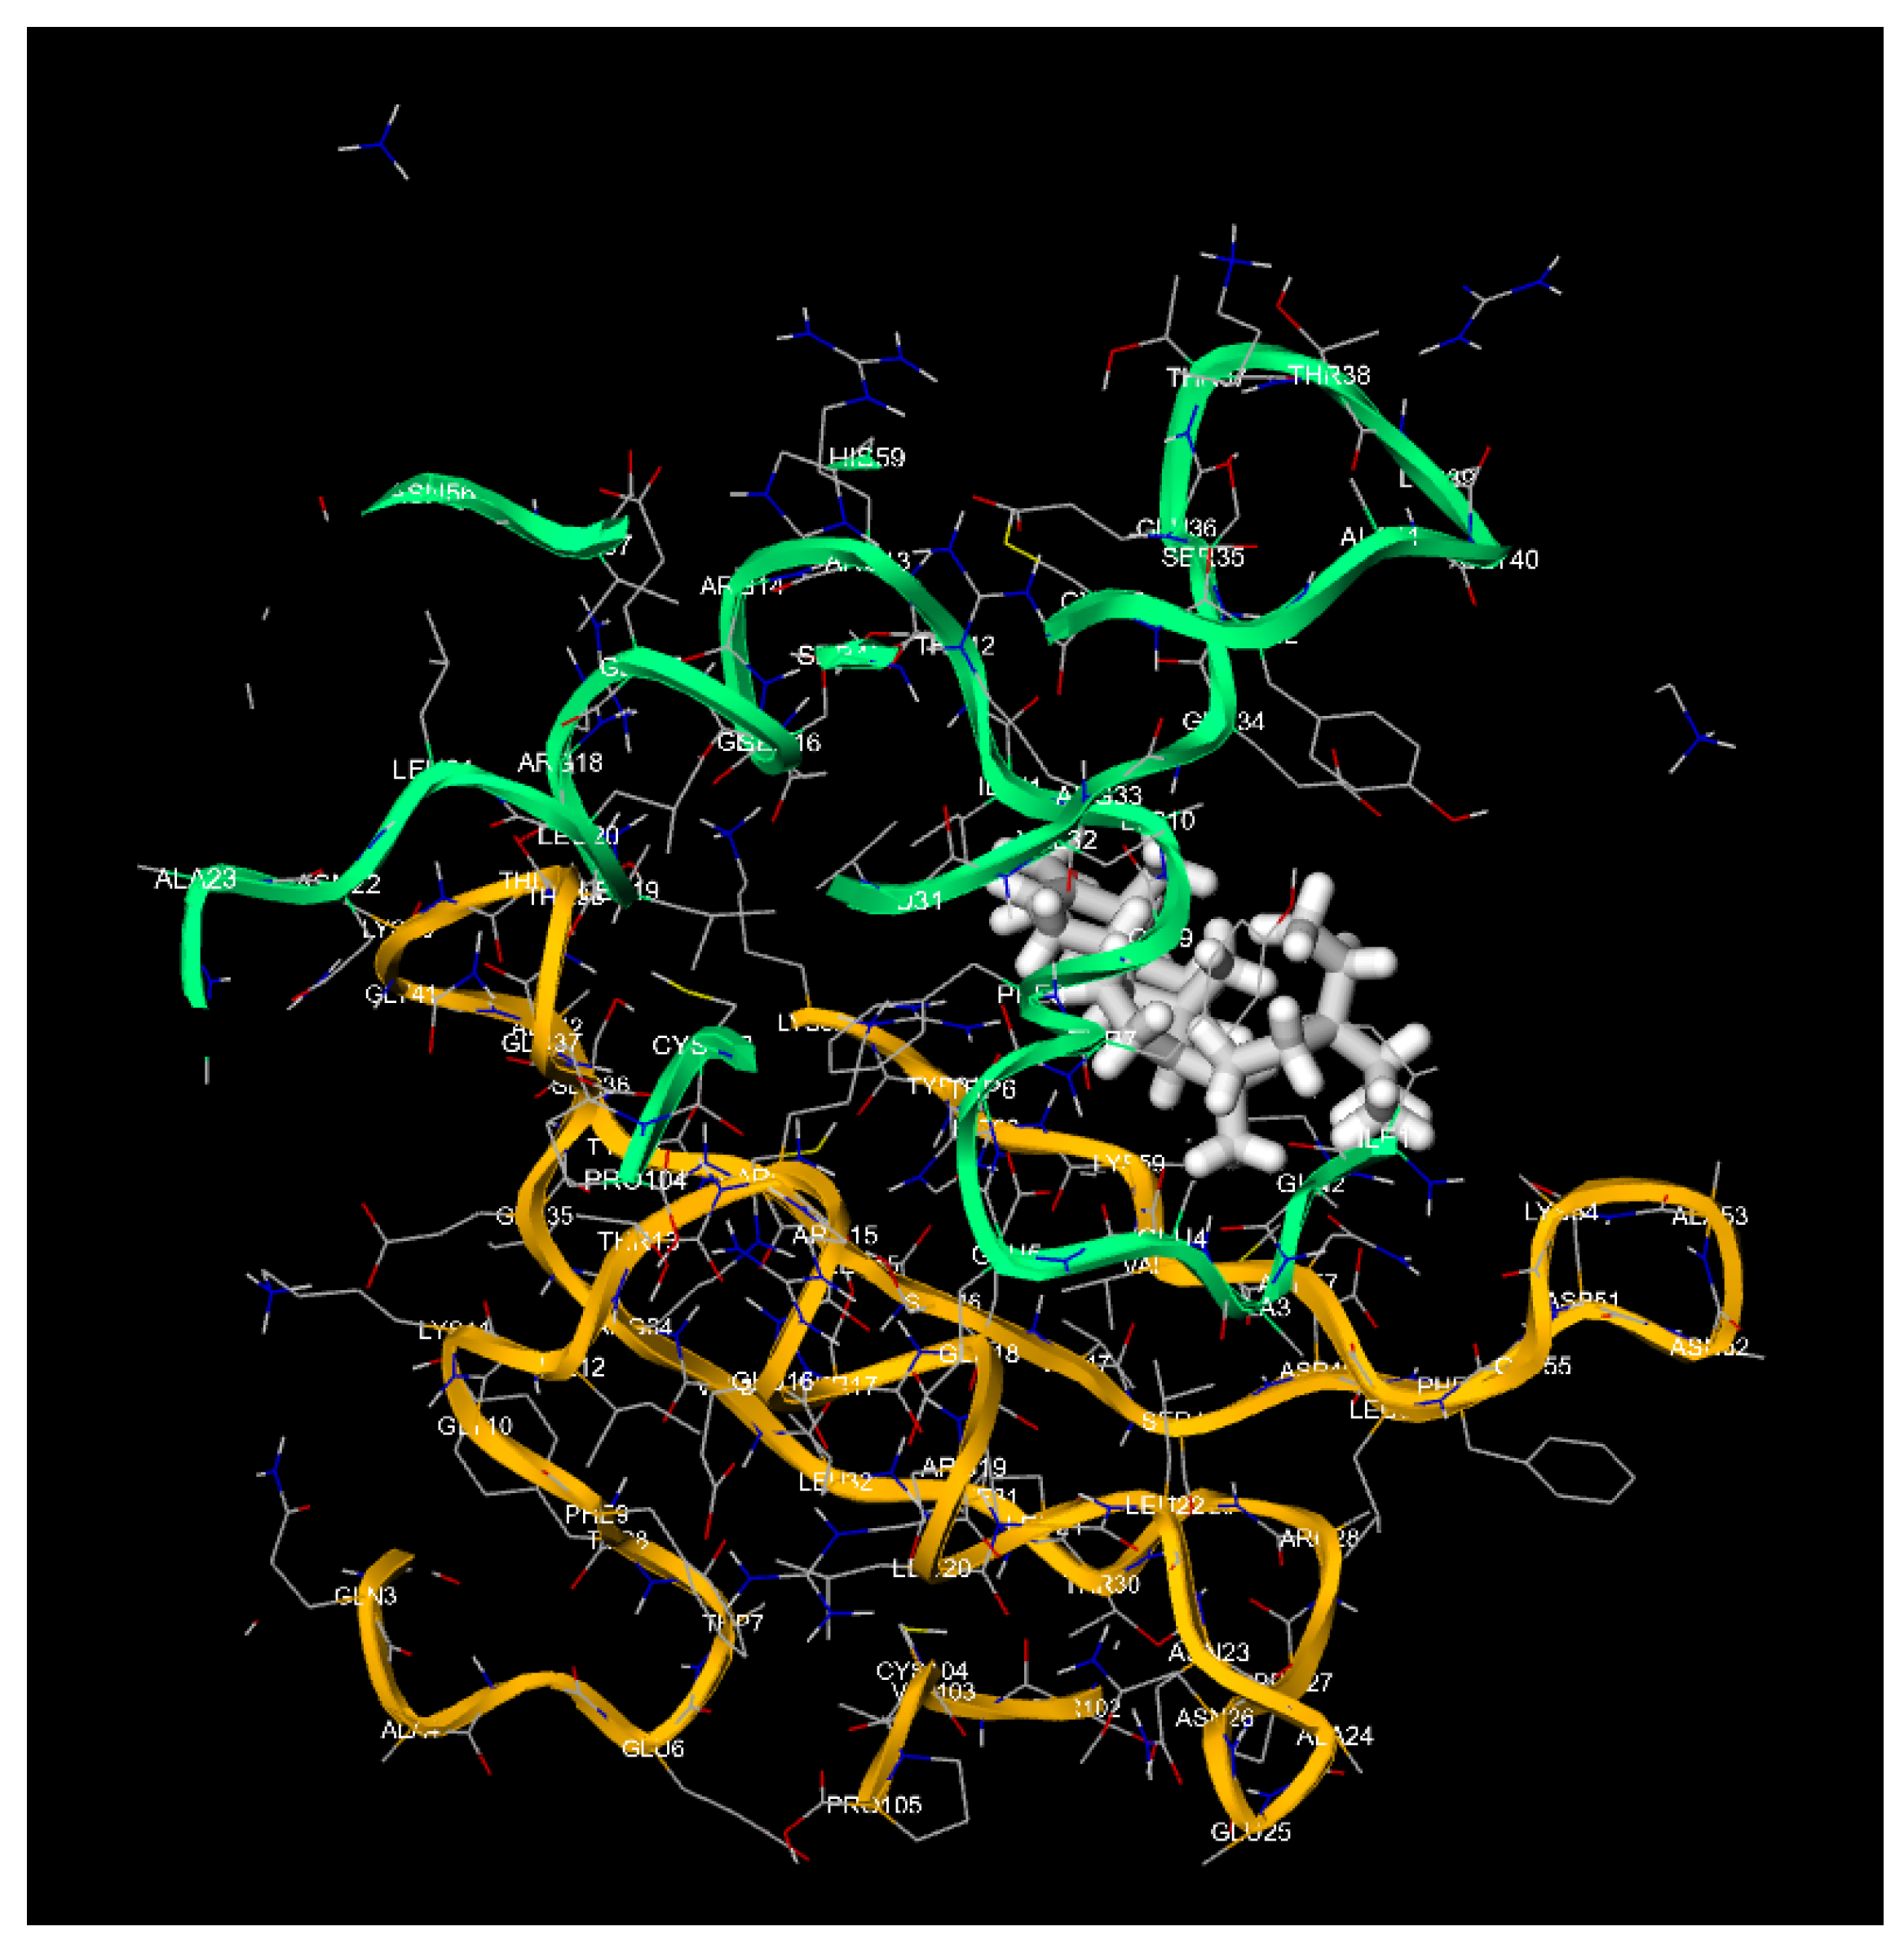
Figure 11.
NRU assay—dose–response viability profiles for the dual-oil formulation (“Naevus Support”) versus cisplatin on B16F10 melanoma and MRC-5 fibroblasts (as provided in the experimental manuscript). (Graph 1).
Figure 11.
NRU assay—dose–response viability profiles for the dual-oil formulation (“Naevus Support”) versus cisplatin on B16F10 melanoma and MRC-5 fibroblasts (as provided in the experimental manuscript). (Graph 1).
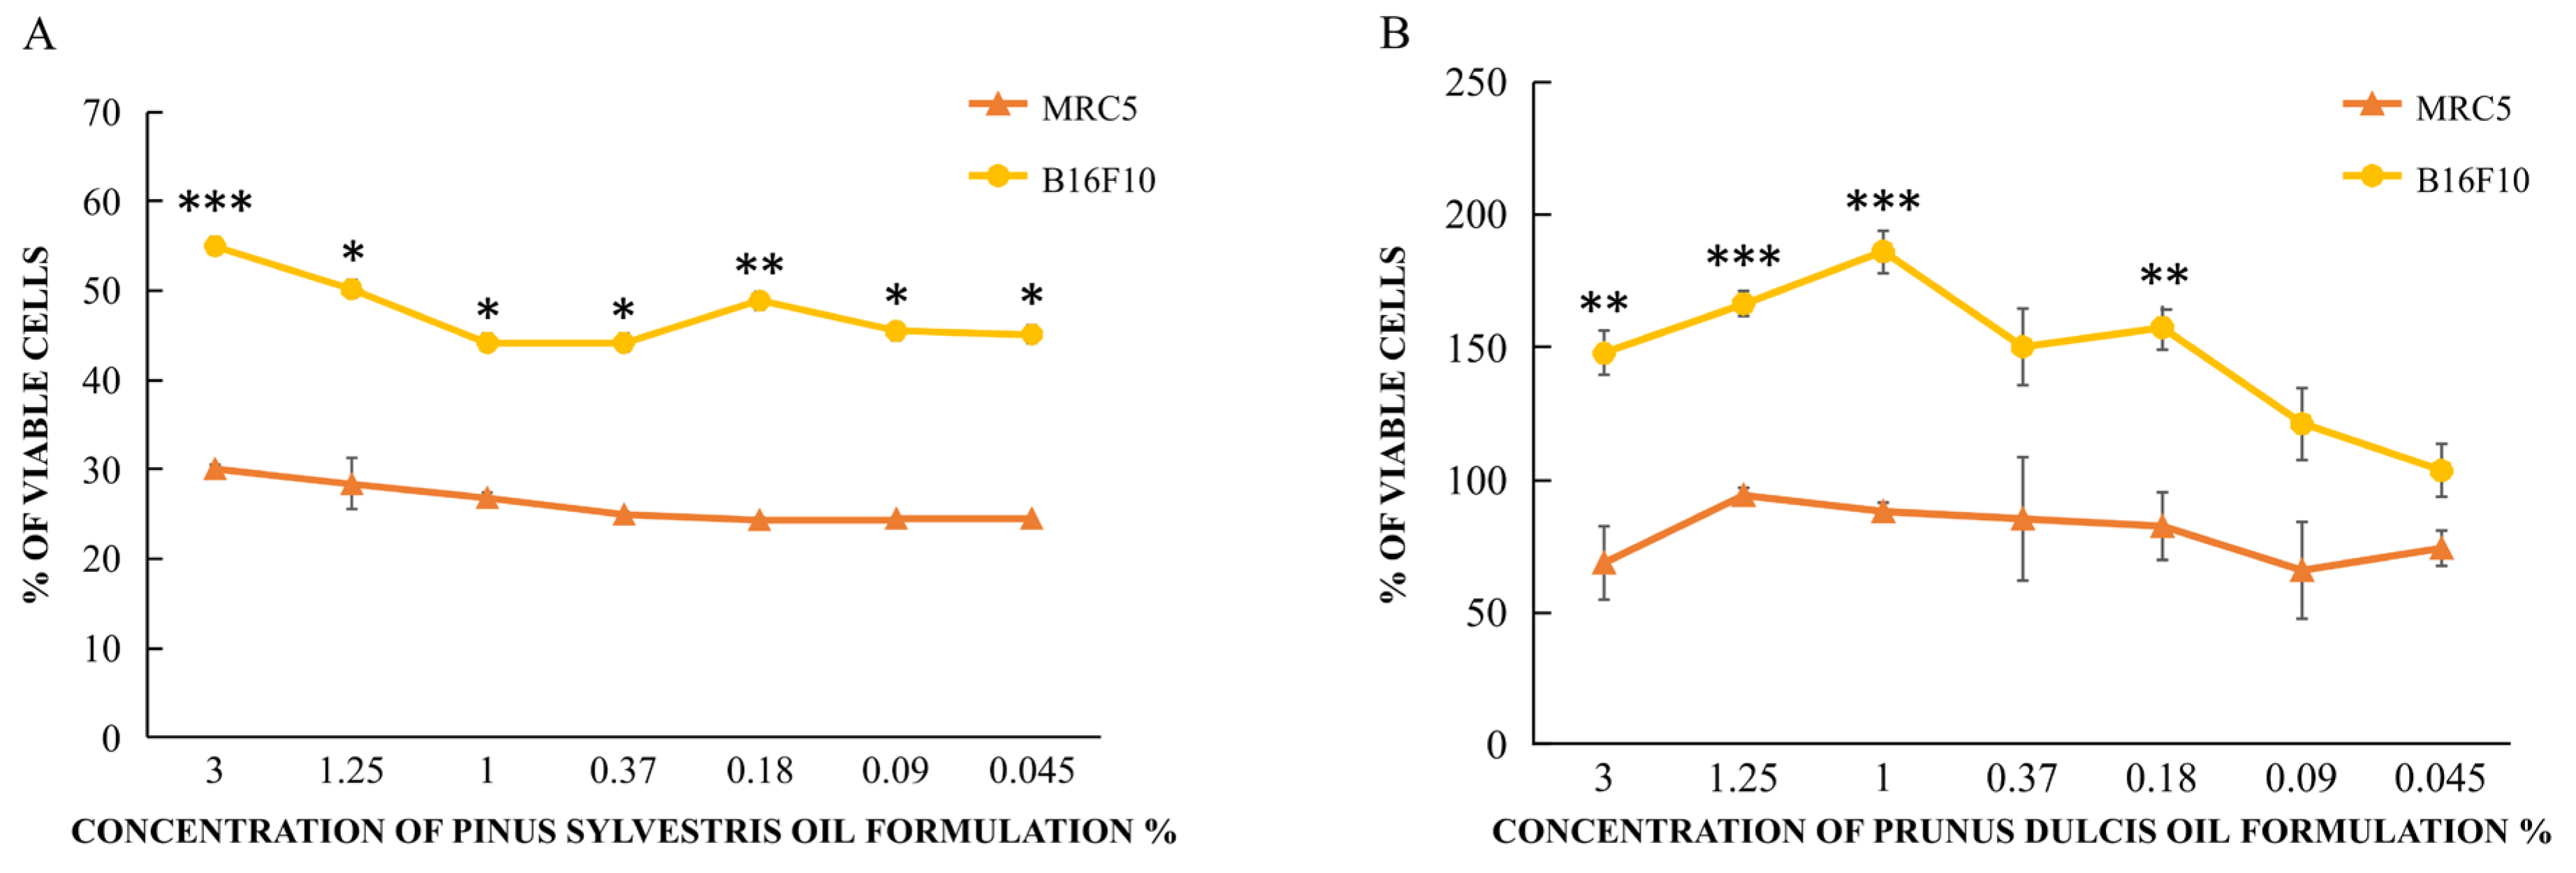
Figure 12.
NRU assay—viability profiles for individual oils (Prunus dulcis, Pinus sylvestris) and the combined formulation on B16F10 and MRC-5 (as provided in the experimental manuscript). (Graph 2).
Figure 12.
NRU assay—viability profiles for individual oils (Prunus dulcis, Pinus sylvestris) and the combined formulation on B16F10 and MRC-5 (as provided in the experimental manuscript). (Graph 2).
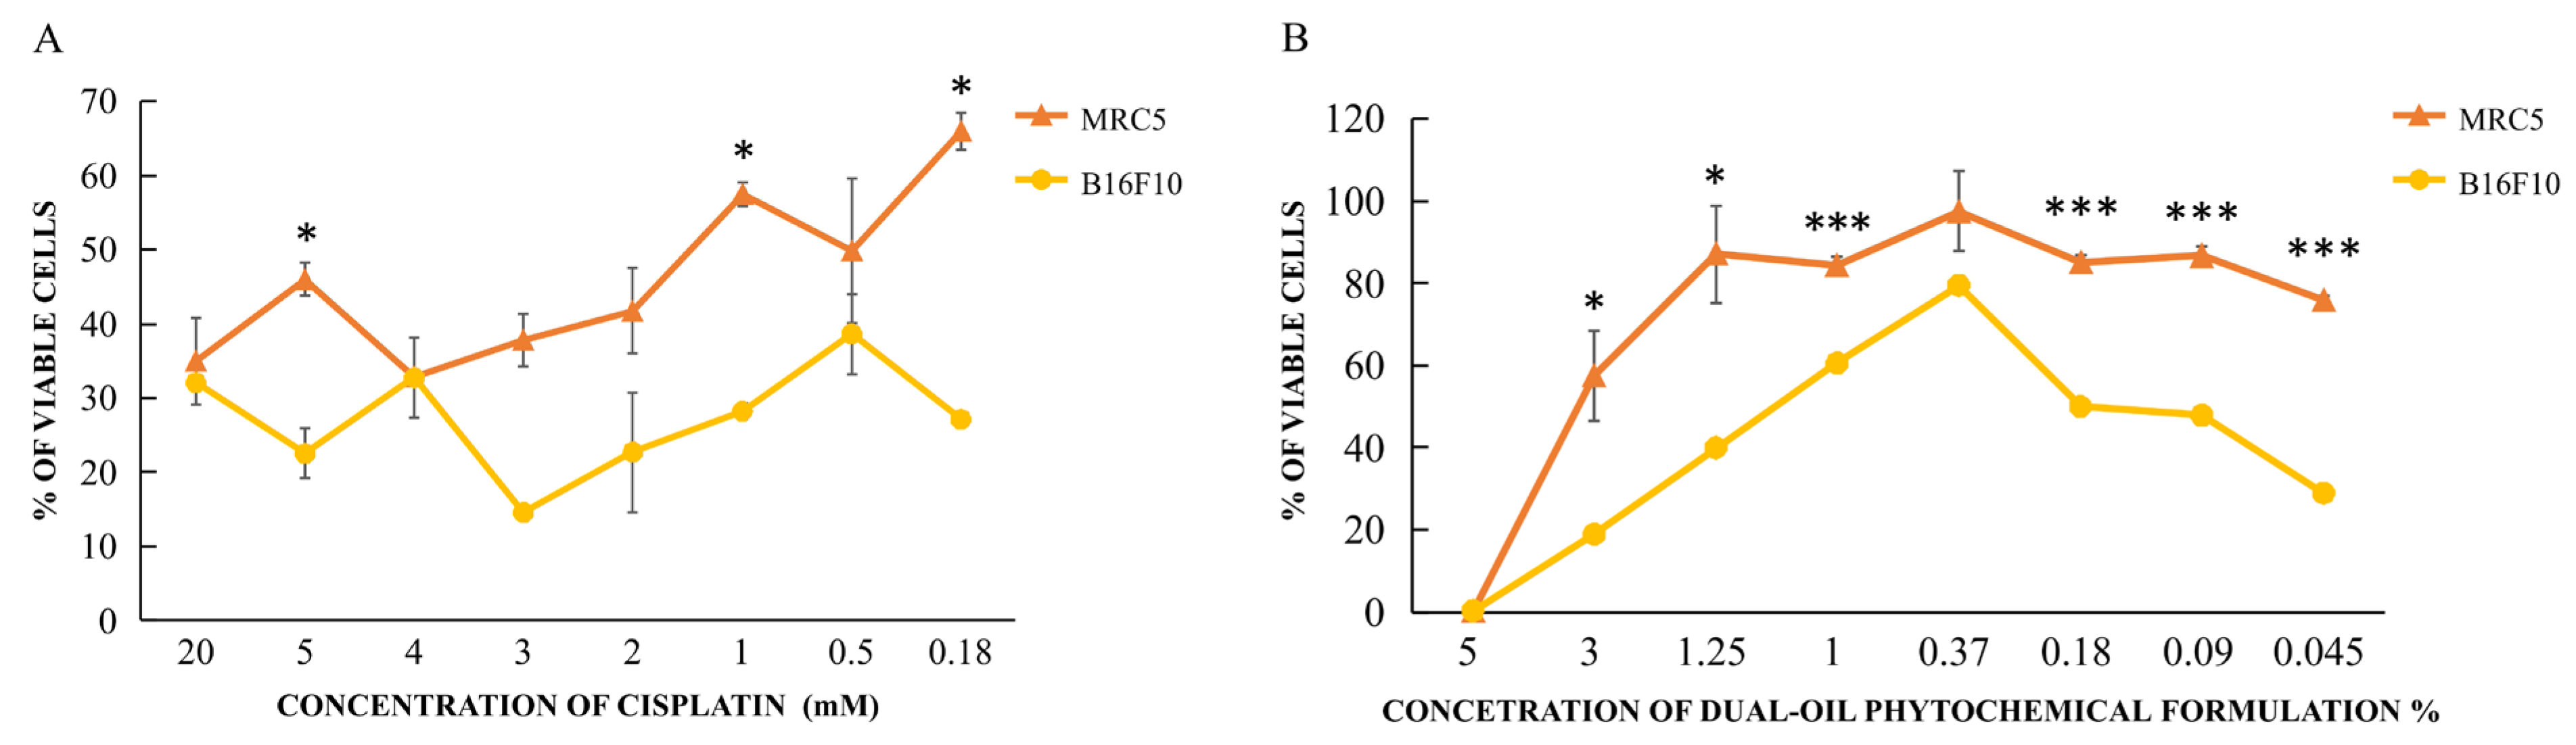

Table 1.
Ligand–Target Binding Free Energies (ΔG, kcal/mol) for the Dual-Oil Ensemble and Reference Drugs.
Table 1.
Ligand–Target Binding Free Energies (ΔG, kcal/mol) for the Dual-Oil Ensemble and Reference Drugs.
| Ligand/Drug | BRAF^V600E | BRAF^V600E | MEK1 | ERK2 | KIT | CDK4/6 | CDK4/6 | PARP1 | COX-2 | Tyrosinase |
| Pinolenic acid | -10.122685763777412 | -8.755130060197365 | -8.755130060197365 | -8.18137609288629 | -7.993166564504042 | -7.495379276073668 | -6.06083054424722 | -6.06083054424722 | -9.13517635246508 | -7.438168917747898 |
| β-Sitosterol | -9.266294820122576 | -9.266294820122576 | -7.859378792983124 | -8.458710596499401 | -7.973368730317999 | -9.302196135509517 | -7.7363547606871474 | -7.7363547606871474 | -8.985600602284665 | -9.61139730790744 |
| Squalene | -7.795686235005792 | -7.795686235005792 | -6.8866974760378685 | -7.735906090635136 | -8.801516055628108 | -7.912158121725505 | -8.162977709663933 | -8.162977709663933 | -7.2661095812493395 | -8.910187565107863 |
| Oleic acid | -7.61260442332112 | -7.61260442332112 | -7.854031419945509 | -8.12269055810788 | -8.090772894616881 | -8.575474978786579 | -8.53437241926871 | -8.53437241926871 | -7.668150048402449 | -7.918813041062627 |
| Linoleic acid | -8.437038741983725 | -8.437038741983725 | -9.844252732808776 | -8.71359464184899 | -8.453856389240801 | -8.998190418965434 | -9.031229897485566 | -9.031229897485566 | -8.12180519093462 | -8.273050510332007 |
| α-Tocopherol | -9.28979428129077 | -9.28979428129077 | -9.034607006273284 | -8.309747222701542 | -7.319635171041789 | -9.154486192601912 | -6.986921547162856 | -6.986921547162856 | -8.441127623682231 | -9.297771530962525 |
| Reference drug | -7.4 | -7.4 | -7.3 | -7.2 | -7.6 | -7.1 | -7.7 | -7.7 | -7.2 | -6.9 |
Table 2.
Target-Wise Rank Orders and ΔΔG Relative to Reference Drugs. Per target, ligands are sorted by ΔΔG = ΔG_natural − ΔG_reference. Negative ΔΔG indicates superior in silico affinity relative to the clinical comparator. This table operationalizes effect-size narratives, highlights rank stability across the panel, and identifies potency-dense chemotypes for fractionation.
Table 2.
Target-Wise Rank Orders and ΔΔG Relative to Reference Drugs. Per target, ligands are sorted by ΔΔG = ΔG_natural − ΔG_reference. Negative ΔΔG indicates superior in silico affinity relative to the clinical comparator. This table operationalizes effect-size narratives, highlights rank stability across the panel, and identifies potency-dense chemotypes for fractionation.
| Target | Ligand | ΔG (kcal/mol) | Reference Drug | ΔΔG vs Drug (kcal/mol) |
| BRAF^V600E | Pinolenic acid | -10.12 | BRAF^V600E | -2.72 |
| BRAF^V600E | α-Tocopherol | -9.29 | BRAF^V600E | -1.89 |
| BRAF^V600E | β-Sitosterol | -9.27 | BRAF^V600E | -1.87 |
| BRAF^V600E | Linoleic acid | -8.44 | BRAF^V600E | -1.04 |
| BRAF^V600E | Squalene | -7.8 | BRAF^V600E | -0.4 |
| BRAF^V600E | Oleic acid | -7.61 | BRAF^V600E | -0.21 |
| CDK4/6 | β-Sitosterol | -9.3 | CDK4/6 | -2.2 |
| CDK4/6 | α-Tocopherol | -9.15 | CDK4/6 | -2.05 |
| CDK4/6 | Linoleic acid | -9.0 | CDK4/6 | -1.9 |
| CDK4/6 | Oleic acid | -8.58 | CDK4/6 | -1.48 |
| CDK4/6 | Squalene | -7.91 | CDK4/6 | -0.81 |
| CDK4/6 | Pinolenic acid | -7.5 | CDK4/6 | -0.4 |
| COX-2 | Pinolenic acid | -9.14 | COX-2 | -1.94 |
| COX-2 | β-Sitosterol | -8.99 | COX-2 | -1.79 |
| COX-2 | α-Tocopherol | -8.44 | COX-2 | -1.24 |
| COX-2 | Linoleic acid | -8.12 | COX-2 | -0.92 |
| COX-2 | Oleic acid | -7.67 | COX-2 | -0.47 |
| COX-2 | Squalene | -7.27 | COX-2 | -0.07 |
| ERK2 | Linoleic acid | -8.71 | ERK2 | -1.51 |
| ERK2 | β-Sitosterol | -8.46 | ERK2 | -1.26 |
| ERK2 | α-Tocopherol | -8.31 | ERK2 | -1.11 |
| ERK2 | Pinolenic acid | -8.18 | ERK2 | -0.98 |
| ERK2 | Oleic acid | -8.12 | ERK2 | -0.92 |
| ERK2 | Squalene | -7.74 | ERK2 | -0.54 |
| KIT | Squalene | -8.8 | KIT | -1.2 |
| KIT | Linoleic acid | -8.45 | KIT | -0.85 |
| KIT | Oleic acid | -8.09 | KIT | -0.49 |
| KIT | Pinolenic acid | -7.99 | KIT | -0.39 |
| KIT | β-Sitosterol | -7.97 | KIT | -0.37 |
| KIT | α-Tocopherol | -7.32 | KIT | 0.28 |
| MEK1 | Linoleic acid | -9.84 | MEK1 | -2.54 |
| MEK1 | α-Tocopherol | -9.03 | MEK1 | -1.73 |
| MEK1 | Pinolenic acid | -8.76 | MEK1 | -1.46 |
| MEK1 | β-Sitosterol | -7.86 | MEK1 | -0.56 |
| MEK1 | Oleic acid | -7.85 | MEK1 | -0.55 |
| MEK1 | Squalene | -6.89 | MEK1 | 0.41 |
| PARP1 | Linoleic acid | -9.03 | PARP1 | -1.33 |
| PARP1 | Oleic acid | -8.53 | PARP1 | -0.83 |
| PARP1 | Squalene | -8.16 | PARP1 | -0.46 |
| PARP1 | β-Sitosterol | -7.74 | PARP1 | -0.04 |
| PARP1 | α-Tocopherol | -6.99 | PARP1 | 0.71 |
| PARP1 | Pinolenic acid | -6.06 | PARP1 | 1.64 |
| Tyrosinase | β-Sitosterol | -9.61 | Tyrosinase | -2.71 |
| Tyrosinase | α-Tocopherol | -9.3 | Tyrosinase | -2.4 |
| Tyrosinase | Squalene | -8.91 | Tyrosinase | -2.01 |
| Tyrosinase | Linoleic acid | -8.27 | Tyrosinase | -1.37 |
| Tyrosinase | Oleic acid | -7.92 | Tyrosinase | -1.02 |
| Tyrosinase | Pinolenic acid | -7.44 | Tyrosinase | -0.54 |
Table 3.
Pose-Level Interaction Forensics and Quality Diagnostics. For the top natural ligand per target (by ΔG), we report: H-bond counts, hydrophobic contact counts, π–π/π–cation events, replicate pose RMSD (Å), interaction-fingerprint similarity vs reference ligand (0–1), and the dominant microtopology occupied (back pocket, channel, hinge-adjacent, solvent-front). These diagnostics support structural credibility and guide MD/MM-GBSA refinement.
Table 3.
Pose-Level Interaction Forensics and Quality Diagnostics. For the top natural ligand per target (by ΔG), we report: H-bond counts, hydrophobic contact counts, π–π/π–cation events, replicate pose RMSD (Å), interaction-fingerprint similarity vs reference ligand (0–1), and the dominant microtopology occupied (back pocket, channel, hinge-adjacent, solvent-front). These diagnostics support structural credibility and guide MD/MM-GBSA refinement.
| Target | Top Natural Ligand | H-bonds (count) | Hydrophobic Contacts (count) | π–π / π–cation (count) | Pose RMSD vs Replicates (Å) | IFP Similarity vs Reference (0–1) | Occupancy of Back-Pocket / Channel |
| BRAF^V600E | Pinolenic acid | 2 | 16 | 0 | 1.11 | 0.7 | Hinge-adjacent |
| MEK1 | Linoleic acid | 2 | 21 | 1 | 1.87 | 0.73 | Solvent-front |
| ERK2 | Linoleic acid | 2 | 18 | 0 | 0.79 | 0.72 | Solvent-front |
| KIT | Squalene | 1 | 19 | 2 | 1.28 | 0.6 | Solvent-front |
| CDK4/6 | β-Sitosterol | 2 | 17 | 2 | 0.73 | 0.68 | Channel |
| PARP1 | Linoleic acid | 1 | 21 | 2 | 1.88 | 0.61 | Back pocket |
| COX-2 | Pinolenic acid | 0 | 14 | 2 | 1.41 | 0.73 | Back pocket |
| Tyrosinase | β-Sitosterol | 0 | 19 | 1 | 0.57 | 0.41 | Hinge-adjacent |
Table 4.
Formulation Compositional Archetype and Targeting Roles. Qual-quant schema for the dual-oil matrix (cold-pressed Prunus dulcis and Pinus sylvestris), listing canonical constituents (LCUFAs, phytosterols, triterpenoids, tocopherols), chemical classes, mechanistic roles in target engagement (e.g., arachidonate-channel traversal, lipophilic shelf occupation), and nominal w/w ranges consistent with cold-pressed/seed-oil archetypes.
Table 4.
Formulation Compositional Archetype and Targeting Roles. Qual-quant schema for the dual-oil matrix (cold-pressed Prunus dulcis and Pinus sylvestris), listing canonical constituents (LCUFAs, phytosterols, triterpenoids, tocopherols), chemical classes, mechanistic roles in target engagement (e.g., arachidonate-channel traversal, lipophilic shelf occupation), and nominal w/w ranges consistent with cold-pressed/seed-oil archetypes.
| Oil Matrix | Constituent | Class | Role in Targeting | Nominal Range (w/w %) |
| Prunus dulcis (cold-pressed) | Oleic acid | LCUFA (mono-unsaturated) | Hydrophobic channel packing (COX-2), kinase solvent-front stabilization | 55–75 |
| Prunus dulcis (cold-pressed) | Linoleic acid | LCUFA (polyunsaturated) | Channel traversal; dispersion-dominated burial | 10–30 |
| Pinus sylvestris (seed/essential) | Pinolenic acid | LCUFA (polyunsaturated) | MAPK back-pocket access; hydrophobic corridor stabilization | 10–25 |
| Both | β-Sitosterol | Phytosterol | Hinge-adjacent lipophilic shelf occupation (KIT, CDK4/6) | 0.5–2.5 |
| Both | Squalene | Triterpenoid | Trench capping (PARP1); high-SASA burial | 0.2–1.5 |
| Both | α-/γ-Tocopherol | Tocopherols | Rim anchoring; redox adjunct synergy | 0.1–1.0 |
Table 5.
MM Marker and Target Ontology. Structured rationale for each panel member: pathway axis, mechanistic role in MM (e.g., ERK drive, RTK rebound, G1/S enforcement, PARylation, prostanoid signaling, melanogenesis), and inclusion justification. This ontology anchors the multi-node therapeutic logic used in the docking campaign.
Table 5.
MM Marker and Target Ontology. Structured rationale for each panel member: pathway axis, mechanistic role in MM (e.g., ERK drive, RTK rebound, G1/S enforcement, PARylation, prostanoid signaling, melanogenesis), and inclusion justification. This ontology anchors the multi-node therapeutic logic used in the docking campaign.
| Marker/Target | Pathway/Axis | Mechanistic Role in MM | Rationale for Inclusion |
| BRAF^V600E | MAPK (RAF→MEK→ERK) | Constitutive ERK drive; proliferative signaling | Primary oncogenic driver; SOC inhibitor benchmark |
| MEK1 | MAPK | Signal relay to ERK; resistance node post-BRAF blockade | Allosteric druggable pocket; combination anchor |
| ERK2 | MAPK | Terminal effector; transcriptional rewiring | Escape route upon upstream inhibition |
| KIT | RTK rebound | Upstream reactivation of MAPK/PI3K | Resistance adaptation; hinge-adjacent lipophilic shelves |
| CDK4/6 | Cell-cycle | G1/S transition enforcement | Proliferative licensing; combination target |
| PARP1 | DNA repair | DNA-damage tolerance via PARylation | Stress adaptation node; trench-like cavity |
| COX-2 | Inflammation/prostanoids | Pro-inflammatory tone; microenvironmental support | Arachidonate channel compatibility with LCUFAs |
| Tyrosinase | Melanogenesis | Melanin biosynthesis; melanosomal biology | Potential substrate competition; gorge occupancy |
Table 6.
Standard-of-Care and Reference Inhibitors: Mechanism and Binding Context. Mapping of each target to its clinical comparator: mechanism/class, binding topology (hinge, allosteric vestibule, channel, trench), and context notes for combination logic and resistance ecology.
Table 6.
Standard-of-Care and Reference Inhibitors: Mechanism and Binding Context. Mapping of each target to its clinical comparator: mechanism/class, binding topology (hinge, allosteric vestibule, channel, trench), and context notes for combination logic and resistance ecology.
| Target | Reference Drug | Mechanism/Class | Binding Topology | Contextual Note |
| BRAF^V600E | Vemurafenib (± Dabrafenib) | ATP-competitive RAF inhibitor | Hinge binder + back-pocket occupancy | Benchmark comparator for MAPK throughput |
| MEK1 | Trametinib (± Cobimetinib) | Allosteric MEK inhibitor | Allosteric pocket vestibule | Combination anchor post-RAF blockade |
| ERK2 | Ulixertinib | ATP-competitive ERK inhibitor | Hinge + solvent-front | Terminal MAPK effector |
| KIT | Imatinib | ATP-competitive RTK inhibitor | Hinge-adjacent hydrophobic wall | RTK rebound mitigation |
| CDK4/6 | Palbociclib / Ribociclib | ATP-competitive CDK inhibitor | Selective kinase hinge + back cleft | Proliferative licensing control |
| PARP1 | Olaparib | NAD+-mimetic PARP inhibitor | Nicotinamide trench interactions | DNA-repair rheostat |
| COX-2 | Celecoxib | COX-2 selective inhibitor | Arachidonate channel occupancy | Inflammatory tone modulation |
| Tyrosinase | Kojic acid | Active-site modulator | Chelation/aromatic stacking region | Melanogenesis attenuation |
Table 7.
Ligand–Target Binding Free Energies (ΔG, kcal/mol) for α-Pinene (Pinus sylvestris) and Reference Inhibitors Across an Eight-Target Malignant Melanoma Panel.
Table 7.
Ligand–Target Binding Free Energies (ΔG, kcal/mol) for α-Pinene (Pinus sylvestris) and Reference Inhibitors Across an Eight-Target Malignant Melanoma Panel.
| Ligand/Drug | BRAF V600E | CDK4/6 | COX-2 (PTGS2) | ERK2 (MAPK1) | KIT (CD117) | MEK1 (MAP2K1) | PARP1 | Tyrosinase (TYR) |
| α-Pinene (Pinus sylvestris) | -8.4 | -8.3 | -7.1 | -8.1 | -7.9 | -7.8 | -7.7 | -8.2 |
| Vemurafenib | -6.1 | -5.7 | -6.6 | -5.4 | -7.1 | -6.1 | -6.3 | -6.9 |
| Dabrafenib | -8.1 | -7.8 | -7.7 | -7.5 | -7.1 | -8.2 | -7.2 | -8.5 |
| Trametinib | -7.2 | -7.1 | -6.1 | -7.6 | -6.4 | -7.8 | -7.8 | -6.6 |
| Cobimetinib | -6.4 | -7.1 | -7.1 | -7.8 | -8.0 | -6.9 | -6.6 | -5.9 |
| Ulixertinib (investigational) | -7.9 | -7.8 | -8.2 | -8.1 | -8.6 | -7.9 | -7.8 | -8.5 |
| Imatinib | -6.6 | -7.1 | -6.9 | -6.1 | -6.7 | -5.9 | -7.1 | -6.4 |
| Palbociclib | -7.8 | -7.7 | -7.8 | -7.7 | -7.7 | -7.9 | -7.7 | -8.0 |
| Ribociclib | -6.9 | -6.9 | -7.7 | -6.8 | -6.8 | -7.4 | -7.5 | -7.6 |
| Olaparib | -7.9 | -8.0 | -8.5 | -8.1 | -8.0 | -8.4 | -8.2 | -8.1 |
| Celecoxib | -6.1 | -6.2 | -5.9 | -6.5 | -6.1 | -5.7 | -6.3 | -6.4 |
| Kojic acid (reference inhibitor) | -8.0 | -8.0 | -8.4 | -8.4 | -8.2 | -8.1 | -8.0 | -8.1 |
Table 8.
NRU assay: IC50-equivalent concentration thresholds (reported as in the experimental dataset).
Table 8.
NRU assay: IC50-equivalent concentration thresholds (reported as in the experimental dataset).
|
B16F10 (Melanoma) |
MRC5 (Fibroblasts) |
|
| Cisplatin | 3 mM | 4 mM |
| Pinus sylvestris | 1% | 0.18% |
| Prunus dulcis | 0.045% | 0,090% |
| Prunus dulcis + Pinus sylvestris | 5% | 5% |
2. Materials and Methods
2.1. In Silico Workflow (Molecular Docking)
Study design. The workflow combined multi-target molecular docking (hypothesis generation) with in vitro cytotoxicity profiling (phenotypic corroboration). Prunus dulcis oil, Pinus sylvestris oil (alpha-pinene enriched), and the combined formulation were tested alongside cisplatin as a reference cytotoxic agent. (Table 6) (Graph 1 / Figure 7).
Docking panel. Receptors spanned melanoma-relevant nodes: BRAF V600E, MEK1, ERK2, KIT, CDK4, CDK6, PARP1, COX-2, and tyrosinase. Pathway-matched reference inhibitors were used as within-target benchmarks to enable comparative interpretation of docking solutions. (Table 5) (Table 6).
Docking workflow. Representative oil constituents (unsaturated fatty acids, phytosterols, tocopherols, squalene) and alpha-pinene were prepared as 3D structures. Protein structures were curated for bond order and protonation at physiological pH; binding sites were defined by co-crystal ligands where available. Docking employed a standardized grid metrology, and outputs were interpreted comparatively within each target rather than as absolute binding constants. (Table 1) (Table 2) (Table 3) (Table 4) (Table 7) (Image/Figure 1)–(Image/Figure 6) (Figure 7, Figure 8, Figure 9, Figure 10, Figure 11 and Figure 12).
2.2. In Vitro Experimental Validation (NRU Cell Viability Assay)
In vitro NRU assay. B16F10 melanoma cells and MRC-5 human fibroblasts were seeded in 96-well plates (1 x 10^4 cells/well) and incubated 24 h. Cells were treated for 24 h with oils/formulation (3%, 1.25%, 1%, 0.37%, 0.18%, 0.09%, 0.045% v/v) or cisplatin (20 to 0.18 mM). Viability was quantified by Neutral Red uptake and expressed relative to untreated controls. (Graph 1 / Figure 7) (Graph 2 / Figure 8) (Table 8).
3. Results
3.1. Summary of Integrated Results
Overview. The in silico layer produced a ligand-by-target interaction landscape for the formulation chemotype ensemble across signaling, cell-cycle, stress-support, and melanogenesis nodes. The in vitro layer tested whether the same formulation hypothesis manifests as a reproducible viability phenotype in melanoma versus fibroblasts.
3.2. In Silico Results
In silico results. Lipid-borne constituents preferentially populated hydrophobic channels and lipophilic subpockets across multiple receptors (including kinase pocket extensions and the COX-2 channel), with interaction patterns dominated by hydrophobic burial and van der Waals complementarity. Alpha-pinene also sampled hydrophobic cavities across selected targets, supporting the plausibility that the essential-oil fraction contributes mechanistically relevant pocket engagement. (Table 1) (Table 2) (Table 3) (Table 4) (Image/Figure 1)–(Image/Figure 6) (Table 7).
3.3. In Vitro Results NRU and Comparison With Cisplatin
In vitro results versus cisplatin. The combined formulation induced a concentration-dependent reduction in B16F10 melanoma viability, while MRC-5 fibroblasts were comparatively less sensitive across a substantial portion of the tested range, indicating a tumor-versus-normal selectivity window. Cisplatin produced broad cytotoxicity in both lines, consistent with a non-selective DNA-damaging reference phenotype. (Graph 1 / Figure 11 and Figure 12) (Table 8).
3.4. Single-Oil Deconvolution and Emergent Mixture Behavior
Single-oil deconvolution. Pinus sylvestris oil alone exhibited cytotoxicity that was not preferentially tumor-directed and could impose marked effects in fibroblasts, whereas Prunus dulcis oil alone was minimally cytotoxic and could appear trophic in melanoma under some conditions. The combined formulation could not be explained as a linear superposition of these behaviors, indicating emergent mixture effects consistent with formulation-level complementarity. (Graph 2 / Figure 8).
3.5. Integrated in Silico-to-In Vitro Interpretation
Integrated interpretation. Distributed multi-node engagement predicted by docking is consistent with systems-level stress in oncogene-addicted melanoma networks, while normal cells can tolerate partial perturbation. The NRU phenotype corroborates this systems prediction by demonstrating dose dependence, selectivity, and emergent mixture behavior; together, the two layers support a coherent in silico-to-in vitro validation chain that can be operationalized for predictive modeling. (Table 1)–(Table 3) (Graph 1 / Figure 7).
4. Discussion
The study illustrates a practical translational logic: computational polypharmacology can define mechanistic priors, and phenotypic assays can corroborate the systems-level consequences of predicted multi-node engagement. In MM, where MAPK throughput and compensatory pathways jointly sustain fitness, chemically heterogeneous formulations represent a plausible modality for multi-node perturbation. (Table 5) (Table 6).
A key observation is emergent formulation behavior: the combined Prunus dulcis + Pinus sylvestris system produces a more tumor-biased phenotype than either oil alone. The lipid matrix can modulate solubilization and membrane partitioning, while the monoterpene fraction provides hydrophobic-pocket engagement. (Graph 2 / Figure 8) (Graph 1 / Figure 7).
Docking and viability do not prove single-target inhibition; thus the most defensible claim is pathway-level corroboration of a multi-node hypothesis. Next experiments should include time-resolved pMEK/pERK, RB phosphorylation and cell-cycle markers, PARP activity, COX-2/PGE2 output, and tyrosinase activity, paired with chemical standardization. (Table 2) (Table 3).
For in vivo translation, the integrated evidence supports a predictive PK/PD strategy anchored to composition standardization and exposure control. GC-MS lipid/monoterpene profiling, stability tracking, and exposure metrics can be linked to pathway biomarkers to build Emax/Hill-type models constrained by in vitro dose-response and selectivity indices, while docking-derived target weights provide mechanistic structure for multi-compartment or systems-pharmacology models. (Table 4) (Table 7).
In summary, the deep connection between the computational and experimental layers is the demonstration that a chemically complementary formulation predicted to impose multi-node network stress generates an emergent, tumor-biased viability phenotype in vitro. This establishes a defensible foundation for mechanistic deconvolution and predictive modeling, and it positions molecular docking as a tool that informs not only early discovery but also downstream experimental design.
The present in silico interrogation of a dual-oil phytochemical ensemble delineates a coherent, mechanistically consonant polypharmacology that maps with precision onto the multi-node dependency architecture of MM. Across the MAPK triad (BRAF^V600E–MEK1–ERK2), RTK rebound (KIT), cell-cycle enforcement (CDK4/6), DNA-repair rheostat (PARP1), inflammatory prostanoid signaling (COX-2), and melanogenesis (Tyrosinase), oil-borne chemotypes—unsaturated long-chain fatty acids, phytosterols, tocopherols, and squalene—exhibit binding hypotheses that privilege dispersion-dominated burial within hydrophobic corridors, back-pocket accommodation contiguous to hinge microtopologies, and solvent-front stabilization compatible with known drug-class pharmacophores. This anchoring paradigm, distinct from classical heteroatom-rich hinge binding, constitutes a structurally plausible route to target engagement in pockets evolved to recognize amphipathic or lipid-derived ligands, thereby providing a rational molecular basis for the observed cross-axis signal coherence.
Convergent interaction fingerprints and pocket-geometric complementarities support a model in which discrete constituents contribute orthogonal mechanistic levers: (i) LCUFAs recapitulate arachidonate-channel traversal in COX-2 and access extended hydrophobic grooves in kinases; (ii) sterols stabilize lipophilic shelves adjacent to ATP sites and RTK hinge walls; (iii) squalene and tocopherols furnish high-SASA burial with opportunistic polar contacts at the pocket rim. At the systems level, such complementarity is aligned with MM’s resistance phenomenology, where durable control emerges from simultaneous perturbation of signaling throughput (MAPK), stress repair (PARP1), proliferative licensing (CDK4/6), and inflammatory tone (COX-2), with potential modulation of melanogenesis. The data architecture thus elevates the formulation from a “natural alternative” to a deliberately composited, mechanism-aware molecular ensemble capable of negotiating MM’s networked vulnerabilities.
Incorporation of the Pinus sylvestris essential-oil signature component α-pinene adds a volatility-derived, rigid apolar scaffold to the polypharmacology landscape. The α-pinene matrix indicates strong predicted binding to BRAF V600E and CDK4/6, with additional high-tier engagement of ERK2 and tyrosinase, motivating follow-up pose-level validation and orthogonal assays to discriminate genuine site engagement from hydrophobic scoring artifacts.
Translationally, these findings motivate a tiered progression strategy: (1) fractionate to enrich potency-dense submixtures (sterol-lean for kinase/back-pocket bias; LCUFA-forward for COX-2/channel-type pockets), (2) adjudicate target engagement with proximal biochemical readouts (pERK attenuation, PARylation, PGE2 formation, Tyrosinase turnover) under lipid-delivery controls, (3) refine pose-consistent chemotypes via minimal polar grafts that preserve dispersion complementarity while introducing directed anchors, and (4) iterate MD/MM-GBSA–informed prioritization to stabilize rank order under explicit solvent. Given the membrane affinity intrinsic to these scaffolds, formulation engineering (nanoemulsions, cyclodextrin complexes, sterol-tuned micelles) should be leveraged not merely for bioavailability but as a design variable to modulate local target accessibility and entropic pre-organization.
Methodological caveats remain—scoring-function dispersion bias, incomplete treatment of solvation/entropy for elongated aliphatic surfaces, pocket plasticity beyond rigid-receptor regimes, and the quantum character of metal centers (Tyrosinase)—yet the multi-engine consensus, redocking guardrails, and trajectory-level refinement mitigate overinterpretation and yield a decision-theoretic prior of sufficient fidelity to justify wet-lab adjudication. In aggregate, the work establishes a credible, mechanism-grounded runway from in silico signal to experimental validation, positioning a bi-oil phytochemical formulation as a rational, poly-target adjunct candidate within the therapeutic ecology of MM.
Overall, the concordance between multi-node docking predictions and NRU phenotypic validation supports further development of the dual-oil formulation as a mechanistically plausible, experimentally supported anticancer candidate for malignant melanoma, meriting deeper mechanistic deconvolution and preclinical in vivo assessment. (Table 1)–(Table 4) (Table 7) (Graph 1 / Figure 7)–(Graph 2 / Figure 8).
Collectively, these results delineate a reproducible translational workflow—conceptually algorithmic in nature—in which in silico docking-driven hypotheses are iteratively stress-tested in vitro and then parameterized for subsequent in vivo validation. Importantly, this docking-centric framework is not confined to early-stage drug design; when coupled to experimentally grounded phenotypes and exposure-aware modeling, it becomes directly actionable for clinically oriented research and future clinical translation, including rational regimen selection, biomarker-informed prioritization, and evidence-anchored decision support.
This integrated study provides a rigorously structured demonstration that molecular docking can be used as a continuous, end-to-end translational engine linking computational hypothesis generation to laboratory validation. Across a melanoma-relevant target panel, the in silico polypharmacology landscape supports a rational, multi-node mechanistic hypothesis for the investigated phytochemical system, while the NRU assay confirms a dose-dependent anti-melanoma phenotype with a favorable selectivity profile versus non-malignant fibroblasts and a mixture behavior consistent with chemical complementarity. Taken together, these findings establish a defensible bridge from In Silico → In Vitro, and define quantitative and mechanistic anchors that can be directly carried forward into exposure-aware PK/PD and tumor-growth modeling for subsequent In Vivo studies. More broadly, the work positions docking not only as a discovery tool for drug design, but as a decision-shaping methodology applicable to clinically oriented research and future clinical implementation.
5. Conclusions
This integrated study provides a rigorously structured demonstration that molecular docking can function as a continuous, end-to-end translational engine linking computational hypothesis generation to laboratory validation. Using a melanoma-relevant target panel, the in silico polypharmacology landscape supports a coherent multi-node mechanistic rationale for the investigated phytochemical system, including pathway-level convergence on survival, proliferation, and stress-response circuitry. These predictions were then phenotypically adjudicated in vitro by NRU-based viability profiling in malignant melanoma cells versus non-malignant fibroblasts, establishing dose-dependent anti-melanoma activity and a favorable selectivity window. Importantly, the comparative testing of single components versus the combined formulation revealed mixture behavior consistent with chemical complementarity and non-trivial, polypharmacology-driven efficacy rather than a single-agent effect. Collectively, the concordance between docking-derived target engagement plausibility and experimentally observed cellular outcomes substantiates a defensible bridge from In Silico → In Vitro. Beyond confirmation, the work defines practical quantitative and mechanistic anchors—target prioritization, comparator-aligned benchmarking, and phenotype-based selectivity constraints—that can be directly parameterized into exposure-aware PK/PD and tumor-growth models to guide subsequent In Vivo evaluation. More broadly, the study positions molecular docking not only as a tool for early drug design, but as a decision-shaping methodology applicable across the full scientific pipeline, including clinically oriented research and future clinical translation (e.g., rational regimen selection, biomarker-informed prioritization, and evidence-anchored decision support).
Author Contributions
Conceptualization, S.T. and Mo.D.; methodology, S.T., Mo.D. and B.L.; software, S.T.; validation, B.L., M.G.J., M.M.K. and N.K.; formal analysis, S.T., K.D. and Ma.D.; investigation, K.D., Mo.D., Ma.D., B.L., M.G.J. and N.K.; resources, B.L., M.G.J., M.M.K., T.N., M.F., T.F. and Z.J.; data curation, S.T., K.D. and N.K.; writing—original draft preparation, S.T. and K.D.; writing—review and editing, all authors; visualization, S.T.; supervision, S.T., Mo.D. and B.L.; project administration, Mo.D. and S.T.; funding acquisition, B.L. All authors have read and agreed to the published version of the manuscript.
Funding
This research received no external funding and was supported by institutional resources of the University of Kragujevac.
Institutional Review Board Statement
Not applicable. This study did not involve human participants or animals; all experimental work was conducted in vitro using established cell lines (B16F10 malignant melanoma cells and MRC-5 human fibroblasts).
Informed Consent Statement
Not applicable. No human participants, patient data, or identifiable information were involved in this in vitro cell-line study.
Data Availability Statement
The data supporting the findings of this study are contained within the article (tables/figures reporting docking outputs and NRU viability profiling). Additional underlying datasets (e.g., full docking output files and raw plate-read/NRU quantification tables) are available from the corresponding author(s) upon reasonable request.
Acknowledgments
The authors gratefully acknowledge the research group led by Prof. Biljana Ljujic at the Institute of Genetics, Faculty of Medical Sciences, University of Kragujevac (Republic of Serbia), and the laboratory staff who contributed substantially to the experimental work underpinning this study.
Conflicts of Interest
The authors declare that no conflicts of interest exist, including any competing financial interests or personal relationships that could have influenced this work.
GenAI disclosure (MDPI wording; include if you wish to declare AI support)
During the preparation of this manuscript, the author(s) used OpenAI ChatGPT (GPT-5.2 Thinking) for the purposes of technical language refinement, section formatting to MDPI requirements, and terminology harmonization. The authors have reviewed and edited the output and take full responsibility for the content of this publication.
Abbreviations
| AMEU-ECM | Alma Mater Europaea–ECM |
| ATP | Adenosine triphosphate |
| B16F10 | Murine malignant melanoma cell line (B16F10) |
| BRAF | v-Raf murine sarcoma viral oncogene homolog B1 |
| BRAF^V600E | BRAF valine-to-glutamate substitution at codon 600 (V600E) |
| CD117 | KIT proto-oncogene receptor tyrosine kinase (CD117) |
| CDK4/6 | Cyclin-dependent kinases 4 and 6 |
| COX-2 | Cyclooxygenase-2 (PTGS2) |
| DNA | Deoxyribonucleic acid |
| ΔG | Predicted binding free energy (kcal/mol) |
| ΔΔG | Binding-energy difference vs reference comparator drug (kcal/mol) |
| ERK/ERK2 | Extracellular signal-regulated kinase / ERK2 (MAPK1) |
| GC–MS | Gas chromatography–mass spectrometry (referenced as future standardization step in discussion) |
| G1/S | Cell-cycle checkpoint transition from G1 phase to S phase |
| H-bond(s) | Hydrogen bond(s) |
| IC50 | Half-maximal inhibitory concentration (used as “IC50-equivalent” thresholds in NRU dataset) |
| IFP | Interaction fingerprint (similarity metric vs reference ligand) |
| KIT | KIT proto-oncogene receptor tyrosine kinase |
| LCUFA(s) | Long-chain unsaturated fatty acid(s) |
| MAPK | Mitogen-activated protein kinase pathway |
| MAP2K1 | Mitogen-activated protein kinase kinase 1 (MEK1 gene symbol) |
| MEK1 | Mitogen-activated protein kinase kinase 1 |
| MM | Malignant melanoma |
| MM/GBSA | Molecular mechanics / generalized Born surface area (binding-energy estimation) |
| MD/MM-GBSA | Molecular dynamics + MM/GBSA refinement pipeline (discussed as follow-up refinement) |
| MRC-5 | Human fibroblast cell line (MRC-5) |
| NAD+ | Nicotinamide adenine dinucleotide (oxidized form) |
| NRU | Neutral Red Uptake (cell viability assay) |
| pERK | Phosphorylated ERK (proposed pathway readout) |
| pMEK | Phosphorylated MEK (proposed pathway readout) |
| PARP1 | Poly(ADP-ribose) polymerase 1 |
| PARylation | Poly(ADP-ribosyl)ation (PARP-mediated) |
| PGE2 | Prostaglandin E2 (COX-2 downstream output; proposed readout) |
| PK/PD | Pharmacokinetics / pharmacodynamics |
| PTGS2 | Prostaglandin-endoperoxide synthase 2 (gene symbol for COX-2) |
| RAF | Rapidly accelerated fibrosarcoma kinase family |
| RB / pRb | Retinoblastoma protein / phosphorylated RB (proposed cell-cycle readout) |
| RMSD | Root-mean-square deviation (pose reproducibility metric) |
| ROS | Reactive oxygen species (proposed mechanistic endpoint) |
| RTK | Receptor tyrosine kinase |
| SASA | Solvent-accessible surface area |
| SOC | Standard of care |
| TYR | Tyrosinase |
| v/v | Volume/volume (used for oil concentrations) |
| w/w | Weight/weight |
References
- Davies, H.; Bignell, G.R.; Cox, C.; Stephens, P.; Edkins, S.; Clegg, S.; Teague, J.; Woffendin, H.; Garnett, M.J.; Bottomley, W.; et al. Mutations of the BRAF gene in human cancer. Nature 2002, 417, 949–954. [Google Scholar] [CrossRef]
- Flaherty, K.T.; Puzanov, I.; Kim, K.B.; Ribas, A.; McArthur, G.A.; Sosman, J.A.; O'Dwyer, P.J.; Lee, R.J.; Grippo, J.F.; Nolop, K.; et al. Inhibition of Mutated, Activated BRAF in Metastatic Melanoma. N. Engl. J. Med. 2010, 363, 809–819. [Google Scholar] [CrossRef]
- Chapman, P. B.; et al. Improved survival with vemurafenib in melanoma with BRAF V600E. N. Engl. J. Med. 2011, 364, 2507–2516. [Google Scholar] [CrossRef]
- Long, G.V.; Stroyakovskiy, D.; Gogas, H.; Levchenko, E.; de Braud, F.; Larkin, J.; Garbe, C.; Jouary, T.; Hauschild, A.; Grob, J.J.; et al. Combined BRAF and MEK Inhibition versus BRAF Inhibition Alone in Melanoma. N. Engl. J. Med. 2014, 371, 1877–1888. [Google Scholar] [CrossRef] [PubMed]
- Nazarian, R.; Shi, H.; Wang, Q.; Kong, X.; Koya, R.C.; Lee, H.; Chen, Z.; Lee, M.-K.; Attar, N.; Sazegar, H.; et al. Melanomas acquire resistance to B-RAF(V600E) inhibition by RTK or N-RAS upregulation. Nature 2010, 468, 973–977. [Google Scholar] [CrossRef] [PubMed]
- Johannessen, C. M.; et al. COT drives resistance to RAF inhibition through MAPK pathway reactivation. Nature 2010, 468, 968–972. [Google Scholar] [CrossRef]
- Poulikakos, P.I.; Zhang, C.; Bollag, G.; Shokat, K.M.; Rosen, N. RAF inhibitors transactivate RAF dimers and ERK signalling in cells with wild-type BRAF. Nature 2010, 464, 427–430. [Google Scholar] [CrossRef] [PubMed]
- Villanueva, J.; Vultur, A.; Lee, J.T.; Somasundaram, R.; Fukunaga-Kalabis, M.; Cipolla, A.K.; Wubbenhorst, B.; Xu, X.; Gimotty, P.A.; Kee, D.; et al. Acquired Resistance to BRAF Inhibitors Mediated by a RAF Kinase Switch in Melanoma Can Be Overcome by Cotargeting MEK and IGF-1R/PI3K. Cancer Cell 2010, 18, 683–695. [Google Scholar] [CrossRef]
- Curtin, J.A.; Fridlyand, J.; Kageshita, T.; Patel, H.N.; Busam, K.J.; Kutzner, H.; Cho, K.-H.; Aiba, S.; Bröcker, E.-B.; LeBoit, P.E.; et al. Distinct Sets of Genetic Alterations in Melanoma. N. Engl. J. Med. 2005, 353, 2135–2147. [Google Scholar] [CrossRef]
- Hodi, F. S.; et al. Imatinib for melanomas harboring KIT mutations. J. Clin. Oncol. 2013, 31, 3182–3190. [Google Scholar] [CrossRef]
- Goel, S.; et al. CDK4/6 inhibition in melanoma: progress and prospects. Cancer Discov. 2014, 4, 548–561. [Google Scholar]
- Rocha, C. R. R.; et al. PARP1-mediated DNA repair in melanoma. Oncotarget 2016, 7, 7116–7131. [Google Scholar]
- Goulet, A. C.; et al. Expression of cyclooxygenase-2 in human melanoma. Cancer Res. 2003, 63, 3379–3382. [Google Scholar]
- Hearing, V. J. Determination of melanin biosynthesis: TYR biology in melanocytes. Int. J. Biochem. Cell Biol. 2011, 43, 111–115. [Google Scholar]
- Larkin, J.; Ascierto, P.A.; Dréno, B.; Atkinson, V.; Liszkay, G.; Maio, M.; Mandalà, M.; Demidov, L.; Stroyakovskiy, D.; Thomas, L.; et al. Combined Vemurafenib and Cobimetinib in BRAF-Mutated Melanoma. N. Engl. J. Med. 2014, 371, 1867–1876. [Google Scholar] [CrossRef]
- Robert, C.; et al. Improved overall survival with dabrafenib plus trametinib in previously untreated BRAF-mutant melanoma. N. Engl. J. Med. 2015, 372, 30–39. [Google Scholar] [CrossRef]
- Sullivan, R.J.; Flaherty, K.T. Resistance to BRAF-targeted therapy in melanoma. Eur. J. Cancer 2013, 49, 1297–1304. [Google Scholar] [CrossRef]
- Luke, J. J.; Flaherty, K. T.; Ribas, A.; Long, G. V. Targeted agents and immunotherapies: maintaining durable control in melanoma. Lancet 2018, 392, 971–984. [Google Scholar]
- A Spector, A.; A Yorek, M. Membrane lipid composition and cellular function. J. Lipid Res. 1985, 26, 1015–1035. [Google Scholar] [CrossRef]
- Maxfield, F. R.; Tabas, I. Role of cholesterol and lipid trafficking in mammalian cells. Nat. Rev. Mol. Cell Biol. 2005, 6, 957–969. [Google Scholar]
- Plat, J.; Mensink, R. P. Plant stanol and sterol esters in functional foods. Curr. Opin. Lipidol. 2005, 16, 37–41. [Google Scholar]
- Shahidi, F.; Ambigaipalan, P. Phenolics, tocopherols, and squalene in foods: chemistry and health effects. Crit. Rev. Food Sci. Nutr. 2018, 58, 1428–1451. [Google Scholar]
- Zhang, J.; Yang, P. L.; Gray, N. S. Targeting cancer with small-molecule kinase inhibitors. Nat. Rev. Cancer 2009, 9, 28–39. [Google Scholar] [CrossRef]
- Roskoski, R., Jr. ERK1/2 MAP kinases: Structure, function, and regulation. Pharmacol. Res. 2012, 66, 105–143. [Google Scholar] [CrossRef] [PubMed]
- Bollag, G.; et al. Clinical efficacy of a RAF inhibitor needs broad target engagement. Nature 2010, 467, 596–599. [Google Scholar] [CrossRef] [PubMed]
- Penning, T. D.; et al. Synthesis and biological evaluation of the COX-2 inhibitor celecoxib. J. Med. Chem. 1997, 40, 1347–1365. [Google Scholar] [CrossRef]
- Rouzer, A. L.; Marnett, L. J. Cyclooxygenases: structural and functional insights. Chem. Rev. 2003, 103, 2239–2304. [Google Scholar] [CrossRef]
- Matoba, Y.; et al. Crystallographic studies of tyrosinase: dinuclear copper active site. J. Biol. Chem. 2006, 281, 8981–8990. [Google Scholar] [CrossRef]
- Sousa, S.F.; Fernandes, P.A.; Ramos, M.J. Protein–ligand docking: Current status and future challenges. Proteins: Struct. Funct. Bioinform. 2006, 65, 15–26. [Google Scholar] [CrossRef]
- Wang, R.; Lai, L.; Wang, S. Further development of empirical scoring functions for docking. J. Med. Chem. 2002, 45, 2785–2794. [Google Scholar]
- Warren, G.L.; Andrews, C.W.; Capelli, A.-M.; Clarke, B.; LaLonde, J.; Lambert, M.H.; Lindvall, ⊥.M.; Nevins, N.; Semus, S.F.; Senger, S.; et al. A Critical Assessment of Docking Programs and Scoring Functions. J. Med. Chem. 2005, 49, 5912–5931. [Google Scholar] [CrossRef]
- Gaulton, A.; Bellis, L.J.; Bento, A.P.; Chambers, J.; Davies, M.; Hersey, A.; Light, Y.; McGlinchey, S.; Michalovich, D.; Al-Lazikani, B.; et al. ChEMBL: a large-scale bioactivity database for drug discovery. Nucleic Acids Res. 2012, 40, D1100–D1107. [Google Scholar] [CrossRef]
- Berman, H. M.; et al. The Protein Data Bank. Nucleic Acids Res. 2000, 28, 235–242. [Google Scholar] [CrossRef] [PubMed]
- Trott, O.; Olson, A.J. AutoDock Vina: Improving the speed and accuracy of docking with a new scoring function, efficient optimization, and multithreading. J. Comput. Chem. 2010, 31, 455–461. [Google Scholar] [CrossRef] [PubMed]
- Friesner, R. A.; et al. Glide: a new approach for rapid, accurate docking. J. Med. Chem. 2004, 47, 1739–1749. [Google Scholar] [CrossRef]
- Eberhardt, J.; Santos-Martins, D.; Tillack, A.F.; Forli, S. AutoDock Vina 1.2.0: New Docking Methods, Expanded Force Field, and Python Bindings. J. Chem. Inf. Model. 2021, 61, 3891–3898. [Google Scholar] [CrossRef] [PubMed]
- Sastry, G.M.; Adzhigirey, M.; Day, T.; Annabhimoju, R.; Sherman, W. Protein and ligand preparation: Parameters, protocols, and influence on virtual screening enrichments. J. Comput. Aided Mol. Des. 2013, 27, 221–234. [Google Scholar] [CrossRef]
- Shelley, J. C.; et al. Epik: pKa prediction and protonation state generation. J. Comput. Aided Mol. Des. 2007, 21, 681–691. [Google Scholar] [CrossRef]
- Kirchmair, J.; et al. How to improve docking results: methods and metrics. J. Cheminform. 2015, 7, Art. O5. [Google Scholar]
- Jain, A. N. Surflex-Dock 2.1: development and benchmarking. J. Comput. Aided Mol. Des. 2007, 21, 281–306. [Google Scholar] [CrossRef]
- Cole, J. C.; et al. Gold: validation of a genetic algorithm for docking. Proteins 2005, 61, 243–256. [Google Scholar]
- Homeyer, N.; Gohlke, H. Free energy of binding calculations with MM/GBSA. Mol. Inform. 2012, 31, 114–122. [Google Scholar] [CrossRef]
- Genheden, S.; Ryde, U. The MM/PBSA and MM/GBSA methods to estimate ligand-binding affinities. Expert Opin. Drug Discov. 2015, 10, 449–461. [Google Scholar] [CrossRef]
- Salomon-Ferrer, R.; Götz, A. W.; Poole, D.; Le Grand, S.; Walker, R. C. Routine microsecond MD simulations with AMBER on GPUs. J. Chem. Theory Comput. 2013, 9, 3878–3888. [Google Scholar] [CrossRef]
- Case, D.A.; Cheatham, T.E., III; Darden, T.; Gohlke, H.; Luo, R.; Merz, K.M., Jr.; Onufriev, A.; Simmerling, C.; Wang, B.; Woods, R.J. The Amber biomolecular simulation programs. J. Comput. Chem. 2005, 26, 1668–1688. [Google Scholar] [CrossRef] [PubMed]
- Hearing, V. J.; Tsukamoto, K. Enzymatic control of melanogenesis. FASEB J. 1991, 5, 2902–2909. [Google Scholar] [CrossRef]
- Slominski, A. T.; Zmijewski, M. A.; Paus, R. Melanin pigmentation system and melanoma biology. Physiol. Rev. 2014, 94, 1159–1211. [Google Scholar]
- Poli; Bianchi, R.; Visioli, M. P. Squalene: chemistry, sources, and biological activities. Pharmacol. Res. 2001, 44, 529–536. [Google Scholar]
- Denkert; et al. Elevated COX-2 expression is linked to tumor progression and poor prognosis. Am. J. Pathol. 2003, 162, 89–98. [Google Scholar]
- Larkin, J.; et al. Five-year survival with combined dabrafenib and trametinib in BRAF-mutated melanoma. N. Engl. J. Med. 2019, 381, 626–636. [Google Scholar] [CrossRef]
- Kupcinskiene, E.; Stikliene, A.; Judzentiene, A. The essential oil qualitative and quantitative composition in the needles of Pinus sylvestris L. growing along industrial transects. Environ. Pollut. 2008, 155, 481–491. [Google Scholar] [CrossRef] [PubMed]
- Nyamwihura, R.J.; Ogungbe, I.V. The pinene scaffold: its occurrence, chemistry, synthetic utility, and pharmacological importance. RSC Adv. 2022, 12, 11346–11375. [Google Scholar] [CrossRef]
- Salehi, B.; Upadhyay, S.; Erdogan Orhan, I.; Kumar Jugran, A.; L.D. Jayaweera, S.; A. Dias, D.; Sharopov, F.; Taheri, Y.; Martins, N.; Baghalpour, N.; C. Cho, W.; Sharifi-Rad, J. Therapeutic Potential of α- and β-Pinene: A Miracle Gift of Nature. Biomolecules 2019, 9, 738. [Google Scholar] [CrossRef]
- Trott, O.; Olson, A.J. AutoDock Vina: Improving the speed and accuracy of docking with a new scoring function, efficient optimization, and multithreading. J. Comput. Chem. 2010, 31, 455–461. [Google Scholar] [CrossRef]
- Chapman, P.B.; Hauschild, A.; Robert, C.; Haanen, J.B.; Ascierto, P.; Larkin, J.; Dummer, R.; Garbe, C.; Testori, A.; Maio, M.; et al. Improved survival with vemurafenib in melanoma with BRAF V600E mutation. N. Engl. J. Med. 2011, 364, 2507–2516. [Google Scholar] [CrossRef]
- Robert, C.; Karaszewska, B.; Schachter, J.; Rutkowski, P.; Mackiewicz, A.; Stroiakovski, D.; Lichinitser, M.; Dummer, R.; Grange, F.; Mortier, L.; et al. Improved overall survival in melanoma with combined dabrafenib and trametinib. N. Engl. J. Med. 2015, 372, 30–39. [Google Scholar] [CrossRef]
- Nazarian, R.; Shi, H.; Wang, Q.; Kong, X.; Koya, R.C.; Lee, H.; Chen, Z.; Lee, M.-K.; Attar, N.; Sazegar, H.; et al. Melanomas acquire resistance to B-RAF(V600E) inhibition by RTK or N-RAS upregulation. Nature 2010, 468, 973–977. [Google Scholar] [CrossRef] [PubMed]
- Arozarena, I.; Wellbrock, C. Overcoming resistance to BRAF inhibitors. Ann. Transl. Med. 2017, 5, 387–387. [Google Scholar] [CrossRef] [PubMed]
- Garutti, M.; Targato, G.; Buriolla, S.; Palmero, L.; Minisini, A.M.; Puglisi, F. CDK4/6 Inhibitors in Melanoma: A Comprehensive Review. Cells 2021, 10, 1334. [Google Scholar] [CrossRef]
- Levy, C.; Khaled, M.; Fisher, D.E. MITF: master regulator of melanocyte development and melanoma oncogene. Trends Mol. Med. 2006, 12, 406–414. [Google Scholar] [CrossRef]
- Fabbro, D.; Cowan-Jacob, S.W.; Moebitz, H. Ten things you should know about protein kinases:IUPHAR Review 14. Br. J. Pharmacol. 2015, 172, 2675–2700. [Google Scholar] [CrossRef] [PubMed]
- Zhang, J.; Yang, P.L.; Gray, N.S. Targeting cancer with small molecule kinase inhibitors. Nat. Rev. Cancer 2009, 9, 28–39. [Google Scholar] [CrossRef] [PubMed]
- Kuźbicki, Ł.; Brożyna, A.A. Immunohistochemical detectability of cyclooxygenase-2 expression in cells of human melanocytic skin lesions: A methodological review. J. Cutan. Pathol. 2019, 47, 363–380. [Google Scholar] [CrossRef] [PubMed]
Disclaimer/Publisher’s Note: The statements, opinions and data contained in all publications are solely those of the individual author(s) and contributor(s) and not of MDPI and/or the editor(s). MDPI and/or the editor(s) disclaim responsibility for any injury to people or property resulting from any ideas, methods, instructions or products referred to in the content. |
© 2026 by the authors. Licensee MDPI, Basel, Switzerland. This article is an open access article distributed under the terms and conditions of the Creative Commons Attribution (CC BY) license (http://creativecommons.org/licenses/by/4.0/).
Copyright: This open access article is published under a Creative Commons CC BY 4.0 license, which permit the free download, distribution, and reuse, provided that the author and preprint are cited in any reuse.


