Submitted:
06 March 2026
Posted:
10 March 2026
You are already at the latest version
Abstract
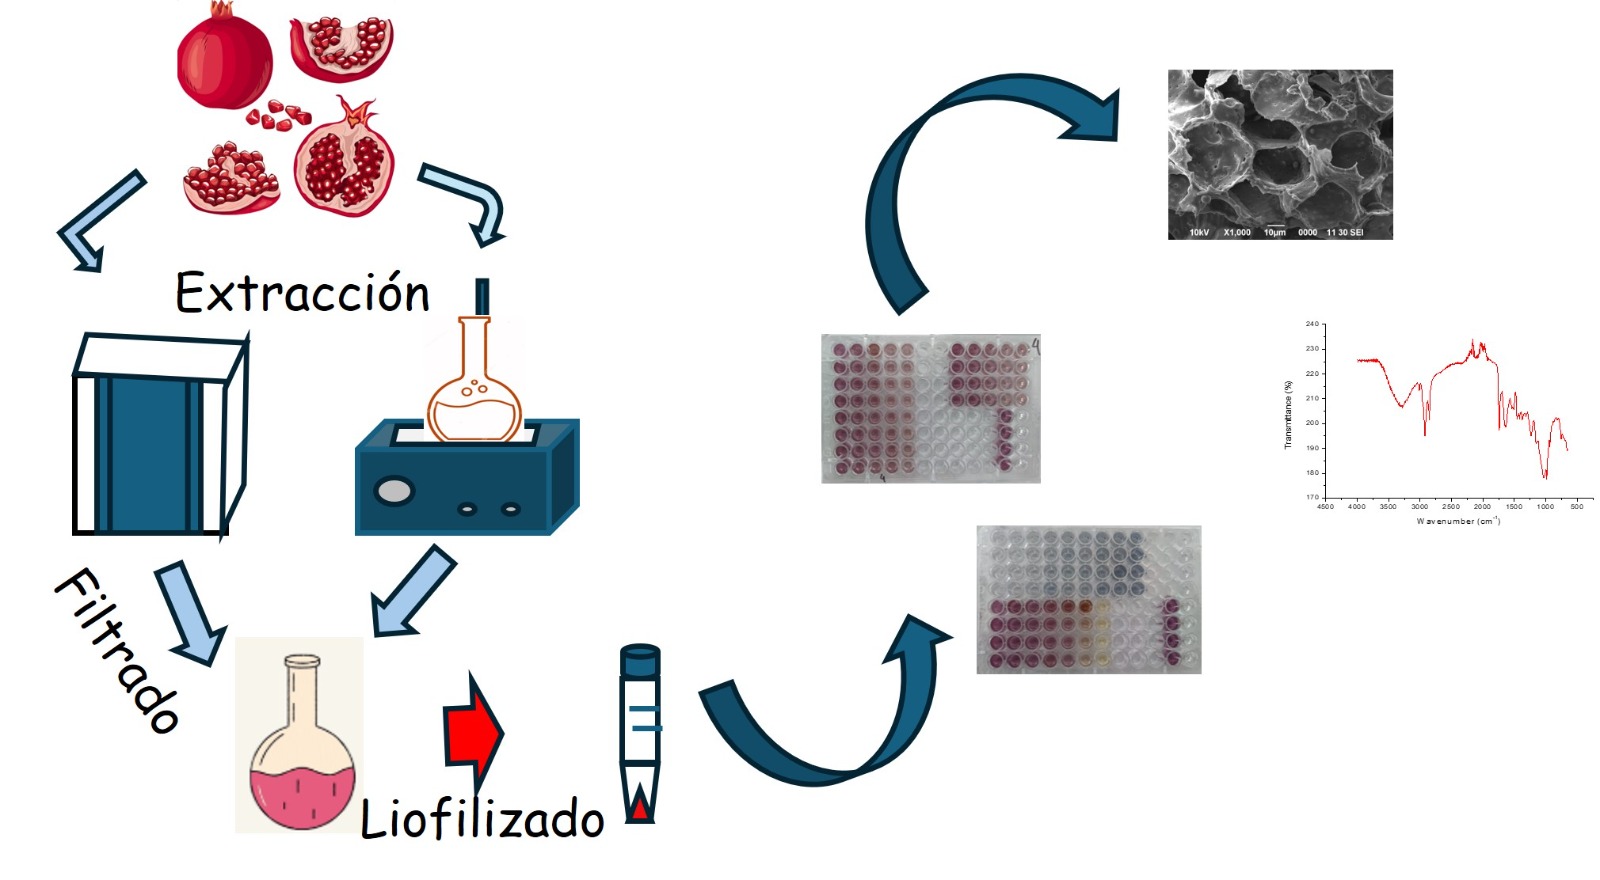
In this study, we compared the effects of microwave-assisted extraction (MAE) and ultrasound-assisted extraction (UAE) on the total phenolic content, antioxidant activity, morphological characteristics, and identification of the bioactive compounds in pomegranate seeds. We conducted a phytochemical characterization of the extracts by determining the total phenolic content and total flavonoids. Antioxidant activity was evaluated using ferric reducing antioxidant power (FRAP) and free radical inhibition methods (DPPH and ABTS). Morphological characteristics were analyzed via scanning electron microscopy, UV-Vis and FTIR of the extracts were recorded. Additionally, the main bioactive compounds were identified using HPLC-MS. Our results demonstrated that MAE was the most efficient technique, yielding a higher content of total phenols (35.47 mg GAE/g), total flavonoids (14.44 mg CAE/g) and antioxidant activity (0.19 and 0.41 mmol TEAC/g, as determined by FRAP and ABTS, respectively). In terms of morphological characteristics, UAE induced more changes in the structure of the plant material compared to MAE. According to HPLC-MS analysis, the extract obtained using MAE notably contained coumaric acid, cyanidin, and quercetin, whereas the UAE extract included coumaric acid, cyanidin, kaempferol, and epicatechin. In conclusion, this study demonstrated that MAE is a more efficient method than UAE for extracting bioactive compounds. Pomegranate seeds may represent a potential source of these compounds for application in various industrial areas.
Keywords:
pomegranate by-product
; phenolic compounds
; antioxidant activity
; microwaves
; sonication
1. Introduction
The pomegranate (Punica granatum L.), a plant from the Punicaceae family, is native to the Mediterranean region. Due to its adaptive nature, it is now cultivated in tropical and subtropical areas globally [1]. In Mexico, cultivation spans 18 states, with Morelos, Hidalgo, and Oaxaca being the primary producers. According to the Ministry of Agriculture and Rural Development (SADER)[2], just over 10,000 tons were produced in 2022.
Juice, the primary product derived from pomegranate fruit processing, constitutes roughly 30% of the fruit’s total weight. This processing, however, results in significant waste, as peels and seeds account for about 50% of the fruit’s weight [3]. Pomegranate fruit residues are rich in phytonutrients, which offer substantial health benefits. Notably, the seeds contain approximately 1.2% polyphenols, including anthocyanins, ellagic acid, and kaempferol [4].
Phenolic compounds are a significant class of phytochemicals found in plants, comprising a wide array of derivatives such as simple phenols, phenylpropanoids, benzoic acid derivatives, flavonoids, tannins, lignans, and lignins. These compounds have gained noteworthy scientific and industrial attention due to their reported benefits in various studies, including antioxidant capacity, as well as antimicrobial, antifungal, anti-inflammatory, antidiabetic, and anticancer properties, among others [5]. Consequently, there is an urgent need to optimize extraction methods to enhance both the yield and the biological activity of these bioactive compounds.
The extraction process is a crucial step that determines both the yield and bioactive properties of secondary metabolites, such as polyphenols. Traditional methods typically require high temperatures and extended periods, leading to substantial energy consumption. These conditions can be too harsh for heat-sensitive compounds. Additionally, conventional methods necessitate large volumes of organic solvents [6] To mitigate these drawbacks, emerging extraction technologies are being explored. These innovative methods optimize the extraction process and yield improved results due to their distinct mechanisms of action. Notably, microwave-assisted extraction (MAE) and ultrasound-assisted extraction (UAE) are among the most promising emerging methods.
MAE has garnered significant attention due to its unique heating mechanism, moderate capital cost, and effective performance under atmospheric conditions. Microwaves, consisting of an electric field and a magnetic field oscillating perpendicularly, operate at frequencies between 0.3 and 300 GHz. They can penetrate certain materials and interact with polar components to generate heat through ionic conduction and dipolar rotation. This selective heating depends on the material’s dielectric constant [7].
Conversely, the UAE is a viable alternative for extracting natural compounds. This technique employs low solvent volumes and short extraction times, resulting in higher yields and minimizing the degradation of thermosensitive compounds [8]. Sonication involves using high-intensity sound waves, which cause physical alterations in plant tissues through acoustic cavitation. This process enhances the release of extractable components into the solvent by improving mass transfer [9].
There is a variety of information regarding the extraction of bioactive compounds from pomegranate peel and their characterization. However, research on using pomegranate seeds as a source for these compounds is limited. Consequently, the objective of this study was to compare the effects of two non-conventional extraction processes - MAE and UAE - on the content of total phenols, total flavonoids, and antioxidant activity (measured by DPPH, FRAP, and ABTS assays). Additionally, the study aimed to identify the main compounds present in both extracts using high-performance liquid chromatography (HPLC).
2. Results and Discussion
2.1. UV-Vis and Infrared Spectroscopies
Figure 1 presents the UV-Vis and FTIR spectra of extracts obtained via MAE and UAE methods. The UV-Vis spectra (Figure 1a) of both extracts display a predominant band in the range of 280–300 nm, with a peak absorbance at 287 nm. As noted by Catalin Mot et al. [10], this region of the UV-Vis spectrum is indicative of phenolic compounds. Flavonoids, a subgroup of these compounds, typically exhibit absorption bands between 240–280 nm and 300–400 nm [11]. In pomegranate seeds, commonly reported flavonoids include kaempferol and anthocyanins, with (+)-catechin and (-)-epicatechin also likely present, which have peak absorbances at 280 and 278 nm, respectively. While the spectra are largely similar, the MAE extract demonstrates higher absorbance, suggesting a greater concentration of phenolic compounds.
FTIR analysis is effective for determining major functional groups and identifying potential changes in a sample’s chemical composition. The FTIR spectra of pomegranate seed flour (PSF) and the extracts obtained through EAM and EAU are illustrated in Figure 1b. A strong and broad signal was consistently recorded in the 3200–3350 cm-1 region, indicating the stretching vibrations of -OH groups, with the processed samples displaying the greatest intensity. The band at 2900 cm-1 corresponds to the stretching vibrations of -CH bonds found in the aromatic methoxy groups of carboxylic acids, as well as in the methyl and methylene groups of the side chains [3]. According to Jha and Sit [12], the peak at 1750 cm-1 is associated with the stretching vibrations of C=O bonds, characteristic of carbonyl or ester groups. It is noteworthy that this signal appeared well-defined in the seed spectrum; however, its intensity significantly decreased in the spectrum of the UAE extract and disappeared in the one obtained by MAE. This change occurs because the band is related to aldehyde or ketone groups primarily found in carbohydrates (though they may also be present in other seed matrix components), which are preferentially removed during the centrifugation and filtration process. The signal at 1605 cm-1, intensified in the spectra of both extracts, corresponds to the stretching vibrations of the C=C bond in the benzene ring [13]. Finally, an intense and broad band observed in the 1000–1086 cm-1 region is attributed to the stretching vibrations of C-O bonds in carboxylic acids and C-OH in alcohol groups, characteristic of phenolic compounds [14]. In conclusion, FTIR analysis effectively recorded the main functional groups indicative of phenolic compounds in the extracts, and no changes in chemical composition resulting from the extraction processes were identified.
2.2. Total Phenolic Content and Flavonoid Content
To evaluate the effect of the extraction method on the yield of phenolic compounds in pomegranate seed extract, a comparative study was conducted between MAE and UAE (Figure 2). Figure 2a indicates that the total phenolic content was higher in seed extracts obtained via MAE (35.47 mg GAE/g of dry extract), with this value being significantly different (P<0.05) from that recorded for UAE (22.62 mg GAE/g of dry extract). These values exceed those reported by Zhang et al. [4], who discovered total phenolic contents between 9.94-10.36 mg/g in pomegranate seed extracts processed using eutectic solvents and UAE. For total flavonoids, the trend was similar; MAE produced a statistically higher amount (P<0.05) of total flavonoids (14.44 mg CAE/g of dry extract) compared to UAE (11.02 mg CAE/g of dry extract) (Figure 2b). This outcome can be attributed to the findings of Cheng et al. [15], which suggest that MAE’s effectiveness arises from enhanced desorption, diffusion, and dissolution processes of bioactive compounds. The microwave incidence increases internal cell pressure, alters the physical properties of biological tissues, and improves the porosity of the biological matrix. This enhancement allows better solvent penetration and increases the yield of desired substances. Nayak et al. [16] reported similar results when comparing MAE and UAE regarding the total phenolic content of orange peel extracts.
2.3. Antioxidant Capacity
The antioxidant capacity of an extract is closely linked to the ability of phenolic compounds to scavenge free radicals, disrupt radical chain reactions, and chelate metals [16]. Common methods for determining antioxidant activity focus on free radical inhibition or neutralization reactions, such as DPPH and ABTS, or metal ion reduction, as seen in the FRAP assay [17].
Table 1 presents the values obtained from the three tests conducted. The FRAP results indicate that both extraction methods yielded extracts capable of reducing Fe3+ ions to Fe2+ ions. However, the extract from the MAE method recorded the highest Trolox equivalent value (0.19 mmoles TEAC/g), compared to the extract from the UAE method (0.13 mmoles TEAC/g), which was a statistically significant difference. Additionally, these values exceeded those reported by Kalaycıoğlu and Erim [18] for seeds of six pomegranate ecotypes from Tunisia, which ranged from 0.053 to 0.1 mmol/g.
The DPPH assay indicated that the MAE method resulted in a slightly higher value than the UAE method. This implies that a greater quantity of microwave extract is necessary compared to the ultrasound extract to inhibit the radical by 50%. Statistically, there was a significant difference between the two extraction methods. Despite this, the IC50 values for both methods were small, demonstrating that only a minimal amount of extract is needed to inhibit 50% of the DPPH radical. This finding translates into high antioxidant activity [19].
The results from the ABTS method indicated that the values for both the MAE and UAE methods were higher than those from the other methods (FRAP and DPPH), measuring 0.41 and 0.39 mmol TEAC/g, respectively. This outcome was anticipated, as higher values indicate a superior ability to inhibit free radicals, underscoring the significant antioxidant capacity of pomegranate seeds. The value obtained by UAE was slightly lower than that of MAE, with the difference being statistically significant (P<0.05). Similar findings were reported by Pourshoaib et al. [20], who observed comparable trends using the DPPH and ABTS methods on date seeds. They also found that UAE yielded slightly lower values than MAE, with a statistically significant difference.
Under the conditions utilized in this study, the MAE method yielded superior results, demonstrating a statistically significant difference. Moreover, it was shown to achieve a greater antioxidant effect in half the time compared to UAE. This effectiveness may be attributed to the MAE method’s reliance on electromagnetic waves, which can directly target polar substances due to their high dielectric constant values. Consequently, this facilitates the extraction of polyphenols – hydrophilic compounds largely responsible for the antioxidant capacity of plant materials [9].
2.4. SEM Microscopy
SEM analysis was employed to examine the morphology and microstructural characteristics of the sample surfaces. Figure 3 displays the SEM micrographs of pomegranate seed flour and residues following extraction by MAE and UAE methods. In the raw sample image (Figure 3a), a densely packed surface with a relatively intact plant wall is evident, showing only slight mechanical damage from grinding. Additionally, basic structures such as starch granules are present, and no porosities are observed. In contrast, the extraction processes significantly altered the physical characteristics of the plant material. Figure 3b reveals that microwave application almost completely removed the material within the cellular structures and caused apparent damage to the cell wall’s outer layers. Nevertheless, despite the conditions generated by electromagnetic energy, the internal structure was somewhat preserved. According to More and Arya [21], the effectiveness of microwave irradiation in breaking the cell wall is attributed to ionic conduction and the permanent dipolar rotation of molecules, which results in rapid solvent heating. The structural changes allow the solvent to easily infiltrate cellular matrices, enhancing the extraction efficiency. Unlike the observations in Figure 3b, UAE induced more pronounced morphological changes in the plant material structure (Figure 3c), evidenced by the complete collapse of the cellular structure. Fragmented structures and large cracks reflect the cavitation generated during the sonication process. Although the application of ultrasonic waves facilitates the diffusion and release of polyphenols within an appropriate time frame, prolonged exposure leads to the decomposition of certain polyphenols due to increased thermal and mechanical effects [22]. Although this study did not consider the effect of extraction time, the duration for UAE was twice that of MAE, which might explain the lower total phenolic content in extracts obtained by UAE.
2.5. HPLC-ESI-MS Compound Identification
An analysis of pomegranate seed extracts, recognized for their high phenolic content, was conducted using LC-ESI-MS/MS to identify a variety of present compounds. The focus was on detecting compounds associated with antioxidant activity, providing insights into the phenolic profile of the extracts, and highlighting several key compounds with such activity. Importantly, the chemical composition of an extract depends on the extraction method utilized. For instance, notable compounds identified in the extract obtained by MAE included coumaric acid, cyanidin, and quercetin (Table 2). In contrast, the extract obtained by UAE contained coumaric acid, cyanidin, kaempferol, and epicatechin (Table 3). These differences in constituents are directly linked to the predominant extraction mechanisms of each technique. The findings in this study align with previous research, confirming the reputation of pomegranate seed extract as a rich source of bioactive molecules [23]. Each phenolic compound plays a significant role in antioxidant defense mechanisms. Specifically, quercetin and kaempferol are known for their anti-inflammatory and anticancer properties [24,25], while epicatechin is associated with cardiovascular health benefits [26]. The diversity of phenolic compounds detected suggests that pomegranate seed extracts may have potential applications in health, including the development of nutraceuticals and functional foods.
4. Materials and Methods
4.1. Materials
The following reagents were used in the study: Folin-Ciocalteu reagents, 2,4,6-tripyridyl-s-triazine (TPTZ), 2,2-azinobis(3-ethyl-benzothiazoline-6-sulfonic acid) diammonium salt (ABTS), and 2,2-diphenyl-1-picrylhydrazyl (DPPH), all of which were purchased from Sigma-Aldrich (St. Louis, MO). Sodium carbonate was obtained from Merck (Darmstadt, Germany), while iron (III) chloride hexahydrate was sourced from Deiman (Mexico). Technical-grade ethanol, acquired from Meyer (Mexico), was also used in the experiments.
4.2. Conditioning of Raw Materials
Commercially ripe pomegranate fruits were collected from the experimental agricultural field of Francisco I. Madero University in Hidalgo, Mexico. The fruits were washed with running water and sanitized with a 1% sodium hypochlorite solution. Seeds were then removed and dehydrated at 55 °C for 24 h using a convection oven. The dried material was ground with a hammer mill (TS3383L60, Thomas ScientificTM, USA) and sieved through a #40 mesh stainless steel sieve (0.420 mm).
4.3. Microwave-Assisted Extraction
A 12.5 g plant sample was incorporated into 250 mL of a 70:30 ethanol-water solution through manual stirring. The mixture underwent microwave irradiation using a digestion system (LMWD-A10, Labtron, UK) at 1600W for 15 min at 65 °C. After irradiation, the mixture was decanted and centrifuged at 515 x g (K 3454OM International centrifuge, USA). The supernatant was collected, and the sediment underwent a second extraction under identical conditions. The resulting supernatants were combined, filtered, and concentrated using a rotary evaporator (RE500 Yamato, Japan) at 40 °C. Finally, the extract was lyophilized (FreeZone 4.5, Labconco, USA) and stored at room temperature in the dark.
4.4. Ultrasound-Assisted Extraction
A mixture containing 12.5 g of plant material and 250 mL of an ethanol-water solution (70:30) was sonicated at 25 kHz for 30 min in an ultrasonic bath (TI-H-5, Elma, Germany) maintained at 25 °C. Following sonication, the mixture was decanted and centrifuged at 515 x g using a K 3454OM International centrifuge (USA). The supernatant was collected, and the sediment underwent a second extraction under identical conditions. The supernatants from both extractions were combined, filtered, and concentrated using a rotary evaporator (RE500 Yamato, Japan) at 40 °C. Finally, the extract was lyophilized using a FreeZone 4.5 (Labconco, USA) and stored at room temperature in the dark.
4.5. Total Phenol Content
The total phenol content was determined using the Folin-Ciocalteu assay, based on the methodology described by Villamil-Galindo and Piagentini [27], with some modifications. In a 96-well microplate, 25 µL of diluted extract was placed in each well. Subsequently, 125 µL of distilled water, 20 µL of Folin’s reagent (diluted tenfold), and 30 µL of sodium carbonate were added. After allowing the mixture to rest for 30 min, absorbance was measured at 760 nm using a spectrophotometer (Multiskan GO, Thermo Scientific, USA). Gallic acid served as the standard, and results were expressed as mg of gallic acid equivalent (GAE)/g of dry extract.
4.6. Total Flavonoid Content
The procedure was adapted from the methodology of Farooq et al. [28] with some modifications. A 0.5 mL sample of diluted extract was combined with 2.5 mL of distilled water and 0.15 mL of sodium nitrite in a 15 mL Falcon tube. The mixture was allowed to stand for 6 min. Subsequently, 0.3 mL of aluminum chloride III was added, and after a further standing period of 5 min, 1 mL of sodium hydroxide was introduced. The solution was then vortexed vigorously for 1 min. The absorbance of the resulting solution was measured at 510 nm. Catechin served as the standard, and results were expressed as mg catechin equivalents (CAE)/g of dry extract.
4.7. FRAP
The iron reduction antioxidant power (FRAP) was assessed according to the method described by Gullón et al. [29], with some modifications. In each well of a 96-well microplate, 20 µL of diluted extract was combined with 180 µL of FRAP solution and 60 µL of distilled water. This mixture was incubated at 37 °C for 10 min, after which the absorbance was measured at 593 nm. Trolox was used as a standard, and the results are reported as micromoles of Trolox equivalent (TEAC)/g of dry extract.
4.8. DPPH and ABTS
The free radical inhibition activity was assessed using the DPPH method [30], with certain adjustments. In a well of a 96-well microplate, 200 µL of diluted extract was combined with 50 µL of DPPH stock solution. This mixture was allowed to stand in the dark for 30 min. Absorbance was measured at a wavelength of 515 nm. Results were expressed as micromoles of Trolox equivalent (TEAC)/g of dry extract. Furthermore, the concentration required to inhibit 50% of DPPH (IC50) was determined by plotting the % degraded DPPH VS concentration of the extract.
The antioxidant capacity using the ABTS method was assessed following the methodology outlined by Rumpf et al. [31], with some modifications. In a well of a 96-well microplate, 25 µL of diluted extract was combined with 180 µL of ABTS solution. The mixture was left to stand for 10 min, after which the absorbance was measured at a wavelength of 734 nm. Trolox served as the standard, and results were expressed as micromoles of Trolox equivalent (TEAC)/g of sample.
4.9. Scanning Electron Microscopy (SEM)
Pomegranate seed powders’ morphology and physical characteristics, both before and after extraction, were examined using an electron microscope (JMS-6390LV, JEOL, Japan). Samples were coated with gold for 120 s using a Denton Vacuum Desk IV (USA) to prepare them for observation. Micrographs were then obtained at various magnifications.
4.10. UV-Vis and Fourier Transform Infrared (FTIR) Spectroscopy
Scanning was conducted over a wavelength range of 200–800 nm using a Genesys spectrophotometer (10S, Thermo Scientific, USA). Infrared analysis aimed to identify the different functional groups present in the extracts obtained by both methods: MAE and UAE. A Cary 630 device (Agilent Technologies, USA) facilitated this analysis. Signals were obtained in the region of 4000–500 cm-1. The analysis utilized an attenuated total reflectance cell with a resolution of 4 cm-1 across 32 scans.
4.11. HPLC-ESI-MS Analysis
The extracts obtained by both methods were analyzed using HPLC with an Agilent 1260 system. This system was equipped with a quadrupole pump, degasser, and diode array detectors, and was coupled to an Agilent 6530 mass spectrometer featuring electrospray ionization and a quadrupole time-of-flight (ESI-QToF) detector. For each sample analysis, a Poroshell 120 EC-C18 column (3.0 mm x 50 mm × 2.7 µm) was used at 30 °C. The mobile phase consisted of 0.1% formic acid in water (eluent A) and acetonitrile (eluent B). A gradient elution method was employed, starting with initial conditions of 95% A and 5% B, transitioning to 80% A at 0–5 min, 10% A at 5–20 min, and finally 0% A at 20–24 min. The total run time was 24 min, with a flow rate of 0.5 mL/min and an injection volume of 2.5 µL. Mass analysis was performed in positive ionization mode, with a gas temperature of 275 °C and a flow rate of 7 L/min. The capillary voltage was set at 4500 V, and the nebulizer pressure at 30 psi. The resulting chromatograms were analyzed and compared using the mzCloud (https://www.mzcloud.org/) and MassBank (http://www.massbank.jp) databases to identify the main metabolites present in the samples.
4.12. Statistical Analysis
All analyses were conducted in triplicate, and results are expressed as mean ± standard deviation. We used OriginPro 9.0 software to perform an analysis of variance (ANOVA). Additionally, a comparison of means was carried out using the Least Significant Difference (LSD) test at a significance level of P<0.05.
5. Conclusions
This study compared the efficiency of MAE and UAE in extracting bioactive compounds and assessing the antioxidant activity of pomegranate seed extracts. The results demonstrated that MAE was superior to UAE, yielding a higher concentration of phenolic compounds and extracts with enhanced antioxidant activity. The total phenolic content showed a positive correlation with antioxidant activity, as measured by FRAP, ABTS, and DPPH assays. The HPLC-MS analysis revealed a diverse array of phytochemicals, including flavonoids and phenolic compounds, with profiles varying based on the extraction technique employed. This diversity suggests that pomegranate seeds are a valuable source of antioxidants, offering potential applications in the food and pharmaceutical industries. Additionally, utilizing agro-industrial waste supports the circular economy and mitigates environmental pollution from waste.
Author Contributions
Carried out the experiments and wrote the manuscript, WM.AB.; supervised the work, provided the materials and reagents and edited the manuscript, MA.AM.; provided the raw material and reviewed the manuscript, E.RJ.; performed the analysis of results by HPLC-MS and supported part of the manuscript writing, O.PR.; supported in several experiments of the work, CA.CR.
Funding
This research was funded by project SIP-IPN No. 20241331
Data Availability Statement
The data presented in this article are not easily made public due to confidentiality agreements. Requests to access the datasets should be directed to the first or last author.
Acknowledgments
The first author thanks SECIHTI México for the support provided during the development of the work. All authors thank Instituto Politécnico Nacional, especially CICATA- Legaria for allowing this work to be carried out in its facilities.
Conflicts of Interest
The authors declare that there is no conflict of interest
Abbreviations
The following abbreviations are used in this manuscript:
| MAE | Microwave assisted extraction |
| UAE | Ultrasound assisted extraction |
| PSF | Pomegranate seed flour |
| TPC | Total phenolic content |
| TFC | Total flavonoid content |
References
- El Hosry, L.; Bou-Mitri, C.; Dargham, M. B.; Abou Jaoudeh, M.; Farhat, A.; El Hayek, J.; Bou Mosleh, J. M.; Bou-Maroun, E. Phytochemical composition, biological activities and antioxidant potential of pomegranate fruit, juice and molasses: A review. Food Bioscience 2023, 55, 103034. [Google Scholar] [CrossRef]
- SADER. Secretaría de Agricultura y Desarrollo Rural. Que hay detrás de la producción de granada. 2022. Available online: https://www.gob.mx/agricultura/articulos/que-hay-detras-de-la-produccion-de-granada?idiom=es.
- Singh, N.; Kumar, S.; Patle, D. S. Intensification of extraction of bioactive compounds from pomegranate peel using an ultrasound-microwave assisted extraction approach: Parametric optimization, kinetics and thermodynamics. Separation and Purification Technology 2025, 359, 130681. [Google Scholar] [CrossRef]
- Zhang, S.; Tan, T.; Wang, J.; Ma, T.; Li, T. Green extraction of polyphenols from pomegranate seeds by ultrasound-assisted deep eutectic solvent extraction: Optimization and bioactivity. Sustainable Chemistry and Pharmacy 2024, 41, 101710. [Google Scholar] [CrossRef]
- Cheng, J.; Li, J.; Xiong, R. G.; Wu, S. X.; Huang, S. Y.; Zhou, D. D.; Saimaiti, A.; Shang, A.; Feng, Y.; Gan, R.Y.; Li, H. B. Bioactive compounds and health benefits of pomegranate: An updated narrative review. Food Bioscience 2023, 102629. [Google Scholar] [CrossRef]
- Pogorzelska-Nowicka, E.; Hanula, M.; Pogorzelski, G. Extraction of polyphenols and essential oils from herbs with green extraction methods–An insightful review. Food Chemistry 2024, 140456. [Google Scholar] [CrossRef]
- Chan, C. H.; Yusoff, R.; Ngoh, G. C.; Kung, F. W. L. Microwave-assisted extractions of active ingredients from plants. Journal of Chromatography A 2011, 1218(37), 6213–6225. [Google Scholar] [CrossRef]
- Yusoff, I. M.; Taher, Z. M.; Rahmat, Z.; Chua, L. S. A review of ultrasound-assisted extraction for plant bioactive compounds: Phenolics, flavonoids, thymols, saponins and proteins. Food research international 2022, 157, 111268. [Google Scholar] [CrossRef]
- Jha, A. K.; Sit, N. Extraction of bioactive compounds from plant materials using combination of various novel methods: A review. Trends in Food Science & Technology 2022, 119, 579–591. [Google Scholar] [CrossRef]
- Catalin MOT, A.; Silaghi-Dumitrescu, R.; Sarbu, C. Rapid and effective evaluation of the antioxidant capacity of propolis extracts using DPPH bleaching kinetic profiles, FT-IR and UV―vis spectroscopic data. Journal of food composition and analysis 2011, 24(4-5), 516–522. [Google Scholar] [CrossRef]
- Masek, A.; Chrzescijanska, E.; Kosmalska, A.; Zaborski, M. Antioxidant activity determination in Sencha and Gun Powder green tea extracts with the application of voltammetry and UV-VIS spectrophotometry. Comptes Rendus. Chimie 2017, 15(5), 424–427. [Google Scholar] [CrossRef]
- Jha, A. K.; Sit, N. Effect of ultrasound, microwave, and enzymatically pre-treated Terminalia chebula pulp on extraction of bioactive compounds using supercritical CO2. Sustainable Chemistry and Pharmacy 2023, 33, 101098. [Google Scholar] [CrossRef]
- Al-Ansari, M. M.; Al-Dahmash, N. D.; Jhanani, G. K. Anti-Candida, antioxidant and antidiabetic potential of ethyl acetate extract fraction-7a from Cymodocea serrulata and its bioactive compound characterization through FTIR and NMR. Environmental Research 2023, 229, 115985. [Google Scholar] [CrossRef]
- Rashid, R.; Wani, S. M.; Manzoor, S.; Masoodi, F. A.; Dar, M. M. Green extraction of bioactive compounds from apple pomace by ultrasound assisted natural deep eutectic solvent extraction: Optimisation, comparison and bioactivity. Food Chemistry 2023, 398, 133871. [Google Scholar] [CrossRef]
- Cheng, M.; He, J.; Li, C.; Wu, G.; Zhu, K.; Chen, X.; Zhang, Y.; Tan, L. Comparison of microwave, ultrasound and ultrasound-microwave assisted solvent extraction methods on phenolic profile and antioxidant activity of extracts from jackfruit (Artocarpus heterophyllus Lam.) pulp. Lwt 2023, 173, 114395. [Google Scholar] [CrossRef]
- Nayak, B.; Dahmoune, F.; Moussi, K.; Remini, H.; Dairi, S.; Aoun, O.; Khodir, M. Comparison of microwave, ultrasound and accelerated-assisted solvent extraction for recovery of polyphenols from Citrus sinensis peels. Food chemistry 2015, 187, 507–516. [Google Scholar] [CrossRef] [PubMed]
- Alzagameem, A.; Khaldi-Hansen, B. E.; Büchner, D.; Larkins, M.; Kamm, B.; Witzleben, S.; Schulze, M. Lignocellulosic biomass as source for lignin-based environmentally benign antioxidants. Molecules 2018, 23(10), 2664. [Google Scholar] [CrossRef]
- Kalaycıoğlu, Z.; Erim, F. B. Total phenolic contents, antioxidant activities, and bioactive ingredients of juices from pomegranate cultivars worldwide. Food chemistry 2017, 221, 496–507. [Google Scholar] [CrossRef]
- Manye, SJ; Saleh, JS; Ishaya, HB; Chiroma, SM; Attah, MOO; Dibal, NI. Análisis fitoquímico y actividad antioxidante in vitro de extractos acuosos y metanólicos de aloe vera. Investigación farmacológica - Medicina China Moderna 2023, 8, 100291. [Google Scholar] [CrossRef]
- Pourshoaib, S. J.; Ghatrami, E. R.; Shamekhi, M. A. Comparing ultrasonic-and microwave-assisted methods for extraction of phenolic compounds from Kabkab date seed (Phoenix dactylifera L.) and stepwise regression analysis of extracts antioxidant activity. Sustainable Chemistry and Pharmacy 2022, 30, 100871. [Google Scholar] [CrossRef]
- More, P. R.; Arya, S. S. Intensification of bio-actives extraction from pomegranate peel via microwave irradiation: Effect of factors, optimization, kinetics, and bioactive profiling. Chemical Engineering and Processing-Process Intensification 2024, 202, 109839. [Google Scholar] [CrossRef]
- Che, H.; Zhang, R.; Wang, X.; Yu, H.; Shi, X.; Yi, J.; Li, J.; Qi, Q.; Dong, R.; Li, Q. Ultrasound-assisted extraction of polyphenols from Phyllanthi Fructus: Comprehensive insights from extraction optimization and antioxidant activity. Ultrasonics Sonochemistry 2024, 111, 107083. [Google Scholar] [CrossRef]
- Fourati, M.; Smaoui, S.; Hlima, H. B.; Elhadef, K.; Braïek, O. B.; Ennouri, K.; Chakchouk Mtibaa, A.; Mellouli, L. Bioactive compounds and pharmacological potential of pomegranate (Punica granatum) seeds-a review. Plant Foods for Human Nutrition 2020, 75, 477–486. [Google Scholar] [CrossRef]
- Khan, H.; Ullah, H.; Aschner, M.; Cheang, W. S.; Akkol, E. K. Neuroprotective effects of quercetin in Alzheimer’s disease. Biomolecules 2019, 10(1), 59. [Google Scholar] [CrossRef]
- Li, Y.; Yao, J.; Han, C.; Yang, J.; Chaudhry, M. T.; Wang, S.; Liu, H.; Yin, Y. Quercetin, inflammation and immunity. Nutrients 2016, 8(3), 167. [Google Scholar] [CrossRef]
- Santos-Buelga, C.; Scalbert, A. Proanthocyanidins and tannin-like compounds–nature, occurrence, dietary intake and effects on nutrition and health. Journal of the Science of Food and Agriculture 2000, 80(7), 1094–1117. [Google Scholar] [CrossRef]
- Villamil-Galindo, J. E.; Piagentini, A. Green solvents for the recovery of phenolic compounds from strawberry (Fragaria x ananassa Duch) and apple (Malus domestica) agro-industrial bio-wastes. Revista de la Facultad de Ciencias Agrarias. Universidad Nacional de Cuyo. Mendoza. Argentina 2024, 56(1), 149–160. [Google Scholar] [CrossRef]
- Farooq, M.; Ahmad, R.; Shahzad, M.; Sajjad, Y.; Hassan, A.; Shah, M. M.; Naz, S.; Khan, S. A. Differential variations in total flavonoid content and antioxidant enzymes activities in pea under different salt and drought stresses. Scientia Horticulturae 2021, 287, 110258. [Google Scholar] [CrossRef]
- Gullon, B.; Eibes, G.; Moreira, M. T.; Davila, I.; Labidi, J.; Gullon, P. Antioxidant and antimicrobial activities of extracts obtained from the refining of autohydrolysis liquors of vine shoots. Industrial Crops and Products 2017, 107, 105–113. [Google Scholar] [CrossRef]
- Ferreyra, S.; Bottini, R.; Fontana, A. Assessment of grapevine stems as source of phenolics with antioxidant properties. Revista de la Facultad de Ciencias Agrarias UNCuyo 2019, 51(2), 417–426. Available online: https://revistas.uncu.edu.ar/ojs/index.php/RFCA/article/view/2728.
- Rumpf, J.; Burger, R.; Schulze, M. Statistical evaluation of DPPH, ABTS, FRAP, and Folin-Ciocalteu assays to assess the antioxidant capacity of lignins. International Journal of Biological Macromolecules 2023, 233, 123470. [Google Scholar] [CrossRef]
Figure 1.
UV-Vis and FTIR spectra for extracts obtained by MAE and UAE.

Figure 2.
Effect of the extraction method on a) total phenolic content and b) total flavonoid content in pomegranate seed extracts. Different letters in the bars show significant difference by LSD test (P˂0.05).
Figure 2.
Effect of the extraction method on a) total phenolic content and b) total flavonoid content in pomegranate seed extracts. Different letters in the bars show significant difference by LSD test (P˂0.05).

Figure 3.
Micrographs obtained by SEM of the flour and residues. a) Untreated pomegranate seed, b) residue obtained by MAE and c) residue obtained by UAE.
Figure 3.
Micrographs obtained by SEM of the flour and residues. a) Untreated pomegranate seed, b) residue obtained by MAE and c) residue obtained by UAE.


Table 1.
Antioxidant capacity of the extracts obtained by MAE and UAE.
| Method | FRAP (mmoles TEAC/g) | DPPH IC50 (mmoles TEAC/g) | ABTS (mmoles TEAC/g) |
| MAE | 0.19 ± 0.03 a | 0.17 ± 0.01 a | 0.41 ± 0.02 a |
| UAE | 0.13 ± 0.00 b | 0.15 ± 0.00 b | 0.39 ± 0.07 b |
Different letters in the same column show significant difference by LSD test (P˂0.05) Values expressed as mean ± standard deviation. All analyses are expressed as micromoles of trolox equivalent (TEAC).
Table 2.
Compound identification of extracts obtained by MAE.
| Sample | RT (min) | [m-H]+,* | MW& | Formula | Identification |
| 1 | 0.76 | 474.22 | 474 | C9H8O3 | p-Coumaric acid |
| 2 | 14.76 | 518.32 | 518.424 | C24H22O13 | Malonylgenistin |
| 3 | 15.29 | 611.42 | 611.525 | C27H31O16 | Cyanidin |
| 4 | 16.58 | 546.40 | 544.504 | C27H28O12 | Diferuloylquinic acid |
| 5 | 18.57 | 558.46 | 558.617 | C30H38O10 | Secoisolariciresinol-sesquilignan |
| 6 | 24.29 | 654.48 | 652.554 | C29H32O17 | Quercetin |
* Experimental data. & Theoretical data.
Table 3.
Compound identification of extracts obtained by UAE.
| Sample | RT (min) | [m-H]+,* | MW& | Formula | Identification |
| 1 | 0.42 | 223.98 | 224.21 | C11H12O5 | Sinapic acid |
| 2 | 0.77 | 474.22 | 474 | C9H8O3 | p-Coumaric acid |
| 3 | 2.38 | 611.16 | 611.527 | C30H27O14 | Cyanidin |
| 4 | 11.86 | 460.49 | 462.36 | C21H18O12 | Kaempferol |
| 5 | 16.24 | 678.48 | 680.564 | C30H32O18 | Chrysoeriol |
| 6 | 17.3 | 705.53 | 706.646 | C36H34O15 | Epicatechin |
| 7 | 23.09 | 636.46 | 638.484 | C27H26O18 | Luteolin |
* Experimental data. & Theoretical data.
Disclaimer/Publisher’s Note: The statements, opinions and data contained in all publications are solely those of the individual author(s) and contributor(s) and not of MDPI and/or the editor(s). MDPI and/or the editor(s) disclaim responsibility for any injury to people or property resulting from any ideas, methods, instructions or products referred to in the content. |
© 2026 by the authors. Licensee MDPI, Basel, Switzerland. This article is an open access article distributed under the terms and conditions of the Creative Commons Attribution (CC BY) license (http://creativecommons.org/licenses/by/4.0/).
Copyright: This open access article is published under a Creative Commons CC BY 4.0 license, which permit the free download, distribution, and reuse, provided that the author and preprint are cited in any reuse.


