Submitted:
27 February 2026
Posted:
06 March 2026
You are already at the latest version
Abstract
Remote sensing (RS) air pollution and greenness investigations provide new information about the risk factors and physiologic mechanisms that change stroke subtype occurrence and risk. Five electronic literature databases (PubMed, Scopus, Embase, Web of Science, Google Scholar) were searched to identify 99 unique published research studies that used RS to evaluate the contribution of ambient air pollution and greenness to four stroke subtypes (cerebrovascular, stroke, ischemic, hemorrhagic). Agreement between ambient aerosol optical depth (AOD)-PM2.5 concentration level values and ambient PM2.5 air monitor measurements was 75.1% (95% CI=72.0-%-78.2%). Record analyses demonstrated the significant contribution of higher ambient AOD-air pollution concentration level values to increased stroke subtype occurrence and risk, but significant protection was rendered by increased RS greenness spatial coverage to decreased stroke subtype occurrence and risk. Environmental risk factors were significantly associated with each stroke subtype. There were significant differences between the eight risk factors and stroke subtype combinations. Single and multiple physiologic mechanisms of immune, inflammation, oxidative stress, and other sources were uniquely associated with individual and multiple stroke subtypes. Literature review findings were used to develop a descriptive-explanatory stroke subtype physiologic mechanism model. The model can assist in the development and implementation of population-based stroke subtype intervention programs.
Keywords:
remote sensing
; ambient air pollution
; greenness
; risk factors
; stroke subtypes
; physiologic mechanisms
; population-based intervention
1. Introduction
In less than two decades, RS has continued to increase our understanding of the contribution of elevated ambient AOD-air pollution concentration level values to higher stroke subtype occurrence and risk [1,2,3,4]. An important objective of using RS technology is to acquire, statistically process and use ambient AOD-particulate matter and ambient AOD-gas concentration level values that accurately estimate on-the-ground ambient air monitor measurements [2]. Many ambient AOD-air pollution and stroke subtype publications have described analytical methods that have independently verified concentration level values for coarse (PM10), fine (PM2.5), ultrafine (PM1) particulates, and Ozone (O3), nitric dioxide (NO2), sulfur dioxide (SO2) and other gaseous pollutants with a spatial resolution of 10 km2 or less, a temporal window of one hour, and accuracy that can, at times, exceed 90%, when compared to on-the-ground ambient monitor measurements [5,6,7,8,9,10,11]. Geographic information system (GIS) software is used to geocode each study participants’ residential addresses and then assign an ambient AOD-air pollution concentration level value to the geocoded residential address [2,4,12,13]. Multi-year retrospective and prospective cohort studies, and other study designs, have been used to assess the contribution of ambient AOD-air pollutants and risk factors to stroke subtype morbidity and mortality prevalence or incidence occurrence and risk [13]. Published studies have identified diverse risk factors that can change the aversiveness of ambient AOD-air pollutant concentration level values on stroke subtype occurrence and risk [1,2,3,7,8,9].
Other research publications have utilized RS to evaluate the contribution of greenness, as a protective risk factor, to stroke subtype occurrence and risk [14,15,16]. RS greenness quantifies the spatial extent and location of living vegetation anywhere on the earth’s surface during daytime hours [14,16]. Instruments onboard orbiting satellites measure light absorbed or reflected by chlorophyl in living vegetation [14]. RS greenness is evaluated by using the normalized different vegetation index (NDVI) or the enhanced vegetation index (EVI) [14,17]. EVI and NDVI values vary between 0-1, with higher values representing increased living vegetation density [14,17]. Another interesting and potentially relevant finding for population-based stroke subtype intervention programs is the inverse association between higher EVI and NDVI values on the earth’s surface and decreased stroke subtype occurrence and risk [14,17].
The aversive contribution of ambient AOD-air pollutants and the protective contribution of RS greenness to stroke subtype occurrence and risk can be changed by the ecologic setting [15,18,19]. The ecologic setting includes all variables within the study participant’s environment that can directly or indirectly modify the environmental exposure-health outcome relationship [15,18,19]. Identified ecologic setting attributes include population density (urban vs. rural), economic resources (economically developing vs. economically developed countries, individual), ambient temperature (warm-cold season differences), ambient air pollution sources (vehicles, industrial, agricultural, natural), ambient AOD-air pollution exposure duration (days to years) and RS greenness (EVI, NDVI) [15,16,17,18,19,20,21,22]. The ecologic setting can be viewed as a complex, but analyzable, effect modifier of the contribution of the adverse effects of higher ambient AOD-air pollution concentration level values and the protective effects of higher RS EVI and NDVI values on stroke subtype occurrence and risk [23].
To systematically analyze, evaluate and synthesize the information contained in the identified research publications this literature review utilized the quantitative-qualitative literature review approach that was previously used to evaluate the contribution of ambient AOD-air pollutants to cardiovascular chronic diseases and AOD-air pollutants and RS EVI and NDVI values to respiratory chronic diseases such as asthma [23,24]. This approach involves using descriptive and inferential statistical analyses to quantify relationships between previously identified independent-outcome variables that may contribute to or modify the relationship between higher ambient AOD-air pollution concentration level values and higher RS EVI and NDVI values to higher or lower stroke subtype occurrence and risk, respectively. The identified subset of statistically significant variables forms the basis for increasing our understanding of the environmental exposure-health outcome associations, developing physiologic mechanism models, and using the synthesized scientific knowledge to decrease chronic disease morbidity and mortality occurrence and risk.
By implementing the electronic literature review search strategy described in this study, 99 unique research publications and 19 review articles were identified. This author did not find one published review article that evaluated the contribution of ambient AOD-air pollutants and RS EVI and NDVI analytical procedures to stroke subtype occurrence and risk. There were literature reviews on the contribution of on-the-ground ambient air monitor measurements to stroke subtype occurrence and risk only, and other review articles that included both ambient AOD-air pollution and ambient air pollution monitor measurements but did not evaluate differences between these two methods on stroke subtype occurrence and risk [1,2,13,25,26,27,28,29,30,31,32,33,34,35,36,37]. Therefore, this is the first quantitative-qualitative literature review of the world’s scientific literature on the contribution of ambient AOD-air pollution concentration level values and RS EVI and NDVI values to stroke subtype occurrence and risk.
The main objective of this literature review was to summarize quantitatively-qualitatively, for the first time, the results of research studies that evaluated the adverse effects of ambient AOD-air pollution concentration level values and the protective effects of RS EVI and NDVI values to four stroke subtypes: cerebrovascular (CRV), stroke (STK), hemorrhagic (HEM) and ischemic (ISC). Specific research questions were developed to focus on the quantitative-qualitative analysis of the methods and results in the identified 99 unique research publications: 1) Over time, have the total number of ambient AOD-air pollution and RS EVI and NDVI stroke subtype publications increased? 2) Does ambient AOD-air pollution contribute to increased stroke subtype occurrence and risk? 3) Is the RS EVI and NDVI contribution to stroke subtype occurrence and risk protective? 4) Are there risk factor differences between stroke subtypes? 5) Did the identified research publications use different physiologic mechanisms to describe and explain the aversive contribution of ambient AOD-air pollution and the protective contribution of RS EVI and NDVI to stroke subtype occurrence and risk? 6) Is it possible to develop a descriptive-explanatory stroke subtype physiologic mechanism model? 7) Does the model contribute to the development and implementation of population-based stroke subtype intervention programs?
2. Methods
This section describes how the reviewed research publications were identified and how the retrieved publications and publication-extracted records were analyzed by utilizing descriptive and inferential statistical tests [38,39,40]. Four subsections describe how this electronic literature search (and all other sources) task and the data analysis task were accomplished. Each subsection describes each phase in greater detail. The first subsection describes the electronic literature search strategy by identifying the search terms and how they were combined together by utilizing the logical operators of “or” and “AND”. The second subsection describes the implementation of the same electronic literature search strategy in each of the five electronic literature databases and all other sources. The third subsection describes the analysis of the identified research publications and publication-extracted records. The fourth subsection describes the results of the implemented literature search strategies for each of the five electronic literature databases and all other sources and how two or more electronic literature databases identified the same publications.
2.1. Development of the Literature Search Strategy
The aim of this literature review was to identify published research articles that evaluated the contribution of RS air pollution and greenness to stroke subtype occurrence and risk [23,24]. More specific information on the electronic literature database search strategy is in Table S1. The search strategy used search term subgroups. The first subgroup identified “RS” articles by utilizing search phrases for “remote sensing”, and “satellite” with the “OR” logical operator. The second subgroup identified “air pollution” articles by using the search phrases and abbreviations that included “air pollution”, “particulate matter”, “PM”, “coarse PM”, “PM10”, “fine PM”, “PM2.5”, ‘ultrafine PM”, “PM1”, “ozone”, “O3”, nitrogen dioxide, “NO2”, “sulfur dioxide”, “SO2”, “carbon dioxide”, “CO2”, “carbon monoxide”, and “CO”. The “OR” logical operator was also utilized to include all of the listed search terms in the “air pollution” subgroup. The third subgroup identified RS greenness research publications by utilizing “greenness”, “normative difference vegetation index”, “NDVI” “enhanced vegetation index”, and “EVI”. The various search terms in the “greenness” subgroup were included in the same search strategy by using the “OR” logical operator. The fourth subgroup identified the “stroke subtypes” by utilizing the terms for “cerebrovascular”, “hemorrhagic”, “ischemic”, and “stroke”. The four stroke subtype identifiers were also combined by using the “OR” logical operator.
The logical operator “AND” was used to combine the first “RS” subgroup and the second “air pollution” subgroup described above into the “RS air pollution” group. The “RS greenness” group was formed by combing the first (RS) subgroup and third (greenness) subgroup by also utilizing the “AND” logical operator.
In the last step of this electronic literature search strategy was to form two hierarchical groups, one for “RS air pollution and stroke subtype” and the other for “RS greenness and stroke subtype”. The “RS air pollution and stroke subtype” hierarchical group was formed by combining the “RS air pollution” group with the “stroke subtype” group by using the “AND” logical operator. The “RS greenness and stroke subtype” hierarchical group was formed by combing the “RS greenness” group with the “stroke subtype” group by utilizing the “AND” logical operator.
2.2. Implementation of the Literature Search Strategy
As was previously mentioned above, the five electronic literature databases were searched to identify the published research articles. There were differences in the implementation of the same literature search strategy with five of the electronic literature databases (PubMed Database, PMD; Embase, EB; Scopus, SC; Web of Science, WoS; Google Scholar, GS). For SC, EB and WoS, the same literature search terms were used to search the title, the abstract, and the keyword fields. Each of these three proprietary electronic literature databases also included suggested database-specific search terms and phrases, which were also used. With PMD, only the title and abstract search fields were utilized. The GS search options were limited in comparison to PMD, EB, SC, and WoS. GS searches were restricted to the use of two different subgroup search terms that were combined with the logical operator “AND”. Also, GS has fewer available options to evaluate the retrieved research publications than were available with PMD, EB, SC, and WoS. Interestingly, GS retrieved one unique research publication that was not identified by the other four electronic literature databases – PMD, EB, SC, and WoS, and all other sources, OTH. Another unexpected outcome was that GS retrieved all 99 of the selected research publications when the title of each previously identified research publication was entered in the search field. GS retrieved research publication sources included each Journal’s URL, and the PMD URL, but not any of the URLs of the three proprietary electronic literature databases, EB, SC, and WoS.
2.3. Analysis of Publications and Publication-Extracted Records
Prior to the analysis of the identified research publications and publication-extracted records, the author developed a data analysis strategy that included which variables should be extracted from each of the identified research publications. The variable list was based on the research questions that were included at the end of the Introduction. The next step involved developing a data dictionary. Once the data dictionary was developed, a dedicated electronic literature database was assembled. The Excel database included variables, both independent and outcome, in columns and unique research publications and publication-extracted records in rows. All analyses were completed by utilizing SAS software [38,39,40]. SAS Studio, the online version, was used to undertake all analyses [38]. Descriptive statistical analyses involved computing cell totals (percentages) for categorical variables, means and associated 95% Confidence Intervals (95% CIs) for continuous variables [38,39]. Inferential statistical analyses of categorical variables were accomplished by using the Chi-Square test when the expected cell totals were at least 5 [39]. When expected cell totals were <5 the Monte Carlo Estimate for the Exact Test was used as an equivalent replacement for the Chi-Square test [39,40].
2.4. Identified Research and Review Articles
Figure 1 displays, in descending order, the effectiveness of each of the five electronic literature databases and all other sources in identifying the final total of 99 research publications that met all of the inclusion criteria. For each electronic literature database and all other sources, Figure 1 includes the number (percent) for the final total of reviewed research publications: PMD, 95 (95.96%); SC 65 (65.66%); EB 56 (56.57%); WoS 13 (13.13%); and OTH 3 (3.03%). GS found one (1.01%) unique research publication which was not identified by PMD, EB, SC, WoS, and OTH sources.
The secondary objective was to also identify review articles that were relevant to this literature review. The sixth electronic literature database, Cochrane Database of Systematic Reviews (CSR), was searched using the search terms of “remote sensing”, “air pollution”, “greenness”, and “stroke” to identify “remote sensing air pollution and stroke” and “RS greenness and stroke” review publications. No literature review publication was identified after searching the CSR electronic literature database. The other five electronic literature databases identified 19 review articles. However, no review article included an analysis of either RS air pollution and stroke subtype or RS greenness and stroke subtype. Some of the review articles cited RS air pollution or AOD-air pollution and stroke subtype research publications, but did not evaluate differences by air pollution source, i.e., similarities and differences between on-the-ground ambient air monitor measurements and stroke subtype results versus ambient AOD-air pollution concentration level values and stroke subtype results, as was previously mentioned above [1,2,35]. The 19 review articles retrieved were not included in Figure 1 but are mentioned in the Figure 1 caption.
Figure 2 visually displays differences between the 99 research articles identified by the five electronic literature databases and OTH source. Figure 2A shows, in descending order, total research articles identified (TOT), stratified by RS type, air pollution (AP) and greenness (GRN). All five electronic literature databases and other sources identified more RS air pollution research publications than RS greenness research publications. Panel B displays the results for total publication-extracted records because each research publication contributed one or more records. As expected, based on the results in panel A for total research publications, there were more RS AP records than RS GRN records for each of the five electronic literature databases and OTH sources. Panel C illustrates the effectiveness of the five electronic literature databases and OTH sources in identifying all four stroke subtypes (TOT), and each stroke subtype (CRV, STK, ISC, HEM). There were differences between the five electronic literature databases and OTH sources on the number of stroke subtype records identified. PMD and SC identified more STK and ISC stroke subtype records and fewer CRV stroke subtype records. PMD also identified more HEM stroke than CRV stroke subtype records. EB identified more ISC stroke subtype records and fewer CRV stroke, STK, and HEM stroke records. WoS identified more STK subtype records than CRV stroke, ISC stroke and HEM stroke subtype records. Tables S2 and S3 contain inferential statistical analysis results of the descriptive statistical analysis results included in Figure 1 and Figure 2 above. Additional information about the implemented electronic literature database search strategy, analysis of the publications and publication-extracted records, and the results are in the Electronic Literature Search Summary supplementary file.
3.0. Results
These quantitative-qualitative electronic literature review findings will be presented in different sections. The primary objective will be to identify unique differences among the four stroke subtypes based on prior exposure to RS AP (AOD-air pollutants) and GRN (EVI, NDVI). Once stroke subgroup occurrence and risk factors have been identified and described, the next step will involve the development of a descriptive and explanatory stroke subtype physiologic mechanism model and the utilization of the model, with additional guidelines, in the design and implementation of population-based public health stroke subtype intervention programs [1,14,41,42].
3.1. Publication and Record Variable Attributes
This quantitative-qualitative electronic literature review identified 99 unique research publications and generated 343 publication-extracted records. Each publication contributed, on average, 3.46 records, with a minimum and a maximum of 1-21 records per unique research publication. Table 1 summarizes the publication and record differences by selected independent variables and associated outcome variables. The 99
unique research publications included a total of 7,555,646 stroke subtype study participants. Between 2019-2025 there were significantly more unique publications published (n=74, 74.75%) than were published between 2012-2018 (n=25, 25.25%). There were significantly more RS AP publications (n=88, 88.89%) than there were RS GRN publications (n=11, 11.11%). Most of the studies were completed in China (n=47, 47.47%); the United States accounted for the second-highest publication total (n=16, 16.16%); publications including multiple countries represented the third-highest total (n=9, 9.09%). There were significant differences among stroke subtype records: STK had the highest number of records (n=111, 32.36%), ISC stroke had the second highest (n=102, 29.74%), HEM stroke had the third highest (n=83, 24.20%), and CRV stroke had the fewest (n=47, 13.70%). With regards to record format, 73 (73.74%) of the research publications analyzed individual records, and 20 (20.20%) assessed concentration-response function (CRF) relationships between RS AP (ambient AOD-air pollution) and stroke subtype occurrence and risk. Significantly more publications utilized incidence (n=60, 60.61%) than prevalence (n=28, 28.28%) as an epidemiologic surveillance method. Significantly more publications utilized a cohort research design (Prospective: n=34, 34.34%; Retrospective: n=11, 11.11%) than another type of research design such as the case crossover (n=14, 14.14%) or cross sectional (n=8, 8.08%). Nineteen (19.19%) of the publications completed studies that were designed to evaluate a proposed hypothesis – the Physiologic Mechanism (PM) variable in the Introduction, and the remaining 80 (80.81%) did not assess a specific testable hypothesis – explanatory vs. descriptive study types, respectively. Significantly more publications utilized ambient AOD-air pollution as the method to evaluate RS air pollution (n=82, 82.83%) than some other method (n=16, 16.16%). Significantly more publications included ambient air monitors (n=79, 85.87%) than the number of publications that did not utilize ambient air monitors (n=11, 11.96%). Significantly more publications used address geocoding (n=40, 40.40%) than another method to identify the location of the residences of the study participants. With regards to environmental exposure duration, there were significantly more publications with one or more years (n=67, 67.68%) than less than one year (n=32, 32.32%). For all records, significantly higher outcomes (n=205, 59.77%) occurred most often, with significantly lower outcomes (n=28, 8.16%) occurring less often than the not significant outcomes (n=82, 23.91%).
3.2. Ambient AOD-Air Pollutant and RS Greenness Values and Accuracy Estimates
Table 2 summarizes publication-extracted record means and 95% CIs for the six ambient AOD- pollutants (with at least 10 records) and the two RS greenness analytical methods, EVI and NDVI. The mean ambient AOD-PM2.5 concentration level value was based on 165 (57.29%) records, the highest record total than any other ambient AOD-air pollutant. The ambient AOD-PM2.5 mean (95% CI) concentration level value was 32.8 (29.2-36.4) µg/m3. The mean (95% CI) accuracy estimate, computed as the percent of the square of the correlation coefficient (r2%) , was 75.1% (72.0%-78.2%). This r2% concordance statistic represents the percentage of the shared variance between the ambient AOD-PM2.5 concentration level values and the on-the-ground ambient PM2.5 monitor measurements. The mean ambient AOD-PM2.5 concentration level value is significantly higher than the US Environmental Protection Agency (US EPA) primary mean standard of 9.0 µg/m3 and the secondary mean standard of 15.0 µg/m3, because it includes ambient AOD-PM2.5 concentration level values from both economically developed countries such as the US and economically developing countries such as China. Recall that China contributed more ambient AOD-air pollution studies than the US, another country or 2+ countries. With fewer records (n=35, 12.15%), the ambient AOD-PM10 concentration level value mean (95% CI) of 68.1 (59.6-76.7) µg/m3, did not exceed the US EPA three-year PM10 mean standard of 150 µg/m3. Notice that the mean (95% CI) AOD-PM10 concordance statistic was significantly higher than the AOD-PM2.5 r2% value, which was 84.7% (82.1%-87.3%), because the AOD-PM10 r2% of 84.7% mean exceeded the AOD-PM2.5 r2% concordance 95% upper limit r2% value of 78.2% . Unlike the ambient AOD-air pollutants included in Table 2, the two RS greenness analytical methods did not provide the computed r2% statistic or another concordance statistic, which represents agreement between the reported RS EVI or NDVI values and on-the-ground measurements of the spatial coverage extent of living vegetation on the earth’s surface. However, some RS GRN publications utilized study-specific analytical procedures to quantify the agreement between the RS EVI and NDVI values and the extent of spatial coverage of living vegetation in the study area [22,43,44].
3.3. Concentration-Response Functions and Stroke Subtype Prevalence and Incidence Worldwide
The Global Burden of Disease (GBD) program and other programs that have the same or similar objectives utilize ambient AOD-air pollution technology to estimate the contribution of ambient air pollution values to different chronic diseases and other health outcomes including stroke subtypes [45,46,47,48,49,50]. Because indoor air pollution can also contribute to numerous chronic diseases and other health outcomes as well as to stroke subtype prevalence and incidence morbidity and mortality, the GBD program utilizes structured questionnaires to evaluate indoor pollution sources, such the use of solid fuel for meal preparation and indoor heat [45,46]. Some worldwide ambient AOD-air pollution concentration level values are computed by utilizing Bayesian statistical procedures which combine different ambient air pollution sources that can include ambient AOD satellite estimates, on-the-ground ambient monitor measurements, ambient air pollution point sources, incomplete combustion from personal and commercial vehicles, ecologic attributes, and weather variables, among others [50,51]. These ambient AOD-air pollution estimates are available for ambient particulates and ambient gases at spatial resolutions of 11 km2 at the equator [50,51]. Investigators worldwide have access to the ambient and indoor air pollution concentration level values as well as chronic disease and other health outcome data [45,46,47,48,49]. Researchers in economically developing and economically developed countries can utilize the pre-computed ambient AOD-air pollution concentration level values with the GBD chronic disease and health outcome multi-country data or country-specific chronic disease or health outcome data with previously developed CRFs to statistically estimate the contribution of ambient AOD-air pollution sources to stroke subtype occurrence and risk [47,48,52,53,54,55,56,57,58,59,60,61,62,63,64,65,66,67,68,69,70].
Because of the increase in the number of publications that have utilized GBD chronic diseases and other health outcome data and CRF products, especially within the last decade, a table summary was included in this electronic literature review because it represents another new development in the use of pre-processed, easily accessible and easily usable data sources that can be utilized to evaluate the contribution of ambient AOD-air pollution to multiple chronic diseases such as stroke subtypes. The results of these GBD and other similar research publications are summarized in Table 3 by AREA (country, first column). RS (ambient AOD-air pollutant), TYPE (stroke subtype), CRF (concentration-response function type and source), and a summary of study results (OUTCOMES). For multiple countries, in 2019 there 1,332,000 stroke deaths, as shown in the first row. Between 1990-2013 in the Republic of Korea (KR) there were 5,382 ISC stroke and 3,452 HEM stroke deaths. In Saudi Arabia (SA) stroke deaths increased from 554 in 1990, to 986 in 2010, and 1,056 in 2017. Other entries in Table 3 report on the contribution of ambient AOD-air pollution to stroke deaths, STK.
3.4. Significant Differences by Variable Outcomes
One advantage of the quantitative-qualitative analysis of ambient AOD-pollution and stroke subtype publication results is the use of inferential statistical tests to objectively define qualitative outcomes, such as non-significant differences, significantly higher adverse outcomes due to ambient AOD-air pollution, and significantly lower protective outcomes resulting from RS greenness exposure, EVI and NDVI. Table 4 presents these three statistical outcomes by selected grouping variables included in the results of the reviewed research publications [71,72,73,74,75,76,77,78,79,80,81,82,83,84,85,86,87,88,89,90,91,92,93,94,95,96,97,98,99,100,101,102,103,104,105,106,107,108,109,110,111,112,113,114,115,116,117,118,119,120,121,122]. Cell entries include total records, and the associated percentage in parentheses. Stroke Subtype was the first variable evaluated in Table 4. The Stroke Subtype by Outcome categorical analysis was significant. For the Stroke Subtype variable, the totals (percentages) for the significantly Higher Outcome category exceeded the totals (percentages) for the significantly Lower Outcome category and the totals (percentages) for the Not Significant (NS) Outcome category. While the Geocoding Specificity assessment was also significantly higher with 125 (54.59%) records geocoded to the study participants’ home address, the Spatial Resolution variable (<10 km2 vs. ≥10 km2) was not significant. There were other significant differences among the Outcome variable and the different ambient AOD-air pollutants. Except for ambient AOD-PM2.5-10, all other ambient AOD-air pollutant particulates and ambient AOD-O3 had higher totals and percentages in the significantly higher Outcome category than in the other two Outcome categories, with ambient AOD-PM2.5 contributing the highest number and percentage of records (n=88, 38.43%) to the significantly higher Outcome category compared to the other ambient AOD-particulate pollutants and ambient AOD-O3. The other significant outcome was for AOD-Air Pollutant Accuracy, which was assessed with the r2% statistic. For all ambient AOD-air pollutants, there were more total and percent of records in the significantly Higher category than the other two categories, with 102 (44.54%) of all records with r2% values that were at least 84.00% (44.54%).
3.5. Stroke Subtype and Risk Factors
The results in Table 5 make it possible to identify specific risk factor differences for each of the four stroke subtypes, ISC stroke, STK, HEM stroke, and CRV stroke. There were significant differences for each stroke subtype and the eight risk factors listed in the first column of Table 5, with all p’s≤0.01. A row analysis of the risk factors revealed that only Environmental, Other and Age were statistically significant. The Environmental risk factor included the most records (n=239, 54.92), Age had the fewest records (n=57, 9.52%) and the Other record total (n=90, 15.03%) was between these two statistically significant risk factors. A column analysis revealed stroke subtype differences. ISC stroke had the highest number (percent) of records (n=204, 34.06%), STK had the second highest total (n=198, 33.06%), HEM stroke had the third highest total (n=110, 18.36%), and CRV stroke that the lowest total (n=87, 14.52%). There were unique Risk Factor patterns for the four Stroke Subtype groups: ISC stroke included the highest number of records for the two significant risk factors, Environmental (n=122, 20.37%) and Age (n=21, 3.51%), but not for the Other risk factor. STK included the highest number of the Other risk factor (n=46, 7.68%), with ISC stroke showing the second-highest total (n=23, 3.84%) for the Other risk factor.
There were also significant differences between the four stroke subtypes and the eight risk factors. The first superscript letter, before the superscript comma in Table 5, next to each stroke subtype acronym identifies significant differences for each stroke subtype on the eight risk factors. All four stroke subtypes showed significant differences on the eight risk factors with all p’s≤0.01. Statistical results are reported using superscript letters to the right of the comma identify differences between each stroke subtype compared to every other stroke subtype on the eight risk factors. In this study, the presence of the same a-d superscript letter identifies significant differences between two-stroke subtype comparisons. Notice that STK was significantly different from HEM stroke (because of the presence of the same “a” superscript) and ISC stroke (because of the presence of the same “b” superscript). All other two-stroke subtype statistical comparisons were not significant with p’s>0.05. Interestingly, CRV stroke was not significantly different from STK, with p>0.05.
3.6. RS Greenness and Stroke Subtype
Table 6 includes results for the use of RS GRN technology to document decreases in stroke subtype mortality outcome and risk. This Table summarizes results for 17 research publications completed in eight countries: Australia (n=1), Belgium (n=1), Brazil (n=1), Canada (n=2), China (n=7), Spain (=1), Italy (n=1) and the United States (n=3). STK was the most often studied outcome (n=9), followed by ISC stroke (n=6), HEM stroke (n=5) and CRV stroke (n=4) [43,44,123,124,125,126,127,128,129]. Some publications evaluated more than one stroke subtype: a) HEM stroke and ISC stroke in China; b) HEM stroke, ISC stroke, and STK in China; c) CRV stroke and STK in Italy. Sixteen of the 17 publications found significant decreases in the stroke subtype outcome and risk due to increased exposure to RS greenness. Only the Belgium (BE) publication [43] reported a non-significant difference between higher NDVI greenness values and CRV stroke mortality. Some of these RS greenness and stroke subtype studies controlled for confounders that included SES and ambient AOD-air pollutants, e.g., the two Canadian studies [18,19].
3.7. Physiologic Mechanisms and Stroke Subtypes
Physiologic mechanisms mentioned in the Introduction and in the Discussion of the reviewed research published studies were also evaluated. The results of these analyses for both the Introduction and Discussion are included in Table S4 and for the Discussion only in Table 7. The results of both analyses are similar except that there were fewer records in the OTH category in Table S4 (n=41, 12.20%) than in the OTH category in Table 7 (n=94, 27.98%). Both Table S4 and Table 7 had the same total number of records, n=336 (100.00%). However, while the two tables differed in totals (percentages) for each of the eight single and multiple descriptive physiologic mechanism categories, they included similar statistical outcomes – the qualitative outcomes that were based on the inferential statistical analyses that utilized a statistical test. Because of this latter reason, only the results in Table 7 will be described in detail below.
There were also significant differences among the single and multiple physiologic mechanisms mentioned in the Discussion. In the physiologic mechanism row analyses, only two single (IN, OTH) and one multiple (IN-OS) physiologic mechanisms were significantly different among the four stroke subtypes, with all p’s≤0.01. Record totals (percents) were highest for IN-OS (n=110, 32.74%), second highest for OTH (n=94, 27.98%), and third highest for IN (n=65, 19.35%). The ISC stroke subtype had the highest totals (percents) for IN (n=28, 8.33%) and IN-OS (n=35, 10.42%) physiologic mechanisms. The STK subtype had the highest total (percent) of the OTH (n=36, 10.71%) physiologic mechanism.
Each of the four stroke subtypes were significantly different on the single (IM, IN, OS, OTH) and multiple (IM-IN, IM-IN-OS, IM-OS, IN-OS) physiologic mechanisms, with all p’s≤0.01. The CRV stroke subtype was significantly different from the HEM stroke subtype and the ISC stroke subtype on the eight physiologic mechanism categories, with all p’s≤0.05. The STK subtype was also significantly different from the HEM stroke subtype and the ISC stroke subtype on the different physiologic mechanism categories, with all p’s≤0.05. However, the CRV stroke versus the STK comparison was not significantly different, with p>0.05.
These results suggest that CRV stroke and STK may resemble each other on the IN (both had lower totals and percentages) and the OTH (both had higher totals and percentages) physiologic mechanisms but may differ from each other on the IN-OS physiologic mechanism (higher for STK and lower for CRV). A similar analysis suggests that ISC stroke and HEM stroke subtypes differ from each other (IN lower for HEM and higher for ISC) but resemble each other on the IN-OS (bother higher) physiologic mechanisms. Notice the STK had the same total (percent) of 32 (9.52%) for IN-OS as did HEM stroke (n=32, 9.52%).
3.8. Descriptive-Explanatory and Stroke Subtype Physiologic Mechanism Differences
Content analysis of the Introduction and Discussion of reviewed published research studies on the contribution of ambient AOD-particulates, ambient AOD-gases, and RS EVI and NDVI to stroke subtype occurrence and risk documented the use of different physiologic mechanisms. The physiological mechanisms mentioned were OS, IN, IM, OTH, and two or more combinations of the first three, e.g., IN-OS, IM-IN-OS. When these physiologic mechanisms were only mentioned in the Discussion, and not in the Introduction of the reviewed published studies, they were used as descriptors of the study’s results. That is, the physiologic mechanisms were used to describe post hoc the obtained results. Other evaluated research publications mentioned the physiologic mechanisms in both the Introduction and in the Discussion and included the use of a study designs that permitted the investigators to a priori evaluate physiologic mechanism scientific hypotheses. That is, the new information generated by these hypothesis testing study designs explain the results more thoroughly than the results themselves may suggest. The distinction between descriptive and explanatory physiologic mechanisms is important to applied public health studies and research public health studies, respectively. Applied environmental public health studies can utilize descriptive physiologic mechanisms to develop and implement population-based stroke subtype intervention programs. Research oriented environmental public health studies can use explanatory physiologic mechanisms to undertake hypothesis testing investigations that can increase our understanding of the importance of physiologic mechanisms in mediating the adverse effect of ambient AOD-air pollutants in the increased occurrence of stroke subtype outcome and risk and the protective effects of RS greenness to the decreased occurrence of stroke outcome and risk.
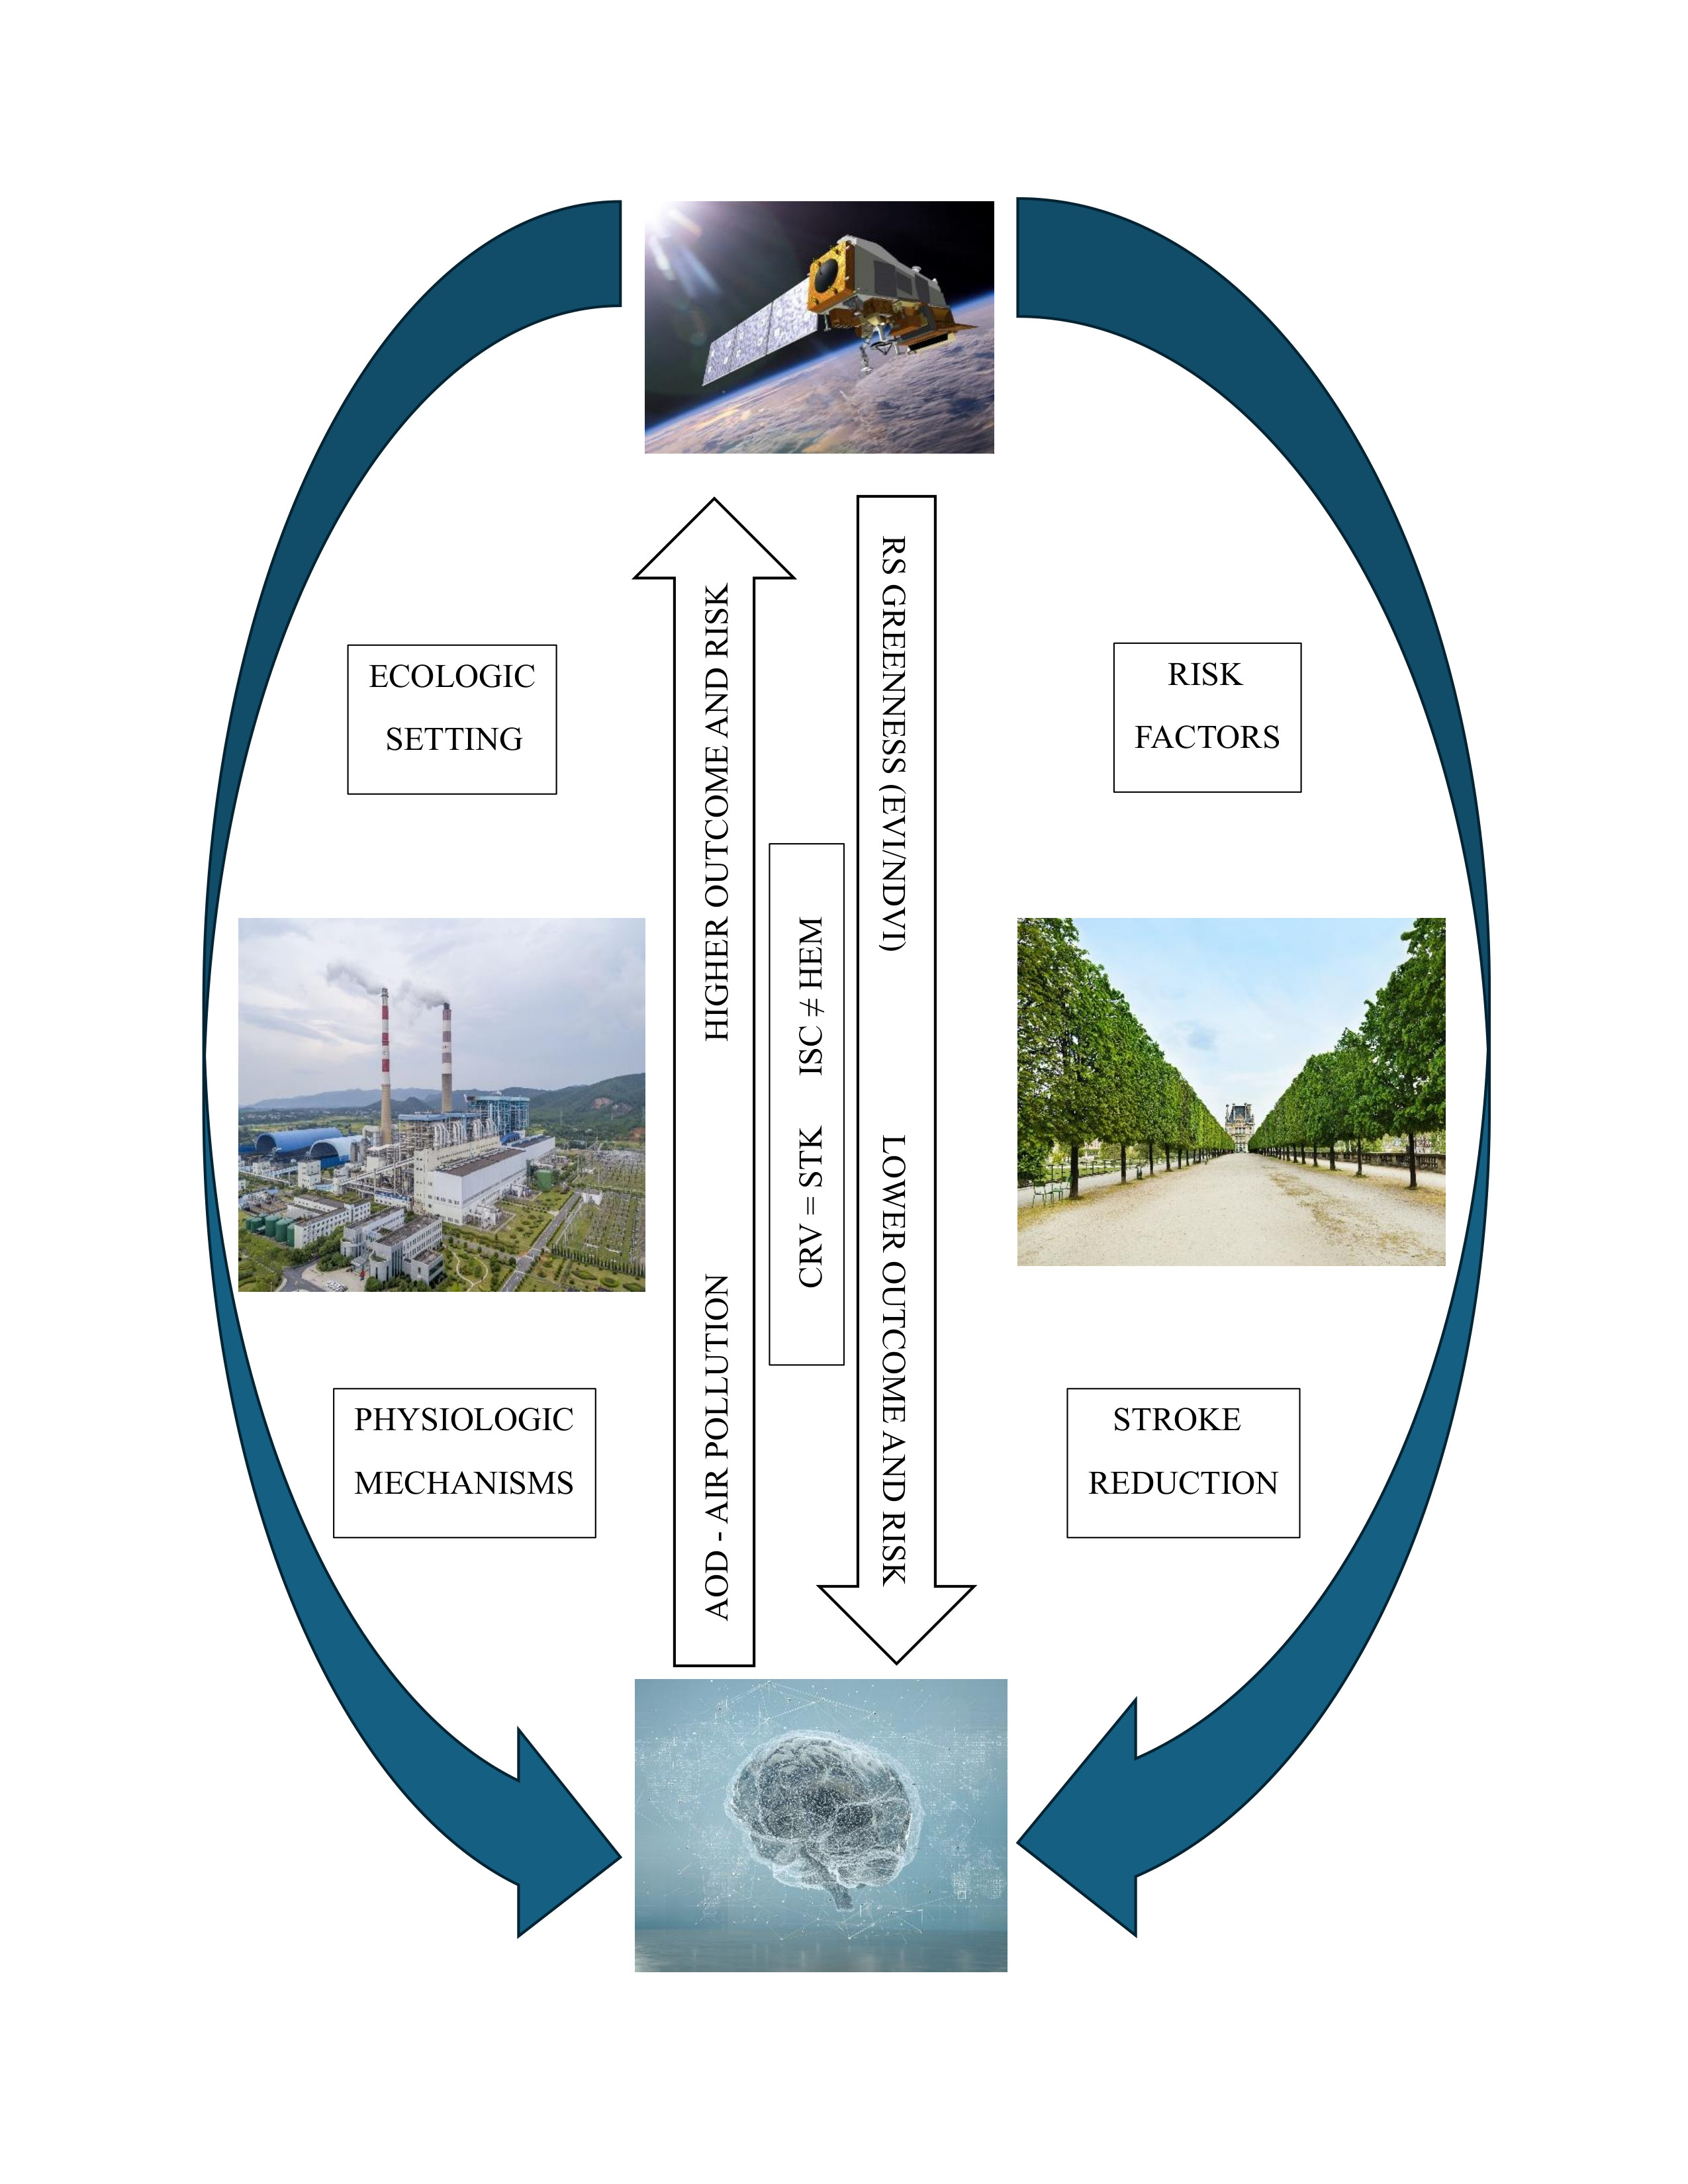
Figure 3 includes the sequential stages that should be considered by a descriptive and explanatory stroke subtype physiological mechanism model. Both stroke subtype physiologic mechanism models emphasize the importance of the ecologic setting as a contributor to stroke subtype occurrence and risk. At a minimum, the ecologic setting includes descriptions of ambient AOD-air pollution concentration level values, RS EVI and NDVI spatial coverage extent on the earth’s surface, indoor air pollution, and air pollution in the workplace. The possible use of the descriptive stroke subtype physiologic mechanism model in applied public health studies is illustrated in Figure 3A, and the use of the explanatory stroke subtype physiologic mechanism model in research public health studies is shown Figure 3B. All eight segments are the same in both panels. The difference is in the sequence of the occurrence of the “physiologic mechanism” segment in the two panels. The physiologic mechanism segment is last in panel A (descriptive), and first in Panel B (explanatory). Because of readability limitations due to the use of minimum font size in Figure 3, it was not possible to include all bullet items for each of the eight segments. Additional bullets for each segment, with an accompanying detailed description, are in Table S5.
Applied public health studies that have the aim of developing a population-based stroke subtype intervention program should first evaluate each of the eight segments in Figure 3A. The first segment identifies Pollutants, the four pollution sources – ambient AOD-air pollution (i.e., ambient AOD-particulates and ambient AOD gases), ecologic, occupational and indoor. Once the specific type of pollutant is selected, it is then possible to move to the second segment, Exposure Route – mouth, nose, olfactory tract, and ingestion. Exposure route(s) should be selected by also considering the Stroke Subtype (seventh segment). The third segment lists three organs – lungs, heart and brain. All four stroke subtypes involve the brain. The importance of the heart may differ based on stroke subtype, such as ischemic stroke vs. hemorrhagic stroke, with blood vessel rupture for the latter stoke subtype may be more important because of tachycardia. Because fine particulates can translocate lung tissue and enter the circulatory system, IN may contribute to vessel weakness followed by vessel rupture (also refer to the fourth segment, Dispersion). Specific pathophysiologic mechanisms are enumerated in the fifth segment, Pathophysiology. Atherosclerosis and vessel wall constriction could be important contributors to the occurrence of the ISC stroke subtype. Vessel wall weakness (Table S5) and vessel wall rupture could be relevant contributors to HEM stroke subtype occurrence and risk. The sixth segment illustrates different Risk Factors. The identified risk factors can contribute to increased stroke subtype occurrence and risk or can be protective by lowering stroke subtype occurrence and risk. Age extremes, lower educational attainment and limited economic resources can contribute to increased stroke subtype occurrence and risk. Increases in RS EVI and NDVI values (greenness) can mitigate stroke subtype occurrence and risk. Results from this quantitative-qualitative literature review demonstrated the unique associations between risk factors and stroke subtype occurrence and risk. Interestingly, no unique risk factor was identified for CRV stroke. Applied public health studies should also consider the inclusion of descriptive Physiologic Mechanisms, the last segment in Figure 3A, in the development of population-based stroke subtype intervention programs. One reason is to mesh results from applied public health studies with the findings reported by research public health studies. Another advantage is to conceptually link results from applied public health studies with the findings generated by research public health studies. This type of sharing of applied and research findings may contribute to the development of more effective population-based stroke subtype intervention programs.
Research public health studies should also consider the eight segments in Figure 3B, with specific bullets for each segment, in the design of investigations that have the objective of advancing our current understanding of stroke subtype physiologic mechanisms. The basis for this suggestion is that the seven other segments that follow the physiologic mechanism initial segment should be considered as comprising a final check on the inclusion of all essential study design variables and outcome measures associated with explanatory physiologic mechanisms. Research public health studies that aim to increase our understanding of stroke subtype physiologic mechanisms should also consider how the new information about explanatory physiologic mechanisms can be utilized by their applied public health colleagues who want to develop more effective population-based stroke subtype intervention programs.
3.9. Stroke Subtype Intervention Programs
Table 8 includes additional suggestions on the development and implementation of population-based stroke subtype intervention programs. The content of Table 8 is organized into four stages. The first one involves the Development Stage. The are eight items to consider in the development of an applied population-based stroke subtype invention program. Many of these items were also included in Figure 3A. The last two items in the Development Stage are different. They include Resources and Objectives. The second stage, Implementation, includes five items. These five items should be considered as a final review of issues that may contribute to the implementation of a successful population-based stroke subtype intervention program. The three items in the Evaluation Stage become important once the population-based stroke subtype intervention program has ended. The first item involves the use of descriptive and inferential statistical tests to confirm the stroke subtype intervention program’s factually confirmed accomplishments – lowering the occurrence and risk of stroke subtype morbidity and mortality occurrence and risk. The second item is a confirmation that the stroke subtype intervention program’s accomplishments are congruent with the results of other applied and research results in the published literature. An often overlooked milestone is the identification of new findings. It is important to demonstrate the utility of new, and previously untested methods, which, hopefully, can contribute to the lowering stroke subtype occurrence and risk. Finally, the importance of the Dissemination Stage should not be underestimated. Applied public health researchers have a professional obligation to inform study participants and persons residing in the study area about the stroke subtype intervention program’s results, and the importance of the results to the reduction of stroke subtype occurrence and risk. Another professional obligation involves sharing the intervention program’s accomplishments with other scientists by making presentations at scientific conferences and publishing the results in scientific journals.
4.0. Discussion
This quantitative-qualitative literature review of the contribution of RS ambient air pollution and greenness to stroke subtype occurrence and risk has identified new factual information on the accuracy of this expanding satellite-based methodology, risk factors and physiologic mechanisms. The r2% mean statistical estimates, which quantify the concordance between an ambient AOD-air pollutants concentration level values and on-the-ground ambient monitor measurements, were 75.1% for AOD-PM2.5 and 84.7% for AOD-PM10. Some research publications included in this quantitative-qualitative literature review reported AOD-PM2.5 r2% statistical values that exceeded 90% [5,6,77,116]. Statistical analyses of publication-extracted records showed significant adverse outcomes of ambient AOD-PM2.5 and other ambient AOD-pollutants, which included ambient particulates and gases, to increased stroke subtype occurrence and risk. The record-level risk factor analysis demonstrated, for the first time, the unique association between risk factors and stroke subtype occurrence and risk. Environmental, Age and Other (to be identified in subsequent investigations) risk factors contributed to each of the four stroke subtypes, with greater contributions of Environmental (n=329 records, 54.92%) and Age (n=57 records, 9.52%) to ISC stroke and Other risk factors (n=46 records, 7.68%) to STK. Analysis of physiologic mechanisms mentioned in the Discussion of the reviewed publications identified, also for the first time, unique patterns of single and multiple physiologic mechanisms with specific stroke subtypes. IN (n=28 records, 8.33%) and IN-OS (n=35 records, 10.42%) physiological mechanisms were most often used to describe ISC stroke while the OTH (n=36 records, 10.71%) physiologic mechanism was most often associated with STK. Based on these and other identified quantitative-qualitative results it was possible to develop a descriptive and explanatory stroke subtype physiologic mechanism model. This model includes ambient AOD-air pollutants and other pollution sources occurring within the ecologic setting – the totality of the study participants’ residences, workplaces and where leisure activities occur. Another unique contribution of the model is its role in contributing to the development and implementation of population-based stroke subtype intervention programs. The seven objectives of this quantitative-qualitative literature review were presented as scientific questions in the Introduction. Now, each one will be considered in greater detail and in separate sections below. Each section’s aim will be to summarize the new information that was generated by this quantitative-qualitative literature review which contributes to our increased understanding of the four stroke subtypes: cerebrovascular, stroke, ischemic and hemorrhagic.
The purpose of the first scientific question was to statistically evaluate changes in the publication year interval of the 99 reviewed research publications that were published between 2012-2025. This analysis demonstrated significant increases over time, from 25 (25.25%) in 2012-2018 to 74 (74.75%) in 2019-2025. One reason for this significant increase over time could be the scientific community’s increased awareness and familiarity with the freely available, preformatted and statistically evaluated ambient AOD-air pollution datasets that can include results and other data analysis health outcome resources for single and multiple countries. Another literature review of the contribution of RS greenness to stroke and ischemic stroke reported that all 27 reviewed publications were published between 2008-2023: two before 2013, 12 between 2013-2019 and 13 between 2020-2023 [14].
The second and third scientific questions concerned whether ambient AOD-air pollution exposure adversely and significantly impacted stroke subtype occurrence and risk and if RS greenness significantly decreased stroke subtype occurrence and risk. Results summarized in Table 3 demonstrated significant positive associations between higher ambient AOD-air pollution exposure and increased stroke subtype occurrence and risk. The fact that there were significant differences, even with methodological heterogeneity among different research publications, suggests that higher ambient AOD-air pollution exposure is a robust contributor to increased stroke subtype occurrence and risk. In addition, Table 6 results also demonstrated that RS greenness contributed to decreased stroke subtype occurrence and risk in 16 of the research publications. The importance of these two outcomes is that stroke subtype occurrence and risk mitigation can occur through the concurrent reduction in ambient AOD-air pollution concentration level values and by increasing spatial coverage of the most appropriate species of living vegetation, particularly trees with larger leaf areas that can absorb ambient air pollutants, on the earth’s surface [14,130].
Differences between risk factors and stroke subtype was the focus of the fourth scientific question. Record-level analyses on this topic were included in Table 5. Each of the four stroke subtypes was significantly different on the eight risk factors. Among all of the risk factors, STK was significantly different from ISC stroke and HEM stroke, but not significantly different from CRV stroke. These results suggest, again for the first time, that STK and CRV stroke occurrence and risk may be influenced by similar risk factors, while different combination of risk factors may influence ISC stroke and HEM stroke occurrence and risk. Results in Table 7 demonstrated that environmental risk factors were mentioned more often than any one of the other seven risk factors, and environmental risk factors occurred more often among the four stroke subtypes – ISC stroke, STK, HEM stroke and CRV stroke. Another review also identified environmental risk factors – ambient air pollutants, ambient temperature, and barometric pressure as important contributors to HEM stroke [28]. Environmental exposure to lead, cadmium and arsenic in the ecologic setting also results in higher stroke occurrence and risk [32].
With regards to the fifth scientific question, the individual and multiple combinations of the four physiologic mechanisms differ between the four stroke subtypes. Descriptive physiologic mechanisms for the four stroke subtypes, as reported in the Discussion of the reviewed research publications, are summarized in Table 7. The STK subtype was significantly different from the ISC stroke and HEM stroke subtypes but did not differ significantly from the CRV stroke subtype. The CRV stroke subtype was also significantly different from HEM stroke and ISC stroke. In addition, HEM stroke and ISC stroke were not significantly different from each other on the single and multiple physiologic mechanisms of IM, IN, OS and OTH. These results suggest that similar physiologic mechanisms may be involved in the occurrence of CRV stroke and STK [27,30,31,33,37]. Table 7 also showed that IN-OS occurred with a similar frequency among ISC stroke (n=35 mentions, 10.42%) and HEM stroke (n=32, 9.52%). IN occurrence frequency was highest for ISC stroke (n=28 mentions, 8.33%) and second highest for HEM stroke (n=18 mentions, 5.36%). A recent publication documented the presence of cerebral microbleeds in the brains of hypertensive rats who were exposed to real-world ambient PM2.5 level of 59.2 µg/m3 for one year [131]. Coincidentally, the residents in in the Tongzhou District, Beijing, China, were exposed to the same ambient PM2.5 level that was used to expose the hypertensive rats who later developed cerebral microbleeds. This publication did not mention if the residents in the Tongzhou District, Beijing, China also had a higher prevalence of cerebral microbleeds, HEM stroke or another stroke subtype. The proposed mechanisms, based on the results of this laboratory study, implicated ambient PM2.5 produced cerebral microbleeds resulting from, in part, the presence of reactive oxygen species (ROS), OS and IN. To summarize, these three physiologic mechanisms of ROS, OS and IN may also indirectly contribute to the occurrence of cerebral microbleeds in residents in the Tongzhou District, Beijing, China, and participate in a pathophysiologic processes that begin with the occurrence of internal vascular stress on the interior walls of cerebral blood vessels and progresses, over time, to the rupture of the same cerebral blood vessels, especially in the presence of hypertension.
The sixth and seventh scientific questions dealt with the development of a descriptive and explanatory stroke subtype physiologic mechanism model and the use of this model in the development and implementation of population-based stroke subtype mitigation programs. As was shown in Figure 3 and Table S5, procedurally, the two physiologic mechanism models only differ from each other on how and when the four single and multiple physiologic mechanisms of ROS, IM, IN, OS, and OTH are implemented in the manifestation of a stroke subtype. For the descriptive physiologic mechanism model, the four physiologic mechanisms, occurring singly or in combination, are used as additional attributes to characterize the obtained results, i.e., post-hoc. Additional suggestions on the use of the descriptive stroke subtype physiologic mechanism model in the design and implementation of stroke subtype public health intervention programs were included in Table 8. The explanatory physiologic mechanism model requires that the research study design involves the” a priori evaluation of one or more physiologic mechanisms. Another difference between the descriptive and explanatory stroke subtype physiologic mechanism models involves the use of the descriptive stroke subtype physiologic mechanism model in applied environmental health epidemiologic studies, while the explanatory stroke subtype physiologic mechanism model is utilized in research environmental health epidemiologic studies. Unlike applied environmental health epidemiologic studies that can make unique and important contributions to lowering stroke subtype morbidity and mortality occurrence and risk, research epidemiologic studies can make other unique and important contributions by increasing our understanding of existing and new physiologic mechanisms that function as mediators between the exposure to the adverse effects of higher ambient AOD-air pollution concentration level values and the protective effects of greater RS greenness spatial coverage on the earth’s surface on the subsequent occurrence of increased or decreased stroke subtype occurrence and risk, respectively [14,30,31].
An additional unexpected contribution of this literature review was the analytical results that described the relative success of the five electronic literature databases in identifying the same 99 research publications. PMD, SC, EB, WoS and GS differed in their identification of the same unique research studies as well as in the identification of the same subset of research studies by two or more electronic literature databases. PMD identified the highest total of research studies while GS scholar identified one unique publication that was not retrieved by the other four electronic literature databases – PMD, SC, EB and WoS.. As an additional assessment of GS’s ability to identify specialized RS environmental health publications, the titles of the 99 research studies selected and reviewed were entered in the GS search window. Google identified all 99 published research studies through the correct reporting of the Journal’s online website and the PMD website, but not the websites of the other three proprietary electronic literature databases, SC, EB, and WoS. Limitations in the use of GS as a freely accessible Internet resource to find specialized RS environmental public health published studies include restrictions in completing abstract and keyword searches. One advantage of the three proprietary electronic literature databases is the built-in capability to conduct keyword, title, abstract searches, and to offer suggestions on the use of alternative keywords in the electronic literature database searches. One limitation shared by all five electronic literature databases is the absence of predefined search terms for RS environmental health specialty areas such as AOD-air pollutants, RS greenness and stroke subtypes.
Based on the search results generated by the five electronic literature databases and other sources, this is the first literature review to evaluate the contribution of ambient AOD-air pollution and RS greenness to stroke subtype occurrence and risk. Another unique contribution of this work is the use of the quantitative-qualitative method to evaluate the content of the reviewed research publications. Specific attributes included in the Methods and Results sections of the reviewed studies were entered as single and multiple records in a dedicated Excel literature database file, and the entered information was subsequently statistically evaluated by utilizing SAS software [23,24]. This quantitative-qualitative literature review procedure permits the evaluation of multiple predictor and outcome variables. Results from the current quantitative-qualitative literature review, as well as previously completed quantitative-qualitative literature reviews on ambient AOD-air pollutants on the cardiovascular and respiratory systems, provide empirical evidence of the improved accuracy of ambient AOD-air pollutant concentration level values relative to on-the-ground air pollutant monitor measurements [23,24]. Unfortunately, at this time, it is not a common practice to also evaluate the accuracy of RS greenness readings with on-the-ground vegetation or tree canopy measurements, in a similar standardized manner.
One limitation of this literature review concerns the limitations in identifying research publications that were published in other non-English languages, even with the use of translation software such as Google Translate. For this reason, it is possible that some research studies published in another non-English language were not identified by the implemented literature review or were published after the current literature review search was completed in August 2025. A second limitation is that this quantitative-qualitative literature review method cannot be used to evaluate outcomes with few research publication-extracted records. Under these circumstances, the extracted records can be evaluated with traditional descriptive procedures, but not with inferential statistical procedures. Recent improvements in the implementation of Bayesian statistical analytical methods make it possible to use the Chi-Square test even when the expected cell totals are <5. A third limitation in any literature review is that professional and personal interests and preferences of the scientist can influence the entire literature review process, starting with the formulation of study objectives, specifying literature search criteria, evaluation of the results, and including the interpretation of the available statistical evidence. While the quantitative-qualitative literature review method can lower this type of professional-personal bias through the objective-qualitative assessment of record-level information, even this new method has limitations.
5. Conclusions
The increase in the number of research publications that evaluated the contribution of ambient AOD-air pollutants and RS greenness on stroke subtype occurrence and risk occurred between 2012-2025 occurred because of the scientific community’s increased familiarity with an easily accessible and usable methodology that can be used in environmental public health research studies. Risk factor analyses differentiated, for the first time, functional differences between ISC stroke and HEM stroke from STK, and identified similarities between CRV stroke and STK. A content analysis of the mention of physiologic mechanisms in reviewed research studies provided estimates, also for the first time, on the use of single and multiple physiologic mechanisms of IM, IN, OS and OTH in the interpretation of the adverse effects of ambient AOD-air pollution exposure and the protective effects of increased RS greenness to higher and lower stroke subtype occurrence and risk, respectively. The descriptive stroke subtype physiologic mechanism model can be used in applied epidemiologic studies that develop and implement population-based stroke subtype intervention programs.
6. Future Directions
The new information included in this quantitative-qualitative literature review provides a basis to increase our current understanding of the importance of the ecologic setting and risk factors in changing the relationship between environmental exposure-health outcome associations that involve ambient AOD-air pollutants and RS greenness and stroke subtype occurrence and risk. Ambient AOD-air pollution concentration level values reported in specific research publications are starting to accurately estimate on-the-ground monitor measurements. These incremental improvements in the accuracy of ambient AOD-air pollution concentration level values should continue in the future. Similar efforts that have been devoted to the improvement of ambient AOD-air pollution accuracy should be directed towards demonstrating that RS greenness EVI and NDVI values accurately reflect the spatial coverage extent of living vegetation on the earth’s surface. Both of these RS air pollution and greenness values should be important tools in research and applied environmental health investigations. The introduced stroke subtype physiologic mechanism model can be used to design research focused epidemiologic studies that promise to advance our understanding of physiologic mechanisms and to use the model in applied epidemiologic studies that design and implement population-based stroke intervention programs. RS greenness provides a complimentary methodology to the reduction of ambient AOD-air pollution level values in population-based stroke intervention programs. Modification of stroke-subtype risk factors is a third way to further decrease stroke subtype occurrence and risk within the context of population-based stroke intervention programs.
Supplementary Materials
The following supporting information can be downloaded at the website of this paper posted on Preprints.org. Supplementary File Table of Contents; Text File 1: Electronic Literature Search Summary – Descriptive and Inferential Statistical Analyses of the Contribution of Remote Sensing Air Pollution and Greenness to Changes in Stroke Subtype Occurrence and Risk; Table S1: Description of the Implemented Electronic Literature Search Strategy that was Used to Identify Published Research Articles on the Contribution of Remote Sensing Air Pollution and Greenness to Changes in Stroke Subtype Occurrence and Risk; Table S2: Totals and Percentages of Remote Sensing Air Pollution and Greenness Research Publications and Publication-Extracted Stroke Subtype Records by Source; Table S3: Totals and Percentages of Remote Sensing Air Pollution and Greenness Research Publications and Publication-Extracted Stroke Subtype Records by Source; Table S4: Totals and Percentages of Single and Multiple Physiologic Mechanisms in the Introduction and the Discussion of Publication-Extracted Records by Stroke Subtype; Table S5: Descriptive Stroke Subtype Physiologic Mechanism Model.
Funding
This research received no external funding.
Institutional Review Board Statement
Not applicable.
Informed Consent Statement
Not applicable.
Data Availability Statement
The data presented in this study are available on request from the author.
Acknowledgments
Sherryll M. Braggio, Vice President and Director of Human Resources, Diablo Analytical Institute, Walnut Creek, CA, USA, reviewed the manuscript.
Conflicts of Interest
The author declares he has no conflicts of interest.
References
- Liu, Q.; Yang, S.; Chen, H. Global trends and hotspots in the study of the effects of PM2.5 on ischemic stroke. Journal of Health, Population and Nutrition 2024, 43, 133. [Google Scholar] [CrossRef] [PubMed]
- Sogno, P.; Traidl-Hoffmann, C.; Kuenzer, C. Earth Observation Data Supporting Non-Communicable Disease Research: A Review. Remote Sensing 2020, 12, 2541. [Google Scholar] [CrossRef]
- Crouse, D.L.; Peters, P.A.; van Donkelaar, A.; Goldberg, M.S.; Villeneuve, P.J.; Brion, O.; Khan, S.; Atari, D.O.; Jerrett, M.; Pope, C.A.; et al. Risk of nonaccidental and cardiovascular mortality in relation to long-term exposure to low concentrations of fine particulate matter: a Canadian national-level cohort study. Environmental health perspectives 2012, 120, 708–714. [Google Scholar] [CrossRef] [PubMed]
- Kloog, I.; Coull, B.A.; Zanobetti, A.; Koutrakis, P.; Schwartz, J.D. Acute and chronic effects of particles on hospital admissions in New-England. PLoS One 2012, 7, e34664. [Google Scholar] [CrossRef]
- Cai, M.; Lin, X.; Wang, X.; Zhang, S.; Qian, Z.; McMillin, S.E.; Aaron, H.E.; Lin, H.; Wei, J.; Zhang, Z.; et al. Ambient particulate matter pollution of different sizes associated with recurrent stroke hospitalization in China: A cohort study of 1.07 million stroke patients. Science of The Total Environment 2023, 856, 159104. [Google Scholar] [CrossRef]
- Chen, S.; Lin, X.; Du, Z.; Zhang, Y.; Zheng, L.; Ju, X.; Guo, T.; Wang, X.; Chen, L.; Jiang, J.; et al. Potential causal links between long-term ambient particulate matter exposure and cerebrovascular mortality: Insights from a large cohort in southern China. Environmental pollution (Barking, Essex: 1987) 2023, 328, 121336. [Google Scholar] [CrossRef]
- Chen, S.; Zhang, Y.; Wang, Y.; Lawrence, W.R.; Rhee, J.; Guo, T.; Chen, S.; Du, Z.; Wu, W.; Li, Z.; et al. Long-term particulate matter exposure and the risk of neurological hospitalization: Evidence from causal inference of a large longitudinal cohort in South China. Chemosphere 2023, 345, 140397. [Google Scholar] [CrossRef]
- Jiang, D.; Wang, L.; Han, X.; Pan, Z.; Wang, Z.; Wang, Y.; Li, J.; Guo, J.; Liu, Y.; Huang, S.; et al. Short-term effects of ambient oxidation, and its interaction with fine particles on first-ever stroke: A national case-crossover study in China. Science of The Total Environment 2024, 907, 168017. [Google Scholar] [CrossRef]
- Li, M.; Edgell, R.C.; Wei, J.; Li, H.; Qian, Z.; Feng, J.; Tian, F.; Wang, X.; Xin, Q.; Cai, M.; et al. Air pollution and stroke hospitalization in the Beibu Gulf Region of China: A case-crossover analysis. Ecotoxicology and environmental safety 2023, 255, 114814. [Google Scholar] [CrossRef]
- Li, W.; Tian, A.; Shi, Y.; Chen, B.; Ji, R.; Ge, J.; Su, X.; Pu, B.; Lei, L.; Ma, R.; et al. Associations of long-term fine particulate matter exposure with all-cause and cause-specific mortality: results from the ChinaHEART project. The Lancet Regional Health – Western Pacific 2023, 41. [Google Scholar] [CrossRef]
- Xu, R.; Wang, Q.; Wei, J.; Lu, W.; Wang, R.; Liu, T.; Wang, Y.; Fan, Z.; Li, Y.; Xu, L.; et al. Association of short-term exposure to ambient air pollution with mortality from ischemic and hemorrhagic stroke. Eur J Neurol 2022, 29, 1994–2005. [Google Scholar] [CrossRef]
- Braggio, J.T.; Hall, E.S.; Weber, S.A.; Huff, A.K. Contribution of Satellite-Derived Aerosol Optical Depth PM2.5 Bayesian Concentration Surfaces to Respiratory-Cardiovascular Chronic Disease Hospitalizations in Baltimore, Maryland. Atmosphere (Basel) 2020, 11, 209. [Google Scholar] [CrossRef] [PubMed]
- Nabizadeh, R.; Yousefian, F.; Moghadam, V.K.; Hadei, M. Characteristics of cohort studies of long-term exposure to PM(2.5): a systematic review. Environmental science and pollution research international 2019, 26, 30755–30771. [Google Scholar] [CrossRef] [PubMed]
- Whyte, M.; Douwes, J.; Ranta, A. Green space and stroke: A scoping review of the evidence. J Neurol Sci 2024, 457, 122870. [Google Scholar] [CrossRef] [PubMed]
- Carver, A.; Beare, R.; Knibbs, L.D.; Mavoa, S.; Grocott, K.; Wheeler, A.J.; Srikanth, V.; Andrew, N.E. Exploring associations of greenery, air pollution and walkability with cardiometabolic health in people at midlife and beyond. Geriatr Gerontol Int 2024, 24 Suppl 1, 208–214. [Google Scholar] [CrossRef]
- Silveira, I.H.D.; Junger, W.L. Green spaces and mortality due to cardiovascular diseases in the city of Rio de Janeiro. Rev Saude Publica 2018, 52, 49. [Google Scholar] [CrossRef]
- Riggs, D.W.; Baumgartner, K.B.; Baumgartner, R.; Boone, S.; Judd, S.E.; Bhatnagar, A. Association Between Residential Greenness and Risk of Stroke by Ecoregions: The REGARDS Study. Journal of the American Heart Association 2025, 14, e037866. [Google Scholar] [CrossRef]
- Paul, L.A.; Hystad, P.; Burnett, R.T.; Kwong, J.C.; Crouse, D.L.; van Donkelaar, A.; Tu, K.; Lavigne, E.; Copes, R.; Martin, R.V.; et al. Urban green space and the risks of dementia and stroke. Environ Res 2020, 186, 109520. [Google Scholar] [CrossRef]
- Crouse, D.L.; Pinault, L.; Balram, A.; Hystad, P.; Peters, P.A.; Chen, H.; van Donkelaar, A.; Martin, R.V.; Ménard, R.; Robichaud, A.; et al. Urban greenness and mortality in Canada's largest cities: a national cohort study. Lancet Planet Health 2017, 1, e289–e297. [Google Scholar] [CrossRef]
- Vivanco-Hidalgo, R.M.; Avellaneda-Gómez, C.; Dadvand, P.; Cirach, M.; Ois, Á.; Gómez González, A.; Rodriguez-Campello, A.; de Ceballos, P.; Basagaña, X.; Zabalza, A.; et al. Association of residential air pollution, noise, and greenspace with initial ischemic stroke severity. Environ Res 2019, 179, 108725. [Google Scholar] [CrossRef]
- Meng, X.; Zhang, L.; Chan, K.H.; Lv, J.; Lam, H.; Liu, C.; Chen, R.; Kartsonaki, C.; Wright, N.; Du, H.; et al. Association of greenness with incidence of cardiovascular disease in China: Evidence from the China Kadoorie Biobank prospective cohort study with 0.5 million adults. Eco Environ Health 2025, 4, 100148. [Google Scholar] [CrossRef] [PubMed]
- Orioli, R.; Antonucci, C.; Scortichini, M.; Cerza, F.; Marando, F.; Ancona, C.; Manes, F.; Davoli, M.; Michelozzi, P.; Forastiere, F.; et al. Exposure to Residential Greenness as a Predictor of Cause-Specific Mortality and Stroke Incidence in the Rome Longitudinal Study. Environmental health perspectives 2019, 127, 27002. [Google Scholar] [CrossRef] [PubMed]
- Braggio, J.T. Remote Sensing Technologies Quantify the Contribution of Ambient Air Pollution to Asthma Severity and Risk Factors in Greenness, Air Pollution, and Wildfire Ecological Settings: A Literature Review. Atmosphere 2024, 15, 1470. [Google Scholar] [CrossRef]
- Braggio, J. Inflammation Describes and Explains the Adverse Effects of Aerosol Optical Depth-Particulate Matter on Cardiovascular Outcomes: A Literature Review Since 2012. Medical Research Archives 2023, 11. [Google Scholar] [CrossRef]
- Abdul-Rahman, T.; Roy, P.; Bliss, Z.S.B.; Mohammad, A.; Corriero, A.C.; Patel, N.T.; Wireko, A.A.; Shaikh, R.; Faith, O.E.; Arevalo-Rios, E.C.E.; et al. The impact of air quality on cardiovascular health: A state of the art review. Curr Probl Cardiol 2024, 49, 102174. [Google Scholar] [CrossRef]
- Brook, R.D.; Rajagopalan, S.; Pope, C.A., 3rd; Brook, J.R.; Bhatnagar, A.; Diez-Roux, A.V.; Holguin, F.; Hong, Y.; Luepker, R.V.; Mittleman, M.A.; et al. Particulate matter air pollution and cardiovascular disease: An update to the scientific statement from the American Heart Association. Circulation 2010, 121, 2331–2378. [Google Scholar] [CrossRef]
- Chen, Z.; Liu, P.; Xia, X.; Wang, L.; Li, X. The underlying mechanism of PM2.5-induced ischemic stroke. Environmental pollution (Barking, Essex 1987) 2022, 310, 119827. [Google Scholar] [CrossRef]
- Guo, Y.; Luo, C.; Cao, F.; Liu, J.; Yan, J. Short-term environmental triggers of hemorrhagic stroke. Ecotoxicology and environmental safety 2023, 265, 115508. [Google Scholar] [CrossRef]
- Irfan, H. Air pollution and cardiovascular health in South Asia: A comprehensive review. Curr Probl Cardiol 2024, 49, 102199. [Google Scholar] [CrossRef]
- Krittanawong, C.; Qadeer, Y.K.; Hayes, R.B.; Wang, Z.; Thurston, G.D.; Virani, S.; Lavie, C.J. PM(2.5) and cardiovascular diseases: State-of-the-Art review. Int J Cardiol Cardiovasc Risk Prev 2023, 19, 200217. [Google Scholar] [CrossRef]
- Kulick, E.R.; Kaufman, J.D.; Sack, C. Ambient Air Pollution and Stroke: An Updated Review. Stroke 2023, 54, 882–893. [Google Scholar] [CrossRef]
- Lamas, G.A.; Bhatnagar, A.; Jones, M.R.; Mann, K.K.; Nasir, K.; Tellez-Plaza, M.; Ujueta, F.; Navas-Acien, A. Contaminant Metals as Cardiovascular Risk Factors: A Scientific Statement From the American Heart Association. Journal of the American Heart Association 2023, 12, e029852. [Google Scholar] [CrossRef] [PubMed]
- Li, W.; Lin, G.; Xiao, Z.; Zhang, Y.; Li, B.; Zhou, Y.; Ma, Y.; Chai, E. A review of respirable fine particulate matter (PM(2.5))-induced brain damage. Front Mol Neurosci 2022, 15, 967174. [Google Scholar] [CrossRef] [PubMed]
- Newby, D.E.; Mannucci, P.M.; Tell, G.S.; Baccarelli, A.A.; Brook, R.D.; Donaldson, K.; Forastiere, F.; Franchini, M.; Franco, O.H.; Graham, I.; et al. Expert position paper on air pollution and cardiovascular disease. Eur Heart J 2015, 36, 83–93b. [Google Scholar] [CrossRef] [PubMed]
- Niu, Z.; Liu, F.; Yu, H.; Wu, S.; Xiang, H. Association between exposure to ambient air pollution and hospital admission, incidence, and mortality of stroke: an updated systematic review and meta-analysis of more than 23 million participants. Environ Health Prev Med 2021, 26, 15. [Google Scholar] [CrossRef]
- Rajagopalan, S.; Al-Kindi, S.G.; Brook, R.D. Air Pollution and Cardiovascular Disease: JACC State-of-the-Art Review. Journal of the American College of Cardiology 2018, 72, 2054–2070. [Google Scholar] [CrossRef]
- Zhou, M.; Xin, J.; Chen, J.; Sun, C.; Huo, B.; Zhang, W.; Liu, X. Scientific Landscape of Oxidative Stress in Stroke: From a Bibliometric Analysis to an in-Depth Review. Neurochemical research 2023, 48, 3327–3348. [Google Scholar] [CrossRef]
- SAS. SAS Studio 3.8: User's Guide. 2018.
- SAS. Base SAS 9.4 Procedures Guide: Statistical Procedures, Sixth Edition. 2016.
- SAS. SAS/STAT 15.4 User's Guide. 2025.
- Kaufman, J.D.; Elkind, M.S.V.; Bhatnagar, A.; Koehler, K.; Balmes, J.R.; Sidney, S.; Burroughs Peña, M.S.; Dockery, D.W.; Hou, L.; Brook, R.D.; et al. Guidance to Reduce the Cardiovascular Burden of Ambient Air Pollutants: A Policy Statement From the American Heart Association. Circulation 2020, 142, e432–e447. [Google Scholar] [CrossRef]
- Rajagopalan, S.; Brauer, M.; Bhatnagar, A.; Bhatt, D.L.; Brook, J.R.; Huang, W.; Münzel, T.; Newby, D.; Siegel, J.; Brook, R.D. Personal-Level Protective Actions Against Particulate Matter Air Pollution Exposure: A Scientific Statement From the American Heart Association. Circulation 2020, 142, e411–e431. [Google Scholar] [CrossRef]
- Bauwelinck, M.; Casas, L.; Nawrot, T.S.; Nemery, B.; Trabelsi, S.; Thomas, I.; Aerts, R.; Lefebvre, W.; Vanpoucke, C.; Van Nieuwenhuyse, A.; et al. Residing in urban areas with higher green space is associated with lower mortality risk: A census-based cohort study with ten years of follow-up. Environment international 2021, 148, 106365. [Google Scholar] [CrossRef]
- Liu, C.; Zhang, B.; Liu, C.; Zhang, Y.; Zhao, K.; Zhang, P.; Tian, M.; Lu, Z.; Guo, X.; Jia, X. Association of ambient ozone exposure and greenness exposure with hemorrhagic stroke mortality at different times: A cohort study in Shandong Province, China. Ecotoxicology and environmental safety 2024, 278, 116356. [Google Scholar] [CrossRef]
- Global burden of 369 diseases and injuries in 204 countries and territories, 1990-2019: a systematic analysis for the Global Burden of Disease Study 2019. Lancet 2020, 396, 1204–1222. [CrossRef]
- Global, regional, and national burden of stroke and its risk factors, 1990-2019: a systematic analysis for the Global Burden of Disease Study 2019. Lancet Neurol 2021, 20, 795–820. [CrossRef] [PubMed]
- Bo, Y.; Zhu, Y.; Zhang, X.; Chang, H.; Zhang, J.; Lao, X.Q.; Yu, Z. Spatiotemporal trends of stroke burden attributable to ambient PM2. 5 in 204 countries and territories, 1990–2019: a global analysis. Neurology 2023, 101, e764–e776. [Google Scholar] [CrossRef] [PubMed]
- Liu, S.; Lv, Y.; Zhang, Y.; Suo, H.; Wang, F.; Gao, S. Global trends and burden of stroke attributable to particulate matter pollution from 1990 to 2019. Ecotoxicology and environmental safety 2024, 274, 116205. [Google Scholar] [CrossRef] [PubMed]
- Motairek, I.; Ajluni, S.; Khraishah, H.; AlAhmad, B.; Al-Dulaimi, S.; Abi Khalil, C.; Rajagopalan, S.; Al-Kindi, S. Burden of cardiovascular disease attributable to particulate matter pollution in the eastern Mediterranean region: analysis of the 1990–2019 global burden of disease. European journal of preventive cardiology 2022, 30, 256–263. [Google Scholar] [CrossRef]
- Shaddick, G.; Thomas, M.L.; Green, A.; Brauer, M.; Donkelaar, A.; Burnett, R.; Chang, H.H.; Cohen, A.; Dingenen, R.V.; Dora, C.; et al. Data Integration Model for Air Quality: A Hierarchical Approach to the Global Estimation of Exposures to Ambient Air Pollution. Journal of the Royal Statistical Society Series C: Applied Statistics 2017, 67, 231–253. [Google Scholar] [CrossRef]
- Shaddick, G.; Thomas, M.L.; Amini, H.; Broday, D.; Cohen, A.; Frostad, J.; Green, A.; Gumy, S.; Liu, Y.; Martin, R.V.; et al. Data Integration for the Assessment of Population Exposure to Ambient Air Pollution for Global Burden of Disease Assessment. Environmental science & technology 2018, 52, 9069–9078. [Google Scholar] [CrossRef]
- Cohen, A.J.; Brauer, M.; Burnett, R.; Anderson, H.R.; Frostad, J.; Estep, K.; Balakrishnan, K.; Brunekreef, B.; Dandona, L.; Dandona, R.; et al. Estimates and 25-year trends of the global burden of disease attributable to ambient air pollution: an analysis of data from the Global Burden of Diseases Study 2015. Lancet 2017, 389, 1907–1918. [Google Scholar] [CrossRef]
- Lelieveld, J.; Haines, A.; Burnett, R.; Tonne, C.; Klingmüller, K.; Münzel, T.; Pozzer, A. Air pollution deaths attributable to fossil fuels: observational and modelling study. Bmj 2023, 383, e077784. [Google Scholar] [CrossRef]
- Shi, Y.; Matsunaga, T.; Yamaguchi, Y.; Zhao, A.; Li, Z.; Gu, X. Long-term trends and spatial patterns of PM(2.5)-induced premature mortality in South and Southeast Asia from 1999 to 2014. The Science of the total environment 2018, 631-632, 1504–1514. [Google Scholar] [CrossRef]
- Yang, X.; Wang, Y.; Zhao, C.; Fan, H.; Yang, Y.; Chi, Y.; Shen, L.; Yan, X. Health risk and disease burden attributable to long-term global fine-mode particles. Chemosphere 2022, 287, 132435. [Google Scholar] [CrossRef] [PubMed]
- Zhu, Y.; Shi, Y. Spatio-temporal variations of PM2.5 concentrations and related premature deaths in Asia, Africa, and Europe from 2000 to 2018. Environmental Impact Assessment Review 2023, 99, 107046. [Google Scholar] [CrossRef]
- He, Q.; Gu, Y.; Yim, S.H.L. What drives long-term PM(2.5)-attributable premature mortality change? A case study in central China using high-resolution satellite data from 2003 to 2018. Environment international 2022, 161, 107110. [Google Scholar] [CrossRef] [PubMed]
- Li, R.; Cui, L.; Meng, Y.; Zhao, Y.; Fu, H. Satellite-based prediction of daily SO2 exposure across China using a high-quality random forest-spatiotemporal Kriging (RF-STK) model for health risk assessment. Atmospheric Environment 2019, 208, 10–19. [Google Scholar] [CrossRef]
- Liu, M.; Huang, Y.; Ma, Z.; Jin, Z.; Liu, X.; Wang, H.; Liu, Y.; Wang, J.; Jantunen, M.; Bi, J.; et al. Spatial and temporal trends in the mortality burden of air pollution in China: 2004-2012. Environment international 2017, 98, 75–81. [Google Scholar] [CrossRef]
- Liu, M.; Saari, R.K.; Zhou, G.; Li, J.; Han, L.; Liu, X. Recent trends in premature mortality and health disparities attributable to ambient PM(2.5) exposure in China: 2005-2017. Environmental pollution (Barking, Essex: 1987) 2021, 279, 116882. [Google Scholar] [CrossRef]
- Wang, J.; Wang, Y.; Liang, X.; Huang, K.; Liu, F.; Chen, S.; Lu, X.; Li, J. Changes on Stroke Burden Attributable to Ambient Fine Particulate Matter in China. Biomedical and Environmental Sciences 2024, 37, 823–833. [Google Scholar] [CrossRef]
- Wang, Q.; Wang, J.; He, M.Z.; Kinney, P.L.; Li, T. A county-level estimate of PM(2.5) related chronic mortality risk in China based on multi-model exposure data. Environment international 2018, 110, 105–112. [Google Scholar] [CrossRef]
- Chowdhury, S.; Dey, S. Cause-specific premature death from ambient PM2.5 exposure in India: Estimate adjusted for baseline mortality. Environment international 2016, 91, 283–290. [Google Scholar] [CrossRef]
- Jain, V.; Dey, S.; Chowdhury, S. Ambient PM(2.5) exposure and premature mortality burden in the holy city Varanasi, India. Environmental pollution (Barking, Essex: 1987) 2017, 226, 182–189. [Google Scholar] [CrossRef]
- Maheshwarkar, P.; Sunder Raman, R. Population exposure across central India to PM(2.5) derived using remotely sensed products in a three-stage statistical model. Sci Rep 2021, 11, 544. [Google Scholar] [CrossRef] [PubMed]
- Kim, J.H.; Oh, I.H.; Park, J.H.; Cheong, H.K. Premature Deaths Attributable to Long-term Exposure to Ambient Fine Particulate Matter in the Republic of Korea. J Korean Med Sci 2018, 33, e251. [Google Scholar] [CrossRef] [PubMed]
- Mazeli, M.I.; Pahrol, M.A.; Abdul Shakor, A.S.; Kanniah, K.D.; Omar, M.A. Cardiovascular, respiratory and all-cause (natural) health endpoint estimation using a spatial approach in Malaysia. The Science of the total environment 2023, 874, 162130. [Google Scholar] [CrossRef] [PubMed]
- Rojas-Rueda, D.; Alsufyani, W.; Herbst, C.; AlBalawi, S.; Alsukait, R.; Alomran, M. Ambient particulate matter burden of disease in the Kingdom of Saudi Arabia. Environ Res 2021, 197, 111036. [Google Scholar] [CrossRef]
- Castillo, M.D.; Kinney, P.L.; Southerland, V.; Arno, C.A.; Crawford, K.; van Donkelaar, A.; Hammer, M.; Martin, R.V.; Anenberg, S.C. Estimating Intra-Urban Inequities in PM(2.5)-Attributable Health Impacts: A Case Study for Washington, DC. Geohealth 2021, 5, e2021GH000431. [Google Scholar] [CrossRef]
- Kerr, G.H.; van Donkelaar, A.; Martin, R.V.; Brauer, M.; Bukart, K.; Wozniak, S.; Goldberg, D.L.; Anenberg, S.C. Increasing Racial and Ethnic Disparities in Ambient Air Pollution-Attributable Morbidity and Mortality in the United States. Environmental health perspectives 2024, 132, 37002. [Google Scholar] [CrossRef]
- Brown, P.E.; Izawa, Y.; Balakrishnan, K.; Fu, S.H.; Chakma, J.; Menon, G.; Dikshit, R.; Dhaliwal, R.S.; Rodriguez, P.S.; Huang, G.; et al. Mortality Associated with Ambient PM2.5 Exposure in India: Results from the Million Death Study. Environmental health perspectives 2022, 130, 97004. [Google Scholar] [CrossRef]
- Cai, M.; Lin, X.; Wang, X.; Zhang, S.; Wang, C.; Zhang, Z.; Pan, J.; Lin, H. Long-term exposure to ambient fine particulate matter chemical composition and in-hospital case fatality among patients with stroke in China. The Lancet Regional Health – Western Pacific 2023, 32. [Google Scholar] [CrossRef]
- Cai, M.; Zhang, S.; Lin, X.; Qian, Z.; McMillin, S.E.; Yang, Y.; Zhang, Z.; Pan, J.; Lin, H. Association of Ambient Particulate Matter Pollution of Different Sizes With In-Hospital Case Fatality Among Stroke Patients in China. Neurology 2022, 98, e2474–e2486. [Google Scholar] [CrossRef]
- Chen, G.; Wang, A.; Li, S.; Zhao, X.; Wang, Y.; Li, H.; Meng, X.; Knibbs, L.D.; Bell, M.L.; Abramson, M.J.; et al. Long-Term Exposure to Air Pollution and Survival After Ischemic Stroke. Stroke 2019, 50, 563–570. [Google Scholar] [CrossRef]
- Chen, S.; Zhang, Y.; Lin, Z.; Liu, R.; Zheng, L.; Chen, X.; Lin, S.; Qu, Y.; Hao, C.; Tang, H.; et al. The joint impact of PM2.5 constituents on the risk of cerebrovascular diseases hospitalization: A large community-based cohort study. Environmental Research 2024, 260, 119644. [Google Scholar] [CrossRef]
- Deng, B.; Zhu, L.; Zhang, Y.; Tang, Z.; Shen, J.; Zhang, Y.; Zheng, H.; Zhang, Y. Short-term exposure to PM2.5 constituents, extreme temperature events and stroke mortality. Science of The Total Environment 2024, 954, 176506. [Google Scholar] [CrossRef] [PubMed]
- Gaines, B.; Kloog, I.; Zucker, I.; Ifergane, G.; Novack, V.; Libruder, C.; Hershkovitz, Y.; Sheffield, P.E.; Yitshak-Sade, M. Particulate Air Pollution Exposure and Stroke among Adults in Israel. International journal of environmental research and public health 2023, 20, 1482. [Google Scholar] [CrossRef] [PubMed]
- Guan, T.; Xue, T.; Liu, Y.; Zheng, Y.; Fan, S.; He, K.; Zhang, Q. Differential Susceptibility in Ambient Particle-Related Risk of First-Ever Stroke: Findings From a National Case-Crossover Study. Am J Epidemiol 2018, 187, 1001–1009. [Google Scholar] [CrossRef] [PubMed]
- Gutiérrez-Avila, I.; Rojas-Bracho, L.; Riojas-Rodríguez, H.; Kloog, I.; Just, A.C.; Rothenberg, S.J. Cardiovascular and Cerebrovascular Mortality Associated With Acute Exposure to PM(2.5) in Mexico City. Stroke 2018, 49, 1734–1736. [Google Scholar] [CrossRef]
- Gutiérrez-Avila, I.; Riojas-Rodríguez, H.; Colicino, E.; Rush, J.; Tamayo-Ortiz, M.; Borja-Aburto, V.H.; Just, A.C. Short-term exposure to PM(2.5) and 1.5 million deaths: a time-stratified case-crossover analysis in the Mexico City Metropolitan Area. Environmental health: a global access science source 2023, 22, 70. [Google Scholar] [CrossRef]
- Huang, K.; Jia, J.; Liang, F.; Li, J.; Niu, X.; Yang, X.; Chen, S.; Cao, J.; Shen, C.; Liu, X.; et al. Fine Particulate Matter Exposure, Genetic Susceptibility, and the Risk of Incident Stroke: A Prospective Cohort Study. Stroke 2024, 55, 92–100. [Google Scholar] [CrossRef]
- Huang, K.; Liang, F.; Yang, X.; Liu, F.; Li, J.; Xiao, Q.; Chen, J.; Liu, X.; Cao, J.; Shen, C.; et al. Long term exposure to ambient fine particulate matter and incidence of stroke: prospective cohort study from the China-PAR project. Bmj 2019, 367, l6720. [Google Scholar] [CrossRef]
- Hystad, P.; Larkin, A.; Rangarajan, S.; AlHabib, K.F.; Avezum, Á.; Calik, K.B.T.; Chifamba, J.; Dans, A.; Diaz, R.; du Plessis, J.L.; et al. Associations of outdoor fine particulate air pollution and cardiovascular disease in 157 436 individuals from 21 high-income, middle-income, and low-income countries (PURE): a prospective cohort study. Lancet Planet Health 2020, 4, e235–e245. [Google Scholar] [CrossRef]
- Jalali, S.; Karbakhsh, M.; Momeni, M.; Taheri, M.; Amini, S.; Mansourian, M.; Sarrafzadegan, N. Long-term exposure to PM(2.5) and cardiovascular disease incidence and mortality in an Eastern Mediterranean country: findings based on a 15-year cohort study. Environmental health: a global access science source 2021, 20, 112. [Google Scholar] [CrossRef]
- Jin, J.-Q.; Lin, G.-Z.; Wu, S.-Y.; Zheng, M.-R.; Liu, H.; Liu, X.-Y.; Yan, M.-Q.; Chen, Z.-Y.; Ou, C.-Q. Short-term effects of individual exposure to PM2.5 on hospital admissions for myocardial infarction and stroke: a population-based case-crossover study in Guangzhou, China. Environmental Science and Pollution Research 2023, 30, 78802–78810. [Google Scholar] [CrossRef]
- Kloog, I.; Nordio, F.; Zanobetti, A.; Coull, B.A.; Koutrakis, P.; Schwartz, J.D. Short term effects of particle exposure on hospital admissions in the Mid-Atlantic states: a population estimate. PLoS One 2014, 9, e88578. [Google Scholar] [CrossRef] [PubMed]
- Kongbunkiat, K.; Pattanapipitpaisal, P.; Seoratanaphunt, S.; Peansukwech, U.; Vorasoot, N.; Kasemsap, N.; Tiamkao, S.; Chotmongkol, V.; Nakaphan, T.; Sawanyawisuth, K. An ecological study of PM2.5 and black carbon and acute hemorrhagic stroke: a long term effect study. Environmental Research Communications 2024, 6, 025008. [Google Scholar] [CrossRef]
- Lian, X.; Wang, Z.; Guo, J.; Han, X.; Pan, Z.; Wang, Y.; Xue, T.; Liu, Y.; Huang, S.; Li, J.; et al. Comparison of short-term effects of particulate matter with different particle sizes on first-ever stroke: A national case-crossover study in China. Atmospheric Environment 2023, 313, 120080. [Google Scholar] [CrossRef]
- Liang, R.; Chen, R.; Yin, P.; van Donkelaar, A.; Martin, R.V.; Burnett, R.; Cohen, A.J.; Brauer, M.; Liu, C.; Wang, W.; et al. Associations of long-term exposure to fine particulate matter and its constituents with cardiovascular mortality: A prospective cohort study in China. Environment international 2022, 162, 107156. [Google Scholar] [CrossRef]
- Lin, H.; Guo, Y.; Di, Q.; Zheng, Y.; Kowal, P.; Xiao, J.; Liu, T.; Li, X.; Zeng, W.; Howard, S.W.; et al. Ambient PM(2.5) and Stroke: Effect Modifiers and Population Attributable Risk in Six Low- and Middle-Income Countries. Stroke 2017, 48, 1191–1197. [Google Scholar] [CrossRef]
- Liu, C.; Chan, K.H.; Lv, J.; Lam, H.; Newell, K.; Meng, X.; Liu, Y.; Chen, R.; Kartsonaki, C.; Wright, N.; et al. Long-Term Exposure to Ambient Fine Particulate Matter and Incidence of Major Cardiovascular Diseases: A Prospective Study of 0.5 Million Adults in China. Environmental science & technology 2022, 56, 13200–13211. [Google Scholar] [CrossRef]
- Liu, L.; Zhang, Y.; Yang, Z.; Luo, S.; Zhang, Y. Long-term exposure to fine particulate constituents and cardiovascular diseases in Chinese adults. J Hazard Mater 2021, 416, 126051. [Google Scholar] [CrossRef]
- Loop, M.S.; Kent, S.T.; Al-Hamdan, M.Z.; Crosson, W.L.; Estes, S.M.; Estes, M.G., Jr.; Quattrochi, D.A.; Hemmings, S.N.; Wadley, V.G.; McClure, L.A. Fine particulate matter and incident cognitive impairment in the REasons for Geographic and Racial Differences in Stroke (REGARDS) cohort. PLoS One 2013, 8, e75001. [Google Scholar] [CrossRef]
- Luo, J.; Craver, A.; Jin, Z.; Zheng, L.; Kim, K.; Polonsky, T.; Olopade, C.O.; Pinto, J.M.; Ahsan, H.; Aschebrook-Kilfoy, B. Contextual Deprivation, Race and Ethnicity, and Income in Air Pollution and Cardiovascular Disease. JAMA Netw Open 2024, 7, e2429137. [Google Scholar] [CrossRef]
- McClure, L.A.; Loop, M.S.; Crosson, W.; Kleindorfer, D.; Kissela, B.; Al-Hamdan, M. Fine Particulate Matter (PM(2.5)) and the Risk of Stroke in the REGARDS Cohort. J Stroke Cerebrovasc Dis 2017, 26, 1739–1744. [Google Scholar] [CrossRef] [PubMed]
- Nethery, R.C.; Josey, K.; Gandhi, P.; Kim, J.H.; Visaria, A.; Bates, B.; Schwartz, J.; Robinson, D.; Setoguchi, S. Air Pollution and Cardiovascular and Thromboembolic Events in Older Adults With High-Risk Conditions. American Journal of Epidemiology 2023, 192, 1358–1370. [Google Scholar] [CrossRef] [PubMed]
- Qian, Y.; Cai, R.; Su, X.; Li, Q.; Jin, S.; Shi, W.; Chen, R.; Wang, C.; He, J. Residential Nitrogen Dioxide Exposure and Cause-Specific Cerebrovascular Mortality: An Individual-Level, Case-Crossover Study. Toxics 2023, 12. [Google Scholar] [CrossRef] [PubMed]
- Qian, Y.; Su, X.; Yu, H.; Li, Q.; Jin, S.; Cai, R.; Shi, W.; Shi, S.; Meng, X.; Zhou, L.; et al. Differentiating the impact of fine and coarse particulate matter on cause-specific cerebrovascular mortality: An individual-level, case-crossover study. Ecotoxicology and environmental safety 2024, 279, 116447. [Google Scholar] [CrossRef]
- Qiu, H.; Sun, S.; Tsang, H.; Wong, C.M.; Lee, R.S.; Schooling, C.M.; Tian, L. Fine particulate matter exposure and incidence of stroke: A cohort study in Hong Kong. Neurology 2017, 88, 1709–1717. [Google Scholar] [CrossRef]
- Riggs, D.W.; Baumgartner, K.B.; Baumgartner, R.; Boone, S.; Judd, S.E.; Bhatnagar, A. Long-term exposure to air pollution and risk of stroke by ecoregions: The REGARDS study. Environmental Pollution 2024, 345, 123367. [Google Scholar] [CrossRef]
- Yitshak Sade, M.; Novack, V.; Ifergane, G.; Horev, A.; Kloog, I. Air Pollution and Ischemic Stroke Among Young Adults. Stroke 2015, 46, 3348–3353. [Google Scholar] [CrossRef]
- Sahu, S.K.; Sharma, S.; Zhang, H.; Chejarla, V.; Guo, H.; Hu, J.; Ying, Q.; Xing, J.; Kota, S.H. Estimating ground level PM(2.5) concentrations and associated health risk in India using satellite based AOD and WRF predicted meteorological parameters. Chemosphere 2020, 255, 126969. [Google Scholar] [CrossRef]
- Shamsa, E.H.; Song, Z.; Kim, H.; Shamsa, F.; Hazlett, L.D.; Zhang, K. The links of fine airborne particulate matter exposure to occurrence of cardiovascular and metabolic diseases in Michigan, USA. PLOS Glob Public Health 2022, 2, e0000707. [Google Scholar] [CrossRef]
- Shin, S.; Burnett, R.T.; Kwong, J.C.; Hystad, P.; van Donkelaar, A.; Brook, J.R.; Goldberg, M.S.; Tu, K.; Copes, R.; Martin, R.V.; et al. Ambient Air Pollution and the Risk of Atrial Fibrillation and Stroke: A Population-Based Cohort Study. Environmental health perspectives 2019, 127, 87009. [Google Scholar] [CrossRef]
- Stafoggia, M.; Renzi, M.; Forastiere, F.; Ljungman, P.; Davoli, M.; De' Donato, F.; Gariazzo, C.; Michelozzi, P.; Scortichini, M.; Solimini, A.; et al. Short-term effects of particulate matter on cardiovascular morbidity in Italy: a national analysis. European journal of preventive cardiology 2022, 29, 1202–1211. [Google Scholar] [CrossRef]
- Sun, D.; Liu, C.; Ding, Y.; Yu, C.; Guo, Y.; Sun, D.; Pang, Y.; Pei, P.; Du, H.; Yang, L.; et al. Long-term exposure to ambient PM(2·5), active commuting, and farming activity and cardiovascular disease risk in adults in China: a prospective cohort study. Lancet Planet Health 2023, 7, e304–e312. [Google Scholar] [CrossRef] [PubMed]
- Tapia, V.; Steenland, K.; Sarnat, S.E.; Vu, B.; Liu, Y.; Sánchez-Ccoyllo, O.; Vasquez, V.; Gonzales, G.F. Time-series analysis of ambient PM(2.5) and cardiorespiratory emergency room visits in Lima, Peru during 2010-2016. J Expo Sci Environ Epidemiol 2020, 30, 680–688. [Google Scholar] [CrossRef] [PubMed]
- To, T.; Zhu, J.; Villeneuve, P.J.; Simatovic, J.; Feldman, L.; Gao, C.; Williams, D.; Chen, H.; Weichenthal, S.; Wall, C.; et al. Chronic disease prevalence in women and air pollution--A 30-year longitudinal cohort study. Environment international 2015, 80, 26–32. [Google Scholar] [CrossRef] [PubMed]
- Valdez, R.B.; Al-Hamdan, M.Z.; Tabatabai, M.; Hood, D.B.; Im, W.; Wilus, D.; Nori-Sarma, A.; Ramesh, A.; Donneyong, M.M.; Langston, M.A.; et al. Association of Cardiovascular Disease and Long-Term Exposure to Fine Particulate Matter (PM(2.5)) in the Southeastern United States. Atmosphere (Basel) 2021, 12, 1–12. [Google Scholar] [CrossRef]
- Wang, M.; Han, Y.; Wang, C.J.; Xue, T.; Gu, H.Q.; Yang, K.X.; Liu, H.Y.; Cao, M.; Meng, X.; Jiang, Y.; et al. Short-term effect of PM2.5 on stroke in susceptible populations: A case-crossover study. Int J Stroke 2023, 18, 312–321. [Google Scholar] [CrossRef]
- Wettstein, Z.S.; Hoshiko, S.; Fahimi, J.; Harrison, R.J.; Cascio, W.E.; Rappold, A.G. Cardiovascular and Cerebrovascular Emergency Department Visits Associated With Wildfire Smoke Exposure in California in 2015. Journal of the American Heart Association 2018, 7. [Google Scholar] [CrossRef]
- Wong, C.M.; Lai, H.K.; Tsang, H.; Thach, T.Q.; Thomas, G.N.; Lam, K.B.; Chan, K.P.; Yang, L.; Lau, A.K.; Ayres, J.G.; et al. Satellite-Based Estimates of Long-Term Exposure to Fine Particles and Association with Mortality in Elderly Hong Kong Residents. Environmental health perspectives 2015, 123, 1167–1172. [Google Scholar] [CrossRef]
- Wu, Y.; Shen, P.; Yang, Z.; Yu, L.; Xu, L.; Zhu, Z.; Li, T.; Luo, D.; Lin, H.; Shui, L.; et al. Outdoor Light at Night, Air Pollution, and Risk of Cerebrovascular Disease: A Cohort Study in China. Stroke 2024, 55, 990–998. [Google Scholar] [CrossRef]
- Yang, L.; Wang, M.; Xuan, C.; Yu, C.; Zhu, Y.; Luo, H.; Meng, X.; Shi, S.; Wang, Y.; Chu, H.; et al. Long-term exposure to particulate matter pollution and incidence of ischemic and hemorrhagic stroke: A prospective cohort study in Eastern China. Environmental pollution (Barking, Essex 1987) 2024, 358, 124446. [Google Scholar] [CrossRef]
- Yang, L.; Zhu, Y.; Zhao, B.; Wan, W.; Shi, S.; Xuan, C.; Yu, C.; Mao, W.; Yan, J. Long-term cardiometabolic effects of ambient ozone pollution in a large Chinese population. Ecotoxicology and environmental safety 2023, 261, 115115. [Google Scholar] [CrossRef] [PubMed]
- Yang, X.; Zhang, L.; Chen, X.; Liu, F.; Shan, A.; Liang, F.; Li, X.; Wu, H.; Yan, M.; Ma, Z.; et al. Long-term exposure to ambient PM(2.5) and stroke mortality among urban residents in northern China. Ecotoxicology and environmental safety 2021, 213, 112063. [Google Scholar] [CrossRef] [PubMed]
- Yitshak-Sade, M.; Bobb, J.F.; Schwartz, J.D.; Kloog, I.; Zanobetti, A. The association between short and long-term exposure to PM(2.5) and temperature and hospital admissions in New England and the synergistic effect of the short-term exposures. The Science of the total environment 2018, 639, 868–875. [Google Scholar] [CrossRef] [PubMed]
- Yitshak-Sade, M.; Kloog, I.; Novack, V. Do air pollution and neighborhood greenness exposures improve the predicted cardiovascular risk? Environment international 2017, 107, 147–153. [Google Scholar] [CrossRef]
- Zhang, Z.; Wang, C.; Lin, C.; Wu, Y.; Wei, J.; Lu, J.; Chen, B.; Wu, C.; Zhang, X.; Yang, Y.; et al. Association of long-term exposure to ozone with cardiovascular mortality and its metabolic mediators: evidence from a nationwide, population-based, prospective cohort study. The Lancet Regional Health – Western Pacific 2024, 52. [Google Scholar] [CrossRef]
- Zheng, M.; Yin, Z.; Wei, J.; Yu, Y.; Wang, K.; Yuan, Y.; Wang, Y.; Zhang, L.; Wang, F.; Zhang, Y. Submicron particle exposure and stroke hospitalization: An individual-level case-crossover study in Guangzhou, China, 2014-2018. The Science of the total environment 2023, 886, 163988. [Google Scholar] [CrossRef]
- Zhou, Y.; Li, X.; Fouxi, Z.; Yao, C.; Wang, Y.; Tang, E.; Wang, K.; Yu, L.; Zhou, Z.; Wei, J.; et al. Rural-urban difference in the association between particulate matters and stroke incidence: The evidence from a multi-city perspective cohort study. Environ Res 2024, 261, 119695. [Google Scholar] [CrossRef]
- Zhu, L.; Fang, J.; Yao, Y.; Yang, Z.; Wu, J.; Ma, Z.; Liu, R.; Zhan, Y.; Ding, Z.; Zhang, Y. Long-term ambient ozone exposure and incident cardiovascular diseases: National cohort evidence in China. J Hazard Mater 2024, 471, 134158. [Google Scholar] [CrossRef]
- Brown, S.C.; Aitken, W.W.; Lombard, J.; Wang, K.; Rundek, T.; Byrne, M.M.; Toro, M.; Nardi, M.I.; Kardys, J.; Parrish, A. Precision greenness and stroke/transient ischemic attack in 249,405 US Medicare beneficiaries. Journal of stroke 2023, 25, 173–176. [Google Scholar] [CrossRef]
- Jia, X.; Yu, Y.; Xia, W.; Masri, S.; Sami, M.; Hu, Z.; Yu, Z.; Wu, J. Cardiovascular diseases in middle aged and older adults in China: the joint effects and mediation of different types of physical exercise and neighborhood greenness and walkability. Environ Res 2018, 167, 175–183. [Google Scholar] [CrossRef]
- Jia, X.; Zhang, B.; Yu, Y.; Xia, W.; Lu, Z.; Guo, X.; Xue, F. Greenness mitigate cause-specific mortality associated with air pollutants in ischemic and hemorrhagic stroke patients: An ecological health cohort study. Environmental Research 2024, 251, 118512. [Google Scholar] [CrossRef]
- Liu, C.; Yu, Y.; Liu, C.; Tang, L.; Zhao, K.; Zhang, P.; He, F.; Wang, M.; Shi, C.; Lu, Z.; et al. Effect of neighbourhood greenness on the association between air pollution and risk of stroke first onset: A case-crossover study in shandong province, China. International journal of hygiene and environmental health 2023, 254, 114262. [Google Scholar] [CrossRef]
- Song, S.; Cheng, C.; Liu, Y.; Duan, Y.; Zuo, H.; Xi, R.; Ni, Z.; Liang, K.; Li, S.; Cui, F.; et al. Associations between short-term exposure to fine particulate matter with ischemic stroke mortality and the role of green space: a time-series study in Zibo, China. J Glob Health 2025, 15, 04068. [Google Scholar] [CrossRef]
- Wang, H.; Tassinary, L.G. Association between greenspace morphology and prevalence of non-communicable diseases mediated by air pollution and physical activity. Landscape and Urban Planning 2024, 242, 104934. [Google Scholar] [CrossRef]
- Zhao, K.; He, F.; Zhang, B.; Liu, C.; Hu, Y.; Dong, Y.; Zhang, P.; Liu, C.; Wei, J.; Lu, Z.; et al. Short-term ozone exposure on stroke mortality and mitigation by greenness in rural and urban areas of Shandong Province, China. BMC public health 2024, 24, 2955. [Google Scholar] [CrossRef]
- Wang, H.; Tassinary, L.G.; Newman, G.D. Developing the health effect assessment of landscape (HEAL) Tool: Assessing the health effects of community greenspace morphology design on non-communicable diseases. Landscape and Urban Planning 2024, 244, 104990. [Google Scholar] [CrossRef]
- Cai, L.; Yang, J.; Cosky, E.; Xin, R.; Geng, X.; Ding, Y. Enhanced Cerebral Microbleeds by Long-Term Air Pollution Exposure in Spontaneously Hypertensive Rats. Neurol Res 2022, 44, 196–205. [Google Scholar] [CrossRef]
Figure 1.
Total identified and final research publications discovered by the five electronic literature databases, and all other sources: PMD, PubMed Database; SC, Scopus; EB, Embase; WoS, Web of Science; GS, Google Scholar; OTH, all other sources. In addition, 19 review articles were also identified.

Figure 2.
Total research publications and publication-extracted records by electronic literature databases (PMD, PubMed; SC, Scopus; EB, Embase; WoS, Web of Science; GS, Google Scholar; OTH, all other publication sources) are displayed in the three Figure 2 panels. Panel A includes total publications by publication type (TOT, total; AP, air pollution; GRN, greenness). Panel B displays total records by publication type. Panel C shows total records by stroke subtype (CRV, cerebrovascular; STK, stroke; ISC, ischemic; HEM, hemorrhagic).

Figure 3.
Descending descriptive (A) and explanatory (B) stroke subtype physiologic mechanism model stages. Acronyms - Stroke Subtypes: CRV, cerebrovascular; STK, stroke; ISC, ischemic; HEM, hemorrhagic; 2+, two or more. Physiologic Mechanisms: ROS, reactive oxygen species; OS, oxidative stress; IN, inflammation; IM, immune; OTH, other.


Table 1.
Research publications and Publication-Extracted Records by Study Variables.
| Variables | Publications1 | Records1 |
| N (%) or Mean (95% CI)2 | N (%) or Mean (95% CI)2 | |
| Research Publications or Extracted Records | 99 (100.00) | 343 (100.00) |
| Stroke Participant Totals | 7,555,646 | 26,513,512 |
| Age Mean (95% CI)2 | 62.21 (59.02-66.39) | 42.8 (39.4-46.2) |
| Publication Year Category | ||
| 2012-2018 | 25 (25.25)b | 20 (5.83)b |
| 2019-2025 | 74 (74.75) | 323 (94.17) |
| Remote Sensing | ||
| Air Pollution | 88 (88.89)b | 315 (93.75)b |
| Greenness | 11 (11.11) | 21 (6.25) |
| Publication Year by Remote Sensing | ||
| 2012-2018 Greenness | 3 (3.03) | 3 (0.87) |
| 2012-2018 Air Pollution | 22 (22.22) | 37 (10.79) |
| 2019-2025 Greenness | 8 (8.08) | 17 (4.96) |
| 2019-2025 Air Pollution | 66 (66.67) | 286 (83.38) |
| Country | ||
| China | 47 (47.47)b | 240 (69.97)b |
| United States | 16 (16.16) | 38 (11.08) |
| 2+ | 9 (9.09) | 13 (3.79) |
| Canada | 5 (5.05) | 10 (2.92) |
| Indonesia | 5 (5.05) | 5 (1.46) |
| Israel | 3 (3.03) | 9 (2.62) |
| Italy | 2 (2.02) | 6 (1.75) |
| Mexico | 2 (2.02) | 6 (1.75) |
| Australia | 1 (1.01) | 3 (0.87) |
| Belgium | 1 (1.01) | 1 (0.29) |
| Brazil | 1 (1.01) | 1 (0.29) |
| Iran | 1 (1.01) | 1 (0.29) |
| Malysia | 1 (1.01) | 2 (0.58) |
| Peru | 1 (1.01) | 1 (0.29) |
| Republic of Korea | 1 (1.01) | 2 (0.58) |
| Saudi Arabia | 1 (1.01) | 2 (0.58) |
| Spain | 1 (1.01) | 1(0.29) |
| Thailand | 1 (1.01) | 2 (0.58) |
| Stroke Subtype | ||
| Cerebrovascular | 22 (22.22)b | 47 (13.70)b |
| Stroke | 47 (47.47) | 111 (32.36) |
| Ischemic | 23 (23.23) | 102 (29.74) |
| Hemorrhagic | 7 (7.07) | 83 (24.20) |
| Record Format | ||
| One | 73 (73.74)b | 292 (85.13)b |
| 2+ | 5 (5.05) | 15 (4.37) |
| Concentration-Response Function | 20 (20.20) | 35 (10.20) |
| Z | 1 (1.01) | 1 (0.29) |
| ICD | ||
| Nine | 11 (11.11)b | 29 (8.45)b |
| Ten | 43 (43.43) | 224 (65.31) |
| Both | 6 (6.06) | 17 (4.96) |
| Other | 19 (19.19) | 40 (11.66) |
| Z | 20 (20.20) | 33 (9.62) |
| Surveillance Type | ||
| Prevalence | 28 (28.28)b | 87 (25.36)b |
| Incidence | 60 (60.61) | 241 (70.26) |
| Both | 1 (1.01) | 1 (0.29) |
| Other | 8 (8.08) | 12 (3.50) |
| Z | 2 (2.02) | 2 (0.58) |
| Outcome | ||
| Morbidity | 46 (46.46)b | 159 (46.36)b |
| Mortality | 45 (45.45) | 162 (47.23) |
| Both | 8 (8.08) | 22 (6.41) |
| Design | ||
| Case Control | 2 (2.02)b | 3 (0.87)b |
| Case Crossover | 14 (14.14) | 93 (27.11) |
| Concentration Response Function | 18 (18.18) | 27 (7.87) |
| Cross Sectional | 8 (8.08) | 17 (4.96) |
| Other | 3 (3.03) | 3 (0.87) |
| Panel | 1 (1.01) | 8 (2.33) |
| Prospective Cohort | 34 (34.34) | 120 (34.99) |
| Retrospective Cohort | 11 (11.11) | 55 (16.03) |
| Time Series | 8 (8.08) | 17 (4.96) |
| Physiologic Mechanism in Introduction | ||
| No | 80 (80.81)b | 263 (76.68)b |
| Yes | 19 (19.19) | 80 (23.32) |
| Aerosol Optical Depth | ||
| No | 16 (16.16)b | 32 (9.33)b |
| Yes | 82 (82.83) | 310 (90.38) |
| Z | 1 (1.01) | 1 (0.29) |
| Monitor | ||
| No | 11 (11.96)b | 22 (7.42)b |
| Yes | 79 (85.87) | 285 (91.94) |
| Z | 2 (2.17) | 2 (0.65) |
| Geocode | ||
| Address | 40 (40.40)6 | 207 (60.35)b |
| Block Group | 1 (1.01) | 1 (0.29) |
| Census Block | 2 (2.02) | 9 (2.68) |
| Census Tract | 3 (3.03) | 4 (1.17) |
| Zip Code | 11 (11.11) | 20 (5.83) |
| Neighborhood | 6 (6.06) | 15 (4.37) |
| City | 9 (9.09) | 28 (8.16) |
| County | 6 (6.06) | 21 (6.12) |
| State | 3 (3.03) | 4 (1.17) |
| Country | 6 (6.06) | 16 (4.66) |
| World region | 3 (3.03) | 4 (1.17) |
| Other | 5 (5.05) | 7 (2.08) |
| Z | 6 (6.06) | 6 (1.75) |
| Remote Sensing Air Pollution and Greenness | ||
| <1 Year | 32 (32.32)b | 140 (44.82)b |
| ≥1 Year | 67 (67.68) | 203 (59.18) |
| Remote Sensing Air Pollution and Greenness | ||
| <1 Year Greenness | 2 (2.02) | 3 (0.87)a |
| <1 Year Air Pollution | 30 (30.30) | 137 (39.94) |
| 1+ Years Greenness | 9 (9.09) | 17 (4.96) |
| 1+ Years Air Pollution | 58 (58.59) | 186 (54.23) |
| Outcome | ||
| Not significant | 15 (15.15)b | 82 (23.91)b |
| Significantly higher | 54 (54.55) | 205 (59.77) |
| Significantly lower | 10 (10.10) | 28 (8.16) |
| Other | 3 (3.03) | 3 (0.87) |
| Z | 17 (17.17) | 25 (7.29) |
1Categorical variable differences for research publications and publication-extracted records were statistically evaluated by using the Chi-Square test if the expected cell total was ≥5 or the Monte Carlo Estimate of the Exact Test if the expected cell total was <5. Significance for the Chi-Square test (a=p≤0.05, b=p≤0.01) or the Monte Carlo Estimate of the Exact Test (a=p≤0.05, b=p≤0.01). 295% CI, 95% Confidence Interval.
Table 2.
Descriptive Statistics for Ambient AOD-Air Pollutants And Remote Sensing Greenness (EVI, NDVI) Records.
Table 2.
Descriptive Statistics for Ambient AOD-Air Pollutants And Remote Sensing Greenness (EVI, NDVI) Records.
| Variable1 | N2 (%) | Exposure3 | Accuracy (r2%)4 | ||
| Mean | 95% CI5 | Mean | 95% CI4 | ||
| AOD-PM10 | 35 (12.15) | 68.1 | 59.6-76.7 | 84.7 | 82.1-87.3 |
| AOD-PM2.5 | 165 (57.29) | 32.8 | 29.2-36.4 | 75.1 | 72.0-78.2 |
| AOD-PM1 | 17 (5.90) | 29.6 | 24.2-34.9 | 82.2 | 79.2-85.1 |
| AOD-O3 | 20 (6.94) | 89.3 | 78.4-100.3 | 86.7 | 85.9-87.5 |
| AOD-NO2 | 24 (8.33) | 29.6 | 25.5-33.8 | 78.6 | 75.6-81.6 |
| AOD-SO2 | 10 (3.47) | 23.3 | 18.1-28.4 | 83.2 | 79.0-87.4 |
| EVI | 2 (0.69) | 0.3 | . | . | . |
| NDVI | 15 (5.21) | 0.4 | 0.3-0.5 | . | . |
1Variable acronyms: AOD, aerosol optical depth; AOD-PM10, coarse particulate matter; AOD-PM2.5, fine particulate matter; AOD-PM1, ultrafine particulate matter; AOD-O3, ozone; AOD-NO2, nitric dioxide; AOD-SO2, sulfur dioxide; EVI, enhanced vegetation index; NDVI, normalized difference vegetation index. With the exception of RS greenness records, only AOD-air pollutants with at least 10 publication-extracted records were included in the Table. 2Total observations, 288. 3Exposure unit of measurement is µg/m3 for all ambient AOD-air pollutants. The EVI and NDVI variables were quantified using a unitless ordinal scale with minimum-maximum values of 0-1. Higher EVI or NDVI values represent more chlorophyl in living vegetation on the earth’s surface. 4Accuracy was evaluated by using the square of the correlation percent, r2%. Higher r2% values represent more agreement between ambient AOD-air pollutant concentration level values and on-the-ground ambient monitor measurements. 595% CI, 95% Confidence Interval.
Table 3.
Stroke Subtype Morbidity and Mortality Estimates Reported in Published Studies that Used Ambient AOD-Air Pollution Concentration Response Functions.
Table 3.
Stroke Subtype Morbidity and Mortality Estimates Reported in Published Studies that Used Ambient AOD-Air Pollution Concentration Response Functions.
| AREA1 |
RS2 | Type3 | CRF4 | Outcomes |
| 2+ [47] | AOD-PM2.5 | STK, ISC | GBD | In 2019 there were 1.14 million incident STK deaths, which included 516,000 ISC stroke deaths. |
| 2+ [52] | AOD-PM2.5 | CRV | GBD | In 2015 there were 898,100 CRV deaths. |
| 2+ [53] | AOD-O3, AOD-PM2.5 | STK |
RR | In 2019 there were 1, 332,000 STK deaths. |
| 2+ [48] | AOD-PM2.5 | STK | GBD | In 2019 there were 1.14 million STK deaths. |
| 2+ [54] | AOD-PM2.5 | STK | ERF | In South-Southeast Asia, between 1999-2014, there were 556,400 premature STK deaths per year. |
| 2+ [55] | AOD-PM2.5 | STK | ERF | Between 2000-2018 STK deaths increased in the world by 0.67% per year, and 2.78% Southeast Asia (>4% in 2000-2006). |
| 2+ [56] | AOD-PM2.5 | STK | GBD | Between 2000-2018, STK death percentages were highest in Asia (40.2%, n=909,000/2,261,000), intermediate in Africa (31.8%, n=54,000/170,000), and lowest in Europe (30.9%, n= 120,000/ 388,000). |
| CN [57] | AOD-PM2.5 | STK | GBD | Between 2003-2018, in central China STK mortality decreased from 143,000 to 103,000. |
| CN [58] | AOD-SO2 | CRV | RF-STKR | Between May 2014 and May 2015 there were 2,188 avoidable premature CRV stroke deaths. |
| CN [59] | AOD-PM2.5 | STK | GBD | Premature STK deaths increased from 589,000 in 2004 and to 761,000 in 2012. |
| CN [60] | AOD-PM2.5 | STK | GEM | Between 2005-2017 there were 580,000 premature STK deaths, representing 36% of all PM2.5 deaths. |
| CN [61] | AOD-PM2.5 | STK | GBD | STK age-standardized disability-adjusted life year rates were 3.99 in 1995-2001, -1.31 in 2001-2004 and -1.98 in 2012-219. |
| CN [62] | AOD-PM2.5 | STK | GBD | In this county-level 2010 study there were 670,906 STK deaths; this total represents 52.90% of all PM2.5 impacted premature deaths. |
| IN [63] | AOD-PM2.5 | STK | NLP | There were 88,700 premature STK deaths. |
| IN [64,65] | AOD-PM2.5 | STK | GBD | Between 2001-2015, in Veranasi, there were 1,000 premature STK deaths per year. |
| IN [65] | AOD-PM2.5 | STK | GBD | Between 2018-2019, in central India (Madhya Pradesh) there were 37,468 STK deaths. |
| KR [66] | AOD-PM2.5 | HEM, ISC | GBD | Between 1990-2013 there were 5,382 ISC stroke and 3,452 HEM stroke deaths. |
| MA [67] | AOD-PM2.5 | STK | RR | There were 1,329 STK deaths in 2,000, 1,062 in 2008, and 2,745 in 2013. |
| SA [68] | AOD-PM2.5 | STK | GBD | STK deaths increased from 554 in 1990, to 986 in 2010, and then to 1,056 in 2017. |
| US [69] | AOD-PM2.5 | STK | RR | In 2000-2015 there were 10 STK deaths in Washington, DC. |
| US [70] | AOD-PM2.5 |
STK | GBD | Between 2010-2018 there were approximately 7,500 STK deaths per year, with higher totals among Black persons and lower totals among White persons. |
1Area acronyms: 2+, two or more countries; CN, China; IN, India; KR, Republic of Korea; US, United States. The research publication reference number is to the right of the country acronym. 2RS acronyms: RS, remote sensing; AOD, aerosol optical depth; AOD-O3, ozone; AOD-PM2.5, PM≤2.5 µg/m3, fine particulate matter; AOD-SO2, sulfur dioxide. 3Type acronyms, stroke subtype: CRV, cerebrovascular; HEM, hemorrhagic; ISC, ischemic; STK, stroke. 4CRF, concentration response function: ERF, exposure-response function; GBD, Global Burden of Disease; NLP, non-linear power law; RF-STKR, random forest-spatiotemporal kriging; RR, relative risk.
Table 4.
Study Variable Differences on the Statistical Significance Outcome for Publication-Extracted Records.
Table 4.
Study Variable Differences on the Statistical Significance Outcome for Publication-Extracted Records.
| Variable1 | Outcome2-3 | |||
| Higher | Lower | NS | Total | |
| Stroke Subtypeb | ||||
| Cerebrovascular | 24 (10.48) |
0 (0.00) |
6 (2.62) |
30 (13.10) |
| Stroke | 48 (20.96) |
3 (1.31) |
10 (4.37) |
61 (26.64) |
| Ischemic | 65 (28.38) |
2 (0.87) |
10 (4.37) |
77 (33.62) |
| Hemorrhagic | 33 (14.41) |
8 (3.49) |
20 (8.73) |
61 (26.64) |
| Geocoding Specificityb | ||||
| Residential Address | 125 (54.59) |
4 (1.75) |
27 (11.79) |
156 (68.12) |
| Other | 45 (19.65) |
9 (3.93) |
19 (8.30) |
73 (31.88) |
| Spatial Resolution | ||||
| <10 km2 | 92 (42.20) |
9 (4.13) |
34 (15.60) |
135 (61.93) |
| ≥10 km2 | 67 (30.73) |
4 (1.83) |
12 (5.50) |
83 (38.07) |
| Remote Sensing Air Pollutantsb | ||||
| AOD-Black Carbon (BC) | 1 (0.44) |
0 (0.00) |
0 (0.00) |
1 (0.44) |
| AOD-Carbon Monoxide (CO) | 5 (2.18) |
0 (0.00) |
4 (1.75) |
9 (3.93) |
| AOD-Nitrogen Dioxide (NO2) | 16 (6.99) |
3 (1.31) |
4 (1.75) |
23 (10.04) |
| AOD-Ozone (O3) | 10 (4.37) |
5 (2.18) |
4 (1.75) |
19 (8.30) |
| AOD-Ultrafine PM (PM1) | 15 (6.55) |
1 (0.44) |
1 (0.44) |
17 (7.42) |
| AOD-Fine PM (PM2.5) | 88 (38.43) |
1 (0.44) |
22 (9.61) |
111 (48.47) |
| AOD-Intermediate PM (PM2.5-10) | 2 (0.87) |
0 (0.00) |
4 (1.75) |
6 (2.62) |
| AOD-Coarse PM (PM10) | 28 (12.23) |
1 (0.44) |
5 (2.18) |
34 (14.85) |
| AOD-Sulfur Dioxide (SO2) | 5 (2.18) |
2 (0.87) |
2 (0.87) |
9 (3.93) |
| AOD-Air Pollution Readings | ||||
| <37.60 µg/m3 | 43 (18.78) |
1 (0.44) |
11 (4.80) |
55 (24.02) |
| ≥37.60 µg/m3 | 127 (55.46) |
12 (5.24) |
35 (15.28) |
174 (75.98) |
| AOD-Air Pollution Exposure | ||||
| <1 Year | 85 (37.12) |
10 (4.37) |
29 (12.66) |
124 (54.15) |
| 1+ Years | 85 (37.12) |
3 (1.31) |
17 (7.42) |
105 (45.85) |
| AOD-Air Pollutant Accuracy (r2%)b | ||||
| <84.00% | 68 (29.69) |
1 (0.44) |
27 (11.79) |
96 (41.92) |
| ≥84.00% | 102 (44.54) |
12 (5.24) |
19 (8.30) |
133 (58.08) |
| Country | ||||
| Canada | 7 (3.06) |
0 (0.00) |
1 (0.44) |
8 (3.49) |
| China | 133 (58.08) |
12 (5.24) |
34 (14.85) |
179 (78.17) |
| Israel | 5 (2.18) |
1 (0.44) |
3 (1.31) |
9 (3.93) |
| Mexico | 3 (1.31) |
0 (0.00) |
3 (1.31) |
6 (2.62) |
| United States | 12 (5.24) |
0 (0.00) |
2 (0.87) |
14 (6.11) |
| Other | 10 (4.37) |
0 (0.00) |
3 (1.31) |
13 (5.68) |
| Publication Year Category | ||||
| 2012-2018 | 15 (6.55) |
0 (0.00) |
7 (3.06) |
22 (9.61) |
| 2019-2025 | 155 (67.69) |
13 (5.68) |
39 (17.03) |
207 (90.39) |
1Variable acronyms: Remote Sensing Air Pollutants (AOD, aerosol optical depth; PM, particulate matter; Ultrafine PM, PM≤1 µg/m3; Fine PM≤2.5 µg/m3; Intermediate PM, PM2.5-10, between PM≤2.5 µg/m3 and PM≤10 µg/m3; Coarse PM, PM≤10 µg/m3). AOD-Air Pollutant Accuracy (r2%, square of the correlation percent). For all ambient AOD-air pollutants the unit of measurement is µg/m3. 2Significance of Outcome (Higher, significantly higher; Lower, significantly lower; NS, not significant). Cell totals include total number of records, with percentages in parentheses. 3Statistical outcome was assessed using the Chi-Square test if the expected cell total was ≥5, or the Monte Carlo Estimate of the Exact Test if the expected cell total was <5. Significance for the Chi-Square test (a=p≤0.05, b=p≤0.01) or the Monte Carlo Estimate of the Exact Text (a=p≤0.05, b= p≤0.01).
Table 5.
Statistical Assessment of Risk Factors by Stroke Subtype.
| Risk Factor1 |
Stroke Subtype2 | total | |||
| ISCb, b | STKb, ab | HEMb, a | CRVb | ||
| Environmentalb | 122 (20.37) |
87 (14.52) |
70 (11.69) |
50 (8.35) |
329 (54.92) |
| Otherb | 23 (3.84) |
46 (7.68) |
12 (2.00) |
9 (1.50) |
90 (15.03) |
| Agea | 21 (3.51) |
19 (3.17) |
8 (1.34) |
9 (1.50) |
57 (9.52) |
| Gender | 16 (2.67) |
15 (2.50) |
10 (1.67) |
8 (1.34) |
49 (8.18) |
| Geographic | 14 (2.34) |
14 (2.34) |
9 (1.50) |
5 (0.83) |
42 (7.01) |
| Education-Income | 4 (0.67) |
9 (1.50) |
1 (0.17) |
6 (1.00) |
20 (3.34) |
| Ethnicity | 2 (0.33) |
6 (1.00) |
0 (0.00) |
0 (0.00) |
8 (1.34) |
| Race | 2 (0.33) |
2 (0.33) |
0 (0.00) |
0 (0.00) |
4 (0.67) |
| Total | 204 (34.06) |
198 (33.06) |
110 (18.36) |
87 (14.52) |
599 (100.00) |
1Significant differences for Risk Factors, Stroke Subtype (ISC, ischemic; STK, stroke; HEM, hemorrhagic; CRV, cerebrovascular). The Risk Factor by Stroke Subtype Interaction was evaluated using the Chi-Square test if the expected cell total was at least 5 or the Monte Carlo Estimate of the Exact Test if the expected cell total was less than 5. Statistical significance for the Chi-Square test: a, p≤0.05; b, p≤0.01; Monte Carlo Estimate of the Exact Test, same probabilities but with bold font superscript letters. First superscript letter in each stroke subtype column identifies significant differences among the eight risk factors. 2The same superscript letter, a or b, to the right of the superscript comma identifies the significant difference between each two-stroke subtype comparison, with p≤0.05.
Table 6.
The Contribution of Higher Remote Sensing Enhanced Vegetation Index Values, Normalized Difference Vegetation Index Values and Ambient AOD Air Pollutant Concentration Level Values to Changes in Stroke Subtype Occurrence and Risk.
Table 6.
The Contribution of Higher Remote Sensing Enhanced Vegetation Index Values, Normalized Difference Vegetation Index Values and Ambient AOD Air Pollutant Concentration Level Values to Changes in Stroke Subtype Occurrence and Risk.
| AREA1 |
RS2 | Type3 | Outcomes4 |
| AU [15] | AOD-PM2.5 AOD-NO2 NDVI |
STK | In an ecologic cross-sectional study of 699 neighborhoods, AOD-PM2.5 and AOD-NO2 were positively and significantly associated with self-reported STK prevalence, while NDVI greenness was negatively and significantly associated with STK prevalence. |
| BE [43] | NDVI |
CRV | In a prospective study of 23,003 CRV adults at least 30 years old, NDVI greenness did not significantly decrease CRV mortality. |
| BR [16] | NDVI | CRV | In an ecologic study of census tracts, study participants exposed to fourth quartile NDVI values showed significantly lower CRV mortality. |
| CA [18] | NDVI | STK | In a retrospective cohort study of 89,958 persons, an interquartile NDVI increase produced a significant decrease in STK incidence, even after controlling for SES and ambient air pollution. |
| CA [19] | NDVI | CRV | In a cohort of 5,955 non-immigrant persons in 30 CA cities, higher NDVI values were negatively and significantly associated with lower CRV mortality after controlling for ambient air pollutants. |
| CN [127] | AOD-PM2.5 NDVI |
ISC | The AOD-PM2.5 produced increase in ISC stroke mortality was significant in an area with a lower NDVI value of 0.31, but not in an area with a higher NDVI value of 0.57. |
| CN [125] | AOD-PM2.5 AOD-NO2 EVI |
HEM ISC |
Compared to the first two EVI tertiles, the highest EVI tertile significantly decreased the contribution of AOD-PM2.5 and AOD-NO2 to increased HEM stroke and ISC stroke mortality risk. |
| CN [126] | AOD-PM2.5 AOD-NO2 AOD-O3 AOD-SO2 AOD-CO EVI |
HEM ISC STK |
Results from a case-crossover design showed that higher neighborhood EVI values significantly decreased AOD-NO2 risk of first HEM stroke, ISC stroke, and STK. |
| CN [44] | AOD-O3 EVI NDVI |
HEM | AOD-O3 significantly increased HEM stroke mortality only during the warm season, but higher NDVI and EVI values significantly decreased HEM stroke mortality during the warm season and the entire year. |
| CN [129] | AOD-O3 EVI |
HEM ISC |
In urban counties only, higher EVI values significantly mitigated the AOD-O3 produced increase in ISC stroke mortality but not HEM stroke mortality. |
| CN [124] | NDVI | STK | In a cross-sectional study, higher movement activity or higher NDVI values were negatively and significantly associated with 25% and 45% decreased stroke risk, respectively. |
| CN [21] | NDVI | HEM ISC STK |
In a prospective study of adults who were 30-79 years old, a 0.1 increase in the NDVI maximum value was inversely and significantly associated with lower STK and ISC stroke risk but not HEM stroke risk. |
| ES [20] | NDVI | ISC | In Barcelona, higher third and fourth quartile NDVI values were negatively and significantly associated with lower acute ISC stroke hospitalization risk. |
| IT [22] | NDVI | CRV STK |
In Rome, 5th NDVI quintile values were negatively and significantly associated with lower CRV mortality and STK incidence. |
| US [123] | NDVI | STK/TIA | In a cross-sectional study completed in Miami-Dade County, Florida, higher census block NDVI values were negatively and significantly associated with decreased STK/TIA risk after controlling for SES. |
| US [128] | GRN MAPS | STK | In Los Angeles, a one interquartile increase in greenspace aggregation was associated with a 0.44% decrease in STK prevalence. |
| US [17] | EVI NDVI |
STK | The Reasons for Geographic and Racial Differences in Stroke cohort study found significant inverse associations between higher EVI and NDVI values and lower STK incidence risk in the Stroke Belt. |
1AREA acronyms: 2+, two or more; AU, Australia; BE, Belgium; BR, Brazil; CA, Canada; CN, China; ES, Spain; IT, Italy; US, United States. The reference number next to the country acronym in the Area column identifies the publication. 2RS, remote sensing, acronyms: AOD, aerosol optical depth; EVI, enhanced vegetation index; GRN MAPS, greenness maps; NDVI, normalized difference vegetation index; AOD-CO, ambient AOD-carbon monoxide; AOD-NO2, ambient AOD-nitrogen dioxide; AOD-O3, ambient AOD-ozone; AOD-PM2.5, ambient AOD-fine particulate matter; AOD-SO2, ambient AOD-sulfur dioxide. 3TYPE acronyms: CRV, cerebrovascular; HEM, hemorrhagic; ISC, ischemic; STK, stroke; STK/TIA, stroke/transient ischemic attack. 4OUTCOME acronym: SES, social economic status.
Table 7.
Totals (Percentages) of Single and Multiple Physiologic Mechanisms Included in the Discussion Section of Reviewed Research Publications by Stroke Subtype.
Table 7.
Totals (Percentages) of Single and Multiple Physiologic Mechanisms Included in the Discussion Section of Reviewed Research Publications by Stroke Subtype.
| PHYSIOLOGIC MECHANISMS1,3 | Stroke Subtype2, 3-4 | ||||
| CRVb, ab | HEMb, ac | ISCb, bd | STKb, cd | Total | |
| IM | 0 (0.00) | 5 (1.49) | 7 (2.08) | 8 (2.38) | 20 (5.95) |
| IM-IN | 2 (0.60) | 2 (0.60) | 2 (0.60) | 1 (0.30) | 7 (2.08) |
| IM-IN-OS | 0 (0.00) | 6 (1.79) | 6 (1.79) | 9 (2.68) | 21 (6.25) |
| IM-OS | 0 (0.00) | 3 (0.89) | 2 (0.60) | 1 (0.30) | 6 (1.79) |
| INb | 6 (1.79) | 18 (5.36) | 28 (8.33) | 13 (3.87) | 65 (19.35) |
| IN-OSb | 11 (3.27) | 32 (9.52) | 35 (10.42) | 32 (9.52) | 110 (32.74) |
| OS | 3 (0.89) | 0 (0.00) | 4 (1.19) | 6 (1.79) | 13 (3.87) |
| OTHa | 24 (7.14) | 17 (5.06 | 17 (5.06) | 36 (10.71) | 94 (27.98) |
| Total | 46 (13.69) | 83 (24.70) | 101 (30.06) | 106 (31.55) | 336 (100.00) |
1Physiologic mechanism acronyms: IM, immune; IN, inflammation; OS, oxidative stress; OTH, other. 2Stroke subtype acronyms: CRV, cerebrovascular; HEM, hemorrhagic; ISC, ischemic; STK, stroke. 3Significance was evaluated using the Chi-Square Test if the expected cell count was ≥5 or the Monte Carlo Estimate for the Exact Test if the expected cell count was <5. Significance for the Chi-Square test (a, p≤0.05; b, p≤0.01) and the Monte Carlo Estimate of the Exact Test (a, p≤0.05; b, p≤0.01). The first superscript letter identifies significant differences for each Physiologic Mechanism (row) or Stroke Subtype (column). 4Two-stroke subtype comparisons are significantly different from each other at p≤0.05 if they have the same superscript letter to the right of the superscript comma.
Table 8.
Guidelines for the Development, Implementation, Evaluation and Dissemination Stages of a Population-Based Stroke Subtype Intervention Program1.
Table 8.
Guidelines for the Development, Implementation, Evaluation and Dissemination Stages of a Population-Based Stroke Subtype Intervention Program1.
| Activities | Available Options2 |
| Development Stage | |
| Stroke Subtype | CRV, HEM, ISC, STK |
| Risk Factors | Environmental, Study participant Attributes, OTH |
| Pollutants | Ambient AOD-air pollutant, Industrial, or Indoor |
| Constituents | Lead, Dust. Soil, OTH |
| Physiologic Mechanisms | IM, IN, OS, OTH, 2+ |
| Greenness (Protective) | EVI, NDVI |
| Resources | Public health infrastructure, Health care system |
| Objectives | Define outcomes as measurable endpoints |
| Implementation Stage | |
| Infrastructure | Hire and train employees |
| Location | Identify intervention catchment area |
| Recruitment | Enroll intervention study participants |
| Duration | Establish starting and ending dates |
| Subgoals | Internal assessment of milestone attainment |
| Evaluation Stage | |
| Accomplishments | Statistically evaluate intervention outcomes |
| Confirmation | Agreement with previously reported outcome |
| Unique Outcomes | Describe importance of new findings |
| Dissemination Stage | |
| Study Participants | Describe intervention results |
| Study Area | Present program results to community members |
| Professionals | Conference presentations |
| Scientific Journals | Publish results |
1These suggested guidelines should be used with the descriptive stroke subtype physiologic mechanism model, shown in Figure 3A. 2Acronyms: Stroke Subtype (CRV, cerebrovascular; HEM, hemorrhagic; ISC, ischemic; STK, stroke); Risk Factors (OTH, other); Pollutants (AOD, aerosol optical depth); Physiologic Mechanisms (IM, immune; IN, inflammation; OS, oxidative stress; 2+, two or more); Greenness (EVI, enhanced vegetation index; NDVI, normalized difference vegetation index).
Disclaimer/Publisher’s Note: The statements, opinions and data contained in all publications are solely those of the individual author(s) and contributor(s) and not of MDPI and/or the editor(s). MDPI and/or the editor(s) disclaim responsibility for any injury to people or property resulting from any ideas, methods, instructions or products referred to in the content. |
© 2026 by the authors. Licensee MDPI, Basel, Switzerland. This article is an open access article distributed under the terms and conditions of the Creative Commons Attribution (CC BY) license (http://creativecommons.org/licenses/by/4.0/).
Copyright: This open access article is published under a Creative Commons CC BY 4.0 license, which permit the free download, distribution, and reuse, provided that the author and preprint are cited in any reuse.


