Preprint
Article

This version is not peer-reviewed.

Do Ecological Patterns Persist in Highly Impacted Urban Wetlands? A Spatiotemporal Analysis of Aquatic Macrophytes and Limnological Variability in a Peruvian Coastal Wetland

Submitted:

02 March 2026

Posted:

04 March 2026

You are already at the latest version

Abstract

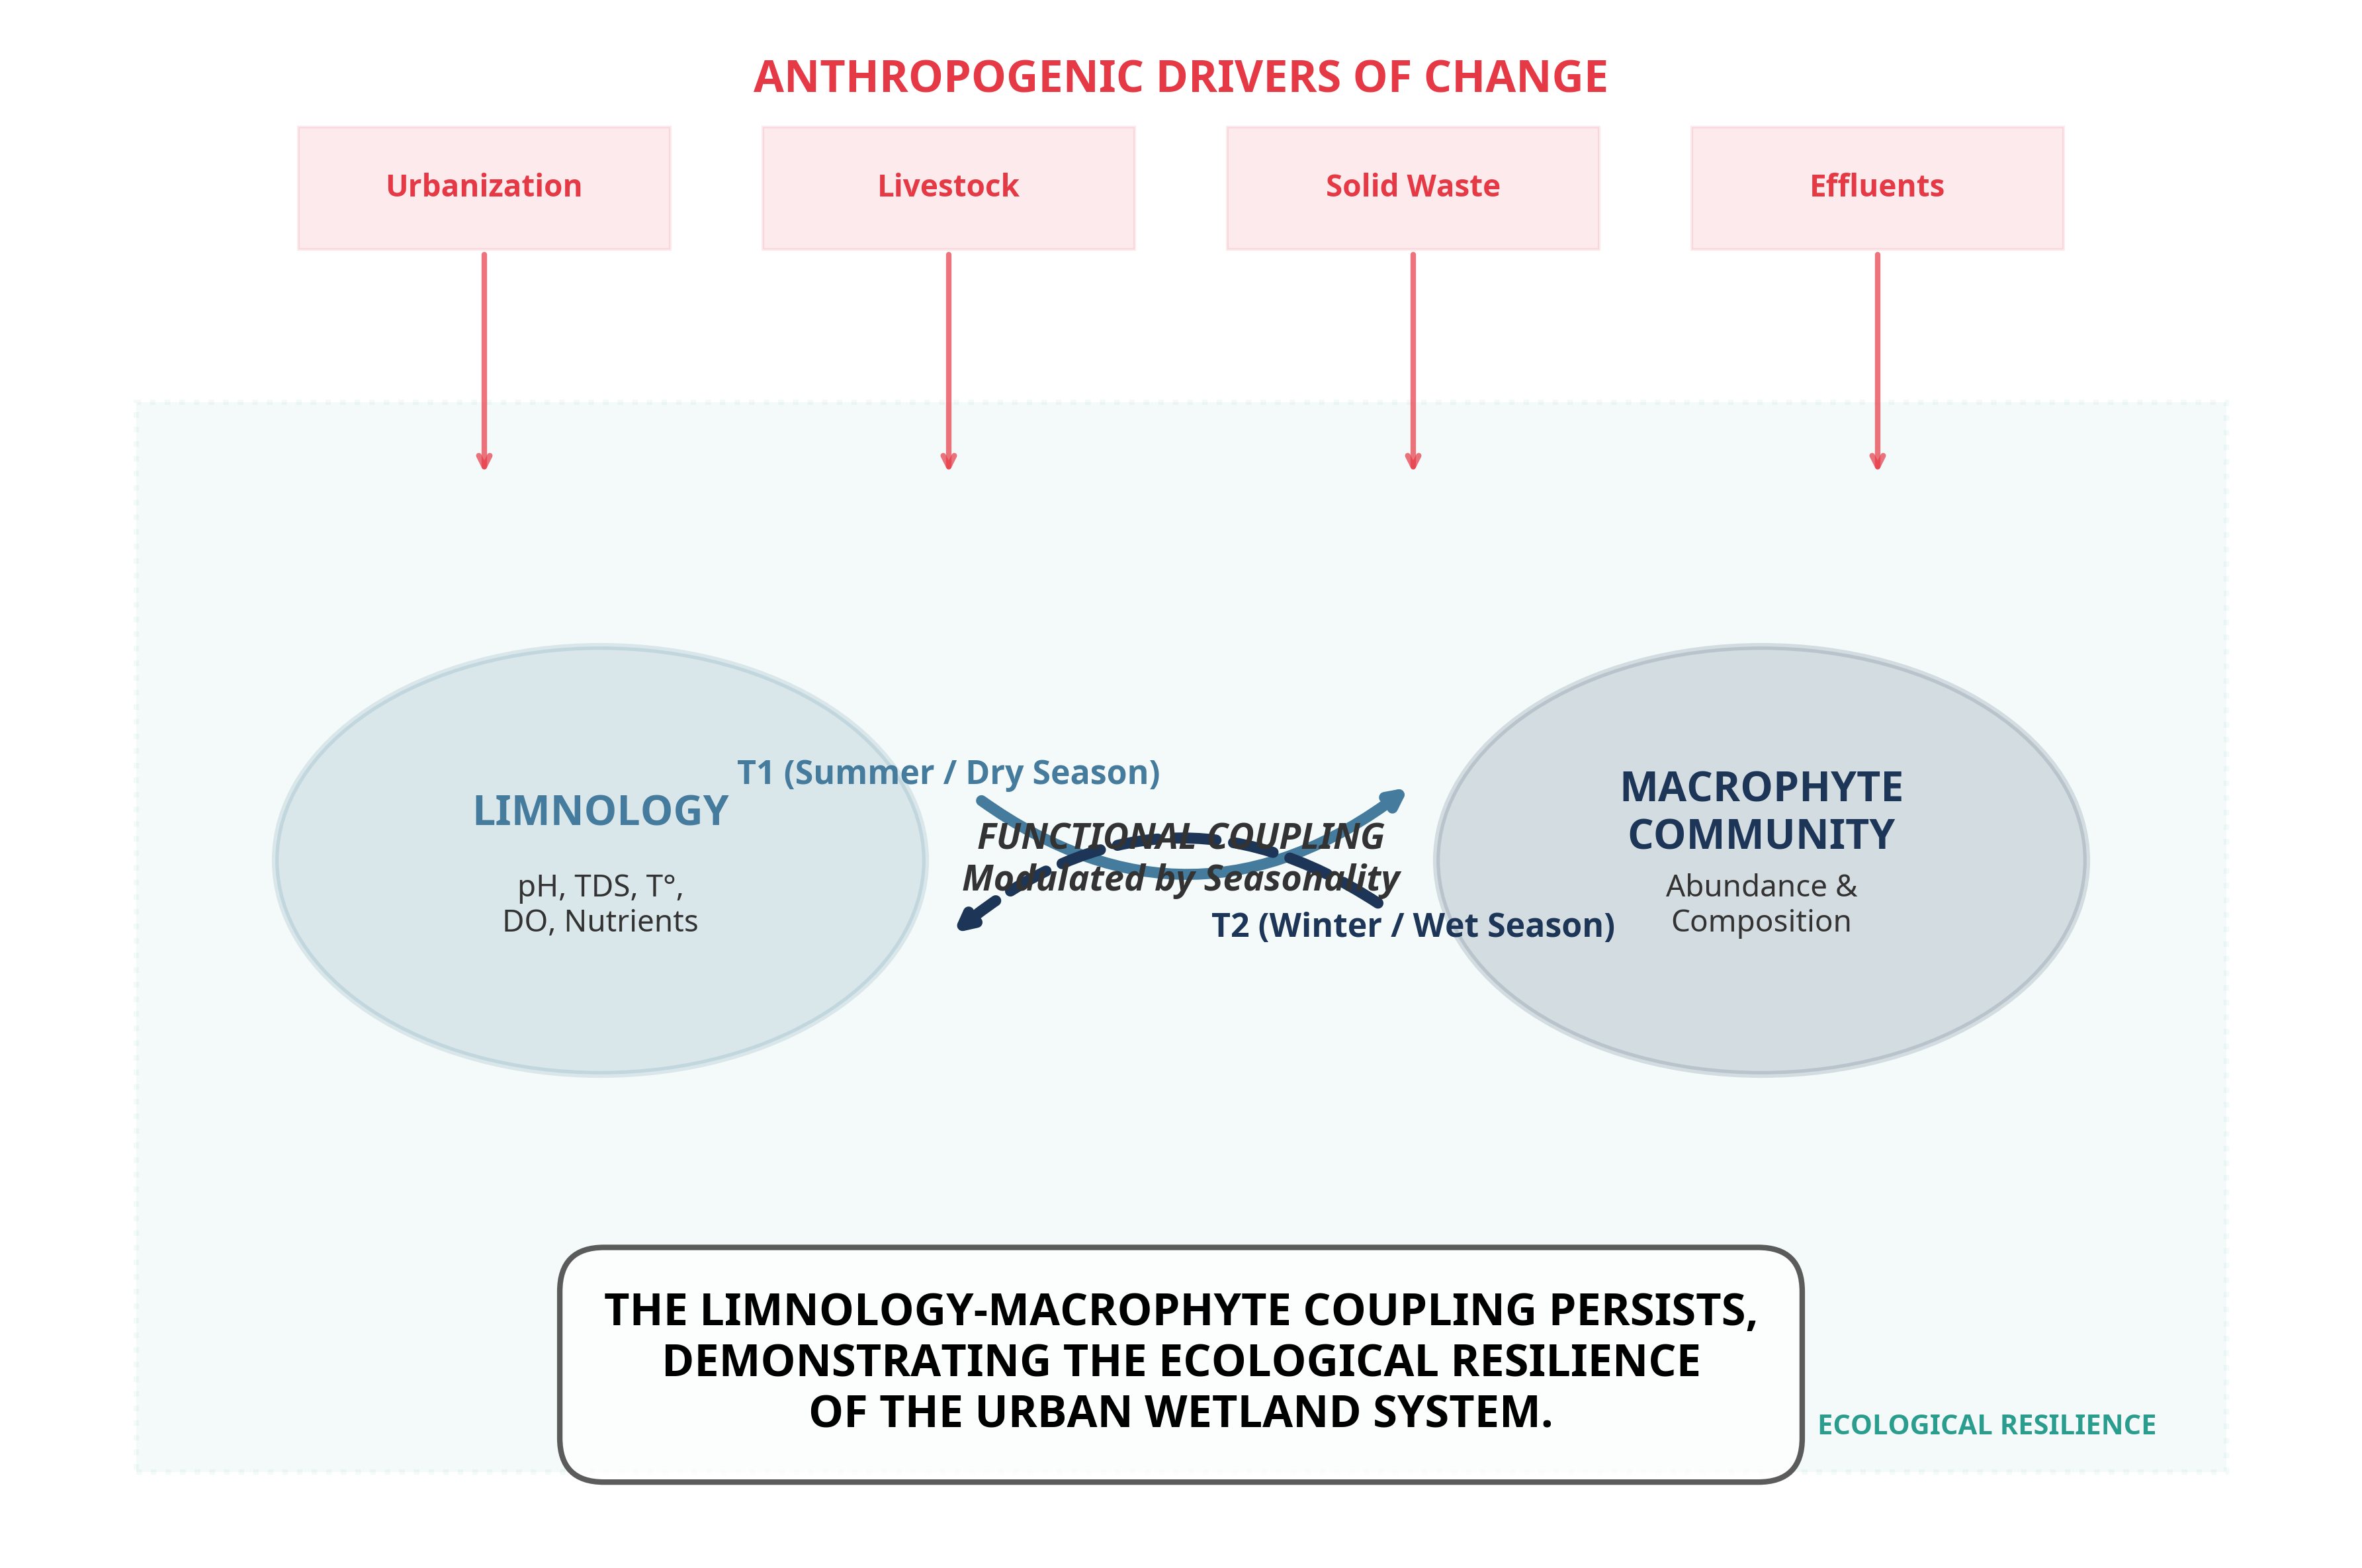
Urban coastal wetlands along the Peruvian Pacific coast are increasingly affected by urban expansion, pollution, and hydrological alterations, compromising their ecological integrity. In this context, the spatiotemporal variation of the aquatic macrophyte community and its relationship with limnological conditions and drivers of change were evaluated in the Santa Rosa wetland (Chancay, Lima). The objective is to evaluate the spatiotemporal variation of the aquatic macrophyte community in the Santa Rosa wetland and analyze its relationship with physicochemical limnological variables and drivers of change. Sampling was conducted during two contrasting hydrological seasons in 2022: T1 (summer) and T2 (winter), at six sampling points (P1–P6). Physicochemical variables (water depth, temperature, pH, conductivity, TDS, TSS, dissolved oxygen, turbidity, nitrate, ammonium, phosphorus, and dissolved organic matter) were measured, and the relative abundance of aquatic macrophytes was evaluated. Drivers of change were identified through direct observation and a structured matrix, with a PCoA performed to summarize spatiotemporal trends. Data were analyzed using Principal Component Analysis (PCA), Co-inertia analysis, and Multi-Response Permutation Procedures (MRPP). Significant spatiotemporal variation was observed in physicochemical parameters (p < 0.05), with moderate covariation between the two matrices (RV = 0.47). A total of ten aquatic macrophyte species were recorded, with higher abundance of Pontederia crassipes and Pistia stratiotes in T1, and Hydrocotyle ranunculoides and Bacopa monnieri in T2. The most relevant drivers of change were solid waste, livestock grazing, organic contamination, and urban expansion. Spatial heterogeneity was observed in the drivers of change affecting the Santa Rosa wetland, forming a mosaic of areas with different impact profiles. Despite multiple anthropogenic pressures, the Santa Rosa wetland maintains a limnological structure and a functionally coupled macrophyte community, evidencing ecological resilience to environmental degradation. The observed covariation between physicochemical conditions and vegetation confirms the persistence of essential ecological processes, even within an altered urban context. This study demonstrates that integrating biotic components, limnological variables, and drivers of change is fundamental to understanding and monitoring the ecological dynamics of urban wetlands along the Peruvian coast.

Keywords: 
;  ;  ;  ;  

1. Introduction

Wetlands are highly productive ecosystems that provide essential ecosystem services, such as hydrological regulation, pollutant purification, and habitat provision for a wide variety of species, particularly adapted to their hydrological dynamics [1]. They also act as carbon sinks and store CO2 in their biomass and sediments, thereby helping to mitigate climate change [2]. Their ability to retain sediments and nutrients prevents eutrophication, leading them to be referred to as the "kidneys of the landscape" [3]. These ecosystems cover between 8.9% and 9.5% of the Earth's surface and are home to remarkable biological diversity, including endemic and endangered species [4]. However, since 1700, nearly 3.4 million km2 of wetlands have been lost, mainly due to land use change; in the last 150 years, more than 50% have been degraded by urban and agricultural expansion, while pollution from fertilizers and pesticides has deteriorated water quality and affected biodiversity, including aquatic macrophyte habitats [5,6,7,8].
The ecological functioning of wetlands is intrinsically linked to the seasonality of the hydrological cycle, physicochemical limnology of the water, and structure of aquatic macrophyte communities [9,10,11,12]. Hydrological regimes regulate seasonal fluctuations in water depth, generating variations in physicochemical limnology, redox conditions, and biogeochemical cycles that control nutrient availability [11,13,14]. Water hydrochemistry and seasonality modify pH, conductivity, salinity, and temperature, affecting the biotic composition and capacity of wetlands to purify water, maintain biodiversity, and provide ecosystem services [15,16].
The aquatic macrophyte community includes freshwater photosynthetic organisms that are visible to the naked eye and can be found as emergent, floating, permanently submerged, or periodically submerged [17]. Their role in ion absorption and transport between sediment and the water column is key to the nutrient cycle and carbon dynamics, influencing dissolved oxygen concentration, nutrient availability, and water quality [9,18,19]. Likewise, their primary production supports multiple trophic levels, and their physical structures provide habitats, shelters, and substrates for various organisms [19,20]. This multifunctionality contributes to ecosystem stability and resilience to disturbances [21,22].
The composition, distribution, and abundance of aquatic macrophytes respond to the interaction of abiotic, biotic, and anthropogenic factors. Among the main hydrological factors, the intensity, duration, and frequency of high and low water levels determine water volume and habitat availability [12,19,21]. Similarly, variability in nutrients, pH, turbidity, and conductivity, together with biotic processes such as competition and herbivory, regulate the richness and dominance of macrophyte species [18,20,23,24]. Eutrophication, fragmentation, and anthropogenic impacts alter these processes to varying degrees [22,25,26,27].
The wetlands of the Peruvian Pacific are unique ecosystems in the arid subtropical desert, shaped by the interaction between natural processes, such as marine intrusions, El Niño events (ENSO) and exfiltration from coastal aquifers, and human activities, including urban and agricultural runoff, resulting in a complex and dynamic hydrological regime [28,29,30,31]. The Santa Rosa wetland, the subject of this study, is one of the most important on the central Peruvian coast from a scientific perspective and is characterized by the highest reported floristic diversity among the coastal wetlands of the Department of Lima, with well-structured communities representative of different functional types of macrophytes [32,33,34]. Although studies have been conducted on the diversity of the Peruvian Pacific wetlands, mainly on flora and avifauna [34,35,36], limnological knowledge, particularly regarding the relationship between the physicochemical parameters of water and biota, remains poorly resolved. Previous studies addressing the physicochemical characteristics of water in this system have been spatially restricted and temporally discontinuous, precluding robust assessments of seasonal and interannual variability [37,38,39], and studies that integrate relationships with aquatic biota are mostly limited to benthic invertebrates [40,41,42]. While some relationships between physicochemical limnology and aquatic macrophytes have been explored [43,44], the role of physicochemical parameters as determinants of the structure of this community and its spatiotemporal dynamics in urban wetlands represents a critical information gap, which is particularly relevant given the increasing degradation of these environments by anthropogenic activities that compromise their diversity and ecosystem services [32,45,46,47,48].
In this context, the present study aimed to evaluate the spatiotemporal dynamics of the aquatic macrophyte community of the Santa Rosa wetland during summer (March) and winter (September) of 2022, determine its relationship with the physicochemical parameters of the water, and characterize the most important drivers of change. We hypothesize that hydrological seasonality drives significant variation in water physicochemical parameters and in the composition and percent cover of aquatic macrophyte assemblages.'

2. Materials and Methods

2.1. Study Area

The Santa Rosa wetland is located in the district of Chancay, Huaral, Lima region, Peru (Figure 1). Bordered by El Cascajo (north) and Salinas (east) hills, the agricultural lands of Peralvillo and Salinas Altas (south), and the Pacific Ocean (west), it includes a main lake of approximately 17.5 ha and secondary wetlands [49,50]. Its hydrological regime depends on an irrigation canal derived from the Chancay River and the exfiltration of groundwater recharged by agricultural irrigation [31,49]. The maximum water depth occurs between August and October, decreasing towards summer, when Chancay River floods raise it slightly [41]. The wetland features diverse habitats and plant formations: the main body of water, reed beds dominated by T. domingensis, reed beds dominated by S. americanus, beach areas, unvegetated areas, mixed meadows associated with agricultural and urban areas, cleared areas affected by human activities and shrubby areas [51]. Since 2020, it has been classified as an Environmental Conservation Area under municipal management (Ordinance No. 013-2020-MPH-CM).

2.2. Sampling Design

Six sampling points (P1–P6) were established (Figure 1). Sampling was carried out during two contrasting periods of the hydrological cycle: March 2022 (summer season, T1) and September 2022 (winter season, T2).
P1 is located in an area influenced by the irrigation canal derived from the Chancay River, which receives agricultural and urban effluents, with a predominance of Pontederia crassipes (Mart.). P2 was located at the eastern end of the main lagoon and is covered with Bacopa monnieri (L.) Wettst and P. stratiotes. P3 is a seasonally saturated area with heterogeneous and seasonal vegetation of T. domingensis, P. crassipes, and S. americanus. P4 corresponds to a deep drainage channel where P. crassipes is conspicuous and the sediments are thick. P5 and P6, at the western and central ends of the lagoon, respectively, are areas with seasonally variable depths and accumulation of organic matter, dominated by P. stratiotes, B. monnieri, and H. ranunculoides.

2.3. In situ Analysis of Physicochemical Parameters

Depth was measured using a graduated ruler with an accuracy of 1 mm. Physicochemical limnological parameters were recorded in the surface layer of the water (0–20 cm), following the National Protocol for Water Resource Monitoring [52]. The temperature (°C) (Standard Method 2550), pH (Standard Method 4500-H+), electrical conductivity (μS/cm) (Standard Method 2510), total dissolved solids (TDS), and dissolved oxygen (DO) (Standard Method 4500-O) were measured using a YSI Pro multiparameter meter. Turbidity was determined using a Lutron LT-TU2016 turbidimeter (Standard Method 2130 B), while total suspended solids (TSS) were measured with a Hach DR900 photocolorimeter (Standard Method 2540). All measurements were taken between 10:00 a.m. and 2:00 p.m. to reduce diurnal variability in the physicochemical limnological parameters. Determinations were made following the Standard Methods for the Examination of Water and Wastewater [53]. For nutrient analysis, 500 mL of surface water was collected at each sampling point, selecting representative and homogeneous areas and avoiding substrate disturbance. The samples were stored at 4 °C for transport and subsequent processing in the laboratory. Phosphate concentration was determined using the ascorbic acid method with a Hanna HI3850 photocolorimeter (Standard Method 4500-P E), ammonium using the Nessler method with a Hanna HI733 photocolorimeter (Standard Method 4500-NH3), and nitrate using the cadmium reduction method with a Hach DR900 photocolorimeter (Standard Method 4500-NO3-E). Dissolved organic matter was determined by gravimetry, using 0.45 μm glass fiber filters, vacuum filtration, and subsequent incineration of volatile solids at 550 °C in a muffle furnace for 2 h [54].

2.4. Aquatic Macrophytes Abundance Determination and Sample Collection

2.4.1. Determination of the Relative Abundance of Aquatic Macrophytes

To estimate the relative abundance of aquatic macrophytes 0.5 m2 quadrats were used by applying a quantitative method based on direct coverage estimates [55].

2.4.2. Species Identification of Aquatic Macrophytes

Aquatic macrophytes were collected at each sampling point and preserved in polyethylene bags with formalin. Identification was based on specialized literature [56] and taxonomic checklists [33,34]. The specimens were deposited in the Herbarium of the Natural History Museum of Ricardo Palma University.

2.5. Identification and Classification of Drivers of Change (DOC)

The approach proposed by Sarkar et al. [57] and adapted by Aponte et al. [32] was applied. In the case of the Santa Rosa wetland, specific modifications were incorporated, and the recommendations from the recently developed methodological framework for coastal wetlands in Peru [46] were also considered in the interpretation of the data. DOCs were classified as direct (immediate physical and chemical impacts) and indirect (sociopolitical, economic, and cultural factors that modulate direct drivers). Direct DOCs included: uncontrolled urban growth (CUD); agricultural (DGA) and livestock (DGP) degradation; introduction of exotic species (IEE); chemical (COQ), organic (CORG), and microbiological (COM) contamination; domestic (RSS) and construction (RSC) solid waste; landfill and drainage (SDE); presence of farms (PGR); effluents (EFL); and other disturbances (e.g., undermining or extraction) (OTP). The only indirect DOC considered was poor management and inadequate governance policies (GMI). Identification was carried out through direct observation at the six sampling points with photographic recording and GPS georeferencing, based on parallel research and a literature review. The analysis was performed during T1 and T2.

2.6. Data Analysis

Principal coordinate analysis (PCoA) was performed using the vegan package in R [58] to evaluate the spatiotemporal variation of the DOCs. Matrices were constructed with the physicochemical parameters and relative abundance of macrophytes by season (T1 and T2) and sampling point (P1–P6), which were summarized in tables and graphs. The relationship between the environmental and biological matrices was evaluated using Spearman's correlation (ρ), considering the value of the statistic and its significance (p < 0.05). Physicochemical data were normalized, and the biotic matrix was transformed using the Hellinger procedure, excluding species with a single occurrence [59].
Principal component analysis (PCA) was used to summarize variability and determine spatiotemporal patterns. The significant axes of the PCA were analyzed using multiple response permutation analysis (MRPP) in Vegan package, considering seasons and sampling points as factors of variability [60,61]. The significant axes of an ordination analysis concentrate on the variability of a data matrix and identify the variables that explain it, that is, those most correlated with the axes, allowing statistical inference about this relationship [59]. The relationship between the matrices was analyzed by co-inertia analysis using the ade4 package [62,63]. Co-inertia assesses the covariation of the significant axes of PCA, quantifying shared inertia through the RV coefficient as a measure of the association between both matrices [59]. All analyses were performed using R and RStudio software [64,65].

3. Results

3.1. Spatiotemporal Variation

3.1.1. Macrophytes

Ten species of aquatic macrophytes were recorded: H. ranunculoides, P. crassipes, P. stratiotes, Azolla filiculoides Lam., B. monnieri, Ludwigia peruviana (L.) H. Hara, S. americanus, L. gibba, Nasturtium officinale W. T Aiton, and Paspalum vaginatum Sw. Macrophyte coverage generally ranged from 35% to 100%, with significant variations between T1 and T2 at sampling points P1 to P6. At P1, the coverage increased from 88% in T1 to 100% in T2. At P2, there was an increase from 85% in T1 to 100% in T2. In contrast, at P3, coverage decreased slightly from 90% in T1 to 85% in T2. At P4, high levels of coverage were recorded during both periods (95% in T1 and 100% in T2). At P5, coverage showed notable variation, from 60% in T1 to 35% in T2. Finally, at P6, coverage reached 98% in T1 and decreased to 75% in T2 (Figure 2).
Regarding the composition and representativeness of aquatic macrophytes per sampling point and season, at P1 dominance changed from P. crassipes (65% in T1) to H. ranunculoides (55% in T2) (Figure 3A). At P2, H. ranunculoides was dominant in T1 (50%); however, in T2, it decreased to 6% and was replaced by P. stratiotes (80%) (Figure 3B). At P3, B. monnieri dominated in T1 (50%), whereas in T2, it was absent and dominance shifted to H. ranunculoides (40%) together with P. stratiotes (30%) (Figure 3C).At P4, the dominance of P. crassipes (60%) and L. peruviana (35%) in T1 decreased in T2, whereas A. filiculoides reached 50% (Figure3D). At P5, the dominance among B. monnieri (40%), H. ranunculoides (30 %), and P. stratiotes (25%) in T1 was reduced in T2 to the exclusive presence of B. monnieri (35%) (Figure 3E). Finally, at P6, the shared dominance between P. stratiotes (60%) and H. ranunculoides (35%) in T1 changed in T2 to the sole presence of P. stratiotes (75%) (Figure 3F).

3.1.2. Physicochemical Parameters

Spatiotemporal variation was observed in physicochemical parameters (Table 1). Depth increased in T2 compared with T1, except at P4, where it decreased. The temperature decreased in T2 (16.7–22.1 °C) compared with T1 (22–25.9 °C). Dissolved oxygen increased significantly in T2 (3.2–8.2 mg/L), reaching the maximum value at P5 (8.5 mg/L) and the minimum at P2 (3.2 mg/L). The pH remained alkaline in both seasons, with a slight decrease in T2. Conductivity and TDS showed reductions in T2, reflecting a seasonal ionic dilution process. Similarly, TSS and turbidity decreased, with the highest values recorded at P6 (TSS) and P1 (turbidity) during T1, and the lowest at P4 in T2. Regarding nutrients, nitrates showed marked spatial variation in both seasons, while ammonium and phosphates tended to increase in T2, with maxima at P1 and P3 for ammonium, and at P3 for phosphates. Dissolved organic matter (DOM) showed a heterogeneous pattern among sampling points, with increases at P3 and P5 and decreases at P1, P2, and P4 in T2.

3.2. Spearman's Correlation Matrix and Drivers of Change

3.2.1. Spearman’s Correlation Matrix

A positive correlation was observed between electrical conductivity and TDS (ρ = 0.88), and among turbidity, TSS, and DOM (ρ ≥ 0.73). In contrast, dissolved oxygen decreased as temperature increased (ρ = -0.84). P. crassipes and L. peruviana were positively correlated (ρ = 0.72). Regarding the physicochemical-macrophyte relationship, P. crassipes was negatively correlated with conductivity (ρ = -0.67), TDS (ρ = -0.87), and phosphates (ρ = -0.78) (Figure 4).

3.2.2. Drivers of Change

The analysis of drivers of change (DOC) in the Santa Rosa Wetland revealed a spatially heterogeneous pattern of impact (Table 2). P4 had the highest number of DOCs (12), followed by P1 and P5 (9), P6 (7), and P2 and P3 (6 each), respectively. Livestock degradation (DGP), characterized by cattle, sheep, goat, and pig farming, was present at all sampling points. Similarly, introduction of exotic species (IEE), such as dogs and free-grazing livestock (cattle, sheep, and goats) occurred at all locations. Organic contamination (CORG), characterized by food and agricultural waste, livestock manure, urban effluents, as well as microbiological contamination (COM), indicated by the presence of thermotolerant coliforms, were also recorded at all sampling points. Governance failures (GMI), including poor inter-institutional participation and coordination leading to deficiencies in the effective protection of wetlands, were considered common to all sampling points. Chemical contamination (COQ), characterized by the use of pesticides and fertilizers, was recorded at P1, P4, P5, and P6. Solid waste (RSS) was found at P4, P5, P6, and P1 during T1, and construction solid waste (RSC) and burial/desiccation waste (SDE) were recorded at P1, P4, and P5. Other DOCs showed localized distribution: uncontrolled urban growth (CUD) was recorded only at P4; agricultural degradation associated with land use change for agriculture (DGA) at P3 and P4; pig and cattle farms (PGR) in P2; effluents (EFL) at P1, and other disturbances (OTP), such as alteration of residence time due to drainage excavation, only in P4 in T2.

3.2.3. Principal Coordinates Analysis (PCoA)

The ordination based on the drivers of change (DC) matrix revealed spatial heterogeneity in the pressures affecting the Santa Rosa Wetland (Figure 5). Sampling points formed discrete and well-defined groups, in which the primary source of variation was spatial location rather than temporal dimension, suggesting persistence of pressure profiles at each point throughout the analyzed period. Axis PCoA1 separated P2 and P3 from the remaining sampling points, while axis PCoA2 distinguished P3 from P4. Four subgroups emerged based on DOC incidence: one comprising P1, P5, and P6, which share a similar DOC profile, and three points (P2, P3, and P4) that clustered separately, each exhibiting a distinctive set of drivers of change. Collectively, these results indicate that driver variability in the wetland is predominantly spatial, resulting in a mosaic of zones with differentiated impact profiles.

3.3. Relationship Between Biotic and Abiotic Matrices

3.3.1. Principal Component Analysis (PCA)

The first three principal components (PC1, PC2, and PC3) of the principal component analysis (PCA) of the abiotic matrix explained 74.55% of the total variability (PC1: 34.47%; PC2: 21.06%; PC3: 19.02%). PC1 retained the variability of turbidity, temperature, and total suspended solids (ρ = -0.941, -0.864, and -0.850, respectively), showing a temporal gradient of change. PC2 concentrated the variability of conductivity and total dissolved solids (ρ = 0.794 and 0.792, respectively), showing a gradient of ionic concentrations between sampling points and seasons. PC3 retained the variability of pH and phosphates (ρ = -0.750 and -0.872, respectively), associated with a gradient of acidity and nutrient availability (Figure 6). The PCA of the biotic matrix explained 76.87% of the variability in the first three components (PC1: 31.20%; PC2: 27.15%; and PC3: 18.51%). PC1 retained the variability of P. stratiotes, P. crassipes, and L. peruviana (ρ = -0.830, -0.788, and 0.728, respectively), reflecting a spatial gradient associated with dominant floating and emergent species. In PC2, B. monnieri and S. americanus concentrated their variability (ρ = -0.891 and 0.625, respectively), characterizing a spatiotemporal pattern of occurrence in shallower environments. PC3 was associated with the occurrence of A. filiculoides (ρ = 0.875), indicating favorable conditions for this species (Figure 7). Statistically significant differences were found in the MRPPs between seasons (PC1) and sampling points (PC3) of the abiotic matrix (p < 0.04 and p < 0.037, respectively) and between sampling points for PC2 of the biotic matrix (p < 0.047).

3.3.2. Co-Inertia

The co-inertia analysis obtained a total inertia of 8.693, retaining 88.97% of the co-inertia (E1: 50.48%, E2: 25.84%, and E3: 12.65%). The correlation (covariation) between both matrices was high for axes 1 and 2, and moderate for axis 3 (ρE1 = 0.86, ρE2 = 0.82, ρE3 = 0.67). An RV coefficient of 0.468 was obtained, representing moderate covariation between the matrices. A main gradient (E1) was observed, defined by TDS, Cond, TSS, Turb, PO43-, NO3- (positive correlation), and Depth (negative correlation). E2 showed a gradient of pH and PO43- (positive correlation) and NH4+ and NO3- (negative correlation). The axis structure reflects the pattern observed in the PCA, with the dilution of the main ions as the depth increased. P. stratiotes showed covariation with TDS, Cond, NO3, PO43-, and pH. B. monnieri was associated with pH and PO43-, whereas H. ranunculoides was more related to shallow environments with high concentrations of NH4+, TSS, and Turb. A. filiculoides was associated with deeper and less mineralized environments, whereas P. crassipes was more related to less mineralized environments (Figure 8). Good agreement was observed between the biotic and abiotic matrices in T2P3, T2P2, T1P6, and T2P5 (short arrows) (Figure 9), while in T2P6, T1P1, T1P5, T1P3, and T2P4, disagreement was observed between both matrices (long arrows). T1P2, T1P5, and T1P6 were associated with the Cond, TDS, pH, and PO43- gradient and the presence of P. stratiotes and B. monnieri; T1P4 and T2P4 were associated with low mineralization and the presence of P. crassipes and A. filiculoides, whereas T2P1 and T2P3 were associated with H. ranunculoides and high concentrations of NH4+, TSS, and Turbidity. In general, a pattern of ionic dilution was observed with increasing depth from T1 to T2, and a temporal gradient of change in physicochemical limnology and aquatic macrophytes (Figure 8 and Figure 9). Although moderate covariation was observed between the matrices, it was not statistically significant (p > 0.05) owing to variability within each sampling point.

4. Discussion

The ecological dynamics of wetlands are characterized by a hierarchical interaction among the hydrological regime, physicochemical limnology, and structure of the aquatic macrophyte community, with linkages that vary spatially and temporally [9,13,18]. This relationship is not unidirectional; aquatic macrophytes and the consequences they have on physicochemical heterogeneity can feed back into the system, altering or buffering the hydrological regime [17,19,20]. The alternation of these processes defines a wetland as ecological systems [12], and it is within this dynamic that anthropogenic impacts become evident [22,23,66].
The Santa Rosa wetland is severely affected by various drivers of change that compromise its integrity, as are most coastal wetlands on the Lima, which are predominantly urban [32]. However, the fundamental ecological pattern of a wetland, the spatiotemporal variability of physicochemical limnology, and the macrophyte community modulated by the different phases of hydrological seasonality are still recognizable, with some reservations, as demonstrated in this study, which is the first of its kind in Peruvian coastal wetlands.
The results show that the Santa Rosa wetland is subject to a combination of direct and indirect drivers of change that act synergistically and generate cumulative pressures on its ecological integrity. The simultaneous presence of factors, such as waste accumulation, livestock farming, and the introduction of exotic species, has been widely documented as one of the main causes of tropical wetland degradation [57,67]. These direct drivers act on habitat structure and water quality, whereas indirect factors, such as poor governance and unplanned urban expansion, perpetuate these impacts by weakening institutional capacities to mitigate them [32,68]. Evidence suggests that when these drivers coexist spatially, ecological effects intensify, hindering natural recovery processes [69].
In the Santa Rosa wetland, physicochemical limnology showed marked seasonal variations, with higher concentrations of total suspended solids (TSS), turbidity, temperature, conductivity, and total dissolved solids (TDS) during the summer period (T1), attributable to the influence of the irrigation canal in T1 and the ionic dilution effect associated with greater water depth in T2. This pattern is characteristic of shallow wetlands with seasonal connectivity [13,70]. However, the temporal component of the hydrological regime exerts a more decisive control over the limnological dynamics of the system [9,21], which, in the present study, is reflected in the increase in depth and seasonal ionic dilution. It is important to note that the nutrient concentrations and physicochemical parameters recorded, which may seem high compared to pristine wetlands, constitute the current reference condition for a system embedded in an agricultural-urban matrix. Rather than anomalies, these values reflect the current hydrochemical regime that conditions the seasonal variability of the wetland. The ionic content of this system is modulated by local processes (both natural and anthropogenic) and by the specific hydrological characteristics of the Santa Rosa wetland basin. In general, the ionic concentrations (conductivity and TDS) of Santa Rosa wetland are lower than those of other coastal wetlands, such as the Pantanos de Villa, Humedales de Ventanilla, and wetlands in La Libertad region [37,40,42,43]. The conductivity values recorded in the Santa Rosa wetland (3280–940 μS/cm in T1 and T2) were below the limiting thresholds for dominant floating species, such as P. stratiotes and P. crassipes [71,72]. Regarding dissolved oxygen, the recording of critical hypoxia thresholds in T1 (< 2mg/L) and recovery to physiologically acceptable levels for macrophytes and biota in general in T2 [71] shows the alternation of states and their amplitude between seasons. This pattern is particularly evident at some sampling points, which is characteristic of structurally complex wetlands with lacustrine and palustrine sectors [18,20].
Between T1 (summer) and T2 (winter), seasonal replacement of P. crassipes by H. ranunculoides, of P. stratiotes by B. monnieri, and of B. monnieri by P. stratiotes and H. ranunculoides was observed, reflecting a relative increase in marsh species in response to water retreat. However, this pattern varies among sectors of the wetland, where geomorphological heterogeneity and water connectivity modulate the magnitude of the coverage cahnge between sampling points This pattern coincides with observations in other neotropical and urban aquatic systems, where macrophyte communities maintain a stable functional composition in the face of broad environmental gradients, and the homogenization of physical and chemical conditions limits floristic turnover and favors the dominance of a few species [73]. These results are consistent with studies showing that the seasonal dynamics of aquatic macrophytes in shallow wetlands respond strongly to hydrological regimes, especially the flood and retreat cycle, which favors marsh species during periods of decreasing water depth [21,74]. The alternation in dominance between floating and marsh species reflects adaptive mechanisms in response to water variability and habitat availability, which have been documented in neotropical and intertropical systems with marked seasonality [24,70].
The relationship between physicochemical limnology and the distribution of aquatic macrophytes in the Santa Rosa wetland was particularly evident in specific areas. The ionic concentration gradient (pH, conductivity, TDS) was associated with the dominance of P. stratiotes and B. monnieri, whereas H. ranunculoides was limited by increasing depth. In contrast, P. crassipes showed greater affinity for waters with lower pH, TDS, and conductivity. Likewise, a moderate covariation structure was evident between the biotic and abiotic matrices, reflecting specific patterns of change in particular sectors and macrophyte species across seasons and sampling points. Although these patterns were not consistent across the entire matrix, the relationship was not statistically significant. These findings are consistent with previous studies that have documented the sensitivity of aquatic macrophytes to environmental gradients, especially in shallow systems, where fluctuations in pH, nutrients, and conductivity strongly influence species distribution [66]. The specific association of P. crassipes with less mineralized waters and P. stratiotes with more mineralized environments reflects contrasting ecophysiological strategies in response to environmental conditions [20,22]. In the lagoon sector of the Santa Rosa wetland, Muñoz et al. [75] described the dynamics of P. stratiotes, the dominant floating species in that environment, whose growth is influenced by local concentrations of ammonium, phosphate, and phosphorus, highlighting the relevance of physicochemical limnology in the structuring of aquatic macrophytes in wetlands. Likewise, the influence of phosphorus on species assembly coincides with reports indicating that increased nutrient concentrations can induce abrupt changes in the dominance of floating or marsh life-forms [25,76,77]. In the Santa Rosa wetland, agricultural activity has been suggested to promote an increase in the coverage of P. crassipes, P. stratiotes, and Lemna gibba [50,78], with high values of chemical oxygen demand (COD), biological oxygen demand (BOD), total nitrogen (TN), and total phosphorus (TP) being recorded [44,79]. The concentrations of nitrate, ammonium, and phosphate in the Santa Rosa Wetland showed a spatial and temporal gradient of nutrients, associated with variations in the composition and coverage of macrophytes. Although there are no previous records of the degree of trophic status and its progressive increase, the levels recorded in 2022 suggest a system tending toward eutrophication and hypertrophy, with spatial and temporal variability. This condition is not an anomaly, but rather a hydrochemical pattern characteristic of coastal wetlands immersed in agricultural-urban matrices [38,80,81]. The structure of the plant community responds to nutrient availability by assimilating excess nutrients and maintaining ecosystem activity despite anthropogenic pressure [26,82]. Although the results allowed the identification of associations between nutrient gradients and macrophyte distribution, it was not possible to establish retrospective causal relationships with respect to the eutrophication of the system.
The variability in co-inertia at specific sites suggests that unmeasured factors such as herbivory, sedimentation associated with local hydrological regimes, and other localized drivers of change could modulate community structure. In particular, P3 and P4 were influenced by agricultural activity, and chemical contamination at P1, P4 and P5 was linked to agricultural effluents and sediment input; additionally, preferential herbivory on P. crassipes and H. ranunculoides, as observed in the field and documented in the literature [50,83], may modify community responses to limnological variables and seasonality. Thus, the moderate co-inertia between the biotic and abiotic matrices, along with the lack of statistical significance of the RV coefficient despite the observable patterns, stem from the structural complexity of the wetland, which presents lacustrine and palustrine sectors with distinct hydroperiods, connections to agricultural effluents, and anthropogenic pressures that vary in space and time. In addition to the natural complexity of wetlands, local pressures contribute to the lack of concordance between the matrices. Several studies have examined the determinants of aquatic macrophyte community composition across spatial and temporal gradients, yielding results that broadly fall into two categories: (1) those reporting clearly defined causal relationships, typically associated with systems governed by strong structuring factors such as regular hydrosedimentological pulses and well-defined hydrological connectivity [26,77,84,85] and (2) those identifying statistically significant but partially explained patterns, characteristic of systems in which structuring gradients are spatially heterogeneous or temporally variable [24,86,87]. The present study aligns with the latter category, a finding consistent with the inherent hydrological variability and spatial heterogeneity of the Santa Rosa wetland, where the coexistence of lacustrine and palustrine zones generates diffuse environmental gradients that reduce the explanatory power of multivariate approaches [87]. In this context, it should be noted that the RV coefficient, although widely employed as a global measure of association in multivariate ecological analyses, is sensitive to sample size and the number of variables considered [88].
Effective wetland conservation requires understanding of their ecological functioning and the factors shaping their structure and dynamics, including not only the biotic communities they support but also the different subsystems composing them. Nevertheless, reductionist approaches persist in limnological studies, which tend to focus only on main open water bodies such as lagoons or shallow lakes, leaving aside functionally key environments, such as marshlands, floodplains, seasonal plains, and transitional microhabitats [9,10,66]. Previous limnological studies of Peruvian coastal wetlands have focused on the main lagoons and a few shallow environments, overlooking marsh environments [41,42]. Indeed, coastal wetlands such as Santa Rosa constitute "wetlandscapes," that is, mosaic landscapes composed of multiple functional units with specific physicochemical conditions and differential ecological responses [57,89]. The Santa Rosa wetland exhibits marked internal limnological heterogeneity, with marsh and lake sectors showing contrasting physicochemical dynamics. These sectors can be interpreted as differentiated functional patches, the coexistence of which contributes to the structural and functional stability of the wetland, without implying a formal classification of landscape units.
The results show that different sectors of the Santa Rosa Wetland respond differentially to water quantity and quality, which in turn modulates the structure of the macrophyte community. However, this pattern is moderately explained not only by the intrinsic heterogeneity of the wetland but also by the effect of drivers of change. This finding contributes to understanding the limnology-biota relationship, an aspect scarcely addressed in the literature on Peruvian wetlands, which has mostly favored descriptive or ecological community approaches without examining functional relationships with limnological dynamics [90,91]. This gap limits the ability to diagnose threats, such as drying, hydrological fragmentation, and climate change, which requires an understanding the coupling between abiotic and biotic matrices [27].
This study contributes to the existing body of knowledge by demonstrating that the limnological structure of wetlands cannot be reduced to the main lagoon. Rather, it must be understood as an integrated system, where areas currently undergoing degradation continue to perform key ecological functions. Despite the multiple drivers of change, waste accumulation, livestock farming, introduction of exotic species, and urbanization, the Santa Rosa wetland continues to sustain essential processes such as nutrient retention, habitat provision, and hydrological regulation, demonstrating the persistence of functional integration among temporal dynamics, physicochemical limnology, and aquatic macrophyte communities [57,67]. The findings suggest that the maintenance of critical functions does not depend exclusively on the best preserved areas but also on the interaction between impacted and less impacted sectors, which has direct implications for the design of conservation, restoration, and climate change adaptation strategies [3,12].
Given the increasing degradation of coastal wetlands along the Peruvian Pacific, understanding the relationship among the hydrological cycle, limnology, and aquatic macrophytes, as addressed in this study, is key to redefining conservation priorities, identifying functional thresholds, and guiding interventions toward maintaining fundamental ecological processes, even in highly transformed landscapes. It is also suggested that the most variable sites, or those with a less clear explanatory relationship between biotic and abiotic processes, may be subject to unique local drivers of change. This opens up a particularly important line of research aimed at establishing casual links between the drivers of change and their effect on community-environment coupling. It is recommended that future studies address this question with extended temporal coverage.

5. Conclusions

The Santa Rosa wetland maintains recognizable ecological patterns despite sustained anthropogenic pressures. The cycle of rising and falling water levels remains the primary structuring force of physicochemical limnology, and the aquatic macrophyte community responds coherently to seasonal changes in water depth, ionic concentration, and nutrient availability, evidencing functional coupling between biota and environmental conditions. Drivers of change are predominantly spatial in their distribution, generating a mosaic of differentiated impact profiles that modulate this coupling at local scales. By integrating limnological dynamics, macrophyte community structure, and drivers of change—an approach scarcely applied in Peruvian coastal wetlands—these findings provide a scientific foundation for identifying functional thresholds, guiding conservation strategies in increasingly threatened urban wetland systems along the Peruvian Pacific coast.

Author Contributions

Conceptualization, J.A.-I. and F.R.-C.; methodology, J.A.-I. and F.R.-C.; software, J.A.-I.; validation, J.A.-I. and S.U.-R.; formal analysis, J.A.-I.; investigation, F.R.-C., S.U.-R. and J.A.-I.; resources, J.A.-I.; data curation, J.A.-I. and F.R.-C.; writing—original draft preparation, F.R.-C. and J.A.-I.; writing—review and editing, F.R.-C., J.A.-I. and S.U.-R.; visualization, J.A.-I. and F.R.-C.; supervision, J.A.-I.; project administration, J.A.-I.; funding acquisition, J.A.-I. All authors have read and agreed to the published version of the manuscript.

Funding

This study was conducted as part of the project: Environmental degradation vs. ecosystem response: A case study in the Santa Rosa wetland from a limnological perspective (004-2020-PRO99), winner of the 2020 Cabieses Teaching Seed Fund Grant from the Universidad Científica del Sur, and is part of Flavia Valeria Rivera Cáceda's Bachelor's Thesis in Marine Biology under the guidance of Dr. José Antonio Arenas Ibarra.

Institutional Review Board Statement

Not applicable.

Acknowledgments

Materials and equipment acquired by the project and others loaned for use by Terra Aqua Perú S.A.C. were used for field sampling and laboratory analysis. Chemical determinations were performed at Wet Experimental Laboratory No. 104 of the Universidad Científica del Sur. José Antonio Arenas Ibarra used protected hours for research in his capacity as an Associate Researcher at the Universidad Científica del Sur, Director of the Institute of Natural Resources and Ecology, and Director of the Ecology Laboratory at the Universidad Ricardo Palma. The facilities of the Ecology Laboratory of the Faculty of Biological Sciences and their infrastructure and research resources were used for the final draft. Access to academic databases at the Universidad Científica del Sur and Universidad Ricardo Palma were used. The authors would like to thank the National Forest and Wildlife Service (SERFOR) for facilitating the necessary research permits, and Mr. Williams Jurado Zevallos, General Coordinator of the Santa Rosa Chancay Wetland Surveillance Committee, for providing the letter of Prior Informed Consent. Special thanks are extended to James López Visag and Sofía Urrutia Ramírez, Martín Muñoz, Kaory Tinoco, Bruno Reátegui, and Edwin Pinto for their collaboration during fieldwork and laboratory sample processing, and to Dámaso Ramírez for his guidance on field sampling techniques and assistance in the specific identification of aquatic macrophytes.

Conflicts of Interest

The authors declare no conflicts of interest.

Abbreviations

The following abbreviations are used in this manuscript:
TDS Total dissolved solids
TSS Total suspended solids
DO Dissolved oxygen
Cond Conductivity
Turb Turbidity
DOM Dissolved organic matter
DOC Drivers of change
PCA Principal Component Analysis
PCoA Principal Coordinate Analysis
MRPP Multiple Response Permutation Procedure
CUD Uncontrolled urban growth
DGA Agricultural degradation
DGP Livestock degradation
IEE Introduction of exotic species
COQ Chemical contamination
CORG Organic contamination
RSS Solid waste
RSC Construction waste
SDE Burial and drying
PGR Presence of farms
COM Microbiological contamination
GMI Governance failures associated with poor management and inadequate policies
EFL Effluents
OTP Other disturbances (alteration of residence time due to drainage excavation)

References

  1. Grizzetti, B.; Lanzanova, D.; Liquete, C.; Reynaud, A.; Cardoso, A.C. Assessing Water Ecosystem Services for Water Resource Management. Environmental Science & Policy 2016, 61, 194–203. [CrossRef]
  2. Moomaw, W.R.; Chmura, G.L.; Davies, G.T.; Finlayson, C.M.; Middleton, B.A.; Natali, S.M.; Perry, J.E.; Roulet, N.; Sutton-Grier, A.E. Wetlands In a Changing Climate: Science, Policy and Management. Wetlands 2018, 38, 183–205. [CrossRef]
  3. Mitsch, W.J.; Gosselink, J.G. Wetlands: Human Use and Science. In Wetlands, 5th Edition; Wiley, 2015; pp. 3–26.
  4. Davidson, N.C.; Finlayson, C.M. Updating Global Coastal Wetland Areas Presented in Davidson and Finlayson (2018). Mar. Freshwater Res. 2019, 70, 1195. [CrossRef]
  5. Davidson, N.C. How Much Wetland Has the World Lost? Long-Term and Recent Trends in Global Wetland Area. Mar. Freshwater Res. 2014, 65, 934–941. [CrossRef]
  6. Fluet-Chouinard, E.; Stocker, B.D.; Zhang, Z.; Malhotra, A.; Melton, J.R.; Poulter, B.; Kaplan, J.O.; Goldewijk, K.K.; Siebert, S.; Minayeva, T.; et al. Extensive Global Wetland Loss over the Past Three Centuries. Nature 2023, 614, 281–286. [CrossRef]
  7. IPBES Global Assessment Report on Biodiversity and Ecosystem Services of the Intergovernmental Science-Policy Platform on Biodiversity and Ecosystem Services; Zenodo, 2019;
  8. Xu, T.; Weng, B.; Yan, D.; Wang, K.; Li, X.; Bi, W.; Li, M.; Cheng, X.; Liu, Y. Wetlands of International Importance: Status, Threats, and Future Protection. International Journal of Environmental Research and Public Health 2019, 16, 1818. [CrossRef]
  9. An, S.; Yin, S.; Verhoeven, J.T.A.; Jeelani, N. Chapter 29 - Wetlands. In Wetzel’s Limnology (Fourth Edition); Jones, I.D., Smol, J.P., Eds.; Academic Press: San Diego, 2024; pp. 999–1013 ISBN 978-0-12-822701-5.
  10. Mitsch, W.J.; Gosselink, J.G. Wetland Biogeochemistry. In Wetlands, 5th Edition; Wiley, 2015; pp. 179–214.
  11. Rasmussen, T.C.; Deemy, J.B.; Long, S.L. Wetland Hydrology. In The Wetland Book: I: Structure and Function, Management, and Methods; Finlayson, C.M., Everard, M., Irvine, K., McInnes, R.J., Middleton, B.A., van Dam, A.A., Davidson, N.C., Eds.; Springer Netherlands: Dordrecht, 2018; pp. 201–216 ISBN 978-90-481-9659-3.
  12. Tiner, R.W. Wetland Indicators: A Guide to Wetland Identification, Delineation, Classification, and Mapping; Second edition.; Taylor & Francis: Boca Raton, 2017; ISBN 978-1-4398-5369-6.
  13. Mitsch, W.J.; Gosselink, J.G. Wetland Hydrology. In Wetlands, 5th Edition; Wiley, 2015; pp. 111–160.
  14. Reddy, K.R.; DeLaune, R.D. Biogeochemistry of Wetlands: Science and Applications; CRC Press: Boca Raton, 2008; ISBN 978-0-429-09576-4.
  15. Davidson, N.C.; Middleton, B.A.; McInnes, R.J.; Everard, M.; Irvine, K.; Van Dam, A.A.; Finlayson, C.M. Introduction to the Wetland Book 1: Wetland Structure and Function, Management, and Methods. The Wetland Book: I: Structure and Function, Management, and Methods 2018, 3–14.
  16. Ramsar Convention on Wetlands Global wetland outlook: state of the World’s wetlands and their services to people; Ramsar Convention Secretariat: Gland, Switzerland, 2018;
  17. Chambers, P.A.; Maberly, S.C. Chapter 24 - Freshwater Plants. In Wetzel’s Limnology (Fourth Edition); Jones, I.D., Smol, J.P., Eds.; Academic Press: San Diego, 2024; pp. 759–816 ISBN 978-0-12-822701-5.
  18. Bornette, G.; Puijalon, S. Response of Aquatic Plants to Abiotic Factors: A Review. Aquatic Sciences 2011, 73. [CrossRef]
  19. Mitsch, W.J.; Gosselink, J.G. Wetland Vegetation and Succession. In Wetlands, 5th Edition; Wiley, 2015; pp. 215–255.
  20. Siddiqui, A.J.; Jahan, S.; Adnan, M.; Ashraf, S.A.; Singh, R. Macrophytes and Their Role in Wetland Ecosystems. In Aquatic Macrophytes: Ecology, Functions and Services; Kumar, S., Bauddh, K., Singh, R., Kumar, N., Kumar, R., Eds.; Springer Nature Singapore: Singapore, 2023; pp. 119–138 ISBN 978-981-99-3821-6.
  21. Maltchik, L.; Rolon, A.S.; Schott, P. Effects of Hydrological Variation on the Aquatic Plant Community in a Floodplain Palustrine Wetland of Southern Brazil. Limnology 2007, 8, 23–28. [CrossRef]
  22. Freedman, B.; Lacoul, P. Environmental Influences on Aquatic Plants in Freshwater Ecosystems. Environmental Reviews 2006, 14, 89–136. [CrossRef]
  23. Dar, N.A.; Pandit, A.K.; Ganai, B.A. Factors Affecting the Distribution Patterns of Aquatic Macrophytes. Limnological Review 2014, 14, 75–81. [CrossRef]
  24. Rameshkumar, S.; Radhakrishnan, K.; Aanand, S.; Rajaram, R. Influence of Physicochemical Water Quality on Aquatic Macrophyte Diversity in Seasonal Wetlands. Appl Water Sci 2019, 9, 12. [CrossRef]
  25. Dubey, D.; Kumar, S.; Dutta, V. Impact of Nutrient Enrichment on Habitat Heterogeneity and Species Richness of Aquatic Macrophytes: Evidence from Freshwater Tropical Lakes of Central Ganga Plain, India. Int. J. Environ. Sci. Technol. 2022, 19, 5529–5546. [CrossRef]
  26. Florescu, L.I.; Catana, R.D.; Mihai, R.A.; Dumitrache, A.C.; Moldoveanu, M.M. Macrophyte Community Distribution in Relation to Anthropization Influences and Phytoplankton Development in an Urban Lake Chain. Water 2024, 16, 3467. [CrossRef]
  27. Madzivanzira, T.C.; Coetzee, J.A.; Dalu, T. Factors Structuring Aquatic Macrophytes. In Aquatic Macrophytes: Ecology, Functions and Services; Kumar, S., Bauddh, K., Singh, R., Kumar, N., Kumar, R., Eds.; Springer Nature Singapore: Singapore, 2023; pp. 21–52 ISBN 978-981-99-3821-6.
  28. Cerna-Arrue, A.; Aponte, H. El origen de los humedales peruanos y su relación con los procesos geológico-ambientales de Sudamérica: Una revisión. Caldasia 2024, 46, 314–325. [CrossRef]
  29. Díaz, A.; Sáenz-Zúñiga, L.; Zutta, B. Formación de un humedal en la costa norte del Perú: Estabilidad biofísica y diversidad biológica. Rev peru biol 2021, 28, e21132. [CrossRef]
  30. INGEMMET, I.G.M. y M.D. de G.A. y R. Estudio hidrogeológico del Refugio de Vida Silvestre Los Pantanos de Villa, Chorrillos - Lima. Instituto Geológico, Minero y Metalúrgico – INGEMMET 2019.
  31. Verones, F.; Bartl, K.; Pfister, S.; Jiménez Vílchez, R.; Hellweg, S. Modeling the Local Biodiversity Impacts of Agricultural Water Use: Case Study of a Wetland in the Coastal Arid Area of Peru. Environ. Sci. Technol. 2012, 46, 4966–4974. [CrossRef]
  32. Aponte, H.; Gonzales, S.; Gomez, A. Impulsores de cambio en los humedales de América Latina: El caso de los humedales costeros de Lima. South Sustainability 2020, 1, e023–e023. [CrossRef]
  33. Aponte, H.; Cano, A. Estudio florístico comparativo de seis humedales de la costa de lima (Perú): Actualización y nuevos retos para su conservación. 2013, 3, 13.
  34. Gonzales, S.; Aponte, H.; Cano, A. Update of the Vascular Flora of the Santa Rosa Wetland - Chancay (Lima, Peru). Arnaldoa 2019, 26, 867–882. [CrossRef]
  35. Castillo Zavala, J.M.; Mostacero León, J.; De La Cruz-Castillo, A.J.; Castillo- Zavala, J.L.; Anhuamán-Castañeda, V.A. Inventario florístico de los humedales de la costa de la provincia de Trujillo, La Libertad, Perú. HYW 2022, 1, 23–39. [CrossRef]
  36. Pulido, V. Ciento quince años de registros de aves en Pantanos de Villa. Rev peru biol 2018, 25, 291–306. [CrossRef]
  37. Aguirre-Soto, L.; Nieto-Juárez, J.I. Evaluación de La Calidad Del Agua En El Humedal Costero Pantanos de Villa, Chorrillos, Perú. Tecnia 2024, 34, 11–25. [CrossRef]
  38. Benites-Alfaro, E.; Mendivil, V.T.; Farfán, E.E.; Rodriguez, C. Trophic Status Index of the Waters of the Pantanos de Villa Protected Natural Reserve, Chorrillos, Perú. 2020, 7.
  39. Huaman Vilca, S.; Lucen, M.; Paredes Vite, M.; Changanaqui Alfaro, D. Evaluación de la calidad del agua de la Laguna Marvilla en los Pantanos de Villa (Lima – Perú). S. Sust. 2020, e019. [CrossRef]
  40. Canales Cuadros, H.; Cabrera Carranza, C.; Arana Maestre, J. Macroinvertebrados acuáticos y calidad de agua en el Área de Conservación Regional Humedales de Ventanilla, Callao. Rev. Inst. investig. Fac. minas metal cienc. geogr 2022, 25, 295–301. [CrossRef]
  41. Castillo-Velásquez, R.-M.; Huamantinco-Araujo, A.-A. Variación espacial de la comunidad de macroinvertebrados acuáticos en la zona litoral del humedal costero Santa Rosa, Lima, Perú. Revista de Biología Tropical 2020, 68, 50–68. [CrossRef]
  42. Córdova-Tello, C.A.; Huamantinco-Araujo, A.A. Efecto de las variables fisicoquímicas en la comunidad de coleópteros acuáticos en un humedal costero, Lima, Perú. Acta biol. Colomb. 2023, 28, 204–219. [CrossRef]
  43. Bopp, G.; Peláez, F. Evaluación de La Flora Vascular de Los Humedales Costeros de La Libertad, Perú. Manglar 2019, 16, 151–156. [CrossRef]
  44. Jindo, K.; Morikawa, M. Innovative Feasibility Study for the Reclamation of the Cascajo Wetlands in Peru Utilizing Sustainable Technologies. Water 2020, 12. [CrossRef]
  45. Aldana-Domínguez, J.; Rojas Quezada, C.; Munizaga, J.; Moschella, P.; Stamm, C.; Martínez, C. Urban Wetland Losses and Land-Use Conservation Challenges in Three Latin American Cities. In Urban Wetlands in Latin America: Protection, Conservation, Innovation, Restoration, and Community for Sustainable and Water Sensitive Cities; Rojas Quezada, C., Ed.; Springer Nature Switzerland: Cham, 2024; pp. 3–18 ISBN 978-3-031-69590-2.
  46. Aponte, H.; Coello-Sarmiento, M.-P.; Montes-Iturrizaga, D. New Insights About the Drivers of Change in the Coastal Wetlands of Peru: Results of a Rapid Field Survey. Water 2025, 17, 1473. [CrossRef]
  47. Romero-Mariscal, G.; Garcia-Chevesich, P.A.; Morales-Paredes, L.; Arenazas-Rodriguez, A.; Ticona-Quea, J.; Vanzin, G.; Sharp, J.O. Peruvian Wetlands: National Survey, Diagnosis, and Further Steps toward Their Protection. Sustainability 2023, 15, 8255. [CrossRef]
  48. Urbina, D.; Rivera-Cáceda, F.; Aponte, H. ¿Se Están Reduciendo Los Humedales de La Costa Del Pacífico Suramericano? El Caso de Los Humedales de Lima. Rev. Acad. Colomb. Cienc. Ex. Fis. Nat. 2022, 46, 985–998. [CrossRef]
  49. Ramirez, D.W.; Aponte, H.; Cano, A. Flora vascular y vegetación del humedal de Santa Rosa (Chancay, Lima). Revista Peruana de Biología 2011, 17. [CrossRef]
  50. Zamora-Aranda, A.; Aponte, H. Evaluation of Two Ecosystem Services Provided by a Pistia Stratiotes Population on the Pacific Coast of South America. Biology 2024, 13, 573. [CrossRef]
  51. Ochoa-Balbacea, D.O.; Gonzales, S.; Apeño, A.; Aponte, H. Hábitats prioritarios en un humedal costero del Pacífico: propuesta de un índice basado en servicios ecosistémicos. Revista de la Academia Colombiana de Ciencias Exactas, Físicas y Naturales 2022, 46, 182–191. [CrossRef]
  52. ANA Protocolo Nacional Para El Monitoreo de La Calidad de Los Recursos Hídricos Superficiales (R.J. N· 010-2016-ANA) 2016.
  53. Baird, R.; Rice, E.W.; Eaton, A.D.; Bridgewater, L.; Federation, W.E. Standard Methods for the Examination of Water and Wastewater; American Public Health Association, 2017; ISBN 978-0-87553-287-5.
  54. Methods in Stream Ecology; Hauer, F.R., Lamberti, G.A., Eds.; 2nd ed.; Academic Press/Elsevier: San Diego, Calif, 2006; ISBN 978-0-12-332908-0.
  55. Dengler, J.; Dembicz, I. Should We Estimate Plant Cover in Percent or on Ordinal Scales? VCS 2023, 4, 131–138. [CrossRef]
  56. Cirujano, S.; Meco Molina, A.; García Murillo, P. Flora acuática española. Hidrófitos vasculares Available online: https://bibdigital.rjb.csic.es/records/item/16128-flora-acuatica-espanola-hidrofitos-vasculares?offset=1 (accessed on 28 March 2025).
  57. Sarkar, P.; Salami, M.; Githiora, Y.; Vieira, R.; Navarro, A.; Clavijo, D.; Padgurschi, M. A Conceptual Model to Understand the Drivers of Change in Tropical Wetlands: A Comparative Assessment in India and Brazil. Biota Neotrop. 2020, 20, e20190913. [CrossRef]
  58. Oksanen, J.; Simpson, G.L.; Blanchet, F.G.; Kindt, R.; Legendre, P.; Minchin, P.R.; O’Hara, R.B.; Solymos, P.; Stevens, M.H.H.; Szoecs, E.; et al. Vegan: Community Ecology Package 2025.
  59. Borcard, D.; Gillet, F.; Legendre, P. Numerical Ecology with R; Use R!; Springer International Publishing: Cham, 2018; ISBN 978-3-319-71403-5.
  60. Legendre, P.; Legendre, L. Numerical Ecology; Developments in environmental modelling; 3rd English ed.; Elsevier: Amsterdam, 2012; ISBN 978-0-444-53868-0.
  61. Mielke, P.W.; Berry, K.J. Description of MRPP. In Permutation Methods: A Distance Function Approach; Mielke, P.W., Berry, K.J., Eds.; Springer: New York, NY, 2001; pp. 9–65 ISBN 978-1-4757-3449-2.
  62. Doledec, S.; Chessel, D. Co-Inertia Analysis: An Alternative Method for Studying Species-Environment Relationships. Freshwater Biol 1994, 31, 277–294. [CrossRef]
  63. Dray, S.; Dufour, A.-B.; Thioulouse, J.; Chessel, D.; Jombart, T.; Pavoine, S.; Lobry, J.R.; Ollier, S.; Borcard, D.; Legendre, P.; et al. Ade4: Analysis of Ecological Data: Exploratory and Euclidean Methods in Environmental Sciences 2025.
  64. R Core Team R: A Language and Environment for Statistical Computing. 2020.
  65. RStudio Team RStudio: Integrated Development for R. RStudio 2020.
  66. Agidie, A.; Wondie, A.; Beneberu, G. Wetland Disturbance Level and Macrophyte Composition in Natural Wetlands and Paddy Fields in the Eastern Part of Lake Tana, Ethiopia. Heliyon 2024, 10, e40701. [CrossRef]
  67. Galatowitsch, S.M. Natural and Anthropogenic Drivers of Wetland Change. In The Wetland Book; Finlayson, C.M., Milton, G.R., Prentice, R.C., Davidson, N.C., Eds.; Springer Netherlands: Dordrecht, 2018; pp. 359–367 ISBN 978-94-007-4000-6.
  68. Gomez Vilca, A.J.; Aponte, H.; Gonzales, S. ¿Cómo Proteger Los Humedales Costeros Peruanos? Una Respuesta a Partir de Un Modelo Conceptual de Sus Impulsores de Cambio. Bol. Investig. Mar. Costeras 2023, 52, 125–142. [CrossRef]
  69. Pacioglu, O.; Tușa, I.M.; Sidoroff, M.E.; Ițcuș, C. The Best Management Practices in Agriculture for Protection of Inland Water Ecosystems. In Encyclopedia of Inland Waters (Second Edition); Mehner, T., Tockner, K., Eds.; Elsevier: Oxford, 2022; pp. 58–67 ISBN 978-0-12-822041-2.
  70. Meerhoff, M.; Beklioğlu, M. Chapter 26 - Shallow Lakes and Ponds. In Wetzel’s Limnology (Fourth Edition); Jones, I.D., Smol, J.P., Eds.; Academic Press: San Diego, 2024; pp. 859–892 ISBN 978-0-12-822701-5.
  71. Hadad, H.R.; Mufarrege, M.M.; Di Luca, G.A.; Maine, M.A. Salinity and pH Effects on Floating and Emergent Macrophytes in a Constructed Wetland. Water Sci Technol 2018, 2017, 270–275. [CrossRef]
  72. Haller, W.T.; Sutton, D.L.; Barlowe, W.C. Effects of Salinity on Growth of Several Aquatic Macrophytes. Ecology 1974, 55, 891–894. [CrossRef]
  73. Pereto, S.C.A. da S.; Padial, A.A. Macrophyte Functional Composition Is Stable across a Strong Environmental Gradient of a Neotropical Floodplain. Acta Bot. Bras. 2021, 35, 62–69. [CrossRef]
  74. Rolon, A.; Homem, H.; Maltchik, L. Aquatic Macrophytes in Natural and Managed Wetlands of Rio Grande Do Sul State, Southern Brazil. Acta Limnologica Brasiliensia 2010, 22, 133–146. [CrossRef]
  75. Muñoz, M.; Tinoco, K.; Arenas, J.; Aponte, H. Dinámica de La Planta Acuática Pistia Stratiotes y Su Incorporación a Un Sistema de Producción de Compost. Tecnología y ciencias del agua 17. [CrossRef]
  76. Rejmankova, E. The Role of Macrophytes in Wetland Ecosystems. Journal of Ecology and Field Biology 2011, 34, 333–345. [CrossRef]
  77. Saluja, R.; Garg, J.K. Macrophyte Species Composition and Structure along Littoral Region in Relation to Limnological Variables of a Tropical Wetland Ecosystem. Chemistry and Ecology 2017, 33, 499–515. [CrossRef]
  78. Aponte, H.; Jiménez, R.; Alcántara, B. Challenges for Management and Conservation of Santa Rosa Wetland (Lima-Peru). Cientifica 2012, 9, 257–264.
  79. Loayza-Basan, K.; Castillejos Paniagua, K.; Mestas Valero, R.; Quiliche Duran, J.P.J. Estudio de la Teledetección y Caracterización Fisicoquímica del Humedal “El Cascajo”, Santa Rosa, Chancay- Lima, Perú. Infinitum... 2017, 7. [CrossRef]
  80. Leiva, J.V.Y.; Ibarra, J.A. Evaluación de la calidad del agua en el canal Surco de la Zona de Reglamentación Especial del Humedal Los Pantanos de Villa (Lima, Perú). South Sustainability 2024, 5, e090–e090. [CrossRef]
  81. Mendoza-Caballero, W.; Quiroz-Santos, R.L. EVALUACIÓN DE LOS ESTADOS TRÓFICOS DE LA LAGUNA PRINCIPAL DEL ÁREA DE CONSERVACIÓN REGIONAL ALBUFERA DE MEDIO MUNDO, HUAURA-LIMA, PERÚ. Biotempo 2022, 19, 149–164. [CrossRef]
  82. Jyothi, P.V.; Sureshkumar, S. Patterns of Vegetation Dynamics across Mild Disturbance Gradient in a Freshwater Wetland System in Southern India. Wetlands 2018, 38, 807–817. [CrossRef]
  83. Domínguez-Machín, M.E.; Silva-López, G. Consumo de plantas por el ganado vacuno en una zona de Manglar-Espartal de Alvarado, Veracruz, México. Foresta Veracruzana 2020, 22, 7–11.
  84. Marca-Zevallos, M.J.; Galiano, W.; Chevarría, R.; Sebastián, G.; Huamani, K.; Ochoa, J.A.; Mendoza, J. Influencia de factores ambientales en la composición de macrofitas acuáticas en lagos (cochas) de la Amazonía sur del Perú. Darwiniana, nueva serie 2024, 12, 170–191. [CrossRef]
  85. Schneider, B.; Cunha, E.R.; Marchese, M.; Thomaz, S.M. Explanatory Variables Associated with Diversity and Composition of Aquatic Macrophytes in a Large Subtropical River Floodplain. Aquatic Botany 2015, 121, 67–75. [CrossRef]
  86. Aoki, C.; Teixeira-Gamarra, M.C.; Gamarra, R.M.; De Medeiros, S.C.H.; Pott, V.J.; Damasceno-Junior, G.A.; Pott, A.; Scremin-Dias, E. Abiotic Factors Drive the Structure of Aquatic Plant Assemblages in Riverine Habitats of the Brazilian “Pantanal.” Braz. J. Bot 2017, 40, 405–415. [CrossRef]
  87. Rolon, A.S.; Maltchik, L. Environmental Factors as Predictors of Aquatic Macrophyte Richness and Composition in Wetlands of Southern Brazil. Hydrobiologia 2006, 556, 221–231. [CrossRef]
  88. Adams, D.C. Evaluating Modularity in Morphometric Data: Challenges with the RV Coefficient and a New Test Measure. Methods Ecol Evol 2016, 7, 565–572. [CrossRef]
  89. Mitsch, W.J.; Gosselink, J.G. Wetland Definitions. In Wetlands, 5th Edition; Wiley, 2015; pp. 27–44.
  90. Gómez-Sánchez, R.; Cuba, D.; Aponte, H. Sobre la necesidad de descentralización y diversificación de la investigación en humedales costeros peruanos. TB 2022, 20, 121–150. [CrossRef]
  91. Rivera, G.; Gonzales, S.; Aponte, H. Wetlands of the South American Pacific Coast: A Bibliometric Analysis. Wetlands Ecol Manage 2021. [CrossRef]
Figure 1. Location of the study area. (A and B) Geographic location in the province of Huaral, district of Chancay, Lima, Peru. (C) Santa Rosa wetland environmental conservation area with sampling points (P1–P6).
Preprints 201190 g001
Figure 2. Macrophyte total cover (%) at sampling points (P1–P6) in the Santa Rosa wetland during two seasons: T1 (summer) and T2 (winter).
Preprints 201190 g002
Figure 3. Percentage composition of aquatic macrophytes in Santa Rosa wetland during two seasons (T1: summer, T2: winter) at sampling points: (A) P1, (B) P2, (C) P3, (D) P4, (E) P5, and (F) P6.
Preprints 201190 g003
Figure 4. Spearman's correlation matrix of association between biotic and abiotic variables.
Preprints 201190 g004
Figure 5. Principal Coordinates Analysis (PCoA) ordination of sampling points based on the drivers of change (DOC).
Preprints 201190 g005
Figure 6. Principal Component Analysis (PCA) for physicochemical variables.
Preprints 201190 g006
Figure 7. Principal Component Analysis (PCA) for macrophytes.
Preprints 201190 g007
Figure 8. Co-inertia biplot (axes 1–2): covariance-optimized structural matching between limnological variables and macrophyte assemblages.
Preprints 201190 g008
Figure 9. Temporal trajectories showing changes between sampling periods.
Preprints 201190 g009
Table 1. Values of physicochemical parameters recorded at the sampling points in Santa Rosa wetland during two seasons: T1 (summer) and T2 (winter).
Sample Points pH Conductivity
(µS/cm)
TDS
(mg/L)
DO
(mg/L)
Temperature
(°C)
Depth
(m)
TSS
(mg/L)
Turbidity
(NTU)
PO43-
(mg/L)
NH4
(mg/L)
NO3
(mg/L)
T1 T2 T1 T2 T1 T2 T1 T2 T1 T2 T1 T2 T1 T2 T1 T2 T1 T2 T1 T2 T1 T2
P1 8 7.45 1610 1166 505 788 0.8 6 25 21.8 0.12 0.12 52 50 57 40.77 0.605 0.66 1.54 3.43 7 6
P2 8.3 7.13 3000 2740 1260 1940 0.4 3.2 27 20.5 0.08 0.19 50 8 50 9.47 0.9 1.06 1.75 1.26 7.5 7
P3 7.9 7.43 1770 1401 907 940 0.5 3.4 22 22.1 0.13 0.20 19 45 25 45.92 0.785 1.28 1.49 3.03 0.05 3
P4 7.9 7.42 1360 992 610 670 0.3 4.18 23 19.9 0.75 0.39 19 4 18 10.51 0.97 0.29 1.55 0.81 2 4
P5 8.5 8.72 3280 1632 1968 1095 0.5 8.2 23.8 19.5 0.40 0.84 56 56 56 34.87 1.03 1.65 1.81 1.22 9 0.05
P6 8.1 8.06 2045 1735 1227 1155 0.3 6.5 25.9 16.7 0.40 0.50 74 20 72 12.8 1.05 1.54 1.9 0.97 7 4
Table 2. Drivers of change identified at the sampling points.
DOC CUD DGA DGP IEE COQ CORG RSS RSC SDE PGR COM GMI EFL OTP
T2P1 0 0 1 1 1 1 0 1 1 0 1 1 0 0
T2P2 0 0 1 1 0 1 0 0 0 1 1 1 0 0
T2P3 0 1 1 1 0 1 0 0 0 0 1 1 0 0
T2P4 1 1 1 1 1 1 1 1 1 0 1 1 0 1
T2P5 0 0 1 1 1 1 1 1 1 0 1 1 0 0
T2P6 0 0 1 1 1 1 1 0 0 0 1 1 0 0
T1P1 0 0 1 1 1 1 1 1 1 0 1 1 1 0
T1P2 0 0 1 1 0 1 0 0 0 1 1 1 0 0
T1P3 0 1 1 1 0 1 0 0 0 0 1 1 0 0
T1P4 1 1 1 1 1 1 1 1 1 0 1 1 0 0
T1P5 0 0 1 1 1 1 1 1 1 0 1 1 0 0
T1P6 0 0 1 1 1 1 1 0 0 0 1 1 0 0
* Uncontrolled urban growth (CUD), Agricultural (DGA) and Livestock (DGP) degradation, Introduction of exotic species (IEE), Chemical (COQ), Organic (CORG), and Microbiological contamination (COM), Solid waste (RSS), Construction waste (RSC), Burial and drying (SDE), Presence of farms (PGR), Effluents (EFL), Governance failures associated with poor management and inadequate policies (GMI) and Other disturbances (alteration of residence time due to drainage excavation) (OTP). Note: 1 = presence of driver; 0 = absence.
Disclaimer/Publisher’s Note: The statements, opinions and data contained in all publications are solely those of the individual author(s) and contributor(s) and not of MDPI and/or the editor(s). MDPI and/or the editor(s) disclaim responsibility for any injury to people or property resulting from any ideas, methods, instructions or products referred to in the content.
Copyright: This open access article is published under a Creative Commons CC BY 4.0 license, which permit the free download, distribution, and reuse, provided that the author and preprint are cited in any reuse.
Prerpints.org logo

Preprints.org is a free preprint server supported by MDPI in Basel, Switzerland.

Subscribe

Disclaimer

Terms of Use

Privacy Policy

Privacy Settings

© 2026 MDPI (Basel, Switzerland) unless otherwise stated