Submitted:
27 February 2026
Posted:
02 March 2026
You are already at the latest version
Abstract
The European Union aims to achieve the target of 25% of land under organic farming by 2030. Italy reached the share of 18.7% in 2022, although significant regional differences persist. This study analyzes farms’ conversion response in the Lazio region (Italy) to evaluate the effectiveness of higher economic incentives in promoting organic conversion. The agro-economic supply model AGRITALIM is applied to a sample of 587 FADN farms. The model simulates individual farm conversion choice, distinguishing between conversion and maintenance phases, and accounting for conversion costs, yield, and price variations associated with each period. Results show limited effects of increased economic support: the 2023–2027 Common Agricultural Policy reform, characterized by higher support, leads to a 5.1% increase in the area under organic farming, while a 40% increase in financial support generates an expansion of 12%. Farm responses are highly heterogeneous: rural provinces, larger and arable farms are more responsive, while smaller farms and livestock are less likely to convert. These findings highlight the need for integrated policy strategies combining financial support, reduced costs, technical assistance, and improved market access. The methodological approach adopted in this study provides a useful tool for supporting the design of targeted and effective policy interventions.
Keywords:
organic farming
; mathematical programming
; CAP
1. Introduction
In December 2019, the European Commission introduced the European Green Deal, aiming for climate neutrality by 2050. Within this framework, the Farm to Fork Strategy (F2F), specifically focused on the agricultural sector, highlights the benefits of organic farming and sets a target for 25% of EU agricultural land to be organic. The 2014-2022 Common Agricultural Policy (CAP) had already supported organic farming expansion, allocating substantial financial resources to the sector. In Italy, a significant boost in this direction came from the Rural Development Programs (RDPs), which introduced Measure 11, specifically aimed at supporting organic farming. As a result, by 2022, the organic area reached 18.7%, a 7.5% increase compared to 2021, bringing Italy closer to the F2F target set for 2027. However, each region had the flexibility to define the role of organic farming within its RDP strategy. This led to disparities at the national level, partly due to regional agricultural characteristics that need to be considered.
Organic farming differs significantly from conventional farming, especially in management practices and productivity [1,2]. It faces sector-specific risks, i.e., the challenges of transition, soil conservation, and price volatility, with premium prices not always guaranteed [3,4,5]. While higher prices should compensate for lower yields [6], this is not always the case, especially for livestock products and vegetables [7]. The fragility of the production system can be exacerbated by specific territorial and climatic conditions, making economic returns uncertain [8]. Moreover, the difficulty of transitioning from conventional to organic farming remains a barrier, especially for small and medium-sized farms [9,10].
Several studies have investigated and modelled the conversion to organic farming. Among them, most usually use individual farms [5] or representative farms, usually hypothesizing a 100% conversion [11,12]. Others use partial equilibrium models not considering all crops and countries across the EU [13] or considering the organic target of 25% jointly with other F2F measures (Barreiro-Hurle et al., 2021; Henning et al., 2021). Recently, Kremmydas et al. (2024), Kremmydas et al. (2023), and [18] have used static farm-level models to analyze organic conversion patterns, the effects of alternative budget allocations, and different policy strategies aimed at achieving the F2F organic target. This study builds on that literature by adopting a dynamic agro-economic modelling framework that explicitly represents farms’ conversion decisions over time. This approach allows farmers to optimize resource allocation and investment choices within an intertemporal frame and to account for the distinct cost-benefit conditions characterizing the conversion and maintenance phases of organic farming.
In this setting, the study has two main objectives: (i) to develop a dynamic farm-level model that explicitly distinguishes between the conversion and maintenance phases, enabling farm-specific adjustment decisions without imposing full conversion; and (ii) to assess how increases in CAP support affect the expansion of land under organic farming, taking into account farm-level and territorial heterogeneity.
To reach these goals, the Lazio region is considered a case study. The analysis simulates a set of scenarios characterized by progressively higher payment levels for organic farming, with the aim of assessing the effectiveness of increased budget allocations in promoting conversion and contributing to the F2F 25% target. The underlying hypothesis is that higher levels of CAP support can promote the expansion of organic farming in the region. Simulations are carried out through an agro-economic supply model applied to an Italian Farm Accountancy Data Network (FADN) sample of 391 farms for the year 2020.
2. Materials and Methods
2.1. Data
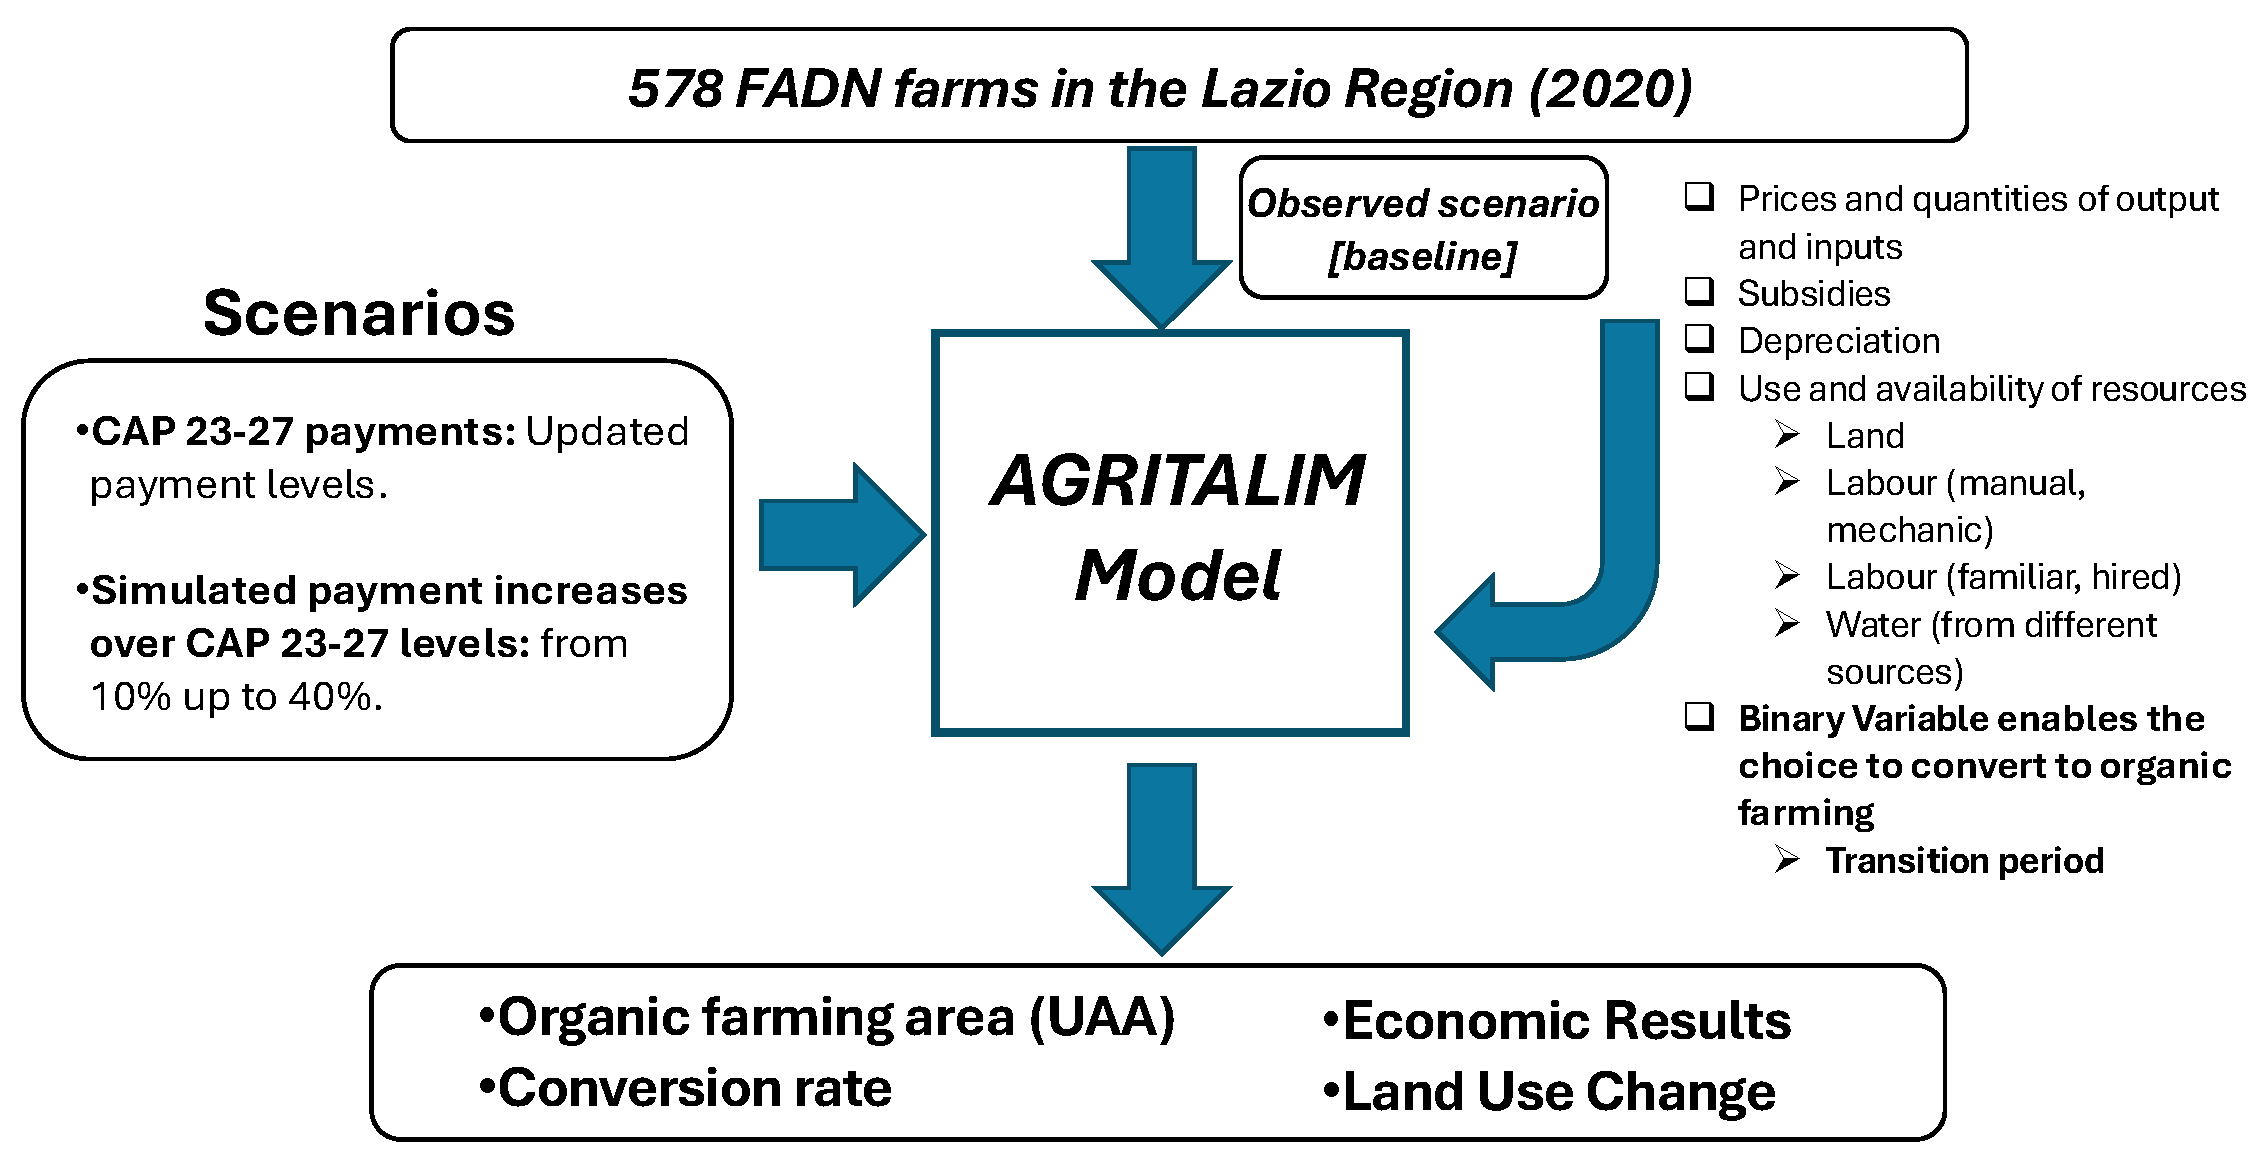
Utilizing an agro-supply model rooted in microeconomic data and designed to consider farm-specific choices, i.e., AGRITALIM, the analysis provides detailed responses for each farm, leveraging data at the farm level from the Italian FADN. Specifically, for this analysis, AGRITALIM was applied to a FADN sample of 578 conventional farms in the Lazio region for the year 2020.
Table 1 shows the main descriptive statistics for the sample, specifically for the group of conventional and organic farms. In terms of spatial distribution, organic farms are mainly located in Viterbo (52.9%), in Rieti (24.6%), followed by Rome (13.4%), Frosinone (7.0%), and Latina (2.1%). The distribution over farm size, instead, is homogeneous: farms between 5 and 15 hectares represent the 31.0%, farms between 15 and 40 hectares represent the 25.7%, and farms above 40 hectares represent the 35.8%. Instead, small farms under 5 hectares only represent the 7.5%. Table 2 shows the distribution over Type of Farming (TF), showing that some sectors are more prone to conversion, such as Olive groves (62.5% of organic farms) and Vineyards (52%). Others, such as Cereals are all classified as Conventional.
2.2. The AGRITALIM Model
Operating within the category of agro-economic supply models, AGRITALIM is based on non-linear Mathematical Programming, combining Leontief technology for variable costs with a quadratic cost function. It is calibrated through the Positive Mathematical Programming (PMP) approach [19,20]. The main components of the objective function and constraints concern land, labor (both manual and mechanic), water and feed availability (Eq. 1). AGRITALIM maximizes the farm operative income, considering market elements (prices of outputs and inputs), production functions (linking crop yields and inputs), agricultural policy support, and depreciation costs. Specifically, in this study, the model maximizes farm income over two phases, i.e. conversion and maintenance, incorporating the allocation of resources and investment decision. Future revenues are discounted using an interest rate (r). Equations 1 and 2 describe the objective function:
The model maximizes the discounted operating income for each farm (Eq. 1), where denotes the two phases of organic adoption: conversion and maintenance. The discount factor accounts for the intertemporal valuation of income streams. Period-specific income, , is defined in Equation (2). The variables and denote output prices and yields, respectively, while represents the levels of each activity, expressed in hectares for crops and number of heads for livestock. The parameter represents production costs associated with each activity.
The transition to organic farming is modeled through a binary variable, , which activates the organic farming payment when a farm chooses to convert (). The same variable also activates the differential terms , , and the cost differential component , capturing deviations in prices, yields, and marginal costs under organic management relative to conventional farming. The differential parameters were calibrated using FADN data from the previous three years for organic crops and livestock within the same geographical area, province, and altitude class. For non-converting farms (), all differential terms are null, and conventional production conditions apply.
Considering that Italy is already at 18.7% of organic land [21], and aiming to reach 25%, assuming the target is set at the Member State level, a contribution from each region will be necessary. This is especially relevant since, under the CAP 2014-2020, rural development measures (including support for organic farming) were implemented through regional Rural Development Programmes (RDPs). Under the CAP 2023-2027 Strategic Plans (CSPs), support for organic farming and other rural development measures continues to be implemented at national and regional levels as part of each Member State’s plan, with allocations often tailored to regional needs. The Italian CSP allocates record financial resources to organic farming. In particular, the intervention dedicated to the adoption and maintenance of organic farming practices receives the largest budget among all rural development interventions, with a total allocation exceeding 2.2 billion euros. This corresponds to approximately 48% of all agri-environment interventions and about 14% of total public expenditure planned under the second pillar over the programming period (ISMEA, 2024).
Based on this, an analysis was conducted on the share of organic land across all Italian regions. Some, particularly in the North, show organic areas around 5-6%, such as Lombardy and Piedmont. This is largely due to the characteristics of farming in those regions, where intensive and profitable livestock farming likely limits the expansion of organic practices. This suggests that other regions, where the trend in organic farming has been more positive in recent years, can help achieve the overall target of 25%. Thus, the simulations are based on a set of assumptions involving a progressively higher commitment from regions with greater shares of organic land, such as Lazio, where 22.6% of the regional area was organic in 2020. Simulations are designed to assess farms’ sensitivity to changes in policy support for organic farming. Specifically, the analysis evaluates whether alternative payment levels can foster further conversion and to what extent they contribute to increasing the regional organic area.
As a first scenario, the model considers the CAP 2023–2027 payment levels for organic farming as defined in the CAP Strategic Plan. Compared to the previous programming period, payments in Lazio decreased from 483 to 376 €/ha during the conversion phase and from 406 to 318 €/ha during the maintenance phase. This scenario represents the baseline policy framework.
Importantly, while unit payments are lower, the overall budget allocated to organic farming is substantially higher. This reflects a policy choice aimed at broadening participation by spreading available resources over a larger number of farms and hectares. The simulations, therefore, assess whether this strategy is sufficient to sustain further conversion, or whether higher per-hectare payments would be more effective in achieving more ambitious regional organic targets.
Figure 1.
The AGRITALIM model, inputs, outputs, and simulated scenarios.
3. Results
The model provides results in terms of the variation of land under organic farming at the farm level. Specifically, it allows us to determine the rate of conversion and, consequently, the variation in unitary payments necessary to stimulate conversion and to assess the cost-effectiveness of this mechanism.
Table 3 shows the main results in terms of variation in the number of organic farms and UAA under organic farming. The CAP 2023–2027 reform represents a step forward in the conversion of farms, leading to an increase of 5.1% in UAA under organic farming. However, this result is achieved at the cost of a 15.4% increase in the budget. This pattern becomes even more evident in the other scenarios, i.e., farms respond in a relatively rigid way to increases in unitary payments. In fact, with a 15% increase in the unitary payment, the number of converted farms rises to 17, increasing to 20 farms in the intermediate scenario (+25%) and reaching 24 farms in the scenario with a 40% increase in payments. These changes correspond to increases of 7.8%, 8.5%, and 11.9% in UAA under organic farming, respectively, supported by overall budget increases of 25.8%, 29.9% and 47.5%. In other words, a substantial increase in regional expenditure, amounting to approximately €554,864, leads to the conversion of only 24 farms (around 12%), making this strategy relatively not cost-effective for policymakers, as shown by Figure 3.
The reasons behind this conversion can be different, and this is also explicitly shown by the spatial distribution of conversion. Looking at Figure 2, for example, the provinces that show an increase in the share of UAA under organic farming are mainly Rome and Viterbo, while Rieti, Frosinone, and Latina show very limited increases (between 0 and +2.9% in all scenarios considered). Rome, instead, shows a high sensitivity, with already large increases under the CAP 2023–2027 baseline (+20.2%) and further increases of +40.4%, +43.2%, and +49.2% in the +15%, +25% and +35% scenarios, respectively. A similar pattern is observed for Viterbo, which shows increases ranging from 18.9% up to 29.8% in the scenario with a +35% increase in unitary payments.
These results partially confirm the baseline situation, in which Viterbo and Rieti already showed a higher incidence of organic farming, while Rome, Frosinone, and Latina displayed a lower incidence. However, according to the results, Viterbo and Rome show a strong potential for expansion, while Rieti remains substantially stable, and Frosinone and Latina confirm a rigid response. This can be explained by the characteristics of these provinces, with Viterbo and Rieti being much more rural, while Latina and Frosinone are characterized by more intensive agricultural systems.
Further information emerges from the distribution of converting farms, in particular with respect to the incidence of UAA by type of farming. Conversion mainly occurs among Arable Crops farms, which already show high sensitivity under the CAP 2023–2027 baseline (+71%) and increase organic area up to 122.6% under this type of farming. Mixed Crops and Livestock farms follow, with more limited increases ranging from 4.4% in the CAP 2023–2027 scenario to 15.8% in the +35% scenario. Finally, Mixed Crops farms respond only starting from a +25% increase in payments, and their variation remains stable even in higher scenarios (+40.2%). Herbivores and Granivores farms, instead, do not respond to increases in unitary payments. Also in this case, the results show that the types of farming more prone to increasing organic area are mixed and arable systems, while for the other types, and especially for livestock farms, conversion is more difficult and less economically convenient in the short run. Moreover, sectors with an already high incidence in the baseline, such as olive groves and tree crops, do not show any relevant variation.
At the farm size level, the farms that convert the most are large farms, which already represented the largest share of UAA under organic farming in the baseline (Table 5). These farms increase both in terms of representativeness and in terms of converted area, from 16.1% in the CAP 2023–2027 scenario up to 28.5% in the +35% scenario. The increase for medium-sized farms (15–40 ha) is more limited, with converted UAA rising from 2.1% to 8.4% over the same scenarios. Small and medium farms (5–15 ha) show a stable increase of 4.9% in UAA under organic farming, i.e., they are not sensitive to increases in unitary payments. Finally, very small farms (<5 ha) do not show any sensitivity to higher payments. Overall, these results show that different farm size classes react differently: although the baseline distribution of organic land was relatively homogeneous, conversion dynamics under increasing payments favor larger farms, while smaller farms remain unresponsive even in the presence of significant increases in policy support.

Table 3.
Simulated Scenarios and their effects on conversion to organic farming and overall budget for organic payments.
Table 3.
Simulated Scenarios and their effects on conversion to organic farming and overall budget for organic payments.
| ∆ Payment | CAP 23–27 | + 10% | + 15% | + 20% | + 25% | + 30% | + 35% | + 40% |
| ∆ Organic farms (n) | 12 | 14 | 17 | 19 | 20 | 21 | 22 | 24 |
| ∆ UAA under organic farming (ha) | 1,074 | 1,189 | 1,637 | 1,710 | 1,780 | 1,860 | 1,933 | 2,495 |
| ∆ of UAA under organic farming on total (%) | 5.1 | 5.7 | 7.8 | 8.2 | 8.5 | 8.9 | 9.2 | 11.9 |
| ∆ Organic budget payments (€) | 180,127 | 226,248 | 302,002 | 335,087 | 349,883 | 388,832 | 420,827 | 554,864 |
| ∆ of Organic budget payments (%) | 15.4 | 19.4 | 25.8 | 28.7 | 29.9 | 33.3 | 36.0 | 47.5 |
Figure 2.
Increase in Organic Farming over the baseline by Province in selected scenarios. .

Figure 3.
Marginal economic effectiveness of each scenario on organic conversion.
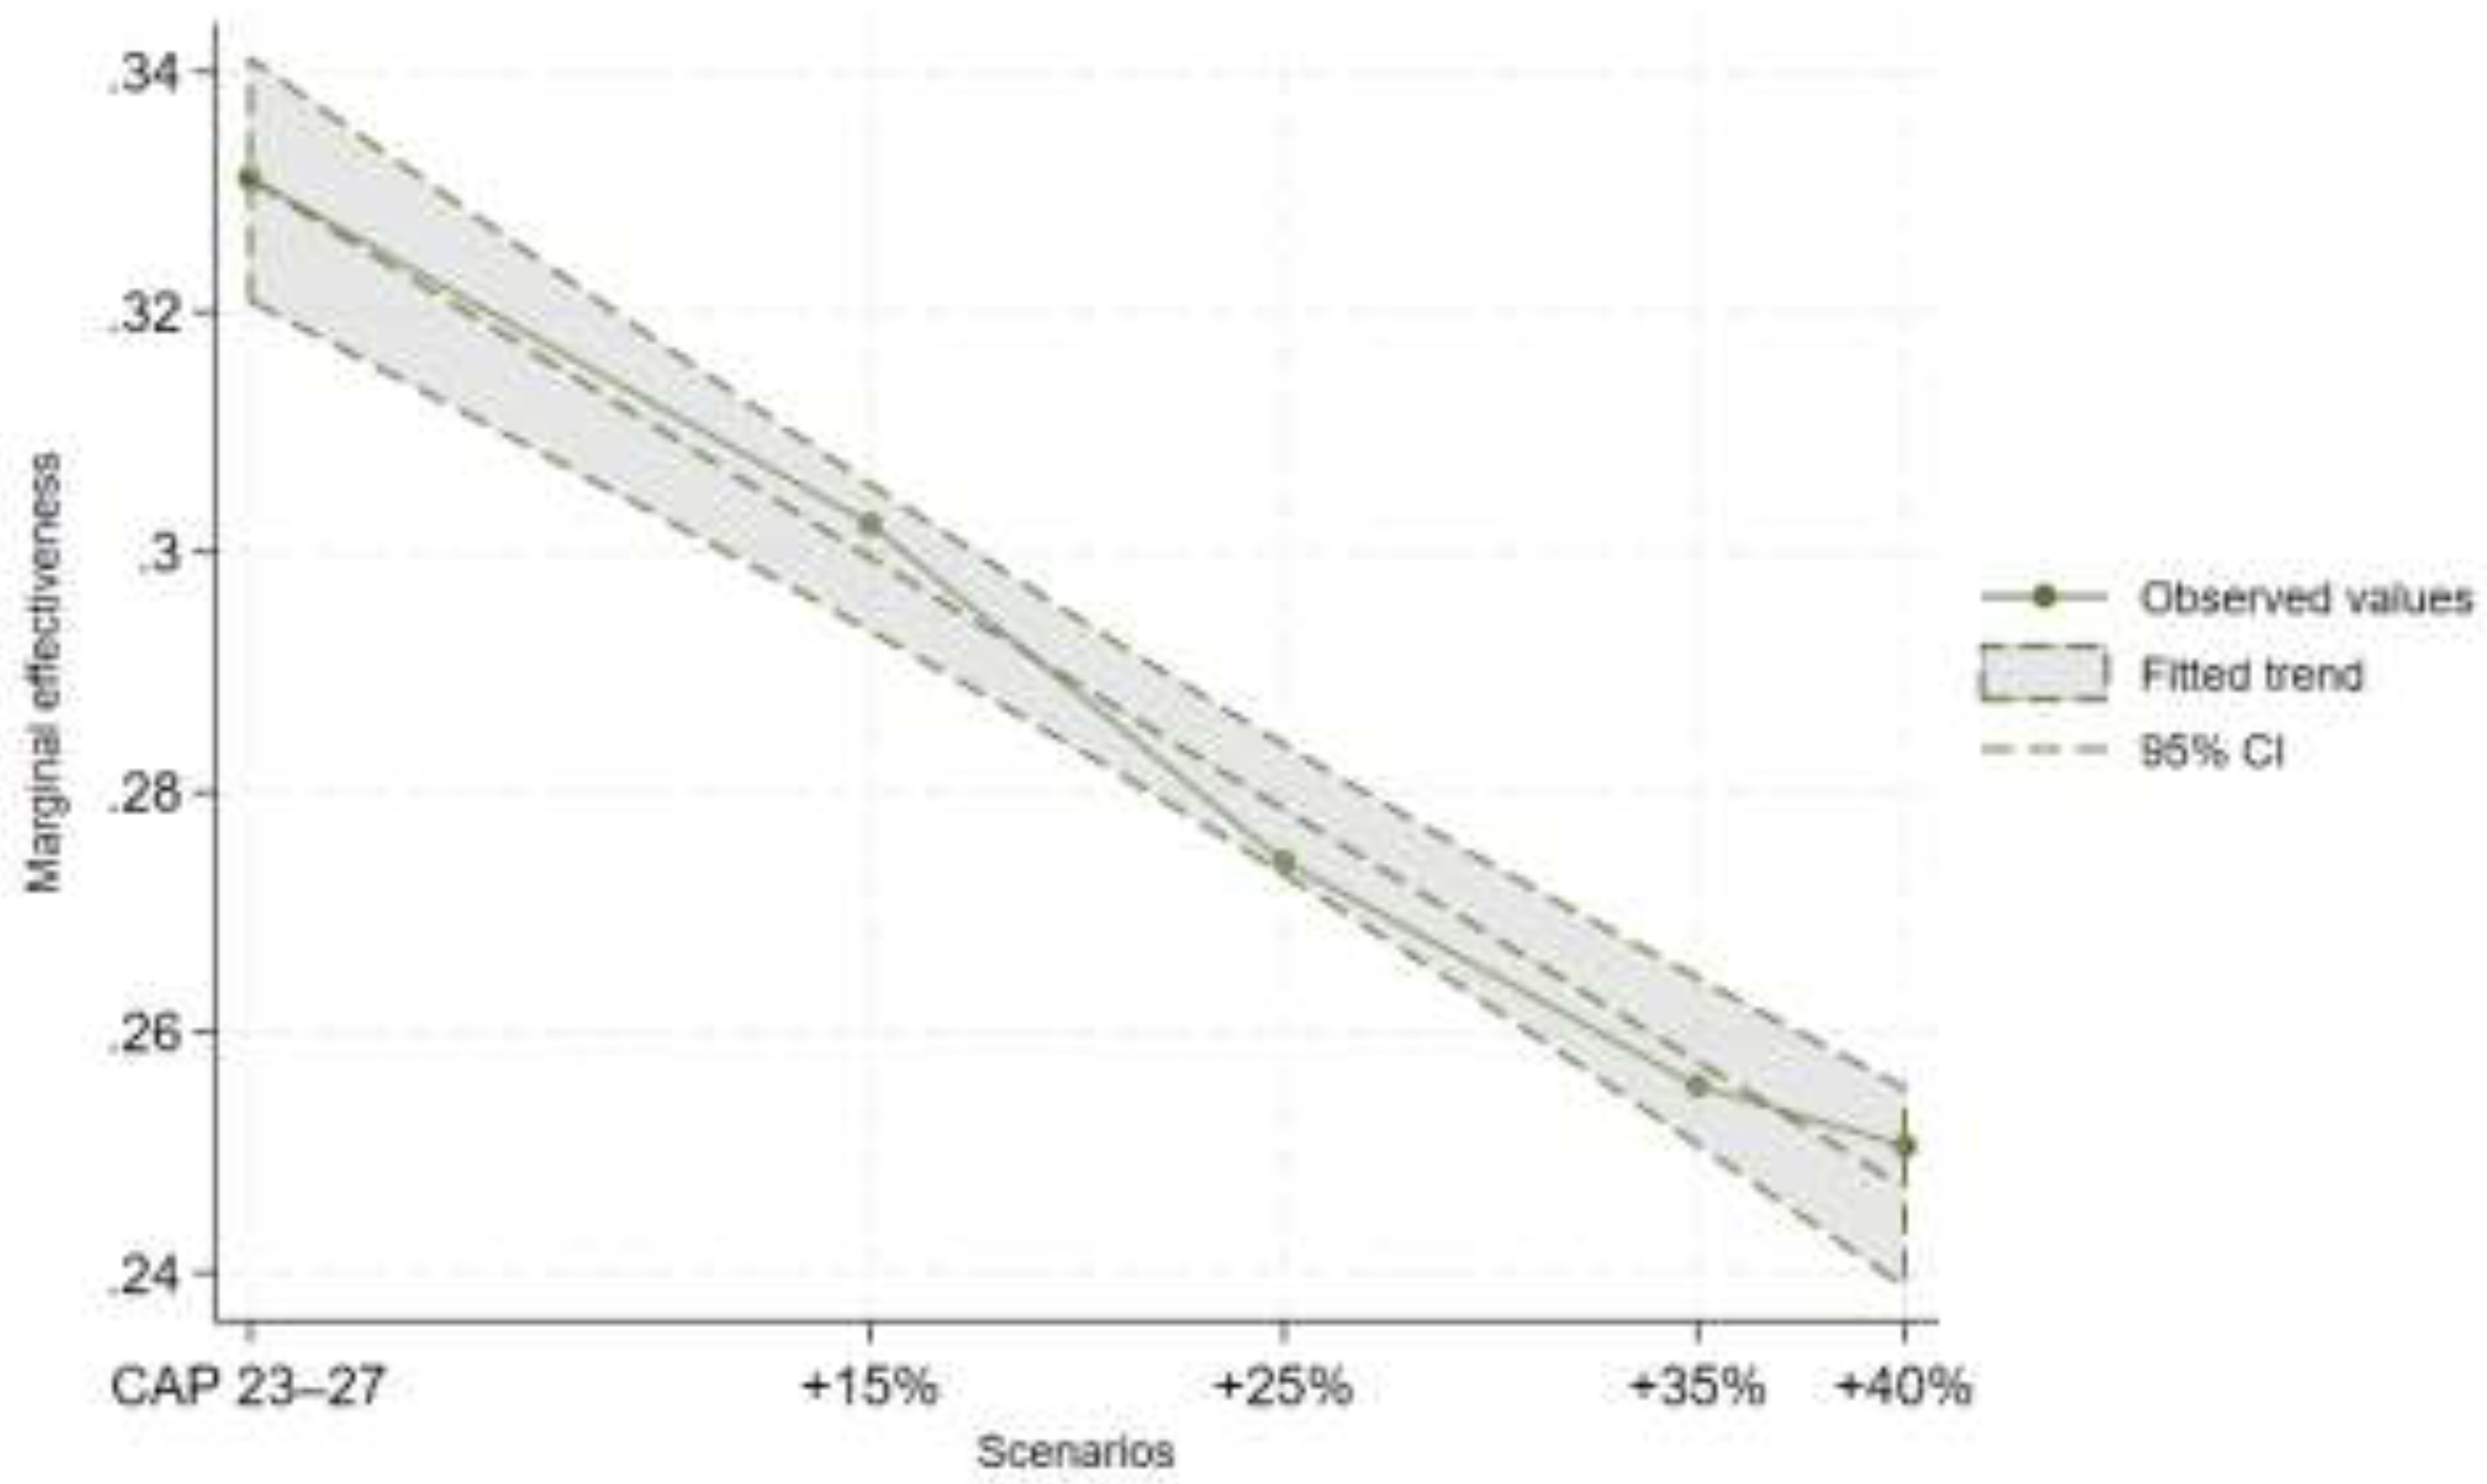
Table 4.
Variation in Organic Farming (%) over the baseline in selected scenarios by Type of Farming.
Table 4.
Variation in Organic Farming (%) over the baseline in selected scenarios by Type of Farming.
| Type of Farming (TF) | Baseline (ha) | CAP 2023-2027 | 15% | 25% | 35% |
| Mixed Crops | 103 | - | - | 40.2 | 40.2 |
| Mixed Crops and Livestock | 692 | 4.4 | 6.8 | 6.8 | 15.8 |
| Arable Crops | 1434 | 71.0 | 109.1 | 111.3 | 122.6 |
| Tree Crops | 1308 | 1.9 | 1.9 | 1.9 | 1.9 |
| Herbivores | 4310 | - | - | - | - |
| Granivores | 216 | - | - | - | - |
| Total | 8063 | 13.3 | 20.3 | 21.2 | 24.0 |
Table 5.
Variation in Organic Farming (%) over the baseline in selected scenarios by Farm Size.
| Farm Size (ha) | Baseline (ha) | CAP 2023-2027 | 15% | 25% | 35% |
| <5 | 49.8 | - | - | - | - |
| 5-15 | 511 | 4.9 | 4.9 | 4.9 | 4.9 |
| 15-40 | 1160 | 2.1 | 5.7 | 8.4 | 8.4 |
| >40 | 6343 | 16.1 | 24.4 | 25.0 | 28.5 |
| Total | 8063 | 13.3 | 20.3 | 21.2 | 24.0 |
4. Discussion
This study introduces a methodological advancement for analyzing the conversion to organic farming by combining detailed farm-level data from the Italian FADN with the AGRITALIM agro-economic model. The strength of this approach lies in its dynamic structure, which allows the modeling of farms’ decision-making over time, explicitly taking into account the costs and potential productivity losses experienced during the conversion phase. These costs and losses are differentiated by crop and livestock product and are based on observed historical data. Unlike many studies that focus solely on full conversion or employ static models, our approach enables the explicit modeling of the conversion decision for each individual farm, capturing the real trade-offs that farmers face during the transition process. By relying on observed farm-level data, the model provides a more accurate representation of farmers’ responses to policy incentives and market conditions, making it a valuable tool for simulating the impacts of agricultural policies and for supporting the design of targeted and sustainable interventions.
The results indicate that increasing unitary payments for organic farming leads to relatively limited gains in terms of converted area and the number of farms involved. [16] estimate that achieving the 25% organic target at the EU level would require an increase in the Pillar 1 budget ranging between 4% and 21%, depending on the allocation strategy, while [22], in addition, show that such increases may come at the expense of other CAP measures. In line with these findings, our results suggest that, at the regional level, the response to higher payments is relatively rigid, pointing to the presence of structural and technical barriers that go beyond financial incentives.
Several studies state that organic farmers, in addition to the typical risks of agriculture, also face sector-specific risks such as those of transition, soil conservation, crop protection, as well as increased price volatility and lower yields [3]. [23] further show that profit maximization alone is often insufficient to induce conversion, as regulatory, informational, and institutional factors also play a relevant role. These elements help explain the limited responsiveness to payment increases observed in our simulations.
The CAP 2023–2027 reform already generates a moderate increase in organic UAA (+5.1%), but this outcome is accompanied by a substantial increase in public expenditure (+15.4%). This pattern becomes even more pronounced under higher payment scenarios, suggesting a relatively rigid response from farms in the Lazio region to financial incentives. Under the most ambitious scenario (+40%), the additional conversion results in an increase in organic UAA of approximately 12%, supported by nearly a 50% rise in the organic budget. These findings point to a declining cost-effectiveness of payment-based strategies, where increases in public spending generate relatively modest additional environmental benefits. Similar patterns of heterogeneous responses to policy incentives across regions and farm types have been highlighted at the EU level [18], suggesting that structural and sector-specific constraints influence the effectiveness of organic conversion policies
The analysis also reveals marked heterogeneity in conversion responses across provinces, farm types, and farm sizes. Spatially, conversion is mainly concentrated in the provinces of Rome and Viterbo, while other provinces, such as Rieti, Frosinone, and Latina, show very limited responsiveness across all scenarios. These differences partly reflect pre-existing structural characteristics and baseline levels of organic farming, with more rural and extensive provinces exhibiting greater potential for expansion compared to areas characterized by intensive agriculture. In addition, physical and climatic conditions may further amplify production fragility, reducing the effectiveness of economic incentives in certain contexts [7,24].
At the sectoral level, arable crop farms are the most responsive to increased payments, mixed farms display moderate responses, and livestock farms show little to no reaction. This is consistent with the results of [25], who highlight higher production and market risks in organic livestock systems, where sales often take place in niche markets characterized by price volatility and lower yields. Similarly, [2,26] state that farms in intensive sectors tend not to convert because of technical and organizational rigidities. These results confirm that structural and technical constraints, particularly in livestock, may limit the feasibility of organic conversion even in the presence of higher financial support.
Farm size further reinforces this trend, with medium-to-large farms accounting for most of the converted area, while smaller farms appear largely insensitive to changes in unitary payments. This finding is consistent with previous studies showing that farms requiring a more intensive production process tend to convert only when sufficient land endowments and scale economies are available [26,27]. Moreover, access to profitable markets for organic products is often limited to larger farms, also because the benefits of selling organic products go largely to intermediaries and traders, while exporting to richer markets is only accessible to larger farms [28,29,30]. As a result, conversion barriers remain strong for small and medium-sized farms, which represent the majority of Italian agriculture [9,10,31].
However, [4] state that organic farms are generally less financially constrained, but they are also more dependent on public payments [32]. [6,33,34] conclude that, on equal terms, the financial situation of organic farms could get much worse without the liquidity contribution of public payments, underlining the relevance of policy support for the expansion of organic land. Therefore, the combination of market, productive, and policy conditions is key in the decision to convert. Many authors stress the relevance of the combination of these three factors, where the higher prices obtained by organic products in the market should compensate for the lower yields [6,33,34,35], even though this is not always the case, especially for livestock products and some vegetables, as well as under specific soil conditions [7,25,36].
These results should be interpreted in light of the behavioral assumptions embedded in the model, which assume rational, profit-maximizing farmers who respond to policy incentives based on expected revenues and costs. While this framework allows a clear assessment of economic trade-offs, it does not fully capture non-economic drivers of conversion decisions, such as risk preferences, personal values, information constraints, or generational factors. Moreover, the model considers only fully organic farms and does not account for possible reversion from organic to conventional farming. The limited responsiveness observed even under favorable payment scenarios may therefore reflect not only economic rigidities but also the presence of structural and informational barriers that are not explicitly modelled.
5. Conclusions
This study highlights the complexity of promoting organic farming in the Lazio region, in Italy. The results show that increases in payment-based incentives generate relatively limited effects in terms of converted area and the number of farms willing to adopt organic practices. This suggests a rigid response to policy payments alone. This rigidity reflects the presence of structural, technical, and informational constraints that play a significant role in shaping farm-level decisions and cannot be overcome exclusively through higher public support. The analysis demonstrates that increasing unitary payments for organic farming leads to limited additional conversion, highlighting a declining cost-effectiveness of purely payment-based strategies. Conversion responses are highly heterogeneous across provinces, farm types, and farm sizes: arable farms and medium-to-large farms are the most responsive, while livestock and small farms remain largely unresponsive even under ambitious payment scenarios.
From a methodological perspective, this study contributes to the literature by combining detailed farm-level data from the Italian FADN with a dynamic agro-economic model that explicitly accounts for the conversion phase, including temporary productivity losses and higher costs. This framework allows for a realistic representation of farmers’ decisions over time.
Instead, from a policy perspective, these findings suggest that strategies relying solely on higher organic payments are unlikely to achieve widespread adoption. More comprehensive policy strategies are needed, combining financial incentives with measures aimed at reducing fixed conversion costs, providing targeted technical assistance, and facilitating market access, particularly for structurally disadvantaged farm types. Market access, price premiums, structural conditions, and technical constraints therefore emerge as key determinants of farmers’ willingness to convert to organic farming. Furthermore, the dynamic nature of the model emphasizes the importance of continuous monitoring and evaluation of policy outcomes over time. Farm-level simulation tools, such as the one proposed in this study, can support evidence-based policy design and help identify more targeted and cost-effective pathways to achieve the objectives of the F2F Strategy. Future research could further integrate non-economic factors influencing farmers’ decisions, such as risk preferences, sociodemographic factors, and information access in the modelling framework, in order to improve the accuracy of predictions and policy relevance.
Author Contributions
“Conceptualization, R.C. and R.B..; methodology, R.C. and R.B.; software, R.C. and R.B..; validation, R.C..; formal analysis, R.C. and R.B..; investigation, R.C and R.B-; resources, R.C..; data curation R.B.; writing—original draft preparation, R.B.; writing—review and editing, R.C. and R.E.; visualization, R.B. and R.C. and R.E.; supervision, R.C.; project administration, R.C:.; funding acquisition, R.C. All authors have read and agreed to the published version of the manuscript.
Funding
We acknowledge financial support under the PRIN Project RECIPE (Linking Research Evidence to Policy Impact and Learning: Increasing the Effectiveness of Rural Development Programmes Towards Green Deal Goals), MUR code: 20224ZHNXE, CUP: J53D23004020006.
Data Availability Statement
The data used in this study are not publicly available due to licensing restrictions. The dataset was provided by a third party under an institutional license for research purposes. In particular, the data were supplied by CREA-PB (Council for Agricultural Research and Economics – Policy and Bioeconomy), and are subject to usage restrictions that prevent public dissemination. For this reason, the authors are not authorized to share or redistribute the dataset.
Conflicts of Interest
The authors declare no conflicts of interest.
Appendix A: Mathematical Representation and Calibration of the AGRITALIM Model
Appendix A.1. Objective Function
Operating income = Z
Gross Saleable Production
CAP payments
Revenues from Complementary Activities
Variable Costs
Quadratic Costs =
External Labour =
Feed Purchased
Pumped Water
Depreciation Rates Observed
Depreciation Rates New Investments
Variables
XC = hectares of crops
XA = number of animals
XH = hours of labour
XF = quantity of feed
XW = quantity of water pumped
ADTC = additional area of tree crops
ADSF = additional area of stables and facilities
Market
pc = prices of crops
pm = prices of milk
pfp = prices of factors of production (fertilizers, pesticides)
ph = prices of external labour
pf = prices of feed purchased
pw = prices of water pumped
drtc = depreciation rates of new investments (tree crops)
drsf = depreciation rates of new investments (animals)
Production function
yc = yields of crops
ym = yields of milk
qfp = quantities of factors of production (fertilizers, pesticides)
Common Agricultural Policy payments
dp = decoupled payments
cpc = coupled payments for crops
cpa = coupled payments for animals
Revenues and average costs
revnm = revenues from other animal products, no milk (meat, eggs, honey,…)
acc = average costs for crops (per hectare)
aca = average costs for animals (per number)
Appendix A.2. Constraints
Sets shown in the mathematical representation
j = types of crops
n = farms
ja = types of animals
jt = tree crops
jan = types of animals non-productive
jap = types of animals productive
nutr = nutrients in animal feeding
Other sets (not shown in the mathematical representation): geographical area [NUTS 2 and NUTS 3], altimetric level, types of cultivation (field, vegetable garden, greenhouse), following crops, main vegetable product, animal production, time
Matrix coefficients
ml = labour (manual and mechanical) needs for each crop and animal
mw = water needs for each irrigated crop
msf = square meter of stables and facilities per animal
nr = nutrient requirements for each animal
nc = nutrient content in each produced or purchased feed
rc = ratio between productive and non-productive animals
Availabilities
ald = land availability per farm
alb = labour availability per farm
awt = water availability per each source (e.g., water users’ association, well,…) and farm
atc = tree crops area per farm
asf = total square meters of stables and facilities
References
- Baker, B.P.; Green, T.A.; Loker, A.J. Biological Control and Integrated Pest Management in Organic and Conventional Systems. Biol. Control 2020, 140, 104095. [Google Scholar] [CrossRef]
- Bonfiglio, A.; Arzeni, A. Spatial Distribution of Organic Farms and Territorial Context: An Application to an Italian Rural Region. Bio-based Appl. Econ. 2019, 8, 297–323. [Google Scholar] [CrossRef]
- Hanson, J.; Dismukes, R.; Chambers, W.; Greene, C.; Kremen, A. Risk and Risk Management in Organic Agriculture: Views of Organic Farmers. Renew. Agric. Food Syst. 2004, 19, 218–227. [Google Scholar] [CrossRef]
- Buttinelli, R.; Cortignani, R.; Dono, G. Financial Sustainability in Italian Organic Farms: An Analysis of the Fadn Sample. Econ. Agro-Alimentare 2021, 23, 1–32. [Google Scholar] [CrossRef]
- Acs, S.; Berentsen, P.; Huirne, R.; van Asseldonk, M. Effect of Yield and Price Risk on Conversion from Conventional to Organic Farming. Aust. J. Agric. Resour. Econ. 2009, 53, 393–411. [Google Scholar] [CrossRef]
- Sgroi, F.; Foderà, M.; Di Trapani, A.M.; Tudisca, S.; Testa, R. Cost-Benefit Analysis: A Comparison between Conventional and Organic Olive Growing in the Mediterranean Area. Ecol. Eng. 2015, 82, 542–546. [Google Scholar] [CrossRef]
- Seufert, V.; Ramankutty, N.; Foley, J.A. Comparing the Yields of Organic and Conventional Agriculture. Nature 2012, 485, 229–232. [Google Scholar] [CrossRef]
- Cisilino, F.; Bodini, A.; Zanoli, A. Rural Development Programs’ Impact on Environment: An Ex-Post Evaluation of Organic Faming. Land use policy 2019, 85, 454–462. [Google Scholar] [CrossRef]
- Kallas, Z.; Serra, T.; Gil, J.M. Farmers’ Objectives as Determinants of Organic Farming Adoption: The Case of Catalonian Vineyard Production. Agric. Econ. 2010, 41, 409–423. [Google Scholar] [CrossRef]
- Jouzi, Z.; Azadi, H.; Taheri, F.; Zarafshani, K.; Gebrehiwot, K.; Van Passel, S.; Lebailly, P. Organic Farming and Small-Scale Farmers: Main Opportunities and Challenges. Ecol. Econ. 2017, 132, 144–154. [Google Scholar] [CrossRef]
- Smith, L.G.; Jones, P.J.; Kirk, G.J.D.; Pearce, B.D.; Williams, A.G. Modelling the Production Impacts of a Widespread Conversion to Organic Agriculture in England and Wales. Land use policy 2018, 76, 391–404. [Google Scholar] [CrossRef]
- Kerselaers, E.; De Cock, L.; Lauwers, L.; Van Huylenbroeck, G. Modelling Farm-Level Economic Potential for Conversion to Organic Farming. Agric. Syst. 2007, 94, 671–682. [Google Scholar] [CrossRef]
- Bremmer, J.; Gonzalez-Martinez, A.; Jongeneel, R.; Huiting, H.; Stokkers, R. Effects of Farm to Fork and Biodiversity Strategy 2030 at Farm, National and EU Level; 2021; Volume c, pp. 1–4. [Google Scholar]
- Barreiro-Hurle, J.; Bogonos, M.; Himics, M.; Hristov, J.; Pérez-Domiguez, I.; Sahoo, A.; Salputra, G.; Weiss, F.; Baldoni, E.; Elleby, C. Modelling Environmental and Climate Ambition in the Agricultural Sector with the CAPRI Model 2021.
- Henning, C.; Witzke, P.; Panknin, L. A Simulation Study of the Impact of the F2F-Strategy on Production, Trade, Welfare and the Environment Based on the CAPRI-Model. Univ. Kiel … 2021, 1–10. [Google Scholar]
- Kremmydas, D.; Beber, C.; Baldoni, E.; Ciaian, P.; Fellmann, T.; Gocht, A.; Hristov, J.; Pignotti, D.; Vicario, D.R.; Stepanyan, D.; et al. The EU Target for Organic Farming: Potential Economic and Environmental Impacts of Two Alternative Pathways. Appl. Econ. Perspect. Policy 2024. [Google Scholar] [CrossRef]
- Kremmydas, D.; Ciaian, P.; Baldoni, E. Modeling Conversion to Organic Agriculture with an EU-Wide Farm Model. Bio-based Appl. Econ. 2023, 12, 261–304. [Google Scholar] [CrossRef]
- Rey Vicario, D.; Kremmydas, D.; Baldoni, E.; Ciaian, P.; Tillie, P. Do Organic Farming Policies Need to Be More Target-Oriented to Achieve Sustainability ? J. Environ. Manage Received. 2025, 394, 127342. [Google Scholar] [CrossRef] [PubMed]
- Howitt, R.E. Positive Mathematical Programming. Am. J. Agric. Econ. 1995, 77, 329–342. [Google Scholar] [CrossRef]
- Paris, Q.; Arfini, F. A Positive Mathematical Programming Model for Regional Analysis of Agricultural Policies Frontier Cost Functions , Self-Selection , Price Risk , PMP , and Agenda 2000 Quirino Paris and Filippo Arfini December 1998. 1995.
- ISMEA Bio in Cifre - 2024. 2024, Luglio.
- Kremmydas, D.; Ciaian, P.; Baldoni, E.; Tillie, P.; Diakoulakis, G.N.; Kampas, A. What Will Be the Budgetary Cost for Reaching Green Deal’s Organic Target ? A Simulation Approach. 2022. [Google Scholar]
- Home, R.; Indermuehle, A.; Tschanz, A.; Ries, E.; Stolze, M. Factors in the Decision by Swiss Farmers to Convert to Organic Farming. Renew. Agric. Food Syst. 2018. [Google Scholar] [CrossRef]
- Cisilino, F.; Zilli, G.; Zanuttig, G. Fadn Data to Support Policymaking: The Potential of an Additional Survey. Econ. Agro-Alimentare 2021, 23, 1–22. [Google Scholar] [CrossRef]
- Berentsen, P.B.M.; Kovacs, K.; Asseldonk, M.A.P.M. Van Comparing Risk in Conventional and Organic Dairy Farming in the Netherlands : An Empirical Analysis. J. Dairy Sci. 2012, 95, 3803–3811. [Google Scholar] [CrossRef]
- Pietola, È.S.; Lansink, A.O. Farmer Response to Policies Promoting Organic Farming Technologies in Finland. Eur. Rev. ofAgricultural Econ. 2001, 28, 1–16. [Google Scholar] [CrossRef]
- Cisilino, F.; Madau, F.A. Organic and Conventional Farming: A Comparison Analysis through the Italian FADN. I Mediterr. Conf. Agro-Food Soc. Sci. 103rd EAAE Semin. ‘Adding Value to Agro-Food Supply Chain Futur. Euromediterranean Space’. Barcelona, Spain, April 23rd - 25th, 2007 2007; 22. [Google Scholar]
- Abele, S.; Dubois, T.; Twine, E.; Sonder, K.; Coulibaly, O. Organic Agriculture in Africa: A Critical Review from a Multidisciplinary Perspective. J. Agric. Rural Dev. Trop. Subtrop. 2007, 89, 143–166. [Google Scholar]
- Bennett, M.; Franzel, S. Can Organic and Resource-Conserving Agriculture Improve Livelihoods? A Synthesis. Int. J. Agric. Sustain. 2013, 11, 193–215. [Google Scholar] [CrossRef]
- Gómez Tovar, L.; Martin, L.; Gómez Cruz, M.A.; Mutersbaugh, T. Certified Organic Agriculture in Mexico: Market Connections and Certification Practices in Large and Small Producers. J. Rural Stud. 2005, 21, 461–474. [Google Scholar] [CrossRef]
- Łuczka, W.; Kalinowski, S. Barriers to the Development of Organic Farming: A Polish Case Study. Agric. 2020, 10, 1–19. [Google Scholar] [CrossRef]
- Lakner, S.; Breustedt, G. Efficiency Analysis of Organic Farming Systems - A Review of Concepts, Topics, Results and Conclusions. Ger. J. Agric. Econ. 2017, 66, 85–108. [Google Scholar] [CrossRef]
- Sgroi, F.; Candela, M.; Di Trapani, A.M.; Foderà, M.; Squatrito, R.; Testa, R.; Tudisca, S. Economic and Financial Comparison between Organic and Conventional Farming in Sicilian Lemon Orchards. Sustain. 2015, 7, 947–961. [Google Scholar] [CrossRef]
- Mohamad, R.S.; Verrastro, V.; Cardone, G.; Bteich, M.R.; Favia, M.; Moretti, M.; Roma, R. Optimization of Organic and Conventional Olive Agricultural Practices from a Life Cycle Assessment and Life Cycle Costing Perspectives. J. Clean. Prod. 2014, 70, 78–89. [Google Scholar] [CrossRef]
- Acs, S.; Berentsen, P.B.M.; Huirne, R.B.M. Modelling Conventional and Organic Farming: A Literature Review. NJAS - Wageningen J. Life Sci. 2005, 53, 1–18. [Google Scholar] [CrossRef]
- Hafla, A.N.; MacAdam, J.W.; Soder, K.J. Sustainability of US Organic Beef and Dairy Production Systems: Soil, Plant and Cattle Interactions. Sustain. 2013, 5, 3009–3034. [Google Scholar] [CrossRef]
Table 1.
Descriptive Statistics of the selected FADN sample, and for the Conventional and Organic groups of farms.
Table 1.
Descriptive Statistics of the selected FADN sample, and for the Conventional and Organic groups of farms.
| Variable | UM | Conventional | Organic | Total | |||
| Mean | SD | Mean | SD | Mean | SD | ||
| Land | Ha | 32.6 | 49.0 | 48.1 | 63.5 | 37.6 | 54.6 |
| Operating Income | €/ha | 3466.2 | 7043.9 | 1908.3 | 2764.5 | 2962.2 | 6044.2 |
| Livestock Units (LSU) | Number of heads/ha | 22.7 | 141.6 | 2.7 | 6.7 | 15.2 | 112.5 |
| Hired Work | Working Units/ha | 0.2 | 0.5 | 0.1 | 0.1 | 0.2 | 0.4 |
| Family Work | Working Units/ha | 0.1 | 0.4 | 0.1 | 0.1 | 0.1 | 0.3 |
| Gross Margin | €/ha | 4367.2 | 7930.3 | 2604.4 | 3176.8 | 3796.9 | 6814.9 |
| Total Gross Output | €/ha | 7196.8 | 9264.4 | 4143.3 | 5398.5 | 6208.9 | 8333.8 |
| Crop Gross Output | €/ha | 4434.4 | 7892.9 | 2944.7 | 4813.1 | 3952.4 | 7075.5 |
| Livestock Gross Output | €/ha | 2359.4 | 5670.6 | 867.9 | 2755.1 | 1876.8 | 4966.8 |
Table 2.
Distribution of Conventional and Organic farms over Type of Farming.
| Type of Farming | Conventional | Organic | Total | % Organic Farming on Total |
| Dairy Cattle | 49 | 9 | 58 | 15.5 |
| Cereals | 12 | 0 | 12 | 0.0 |
| Livestock | 81 | 48 | 129 | 37.2 |
| Tree Crops | 51 | 44 | 95 | 46.3 |
| Granivores | 12 | 12 | 24 | 50.0 |
| Mixed Crops and Livestock | 30 | 22 | 52 | 42.3 |
| Olive Groves | 6 | 10 | 16 | 62.5 |
| Horticulture | 60 | 20 | 80 | 25.0 |
| Arable farms | 78 | 9 | 87 | 10.3 |
| Vineyards | 12 | 13 | 25 | 52.0 |
| Total | 391 | 187 | 578 | 32.4 |
Disclaimer/Publisher’s Note: The statements, opinions and data contained in all publications are solely those of the individual author(s) and contributor(s) and not of MDPI and/or the editor(s). MDPI and/or the editor(s) disclaim responsibility for any injury to people or property resulting from any ideas, methods, instructions or products referred to in the content. |
© 2026 by the authors. Licensee MDPI, Basel, Switzerland. This article is an open access article distributed under the terms and conditions of the Creative Commons Attribution (CC BY) license (http://creativecommons.org/licenses/by/4.0/).
Copyright: This open access article is published under a Creative Commons CC BY 4.0 license, which permit the free download, distribution, and reuse, provided that the author and preprint are cited in any reuse.


