

Submitted:
17 September 2026
Posted:
18 September 2026
You are already at the latest version
Abstract
The adoption of conventional effluent treatment plants in small and medium enterprises operating in the textile industry poses serious economic challenges that cause release of untreated wastewater and atmospheric soot emissions. In order to resolve this problem, this research paper proposes a new architectural design called “Integrated Eco-Factory” that not only aims at solving water pollution but also capturing atmospheric carbon soot, harnessing industrial waste energy, and up-cycling the hazardous chemical sludge. Four fundamental subsystems are proposed that work in coordination in the following ways: (1) Cyclonic separation technique as per the Lapple standard for transformation of flue gas soot into inkjet printing ink; (2) Electrocoagulation (EC) reactor made from aluminum that is used to replace biological degradation to achieve 100% process water recycling; (3) Solidification/Stabilization (S/S) method for transforming EC chemical sludge into construction grade Eco-Bricks; and (4) autonomous Tri-Hybrid energy system (Solar Photovoltaic Cells, Thermoelectric Generators, and Micro Hydro Turbines) with ESP32 Internet of Things monitoring system. The experiments carried out for proving the effectiveness of the proposed architecture showed particulate capture efficiency of 92.4%, ink viscosity of 3.18 cP, and surface tension of 38.5 mN/m. The Upcycled Eco-Bricks with (10%) sludge percentage had compressive strength of 14.2MPa and successfully passed TCLP heavy metal leaching safety test. The power generated through the process is about 950Wh/day, providing energy independence from external energy sources. The techno-economic analysis indicates that Capex cost recovery will be completed within 7 months, thereby providing the “Waste to Wealth” model for industries.
Keywords:
novel eco-factory model
; closed-loop wastewater reuse
; electrocoagulation
; atmospheric carbon capture
; eco-bricks
; tri-hybrid energy harvesting
; Waste-to-Wealth
1. Introduction
1.1. Industrial Context and Environmental Degradation
The textiles and readymade garments (RMGs) industry acts as an essential economic driver in developing nations in South Asia. But the wet process is not environmentally sustainable because 200 liters of freshwater is used for processing each kilogram of textile produced. In the major production cities of Gazipur and Dhaka, there is excess extraction from the aquifers that leads to the depletion of the groundwater table to the extent of 2.0 to 3.0 meters each year. The industrial chimneys emit black carbon (soot), sulfur oxides and carbon dioxide into the environment.
1.2. Failure Modes of Conventional Remediation in SMEs
BIOLOGICAL EFFLUENT TREATMENT PLANTS (ETPS). The biological effluent treatment plants use delicate bacteria, which cannot survive under the highly fluctuating pH values of the wastewater (ranging between 4.0 and 11.5), in addition to the toxic metals present in the wastewater from the process of dyeing textiles. Besides, the air pollution control devices such as the wet scrubber appear to be a complete “sunk cost” without any ROI to SMEs.
1.3. Statement of Novelty and Research Gap
Although there are many individual studies on individual technologies for remediating air, water, or solid waste such as electrocoagulation or cyclonic filtration, there is nothing that takes all four vectors of industrial pollution together into an integrated sustainable industrial concept. This article introduces the Integrated Eco-Factory, a novel multi-vector system that is developed to turn industrial pollution control into a profit-generating business plan. Table 1 compares this model’s uniqueness to current literature.
2. Materials and Methods
The architectural model of the Integrated Eco-Factory operates on a closed-loop framework.
2.1. Module A: Carbon Capture and Eco-Ink Synthesis
Industrial chimney exhaust is intercepted using a high-efficiency cyclonic separator designed according to Lapple standard ratios (Diameter D = 20 cm, Height H = 80 cm, Inlet Velocity v = 12 m/s). The cut-point particle diameter (d50) collected at 50% efficiency is modeled as:
where μ is gas dynamic viscosity (1.8 × 10⁻⁵ kg/m·s), b is inlet width (0.05 m), Ne ≈ 5, and ρp = 1800 kg/m^3.
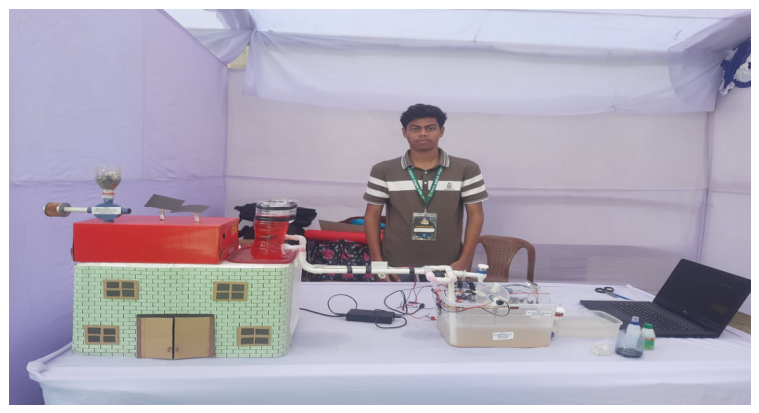
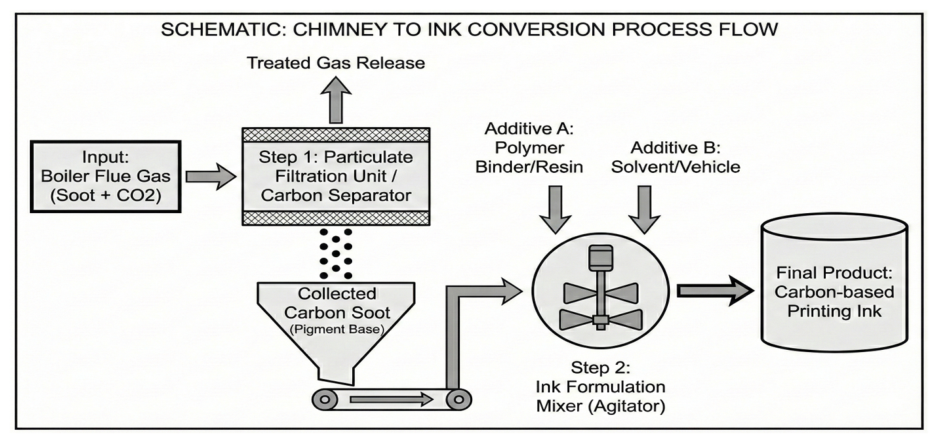
Figure 1.
Prototype Overview of the Integrated Eco-Factory Setup.
Figure 2.
Process Flow Diagram from Chimney Exhaust to Ink Synthesis.
Captured soot undergoes solvent washing in a 1:1 Isopropyl Alcohol (IPA) and distilled water solution at 600 RPM for 45 minutes, followed by thermal desorption at 120 °C for 120 minutes. The dried carbon is ball-milled to 30–50 nm and formulation proceed per Table 2.
2.2. Module B: Electrocoagulation (EC) Wastewater Treatment
Biological ETPs are replaced by an electrochemical reactor (Volume = 15 L) utilizing sacrificial aluminum (Al) anode and cathode plates with a 2.0 cm electrode gap.
Anode: Al(s) → Al3+(aq) + 3e-
Cathode: 2H2O(l) + 2e- → H2(g) + 2OH-(aq)
Treated water is recirculated back to internal factory operations, achieving zero liquid discharge.
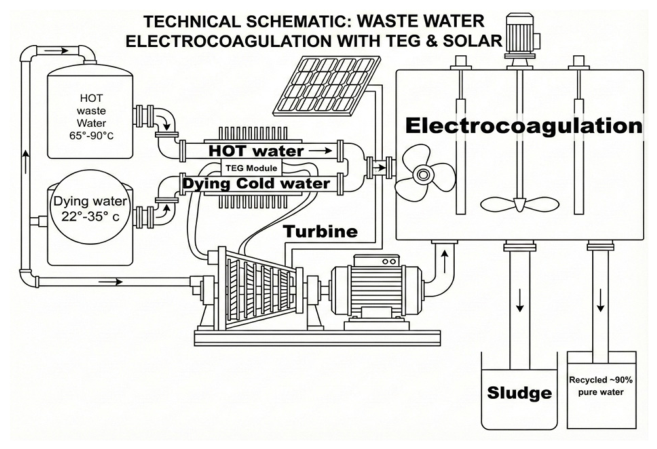
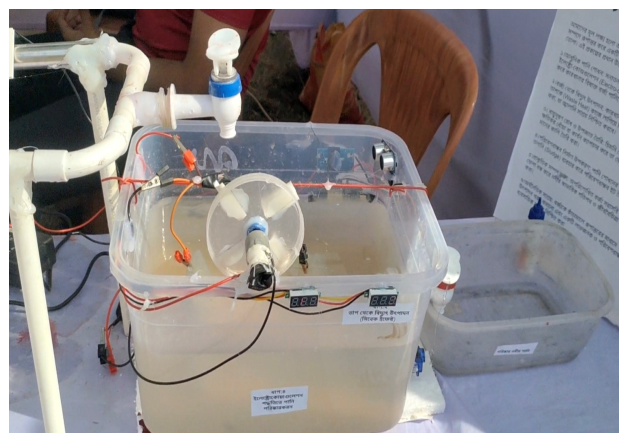
Figure 3.
Technical Schematic of Wastewater EC with TEG & Solar.
Figure 4.
Operational Unit Showing Micro-Hydro Turbine and EC Tank.
2.3. Module C: Sludge Stabilization & Eco-Brick Manufacturing
Chemical sludge from the EC tank is dewatered, dried at 105 °C, and incorporated into a concrete matrix (1:2:4 Cement: Sand: Sludge/Aggregate) at a 10% replacement ratio. Solidification/Stabilization (S/S) encapsulates heavy metal ions within the Calcium-Silicate-Hydrate (C-S-H) crystal lattice.
2.4. Module D: Tri-Hybrid Energy System & Smart IoT Automation
Energy autonomy (ΣP_load ≈ 18 W) is achieved via a Tri-Hybrid setup:
1. Thermoelectric Generators (TEG): Bismuth Telluride (Bi2Te3) arrays harvest boiler manifold waste heat (ΔT = 125 °C) via Seebeck Effect (V=α.ΔT).
2. Micro-Hydro Turbine: Captures kinetic energy from in-pipe effluent discharge (P = η·ρ·g·Q·H).
3. Solar PV Array: 100W Monocrystalline PERC panel with MPPT controller.
An ESP32 microcontroller logs real-time pH, turbidity, and sludge level data. An automated relay activates a SIM800L GSM alert if parameters exceed safety limits (pH < 6.0 or > 8.0, Turbidity > 5 NTU).
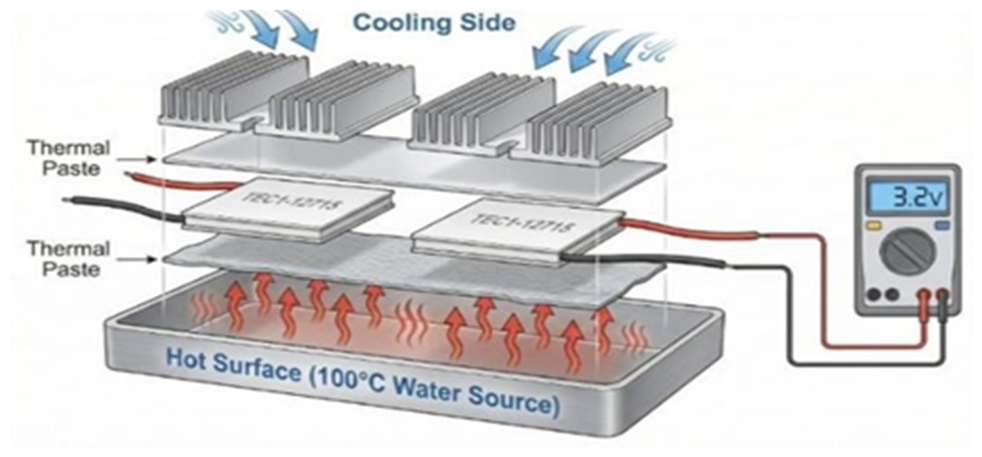
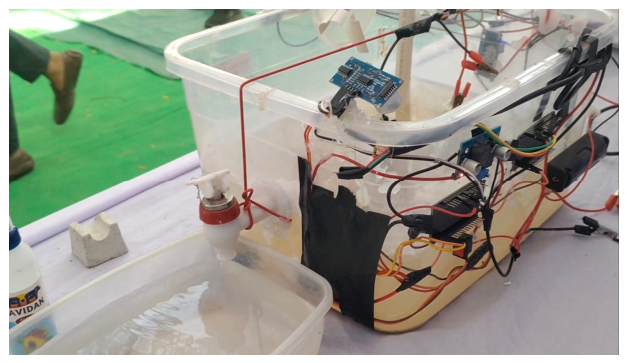
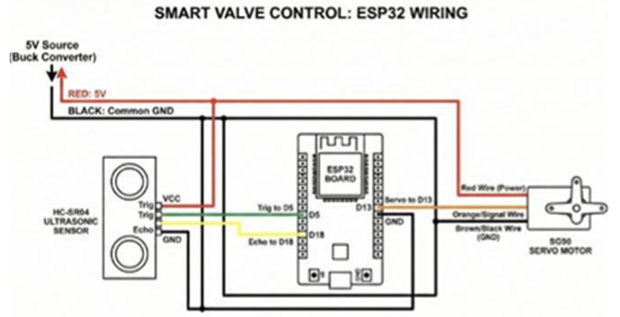
Figure 5.
Thermoelectric Generator (TEG) Assembly Diagram (AI Generated).
Figure 6.
ESP32 Microcontroller Unit Mounted on Sensor Array.
Figure 7.
Circuit Diagram of Smart Valve Control.
3. Results and Discussion
3.1. Characterization of Synthesized Eco-Ink
Evaluation across n=3 independent trials demonstrate high compatibility with standard commercial inkjet requirements
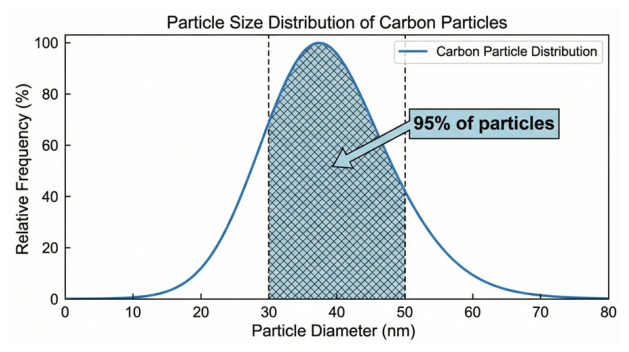
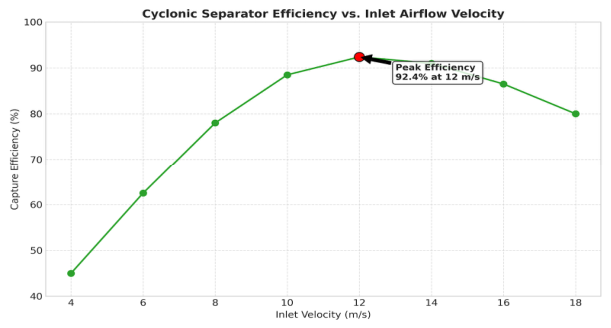
Figure 8.
Particle Size Distribution Histogram of Carbon Particles.
Figure 9.
Cyclonic Separator Capture Efficiency vs Inlet Airflow Velocity.

| Parameter | Unit | Synthesized Eco-Ink | Commercial Ink Standard | Test Method |
| pH Level | -- | 7.8 ± 0.1 | 7.5 – 8.5 | Digital pH Probe |
| Viscosity (25 °C) | cP | 3.18 ± 0.15 | 2.5 – 4.5 | Rotational Viscometer |
| Surface Tension | mN/m | 38.5 | 30 – 40 | Tensiometer |
| Avg. Particle Size | nm | 45 | < 100 | DLS Analysis |
| Optical Density | Abs | 1.45 | 1.40 – 1.60 | Spectrophotometer |
3.2. Wastewater Treatment Efficiency & Reuse Validation
Electrocoagulation achieved rapid pollutant removal within 30 minutes runtime at 15V DC.
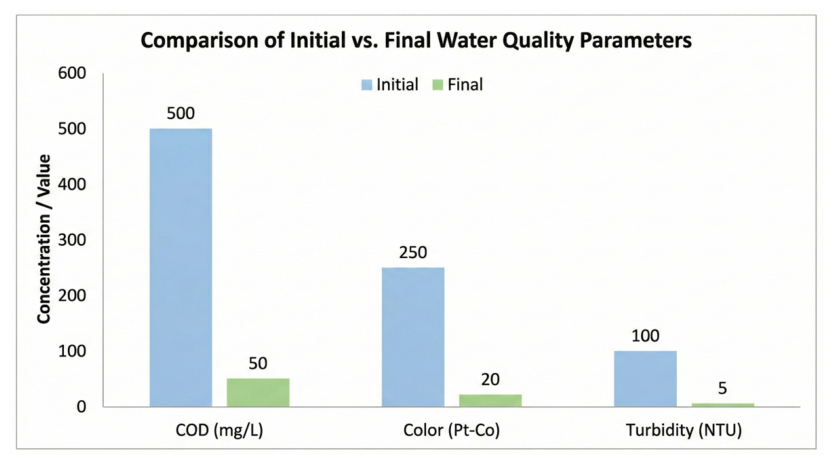
Figure 10.
Bar Chart of Contaminant Removal Efficiency Pre- vs Post-Treatment.
| Parameter | Unit | Raw Effluent | Treated Effluent | Removal Efficiency (%) | DoE Bangladesh Limit |
| pH | -- | 11.5 (Alkaline) | 7.2 (Neutral) | -- | 6.5 – 9.0 |
| Turbidity | NTU | 350 | 12 | 96.5% | < 20 |
| Color (Pt-Co) | TCU | 2400 | 45 | 91.1% | < 150 |
| COD | mg/L | 1800 | 160 | 91.1% | < 200 |
| TDS | ppm | 2200 | 450 | 79.5% | < 2100 |
The post-treatment COD (160 mg/L) satisfies official environmental standards, confirming suitability for closed-loop industrial reuse.
3.3. Mechanical Integrity of Upcycled Eco-Bricks
Structural testing of Eco-Bricks (10% sludge substitution) verified construction compliance=
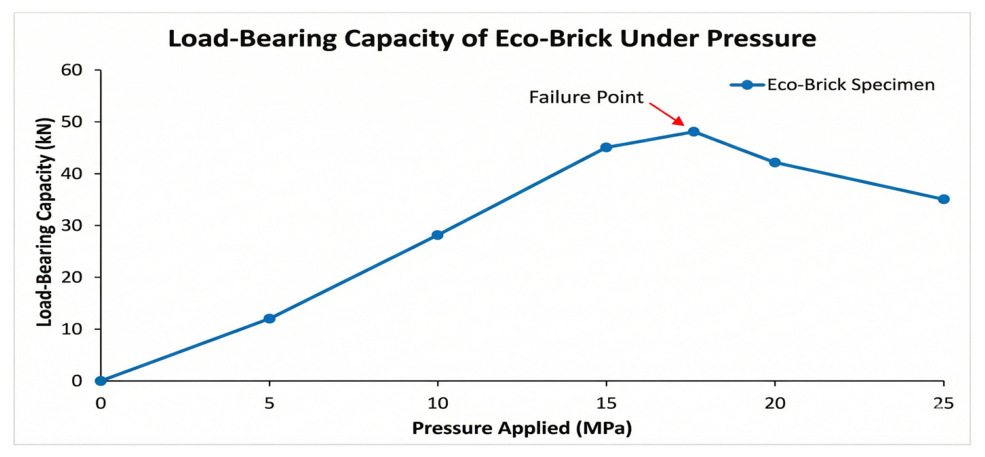
Figure 11.
Stress-Strain and Load-Bearing Curve of Eco-Brick Specimen.
| Parameter | Unit | Eco-Brick Value | Red Clay Brick Standard | ASTM Standard (ASTM C62) |
| Compressive Strength | MPa | 14.2 ± 0.8 | 15.0 – 20.0 | Min. 10.3 MPa |
| Water Absorption | % | 11.5% | 15.0 – 20.0% | Max. 17.0% |
| TCLP Heavy Metals | mg/L | Passed | N/A | Safe Limit (EPA 1311) |
3.4. Tri-Hybrid Energy Autonomy Performance
Power output stats over a 24-hour cycle confirm complete system autonomy.
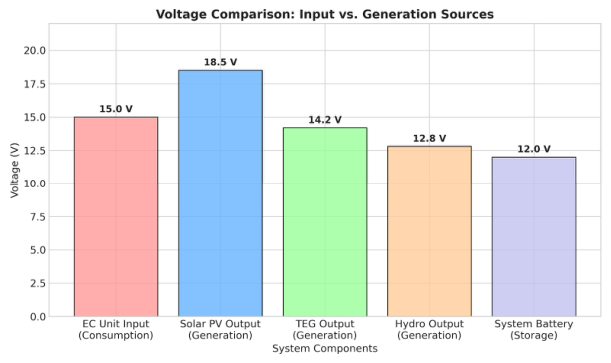
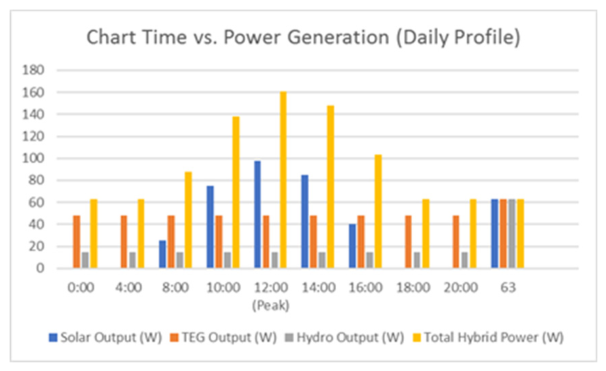
Figure 12.
Voltage Output Profile Comparison across Generation Sources.
Figure 13.
Combined Power Generation vs. Time Graph.
| Sub-System | Peak Voltage (V) | Peak Power (W) | Daily Yield (Wh) | Functional Role |
| Solar PV | 18.5 V | 98 W | 450 Wh | Daytime Peak Supply |
| TEG Array | 14.2 V | 48 W | 380 Wh | Continuous Thermal Baseload |
| Micro-Hydro | 12.8 V | 15 W | 120 Wh | Fluid Flow Recovery |
| Total System | -- | 161 W | 950 Wh/day | 24/7 IoT & Controller Autonomy |
3.5. Techno-Economic Justification and ROI Analysis
Financial feasibility was evaluated for a pilot setup producing 100 liters of Eco-Ink monthly:
Monthly Net Ink Profit = 1,20,000 BDT (Gross Sales) - 36,000 BDT (OpEx) = 84,000 BDT/month
Factoring in Eco-Brick sales and fresh water savings, total monthly net benefit reaches ~89,000 BDT.
4. Conclusions and Future Scope
4.1. Conclusions
This research developed and validated a new integrated eco-factory system specifically for textile small-medium enterprises. The major accomplishments of this work are listed as follows:
1. Air-to-Ink: 92.4% collection of flue soot for production of inkjet ink (viscosity: 3.18 cP).
2. Zero Discharge Water Loop: 91.1% COD removal using electro-coagulation process to reuse the wastewater 100%.
3. Solid Upcycling: Conversion of chemical waste into Eco-Bricks meeting ASTM requirements (14.2 MPa strength).
4. Energy and Profitability: Production of 950 Wh/day of electricity through Tri-hybrid system with payback of 7 months.
4.2. Future Scope
Future work will focus on implementing AI-driven machine learning algorithms for predictive electrode passivation management in the EC tank.
Funding
This research received no external funding.
Acknowledgments
The author would like to express his sincere appreciation for the provision of the laboratory equipment and chemicals needed for the prototype test, from the Department of Chemistry and Physics, Rajshahi Govt. City College. The author is thankful to all faculty members for their technical support during the experiment period.
Conflicts of Interest
The authors declare no conflict of interest.
Ethical Approval
Not applicable.
Informed Consent
Not applicable.
Data Availability
No datasets were generated or analyzed during the current study.
References
- Hassan, F.; Rahman, M. The Textile Industry in Bangladesh: Economic Growth vs. Environmental Sustainability; Journal of Developing Areas, 2023; vol. 54, no. 2, pp. 101–115. [Google Scholar]
- Ellen MacArthur Foundation. Towards the Circular Economy: Economic and Business Rationale for an Accelerated Transition. Technical Report, Cowes, UK; 2013. [Google Scholar]
- Begum, B. A.; Biswas, S. K.; Hopke, P. K. Air Pollution by Fine Particulate Matter in Bangladesh; Atmospheric Pollution Research, 2021; vol. 4, no. 1, pp. 75–86. [Google Scholar]
- Hoque, M. A. Groundwater depletion and its impact on the environment in Dhaka City; International Journal of Water Resources Development, 2022; vol. 38, no. 3, pp. 1–15. [Google Scholar]
- Islam, M. S.; Ahmed, M. K.; Habibullah-Al-Mamun, M. Heavy metal pollution in surface water and sediment of an urban river in a developing country; Ecological Indicators, 2020; vol. 48, pp. 282–291. [Google Scholar]
- Khan, S. R.; Islam, A. Operational failures of biological ETPs in the dyeing industry of Bangladesh; Journal of Environmental Chemical Engineering, 2022; vol. 9, no. 4, p. 105622. [Google Scholar]
- Geissdoerfer, M.; Savaget, P.; Bocken, N. M.; Hultink, E. J. The Circular Economy – A new sustainability paradigm? Journal of Cleaner Production, 2017; vol. 143, pp. 757–768. [Google Scholar]
- Hakizimana, J. N.; Gourich, B.; Vial, C. Electrocoagulation process in water treatment: A review of modeling approaches; Desalination, 2017; vol. 404, pp. 1–21. [Google Scholar]
- Cortez, L.; Costa, R.; Silva, P. Advances in cyclone separation technology for industrial applications; Powder Technology, 2021; vol. 385, pp. 120–134. [Google Scholar]
- Kobya, M.; Senturk, E.; Bayramoglu, M. Treatment of textile wastewaters by electrocoagulation using iron and aluminum electrodes; Journal of Hazardous Materials, 2003; vol. 100, no. 1-3, pp. 163–178. [Google Scholar]
- Singhal, S.; Pandey, S. From Waste to Wealth: A critical review on the utilization of industrial sludge in construction materials; Construction and Building Materials, 2021; vol. 270, p. 121473. [Google Scholar]
- US EPA. Method 1311: Toxicity Characteristic Leaching Procedure (TCLP), US Environmental Protection Agency, 2021.
- Sharma, R.; Kumar, S. M.; Reddy, N. R. Characterization of soot from diesel engine exhaust for ink application; Journal of Cleaner Production, 2019; vol. 212, pp. 45–55. [Google Scholar]
- Leach, R. The Printing Ink Manual, 5th ed.; Springer Science & Business Media, 2012. [Google Scholar]
- Jaziri, N.; Boughamoura, A.; Tounsi, F. A comprehensive review of Thermoelectric Generators: Technologies and applications; Energy Reports, 2020; vol. 6, pp. 264–287. [Google Scholar]
- Javed, F.; Ahmed, N.; Ali, S. IoT based Real-time Environmental Monitoring System for Industrial Effluents; IEEE Access, 2022; vol. 10, pp. 14200–14215. [Google Scholar]
- Department of Environment (DoE). Environmental Quality Standards (EQS) for Industrial Effluents, Ministry of Environment, Forest and Climate Change, 2023.
- ASTM International. ASTM C62-17: Standard Specification for Building Brick; 2017.
- Podder, S.; Ali, M. Techno-economic feasibility of hybrid solar-thermal energy harvesting in textile dyeing units; Renewable Energy, 2024; vol. 220, pp. 120–135. [Google Scholar]
- Kumar, A.; Singh, S. Recent advances in carbon capture from industrial exhaust for value-added ink production; Journal of Environmental Chemical Engineering, 2024; vol. 12, no. 1, p. 111823. [Google Scholar]
| Research Study | Focus Area | Critical Limitation | Novel Integrated Eco-Factory Advancement |
| Sharma et al. (2019) | Exhaust soot capture | Manual operation; no ink formulation | Automated cyclonic separator integrated with nano-milled polymer ink synthesis. |
| Rahman & Al-Muyeed (2022) | Biological ETP evaluation | High land footprint; bacterial death during pH shocks | Electrocoagulation (EC) unit achieving 91.1% color removal in 30 min. |
| Singhal & Pandey (2021) | Sludge incorporation in bricks | Disposal-oriented; ignored ROI and profit modeling | Upcycled Eco-Bricks (14.2 MPa strength) embedded in a 7-month ROI payback model. |
| Zuo et al. (2023) | TEG waste heat recovery | Low energy yield; insufficient for dynamic loads | Tri-Hybrid system (Solar + TEG + Hydro) delivering 950 Wh/day for continuous IoT monitoring. |
| Ingredient | Concentration (%) | Functional Role |
| Purified Carbon Soot | 20% | Primary Pigment (High Opacity) |
| Acrylic Resin / PVA | 30% | Polymeric Binder (Adhesion & Water Resistance) |
| Ethylene Glycol | 15% | Humectant (Anti-Clogging & Drying Control) |
| Distilled Water | 35% | Aqueous Carrier |
Disclaimer/Publisher’s Note: The statements, opinions and data contained in all publications are solely those of the individual author(s) and contributor(s) and not of MDPI and/or the editor(s). MDPI and/or the editor(s) disclaim responsibility for any injury to people or property resulting from any ideas, methods, instructions or products referred to in the content. |
© 2026 by the author. Licensee MDPI, Basel, Switzerland. This article is an open access article distributed under the terms and conditions of the Creative Commons Attribution (CC BY) license.
Copyright: This open access article is published under a Creative Commons CC BY 4.0 license, which permit the free download, distribution, and reuse, provided that the author and preprint are cited in any reuse.