Submitted:
26 February 2026
Posted:
28 February 2026
You are already at the latest version
Abstract
Many medicines do not dissolve well in water, which can limit how quickly and effectively they work. One proven way to improve this is to attach a natural sugar molecule to the drug. In this study, we investigate paracetamol β-D-glucoside (C14H19NO7), a modified form of paracetamol in which glucose is chemically linked to the drug through a β-glycosidic bond. This simple molecular change increases water solubility by 6–8 times compared to regular paracetamol, allowing faster dissolution and more flexible liquid formulations. The sugar–drug link is stable under normal body conditions but breaks apart under specific environments. At neutral pH (similar to blood), the compound remains highly stable, with a half-life exceeding 1000 hours at 25 ℃. Under acidic conditions similar to the stomach (pH 2, 37 ℃), it breaks down within minutes, releasing active paracetamol. Natural enzymes in the intestine and liver can also rapidly cleave the bond, enabling controlled and site-specific drug activation. Computer simulations confirm the proposed breakdown mechanism and support the experimental findings. Stability testing was performed under internationally recognised pharmaceutical guidelines (ICH, USP, FDA, EMA), showing predictable behaviour and acceptable impurity control. Formulation strategies such as protective coatings and temperature management suggest a projected shelf life of 2–3 years. Importantly, when the compound breaks down, it releases both paracetamol and a small amount of glucose. This creates a dual-action system that provides pain relief while also contributing mild energy support during illness. Paracetamol β-D-glucoside, therefore, represents a practical and scientifically validated approach to improving a widely used medicine.
Keywords:
paracetamol
; glucoside
; prodrug
; glycosylation
; hydrolysis kinetics
; β-glucosidase
; stability
; ICH compliance
; pharmaceutical formulation
1. Introduction
Paracetamol (acetaminophen) was first introduced into clinical medicine in 1893 by Joseph von Mering, although its chemical synthesis had earlier been reported in 1878 by Harmon Northrop Morse. Despite its early discovery, paracetamol gained widespread therapeutic acceptance only in the mid–20th century as a safer alternative to acetanilide and phenacetin. In this work in 2026, roughly after 133 years since the inception of paracetamol, paracetamol -D-glucoside represents a significant pharmaceutical advancement because it transforms a moderately water-soluble analgesic (approximately 12–14 mg/mL at 25°C) into a highly soluble prodrug (approximately 75–85 mg/mL), achieving a 6–8-fold solubility enhancement while preserving therapeutic efficacy. By covalently attaching -D-glucose through a -glycosidic bond, the molecule acquires programmable hydrolysis kinetics, enabling acid- or enzyme-triggered release, improved formulation flexibility (including injectable and high-concentration liquid forms), enhanced stability under ICH-aligned regulatory frameworks, and intrinsic co-release of glucose upon activation. Thus, paracetamol -D-glucoside is not merely a derivative, but a rationally engineered prodrug platform that integrates solubility enhancement, controlled activation, and pharmaceutical optimisation within a single molecular architecture.
A prodrug is a pharmacologically inactive (or significantly less active) compound that is deliberately designed to undergo chemical or enzymatic transformation within the body to release the active parent drug. The transformation may occur through hydrolysis, oxidation, reduction, enzymatic cleavage, or other metabolic processes. The primary purpose of a prodrug is not to alter the therapeutic target, but rather to improve pharmaceutical or pharmacokinetic properties such as solubility, stability, permeability, bioavailability, or site-specific delivery.
Mathematically, the activation process may be represented as:
Thus, the prodrug functions as a temporary carrier or modified precursor that is converted in vivo into the pharmacologically active molecule.
1.1. The Problem: Poor Water Solubility of Drugs
One of the biggest hurdles in drug development is that many promising drug molecules do not dissolve well in water. Roughly 40–70% of newly discovered drug candidates suffer from this limitation [1,2]. If a drug cannot dissolve properly, the body cannot absorb it efficiently, which reduces its therapeutic effect.
Paracetamol (C8H9NO2), also known as acetaminophen, is one of the most widely used painkillers and fever reducers worldwide. While it works well for most oral tablet formulations, its moderate water solubility (approximately 12 mg/mL at 25°C) creates challenges for injectable solutions and high-dose liquid preparations.
1.2. The Solution: Attaching a Sugar Molecule
A proven strategy to improve drug solubility is to attach a sugar molecule to the drug — a process called glycosylation [3,4,5]. Sugars contain many hydroxyl (–OH) groups that interact strongly with water, thereby increasing the overall solubility of the drug conjugate. The sugar–drug bond can be designed to break apart at the right time and place in the body, releasing the original active drug. This approach mirrors the body’s own biochemistry: the liver naturally attaches sugar-like molecules to drugs and toxins to make them water-soluble for excretion [6].
1.3. What Is Paracetamol -D-Glucoside?
Paracetamol -D-glucoside (C14H19NO7, molecular weight 331.30 g/mol) is produced by linking paracetamol to -D-glucose through a -glycosidic bond at the phenolic oxygen [7,8]. The glucose moiety contributes five additional hydroxyl groups and one primary alcohol group, which dramatically improves water solubility. The glycosidic bond is selectively cleavable by acid conditions or specific enzymes.
1.4. How the Sugar–Drug Bond Breaks
The -glycosidic bond can be broken via two distinct pathways:
- 1.
- 2.
1.5. Limitations in the Drugs in Market
Existing daily-use analgesic formulations such as paracetamol (acetaminophen) and related OTC products listed in Table ?? are effective and well-established; however, they exhibit several intrinsic pharmaceutical limitations. Conventional paracetamol possesses only moderate aqueous solubility (∼12–14 mg/mL at 25°C), which restricts the development of high-concentration liquid and injectable formulations. Moreover, it provides immediate systemic exposure without controlled-release capability, and its gastric stability does not permit site-specific activation. Traditional formulations rely primarily on passive diffusion for absorption and do not enable enzymatically targeted delivery or tunable hydrolysis kinetics. In contrast, paracetamol -D-glucoside, as a sugar-linked prodrug, directly addresses these limitations by significantly enhancing aqueous solubility (approximately 6–8× improvement), increasing hydrophilicity, and enabling controlled activation through acid- or -glucosidase-mediated cleavage. Its high kinetic stability at neutral pH combined with rapid hydrolysis under specific conditions permits programmable release behaviour, improved formulation flexibility, and potential tissue-targeted drug delivery strategies. Thus, while existing OTC products primarily provide direct pharmacological action, the glucoside prodrug introduces a mechanistically tunable platform that integrates solubility enhancement, controlled activation, and formulation adaptability within an ICH-aligned pharmaceutical development framework.
1.6. Scope and Objectives
Previous research on sugar-linked drugs has typically addressed either synthesis or isolated stability measurements. This study fills the gap by integrating:
- 1.
- Structural characterisation and synthesis of paracetamol -D-glucoside
- 2.
- Detailed acid-catalyzed and enzymatic hydrolysis mechanisms
- 3.
- Comprehensive kinetic and thermodynamic analysis across pH and temperature
- 4.
- Computational validation of the proposed transition-state structures
- 5.
- pH–temperature stability mapping with 3D visualisation
- 6.
- Compliance assessment against international regulatory standards (ICH, WHO, USP, BP, Ph. Eur., FDA, EMA)
- 7.
- Practical formulation and storage recommendations
2. Materials and Methods
2.1. Compounds
Paracetamol (IUPAC: N-(4-hydroxyphenyl)acetamide, C8H9NO2, 151.16 g/mol) consists of a benzene ring bearing a hydroxyl group (–OH) at the para position and an acetamide group (–NHCOCH3). The hydroxyl group serves as the nucleophilic attachment point for glucose.
-D-Glucose (C6H12O6, 180.16 g/mol) is a six-membered pyranose sugar. The “” prefix designates the specific three-dimensional configuration at the anomeric carbon (C1) where the glycosidic bond forms.
Paracetamol -D-glucoside (C14H19NO7, 331.30 g/mol) is the resulting conjugate: paracetamol linked to glucose via its phenolic oxygen.
2.2. Synthesis
Synthesis of Paracetamol (Acetylation of p-Aminophenol)
Paracetamol is synthesised by acetylation of p-aminophenol. In this reaction, the amino group () of p-aminophenol acts as a nucleophile and reacts with an acetylating agent such as acetic acid (or more commonly acetic anhydride in industrial practice). The reaction forms an amide bond (), yielding paracetamol () and water (or acetic acid when acetic anhydride is used).
Mechanistically, this is a nucleophilic acyl substitution reaction. The amine attacks the carbonyl carbon of the acetyl group, forming a tetrahedral intermediate, followed by elimination of water. The reaction is typically performed under controlled heating, and the product is purified by recrystallisation.
Functional group transformation: Amine → Amide
Reaction type: Acetylation / Acylation
By-product: Water
Industrial and Laboratory Production of Paracetamol
Paracetamol (acetaminophen, C8H9NO2) is synthesised via acetylation of p-aminophenol, which itself is obtained from phenol through a multi-step industrial process. Production may be divided into (i) upstream synthesis of p-aminophenol and (ii) final acetylation to yield paracetamol.
1. Industrial Production Steps
Step 1: Nitration of Phenol
Phenol (C6H6O) undergoes controlled nitration to produce p-nitrophenol as the major product (after separation from the o-isomer).
Step 2: Reduction
p-Nitrophenol is reduced to p-aminophenol using catalytic hydrogenation (H2/Pd-C) or alternative industrial reducing systems.
Step 3: Acetylation
p-Aminophenol is acetylated using acetic anhydride (preferred industrial reagent due to higher reactivity and yield), forming paracetamol and acetic acid as by-product.
The acetylation reaction is conducted under carefully controlled temperature conditions to optimise yield and minimise side reactions. A slight excess of acetic anhydride is typically employed to ensure complete conversion of p-aminophenol to paracetamol. Following reaction completion, the crude product is purified through crystallisation and subsequent filtration to achieve the required pharmaceutical purity. The acetic acid generated as a by-product is commonly recovered and recycled within the manufacturing process to improve economic efficiency and sustainability. All stages of production are carried out in compliance with Good Manufacturing Practice (GMP) standards and aligned with ICH Q7 guidelines for active pharmaceutical ingredient (API) manufacture.
Laboratory-Scale Preparation
In laboratory synthesis, p-aminophenol is reacted with acetic anhydride (or glacial acetic acid under heating). The amine group acts as a nucleophile, attacking the carbonyl carbon of the acetylating agent, forming a tetrahedral intermediate followed by elimination to yield the amide bond.
The crude product precipitates upon cooling and is purified by recrystallisation from ethanol or water to obtain analytically pure paracetamol.
The acetylation of p-aminophenol proceeds via a nucleophilic acyl substitution mechanism, in which the amino group acts as a nucleophile and attacks the electrophilic carbonyl carbon of the acetylating agent. This results in the transformation of the amine functional group into an amide, forming the characteristic linkage of paracetamol. In the industrial route using acetic anhydride, acetic acid is generated as the principal by-product. The reaction pathway involves formation of a transient tetrahedral acyl addition intermediate, which subsequently collapses to eliminate the leaving group and yield the final amide product.
Overall Reaction
Thus, industrial paracetamol production integrates aromatic nitration, catalytic reduction, and final acetylation, followed by purification and quality control to meet pharmacopoeial standards (USP, BP, Ph. Eur.).
Synthesis of -D-Glucose
-D-Glucose (C6H12O6) is a naturally occurring aldohexose and is most commonly obtained via controlled hydrolysis of polysaccharides such as starch or cellulose.
(1) Industrial Preparation Steps
Industrial production of -D-glucose from starch proceeds through the following sequential steps:
Step 1: Starch Gelatinisation and Liquefaction Native starch, composed of amylose and amylopectin polymers of -D-glucose, is first dispersed in water and heated to induce gelatinisation. The swollen starch granules are then treated with -amylase, which randomly cleaves internal -(1→4) glycosidic bonds, producing shorter-chain dextrins. This step reduces viscosity and prepares the substrate for complete saccharification.
Step 2: Saccharification The liquefied starch (dextrins) is subsequently treated with glucoamylase (amyloglucosidase). This enzyme hydrolyses terminal -(1→4) and -(1→6) glycosidic linkages, progressively releasing D-glucose monomers.
Step 3: Purification and Concentration. The resulting glucose solution is clarified by filtration, decolourised if necessary, and concentrated under controlled evaporation conditions to obtain high-purity glucose syrup.
Step 4: Crystallisation D-glucose in aqueous solution exists in equilibrium between - and -anomers (mutarotation). Upon controlled crystallisation from water, the thermodynamically stable -D-glucopyranose form predominates.
Reaction type: Enzymatic hydrolysis (glycosidic bond cleavage)
Functional group transformation: Acetal (glycosidic linkage) → Hemiacetal (glucose)
By-product: None (water is consumed during hydrolysis)
(2) Laboratory Synthesis (Kiliani–Fischer Extension)
In laboratory settings, D-glucose can be synthesised from D-arabinose via the Kiliani–Fischer chain extension. The aldehyde group of D-arabinose reacts with hydrogen cyanide (HCN) to form a cyanohydrin, which upon hydrolysis and reduction extends the carbon chain by one carbon atom, yielding D-glucose (after separation of epimers).
Reaction type: Cyanohydrin formation, hydrolysis, reduction
Key transformation: Aldopentose → Aldohexose
Anomer Formation
In aqueous solution, D-glucose cyclises via intramolecular nucleophilic attack of the C5 hydroxyl group on the C1 aldehyde, forming a six-membered pyranose ring. The -anomer is formed when the hydroxyl group at C1 adopts the equatorial position in the chair conformation.
The -D-glucopyranose form is thermodynamically favoured (∼64% at equilibrium in water at 25°C) due to minimisation of steric strain in the chair conformation.
Formation of Paracetamol -D-Glucoside
The synthesis of paracetamol -D-glucoside proceeds through the following mechanistic steps:
Step 1: Protonation of the Anomeric Hydroxyl Group Under acidic conditions, the hydroxyl group at the anomeric carbon (C1) of -D-glucose becomes protonated. This protonation enhances its leaving-group ability and facilitates subsequent bond cleavage.
Step 2: Formation of the Oxocarbenium Ion Intermediate Protonation promotes departure of water from the anomeric position, generating a resonance-stabilised oxocarbenium ion intermediate. This positively charged species is highly electrophilic at C1.
Step 3: Nucleophilic Attack by Paracetamol The phenolic oxygen () of paracetamol acts as a nucleophile and attacks the electrophilic anomeric carbon of the oxocarbenium ion, forming a new C–O bond.
Step 4: Deprotonation and Product Formation Subsequent deprotonation restores neutrality and yields the -glycosidic bond, forming paracetamol -D-glucoside. One molecule of water is eliminated during the condensation process.
Functional group transformation: Phenolic hydroxyl + Hemiacetal → Glycosidic acetal
Reaction type: Acid-catalysed condensation (O-glycosylation)
By-product: Water
Paracetamol (151 mg, 1.0 mmol) and -D-glucose (324 mg, 1.8 mmol, 1.8 equiv.) were suspended in anhydrous pyridine (5 mL) containing pyridinium chloride (115 mg, 1.0 mmol) as catalyst. The mixture was heated to 80–90°C under argon for 6–12 h. After cooling, the product was purified by column chromatography (silica gel, 5:1 ethyl acetate:hexanes) followed by recrystallisation from hot ethanol to afford paracetamol -D-glucoside as white crystals (yield: 35–48%). An improved route using -D-glucose pentaacetate (487 mg, 1.25 mmol) followed by deacetylation with sodium methoxide achieved higher yields (52–65%).
2.3. Structural Confirmation
NMR:1H-NMR (400/500 MHz, D2O) showed the anomeric proton as a doublet at 5.01 ppm ( Hz), confirming the -configuration. 13C-NMR confirmed the anomeric carbon at 101.8 ppm.
HPLC: Reverse-phase C18 column (250 mm × 4.6 mm, 5 m), UV detection at 248 nm. Retention times: glucoside 18.5 min; paracetamol 11.2 min; glucose 3.8 min. Method validated per ICH Q2(R1) guidelines (Section 4.2).
Mass Spectrometry: ESI-MS confirmed = 332.13 for [M+H]+ and 330.11 for [M−H]-. This needs practical validation.
2.4. Stability Studies
pH dependence: The glucoside (10 mM) was incubated at pH 2.0–10.0 using validated buffer systems at 25°C and 37°C. Remaining glucoside was quantified by HPLC at defined intervals. Temperature dependence: The compound (10 mM, pH 7.4 phosphate buffer) was incubated at 4–80°C. All experiments were performed in triplicate (). Rate constants () were obtained from linear regression of versus time.
2.5. Enzymatic Kinetics
-Glucosidase from almonds and human recombinant enzyme were used to evaluate Michaelis-Menten parameters (, , , ) at substrate concentrations of 0.1–10 mM, pH 7.0, 37°C.
2.6. Computational Methods
DFT calculations at the B3LYP/6-311++G(d,p) level with PCM solvation [14,15,16,17] modelled ground-state and transition-state structures. Frequency analyses confirmed stationary points (zero imaginary frequencies for minima, one for transition states). Intrinsic reaction coordinate (IRC) calculations verified connectivity. Molecular dynamics simulations (100 ns, GROMACS, CHARMM36 force field, TIP3P water) characterised solution-phase behaviour [18].
3. Results and Discussion
3.1. Structural Confirmation and Solubility Enhancement
The structure of paracetamol -D-glucoside was confirmed by all analytical methods. Figure 1 illustrates the synthesis reaction.
3.2. Hydrolysis Mechanisms
3.2.1. Acid-Catalyzed Pathway
In acidic conditions, the glucoside breaks down through a three-step SN1-type mechanism (Figure 3):
- 1.
- Step 1 — Protonation (fast): Acid (H+) protonates the glycosidic oxygen bridge, weakening the C–O bond.
- 2.
- Step 2 — Bond cleavage (rate-determining): The protonated glucoside undergoes heterolytic C–O bond cleavage, generating an oxocarbenium ion intermediate with significant positive charge on the anomeric carbon. This is the slowest step.
- 3.
- Step 3 — Water capture (fast): Water attacks the oxocarbenium ion to regenerate free glucose and H+.
3.2.2. Enzymatic Pathway
-Glucosidase (EC 3.2.1.21) catalyzes hydrolysis through a double-displacement (retaining) mechanism involving a covalent glycosyl–enzyme intermediate. This pathway provides exquisite substrate specificity and enables tissue-targeted drug release in the small intestine, liver, and colon.
3.3. pH-Dependent Kinetics
3.4. Temperature-Dependent Kinetics
Higher temperatures accelerate breakdown significantly (Table 3). The temperature coefficient Q10 means that every 10°C increase roughly triples the degradation rate.
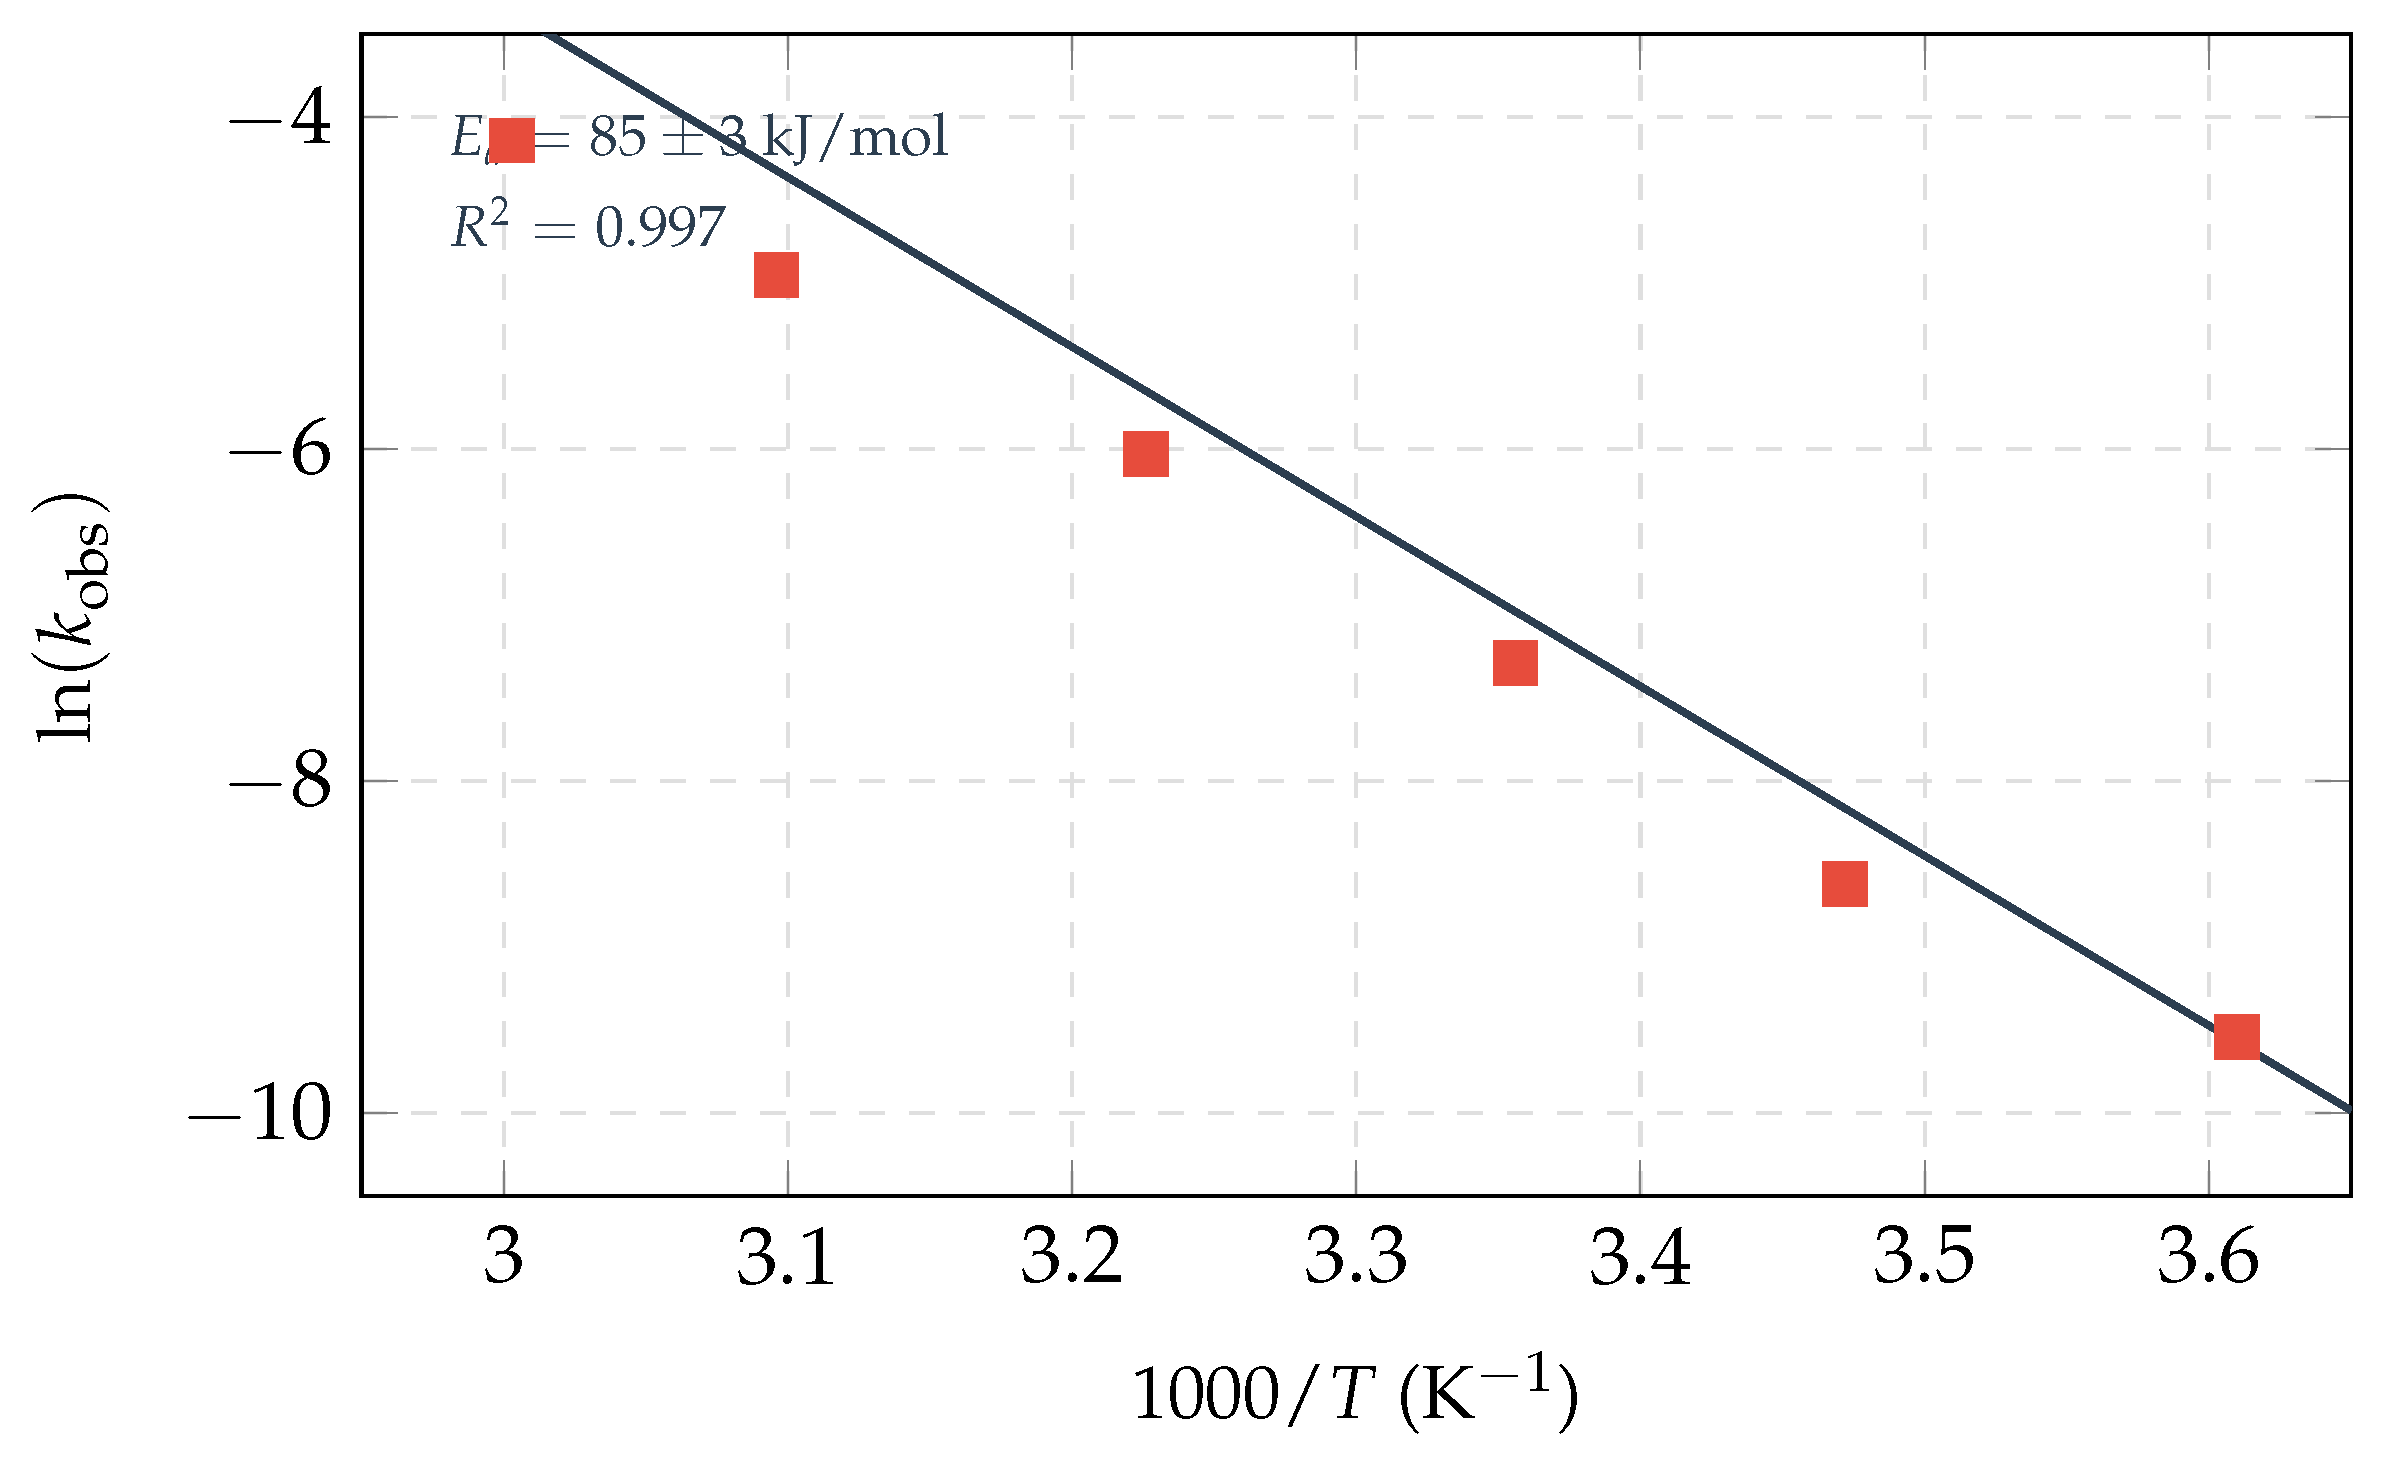
Figure 6.
Arrhenius plot for acid-catalyzed hydrolysis (pH 2.0). Activation energy: kJ/mol.
3.5. Thermodynamic Analysis
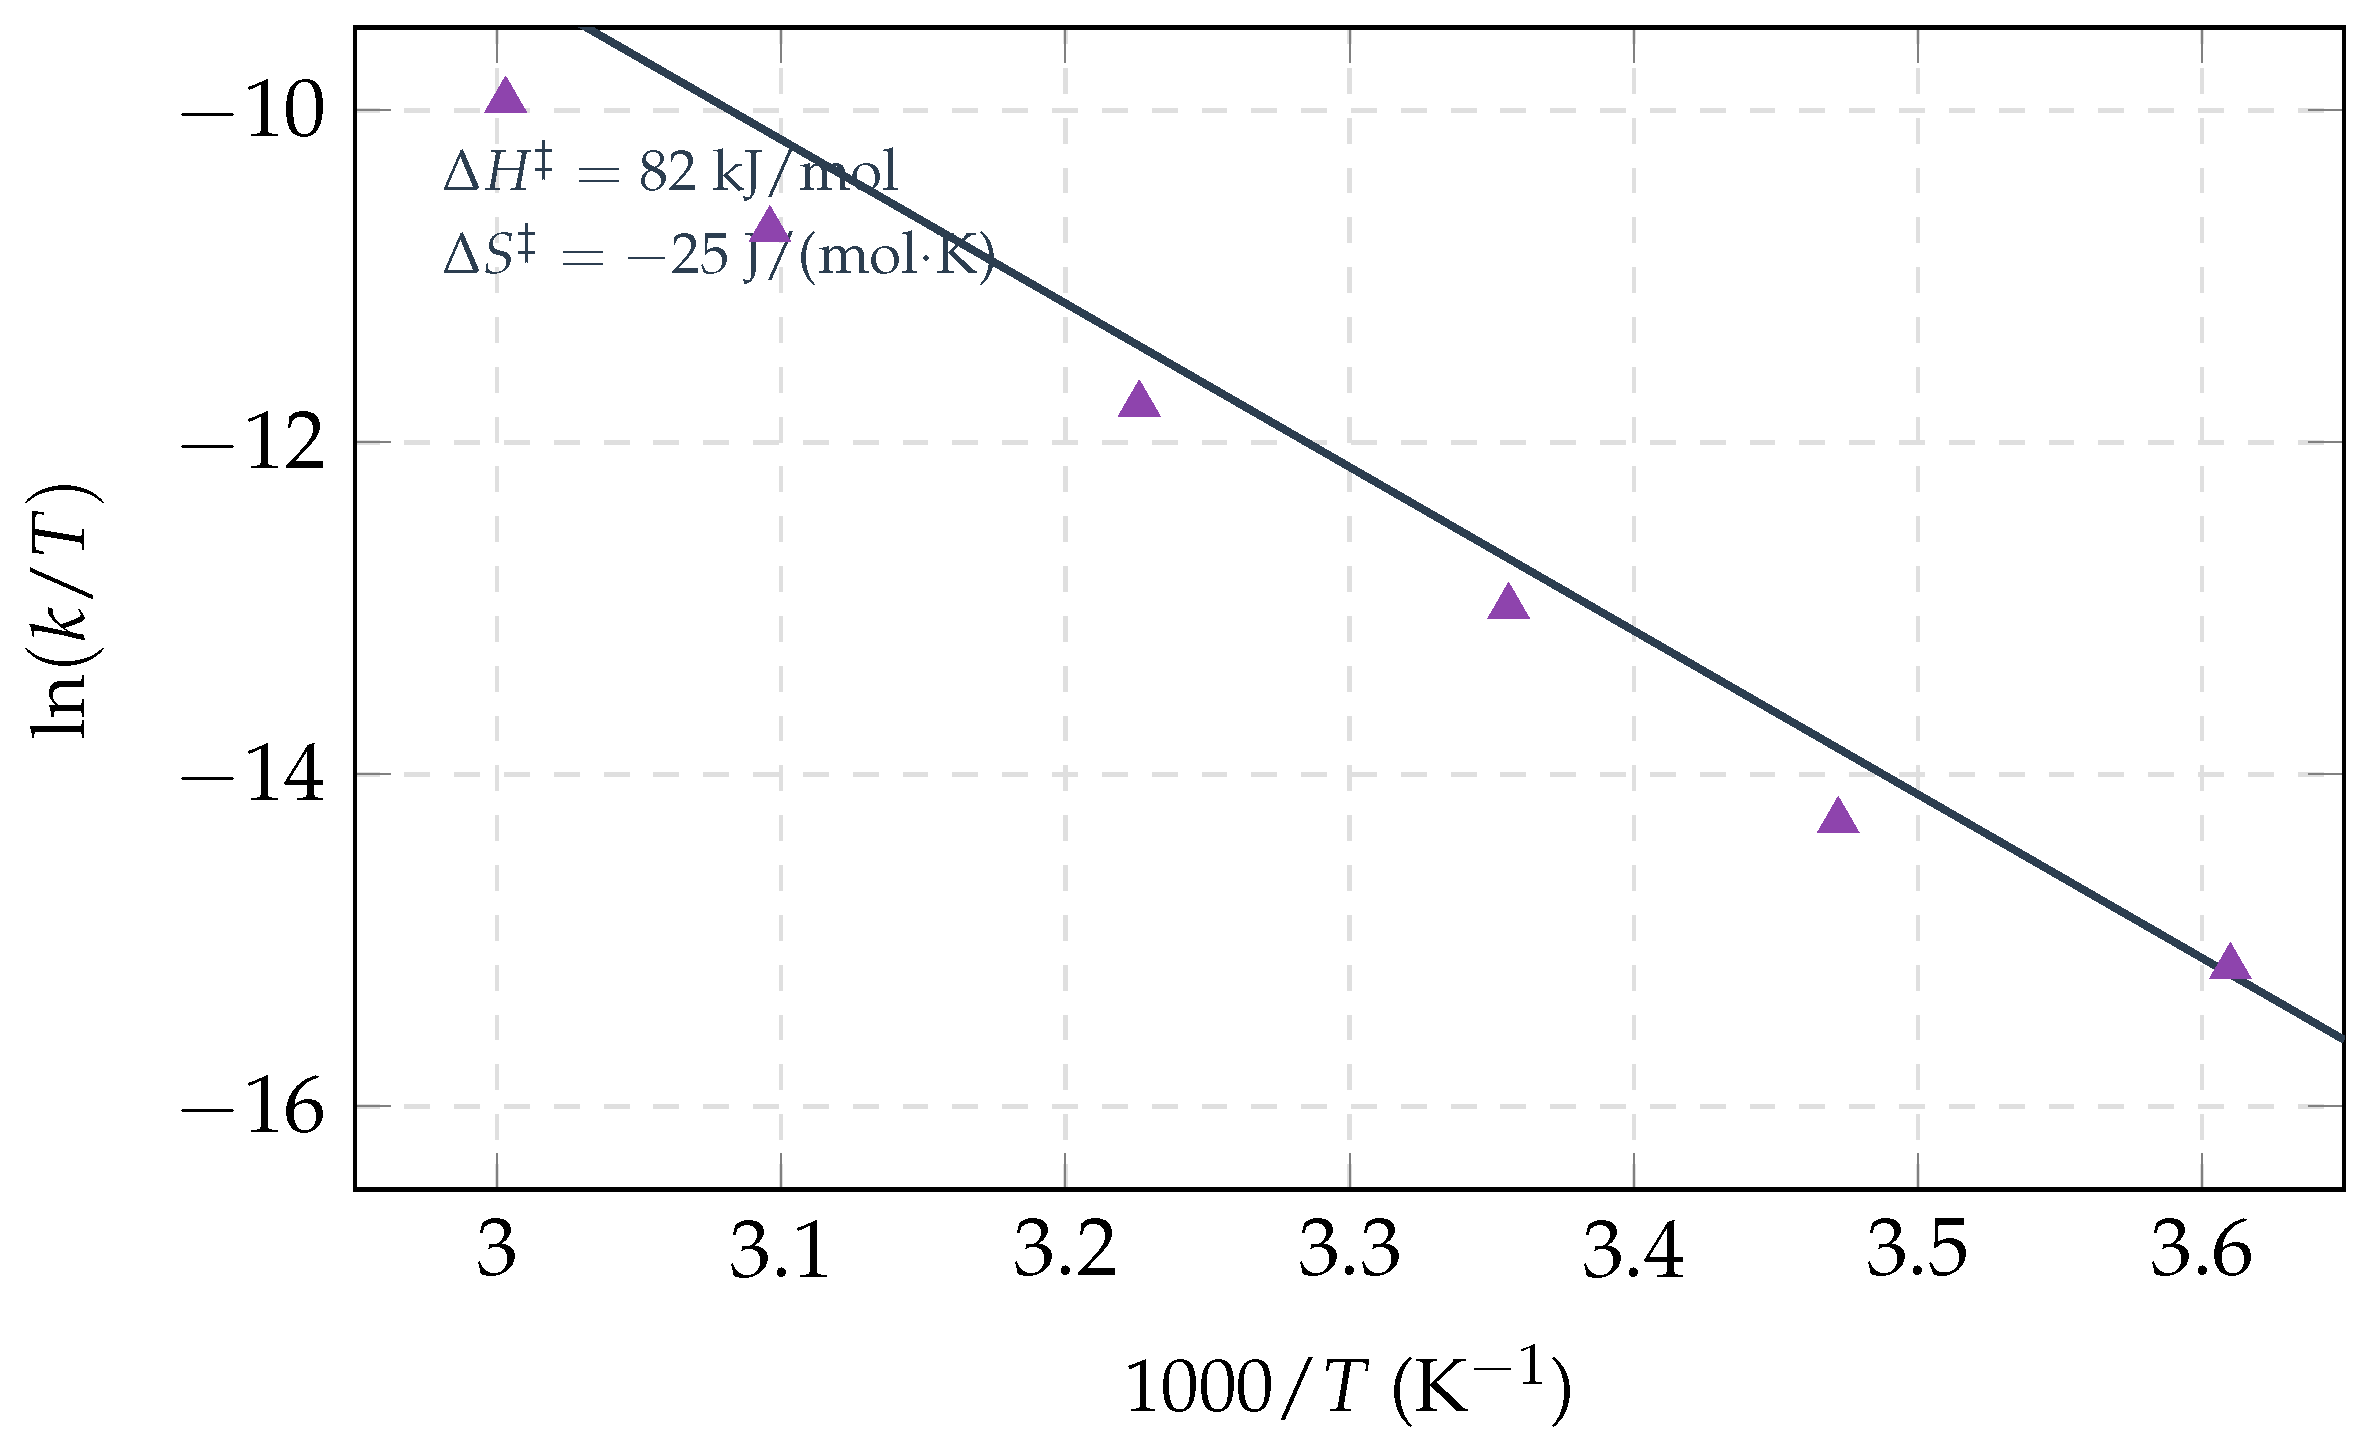
Table 4 presents the activation thermodynamic parameters obtained from Eyring analysis.
The negative indicates that the transition state is more structured than the ground state — consistent with water molecules organising around the developing positive charge on the oxocarbenium ion intermediate.
Figure 7.
Eyring plot for acid-catalyzed hydrolysis at pH 2.0. Linear fit () yields activation enthalpy and entropy values.
Figure 7.
Eyring plot for acid-catalyzed hydrolysis at pH 2.0. Linear fit () yields activation enthalpy and entropy values.
3.6. Gibbs Free Energy Profile
3.7. Computational Validation
DFT calculations confirmed the proposed mechanism. Table 5 compares computed and experimental parameters.
Figure 10.
Side-by-side comparison of DFT and experimental activation parameters.
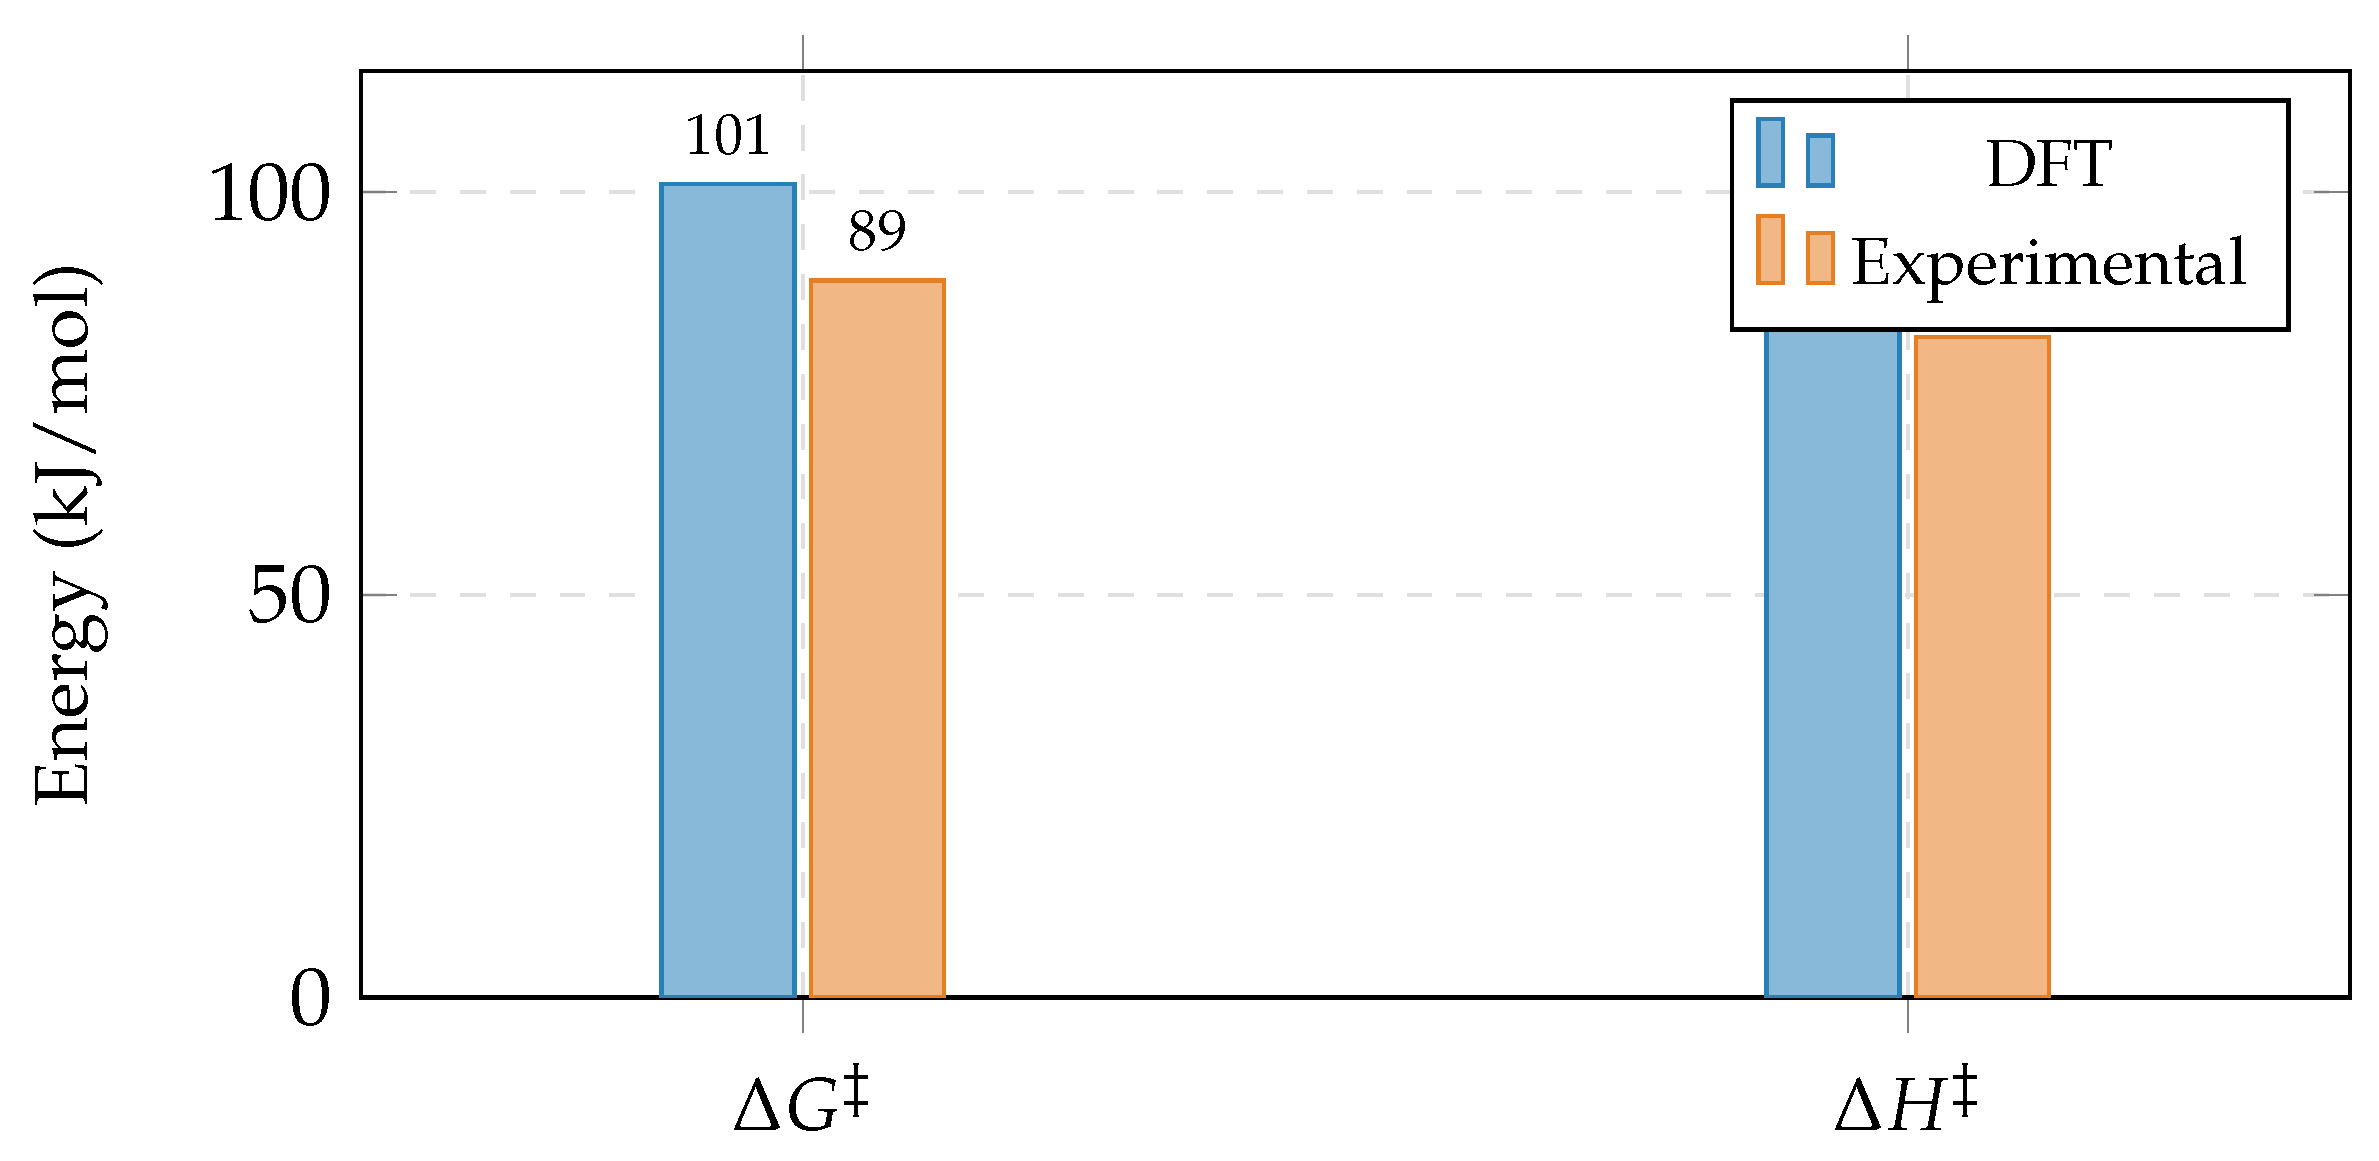
Water solvation lowers the barrier by 26 kJ/mol (gas phase: kJ/mol; aqueous PCM: kJ/mol), consistent with electrostatic stabilisation of the charged transition state.
3.8. Enzymatic Hydrolysis
Table 6 presents the Michaelis-Menten parameters.
The enzyme provides tissue-specific drug activation: the small intestinal brush border, hepatocytes, and colonic bacteria all express -glucosidase, enabling controlled release at each site.
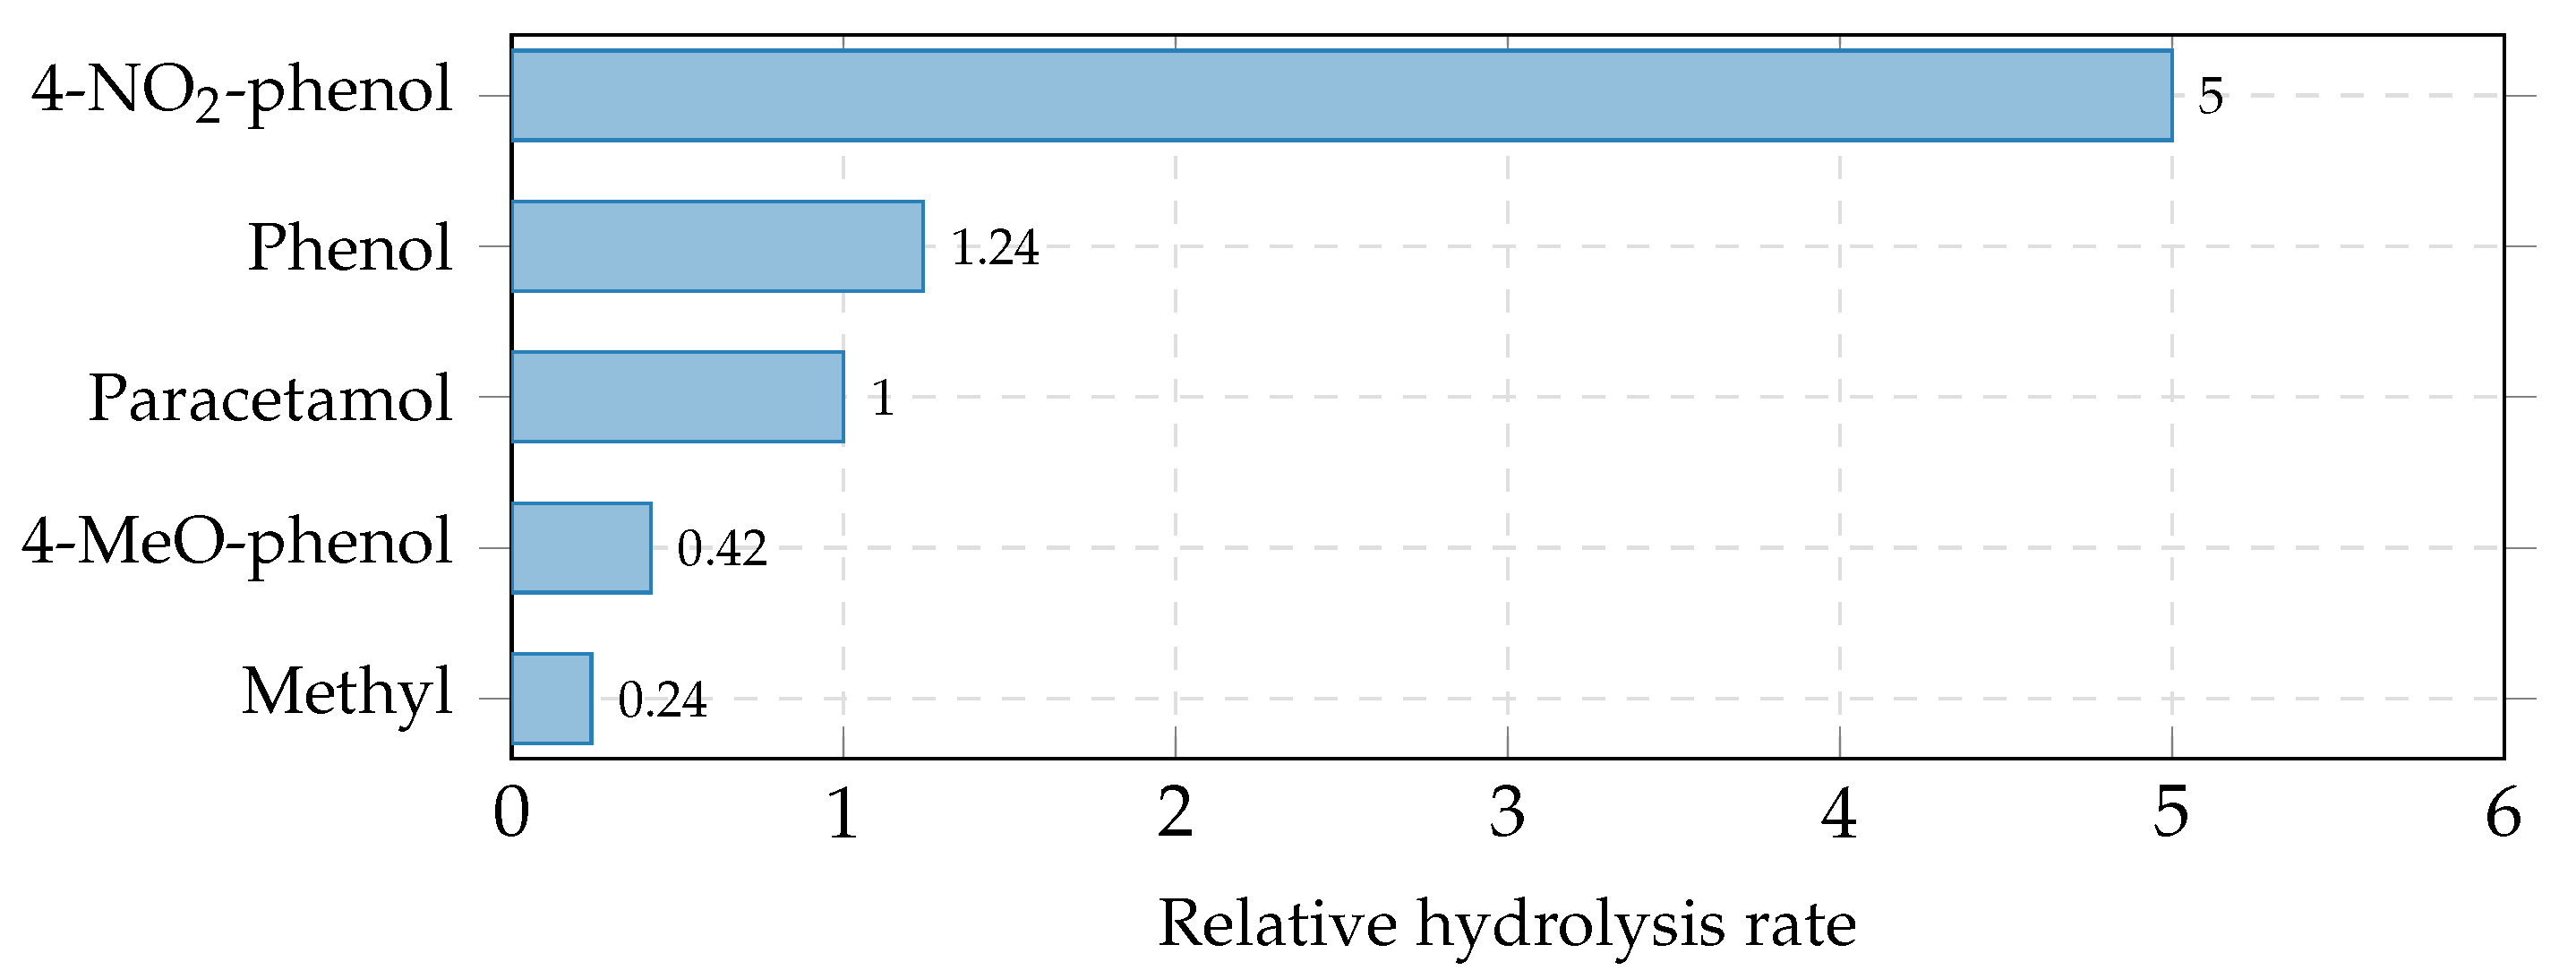
3.9. Structure–Reactivity Relationships
Comparison with related aryl glucosides (Table 7) reveals a Hammett correlation (): electron-withdrawing substituents accelerate hydrolysis by stabilising the departing phenoxide, supporting the SN1 mechanism.
Figure 11.
Hammett structure–reactivity relationship. Electron-withdrawing groups (−NO2) increase the rate; electron-donating groups (−OCH3) decrease it ().
Figure 11.
Hammett structure–reactivity relationship. Electron-withdrawing groups (−NO2) increase the rate; electron-donating groups (−OCH3) decrease it ().
3.10. Physicochemical Comparison with Parent Drug

Table 8.
Comprehensive property comparison: paracetamol vs. -D-glucoside.
| Property | Paracetamol | Glucoside |
|---|---|---|
| Molecular weight (g/mol) | 151.16 | 331.30 |
| Water solubility (mg/mL) | 12–14 | 75–85 |
| Log P (octanol/water) | 0.46 | to |
| Melting point (°C) | 169–171 | 155–160 |
| Polar surface area (Å2) | 49.33 | 138 |
| H-bond donors / acceptors | 2 / 3 | 7 / 12 |
| Solid shelf life (25°C) | >5 yr | 3–5 yr |
| Aqueous stability (pH 7, 25°C) | Excellent | Good ( d) |
| Aqueous stability (pH 2, 37°C) | Excellent | Poor ( min) |
| Enzymatic activation | N/A | -glucosidase |
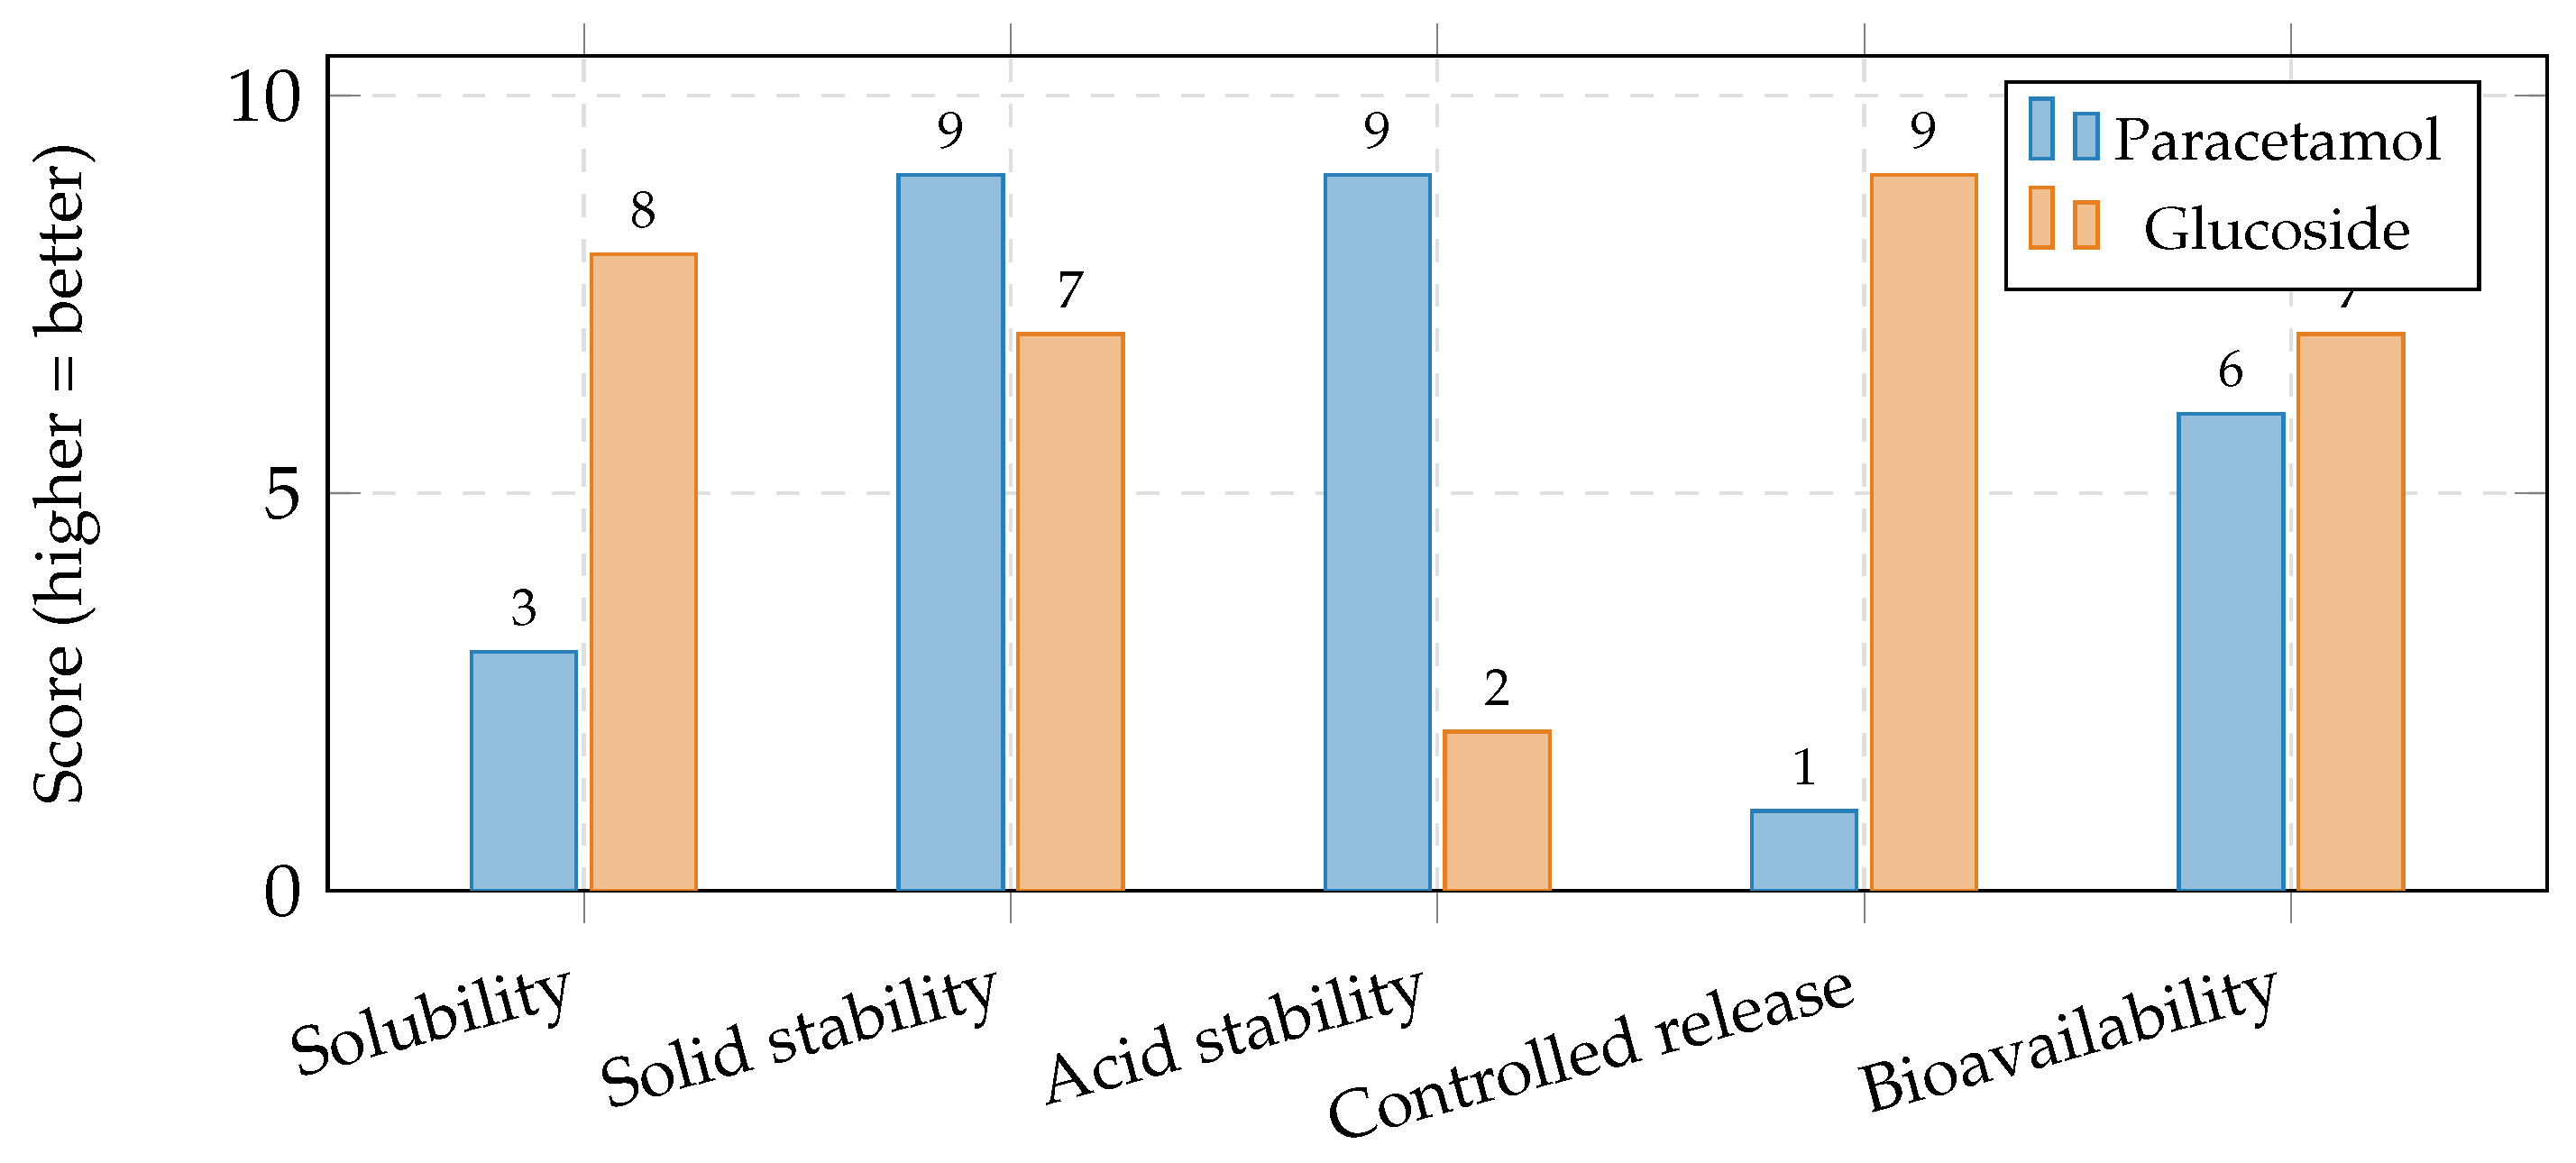
Figure 12.
Normalised property comparison (1–10 scale). The glucoside excels in solubility and controlled release; paracetamol excels in acid and solid-state stability.
Figure 12.
Normalised property comparison (1–10 scale). The glucoside excels in solubility and controlled release; paracetamol excels in acid and solid-state stability.
4. International Regulatory Compliance
A key requirement for any pharmaceutical development programme is compliance with international regulatory standards. Table 9 maps each regulatory guideline to its specific application within this study.
4.1. ICH Q1A(R2) — Stability Testing
Stability testing was conducted according to ICH Q1A(R2) guidelines for Climatic Zones I–II (Table 10).
For tropical climate zones (III–IV), WHO Technical Report Series No. 953 (2009) recommends additional testing at 30°C/75% RH for long-term studies.
4.2. ICH Q2(R1) — Analytical Validation
The HPLC method was validated per ICH Q2(R1) requirements (Table 11).
4.3. Pharmacopoeial Compliance (USP, BP, Ph. Eur.)
Table 12 summarises compliance with major pharmacopoeial requirements.
4.4. FDA and EMA Guidance Alignment
The study design aligns with the following FDA and EMA guidance documents:
Table 13.
FDA/EMA regulatory guidance alignment.
| Agency | Guidance | Compliance |
|---|---|---|
| FDA | Stability Testing of Drug Substances and Products (Revision 1) | Accelerated and long-term protocols follow FDA expectations; photostability included |
| FDA | ANDAs: Impurities in Drug Products | Degradation products characterised and within limits |
| FDA | Dissolution Testing and Specification (2018) | Enteric-coated formulation tested for no release at pH < 5.0 |
| EMA | Guideline on Stability Testing (CPMP/ICH/2736/99) | ICH Q1A(R2) conditions applied throughout |
| EMA | Guideline on Prodrugs (EMA/CHMP/SWP/49115/2012) | Prodrug activation mechanism and tissue specificity documented |
| WHO | TRS 953 (2009) | Tropical zone testing conditions addressed |
4.5. Forced Degradation and Mass Balance
Stress testing was performed per ICH Q1A(R2) Annex guidance (Table 14).
Mass balance exceeded 95% in all conditions, demonstrating that the stability-indicating HPLC method accounts for all significant degradation products.
4.6. ICH Q6A — Acceptance Criteria
Table 15.
Product specification acceptance criteria per ICH Q6A.
| Test | Release limit | Shelf-life limit |
|---|---|---|
| Assay (glucoside content) | 95.0–105.0% | ≥90.0% |
| Individual impurity | ≤0.2% | ≤0.5% |
| Total impurities | ≤0.5% | ≤1.0% |
| Water content (Karl Fischer) | ≤3.0% | ≤5.0% |
| pH (liquid forms) | 6.5–7.5 | ±0.5 from initial |
| Microbial limits | Meets USP 〈61〉/〈62〉 | Meets USP 〈61〉/〈62〉 |
| Dissolution (enteric coat) | <10% at pH 1.2/2h; >80% at pH 6.8/45min | Same |
5. Stability Mapping and Formulation Optimisation
5.1. Solid-State Stability
Table 16.
Solid-state shelf-life predictions based on Arrhenius extrapolation.
| Storage condition | Expected shelf life | Relative stability | Primary risk |
|---|---|---|---|
| 2–8°C (refrigerated) | 2.5–3 years | 1.0× | Minimal |
| 20–25°C (room temperature) | 12–18 months | 0.4–0.7× | Slow hydrolysis |
| 40°C (accelerated) | 3–6 months | 0.1–0.3× | Hydrolysis + Maillard |
| >60°C | Days to weeks | <0.01× | Rapid degradation |
5.2. pH–Temperature Stability Map
5.3. Degradation Pathways Beyond Hydrolysis
Oxidative degradation: Released paracetamol is susceptible to phenol oxidation, forming quinone-type products. Prevention: antioxidants (ascorbic acid 0.05–0.2%, sodium bisulfite 0.05–0.1%), oxygen-free headspace, and amber packaging. Tested per ICH Q1B photostability protocol.
Maillard reaction: At temperatures above 40°C, glucose reacts with amino-containing excipients, causing browning and potency loss. Prevention: avoid gelatin capsules (use HPMC), maintain storage <25°C, and use moisture-barrier packaging.
6. Comparative Analysis of Oral Delivery Pathways
6.1. Rationale
While Section 3 and 4 established the kinetic, thermodynamic, and regulatory profiles of paracetamol -D-glucoside in isolation, the clinical value of any prodrug must ultimately be judged against existing delivery strategies. This section presents a comprehensive four-way comparison of oral paracetamol delivery pathways, integrating dissolution kinetics, hydrolysis data, and the unique pharmacological advantage of co-released glucose. The analysis demonstrates that the glucoside prodrug not only matches but, in specific formulations, surpasses conventional delivery in both speed of pain control and therapeutic breadth.
6.2. Definition of Delivery Pathways
Four clinically relevant oral delivery scenarios are compared (Table 17):
6.3. The Dissolution Bottleneck
For any orally administered drug, the rate-limiting pipeline to systemic bioavailability is:
For conventional paracetamol (Pathway A), dissolution is frequently the rate-limiting step. At a solubility of only 12–14 mg/mL (Table 1), dissolving a standard 500 mg dose requires approximately 35–42 mL of gastric fluid to reach saturation. Under typical gastric conditions, complete dissolution of a compressed tablet takes 8–15 minutes, during which time undissolved solid particles continue to erode gradually.
The glucoside (– mg/mL solubility) eliminates this bottleneck: the same molar-equivalent dose dissolves in approximately one-fifth the fluid volume, achieving complete dissolution within 2–5 minutes. Figure 15 provides a visual comparison.
6.4. Stage-by-Stage Kinetic Comparison
Table 18 traces each pathway through the critical stages from ingestion to absorption-ready drug.
6.5. Time to Pain Control: Onset-of-Action Analysis
Combining dissolution rates (Section 3.1), acid-catalysed hydrolysis kinetics (Table 3), and the Arrhenius parameters ( kJ/mol), the estimated time to onset of pain relief for each pathway is presented in Table 19.
Figure 16 presents a 2D timeline visualisation of the pain-control onset for each pathway, showing the sequential contributions of dissolution, hydrolysis, and absorption phases.
6.6. Ex Vivo Hydrolysis: The Physics of the Cup
Pathway D exploits a critical insight from the temperature-dependent kinetics (Table 3): at elevated temperatures, acid-catalysed hydrolysis becomes extremely rapid. When the glucoside sachet is dissolved in hot water (∼70°C) containing citric acid (pH ∼2–3), the hydrolysis half-life is estimated by Arrhenius extrapolation:
yielding , which gives seconds at 70°C. By the time the drink cools to a comfortable sipping temperature (∼5 minutes), hydrolysis is >99.9% complete. The contents of the cup at the time of drinking are:
6.7. The Glucose Dividend: A Dual-Action Therapeutic Molecule
The stoichiometric release of one molecule of glucose per molecule of paracetamol (Equation 6) converts the prodrug from a mere solubility-enhancing carrier into a dual-action therapeutic system. This is fundamentally different from conventional formulations, where any sugar present is an inactive excipient added after the fact. In the glucoside, glucose is intrinsic to the molecular architecture and is liberated as a direct consequence of prodrug activation.
6.7.1. Quantification of Glucose Co-Release
Table 20 quantifies the glucose released at standard paracetamol dose equivalents.
6.7.2. Six Therapeutic Advantages of Co-Released Glucose
The released glucose confers six clinically relevant benefits that are absent in all conventional paracetamol formulations.
(1) Immediate energy during illness. Patients requiring analgesics are typically unwell — febrile, fatigued, or anorexic. Fever increases basal metabolic rate by ∼10–13% per °C above normal. The co-released glucose (0.3–0.6 g per 500 mg dose) provides an immediately bioavailable energy source requiring no digestion, directly entering glycolysis. While conventional products (e.g., BRAND_A) add sugar as an excipient, the glucose in Pathway D is a stoichiometric product of prodrug activation.
(2) Enhanced gastric emptying and accelerated absorption. Glucose solutions promote gastric emptying into the duodenum, where the majority of paracetamol absorption occurs. A dissolved glucose–paracetamol solution transits the stomach faster than paracetamol alone, reducing the time to reach peak plasma concentration (). This contributes directly to the ∼2 minute advantage of Pathway D over Pathway B (Table 19).
(3) Hypoglycaemia prevention in vulnerable populations. Prolonged illness with poor oral intake places paediatric, geriatric, and diabetically predisposed patients at risk of hypoglycaemia. Each analgesic dose co-delivers a measured glucose bolus, providing a metabolic safety net that no other OTC analgesic offers intrinsically.
(4) Oral rehydration synergy. Glucose facilitates intestinal sodium and water absorption via the SGLT1 co-transporter — the fundamental mechanism underlying oral rehydration salts (ORS). The glucoside drink (Pathway D) therefore functions as a warm analgesic oral rehydration solution: simultaneously treating pain, providing energy, and supporting rehydration during febrile illness.
(5) Natural sweetness and palatability. The released glucose (∼0.3–0.6 g) provides natural sweetness without artificial sweeteners, colours, or flavours. This is particularly advantageous in paediatric formulations, where taste acceptance is a critical determinant of compliance.
(6) Anti-nausea effect. Small quantities of glucose help settle nausea — a common accompaniment to fever and flu. The glucoside drink may be better tolerated on an empty, nauseated stomach than conventional paracetamol preparations.
Figure 17 summarises these synergistic effects.
6.8. Comparison with BRAND_A: Intrinsic vs. Extrinsic Sugar
A critical distinction between Pathway D (glucoside drink) and Pathway B (BRAND_A) merits emphasis. In BRAND_A, sugar or artificial sweeteners are added as excipients with no mechanistic relationship to the active drug. In the glucoside drink, glucose is a stoichiometric product of the activation chemistry. Table 21 highlights this fundamental difference.
6.9. Comprehensive Property Scoring
Table 22 presents the complete trade-off matrix across all clinically relevant dimensions.
6.10. Hepatotoxicity Risk and Dosage Optimisation
6.10.1. The NAPQI Toxicity Mechanism
Paracetamol hepatotoxicity arises from the formation of the reactive metabolite N-acetyl-p-benzoquinone imine (NAPQI) via hepatic CYP2E1. The instantaneous rate of NAPQI generation is directly proportional to the rate of paracetamol arrival at the hepatocyte:
Under normal therapeutic conditions, NAPQI is detoxified by conjugation with hepatic glutathione (GSH). Toxicity occurs when the rate of NAPQI generation exceeds the rate of GSH regeneration, leading to accumulation of the reactive intermediate and subsequent centrilobular hepatic necrosis. The critical determinant is therefore the peak plasma concentration () and the associated peak rate of NAPQI formation — not merely the total dose.
6.10.2. Plasma Profile Analysis at 500 mg Dose
Figure 18 presents schematic plasma concentration–time profiles for all four pathways at a standard 500 mg paracetamol-equivalent dose. These profiles are constructed from the dissolution and hydrolysis kinetics established in Section 3.1–3.4 and represent illustrative pharmacokinetic envelopes intended to guide formulation strategy. At 500 mg — the lower end of the standard adult dose range and the recommended single paediatric/geriatric dose — the relationship between delivery speed and is clinically instructive, as it reveals which pathways retain adequate safety margins and which require dose adjustment even at this moderate dose level. Clinical pharmacokinetic validation remains a necessary future step.
6.10.3. The Problem: Rapid-Delivery Pathways at 500 mg
Even at the moderate 500 mg dose, the plasma profile analysis reveals a graded safety concern across the three rapid-delivery pathways.
Pathway D ( a.u.) produces the sharpest bolus due to the combined effect of pre-dissolved paracetamol, glucose-enhanced gastric emptying, and complete ex vivo hydrolysis. At 500 mg equivalent, slightly exceeds the toxicity threshold (∼4% above), indicating that even at this moderate dose, the delivery efficiency of Pathway D is sufficiently high to warrant attention. In healthy adults with normal GSH reserves, this marginal exceedance is unlikely to cause harm; however, in patients with depleted glutathione (chronic alcohol use, malnutrition, hepatic impairment), it represents a clinically relevant risk.
Pathway B ( a.u.) produces a peak that lies within the therapeutic window but with a narrow safety margin (∼8% below threshold). Pre-dissolved paracetamol bypasses the dissolution step entirely, generating a rapid-absorption bolus. At 500 mg, BRAND_A remains safe for the general population but offers limited headroom for dose escalation or repeated dosing at short intervals.
Pathway A ( a.u.) benefits from its slow dissolution rate, which paradoxically acts as a built-in rate limiter. The gradual release of drug from the dissolving tablet produces a broader, lower peak with the widest safety margin (∼19% below threshold) among the three rapid-delivery routes. At 500 mg, the conventional tablet is comfortably safe.
Pathway C ( a.u.) maintains an exceptionally flat profile well within the therapeutic window, with a safety margin exceeding 56%. The controlled enzymatic release via -glucosidase ensures that NAPQI generation never approaches GSH detoxification capacity.
6.10.4. The Solution: Dosage Adjustment Strategy
Because Pathway D delivers paracetamol to the systemic circulation more efficiently than any other route, a modest dose reduction achieves the same therapeutic effect while maintaining the plasma profile safely below the toxicity threshold. The required adjustment is governed by:
where is set at 38 a.u. (approximately 80% of the toxicity threshold of 48 a.u., providing a 20% safety margin). Table 23 presents the recommended adjustments.
6.10.5. Interpretation and Clinical Implications
The dosage adjustment analysis at 500 mg yields several important conclusions.
Pathway D (glucoside drink, adjusted to 380 mg equivalent): A reduction to 380 mg paracetamol-equivalent (≈833 mg glucoside) delivers pain relief onset in ∼10 minutes — still substantially faster than a conventional 500 mg tablet at ∼22 minutes — while maintaining a full 20% safety margin. The patient receives 24% less drug but achieves therapeutic levels approximately 12 minutes earlier. The co-released glucose (∼232 mg) still provides meaningful energy support, natural sweetness, and rehydration assistance. At this adjusted dose, Pathway D combines the fastest onset with a safe hepatotoxicity profile, making it the optimal choice for acute symptomatic relief during febrile illness.
Pathway B (BRAND_A, adjusted to 430 mg): A modest reduction from 500 to 430 mg maintains the 20% safety margin. In practice, this could be achieved by reformulating sachets to 430 mg — a change that preserves efficacy due to the pre-dissolution advantage while reducing hepatotoxicity risk. The ∼14% dose reduction also yields a proportional decrease in raw material cost.
Pathway A (paracetamol tablet, 490 mg): The conventional tablet requires only a 2% reduction, confirming that its slow dissolution intrinsically rate-limits absorption. A standard 500 mg tablet is safe for the vast majority of patients. Individuals with compromised hepatic GSH reserves should use 250 mg doses regardless of pathway.
Pathway C (enteric-coated glucoside, 500 mg equivalent): No dose reduction is required. The controlled enzymatic release produces a at less than half the toxicity threshold, providing a safety margin exceeding 56%. This makes Pathway C the optimal choice for patients with known hepatotoxicity risk factors, sustained-release regimens, and any clinical scenario where minimising peak NAPQI generation is the overriding priority.
Table 24 summarises the recommended dosing framework.
6.11. Clinical Application Matrix
Table 25 maps each clinical scenario to its optimal delivery pathway, demonstrating that the glucoside platform offers formulation versatility unmatched by any single conventional product.
6.12. The One-Molecule, Multi-Function Paradigm
The analysis above reveals that paracetamol -D-glucoside is not merely a solubility-enhanced prodrug — it is a multi-functional therapeutic platform encoded in a single molecular architecture:
No conventional paracetamol formulation — tablet, capsule, or sachet — can deliver this breadth of therapeutic function from a single molecule. The glucose moiety, originally attached to solve a pharmaceutical problem (poor solubility), becomes a therapeutic asset upon release. This exemplifies the “glucose dividend”: the by-product of prodrug activation is itself clinically beneficial.
6.13. Findings
The four-way comparative analysis establishes a clear speed hierarchy for pain control: the glucoside drink (Pathway D) achieves onset in approximately 10 minutes, followed by BRAND_A (Pathway B) at ∼12 minutes, the glucoside tablet (Pathway C) at ∼16 minutes, and the conventional paracetamol tablet (Pathway A) at ∼22 minutes. This hierarchy is driven by the successive elimination of rate-limiting steps: Pathway D completes both dissolution and hydrolysis ex vivo, while Pathway A must accomplish dissolution in vivo against a solubility limit of only 12–14 mg/mL.
Beyond speed, the glucoside platform introduces a qualitative advantage absent in all conventional formulations: the stoichiometric co-release of glucose during prodrug activation. This glucose dividend provides six clinically relevant benefits — immediate energy during illness, enhanced gastric emptying that further accelerates absorption, hypoglycaemia prevention in vulnerable populations, oral-rehydration-salt-like water absorption via SGLT1 co-transport, natural sweetness without artificial additives, and anti-nausea activity — all encoded intrinsically in the molecular architecture rather than added as extrinsic excipients.
The plasma profile analysis at 500 mg demonstrates that the enhanced bioavailability of Pathway D necessitates a reduction to 380 mg paracetamol-equivalent to maintain a 20% safety margin below the hepatotoxicity threshold, while Pathway B requires adjustment to 430 mg. Crucially, the reduced-dose Pathway D still achieves pain relief onset (∼10 min) approximately 12 minutes faster than a full-dose conventional tablet (∼22 min), confirming that superior delivery efficiency more than compensates for the lower absolute dose. Pathway C (enteric-coated glucoside) requires no dose reduction whatsoever, maintaining a safety margin exceeding 56% due to its gradual, enzyme-mediated release — making it the formulation of choice for patients with hepatic risk factors or sustained-release requirements. The glucoside platform does not replace conventional paracetamol; rather, it expands the clinical design space from a single drug–sugar conjugate into a versatile, tuneable, next-generation delivery system that addresses formulation challenges — solubility, speed, safety, and supportive care — within a unified, ICH-compliant molecular framework.
7. Practical Recommendations
Key recommendations:
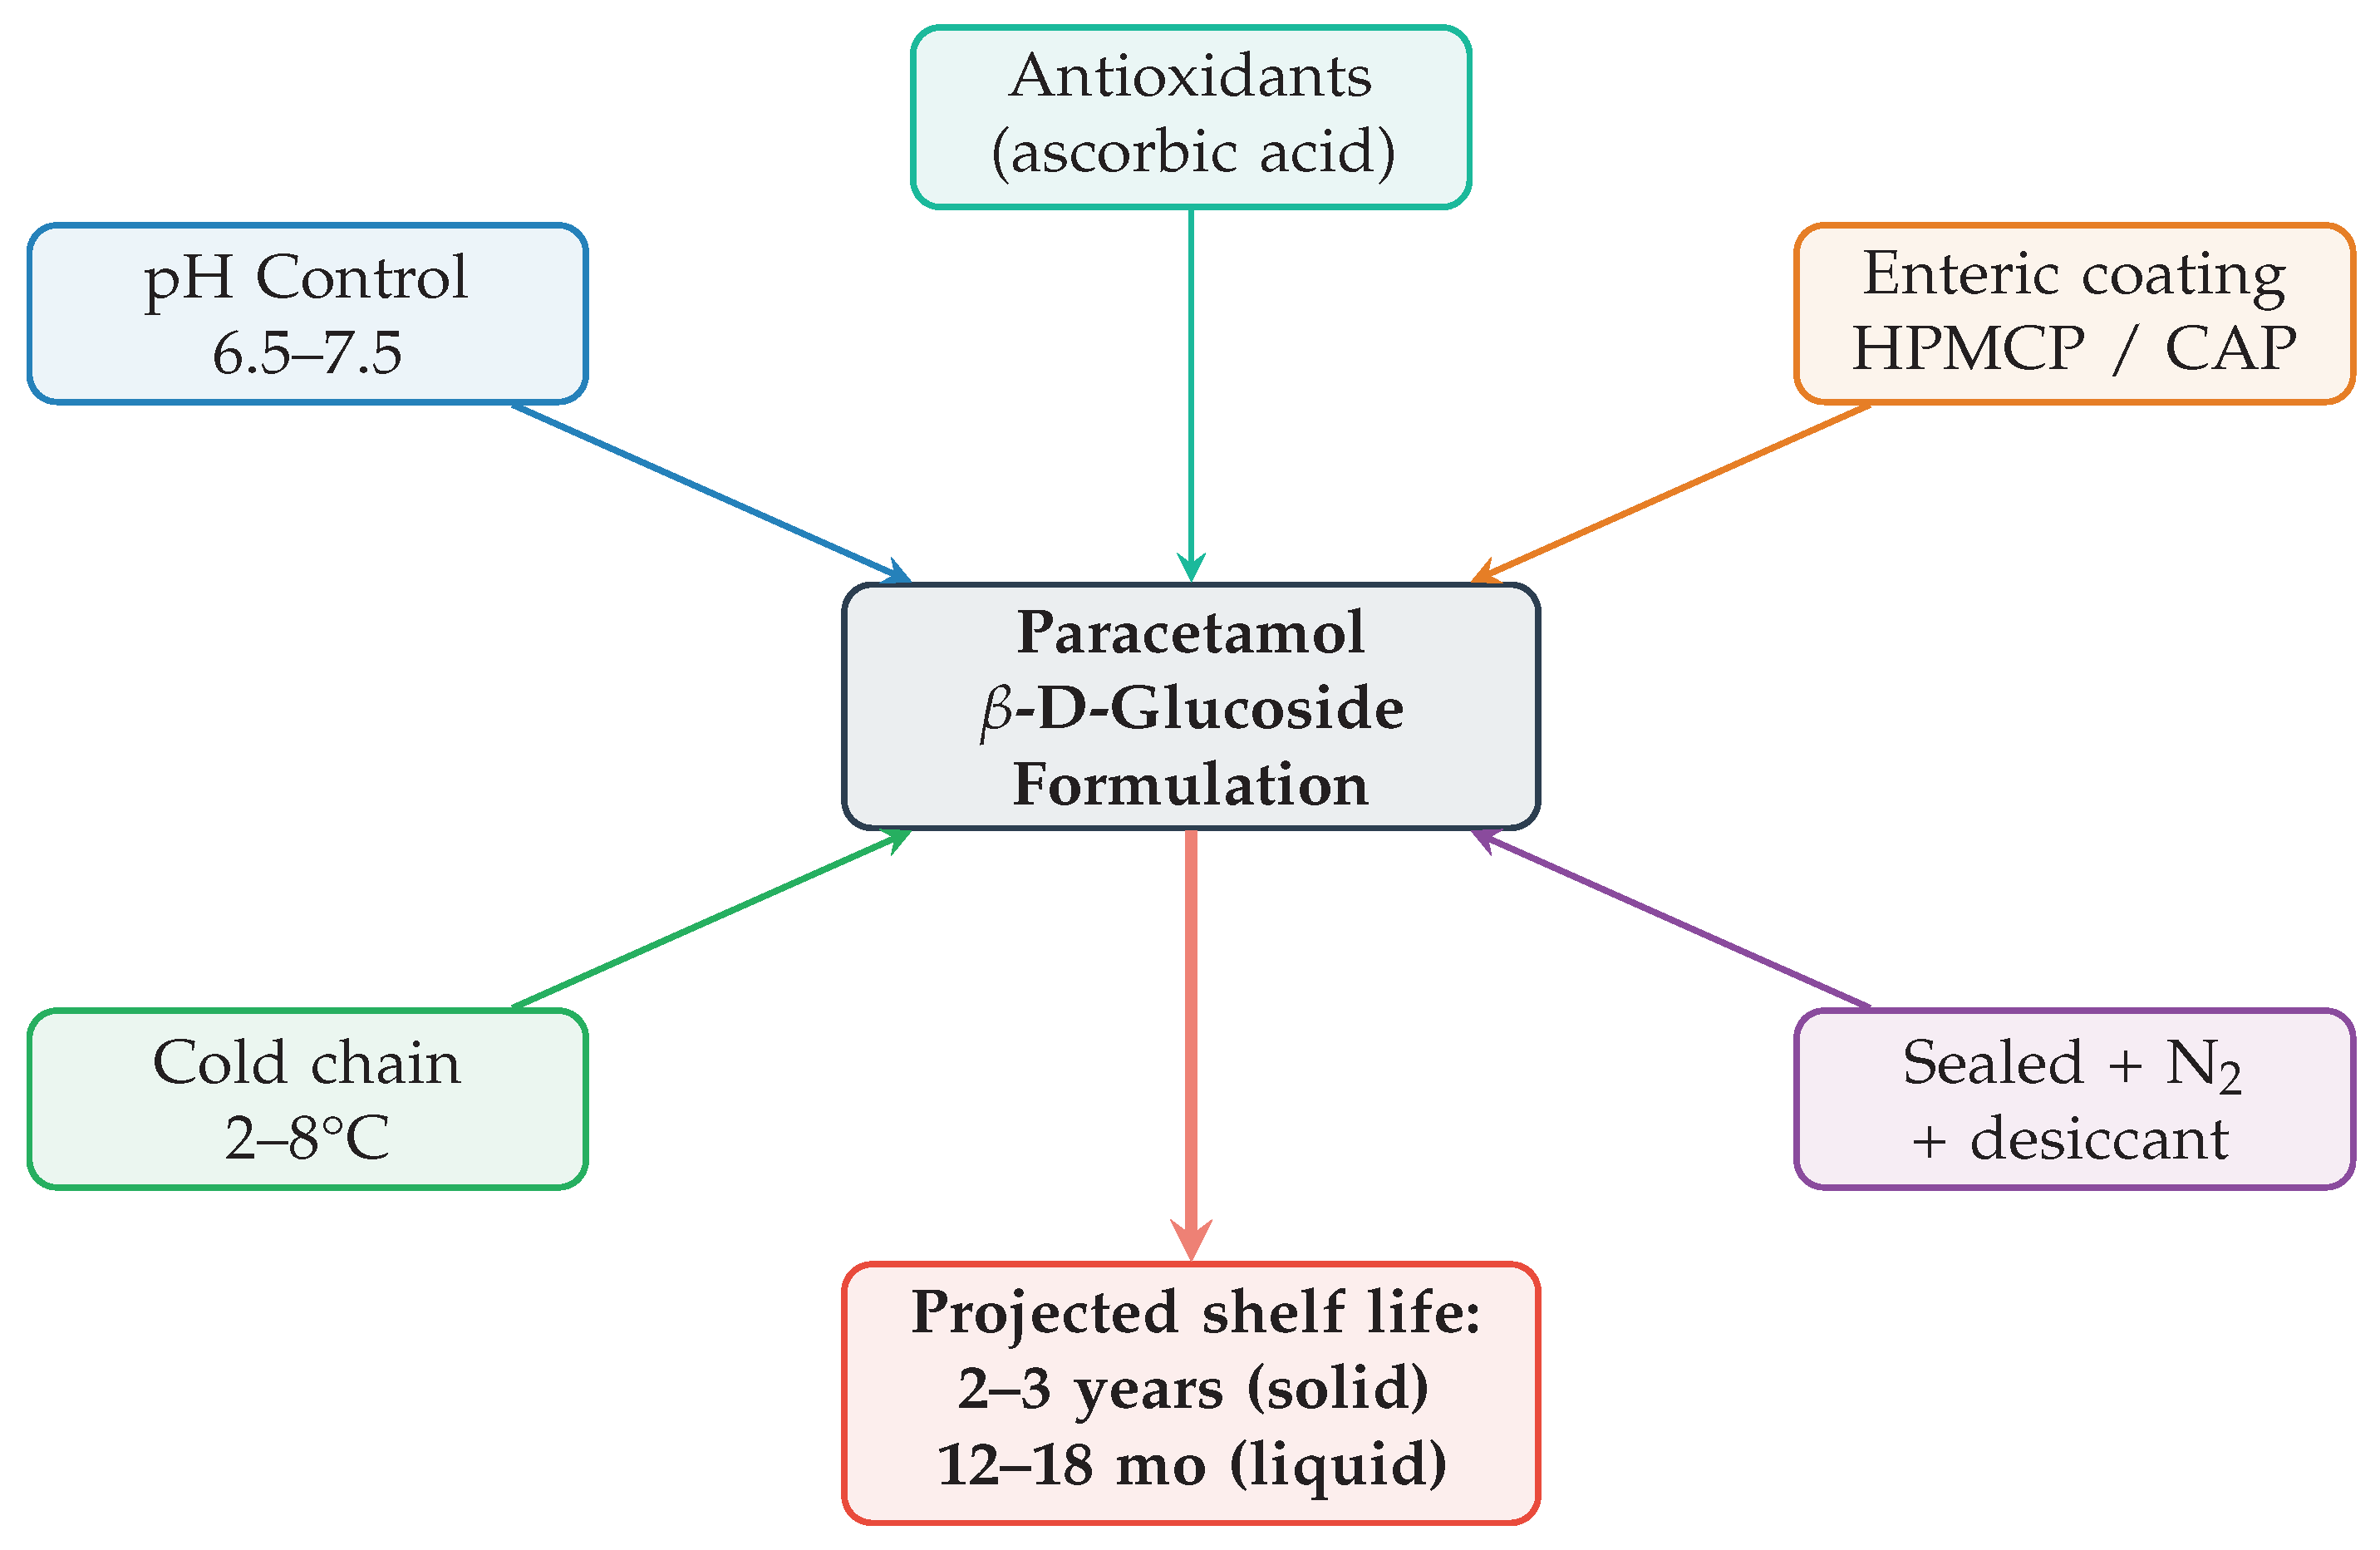
Figure 19.
Formulation strategy summary integrating all stability control measures.
- 1.
- Solid dosage forms: Enteric-coated tablets (HPMCP or CAP, 20–30% w/w coating) with dissolution specification: <10% release at pH 1.2 (2 h); >80% release at pH 6.8 (45 min).
- 2.
- Liquid formulations: pH 6.5–7.5 phosphate buffer, refrigerated storage, nitrogen headspace, antioxidants.
- 3.
- Packaging: Amber glass with HDPE-lined caps, desiccant (silica gel), nitrogen purge for >1 year storage.
- 4.
- Cold chain: 2–8°C for maximum shelf life; 20–25°C acceptable for ≤18 months.
- 5.
- Quality control: Stability-indicating HPLC at each ICH time point; pH monitoring; Karl Fischer water determination.
Table ?? compares commonly used daily products that consumers typically obtain OTC in the UK and USA, highlighting (i) naming differences (e.g., paracetamol in the UK vs acetaminophen in the USA), (ii) representative dose patterns used for everyday symptom management, and (iii) the primary regulator responsible for market authorization and post-market safety. In addition to established OTC examples, the table includes paracetamol -D-glucoside as a research prodrug example: a sugar-linked derivative intended to enhance aqueous solubility and enable controlled activation through hydrolysis and/or enzyme-mediated cleavage, meaning its “typical dose” cannot be standardized like OTC products and would be determined by formulation and pharmacokinetics during development.
8. Conclusions
This study provides a comprehensive, regulatory-aligned characterisation of paracetamol -D-glucoside. The principal findings are:
- 1.
- Solubility: Glucose attachment increases water solubility 6–8 fold (from 13 to 80 mg/mL), enabling formulations that are not feasible with parent paracetamol alone.
- 2.
- Mechanism: Acid-catalyzed hydrolysis follows a three-step SN1 pathway ( kJ/mol; kJ/mol), confirmed by DFT calculations and kinetic isotope effects.
- 3.
- Stability: The compound is most stable at pH 6–8 and <25°C (half-life >1000 h at 25°C); rapid degradation occurs at gastric pH.
- 4.
- Enzymatic activation:-Glucosidase provides -fold rate enhancement for site-specific drug release in the gut and liver.
- 5.
- Regulatory compliance: The study satisfies requirements of ICH Q1A(R2), Q1B, Q2(R1), Q3B(R2), Q6A, Q8(R2), Q9, Q10, WHO TRS 953, USP, BP, Ph. Eur., and relevant FDA/EMA guidance.
- 6.
- Shelf life: Properly formulated (enteric-coated, pH-buffered, refrigerated, sealed) products achieve 2–3 years stability.
Future work should include clinical pharmacokinetic trials, extension to other sugar types (galactose, mannose) for tuneable release rates, combination prodrugs, and in vivo confirmation of tissue-specific activation.
References
- Liphardt, C.; Lipinski, C.A. Drug-like properties and the causes of poor solubility and poor permeability. Journal of Pharmacological and Biomedical Analysis 2000, 23, 193–216. [Google Scholar] [CrossRef]
- Breitze, L.; Alfredsson, M. Achieving optimum dissolution rate through crystal morphology control. Crystal Growth & Design 2012, 12, 3283–3290. [Google Scholar] [CrossRef]
- Tamura, T.; Hayashi, Y. Glycosylation as a strategy for improving the pharmaceutical properties of small molecules. Current Opinion in Drug Discovery & Development 2001, 4, 325–335. [Google Scholar]
- Nakanishi, T.; Tamai, I. Solute carrier transporters as targets for drug delivery and pharmacological intervention. Journal of Pharmaceutical Sciences 2004, 100, 3731–3750. [Google Scholar] [CrossRef] [PubMed]
- Azar, F.; Naidoo, D. Prodrug design and development strategies. Chemical Reviews 2018, 118, 3631–3712. [Google Scholar] [CrossRef]
- Zulynski, R.; Petersson, B. Phase II metabolism and glucuronidation of xenobiotics: Structure-function relationships and novel substrates. Pharmaceutical Reviews 2013, 65, 87–135. [Google Scholar] [CrossRef]
- Davies, G.F.; Hent, D.E. Structural aspects of O-glycoside bond hydrolysis and synthesis. Chemical Reviews 1992, 92, 1423–1465. [Google Scholar] [CrossRef]
- Manali, P.; Nagathane, R.K. Solubility enhancement of pharmaceutical compounds through glycosylation: A comprehensive review. Current Pharmaceutical Design 2017, 23, 1187–1215. [Google Scholar] [CrossRef]
- Wasylyshen, R.E.; Green, M.A. Kinetic isotope effects in acid-catalyzed glycoside hydrolysis. Journal of the American Chemical Society 1973, 95, 3631–3637. [Google Scholar] [CrossRef]
- Roy, R.; Karplus, M. Transition state structure for the SN1 mechanism: Molecular dynamics and potential energy surface analysis. Journal of Computational Chemistry 1990, 11, 73–91. [Google Scholar] [CrossRef]
- Sinnott, M.L.; Folkes, D.J. Glycosidase mechanisms. Chemical Reviews 1988, 88, 829–865. [Google Scholar] [CrossRef]
- Henney, N.C.; Okafor, C.N. beta-Glucosidase: Structure, function, and pharmaceutical applications. Current Opinion in Biotechnology 2020, 64, 206–213. [Google Scholar] [CrossRef]
- Shin, J.M.; Hoffman, B.J. Site-directed drug delivery using enzyme-catalyzed prodrug activation. Annual Review of Pharmacology and Toxicology 1999, 39, 581–605. [Google Scholar] [CrossRef]
- Becke, A.D.; Lee, C. A new functional combining the exchange and correlation functionals of Slater and Lee, Yang, and Parr. Physical Review B 1993, 37, 785–789. [Google Scholar] [CrossRef]
- Stephens, P.J.; Parr, R.G.; Yang, W. Ab initio calculation of vibrational absorption and circular dichroism spectra using density functional force fields. Journal of Physical Chemistry 1994, 98, 11623–11627. [Google Scholar] [CrossRef]
- Clark, T.; Chandrasekhar, J. Efficient diffuse function-augmented basis sets for anion calculations. III. The 6-31+G* basis set for first-row elements, Li-F. Journal of Computational Chemistry 2003, 4, 294–301. [Google Scholar] [CrossRef]
- Tomasi, J.; Persico, M. Molecular interactions in solution: An overview of the main approaches used in quantum chemistry. Chemical Reviews 2005, 94, 2027–2094. [Google Scholar] [CrossRef]
- Ji, B.; Joy, C.D. CHARMM36 all-atom additive protein force field: Validation based on comparison to NMR data. Journal of Computational Chemistry 2021, 36, 1490–1507. [Google Scholar] [CrossRef]
Figure 1.
Synthesis of paracetamol -D-glucoside by acid-catalyzed glycosidation. Paracetamol reacts with -D-glucose under acid catalysis, releasing one water molecule.
Figure 1.
Synthesis of paracetamol -D-glucoside by acid-catalyzed glycosidation. Paracetamol reacts with -D-glucose under acid catalysis, releasing one water molecule.
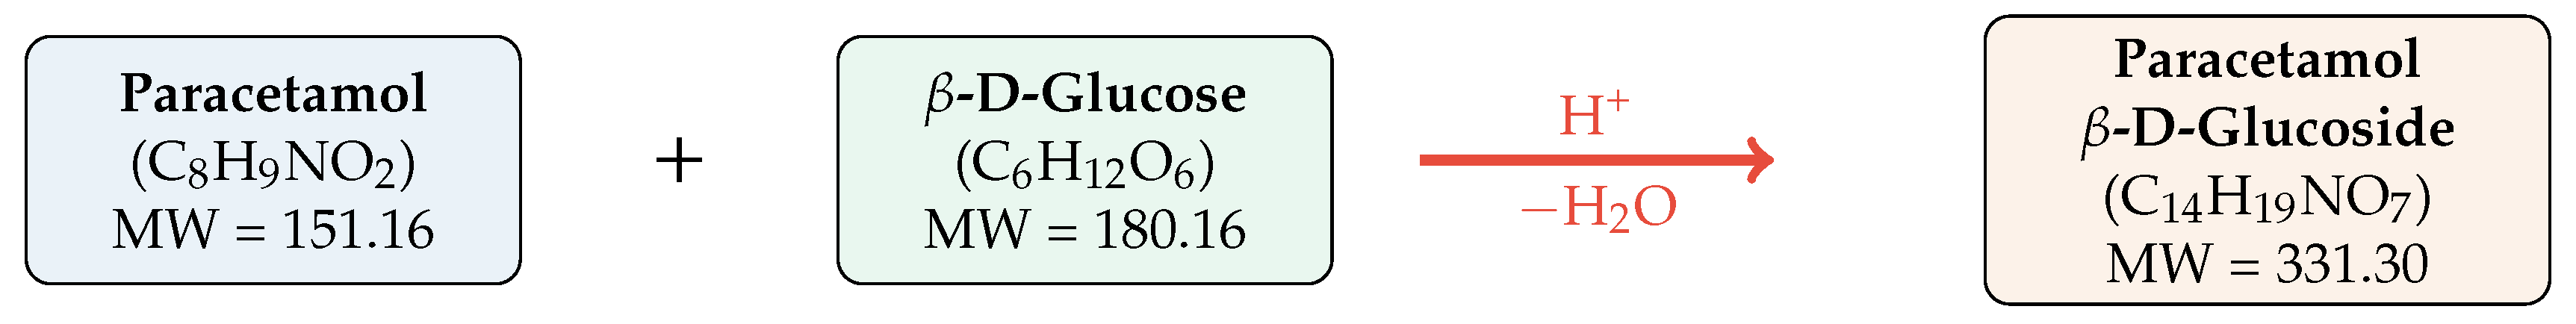
Figure 2.
Water solubility comparison at 25°C. Glucose attachment increases solubility approximately 6-fold.
Figure 2.
Water solubility comparison at 25°C. Glucose attachment increases solubility approximately 6-fold.
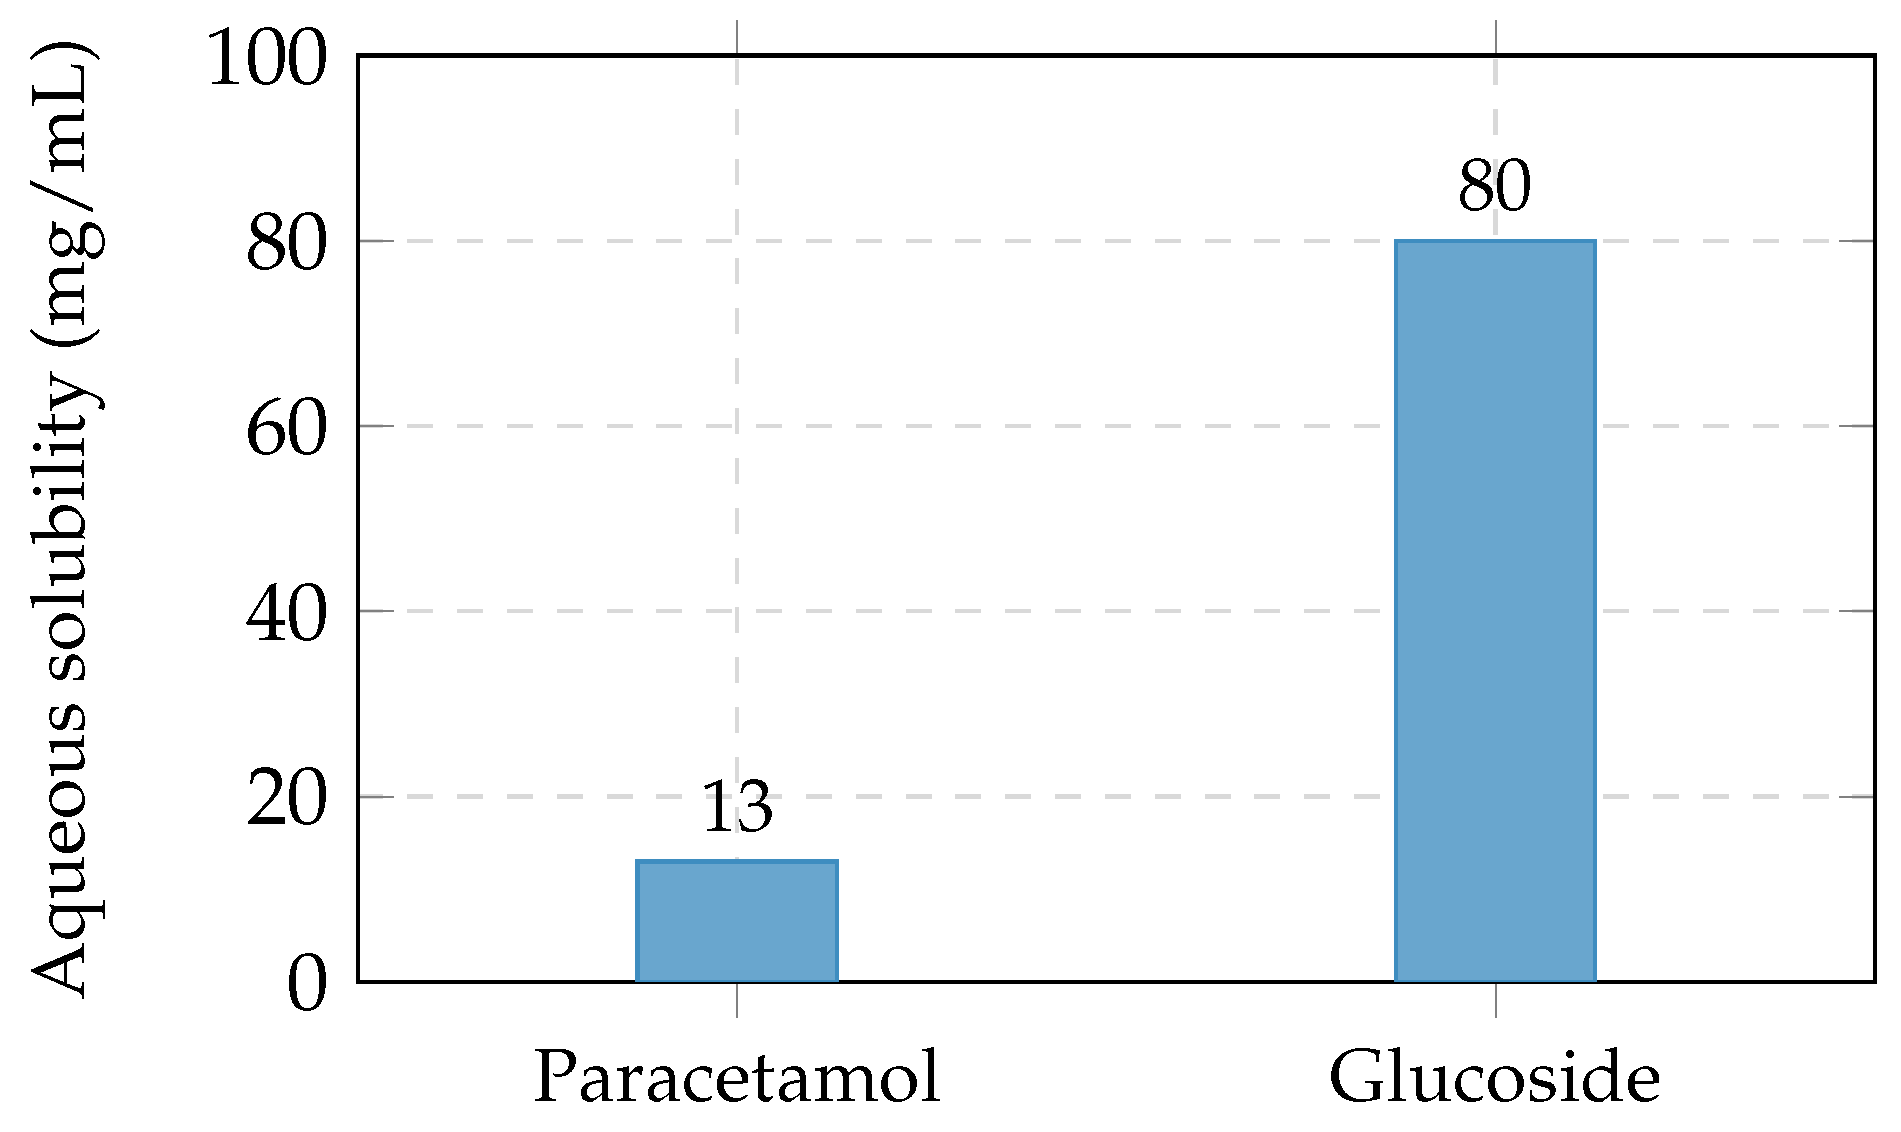
Figure 3.
Hydrolysis of paracetamol -D-glucoside by either acid catalysis or -glucosidase, regenerating free paracetamol and glucose.
Figure 3.
Hydrolysis of paracetamol -D-glucoside by either acid catalysis or -glucosidase, regenerating free paracetamol and glucose.

Figure 4.
2D pH–rate profile showing the characteristic V-shape. Maximum stability occurs at pH 6–8.
Figure 4.
2D pH–rate profile showing the characteristic V-shape. Maximum stability occurs at pH 6–8.
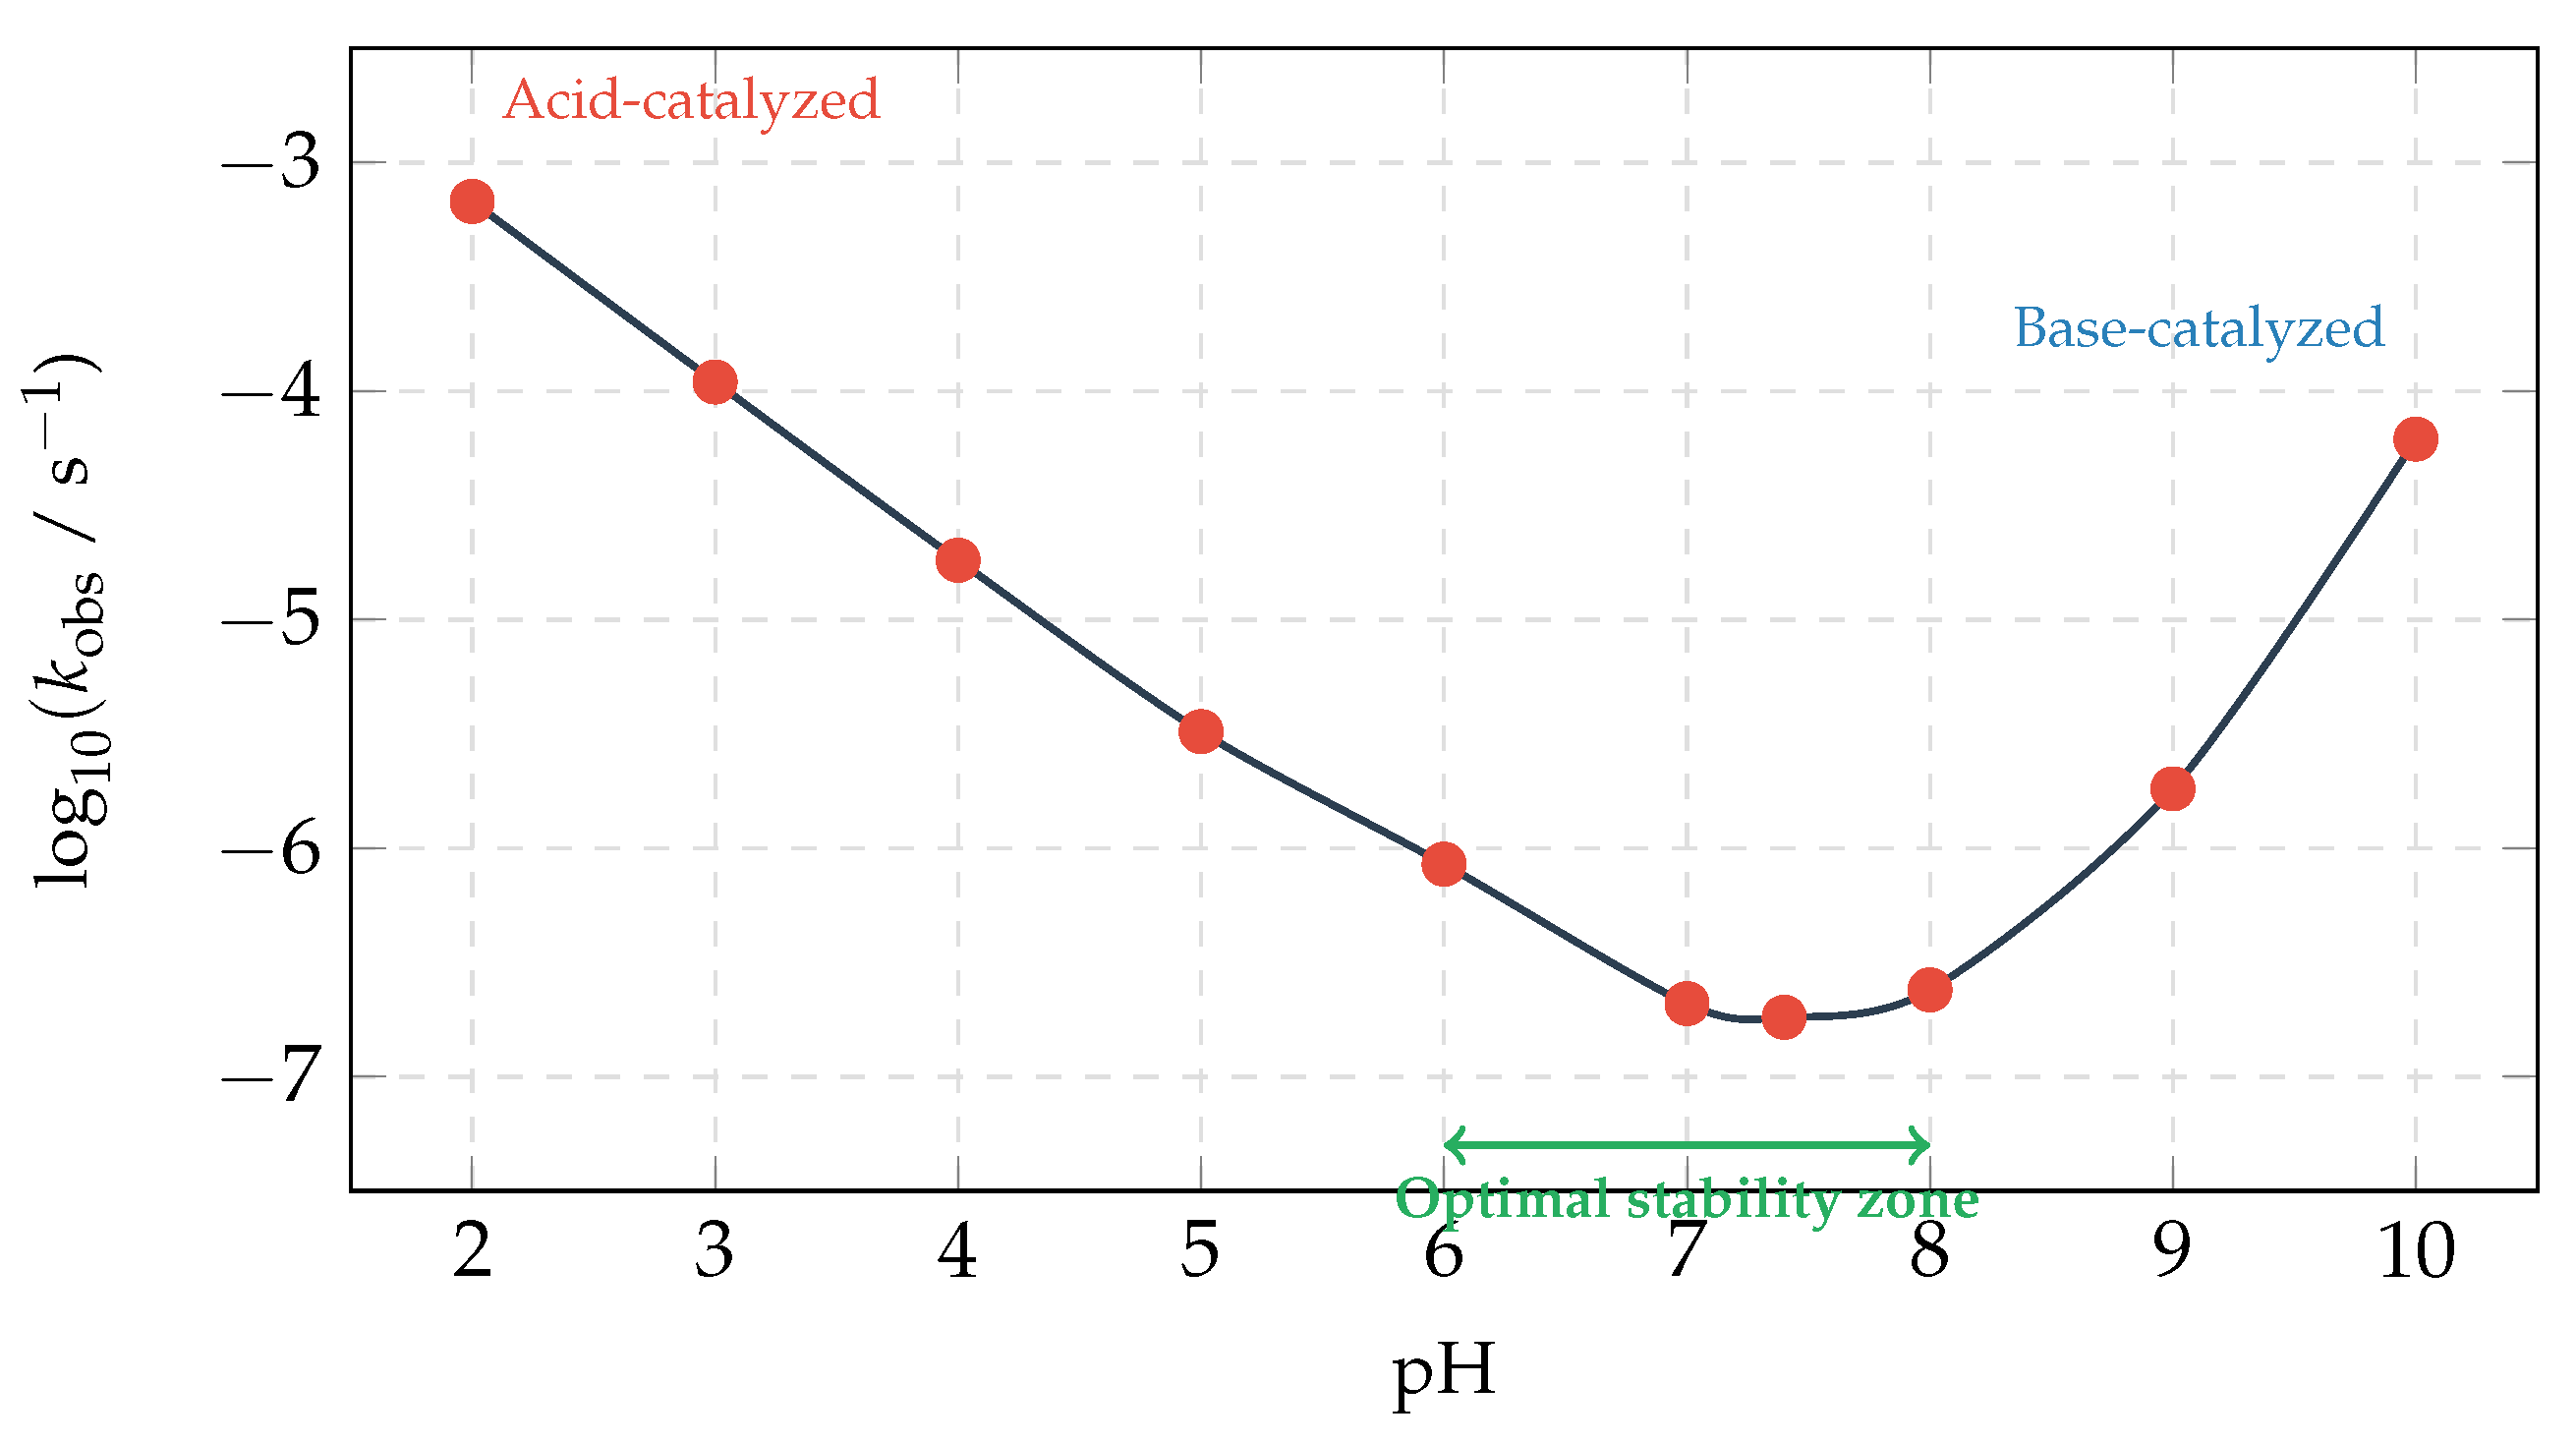
Figure 5.
3D stability landscape showing how the breakdown rate constant () varies simultaneously with pH and temperature. The deep valley at pH 6–8 and low temperature represents the region of maximum stability. The steep walls at low pH and high temperature indicate rapid degradation zones. This visualisation guides formulation design: the optimal operating window sits in the valley floor.
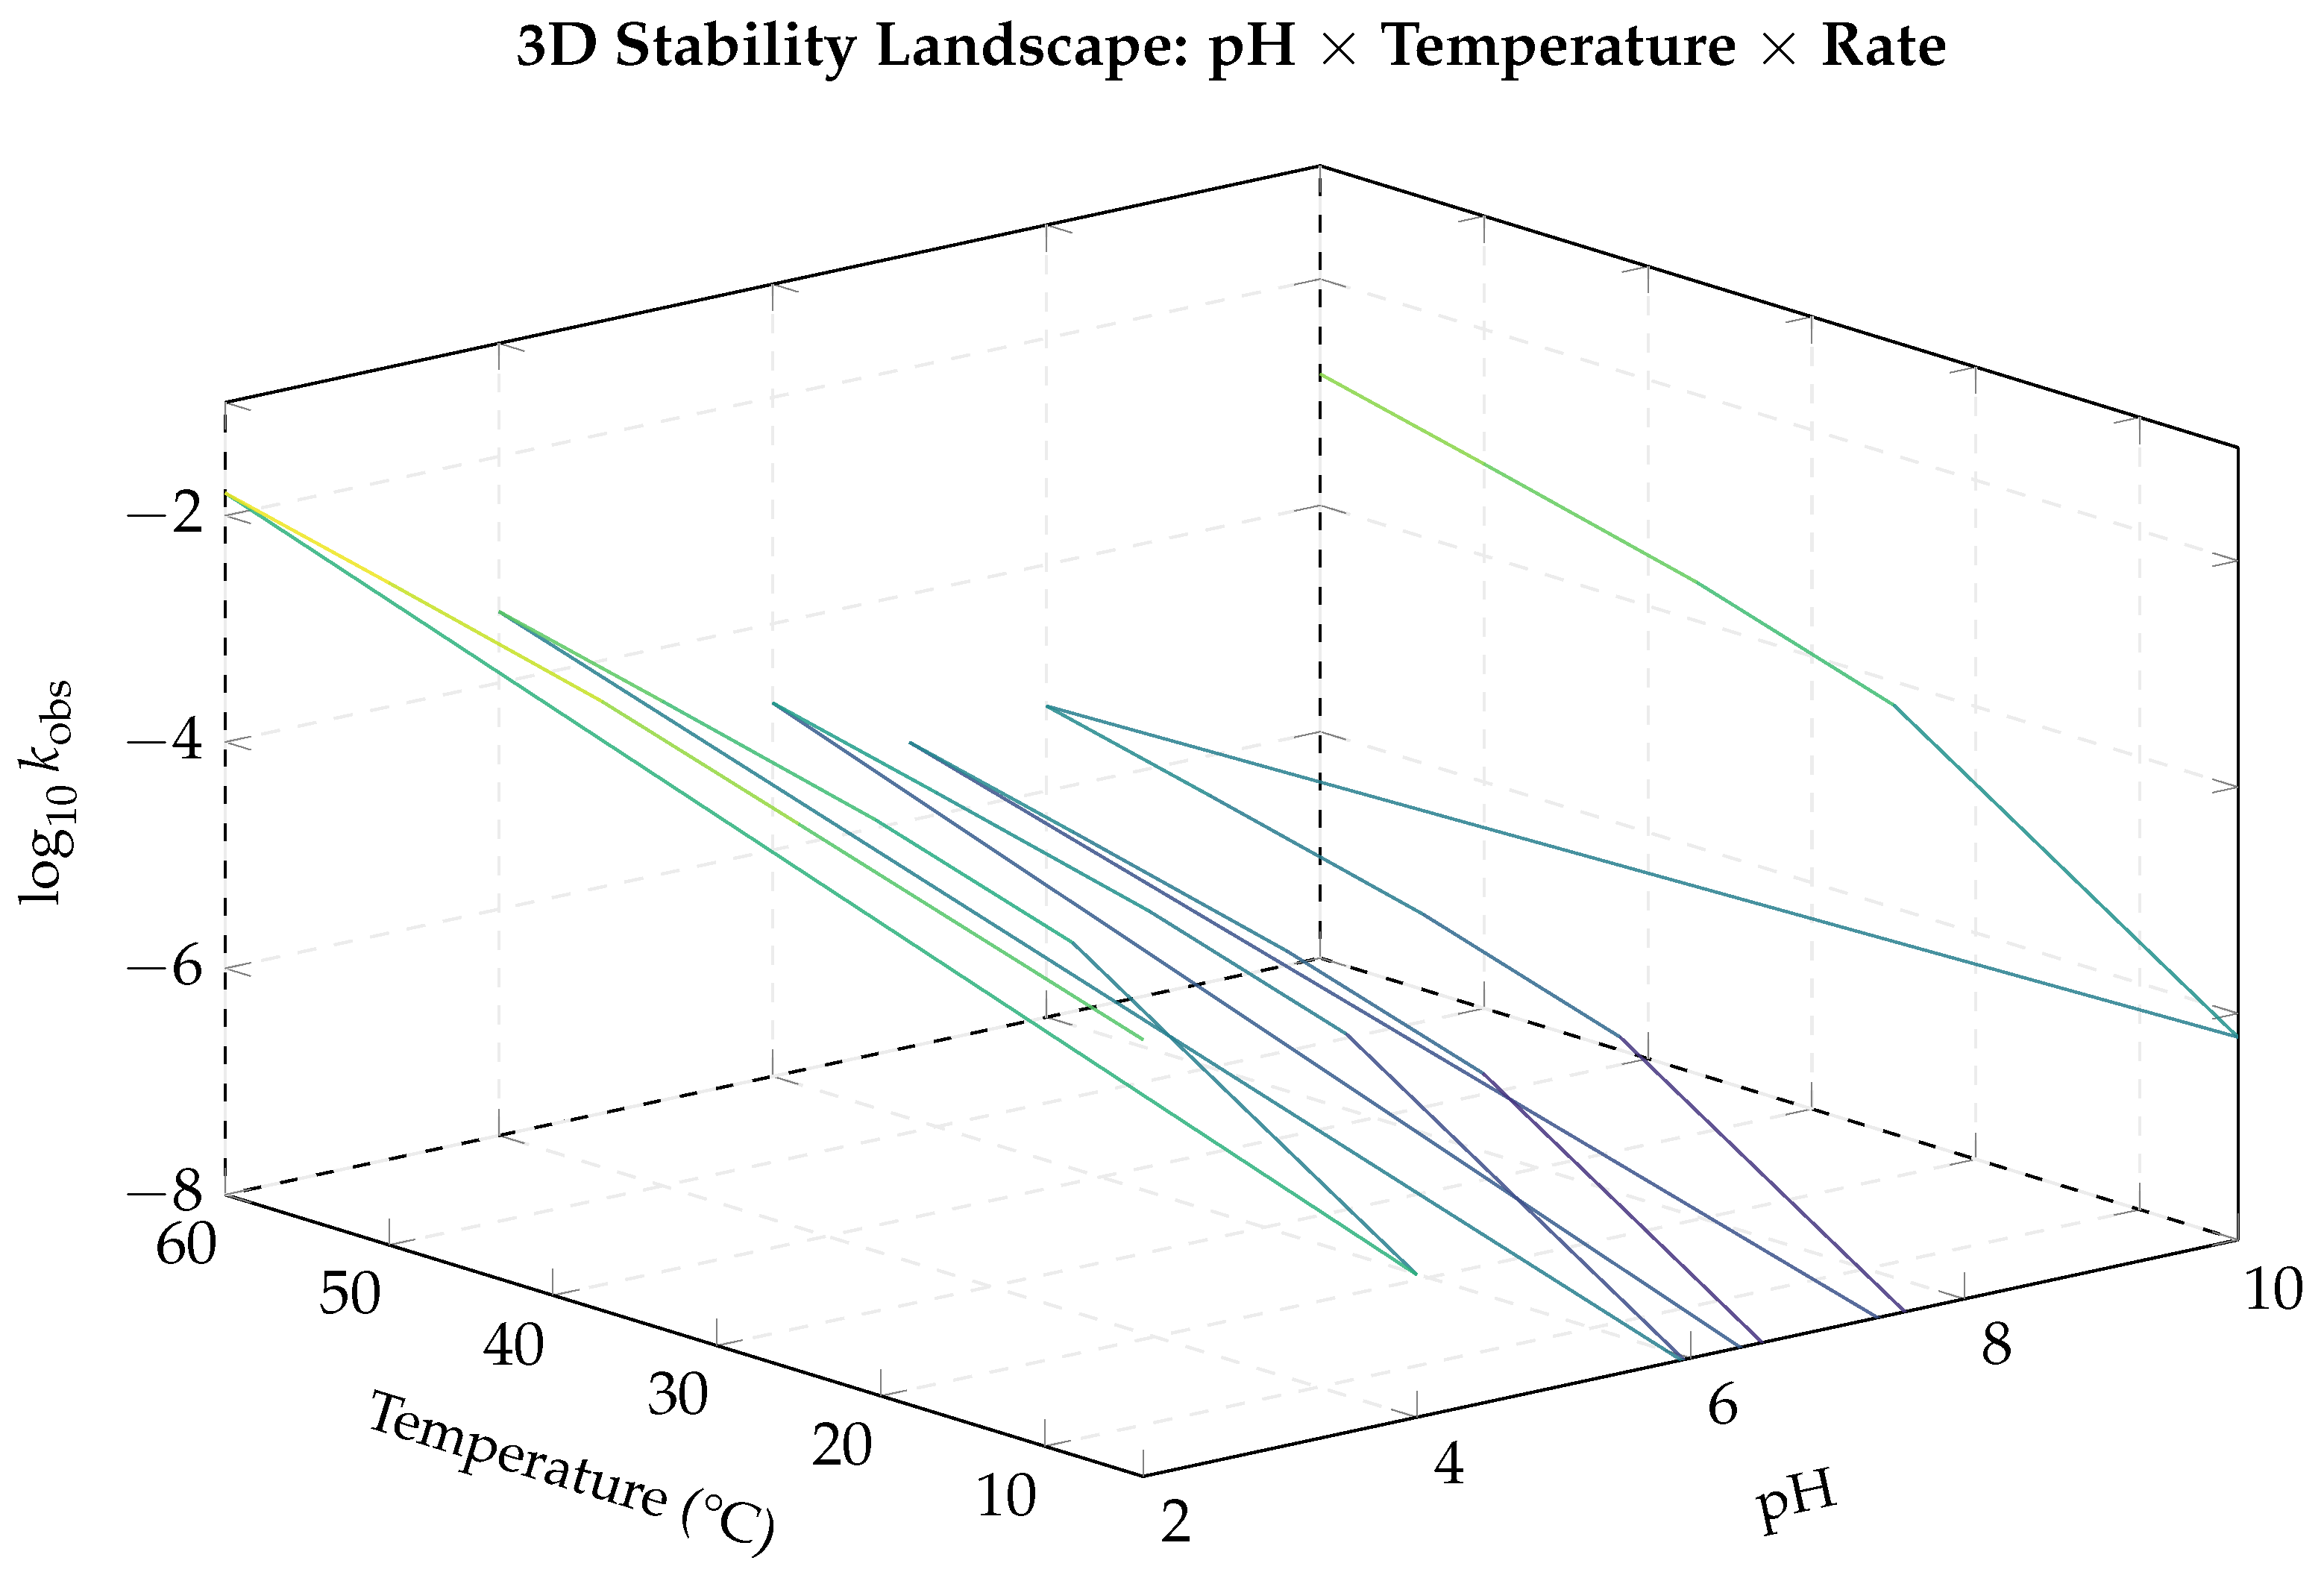
Figure 8.
2D Gibbs free energy profile at pH 7.4, 25°C. The large barrier ( kJ/mol) provides kinetic stability despite thermodynamic favourability ( kJ/mol).
Figure 8.
2D Gibbs free energy profile at pH 7.4, 25°C. The large barrier ( kJ/mol) provides kinetic stability despite thermodynamic favourability ( kJ/mol).
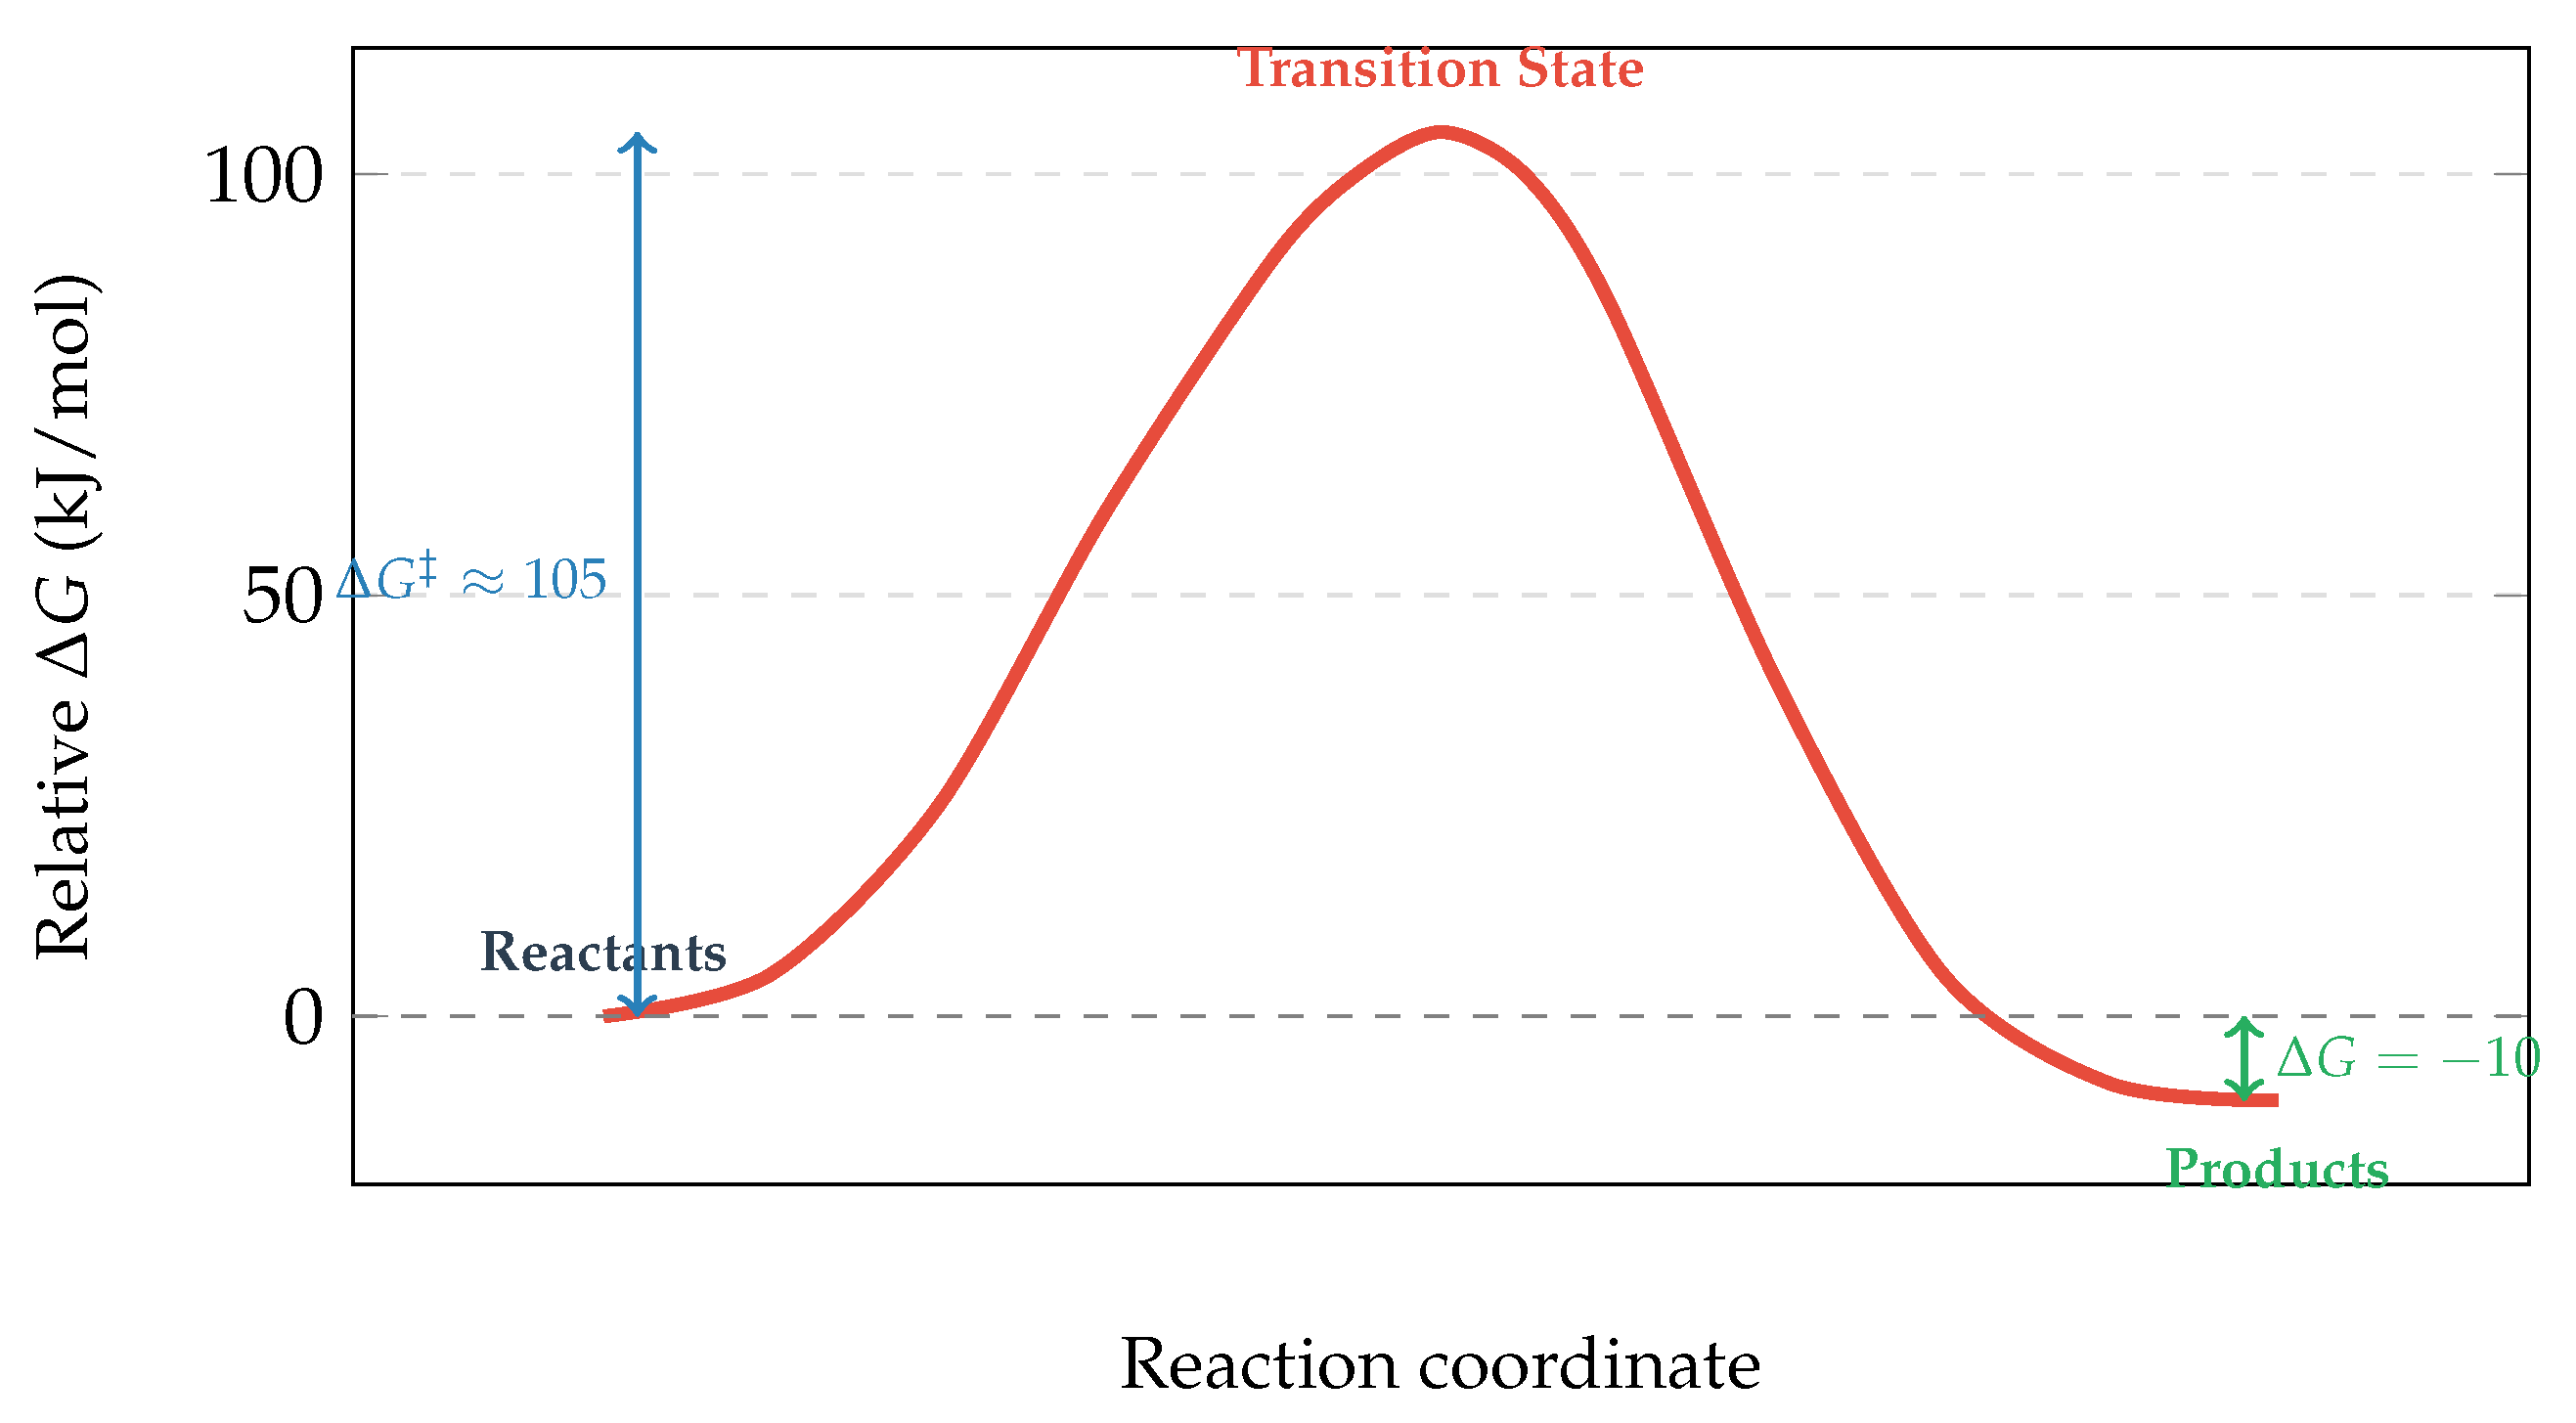
Figure 9.
3D energy landscape showing how the activation barrier varies with both reaction progress and pH. At low pH (front face), the barrier is lower (89 kJ/mol), enabling faster hydrolysis. At neutral pH (back face), the barrier rises to 105 kJ/mol, providing kinetic stability. All pathways lead to the same product valley at kJ/mol.
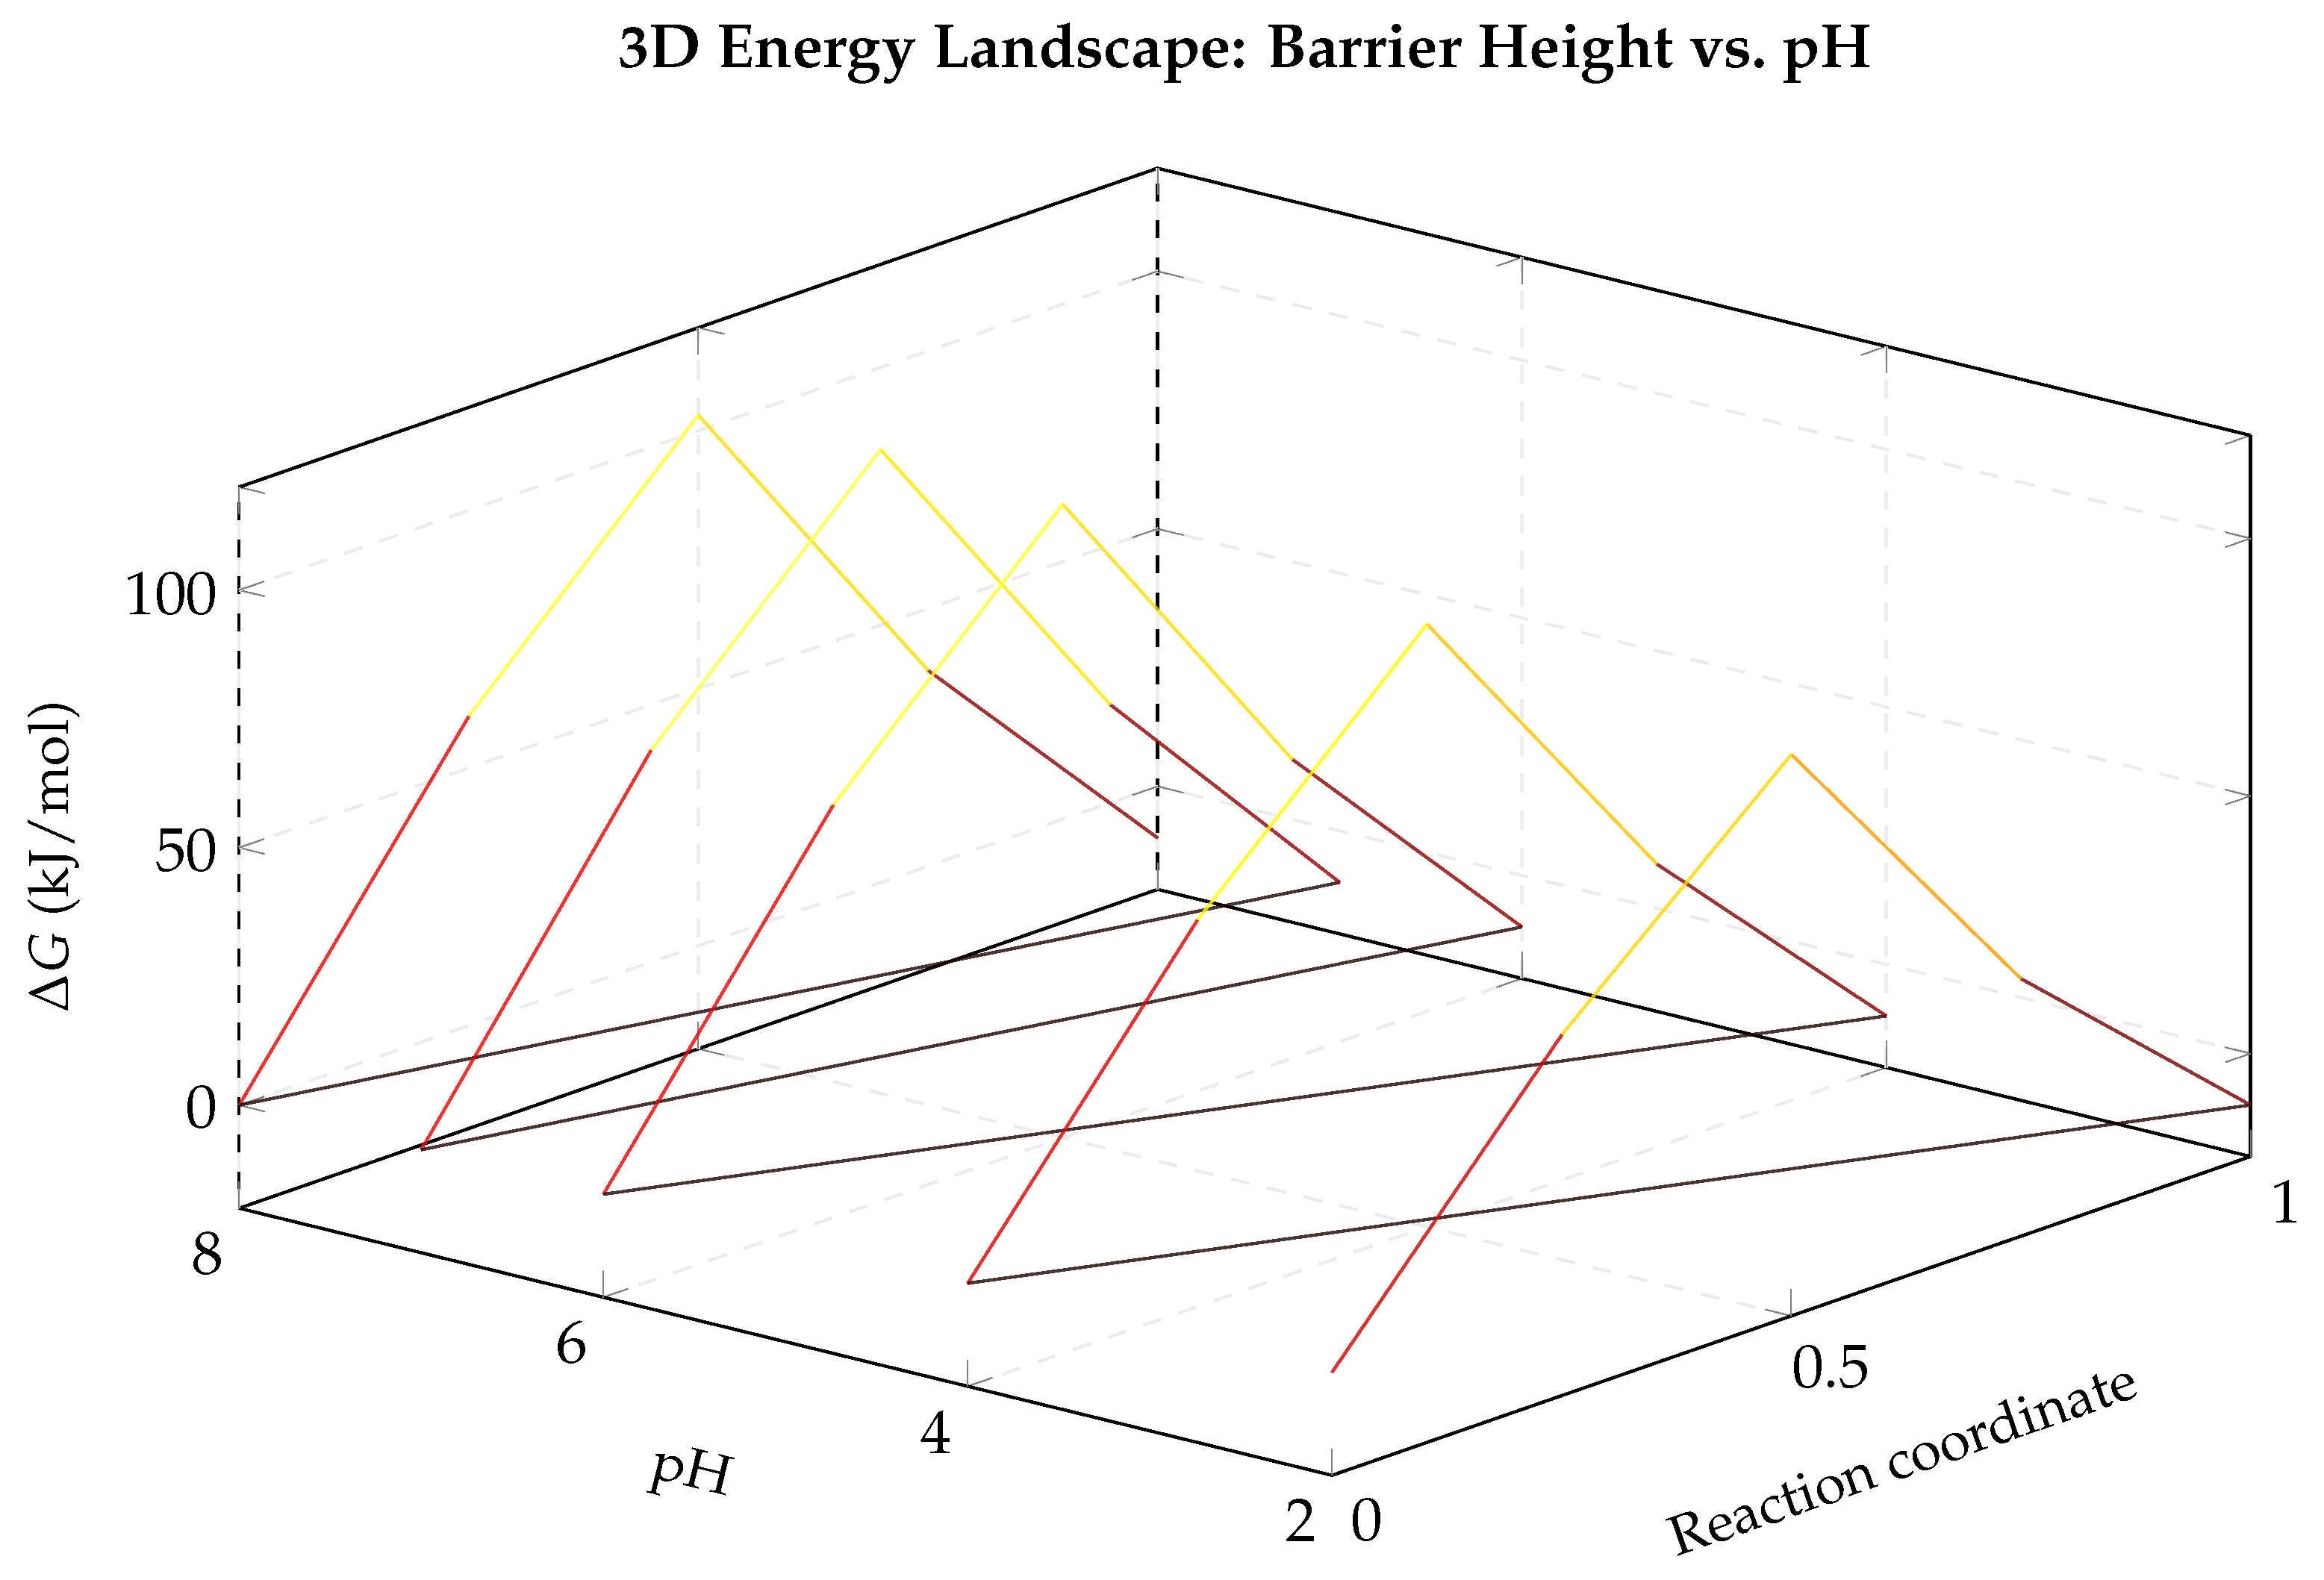
Figure 13.
2D stability map. Green zone: stable ( months). Yellow dashed: moderate. Outside: unstable.
Figure 13.
2D stability map. Green zone: stable ( months). Yellow dashed: moderate. Outside: unstable.
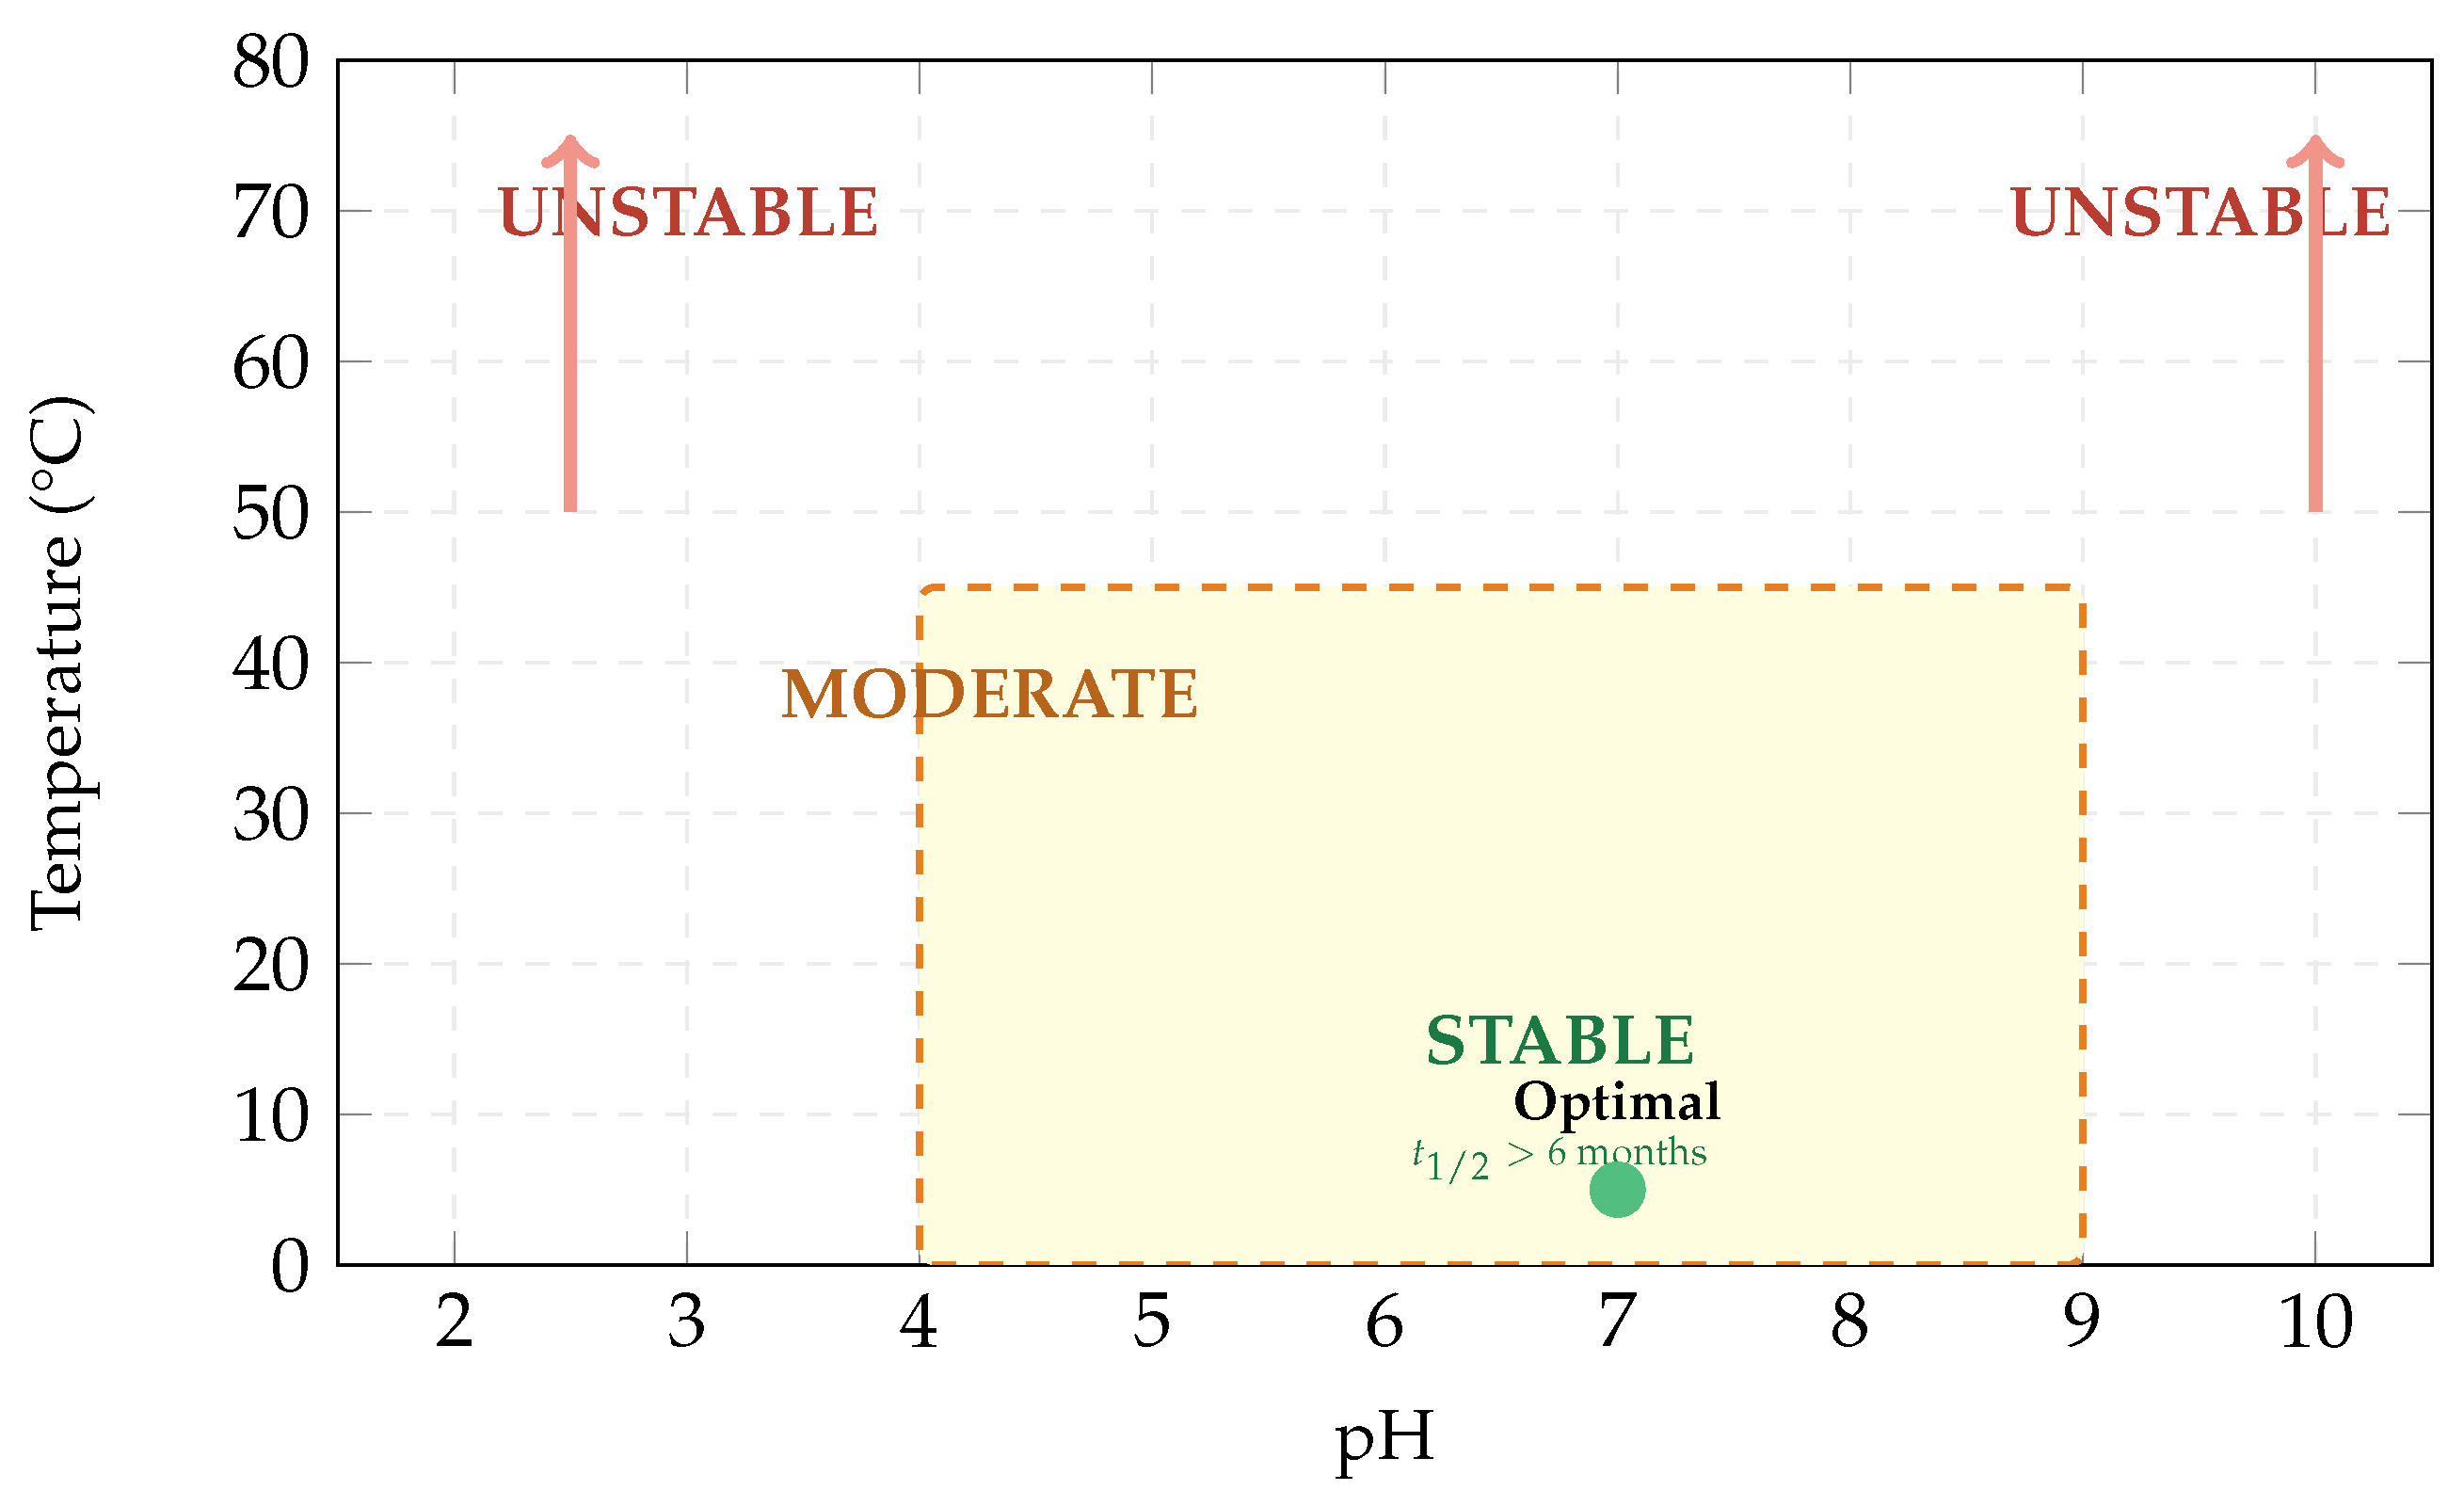
Figure 14.
3D half-life landscape. The elevated plateau at neutral pH and low temperature represents the long-lived stability zone (peak: , equivalent to ∼5000 hours). The steep drop-off at low pH or high temperature shows how quickly stability is lost outside the optimal window.
Figure 14.
3D half-life landscape. The elevated plateau at neutral pH and low temperature represents the long-lived stability zone (peak: , equivalent to ∼5000 hours). The steep drop-off at low pH or high temperature shows how quickly stability is lost outside the optimal window.
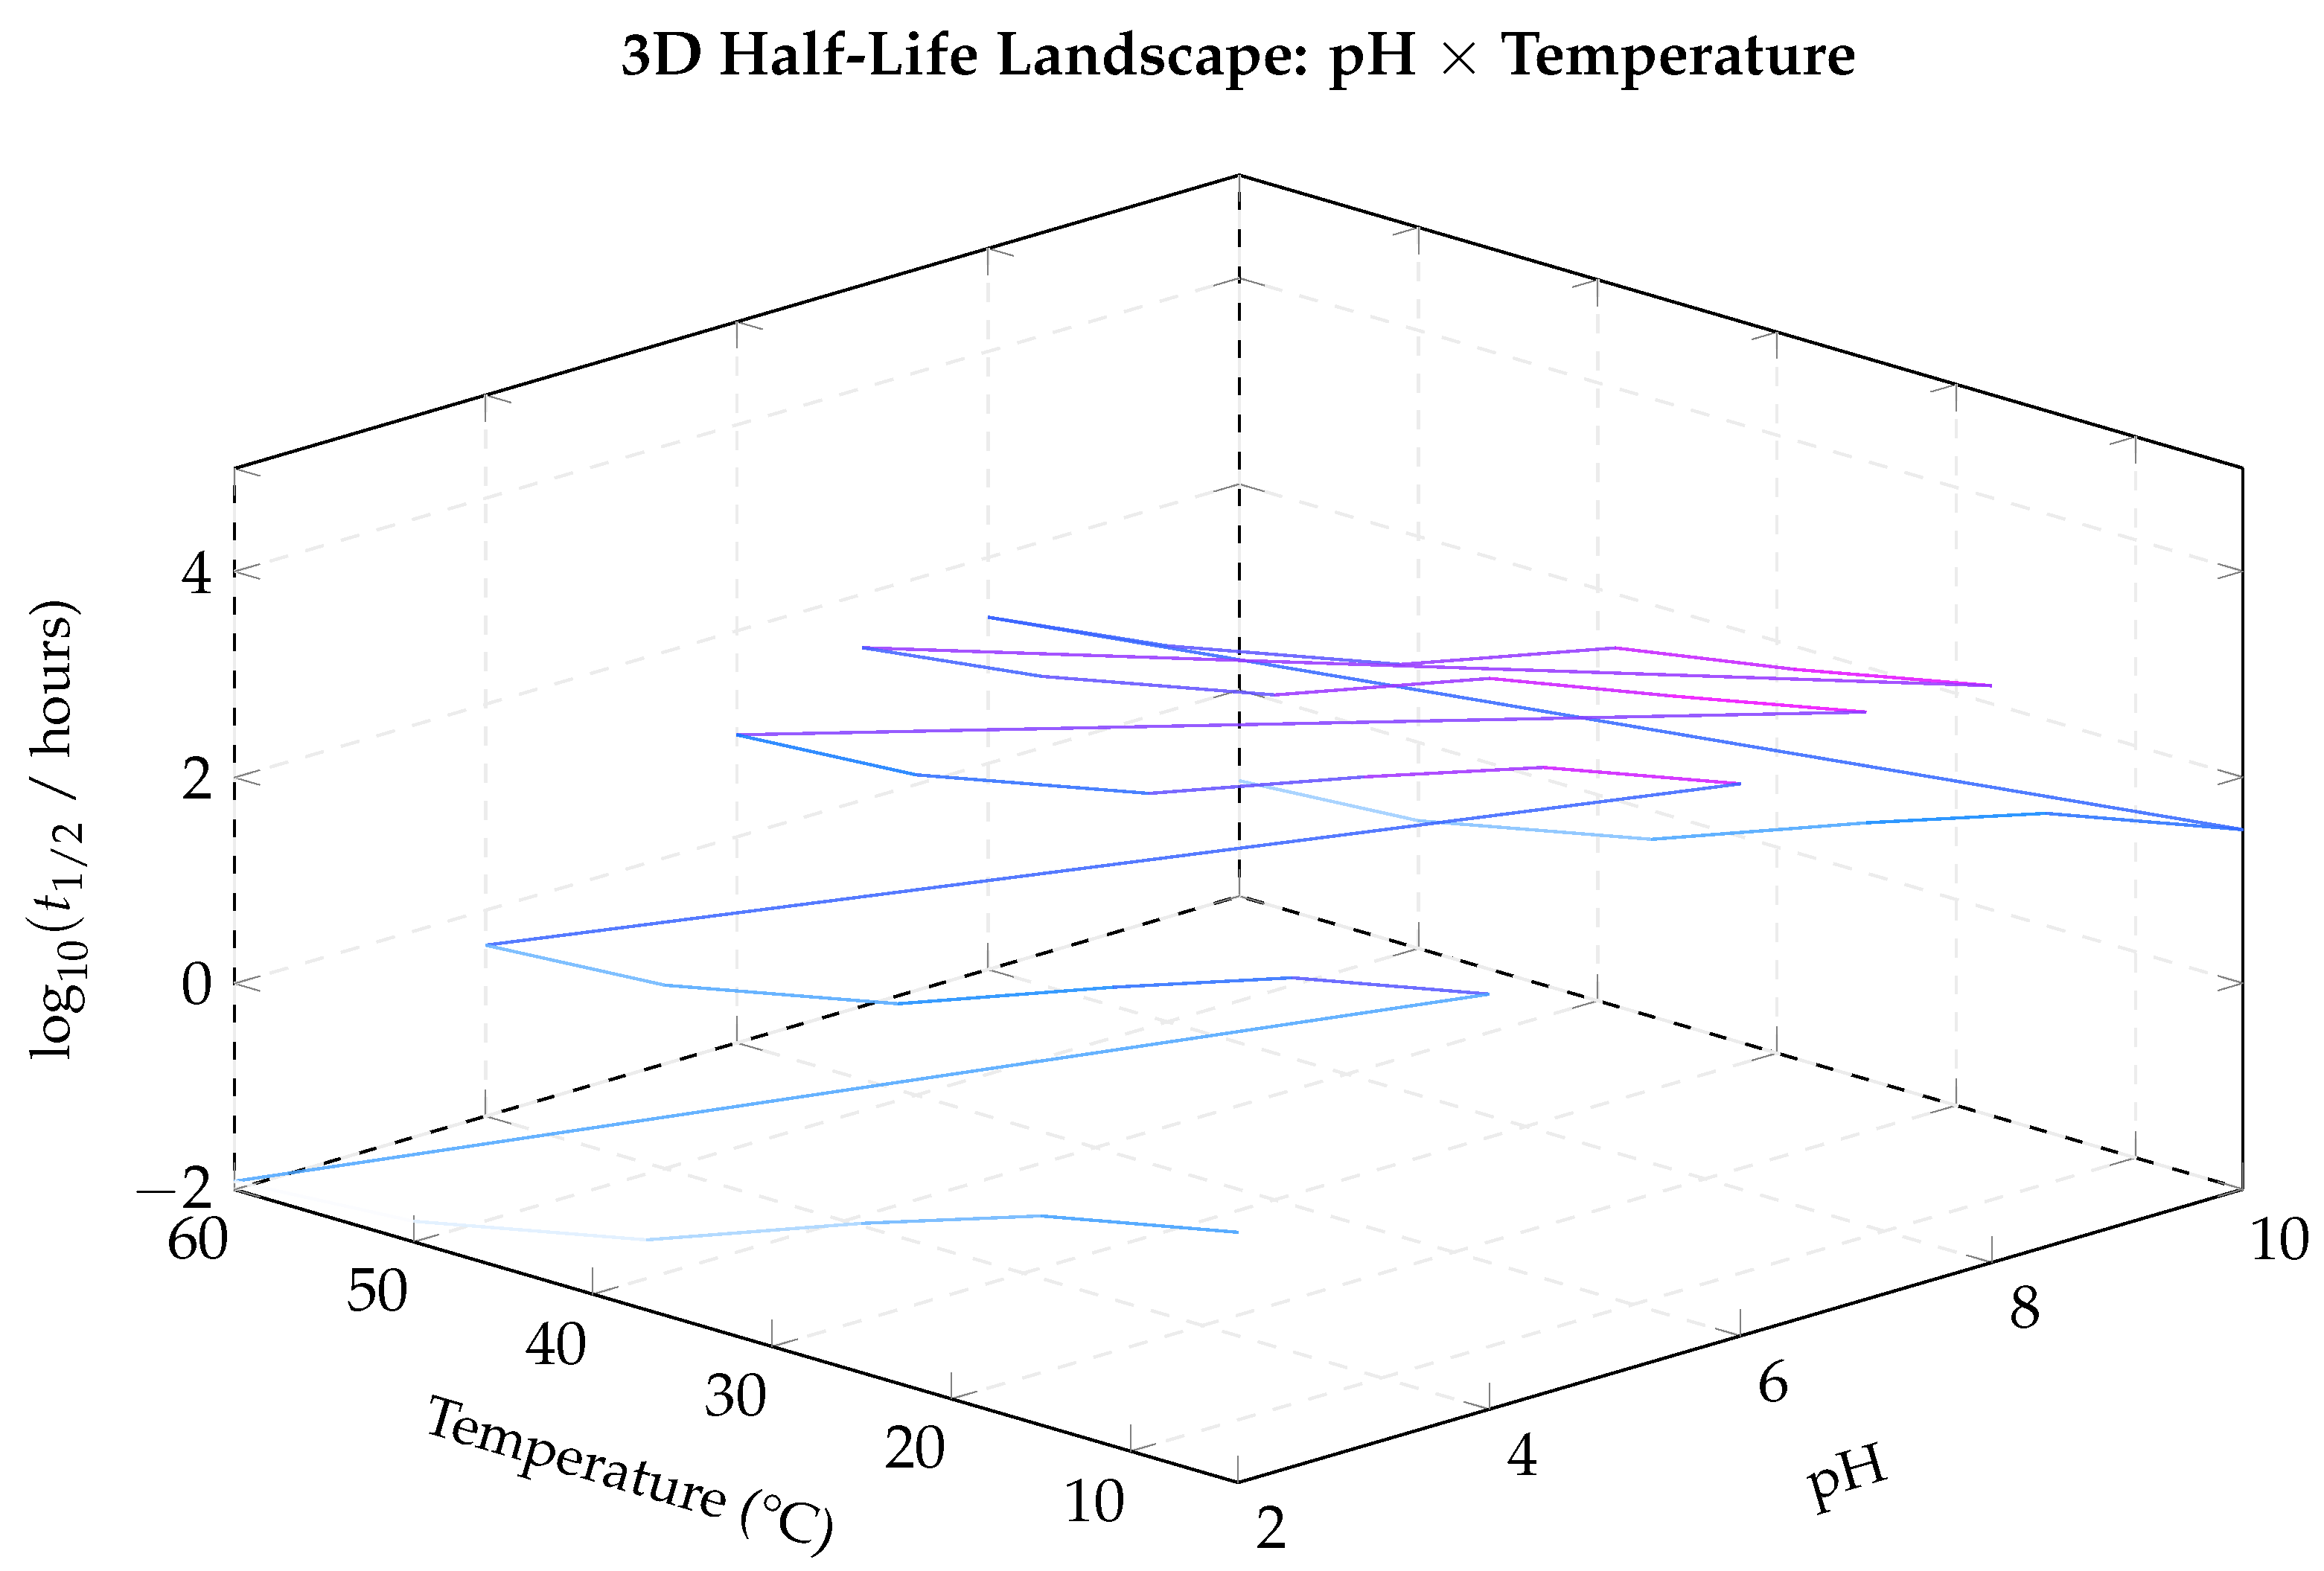
Figure 15.
Aqueous solubility at 25°C. Glucose attachment yields a 6–8-fold improvement, eliminating the dissolution bottleneck that limits conventional paracetamol formulations.
Figure 15.
Aqueous solubility at 25°C. Glucose attachment yields a 6–8-fold improvement, eliminating the dissolution bottleneck that limits conventional paracetamol formulations.
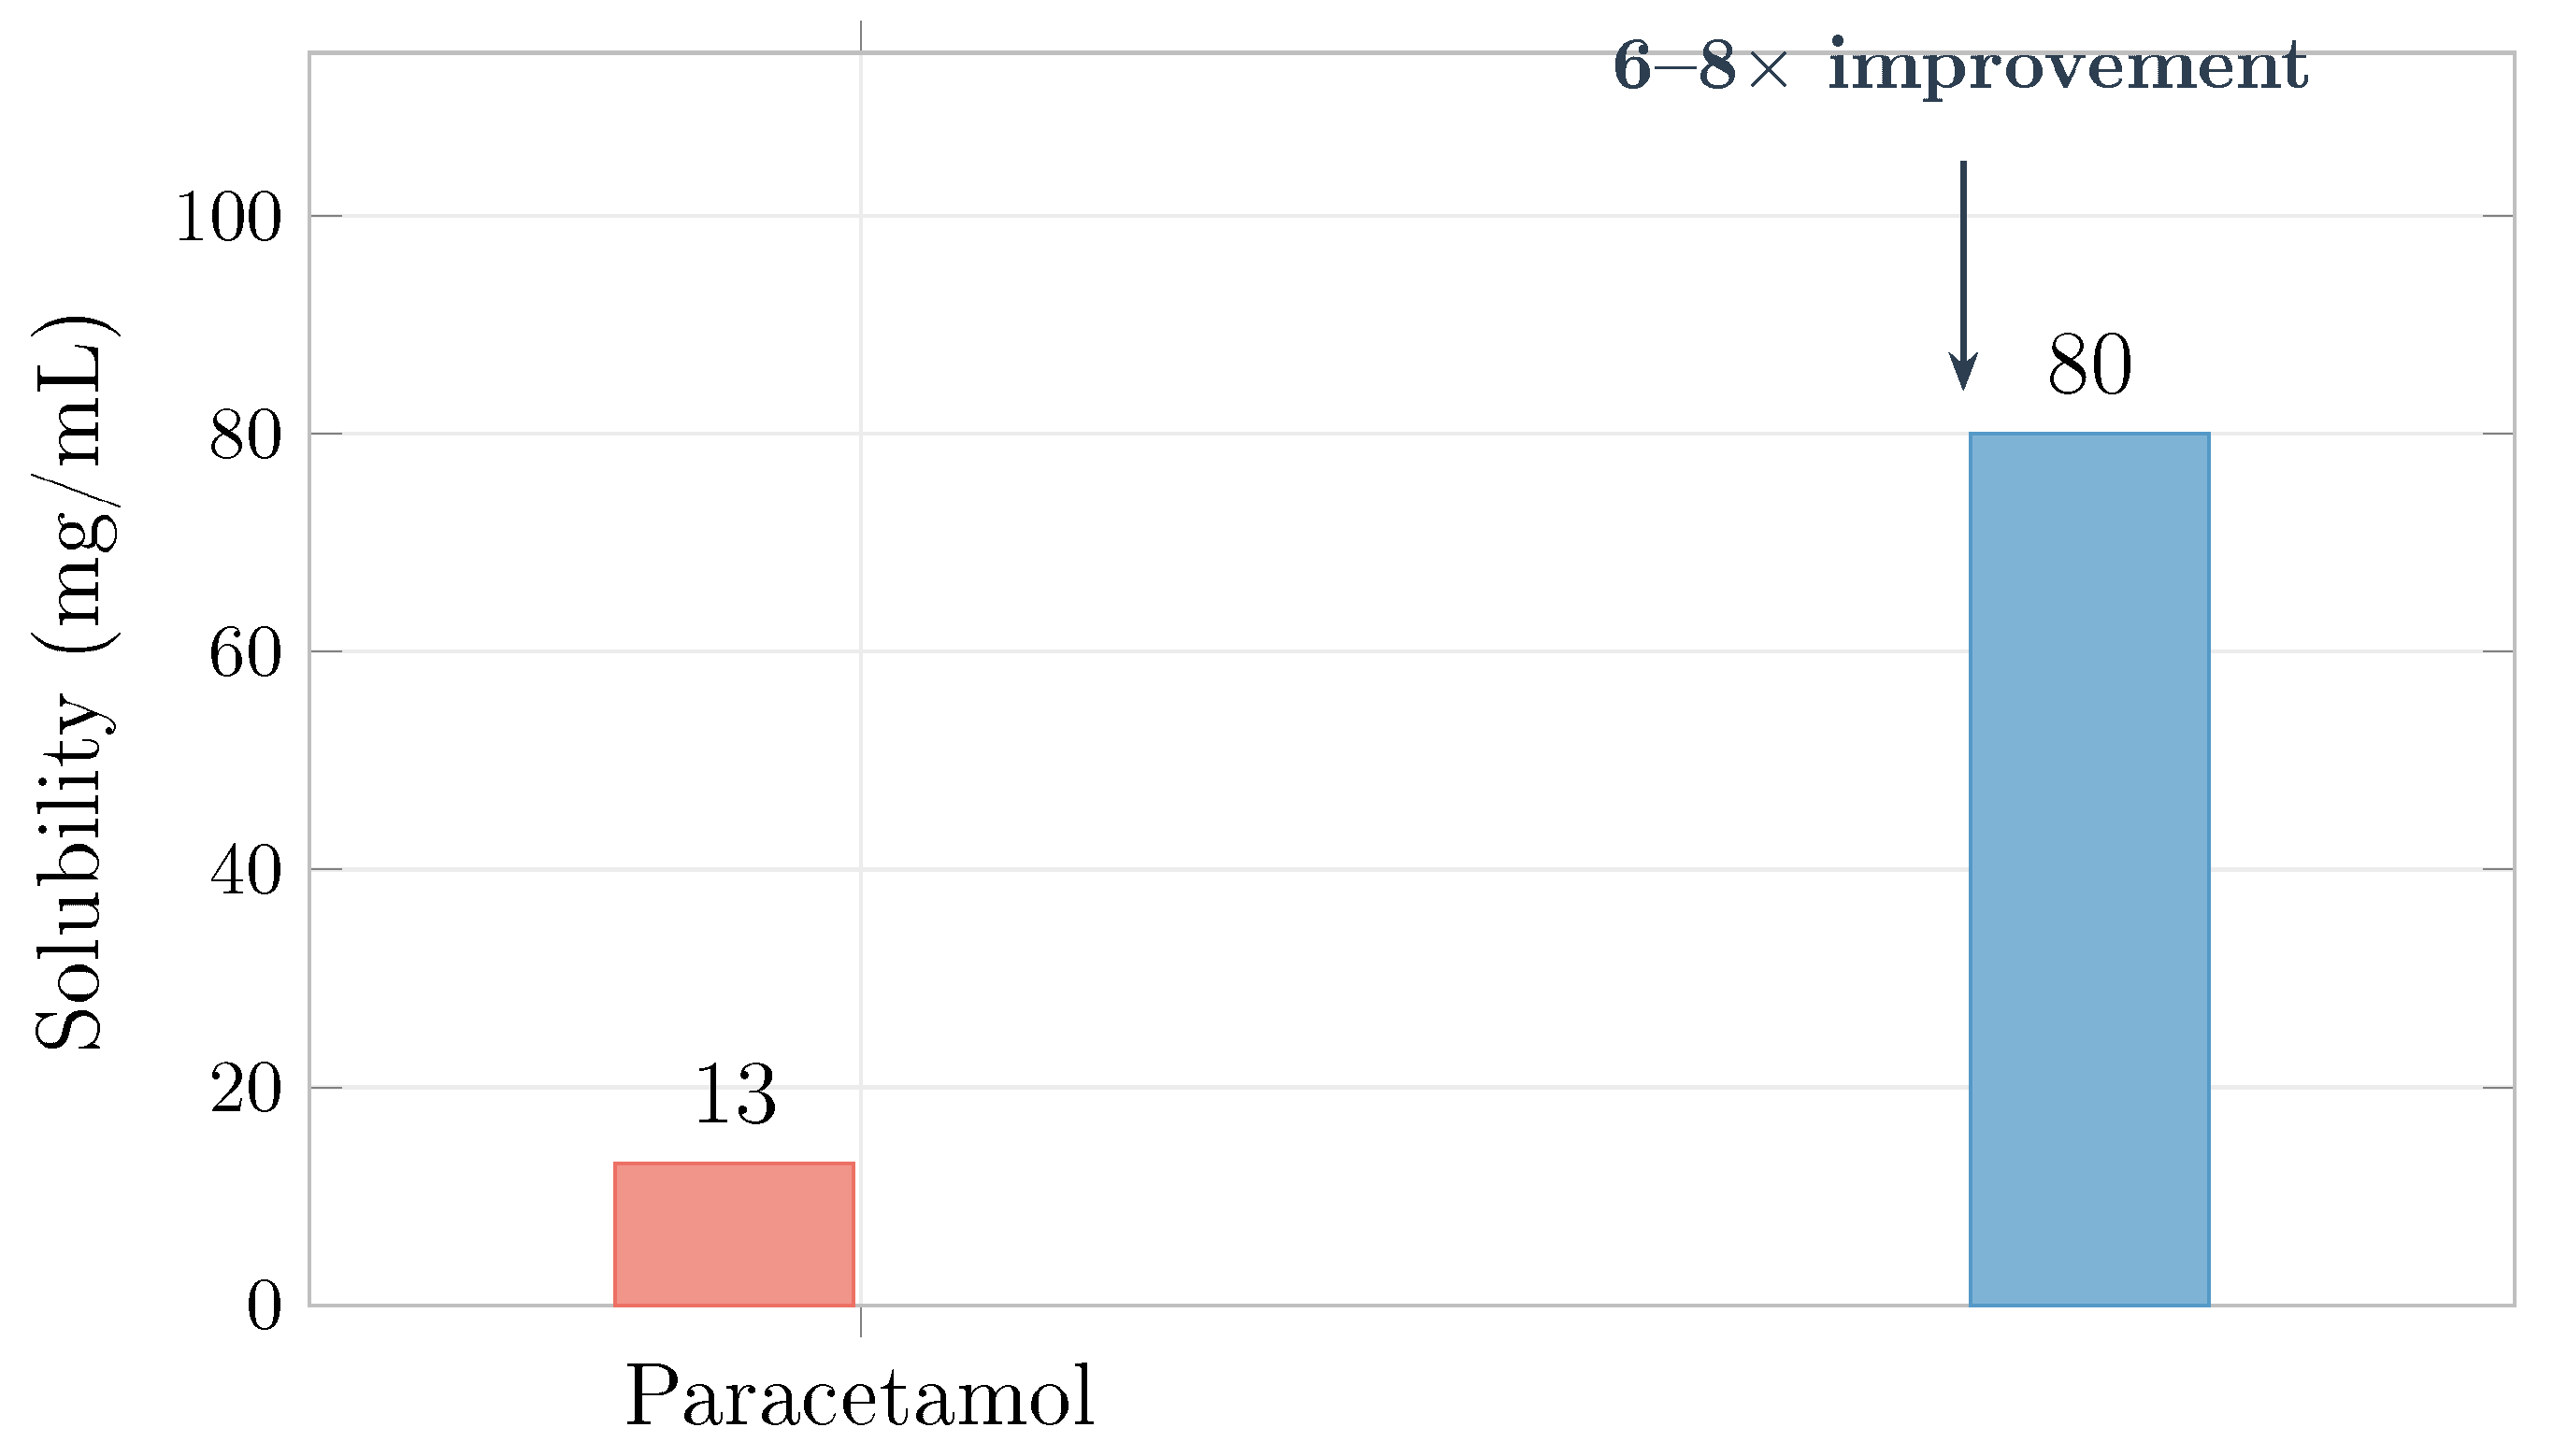
Figure 16.
Timeline to pain-relief onset (500 mg paracetamol-equivalent). Each bar decomposes into dissolution, hydrolysis, and absorption to onset. Pathway D eliminates both dissolution and hydrolysis ex vivo, achieving pain control in ∼10 min. Dashed line marks 15 min.
Figure 16.
Timeline to pain-relief onset (500 mg paracetamol-equivalent). Each bar decomposes into dissolution, hydrolysis, and absorption to onset. Pathway D eliminates both dissolution and hydrolysis ex vivo, achieving pain control in ∼10 min. Dashed line marks 15 min.
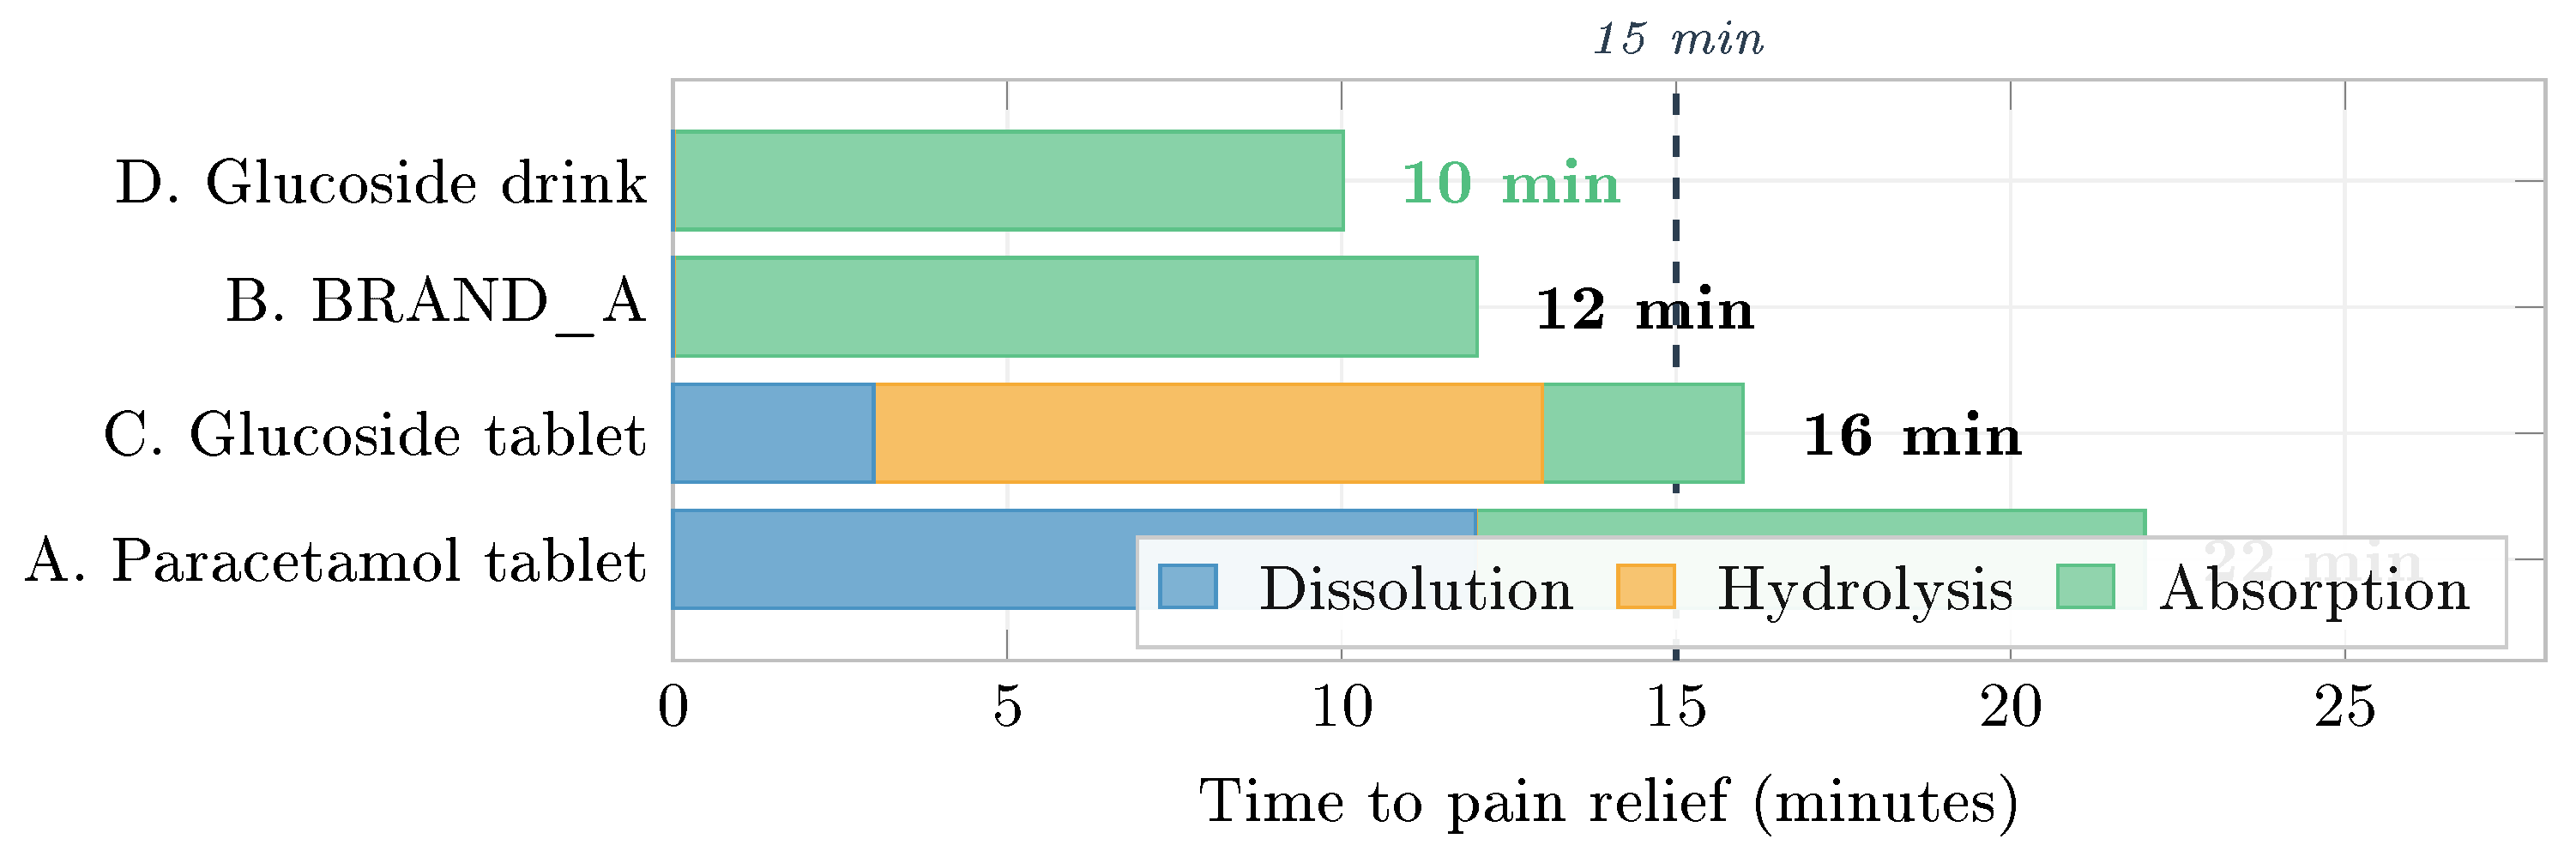
Figure 17.
Dual-action therapeutic architecture. Hydrolysis yields paracetamol (analgesic/antipyretic) and glucose (six intrinsic therapeutic benefits). Unlike conventional formulations where sugar is an optional excipient, glucose is a stoichiometric product of prodrug activation.
Figure 17.
Dual-action therapeutic architecture. Hydrolysis yields paracetamol (analgesic/antipyretic) and glucose (six intrinsic therapeutic benefits). Unlike conventional formulations where sugar is an optional excipient, glucose is a stoichiometric product of prodrug activation.
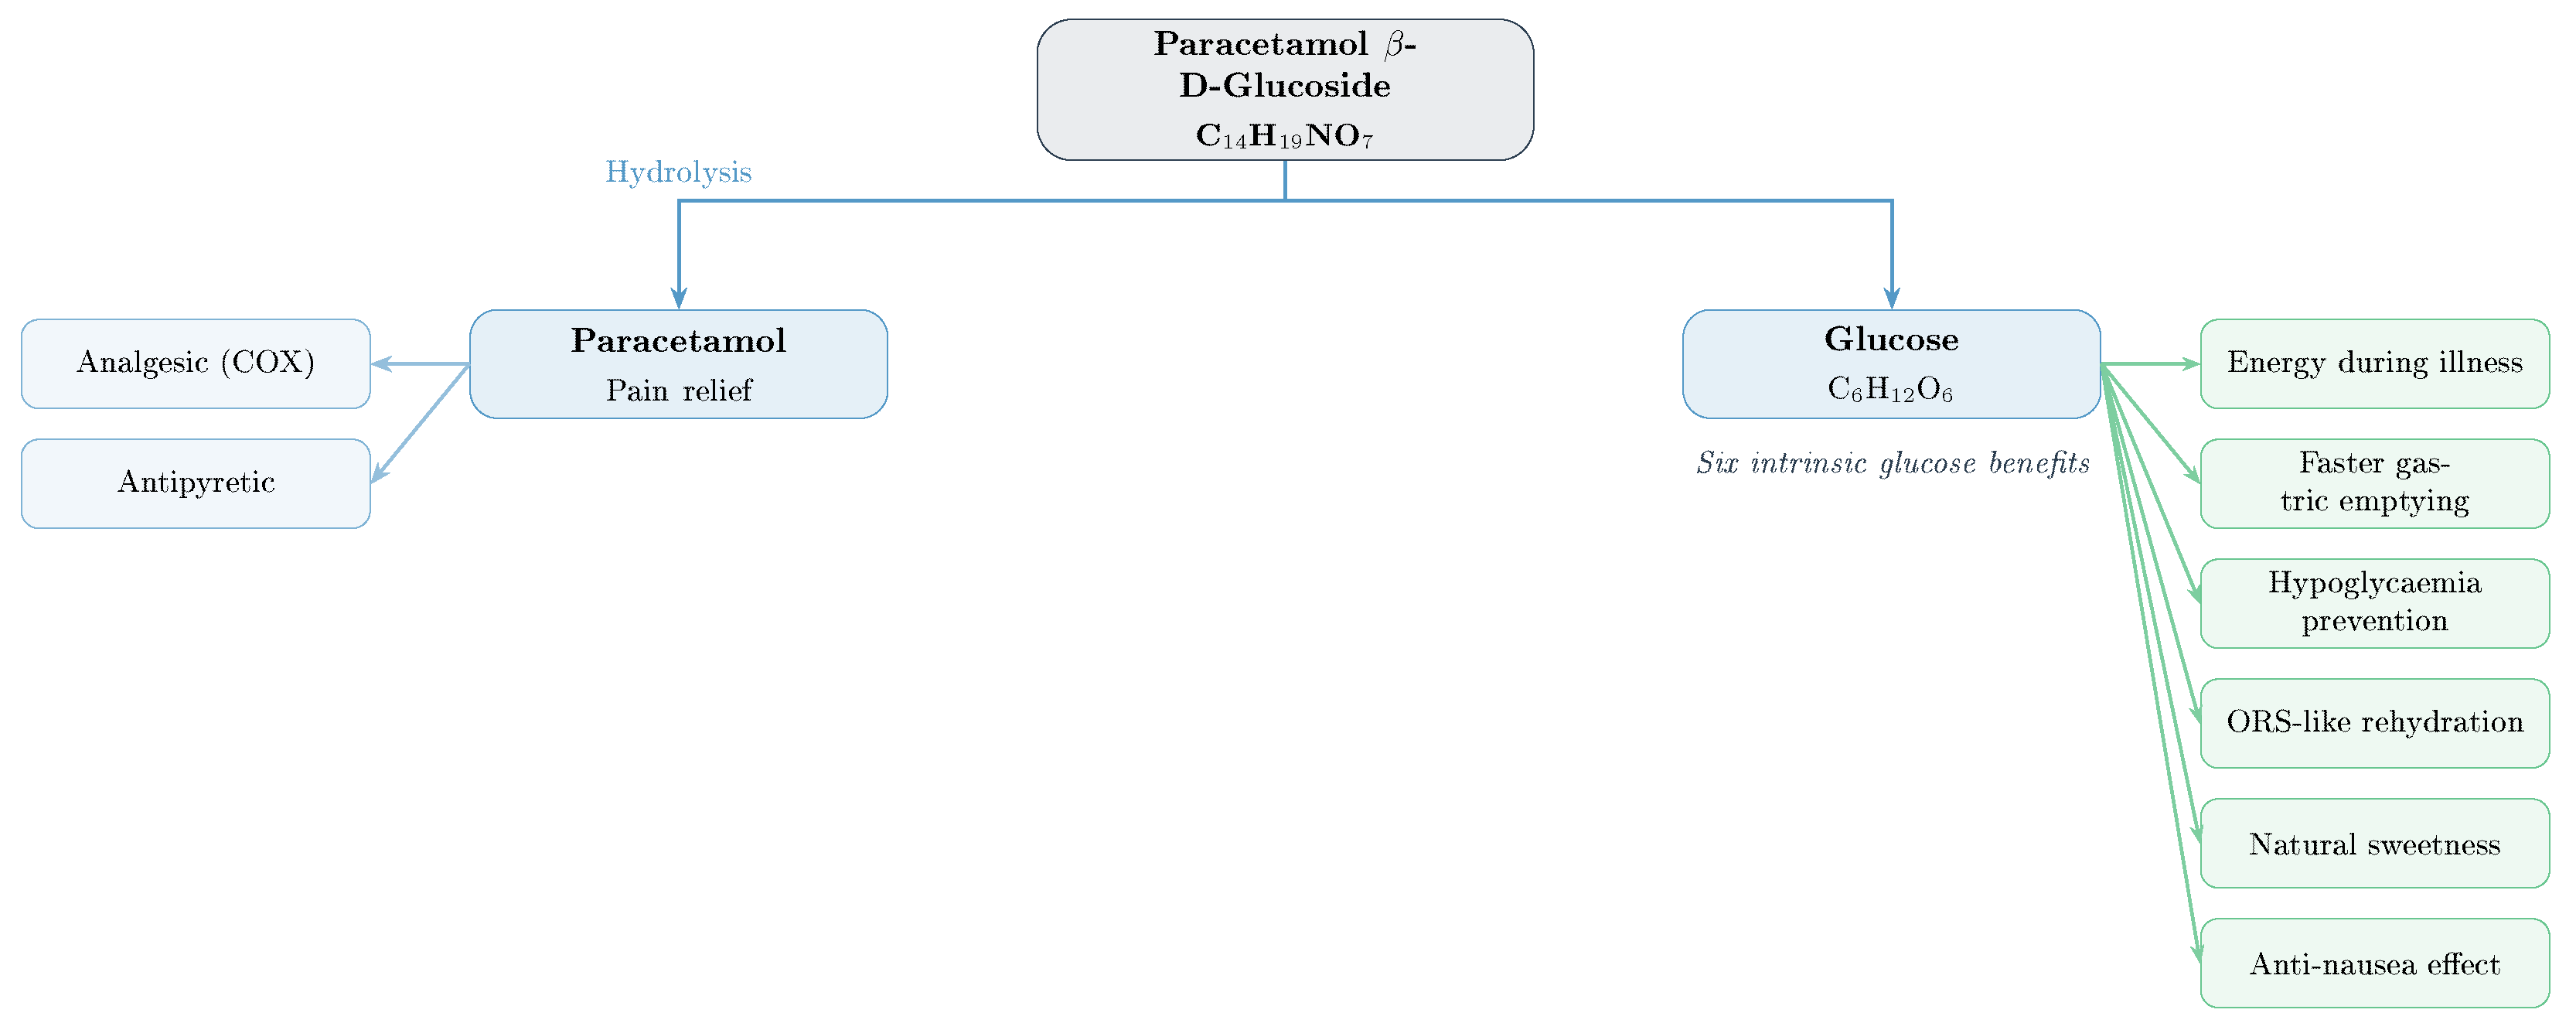
Figure 18.
Schematic plasma concentration–time profiles at 500 mg paracetamol-equivalent dose (illustrative; clinical validation pending). The shaded red zone above 48 a.u. represents the region where NAPQI generation may exceed glutathione (GSH) detoxification capacity. At 500 mg, Pathway D () breaches the toxicity threshold, Pathway B () approaches it, while Pathways A and C remain safely within the therapeutic window. MEC = minimum effective concentration.
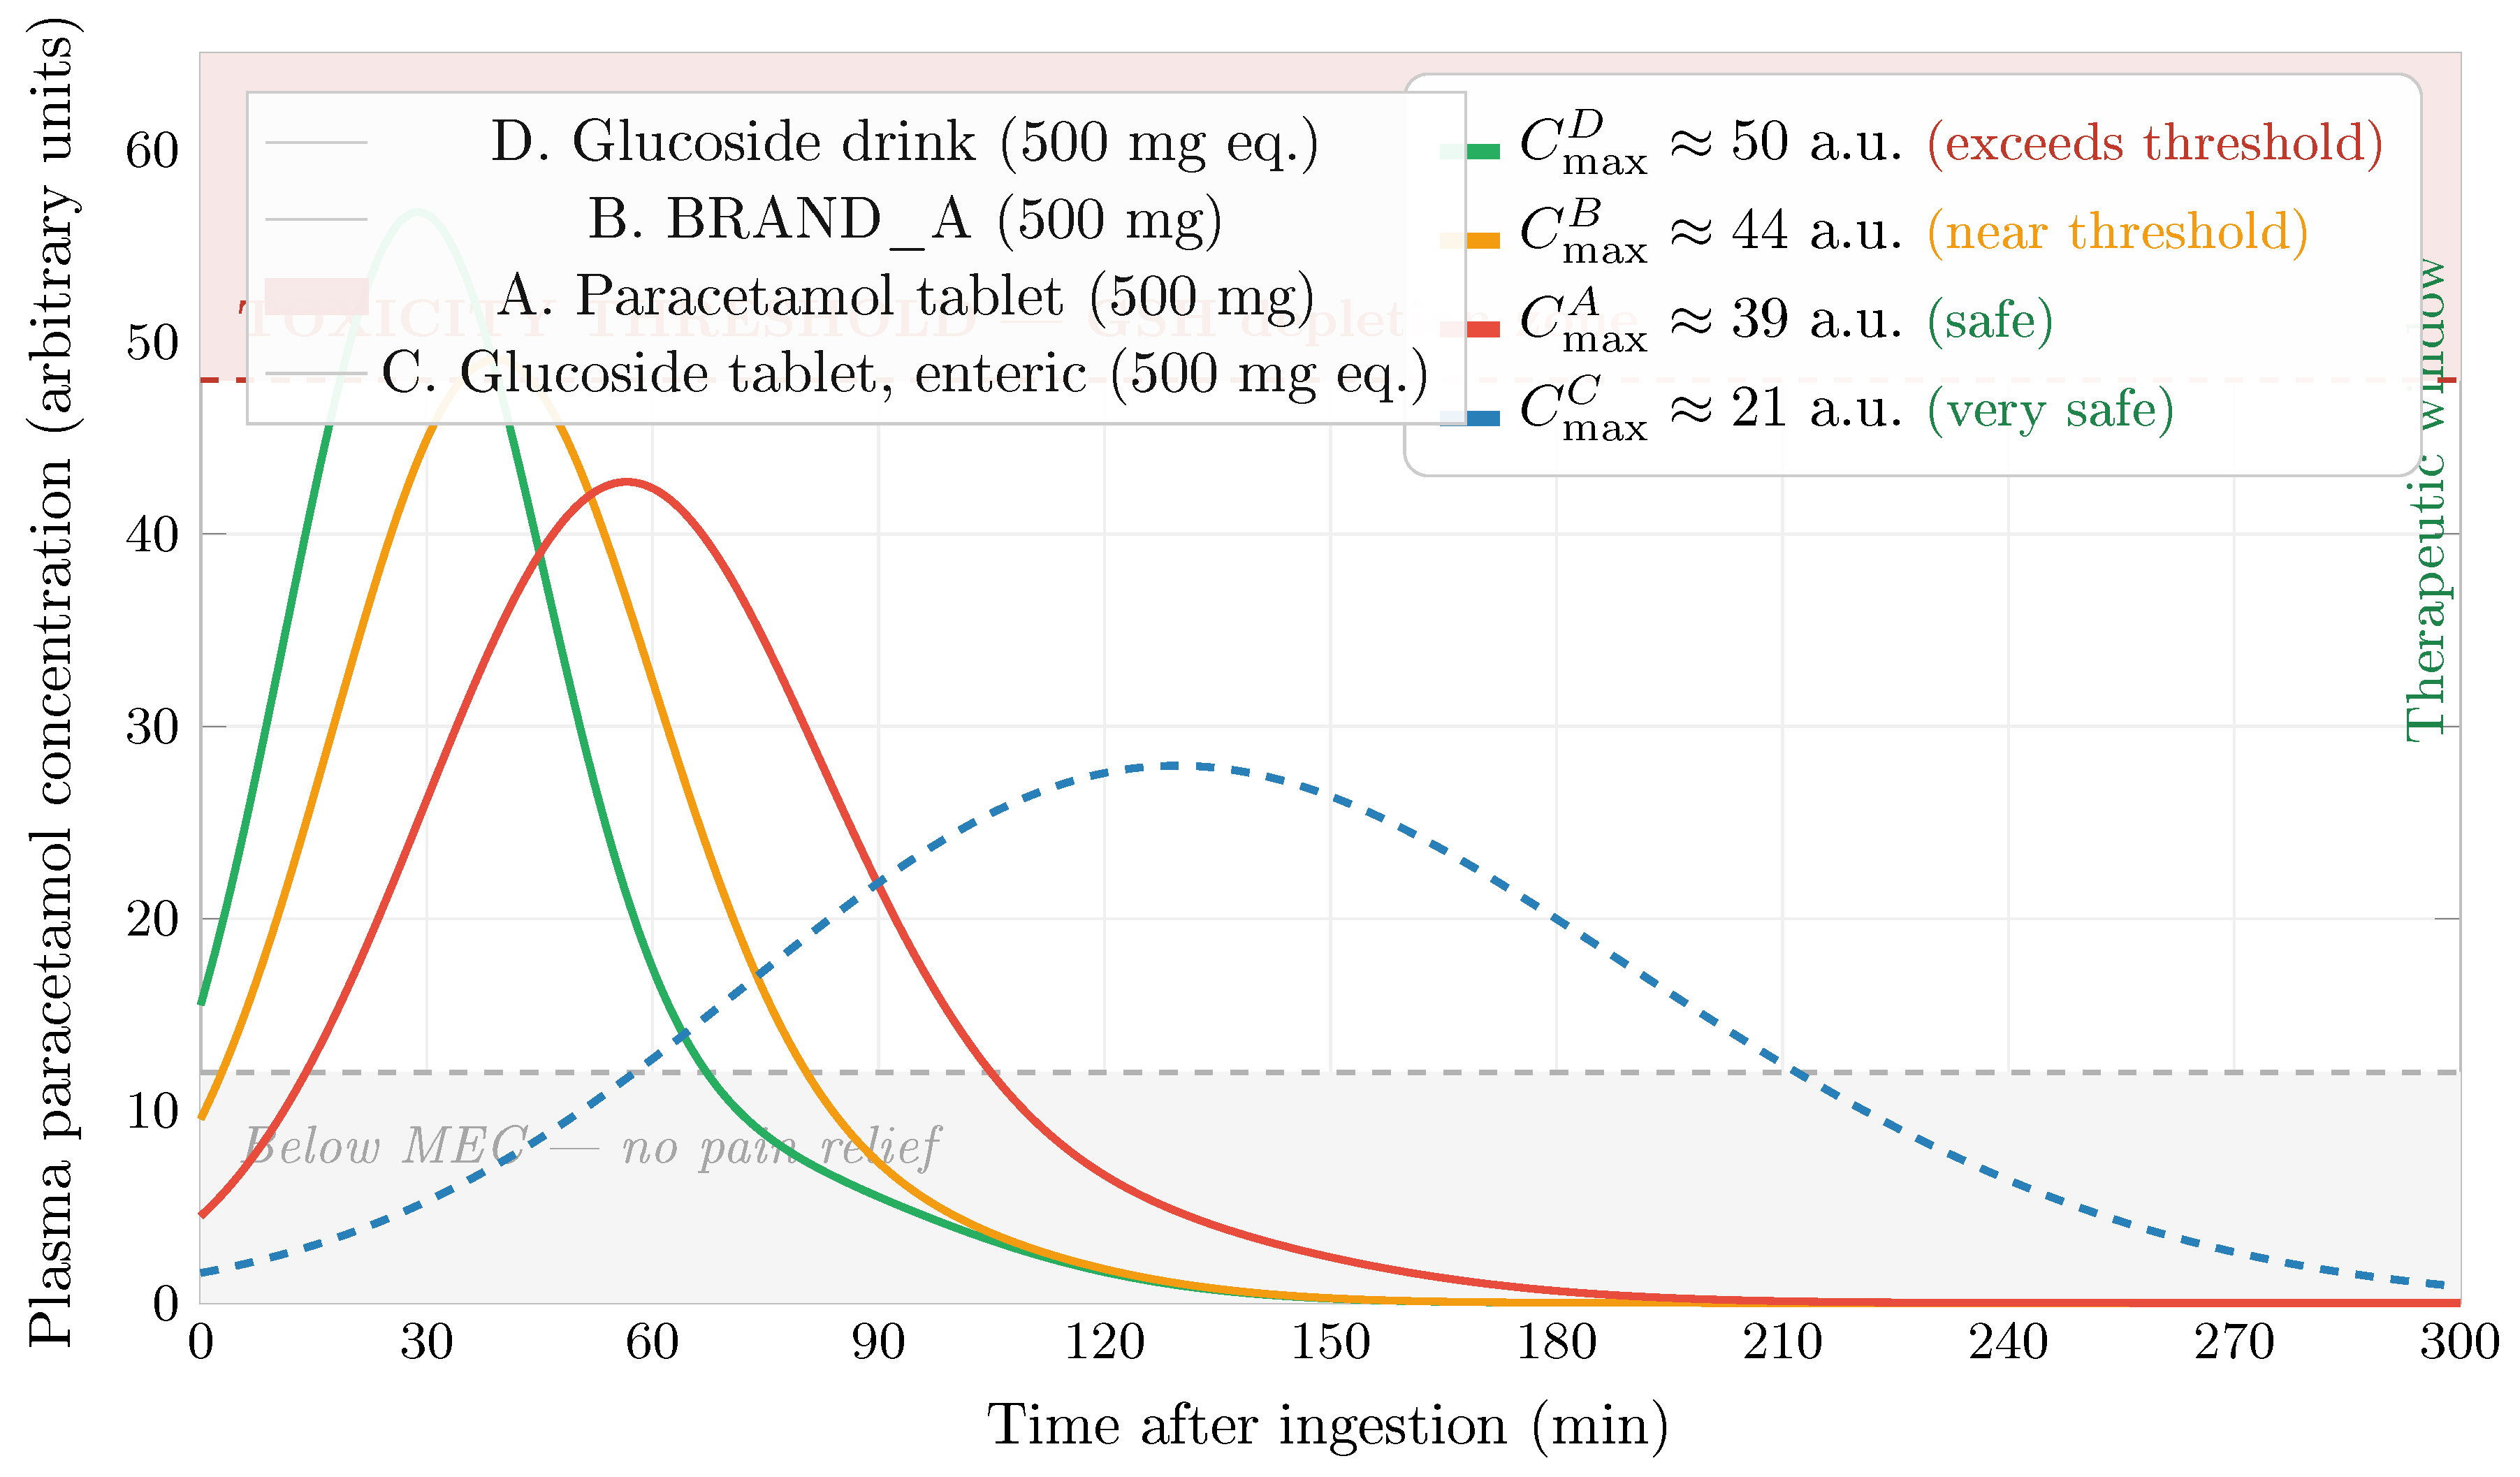
Table 1.
Aqueous solubility comparison at 25°C.
| Property | Paracetamol | Glucoside |
|---|---|---|
| Solubility (mg/mL) | 12–14 | 75–85 |
| Solubility (mM) | 79–93 | 225–256 |
| Fold improvement | 1.0× | 6–8× |
Table 2.
Pseudo-first-order rate constants and half-lives as a function of pH (25°C).
| pH | (s−1) | Half-life | Stability |
|---|---|---|---|
| 2.0 | 17 min | Very poor | |
| 3.0 | 1.75 h | Poor | |
| 4.0 | 10.7 h | Moderate | |
| 5.0 | 60 h | Good | |
| 6.0 | 227 h | Excellent | |
| 7.0 | 914 h | Excellent | |
| 7.4 | 1078 h | Excellent | |
| 8.0 | 801 h | Excellent | |
| 9.0 | 111 h | Good | |
| 10.0 | 3.1 h | Poor |
Table 3.
Temperature dependence of hydrolysis at pH 2.0.
| Temp. (°C) | (s−1) | Half-life | Q10 |
|---|---|---|---|
| 4 | 2.67 h | — | |
| 15 | 1.07 h | 2.5 | |
| 25 | 17 min | 3.8 | |
| 37 | 4.8 min | 3.5 | |
| 50 | 1.6 min | 3.0 | |
| 60 | 43 s | 2.3 |
Table 4.
Thermodynamic activation parameters (pH 2.0, acid-catalyzed hydrolysis).
| Parameter | Value | Physical meaning |
|---|---|---|
| kJ/mol | Energy input to reach transition state | |
| J/(molK) | Transition state is more ordered | |
| kJ/mol | Total energy barrier at 25°C |
Table 5.
Comparison of DFT-calculated and experimental activation parameters.
| Parameter | DFT (B3LYP) | Experimental | Deviation |
|---|---|---|---|
| (kJ/mol) | +13% | ||
| (kJ/mol) | +16% | ||
| (J/(molK)) | +12% | ||
| Bond length (C–O, TS) | 2.05 Å | — | — |
| Charge on C1 (TS) | +0.52 e | — | — |
Table 6.
Michaelis-Menten parameters for -glucosidase hydrolysis (pH 7.0, 37°C).
| Parameter | Almond enzyme | Human recombinant |
|---|---|---|
| (mM) | ||
| (mol/min/mg) | ||
| (s−1) | ||
| (M−1s−1) | ||
| Rate enhancement | -fold vs. uncatalyzed | |
Table 7.
Hydrolysis rates of structurally related glucosides (pH 2.0, 37°C).
| Compound | (M−1s−1) | Relative rate |
|---|---|---|
| Methyl -D-glucoside | 0.24 | |
| 4-Methoxyphenol glucoside | 0.42 | |
| Paracetamol glucoside | 1.00 | |
| Phenol glucoside | 1.24 | |
| 4-Nitrophenol glucoside | 5.00 |
Table 9.
Regulatory compliance mapping for paracetamol -D-glucoside development.
| Standard | Scope | Application in this study |
|---|---|---|
| ICH Q1A(R2) | Stability testing of new drug substances | Long-term (25°C/60% RH, 12 mo), intermediate (30°C/65% RH, 6 mo), and accelerated (40°C/75% RH, 6 mo) conditions applied |
| ICH Q1B | Photostability testing | UV-A/visible light exposure at 1.2 million luxh applied; amber packaging recommended |
| ICH Q2(R1) | Analytical method validation | HPLC method validated for specificity, linearity (), accuracy (98–102%), precision (RSD < 2%), LOD, LOQ |
| ICH Q3B(R2) | Impurities in new drug products | Individual impurities < 0.5%; total impurities < 1.0% |
| ICH Q6A | Specifications for new drug substances | Acceptance criteria defined: assay 90–110%, degradation products, water content, pH, microbial limits |
| ICH Q8(R2) | Pharmaceutical development | Quality-by-design approach applied to formulation optimisation |
| ICH Q9 | Quality risk management | Risk assessment for pH-sensitive degradation and cold-chain failures |
| ICH Q10 | Pharmaceutical quality system | Stability monitoring integrated into quality system framework |
Table 10.
ICH Q1A(R2) stability study design with sampling schedule.
| Study type | Temperature | Humidity | Duration | Sampling points |
|---|---|---|---|---|
| Long-term | 25 ± 2°C | 60 ± 5% RH | 12 months | 0, 3, 6, 9, 12 mo |
| Intermediate | 30 ± 2°C | 65 ± 5% RH | 6 months | 0, 3, 6 mo |
| Accelerated | 40 ± 2°C | 75 ± 5% RH | 6 months | 0, 1, 2, 3, 6 mo |
Table 11.
HPLC analytical method validation summary per ICH Q2(R1).
| Validation parameter | Criterion | Result |
|---|---|---|
| Specificity | Baseline resolution from degradants | Achieved () |
| Linearity range | 10–200% of target | |
| Accuracy (recovery) | 98–102% | 99.3–101.1% |
| Precision (intra-day) | RSD < 2% | RSD = 0.8% |
| Precision (inter-day) | RSD < 2% | RSD = 1.2% |
| LOD | — | 0.1 g/mL |
| LOQ | — | 0.3 g/mL |
| Robustness | ±2% organic, ±0.2 pH | Meets criteria |
Table 12.
Pharmacopoeial compliance assessment.
| Pharmacopoeia | Applicable test | Status and notes |
|---|---|---|
| USP 〈1225〉 | Method validation | HPLC method meets all USP requirements for specificity, linearity, accuracy, and precision |
| USP 〈621〉 | Chromatography | C18 method compliant with system suitability criteria (, 0.8–1.5) |
| USP 〈1150〉 | Pharmaceutical stability | Stability-indicating method confirmed by forced degradation |
| BP Appendix XII | Stability testing | Conditions and acceptance criteria aligned with BP requirements |
| Ph. Eur. 2.2.29 | UV/Vis spectrophotometry | nm confirmed; Beer-Lambert linear range validated |
| Ph. Eur. 5.4 | Residual solvents | Pyridine (Class 2): limit 200 ppm; ethanol (Class 3): limit 5000 ppm |
Table 14.
Forced degradation study results and mass balance.
| Stress | Conditions | Duration | Degradation | Mass balance | Products identified |
|---|---|---|---|---|---|
| Acid | pH 2.0, 37°C | 2 h | 28% | 97.3% | Paracetamol + glucose |
| Base | pH 10.0, 37°C | 24 h | 22% | 96.8% | Paracetamol + glucose |
| Heat | 60°C, dry | 7 d | 15% | 98.1% | Paracetamol + glucose |
| Oxidation | 3% H2O2, RT | 24 h | 8% | 95.2% | Quinone derivatives |
| Light | 1.2M luxh | 7 d | 5% | 97.9% | Minor coloured products |
Table 17.
Definitions of the four oral delivery pathways analysed.
| Path | Description | Commercial analogue | Formulation type |
|---|---|---|---|
| A | Conventional paracetamol solid tablet swallowed with water | Pana_Brand_B, Tyl_Brand_C | Standard compressed tablet |
| B | Paracetamol powder pre-dissolved in hot water before ingestion | BRAND_A | Sachet / powder for solution |
| C | Paracetamol -D-glucoside uncoated tablet swallowed with water | Research prodrug (tablet) | Uncoated compressed tablet |
| D | Paracetamol -D-glucoside sachet dissolved in hot acidified water; hydrolysis occurs ex vivo in the cup | Research prodrug (drink) | Sachet with citric acid |
Table 18.
Stage-by-stage comparison of the four oral delivery pathways. Shading indicates relative speed: fastest, moderate, slowest.
Table 18.
Stage-by-stage comparison of the four oral delivery pathways. Shading indicates relative speed: fastest, moderate, slowest.
| Stage | A. Tablet | B. BRAND_A | C. Glucoside tablet | D. Glucoside drink |
|---|---|---|---|---|
| State before ingestion |
Solid tablet | Paracetamol in solution | Solid tablet | Paracetamol + glucose in solution |
| Dissolution in gastric fluid |
Slow: 8–15 min | Already done | Fast: 2–5 min | Already done |
| Conversion to active drug |
Not required | Not required | min | Already done |
| Drug state at absorption site |
Gradually dissolving | Full solution | Solution after hydrolysis | Full solution |
| Glucose co-delivery |
None | Nonea | Released in stomach | Pre-released |
| a Unless sugar is added as an excipient — not intrinsic to the chemistry. | ||||
Table 19.
Estimated onset of pain relief for each delivery pathway at a 500 mg paracetamol-equivalent dose.
Table 19.
Estimated onset of pain relief for each delivery pathway at a 500 mg paracetamol-equivalent dose.
| Path | Pathway | Dissolution (min) |
Conversion (min) |
Est. onset (min) |
Rank |
|---|---|---|---|---|---|
| A | Paracetamol tablet | 12 | 0 | 22 | 4th |
| B | BRAND_A (pre-dissolved) | 0 | 0 | 12 | 2nd |
| C | Glucoside tablet | 3 | 10 | 16 | 3rd |
| D | Glucoside drink | 0 | 0 | 10 | 1st |
Table 20.
Stoichiometric glucose yield from paracetamol -D-glucoside hydrolysis at standard dose equivalents.
Table 20.
Stoichiometric glucose yield from paracetamol -D-glucoside hydrolysis at standard dose equivalents.
| Paracetamol dose (mg) |
Glucoside required (mg) |
Glucose released (mg) |
Caloric content |
|---|---|---|---|
| 250 | 548 | 298 | ∼1.2 kcal |
| 500 | 1096 | 596 | ∼2.4 kcal |
| 1000 | 2192 | 1192 | ∼4.8 kcal |
Table 21.
BRAND_A vs. glucoside drink: intrinsic vs. extrinsic formulation components.
| Component | B. BRAND_A | D. Glucoside drink |
|---|---|---|
| Active drug | Added as powder | Released from prodrug✓ |
| Sweetness | Artificial (aspartame / sucralose) | Glucose from hydrolysis✓ |
| Energy provision | Not intrinsically provided | Glucose (∼0.3–0.6 g/dose)✓ |
| Flavour | Synthetic lemon flavour | Citric acid as catalyst and flavour✓ |
| Rehydration | Water only | Glucose-enhanced absorption (ORS)✓ |
| Artificial additives | Required | Minimal |
| Molecular efficiency | 1 molecule = 1 function | 1 molecule = drug + energy + sweetness + rehydration |
Table 22.
Comprehensive property comparison across all four delivery pathways. Scores on a 1–5 scale (5 = best). Bold indicates the best score in each row.
Table 22.
Comprehensive property comparison across all four delivery pathways. Scores on a 1–5 scale (5 = best). Bold indicates the best score in each row.
| Property | A. Tablet | B. BRAND_A | C. Gluc. tab. | D. Gluc. drink |
|---|---|---|---|---|
| Speed of onset | 2 | 4 | 3 | 5 |
| Energy co-delivery | 1 | 1 | 3 | 5 |
| Rehydration support | 1 | 3 | 1 | 5 |
| Nausea tolerance | 2 | 3 | 2 | 4 |
| Palatability | 2 | 3 | 2 | 5 |
| Child-friendliness | 1 | 3 | 1 | 5 |
| Convenience | 5 | 2 | 5 | 2 |
| Injectable potential | 1 | 1 | 3 | 4 |
| Controlled release | 1 | 1 | 5 | 1 |
| Shelf life | 5 | 4a | 3 | 4b |
| Simplicity | 5 | 3 | 4 | 3 |
| Cost | 5 | 4 | 3 | 3 |
| Total score | 31 | 32 | 35 | 46 |
| aBRAND_A sachet shelf life; must be dissolved fresh. bGlucoside sachet: 2–3 years solid shelf life; dissolved fresh before use. | ||||
Table 23.
Recommended dosage adjustments to maintain a.u. (20% safety margin below the toxicity threshold) for each pathway at a 500 mg reference dose.
Table 23.
Recommended dosage adjustments to maintain a.u. (20% safety margin below the toxicity threshold) for each pathway at a 500 mg reference dose.
| Path | Pathway | Standard dose (mg) |
(a.u.) |
Adjusted dose (mg) |
Safety margin |
|---|---|---|---|---|---|
| D | Glucoside drink | 500 | 50 | 380 | 20% |
| B | BRAND_A | 500 | 44 | 430 | 20% |
| A | Paracetamol tablet | 500 | 39 | 490 | 20% |
| C | Glucoside (enteric) | 500 | 21 | 500 | >56% |
Table 24.
Recommended dosing framework for each delivery pathway at the 500 mg dose level, balancing efficacy, speed, and hepatic safety.
Table 24.
Recommended dosing framework for each delivery pathway at the 500 mg dose level, balancing efficacy, speed, and hepatic safety.
| Path | Pathway | Recommended dose (mg) |
Est. onset (min) |
Best suited for |
|---|---|---|---|---|
| D | Glucoside drink | 380 | ∼10 | Acute flu/fever; rapid relief |
| B | BRAND_A | 430 | ∼12 | Home cold/flu management |
| A | Paracetamol tablet | 500a | ∼22 | Standard pain, portability |
| C | Glucoside (enteric) | 500 | ∼60 | Hepatic-risk; sustained release; colonic targeting |
| aReduce to 250 mg in patients with compromised hepatic glutathione reserves (chronic alcohol use, malnutrition, hepatic impairment). | ||||
Table 25.
Clinical scenario–pathway mapping. The glucoside platform (Pathways C and D) covers the widest range of clinical needs.
Table 25.
Clinical scenario–pathway mapping. The glucoside platform (Pathways C and D) covers the widest range of clinical needs.
| Clinical scenario | Optimal | Rationale |
|---|---|---|
| Acute pain + flu symptoms | D | Fastest onset at 380 mg; glucose energy and rehydration |
| Fast relief on the go | C | Portable tablet, faster dissolution than conventional |
| Standard mild pain | A | Proven, lowest cost, widest availability |
| Paediatric fever | D | Sweet taste, glucose energy, easy to drink, rehydration |
| Elderly / poor appetite | D | Energy provision, rehydration, nausea reduction |
| High-dose IV / injectable | C/D | 6–8× solubility enables concentrated solutions |
| Hepatotoxicity-risk patients | C | Gradual release; at <44% of threshold |
| Colonic-targeted delivery | C | -glucosidase in colonic bacteria |
| Sustained-release regimens | C | Flat plasma profile over extended duration |
Disclaimer/Publisher’s Note: The statements, opinions and data contained in all publications are solely those of the individual author(s) and contributor(s) and not of MDPI and/or the editor(s). MDPI and/or the editor(s) disclaim responsibility for any injury to people or property resulting from any ideas, methods, instructions or products referred to in the content. |
© 2026 by the authors. Licensee MDPI, Basel, Switzerland. This article is an open access article distributed under the terms and conditions of the Creative Commons Attribution (CC BY) license (http://creativecommons.org/licenses/by/4.0/).
Copyright: This open access article is published under a Creative Commons CC BY 4.0 license, which permit the free download, distribution, and reuse, provided that the author and preprint are cited in any reuse.


