Submitted:
16 February 2026
Posted:
28 February 2026
You are already at the latest version
Abstract
Background/Objectives: Advanced Glycation End Products (AGEs) are the end products of the Maillard reaction, derived from reduced sugars and proteins, lipids or DNA. AGEs accumulate in dermal collagen and elastin, causing several changes: skin stiffening and loss of elasticity, stimulation of inflammation and the result of accelerated photo- and chronological aging, manifested by skin yellowing, wrinkles, and dryness. High Fre-quency Ultrasound (HFU) offers precise and non-invasive assessments of structural and inflammatory changes in the skin: it measures the thickness of the epidermis and dermis, echogenicity and the hypoechoic band under the epidermis. The aim of the study is to correlate AGEs levels in biological fluids with ultrasonographic measurements of sun-exposed skin and non-sun-exposed tissue. Methods: Patients (N=113) were enrolled and demographic, clinical, and anthropometric measurements were recorded: age, gender, body mass index (BMI), waist circumference, and Fitzpatrick skin type. Venous blood, urine and salivary samples were harvested. The following AGEs were assessed in biological fluids (plasma, saliva, urine): Fruc-tose-Lysine, Pyridine, Methyl-Glyoxal-H1, Carboxyethyl-lysine, Carboxymethyllysine, Arginine, Lysine. The tissue glycation process of collagen fibers was indirectly evaluated with a 22 MHz HFU ultrasound device (DUB cutis, Taberna Pro Medicum, Lüneburg, Germany). The assessment was performed on sun-exposed skin (left zygomatic area) and on non-sun-exposed tissue (non-keratinized mucosa of the lower lip). For the sun-exposed skin of the zygomatic area, including the epidermis, dermis, and subcuta-neous tissue (hypodermis), tissue depth (thickness), pixel count (px), and density (au-tomatic) were recorded. The non-sun-exposed tissue examined was the oral mucosa on the inner surface of the lower lip including the non-keratinized epithelium, lamina propria, and submucosa. Results: The study evidences a weak positive correlation between UV exposed dermis collagen and serum Pyr, salivary MG-H1, salivary Arg and salivary Lys. Between bio-fluid AGEs and the degree of pixelation of dermal collagen exposed to UV rays, we determined weak direct correlations with salivary MG-H1 and salivary CML. Significant indirect weak and medium correlations were found between dermal collagen density affected by UV exposure with serum CEL, Arg, Lys, weak direct correlation with sali-vary MG-H1 and salivary CML. Regarding the density of the dermis affected by UV exposure, we found a weak indirect correlation with salivary FruLys, MG-H1, CML and Lys . Conclusions: HFU ultrasound assessment revealed structural changes in the cervi-co-facial dermis, which were associated with increased AGEs, suggesting that gly-cation-induced tissue remodeling can be detected non-invasively. This data obtained might be the based for future studies on the clinical utility of the combined assessment of AGEs and skin changes by HFU as modern, rapid and non-invasive tools to identify patients at increased cardiovascular risk.
Keywords:
skin
; UV exposure
; glycation products
; high frequency ultrasound
1. Introduction
Health is defined as a state of physical, mental, and social well-being and not merely the absence of disease or infirmity [1]. The global population is continuously aging, and most adult patients experience the second stage of life accompanied by associated pathology and disability Although the decline in physiological resources is associated with the aging process, frailty brings with it an acceleration of the decline, and homeostasis mechanisms no longer react within appropriate parameters. However, in the presence of comorbidities, reduced physical activity, unbalanced dietary intake, and a precarious economic status, the risks of imbalance are higher.
Advanced Glycation End Products (AGEs) are the end products of the Maillard reaction, derived from reduced sugars and proteins, lipids or DNA [2]. In MS, chronic hyperglycemia and oxidative stress accelerate the generation of reactive dicarbonyls (e.g. methylglycoxal H1- MG) that are converted into AGEs [1,2]. AGEs such as carboxy-methyl-lysine (CML), carboxy-ethyl-lysine (CEL), fructose-lysine (Fru-Lys), pyridine (Pyr), arginine (Arg) are involved in tissue stiffening, inflammation through activation of the AGE receptor (RAGE) and induction of proinflammatory pathways NF κB, metaloproteinases and degradation of the extracellular tissue matrix [3].
Impact of AGEs on skin structure and function AGEs accumulate in dermal collagen and elastin, causing: skin stiffening and loss of elasticity through covalent bonds between collagen/elastin fibers [3], stimulation of inflammation through the RAGE → NF κB → MMP → extracellular matrix activation mechanism, and most clinically evident, the result of accelerated photo- and chronological aging, manifested by skin yellowing, wrinkles, and dryness. Studies have shown that skin levels of AGEs measured by autofluorescence are correlated with carotid intima-media thickness (a cardiovascular marker) and vascular stiffness [4]. AGEs measured by autofluorescence in type 1 diabetes are predictive of macro- and microangiopathic complications [5]. Cutaneous AGEs are valuable markers for vascular complications and respond to intensive glycemic management.
Regarding the ultrasound assessment of skin aging, High Frequency Ultrasound (HFU), where HFU ≥20MHz, offers precise and non-invasive assessments of structural and inflammatory changes in the skin: it measures the thickness of the epidermis and dermis, echogenicity and the hypoechoic band under the epidermis [6,7]. In MetS, HFU highlights thin epidermis, low cell density, thicker dermis in sun-exposed areas [6]. On the other hand, in autoimmune pathology, in atopic dermatitis, the hypoechoic band under the epidermis is thicker in lesions and present in apparently healthy areas, indicating chronic subclinical inflammation, known as metainflammation [7].
According to the latest research, HFU has become increasingly used in medical diagnosis, especially in dermatological oncology, where HFU is used in a predominant manner, because the examination of malignant pathology involves early diagnosis of neoplastic formations, the authors claim that HFU ensures the acquisition of essential and objective information regarding tumor depth, lateral extension, degree of vascularization [8]. HFU has the advantage of highlighting structural skin changes, which reflect the degradation given by the cross-linking of collagen fibers and skin aging through the consequent loss of elasticity. AGEs are represented by compounds of exogenous or endogenous origin resulting from the non-enzymatic glycation of protein and carbohydrate groups, and their role in the occurrence and chronicity of systemic inflammation is under continuous research. Moreover, their effect on collagen fibers also has a visible component, which can be quantified by HFU and autofluorescence [8].
Another area explored by HFU is the evaluation of inflammatory skin diseases, such as differentiating between the inflammatory and sclerotic stages of scleroderma, by increasing collagen deposits, which are visible by HFU ultrasound [9]. In aesthetic medicine, HFU has applicability in the injection of dermal fillers, by measuring the depth before the procedure, but also for monitoring the results, being also used in monitoring anti-cellulite therapies, and the formation of postoperative scars. Other applications of HFU are in examining the skin and determining the degree of tissue aging, by monitoring the arrangement of collagen and elastin fibers, the degree of hydration, the presence and characteristics of the hypoechoic subepidermal band, which tends to change with age [10].
HFU also has applicability in cosmetology pharmacology, in industry and anti-aging therapy (e.g. chemical peeling, platelet-rich-plasma injection), HFU quantifies the effectiveness of treatments through changes in the epidermis and dermal parameters [11]. Thus, HFU allows clear monitoring of inflammation and tissue response to interventions in MetS and skin aging. HFU is a promising tool for the early detection of inflammation and changes induced by chronic systemic pathology, such as that generating AGEs in the skin structure, but also collagen aging correlated with predisposing factors – tobacco use, exposure to ultraviolet rays, consumption of foods from the Western Diet category, cooked at high temperatures and short cooking time.
Taking into account what was presented in the introductory part, the aim of the study is to compare AGEs in biological fluids with ultrasonographic changes induced by AGEs visible through HFU, in sun-exposed and non-exposed skin. The aim of the study is to correlate AGEs levels in biological fluids with ultrasonographic measurements of sun-exposed skin and non-sun-exposed tissue.
2. Materials and Methods
This study is analytical, observational, cross-sectional. Patients (N = 113) were recruited from the Departments of Oral Rehabilitation and Oral Prosthetics (Faculty of Dentistry, “Iuliu Hațieganu” University of Medicine and Pharmacy) and from the Regional Diabetes Center in Cluj-Napoca, Romania, between 2018 and 2019.
Inclusion criteria were patients over 18 years of age who required clinical examination and diagnosis of the oral cavity and diagnosis, associated or not with dental treatment needs. Exclusion criteria were patients weighing more than 150 kg (which exceeded the assessment capacity of the measuring device) and patients with skin and/or oral mucosa lesions or vascular anomalies. This study was approved by the University Ethics Board, no. 93/08.03.2017. Written informed consent was obtained from all subjects, according to the Declaration of Helsinki of the World Medical Association, revised in 2000, in Edinburgh.
Study Protocol
Clinical Evaluation
Patients were asked to report to the Oral Rehabilitation Department at 7:30 a.m. for enrollment, where they were asked to complete written informed consent regarding the procedures that would follow after inclusion in the clinical study. Demographic, clinical, and anthropometric measurements were recorded: age, gender, body mass index (BMI), waist circumference, and Fitzpatrick skin type (Figure 1). Venous blood was collected from the upper arm of the included subjects and collected in sterile osmotic tubes, centrifuged at 4000 rpm/14 min, plasma and serum were divided and stored in 100, 200, 500 µl samples, in sterile criotubes. Urine samples were brought by patients in sterile tubes. Urine was divided and stored in 100, 200, 500 µl samples, in sterile criotubes.
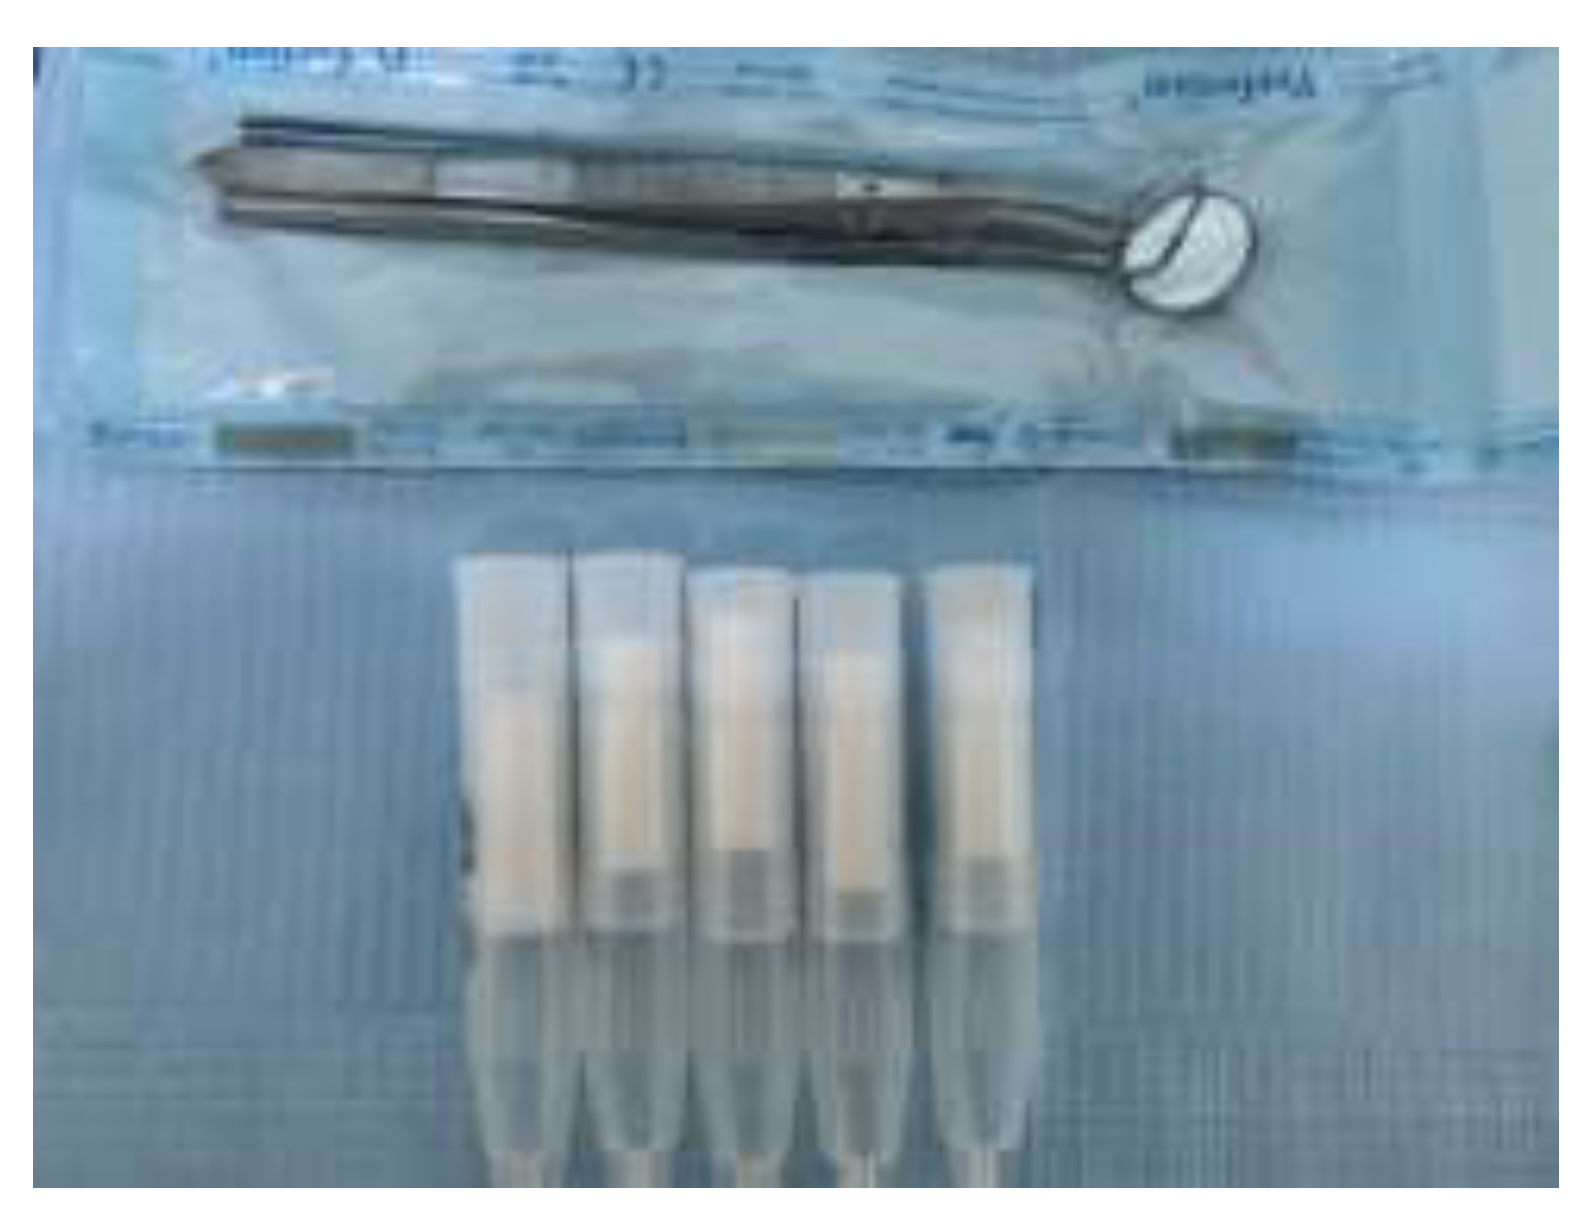
Saliva samples were harvested by using sterile cotton swabs, which were held by the patients in the oral cavity for three minutes, after putting them in sterile tubes (Salivette®, Sarstedt, AG & Co., Numbrecht, Germany) (Image 1). Saliva was centrifuged (1450 rpm/2min) and sampled in 100, 200, 500 µl sterile crio-microtubes. The following AGEs were assessed in biological fluids (plasma, saliva, urine): FruLys, Pyr, MG-H1, CEL, CML, Arg, Lys.
Image 1.
Saliva harvesting kit (Salivette™, Sarstedt, AG & Co., Numbrecht, Germany).
Ultrasound Evaluation
The tissue glycation process of collagen fibers was indirectly evaluated with a 22 MHz HFU ultrasound device (DUB cutis, Taberna Pro Medicum, Lüneburg, Germany), with a signal penetration depth of 8 mm, axial resolution of 57 µm at 22 MHz. Measurements were performed with the windows covered with curtains (to avoid UV-induced evaluation errors), at an ambient temperature of 25 °C. The ultrasound probe was used as a transmission medium for both the ultrasound gel (applied to the examined surface) and the water introduced into the HFU probe and covered with a thin transparent membrane. Ultrasound images were acquired in B-scan and A-scan viewing modes. The assessment was performed on sun-exposed skin (left zygomatic area) and on non-sun-exposed tissue (non-keratinized mucosa of the lower lip). Before measurements were taken, patients were asked to remove moisturizer/face concealer, if present. The transducer was placed parallel with and without pressure on both the zygomatic and inner lower lip regions after gel application.
Ultrasound measurements were performed by two operators (AMB and SCV). Each assessment was performed three times by each operator. For each site examined, HFU was performed at three different points (mesial, central and distal). The final value was the sum of the values. When differences in values were identified, the respective measurement was repeated by the two operators, reaching mutual agreement between the examiners. Intra-rater reliability was assessed for epidermal depth measurements. The correlation coefficient was 0.787, indicating good reliability. Inter-rater reliability was assessed for epidermal depth measurements using Cohen’s kappa coefficient, which revealed a k of 0.881. For the sun-exposed skin of the zygomatic area, including the epidermis, dermis, and subcutaneous tissue (hypodermis), tissue depth (thickness), pixel count (px), and density (automatic) were recorded (Image 2). The non-sun-exposed tissue examined was the oral mucosa on the inner surface of the lower lip including the non-keratinized epithelium, lamina propria, and submucosa (Image 3). The following parameters were recorded: depth (thickness), pixel count (px), and density.
Image 2.
HFU ultrasound assessment (DUB™ cutis, Taberna Pro Medicum) of the lower lip structures, images are exported as pixels in order to highlight tissue density (white and blue – very dense, green – dense, black – very low density or muscular structure) yellow arrow – transducer membrane, Orange arrow – hyperpixelated epidermis, Blue arrow – dermis, Red arrow – hypopixelated hypodermis.
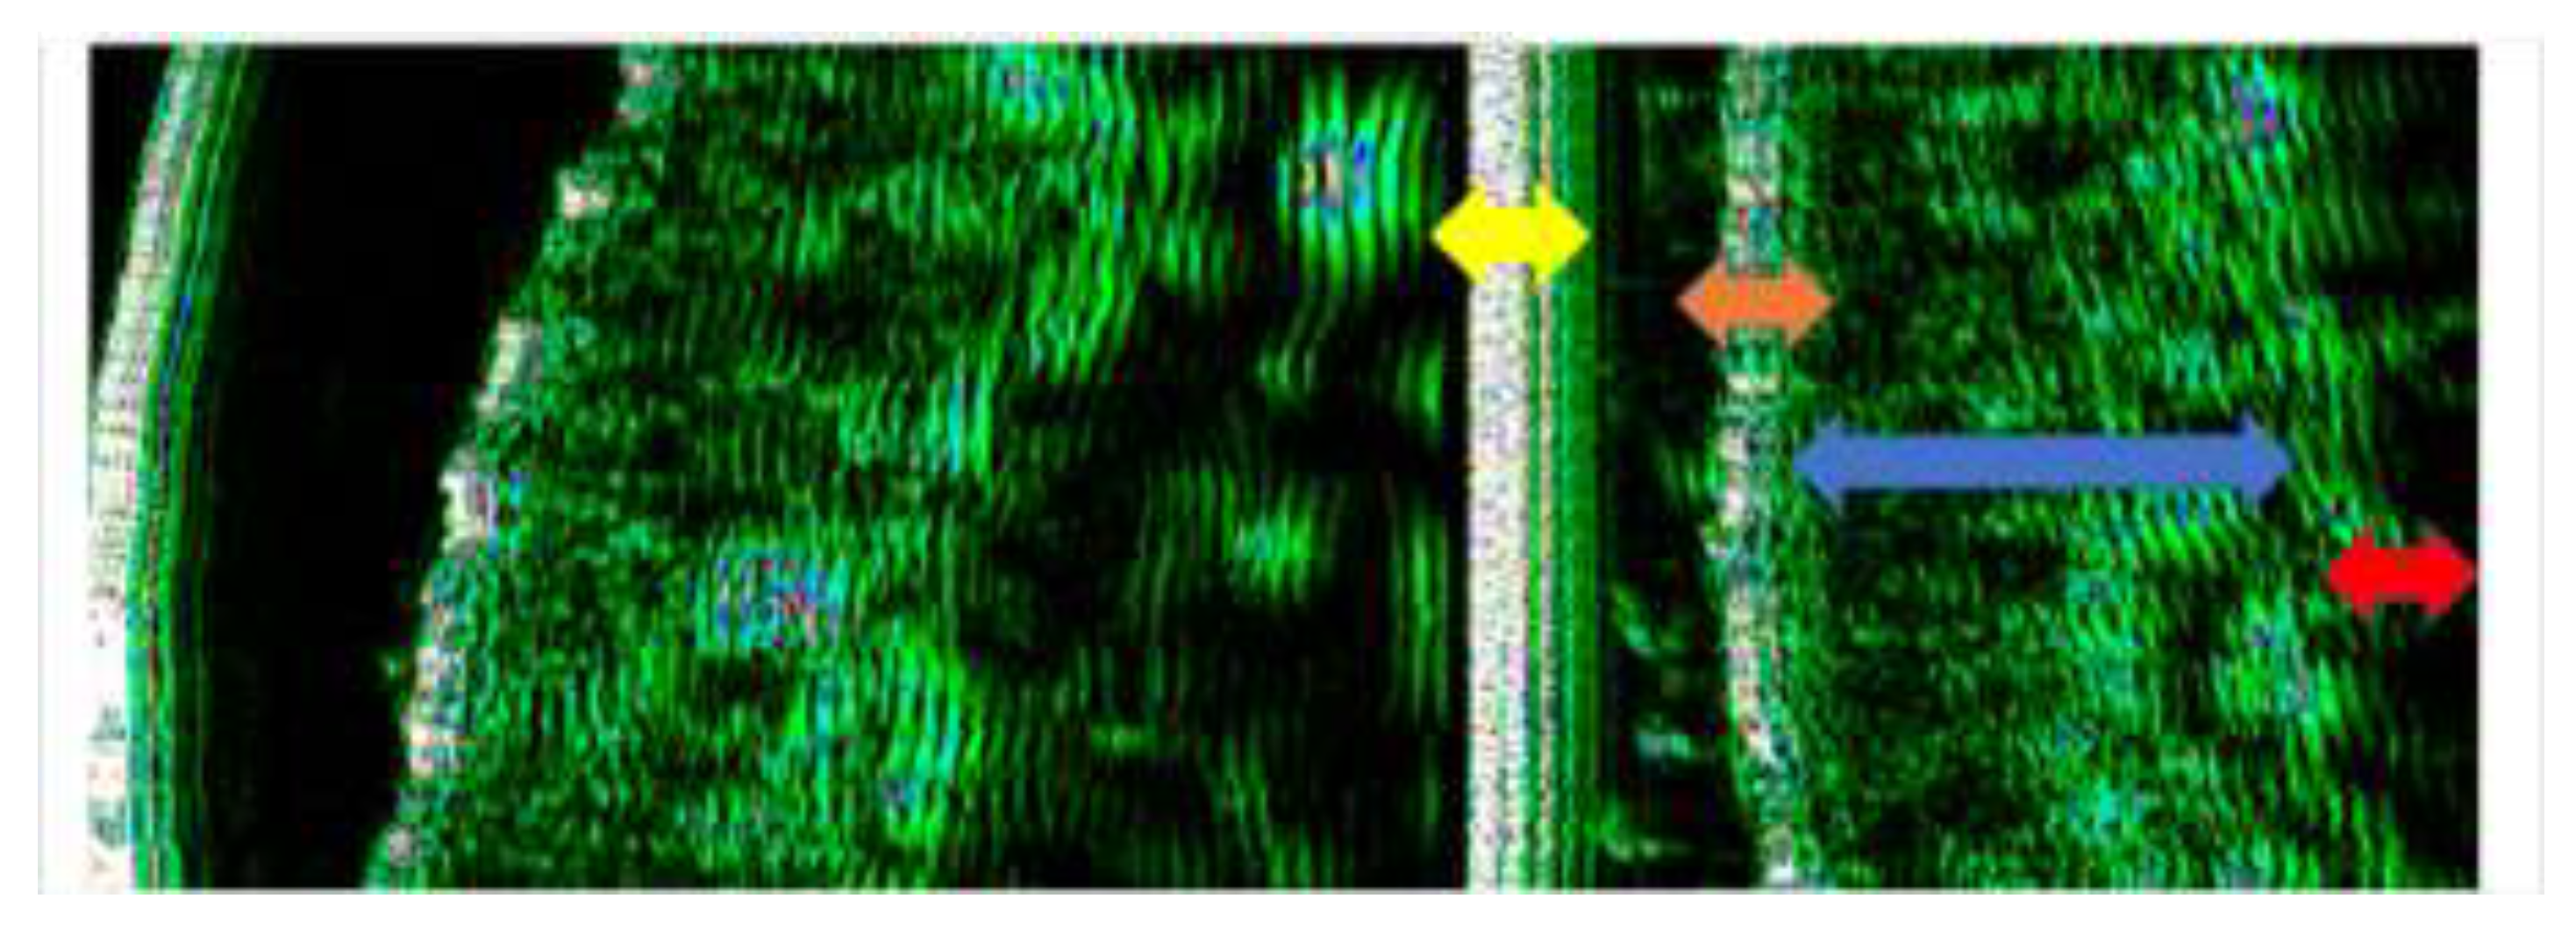
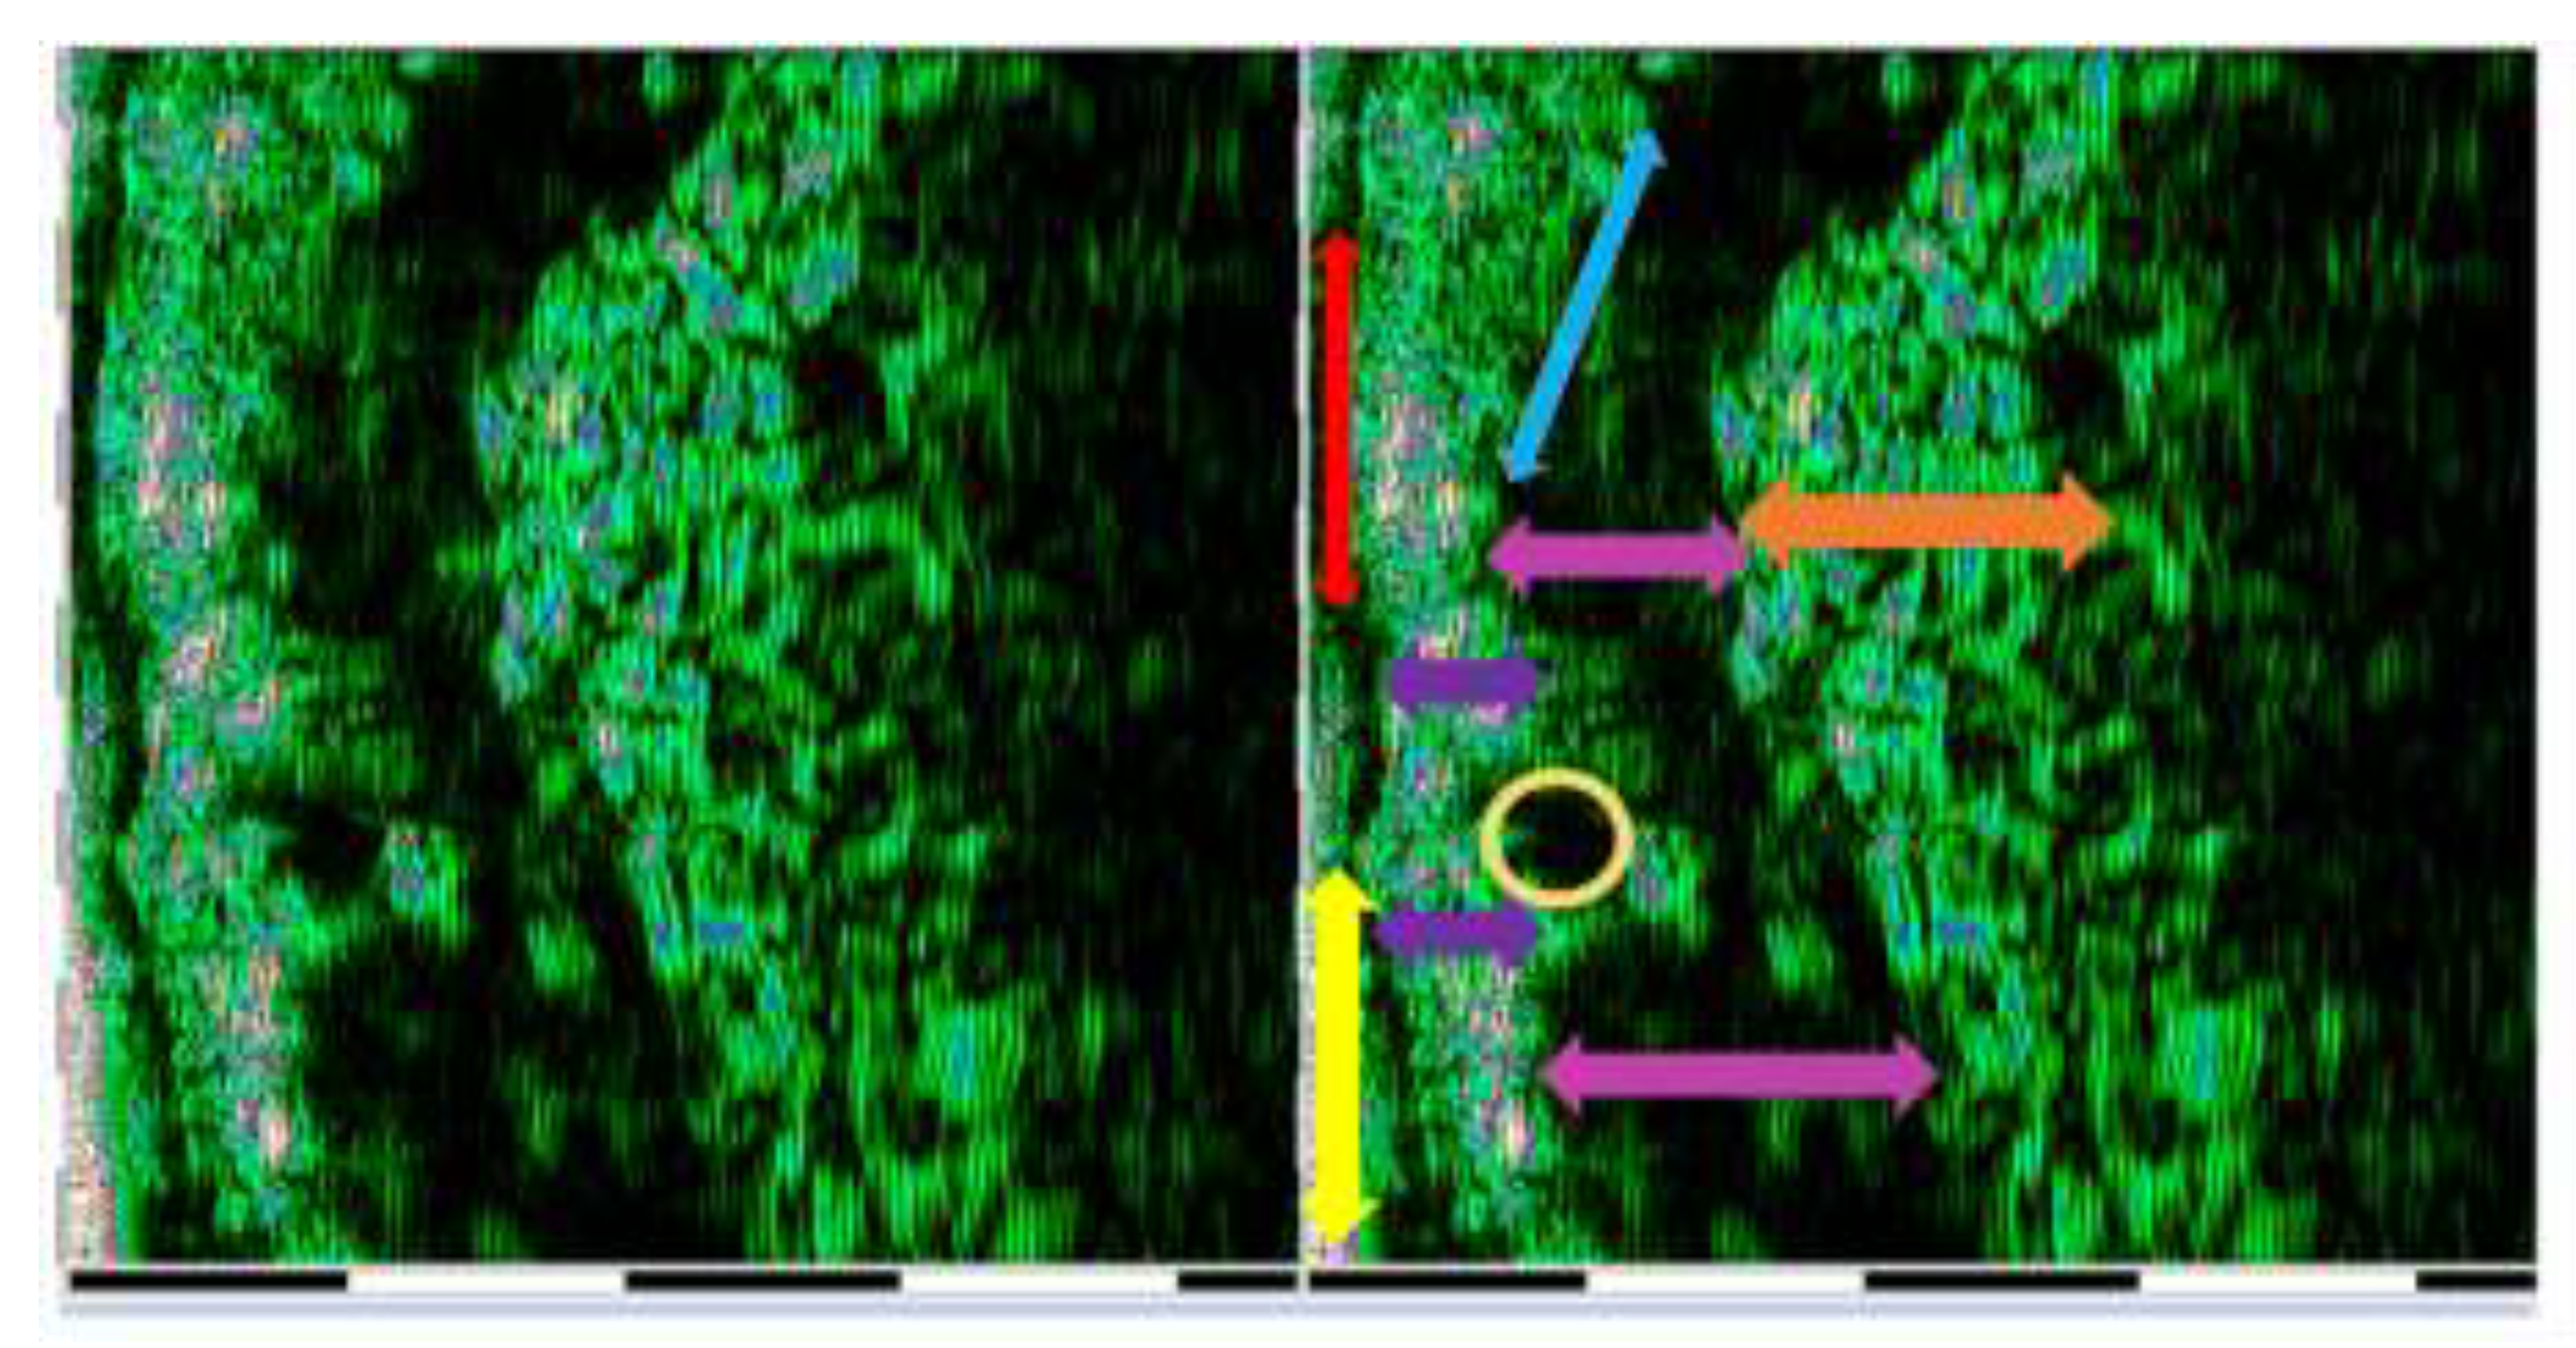
Image 3.
HFU ultrasound assessment (DUB™ cutis, Taberna Pro Medicum) of the lower lip structures. yellow arrow - superficial layer of non-keratinized squamous epithelium red arrow - spinous and basal layers of non-keratinized squamous epithelium purple arrow - papillary and reticular layers of the lamina propria mucosae orange arrow - tela submucosa yellow circle - minor salivary gland pink arrow - orbicularis oris muscle.
Statistical Analysis
Statistical analysis was performed using the statistical software MedCalc version 19.2.1 (MedCalc Software Ltd., Ostend, Belgium; https://www.medcalc.org; 2020). Quantitative variables were tested for normality of distribution using the Shapiro-Wilk test and were expressed as median and 25th-75th percentiles. Quantitative data were described using median and 25-75 percentiles. Qualitative data were characterized by frequency and percentage. Correlations between variables were performed using the Spearman coefficient. A p value <0.05 was considered statistically significant.
3. Results
Data regarding anthropometric, high frequency ultrasound evaluation parameters and AGEs in biofluids (saliva, plasma, serum, urine) are shown in Table 1.
We determined the existence of a weak direct correlation between plasma MG-H1 and epidermal thickness (r=0.208), a weak indirect correlation between epidermal thickness and plasma Arg (r=-0.189), and a weak indirect correlation between epidermal depth and serum CEL (r=-0.248) (Table 2).
We also determined a weak positive correlation between epidermal density and salivary MG-H1 (r=0.204), a weak direct correlation between epidermal density and salivary Arg (r=0.223) (Table 3).
Regarding advanced glycation end products and dermal collagen affected by UV exposure, we established a weak positive correlation with serum Pyr (r=.227*), a weak direct correlation with salivary MG-H1 (r= 0.285**) and salivary CML (r=0.295). Also, weak direct correlations were determined between dermal affected by UV exposure and salivary Arg (r=0.207*), salivary Lys (r=0.200*). Indirect correlations were between dermal collagen affected by UV exposure and urinary MG-H1 (r=-0.194*), urinary CML (r=-0.252**) (Table 4).
Regarding the correlation between glycation end products in biofluids and the degree of pixelation of dermal collagen exposed to UV rays, we determined weak direct correlations with salivary MG-H1 (r=0.193*), salivary CML (r=0.227*), and weak indirect correlation with urinary CML (r=-0.240*) (Table 5).
Significant correlations were found between dermal collagen density affected by UV exposure as follows – positive direct correlation with plasma FruLys (r=0.363), moderate indirect correlation with plasma Pyr (r=-0.417), moderate indirect correlation with plasma Arg (r=-0.456), moderate indirect correlation with plasma Lys (r=-0.394), strong indirect correlation with serum Pyr (r=-0.547), weak indirect correlation with serum CEL (r= -0.241), moderate indirect correlation with serum Arg (r=-0.369), weak indirect correlation with serum Lys (r=-0.270), weak direct correlation with salivary MG-H1 (r=0.193) and salivary CML (r=.227). At the urinary level, chelated dermal collagen was weakly indirectly correlated with CML (r=-0.240) (Table 6).
Regarding the density of the dermis affected by UV exposure, we found a moderate indirect correlation with salivary FruLys (r=-.0295), weak indirect with salivary MG-H1 (r=-0.170), weak indirect with salivary CML (r=-0.195) and weak indirect with salivary Lys (r=-0.233) (Table 7).
Dermal depth was weakly positively correlated with salivary Lys (r=0.228), weakly indirectly correlated with plasma CML (r=-0.203), urinary Frulys (r=-0.216), urinary MG-H1 (r=-0.224), urinary CML (r=-0.186) (Table 8).
The degree of pixelation of dermal collagen was correlated with plasma FruLys – weak direct correlation (r=0.256), with serum CEL – weak indirect correlation (r=-0.221), urinary FruLys (r=-0.221) (Table 9).
Regarding dermal density and advanced glycation end products in biofluids, we found a weak direct correlation with serum FruLys (r=0.203) and urinary CEL (r=0.220), a weak indirect correlation with plasma Lys (r=-0.210) (Table 10).
Subcutaneous tissue depth was weakly directly correlated with plasma MG-H1 (r=0.208), and weakly indirectly with serum CML (r=-.290) (Table 11).
We found a weak direct correlation between the degree of subcutaneous tissue pixelation and plasma MG-H1 (r=0.201), weak indirect correlation with serum CML (r=-0.213) (Table 12).
Regarding subcutaneous tissue density and advanced glycation end products in biofluids, we found a weak indirect correlation with serum Lys (Table 13). No other statistically significant differences were determined.
4. Discussion
The present cross-sectional study is the first to analyze the correlation between the accumulation of AGEs subtypes (CML, CEL, Arg, Pyr, MG-H1, FruLys, Lys) at the level of biofluids (plasma, serum, saliva, urine) and skin parameters of the AGEs cross-linking process by HFU (depth, density and degree of dermal pixelation). Pyr was isolated in 1849 by Anderson from the oil obtained by boiling animal bones at high temperatures, and years later its presence was found in volatile organic compounds produced by baking and preservation processes – fried chicken, roasted coffee, potato chips, fried ham, black tea [12,13,14]. In the present study, urinary Pyr and salivary MG-H1 values were lower in patients with cutaneous phenotype II compared to the others. Kostelc et al. found high values of Pyr at salivary level in patients with gingivitis, but related to the inflammatory component of its effects [15]. There are no other studies in the literature regarding AGEs in biofluids and facial phenotype, but it is known that Pyr induces capillary and skin depigmentation, which explains the low values in patients with facial phenotype II [16]. Compared to other biofluids, the lower MG-H1 concentration in saliva can be explained by the salivary composition in albumin, lysozyme, salivary amylase, which reacts to oxidative stress induced by the glycation phenomenon [17].
Our study showed significant differences in urinary MG-H1, CEL and Arg concentrations, which were higher in female patients. Arg is a non-essential amino acid, with dietary origin and de novo synthesis (intestinal-renal axis) [18]. The literature attests that nitric oxide precursors and arginine methylation (function in ammonia assimilation in the uric cycle and its transformation into urea, creatinine, nitric oxide) together with MG with predominantly dietary origin, are biological markers of reduced glomerular filtration rate, and reduced renal glyoxalase-1 (Glo1) function [19,20,21].
The results of the present study did not bring significant differences between age groups and glycation end products at the level of biological fluids. The specialized literature contradicts our result, because carbonyl groups, oxidative stress, total thiol number, increase with age [22,23]. The justification of our result is represented by the age groups included in the study, which were close (40-60 years), which influenced the uniformity of AGEs values at the level of biofluids. We determined the existence of a weak direct correlation between MG-H1, from plasma and epidermal thickness, a weak indirect correlation between epidermal thickness and plasma Arg, CEL, the same salivary variables being in close correlation with epidermis density. There are no similar studies in the literature, but our results are in agreement with those of Christidis et al., who correlated reduced density and pixelation of the dermis (assessed by HFU) in sun-exposed areas, especially in patients with metabolic syndrome [24].
Regarding advanced glycation end products and the depth of the dermis affected by UV exposure, we established a weak positive correlation with serum Pyr, MG-H1, Arg, Lys, and salivary CML. Also, regarding the increased degree of pixelation of dermal collagen exposed to UV rays, it was directly related to MG-H1, salivary CML, and indirectly with the same products in urine. HFU reflects echogenic structural changes potentially associated with glycated collagen fibers in the dermis and connective tissue, where the degree of pixelation increases with a reduction in dermal elasticity, associated with the phenomenon of collagen glycation, which also indicates structural-functional tissue changes.
The changes revealed by HFU are in agreement with Monnier and Gkogkolou, who showed that the accumulation of AGEs and the fluorescence given by cross-linking are directly correlated with the loss of dermal elasticity and the increase in tissue autofluorescence [25,26]. Our study showed that, with the increase in the degree of damage to collagen by the glycation process in the skin exposed to UV rays, the serum values of glycation products (Arg, Lys, Pyr, CEL) are lower, which shows the capture of AGEs at the tissue level, in agreement with other studies that evaluated the accumulation of AGEs by autofluorescence [27,28,29].
Dermis aging was directly correlated with CML and salivary MG-H1, a promising aspect for the diagnosis and monitoring of the level of inflammation at a systemic level and, very importantly, of tissue aging. Both in the present study and in the specialized literature, the direct link between glycation of collagen fibers and systemic inflammatory markers was demonstrated [30,31,32]. It was also shown that the cross-linking phenomenon can be assessed by HFU and autofluorescence.
The assessment of HFU can be influenced by the facial phenotype, more specifically by the amount of melanin in the basal epidermal layers [33].. In the present study, most of the included subjects were part of phenotype III, and the exclusion criteria respected the absence of actinic erythema, skin hyperpigmentation formations or hyperkeratoses, which is why we considered that there was no possibility of inducing bias in the HFU results.
Our study is the first to demonstrate quantitative correlations between advanced glycation end products (CML, CEL, Arg, Pyr, MG-H1, FruLys, Lys) at the biofluid level (plasma, serum, saliva, urine) and skin parameters of the AGEs cross-linking process by HFU (dermal depth, density and degree of pixelation). Furthermore, the analysis in the four environments revealed a weak direct correlation between FruLys at plasma and serum levels, a weak indirect correlation with FruLys at salivary levels, a weak direct correlation between plasma and salivary MG-H1. results that provide a solid basis for AGEs quantification.
Regarding skin health, AGEs, and prevention, community health initiatives should prioritize dietary education on reducing sugar intake, and ultra-processed foods (high in dietary AGEs) to limit the endogenous production of glycation products and mitigate systemic inflammation. Also, as strict photoprotection measures, should promote rigorous “UV hygiene” protocols—including the daily use of broad-spectrum sunscreen and physical barriers, while advocate for the adoption of HFU of the skin in routine preventive check-ups; utilizing skin health as a readily accessible, as an accessible screening tool for identifying glycation-related cardiovascular risk.
As our study is an exploratory one, and, given the large number of correlations we performed, the results should be interpreted with caution and will require confirmation from independent cohorts.
5. Conclusions
HFU ultrasound assessment revealed structural changes in the cervico-facial dermis, which were associated with increased AGEs, suggesting that glycation-induced tissue remodeling can be detected non-invasively. This data obtained might be the based for future studies on the clinical utility of the combined assessment of AGEs and skin changes by HFU as modern, rapid and non-invasive tools with potential relevance for cardiometabolic risk research which require further studies.
Author Contributions
Conceptualization, A.M.B., S.C.V. and A.I.; methodology, C.F.; validation, A.M.B, O.S. and A.R.; formal analysis, S.C.V.; investigation, A.M.B., S.I.V.; data curation, A.E.M, S.C.V.; writing—original draft preparation, A.M.B, S.C.V., S.I.V. C.F.; writing—review and editing, A.I., O.S., A.R.; supervision, A.I.; All authors have read and agreed to the published version of the manuscript.
Funding
This research received no external funding.
Informed Consent Statement
Written informed consent has been obtained from the patients to publish this paper.
Conflicts of Interest
The authors declare no conflicts of interest.
Abbreviations
The following abbreviations are used in this manuscript:
AGEs - Advanced Glycation End Products
Arg - Arginine
CEL - Carboxy-ethyl-lysine
CML - Carboxy-methyl-lysine
CRP - C reactive protein
Fru-Lys- Fructose-lysine
HDL – C - High-density lipoprotein
HFU - High Frequency Ultrasound
IL 6 - Interleukin 6
MetS – Metabolic syndrome
MG-H1 - Methylglycoxal H1
Pyr - Pyridine
RAGE - AGE receptor
TNF α - Tumor necrosis factor alpha
Sc – subcutaneous tissue
UV – ultraviolet exposure
References
- Constitution of the World Health Organization. Definition of Health. 2006. [Google Scholar] [CrossRef]
- Balkau, B.; Charles, M.A.; Drivsholm, T.; Borch-Johnsen, K.; Wareham, N.; Yudkin, J.S.; Morris, R.; Zavaroni., I.; van Dam, R.; Feskins, E.; et al. European Group For The Study Of Insulin Resistance (EGIR). Frequency of the WHO metabolic syndrome in European cohorts, and an alternative definition of an insulin resistance syndrome. Diabetes Metab 2002, 28, 364–376. [Google Scholar] [PubMed]
- Carrión-Barberà, I.; Triginer, L.; Tío, L.; Pérez-García, C.; Ribes, A.; Abad, V.; Pros, A.; Bermúdez-López, M.; Castro-Boqué, E.; Lecube, A.; et al. Role of Advanced Glycation End Products as New Biomarkers in Systemic Lupus Erythematosus. Int J Mol Sci 2024, 25, 3022. [Google Scholar] [CrossRef] [PubMed]
- Israelsen, N.M.; Michael, M.; Mogensen, M.; Bojesen, S.; Jensen, M.; Hædersdal, M.; Podoleanu, A.; Bang, O. The value of ultrahigh resolution OCT in dermatology - delineating the dermo-epidermal junction, capillaries in the dermal papillae and vellus hairs. Physics 2018. [Google Scholar] [CrossRef] [PubMed]
- Momma, H.; Niu, K.; Kobayashi, Y.; Guan, L.; Sato, M.; Guo, H.; Chujo, M.; Otomo, A.; Yufei, C.; Tadaura, H.; et al. Skin advanced glycation end-product accumulation is negatively associated with calcaneal osteo-sono assessment index among non-diabetic adult Japanese men. Osteoporos Int 2012, 23, 1673–1681. [Google Scholar] [CrossRef] [PubMed]
- Chen, J.; Arshi, B.; Waqas, K.; Lu, T.; Bos, D.; Ikram, M.A.; Uitterlinden, A.G.; Kavousi, M.; Zillikens, M.C. Advanced glycation end products measured by skin autofluorescence and subclinical cardiovascular disease: The Rotterdam Study. Cardiovasc Diabetol 2023, 22, 326. [Google Scholar] [CrossRef]
- Băbțan, A.M.; Vesa, Ș.C.; Boșca, B.A.; Crișan, M.; Mihu, C.M.; Băciuț, M.F.; Dinu, C.; Crișan, B.; Câmpian, R.S.; Feurdean, C.N.; et al. High-Frequency Ultrasound Assessment of Skin and Oral Mucosa in Metabolic Syndrome Patients-A Cross-Sectional Study. J Clin Med 2021, 10, 4461. [Google Scholar] [CrossRef] [PubMed] [PubMed Central]
- Alimova, S.; Sharobaro, V.; Yukhno, A.; Bondarenko, E. Possibilities of ultrasound examination in the assessment of age-related changes in the soft tissues of the face and neck: A review. Appl Sci 2023. [Google Scholar] [CrossRef]
- Machet, L.; et al. High resolution ultrasound imaging of melanocytic and other pigmented lesions of the skin. Ultrasound Imaging 2021. [Google Scholar] [CrossRef]
- Czajkowska, J.; Juszczyk, J.; Bugdol, M.N.; et al. High-frequency ultrasound in anti-aging skin therapy monitoring. Sci Rep 2023, 13, 17799. [Google Scholar] [CrossRef]
- Anderson, T. “Producte der trocknen Destillation thierischer Materien” [Products of the dry distillation of animal matter]. Annalen der Chemie und Pharmacie (in German). 1849, 70, 32–38. [Google Scholar] [CrossRef]
- Aeschbacher, H.U.; Wolleb, U.; Löliger, J.; Spadone, J.C.; Liardon, R. Contribution of coffee aroma constituents to the mutagenicity of coffee”. Food and Chemical Toxicology 1989, 27(4), 227–232. [Google Scholar] [CrossRef] [PubMed]
- Buttery, R.G.; Seifert, R.M.; Guadagni, D.G.; Ling, L.C. Characterization of Volatile Pyrazine and Pyridine Components of Potato Chips. In Journal of Agricultural and Food Chemistry; ACS: Washington, DC, 1971; Volume 19, pp. 969–971. [Google Scholar]
- Ho, C.T.; Lee, K.N.; Jin, Q.Z. Isolation and identification of volatile flavor compounds in fried bacon. Journal of Agricultural and Food Chemistry 1983, 31(2), 336. [Google Scholar] [CrossRef]
- Kostelc, J.G.; Preti, G.; Nelson, P.R.; Brauner, L.; Baehni, P. Oral Odors in Early Experimental Gingivitis”. Journal of Periodontal Research 1984, 19(3), 303–312. [Google Scholar] [CrossRef]
- Muraoka, M.Y.; Justino, A.B.; Caixeta, D.C.; Queiroz, J.S.; Sabino-Silva, R.; Espindola Salmen, F. Fructose and methylglyoxal-induced glycation alters structural and functional properties of salivary proteins, albumin and lysozyme. PLoS One 2022, 17, e0262369. [Google Scholar] [CrossRef] [PubMed] [PubMed Central]
- Morris, S. Arginine Metabolism Revisited. J Nutr 2016, 146, 2579S–2586S. [Google Scholar] [CrossRef]
- Kleinebenne, L.; Röhrig, W.; Ebach, F.; Reutter, H.; Pankraz, A.; Heuchel, K.M.; Müller, A.; Hilger, A.C. The components of arginine and methylarginine metabolism are indicative of altered kidney function in intrauterine growth-restricted neonates. J Hypertens 2024, 42, 1940–1947. [Google Scholar] [CrossRef]
- Emrich, I.E.; Zawada, A.M.; Martens-Lobenhoffer, J.; Fliser, D.; Wagenpfeil, S.; Heine, G.H.; Bode-Boger, S.M. Symmetric dimethylarginine (SDMA) outperforms asymmetric dimethylarginine (ADMA) and other methylarginines as predictor of renal and cardiovascular outcome in nondialysis chronic kidney disease. Clin Res Cardiol 2018, 107, 201–213. [Google Scholar] [CrossRef]
- Rabbani, N.; Thornalley, P.J. Advanced glycation end products in the pathogenesis of chronic kidney disease. Kidney Int 2018, 93, 803–813. [Google Scholar] [CrossRef]
- Kaleta, D.; Polańska, K.; Korytkowski, P.; Usidame, B.; Bąk-Romaniszyn, L. Patterns of nicotine dependence in four Eastern European countries. BMC Public Health 2015, 15, 1189. [Google Scholar] [CrossRef]
- Maciejczyk, M.; Nesterowicz, M.; Szulimowska, J.; Zalewska, A. Oxidation, Glycation, and Carbamylation of Salivary Biomolecules in Healthy Children, Adults, and the Elderly: Can Saliva Be Used in the Assessment of Aging? J Inflamm Res 2022, 15, 2051–2073. [Google Scholar] [CrossRef]
- Maciejczyk, M.; Bielas, M.; Zalewska, A.; Gerreth, K. Salivary Biomarkers of Oxidative Stress and Inflammation in Stroke Patients: From Basic Research to Clinical Practice. Oxid Med Cell Longev 2021, 2021, 5545330. [Google Scholar] [CrossRef]
- Christidis, G.; Küppers, F.; Karatayli, S.C.; et al. Skin advanced glycation end-products as indicators of the metabolic profile in diabetes mellitus: Correlations with glycemic control, liver phenotypes and metabolic biomarkers. BMC Endocr Disord 2024, 24, 31. [Google Scholar] [CrossRef]
- Monnier, V.M.; Sun, W.; Gao, X.; Sell, D.R.; Cleary, P.A.; Lachin, J.M.; et al. Skin collagen advanced glycation endproducts (AGEs) and the long-term progression of subclinical cardiovascular disease. Diabetes Care 2015, 38, 1170–1175. [Google Scholar]
- Gkogkolou, P.; Böhm, M. Advanced glycation end products: Key players in skin aging? Dermatoendocrinol 2012, 4, 259–270. [Google Scholar] [CrossRef]
- Du, T.; Brandl, B.; Hauner, H.; Skurk, T. Skin Autofluorescence Mirrors Surrogate Parameters of Vascular Aging: An Enable Study. Nutrients 2023, 15, 1597. [Google Scholar] [CrossRef] [PubMed]
- Meerwaldt, R.; Hartog, J.W.; Graaff, R.; Huisman, R.J.; Links, T.P.; den Hollander, N.C.; et al. Skin autofluorescence, a measure of cumulative metabolic stress and advanced glycation end products, predicts mortality in hemodialysis patients. J Am Soc Nephrol 2005, 6, 3687–3693. [Google Scholar] [CrossRef] [PubMed]
- Petrofsky, J.S.; Lee, S.; Hamdan, T.; et al. High-frequency ultrasound analysis of skin structure and its relation to glycation. J Clin Med 2021, 10, 4461. [Google Scholar]
- Saremi, A.; Howell, S.; Schwenke, D.C.; Bahn, G.; Beisswenger, P.J.; Reaven, P.D. for the VADT Investigators. Advanced Glycation End Products, Oxidation Products, and the Extent of Atherosclerosis During the VA Diabetes Trial and Follow-up Study. Diabetes Care 2017, 40, 591–598. [Google Scholar] [CrossRef]
- Zhao, X.W.; Yue, W.X.; Zhang, S.W.; Chen, Q. Correlation between the accumulation of skin glycosylation end products and the development of type 2 diabetic peripheral neuropathy. BMC Endocr Disord 2022, 22, 106. [Google Scholar] [CrossRef]
- Reurean-Pintilei, D.; Stoian, A.P.; Potcovaru, C.G.; et al. Skin autofluorescence as a potential adjunctive marker for cardiovascular risk assessment in type 2 diabetes: A systematic review. Int J Mol Sci 2024, 25, 3889. [Google Scholar] [CrossRef]
- Martinovic, D.; Tokic, D.; Usljebrka, M.; Lupi-Ferandin, S.; Cigic, L.; Vanjaka Rogosic, L.; Ercegovic, S.; Kontic, M.; Kumrić, M.; Rusic, D.; et al. The Association between the Level of Advanced Glycation End Products and Objective Skin Quality Parameters. Life 2023, 13, 256. [Google Scholar] [CrossRef]
Figure 1.
Types of skin phototype according to the Fitzpatrick classification.
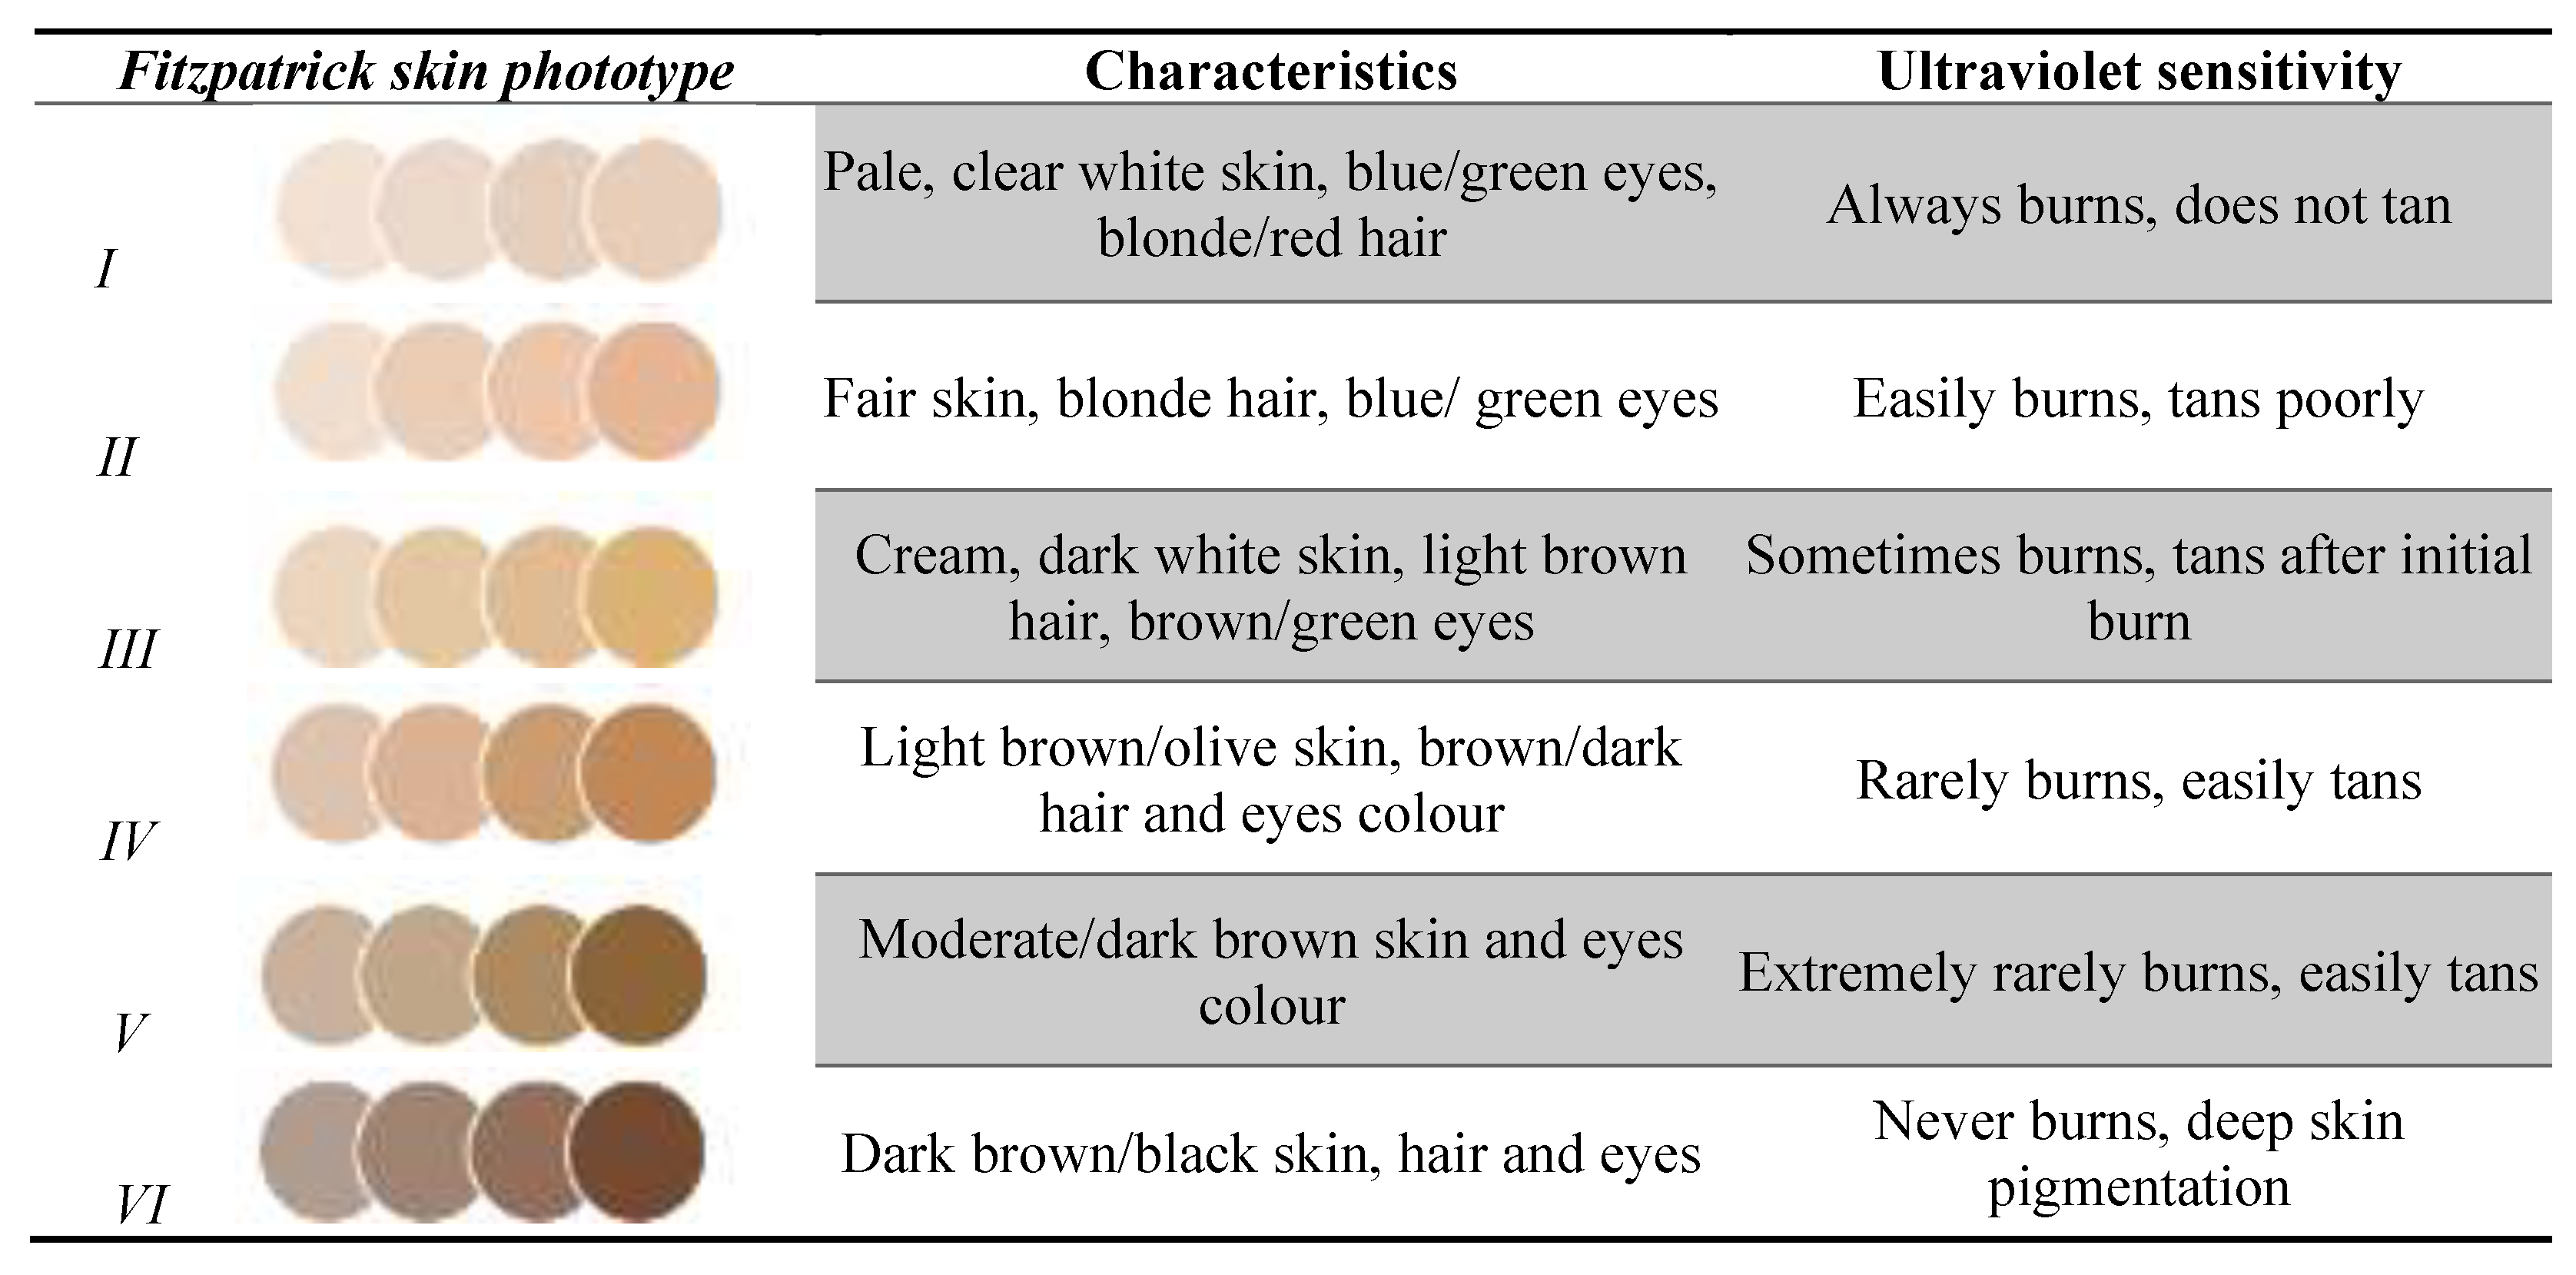

Table 1.
Biochemical and ultrasound assessment in included subjects.
| Characteristic | N (=113) | |
|---|---|---|
| Age | 52 (36; 60) | |
| Gender | Male | 37 (32.7%) |
| Female | 76 (67.3%) | |
| Epidermis depth | 281 (243; 325) | |
| Epidermis nr pixels | 5361.5 (4062; 4760) | |
| Epidermis density | 63.31 (47.61; 82.69) | |
| Epidermis density % | 26.1300 (19.8; 32.7) | |
| Uv dermis exposure damage depth uv aged dermis | 547 (394.5; 684) | |
| Uv dermis exposure damage nr pixels | 8806 (6312.5; 10979) | |
| Uv dermis exposure damage density | 9.8 (5.4; 17.5) | |
| Uv dermis exposure damage density % | 8.4 (6; 14.6) | |
| Dermis Depth | 1450 (1269.5; 1680) | |
| Dermis nr pixels | 23681 (20185; 27083.5) | |
| Dermis density % | 19.8 (15.2; 26.2) | |
| Sc tissue depth | 1594 (1094; 2164) | |
| Sc tissue nr pixels | 25320 (18000; 33201) | |
| Sc tissue density | 7.5 (5.2; 12.1) | |
| plasma FruLys [µg/ml] | 267 (146.7; 423.2) | |
| plasma Pyr [ng/ml] | 28.3 (24.9; 28.9) | |
| plasma MG-H1 [ng/ml] | 33.1 (31.3; 36.1) | |
| plasma CEL [ng/ml] | 13.2 (12.9; 13.4) | |
| plasma CML [ng/ml] | 49.1 (46.2; 51.8) | |
| plasma Arg [µg/ml] | 3.6 (2.6; 6.5) | |
| plasma Lys [µg/ml] | 6 (5.2; 7.2) | |
| serum FruLys [µg/ml] | 293.5 (205; 380.9) | |
| serum Pyr [ng/ml] | 28.4 (25.2; 29) | |
| serum MG-H1 [ng/ml] | 33.2 (31.3; 36.3) | |
| serum CEL [ng/ml] | 13.3 (12.8; 13.6) | |
| serum CML [ng/ml] | 46.9 (44.1; 49) | |
| serum Arg [µg/ml] | 5.4 (4.1; 7) | |
| serum Lys [µg/ml] | 6.4 (5.7; 7.6) | |
| urine FruLys [µg/mg Kreatinin] | 3.2 (2.46; 5.3) | |
| urine Pyr [µg/mg Kreatinin] | 0.11 (0.07; 0.18) | |
| urine MG-H1 [µg/mg Kreatinin] | 3.2 (2.1; 5.1) | |
| urine CEL [µg/mg Kreatinin] | 0.3 (0.22; 0.38) | |
| urine CML [µg/mg Kreatinin] | 1.4 (1.1; 2.1) | |
| urine Arg [µg/mg Kreatinin] | 2.2 (1.6; 2.9) | |
| urine Lys [µg/mg Kreatinin] | 8.1 (4.9; 14.5) | |
| saliva FruLys [ng/ml] | 21.9 (21; 24.3) | |
| saliva Pyr [ng/ml] | 1.7 (1.6; 1.7) | |
| saliva MG-H1 [ng/ml] | 3 (2.5; 4.2715) | |
| saliva CEL [ng/ml] | 1.1 (1; 1.3) | |
| saliva CML [ng/ml] | 3.9 (3.2; 4.8) | |
| saliva Arg [µg/ml] | 0.49 (0.24; 0.83) | |
| saliva Lys [µg/ml] | 0.59 (0.26; 0.89) | |
*px – pixels; UV – ultraviolet; sc – subcutaneous tissue.
Table 2.
Correlations between AGE types and epidermal thickness.
| Variable | EPIDERMIS DEPTH (N=113) | |
|---|---|---|
| R | p | |
| plasma FruLys [µg/ml] | 0.170 | 0.071 |
| plasma Pyr [ng/ml] | -0.167 | 0.077 |
| plasma MG-H1 [ng/ml] | 0.208* | 0.027 |
| plasma CEL [ng/ml] | 0.055 | 0.564 |
| plasma CML [ng/ml] | 0.181 | 0.055 |
| plasma Arg [µg/ml] | -0.189* | 0.045 |
| plasma Lys [µg/ml] | -0.170 | 0.071 |
| serum FruLys [µg/ml] | 0.011 | 0.904 |
| serum Pyr [ng/ml] | -0.128 | 0.177 |
| serum MG-H1 [ng/ml] | -0.047 | 0.625 |
| serum CEL [ng/ml] | -0.248** | 0.008 |
| serum CML [ng/ml] | -0.402** | 0.000 |
| serum Arg [µg/ml] | -0.089 | 0.349 |
| serum Lys [µg/ml] | -0.138 | 0.145 |
| saliva FruLys [ng/ml] | 0.045 | 0.637 |
| saliva Pyr [ng/ml] | 0.051 | 0.593 |
| saliva MG-H1 [ng/ml] | 0.204* | 0.030 |
| saliva CEL [ng/ml] | -0.011 | 0.907 |
| saliva Arg [µg/ml] | 0.223* | 0.018 |
| saliva Lys [µg/ml] | 0.115 | 0.224 |
| urine FruLys [µg/mg Kreatinin] | 0.048 | 0.612 |
| urine Pyr [µg/mg Kreatinin] | 0.034 | 0.725 |
| urine MG-H1 [µg/mg Kreatinin] | 0.109 | 0.250 |
| urine CEL [µg/mg Kreatinin] | 0.157 | 0.097 |
| urine CML [µg/mg Kreatinin] | 0.159 | 0.093 |
| urine Arg [µg/mg Kreatinin] | 0.212* | 0.024 |
| urine Lys [µg/mg Kreatinin] | -0.027 | 0.780 |
Table 3.
Correlations between AGE types and epidermal density.
| Variable | EPIDERMIS DENSITY (N=113) | |
|---|---|---|
| r | p | |
| plasma FruLys [µg/ml] | 0.066 | 0.488 |
| plasma Pyr [ng/ml] | -0.010 | 0.913 |
| plasma MG-H1 [ng/ml] | -0.032 | 0.734 |
| plasma CEL [ng/ml] | -0.056 | 0.554 |
| plasma CML [ng/ml] | -0.045 | 0.639 |
| plasma Arg [µg/ml] | 0.006 | 0.949 |
| plasma Lys [µg/ml] | -0.019 | 0.838 |
| serum FruLys [µg/ml] | 0.111 | 0.241 |
| serum Pyr [ng/ml] | -0.082 | 0.386 |
| serum MG-H1 [ng/ml] | -0.003 | 0.972 |
| serum CEL [ng/ml] | 0.015 | 0.877 |
| serum CML [ng/ml] | 0.031 | 0.744 |
| serum Arg [µg/ml] | 0.000 | 0.999 |
| serum Lys [µg/ml] | -0.004 | 0.962 |
| saliva FruLys [ng/ml] | 0.045 | 0.637 |
| saliva Pyr [ng/ml] | 0.051 | 0.593 |
| saliva MG-H1 [ng/ml] | 0.204* | 0.030 |
| saliva CEL [ng/ml] | -0.011 | 0.907 |
| saliva Arg [µg/ml] | 0.223* | 0.018 |
| saliva Lys [µg/ml] | 0.115 | 0.224 |
| urine FruLys [µg/mg Kreatinin] | 0.018 | 0.852 |
| urine Pyr [µg/mg Kreatinin] | -0.003 | 0.975 |
| urine MG-H1 [µg/mg Kreatinin] | 0.012 | 0.896 |
| urine CEL [µg/mg Kreatinin] | 0.086 | 0.366 |
| urine CML [µg/mg Kreatinin] | 0.160 | 0.091 |
| urine Arg [µg/mg Kreatinin] | -0.007 | 0.937 |
| urine Lys [µg/mg Kreatinin] | 0.088 | 0.355 |
Table 4.
Correlations between types of AGEs and depth of dermal collagen affected by UV exposure.
| Variable | UV DERMIS EXPOSURE DAMAGE DEPTH UV AGED DERMIS (N=113) | |
|---|---|---|
| r | p | |
| plasma FruLys [µg/ml] | -0.118 | 0.213 |
| plasma Pyr [ng/ml] | 0.125 | 0.188 |
| plasma MG-H1 [ng/ml] | -0.052 | 0.585 |
| plasma CEL [ng/ml] | 0.145 | 0.126 |
| plasma CML [ng/ml] | -0.065 | 0.492 |
| plasma Arg [µg/ml] | 0.091 | 0.337 |
| plasma Lys [µg/ml] | 0.151 | 0.110 |
| serum FruLys [µg/ml] | -0.070 | 0.464 |
| serum Pyr [ng/ml] | 0.227* | 0.016 |
| serum MG-H1 [ng/ml] | -0.126 | 0.183 |
| serum CEL [ng/ml] | 0.015 | 0.877 |
| serum CML [ng/ml] | -0.115 | 0.224 |
| serum Arg [µg/ml] | -0.010 | 0.912 |
| serum Lys [µg/ml] | 0.071 | 0.453 |
| saliva FruLys [ng/ml] | 0.184 | 0.051 |
| saliva Pyr [ng/ml] | 0.026 | 0.787 |
| saliva MG-H1 [ng/ml] | 0.285** | 0.002 |
| saliva CEL [ng/ml] | 0.039 | 0.685 |
| saliva CML [ng/ml] | 0.295** | 0.001 |
| saliva Arg [µg/ml] | 0.207* | 0.028 |
| saliva Lys [µg/ml] | 0.200* | 0.034 |
| urine FruLys [µg/mg Kreatinin] | -0.035 | 0.710 |
| urine Pyr [µg/mg Kreatinin] | -0.126 | 0.183 |
| urine MG-H1 [µg/mg Kreatinin] | -0.194* | 0.039 |
| urine CEL [µg/mg Kreatinin] | -0.020 | 0.829 |
| urine CML [µg/mg Kreatinin] | -0.252** | 0.007 |
| urine Arg [µg/mg Kreatinin] | -0.070 | 0.460 |
| urine Lys [µg/mg Kreatinin] | 0.064 | 0.498 |
Table 5.
Correlations between types of AGEs and the degree of pixelation of dermal collagen affected by UV ray exposure.
Table 5.
Correlations between types of AGEs and the degree of pixelation of dermal collagen affected by UV ray exposure.
| Variable | UV DERMIS EXPOSURE DAMAGE NR PIXELS (N=113) | |
|---|---|---|
| r | p | |
| plasma FruLys [µg/ml] | -0.029 | 0.763 |
| plasma Pyr [ng/ml] | 0.063 | 0.509 |
| plasma MG-H1 [ng/ml] | -0.075 | 0.432 |
| plasma CEL [ng/ml] | 0.112 | 0.238 |
| plasma CML [ng/ml] | -0.048 | 0.614 |
| plasma Arg [µg/ml] | 0.042 | 0.659 |
| plasma Lys [µg/ml] | 0.106 | 0.263 |
| serum FruLys [µg/ml] | -0.006 | 0.947 |
| serum Pyr [ng/ml] | 0.149 | 0.115 |
| serum MG-H1 [ng/ml] | -0.079 | 0.406 |
| serum CEL [ng/ml] | 0.047 | 0.619 |
| serum CML [ng/ml] | -0.032 | 0.738 |
| serum Arg [µg/ml] | -0.032 | 0.733 |
| serum Lys [µg/ml] | 0.065 | 0.494 |
| saliva FruLys [ng/ml] | 0.104 | 0.272 |
| saliva Pyr [ng/ml] | -0.007 | 0.942 |
| saliva MG-H1 [ng/ml] | 0.193* | 0.041 |
| saliva CEL [ng/ml] | 0.018 | 0.851 |
| saliva CML [ng/ml] | 0.227* | 0.016 |
| saliva Arg [µg/ml] | 0.115 | 0.226 |
| saliva Lys [µg/ml] | 0.123 | 0.193 |
| urine FruLys [µg/mg Kreatinin] | -0.037 | 0.700 |
| urine Pyr [µg/mg Kreatinin] | -0.114 | 0.229 |
| urine MG-H1[µg/mg Kreatinin] | -0.168 | 0.075 |
| urine CEL [µg/mg Kreatinin] | -0.030 | 0.753 |
| urine CML [µg/mg Kreatinin] | -0.240* | 0.011 |
| urine Arg [µg/mg Kreatinin] | -0.072 | 0.452 |
| urine Lys [µg/mg Kreatinin] | 0.058 | 0.542 |
Table 6.
Correlations between types of AGEs and the density of the dermis affected by UV exposure.
| Variable | UV DERMIS EXPOSURE DAMAGE DENSITY (N=111) | |
|---|---|---|
| r | p | |
| plasma FruLys [µg/ml] | 0.363** | 0.000 |
| plasma Pyr [ng/ml] | -0.417** | 0.000 |
| plasma MG-H1 [ng/ml] | -0.036 | 0.709 |
| plasma CEL [ng/ml] | -0.054 | 0.576 |
| plasma CML [ng/ml] | 0.048 | 0.619 |
| plasma Arg [µg/ml] | -0.456** | 0.000 |
| plasma Lys [µg/ml] | -0.394** | 0.000 |
| serum FruLys [µg/ml] | 0.008 | 0.937 |
| serum Pyr [ng/ml] | -0.547** | 0.000 |
| serum MG-H1 [ng/ml] | -0.093 | 0.332 |
| serum CEL [ng/ml] | -0.241* | 0.011 |
| serum CML [ng/ml] | -0.140 | 0.143 |
| serum Arg [µg/ml] | -0.369** | 0.000 |
| serum Lys [µg/ml] | -0.270** | 0.004 |
| saliva FruLys [ng/ml] | 0.104 | 0.272 |
| saliva Pyr [ng/ml] | -0.007 | 0.942 |
| saliva MG-H1 [ng/ml] | 0.193* | 0.041 |
| saliva CEL [ng/ml] | 0.018 | 0.851 |
| saliva CML [ng/ml] | 0.227* | 0.016 |
| saliva Arg [µg/ml] | 0.115 | 0.226 |
| saliva Lys [µg/ml] | 0.123 | 0.193 |
| urine FruLys [µg/mg Kreatinin] | -0.037 | 0.700 |
| urine Pyr [µg/mg Kreatinin] | -0.114 | 0.229 |
| urine MG-H1 [µg/mg Kreatinin] | -0.168 | 0.075 |
| urine CEL [µg/mg Kreatinin] | -0.030 | 0.753 |
| urine CML [µg/mg Kreatinin] | -0.240* | 0.011 |
| urine Arg [µg/mg Kreatinin] | -0.072 | 0.452 |
| urine Lys [µg/mg Kreatinin] | 0.058 | 0.542 |
Table 7.
Correlations between AGE types in biofluids and the density of dermal collagen affected by UV exposure.
Table 7.
Correlations between AGE types in biofluids and the density of dermal collagen affected by UV exposure.
| Variable | UV DERMIS EXPOSURE DAMAGE DENSITY (N=111) | |
|---|---|---|
| r | p | |
| saliva FruLys [ng/ml] | -0.295** | 0.002 |
| saliva Pyr [ng/ml] | -0.006 | 0.951 |
| saliva MG-H1 [ng/ml] | -0.170* | 0.075 |
| saliva CEL [ng/ml] | -0.101 | 0.292 |
| saliva CML [ng/ml] | -0.195* | 0.041 |
| saliva Arg [µg/ml] | -0.180 | 0.059 |
| saliva Lys [µg/ml] | -0.233* | 0.014 |
| urine FruLys [µg/mg Kreatinin] | 0.012 | 0.904 |
| urine Pyr [µg/mg Kreatinin] | 0.137 | 0.152 |
| urine MG-H1 [µg/mg Kreatinin] | 0.196* | 0.039 |
| urine CEL [µg/mg Kreatinin] | 0.135 | 0.156 |
| urine CML [µg/mg Kreatinin] | 0.075 | 0.432 |
| urine Arg [µg/mg Kreatinin] | 0.432 | 0.744 |
| urine Lys [µg/mg Kreatinin] | -0.073 | 0.445 |
Table 8.
Correlations between AGE types in biofluids and dermis depth.
| Variable | DERMIS DEPTH N=113 | |
|---|---|---|
| r | p | |
| plasma FruLys [µg/ml] | 0.113 | 0.233 |
| plasma Pyr [ng/ml] | -0.075 | 0.429 |
| plasma MG-H1 [ng/ml] | -0.145 | 0.125 |
| plasma CEL [ng/ml] | -0.086 | 0.364 |
| Plasma CML | -0.203* | 0.031 |
| plasma Arg [µg/ml] | 0.042 | 0.662 |
| plasma Lys [µg/ml] | 0.090 | 0.342 |
| serum FruLys [µg/ml] | 0.073 | 0.443 |
| serum Pyr [ng/ml] | -0.017 | 0.861 |
| serum MG-H1 [ng/ml] | -0.184 | 0.052 |
| serum CEL [ng/ml] | -0.178 | 0.059 |
| serum CML [ng/ml] | -0.145 | 0.126 |
| serum Arg [µg/ml] | -0.071 | 0.458 |
| serum Lys [µg/ml] | -0.044 | 0.644 |
| saliva FruLys [ng/ml] | 0.158 | 0.095 |
| saliva Pyr [ng/ml] | 0.013 | 0.890 |
| saliva MG-H1 [ng/ml] | 0.158 | 0.096 |
| saliva CEL [ng/ml] | 0.050 | 0.596 |
| Saliva CML | 0.0170 | 0.072 |
| saliva Arg [µg/ml] | 0.154 | 0.104 |
| saliva Lys [µg/ml] | 0.228* | 0.015 |
| urine FruLys [µg/mg Kreatinin] | -0.216* | 0.022 |
| urine Pyr [µg/mg Kreatinin] | -0.111 | 0.243 |
| urine MG-H1 [µg/mg Kreatinin] | -0.224* | 0.017 |
| urine CEL [µg/mg Kreatinin] | -0.172 | 0.069 |
| urine CML [µg/mg Kreatinin] | -0.186* | 0.048 |
| urine Arg [µg/mg Kreatinin] | -0.159 | 0.094 |
| urine Lys [µg/mg Kreatinin] | 0.042 | 0.660 |
Table 9.
Correlations between AGE types in biofluids and the degree of pixelation of the dermis.
| Variable | DERMIS nr pixels N=113 | |
|---|---|---|
| r | p | |
| plasma FruLys [µg/ml] | 0.256** | 0.006 |
| plasma Pyr [ng/ml] | -0.181 | 0.055 |
| plasma MG-H1 [ng/ml] | -0.174 | 0.066 |
| plasma CEL [ng/ml] | -0.123 | 0.194 |
| Plasma CML | -0.177 | 0.061 |
| plasma Arg [µg/ml] | -0.001 | 0.989 |
| plasma Lys [µg/ml] | 0.036 | 0.703 |
| serum FruLys [µg/ml] | 0.174 | 0.066 |
| serum Pyr [ng/ml] | -0.159 | 0.092 |
| serum MG-H1 [ng/ml] | -0.093 | 0.329 |
| serum CEL [ng/ml] | -0.221* | 0.019 |
| serum CML [ng/ml] | 0.005 | 0.957 |
| serum Arg [µg/ml] | -0.077 | 0.420 |
| serum Lys [µg/ml] | -0.033 | 0.033 |
| saliva FruLys [ng/ml] | -0.004 | 0.968 |
| saliva Pyr [ng/ml] | -0.014 | 0.880 |
| saliva MG-H1 [ng/ml] | 0.002 | 0.985 |
| saliva CEL [ng/ml] | -0.012 | 0.896 |
| Saliva CML | 0.046 | 0.629 |
| saliva Arg [µg/ml] | -0.021 | 0.826 |
| saliva Lys [µg/ml] | 0.077 | 0.418 |
| urine FruLys [µg/mg Kreatinin] | -0.221* | 0.019 |
| urine Pyr [µg/mg Kreatinin] | -0.102 | 0.283 |
| urine MG-H1 [µg/mg Kreatinin] | -0.180 | 0.057 |
| urine CEL [µg/mg Kreatinin] | -0.179 | 0.058 |
| urine CML [µg/mg Kreatinin] | -0.177 | 0.061 |
| urine Arg [µg/mg Kreatinin] | -0.158 | 0.095 |
| urine Lys [µg/mg Kreatinin] | 0.038 | 0.690 |
Table 10.
Correlations between AGEs types in biofluids and dermal density.
| Variable | DERMIS density N=113 | |
|---|---|---|
| r | p | |
| plasma FruLys [µg/ml] | 0.098 | 0.304 |
| plasma Pyr [ng/ml] | -0.066 | 0.489 |
| plasma MG-H1 [ng/ml] | 0.066 | 0.485 |
| plasma CEL [ng/ml] | -0.089 | 0.350 |
| Plasma CML | 0.061 | 0.519 |
| plasma Arg [µg/ml] | -0.109 | 0.250 |
| plasma Lys [µg/ml] | -0.210* | 0.026 |
| serum FruLys [µg/ml] | 0.203* | 0.031 |
| serum Pyr [ng/ml] | -0.182 | 0.054 |
| serum MG-H1 [ng/ml] | 0.067 | 0.478 |
| serum CEL [ng/ml] | -0.057 | 0.551 |
| serum CML [ng/ml] | 0.002 | 0.979 |
| serum Arg [µg/ml] | -0.032 | 0.737 |
| serum Lys [µg/ml] | -0.052 | 0.586 |
| saliva FruLys [ng/ml] | -0.053 | 0.580 |
| saliva Pyr [ng/ml] | 0.112 | 0.236 |
| saliva MG-H1 [ng/ml] | 0.050 | 0.601 |
| saliva CEL [ng/ml] | -0.086 | 0.365 |
| Saliva CML [µg/ml] | 0.057 | 0.549 |
| saliva Arg [µg/ml] | -0.041 | 0.669 |
| saliva Lys [µg/ml] | 0.032 | 0.734 |
| urine FruLys [µg/mg Kreatinin] | 0.003 | 0.972 |
| urine Pyr [µg/mg Kreatinin] | 0.150 | 0.112 |
| urine MG-H1 [µg/mg Kreatinin] | 0.171 | 0.071 |
| urine CEL [µg/mg Kreatinin] | 0.220* | 0.019 |
| urine CML [µg/mg Kreatinin] | 0.133 | 0.159 |
| urine Arg [µg/mg Kreatinin] | 0.131 | 0.168 |
| urine Lys [µg/mg Kreatinin] | 0.026 | 0.785 |
Table 11.
Correlations between AGE types in biofluids and subcutaneous tissue depth.
| Variable | SC TISSUE DEPTH N=111 | |
|---|---|---|
| r | p | |
| plasma FruLys [µg/ml] | 0.046 | 0.635 |
| plasma Pyr [ng/ml] | 0.014 | 0.881 |
| plasma MG-H1 [ng/ml] | 0.208* | 0.029 |
| plasma CEL [ng/ml] | 0.008 | 0.936 |
| Plasma CML | 0.135 | 0.158 |
| plasma Arg [µg/ml] | 0.043 | 0.651 |
| plasma Lys [µg/ml] | 0.132 | 0.166 |
| serum FruLys [µg/ml] | -0.063 | 0.513 |
| serum Pyr [ng/ml] | 0.013 | 0.893 |
| serum MG-H1 [ng/ml] | -0.111 | 0.248 |
| serum CEL [ng/ml] | -0.062 | 0.520 |
| serum CML [ng/ml] | -0.290** | 0.002 |
| serum Arg [µg/ml] | -0.118 | 0.217 |
| serum Lys [µg/ml] | 0.083 | 0.388 |
Table 12.
Correlations between AGE types in biofluids and the degree of subcutaneous tissue pixelation.
Table 12.
Correlations between AGE types in biofluids and the degree of subcutaneous tissue pixelation.
| Variable | SC TISSUE NR PIXELS N=111 | |
|---|---|---|
| r | p | |
| plasma FruLys [µg/ml] | 0.134 | 0.162 |
| plasma Pyr [ng/ml] | -0.049 | 0.613 |
| plasma MG-H1 [ng/ml] | 0.201* | 0.035 |
| plasma CEL [ng/ml] | -0.035 | 0.712 |
| Plasma CML | 0.140 | 0.142 |
| plasma Arg [µg/ml] | 0.026 | 0.786 |
| plasma Lys [µg/ml] | 0.103 | 0.283 |
| serum FruLys [µg/ml] | -0.007 | 0.942 |
| serum Pyr [ng/ml] | -0.061 | 0.522 |
| serum MG-H1 [ng/ml] | -0.063 | 0.511 |
| serum CEL [ng/ml] | -0.124 | 0.195 |
| serum CML [ng/ml] | -0.213* | 0.025 |
| serum Arg [µg/ml] | -0.128 | 0.180 |
| serum Lys [µg/ml] | 0.086 | 0.370 |
Table 13.
Correlations between AGEs types in biofluids and subcutaneous tissue density.
| Variable | SC TISSUE DENSITY N=111 | |
|---|---|---|
| r | p | |
| plasma FruLys [µg/ml] | 0.034 | 0.719 |
| plasma Pyr [ng/ml] | -0.089 | 0.351 |
| plasma MG-H1 [ng/ml] | -0.117 | 0.220 |
| plasma CEL [ng/ml] | 0.009 | 0.925 |
| Plasma CML | -0.120 | 0.210 |
| plasma Arg [µg/ml] | -0.117 | 0.220 |
| plasma Lys [µg/ml] | -0.109 | 0.256 |
| serum FruLys [µg/ml] | -0.160 | 0.093 |
| serum Pyr [ng/ml] | -0.114 | 0.233 |
| serum MG-H1 [ng/ml] | 0.087 | 0.363 |
| serum CEL [ng/ml] | 0.746 | 0.746 |
| serum CML [ng/ml] | 0.049 | 0.606 |
| serum Arg [µg/ml] | -0.075 | 0.434 |
| serum Lys [µg/ml] | -0.191* | 0.045 |
Disclaimer/Publisher’s Note: The statements, opinions and data contained in all publications are solely those of the individual author(s) and contributor(s) and not of MDPI and/or the editor(s). MDPI and/or the editor(s) disclaim responsibility for any injury to people or property resulting from any ideas, methods, instructions or products referred to in the content. |
© 2026 by the authors. Licensee MDPI, Basel, Switzerland. This article is an open access article distributed under the terms and conditions of the Creative Commons Attribution (CC BY) license.
Copyright: This open access article is published under a Creative Commons CC BY 4.0 license, which permit the free download, distribution, and reuse, provided that the author and preprint are cited in any reuse.


