
Submitted:
23 February 2026
Posted:
27 February 2026
Read the latest preprint version here
Abstract
The act of receiving and giving help is commonly expected to improve older people’s health. In this article, this expectation is explored through a longitudinal analysis of a representative sample of 29,995 respondents aged 59 to 100 from 12 European countries documented in the Survey of Health, Ageing and Retirement in Europe (SHARE) for the period 2011 to 2022. An unordered correlated random-effects Mundlak (CRE), an ordered fixed-effects logistic (FEO), as well as an ordered random-effects Mundlak logistic panel estimator (REO), all with longitudinal calibrated weights, are used to estimate the relationship between self-perceived health and receiving and giving help. Additionally, the estimators are repeated for testing the robustness of the findings across the five available imputed SHARE datasets. The study supports the positive impact on health status of income, doing activities and being satisfied with life, as well as the negative impact of age, having limitations and being permanently sick. The Danish older people report the best health status, while the Swedish, Belgian, and Dutch jointly hold the second-best health status. Moreover, the value of a helping hand is revealed. Receiving help implies a 24.8 per cent increase in the odds of reporting worse health, yet, when combined with giving help, the latter lowers to 7.7 per cent. Overall, the study confirms the positive effect of receiving and giving help. This suggests that initiating a stimulus for recipients of help to engage in giving help is an opportunity to improve the self-perception of health among older people in Europe.
Keywords:
European Union
; longitudinal
; older people
; self-perceived health
; giving and receiving help
Introduction
Active ageing is commonly regarded as a desirable phenomenon in our global society, given that it is expected to have a positive impact on health and subsequently a negative one on the care burden which societies face worldwide. A valuable social activity for an active life is helping out, which is, in the existing literature, primarily discussed in the context of voluntarism. This social activity of helping out is primarily expected to trigger beneficial effects on well-being and health. An overarching study of this association is provided by de Wit, Qu and Bekkers [1] through their ‘mega-analysis’ across 33 years and 22 European countries of six longitudinal panel surveys, SHARE included. They estimate that, through volunteering, a health advantage of, on average, more than 13 per cent is acquired. The health advantage tends to increase with age, and to be a priori larger for those with a worse state of health. On top of their fixed-effects regressions, first-difference estimators confirm the significant positive influence of continuing volunteering compared to stopping with it. This effect also results from the analysis of Kleiner et al. [2], who document the impact of volunteering on health through quality of life scores extracted from questionnaires and focus groups covering the older Swiss community. The scores are regressed with logistic estimators on variables covering age, gender, education, subsidy recipient, and impairment for both the states of stopped and continued volunteering. They find the odds of a decrease in quality of life to be higher in the stopped state, more precisely 75 per cent and 66 per cent higher for, respectively, self-esteem and autonomy. The study of Weziak-Bialowolska, Skiba, and Bialowolski [3] also supports the health advantage resulting from helping out. Based on SHARE-data from 15 European countries and with generalised estimating models, they document reciprocal longitudinal associations, of which the significant and positive associations of optimism and vitality with doing voluntary activity at least once a week are the most explicit. Other positive psychological well-being effects resulting from volunteering are illustrated by Huo, Miller, Kim, and Liu [4] through an autoregressive cross-lagged panel model based on the Health and Retirement Study Wave 2010 and 2014. Individuals aged 65 or older confirm significantly increased positive self-perceptions of ageing, and decreased negative perceptions when volunteering more than 100 hours. The effect appears not to significantly impact depressive symptoms, just as volunteering less than 100 hours overall. Volunteering at least 200 hours during the past year might even reduce the risk of deterioration or dying for adults with cardiovascular disease. Heisler et al. [5] conclude the latter based on the Health and Retirement Study in the United States with, among others, ordered logistic regressions. The importance of the frequency of volunteering is also illustrated by Lawton, Gramatki, Watt, and Fujiwara [6], who find that more volunteering results in higher well-being in the United Kingdom across a period of 20 years. With fixed-effects estimators they notice that self-rated health on a one-to-five scale increases with the volunteering frequency, i.e. from rarely (baseline) over several times a year (coefficient 0.098, p<.01) to at least once a week (coefficient 0.126, p<.01). Pavlova and Lühr [7] document an additional psychological impact of volunteering on social well-being with data from the 2012 European Social Survey covering 29 European countries. For their three dependent variables representing well-being, i.e. generalised trust, perceived social support, and loneliness, the positive impact of volunteering is significant at a 0.1 level. Significant independent variables at the same level are, among others, education, employment, income, gender, and self-reported general health. Additionally, the impact of offering help tends to vary geographically. Lakomy [8] distinguishes this variation between welfare regimes with panel fixed-effects regressions based on SHARE data from Waves 4 to 6. He finds that caregiving outside the household has no significant influence under any regime, but that providing care within the household significantly influences quality of life under all regimes except the social-democratic one, as found in Denmark or Sweden. In turn, under the latter regime, volunteering has a significant influence on the quality of life as well as in the Mediterranean countries, for example, Italy or Spain. Yet, in conservative countries like Austria, Belgium, France, or Germany, and post-communist countries, like Czech Republic, Estonia and Slovenia, the benefits of voluntarism for quality of life are expected to be limited. Additionally, Morawski, Okulicz-Kozaryn, and Strzelecka [9] find, also with SHARE data, that voluntary work positively correlates to quality of life. Their Kendall tau-b correlation coefficients reveal that intrinsic aspects like self-realisation relate to higher volunteering rates, not extrinsic ones like control. Meneghini and Colledani [10] notice the same dominant contribution of intrinsic motivation to satisfaction with life and well-being in their smaller sample of 133 Italians. They find a 40 per cent increase in life satisfaction allocatable to the commitment to volunteering. Besides improving life quality, those who help out others are also expected to live longer, an expectation which is mediated by prospective health [11]. Lastly, the impact of a health shock on self-perceived health is worth mentioning, given the more recent occurrence of COVID-19. The latter appears to undo the positive effect of volunteering, and might even trigger a negative effect of volunteering on well-being [12]. To conclude, the act of helping out is, besides factors like life satisfaction, health shocks or income, proven to influence well-being, self-perceived health included. Overall, past research indicates that helping behaviour facilitates healthy ageing.
On top of well-being, helping out relates to status. Three kinds of status are documented, i.e. job, financial, and social status. First, job status is known to influence volunteering as well as health. Hämäläinen et al. [13] find that retirement initiates more volunteering, in particular, for those who perceive having better health. Their results rely on fixed-effects panel regressions based on SHARE data from 2011 to 2018 of 19 European countries. Kalbarczyk and Łopaciuk-Gonczaryk [14] use the same dataset, limited to 2011 and 2015, for 14 European countries to conclude, based on a Generalised Structural Equation Model, that “active people remain active and inactive people remain so after retirement”. Besides acknowledging the relevance of retirement, the relationship between volunteering and employment is discussed. Strauss [15] scrutinises five waves of SHARE data from 2004 up to 2015 for 13 nationalities in the EU in the age category 50 years and older. He relies on multi-level random-effects as well as conditional fixed-effects logistic regressions to explore the impact of caregiving on volunteering. His research illustrates how caregivers tend to volunteer more than non-caregivers, as well as that cash-for-care expenditures stimulate both groups to volunteer, likely resulting from receiving compensation for the loss of income from paid work. Almeida-Meza, Di Gessa, Lacey, McMunn, and Xue [16] similarly find carers and former carers to volunteer more than non-carers across five waves of SHARE covering 16 European countries. Moreover, they note that the frequency of care positively relates to the frequency of volunteering. Second, on top of job status, the relationship between financial status and frequency of helping is documented. Hämäläinen et al. [17] explore Waves 4 to 8 of SHARE with a fixed-effects ordered logit model to find a positive relationship between the frequency of volunteering and deteriorating health as well as worsening financial condition. They find that a change to a worse financial condition increases the probability of not volunteering, while the inverse effect, i.e. a change to a better financial condition, appears to have no significant effect. Besides job status, financial status, as measured by income, influences the effect of frequency of participation in formal social activities on loneliness, being an aspect of mental health. Nissanholtz-Gannot and Peretz-Dayan [18] scrutinise this effect through hierarchical multiple regression models for 18 European countries based on Wave 6 of SHARE. Formal social activity is defined as participating in, e.g., charity or social organisations, and can be considered as a conditioned form of helping, as it mostly comes with private financial expenses. Nissanholtz-Gannot et al. find frequent formal social activity relevant for the lower income quintiles, as it significantly reduces the self-perceived loneliness scores. In a similar social context, Näsman et al. [19] discuss formal volunteering jointly with three other factors of civic engagement, e.g., political participation. Relying on data from the European Quality of Life Survey covering 32 European countries, their logistic regressions reveal significant relationships between formal volunteering and individual resources, i.e. education level, income, and health. They conclude that civic engagement, volunteering included, benefits from additional investment in the individual resources on top of the country-level social expenditures. As such, the individual as well as the national financial context is relevant for cultivating a culture of helping out. Lastly, the societal recognition or position a volunteer enjoys is of interest. Sánchez-García et al. [20] conclude, based on 29 countries covered in the European Social Survey (ESS), that people aged 70 years and older “who volunteer are 1.7 times more likely to report better health and life satisfaction”. Additionally, their multilevel regression models with fixed and random effects reveal a significant moderation effect of older people’s social status on volunteering. To conclude, the act of helping others is expected to occur in a context conditioned by the financial, work, and social status.
Data
The longitudinal analysis in this study relies on data from SHARE. The latter is a recurring health survey that inquires European citizens about the effects of health, social, economic and environmental policies. The data used for this study covers Waves 4 to 9, and 12 countries in Europe, being Austria, Germany, Sweden, the Netherlands, Spain, Italy, France, Denmark, Switzerland, Belgium, Czech Republic, and Slovenia. [21,22,23,24,25,26]. The dataset based on the six SHARE waves is unbalanced on the panel level, i.e. on the level of an individual respondent, due to the fact that the same respondents from Wave 4 are taken forward up to Wave 9 without replacement. The latter is accounted for by integrating calibrated longitudinal weights in the estimators. Additionally, the panel time level comes with gaps resulting from the frequency of surveying; nevertheless, this is no cause for concern. Nonetheless, the dataset is well balanced based on gender, as on average 43.9 per cent of the respondents are female and 56.1 per cent are male. Worth mentioning is that it primarily regards retired respondents, given that 75.9 per cent report being retired in Wave 4 (2011), up to 87.9 per cent in Wave 9 (2022).
Besides the structure, the content of the dataset is highlighted. As Table 1 illustrates, the dataset consists of 16 variables, of which four are considered continuous. It consists of 109,546 observations for 29,995 respondents, each reporting maximally six times across the panel time horizon.
Table 1 reveals the one-to-five scale of the dependent variable self-perceived health, which is the health status from Excellent to Poor. The independent variables are primarily individual characteristics, except for the occurrence of COVID-19, the respondent’s unique number and year of survey. As such, the pandemic is specified with a binary variable, which is set to one when the year of survey is 2022. The responses of Wave 8, i.e. from 2020, are not marked as 70 per cent of the interviews for that wave were already conducted at the time of the lockdown [27]. The total time horizon covers Wave 4 for 2011, Wave 5 for 2013, Wave 6 for 2015, Wave 7 for 2017, Wave 8 for 2019/2020, and Wave 9 for 2021/2022. The respondent’s individual characteristics are reflected through 13 independent variables, of which two are of prior interest. First, the former are summarised. Age has a range from 59 to 100 and a mean of approx.74 years, while the respondents’ years of education range from zero to 30, with a mean of 10 years. Total household income is stated, if required through conversion, in Euro and has a minimum of zero and a maximum of approx.94,000 euro. On average, a household reports a total household income of 27,489 euro, which can consist of earnings from any kind of employment, pensions, benefits, rent, financial products, as well as those from other household members. Total household income is preferred as it reflects the financial power of the respondent’s household, which is assumed to be available for supporting the living conditions of the household as a whole, including the respondent. Given its relatively wide scale, the income variable has been standardised by subtracting the mean from each income and subsequently dividing it by the standard deviation. Besides household income, the household type is included in three non-overlapping categories, namely “Single”, “Couple, both responding”, and “Multiple, at least 1 responding”. This variable results from regrouping the original variable with nine categories, of which the categories “Single”, with 37,717 observations, and “Couple, both responding”, with 62,737 observations, are preserved. The newly created category “Multiple, at least 1 responding” comprises the remaining 9,092 observations. Additionally, the variable Job situation indicates if the respondent is retired, employed or self-employed, unemployed, permanently sick or disabled, homemaker, or in another situation (e.g., studying or volunteering). The Job situation variable includes, as three other variables, a category “Not in universe”, which is not included in the output yet bundles the feedback of respondents refusing to answer, not knowing an answer, and the like. For Job situation, this category accounts for 1.6 per cent of the total number of observations. The Being limited binary indicator, also known as the Global Activity Limitation Indicator, reflects a respondent’s limitation in activities because of a health problem, and denotes “Not limited” or “Limited”. The Number of activities last year originally reflects whether the respondent did sports, reading, charity, and the like. It is regrouped to “None”, i.e. participated in no activities, and “At least 1”. It also includes the category “Not in universe”, which accounts for 1.6 per cent of the total number of observations. The variable Country holds the original SHARE country numbers for the 12 European countries in the dataset, being Austria, Germany, Sweden, the Netherlands, Spain, Italy, France, Denmark, Switzerland, Belgium, Czech Republic, and Slovenia. Lastly, the value of a helping hand is reflected in the covariates of interest Receiving help from, and Giving help to others. Both cover help from or to people inside or outside the household provided during the last 12 months, and originally specify an exact number of persons. Both have been converted to a variable with categories “None” and “At least 1”. The “Not in universe” category occurs in both the Receiving and Giving help variables, with, respectively, 7.6 per cent and 21.7 per cent of the total number of observations. In conclusion, the dataset variables are constructed to facilitate the regression analysis as well as to safeguard the integration of a maximum of known relevant determinants.
To visualise the time dimension of the dataset, two figures are included. Figure 1 shows the age distribution of the respondents over time, while Figure 2 plots the average self-perceived health score per country over time.
Figure 1 Age distributions per wave across countries from 2011 to 2022. Based on SHARE-data Wave 4 to 9.
Figure 2 Average self-perceived health status per country per year
Besides the time dimension, the correlation structure of the variables is verified to ensure that the variables are compatible in regression analysis. Both the Pearson and Spearman Rank Order correlations are referred to. Table 2 illustrates the Pearson correlations, which are merely interpretable as an approximation, given that Skewness and Kurtosis tests don’t accept the null hypothesis of normality (n = 109,546) of the continuous variables. Nevertheless, thanks to the sufficiently large sample size, the Pearson correlations remain informative.
Table 2 reveals that the Pearson coefficients are well below a 0.60 threshold. Additionally, the Spearman Rank correlations are calculated between all variables (see Table A1 in Appendix A). Being limited appears strongly yet soundly related to self-perceived health, given the 0.533 correlation coefficient. Life satisfaction modestly correlates with the dependent variable by noting a -0.353 coefficient. On top, Total household income appears correlated with the Household type as well as with Receiving help, given their coefficients of, respectively, 0.352 and -0.358. Overall, the correlation tests do not suggest the exclusion of any of the selected variables for the regression analysis.
Two final characteristics of the dataset are worth mentioning. First, as commonly experienced with surveys, SHARE has issues of non-response and subsequently missing values. The SHARE data uses two approaches to handle these issues, i.e. the Hot-deck Imputations and Fully Conditional Specification approach. The former is used for negligible fractions of missing data, primarily of socio-demographic characteristics, and replaces the missing values with those of a similar recipient or donor. The latter handles the sizeable fractions of missing values, primarily in monetary variables. The imputation procedure is repeated five times, which results in five imputed datasets differing only in values, not structure. Completing a robustness test by repeating the regression analysis across the five imputed datasets is motivated by the fact that 12 of the 14 regressed variables, including the dependent variable, are referred to as being imputed with one of the two imputation procedures [27]. Second, the analysis of SHARE data across the targeted time horizon preferably integrates calibrated longitudinal weights, which are calculated based on the reweighing procedure advised by Pacifico [28]. This procedure reweighs the data according to the mortality per year, country, age and gender as provided by Eurostat. It aims to “compensate for both problems of unit nonresponse in the baseline and refreshment samples of each wave, and problems of attrition in the longitudinal samples of different waves” [29]. Both imputations and weights are expected to improve the longitudinal analysis.
Methods
This study implements a brief descriptive as well as an extensive regression analysis. The former maps, per category, the self-perceived health per year, its transitions between years, and its relation to the two covariates of interest, being Receiving and Giving help. For the regression analysis, a set of estimators is programmed in Stata 19.5 Basic Edition. It regards the commonly used fixed-effects (FE) and random-effects panel estimators (RE), with a preference for the additional variants that can take the order of the dependent variable, i.e. self-perceived health status, into account. A first concern is the choice between the fixed-effects and random-effects estimator. As such, for the dataset used, the Breusch and Pagan Lagrange test suggests not to accept the null hypothesis that the unit-specific error term has zero variance (Chi Squared 15,517.97, p=.0). Thus, the use of a random effects estimator is most efficient. Yet, the Hausman specification test reveals that the differences between both estimators are significantly different from zero (Chi squared 7950.301, p=.0), and the Mundlak specification test shows that the unit-specific error terms (i.e. per respondent) are correlated with the covariates (Chi squared 7374.43, p=.0). The three test results combined point towards the use of an unordered random-effects estimator with the Mundlak correction, i.e. CRE. This correction implies adding the time averages of the explanatory variables, which subsequently allows estimating the unit-specific error terms. The correction can also be applied to an ordered estimator, as, for example, illustrated by Cullinan, Gannon, and Lyons [30] who applied the correction to a pooled ordered probit model with standard of living on a one-to-six scale as the dependent variable. As such, the use of an ordered random-effects Mundlak logistic panel estimator, i.e. REO, is considered appropriate. Additionally, for comparison, the ordered fixed-effects logistic panel estimator or FEO of Baetschmann, Ballantyne, Staub, and Winkelmann [31] is documented. Lastly, as they differ, the underlying estimation methods of the estimators are summarised subsequently. The FE relies on the Ordinary Least Squares estimation method, while RE and CRE are implemented with the Generalised Least Squares method. The FEO uses the Blow-up and Cluster method, and the REO the Maximum Likelihood method. A priori, the CRE, FEO and REO are preferred. The latter are implemented with robust standard errors according to the estimation approach of Huber [32] and White [33]. Moreover, they integrate calibrated longitudinal weights specifically calculated for this study, and report coefficients or odds ceteris paribus.
Descriptive Analysis
To exploit the informativeness of the data, a descriptive analysis is documented of the dependent variable, i.e. self-perceived health, as well as of the two covariates of interest, i.e. Receiving and Giving help. Table 3 shows the distribution of older people’s reported health status across its five categories per year.
Table 3 illustrates that a category’s rank within years holds across the years. As such, the categories fluctuate around the following percentages across the time horizon: “Good” (approx. 40 per cent), “Fair” (approx. 29 per cent), “Very good” (approx. 15 per cent), “Poor” (approx. 11 per cent) and “Excellent” (approx. 5 per cent). On top, the health status moves gradually towards the middle category, as reflected by the combined decrease in 2022 of the categories “Poor” and “Excellent” of approximately three percentage points in favour of the category “Good”. Another interesting movement is how the respondents transition between categories over the years. Table 4 documents the transitions for the entire time horizon.
The transition probabilities in Table 4 on the main left diagonal indicate that the respondent most likely rates the same health score. Moreover, no large shifts to the extreme categories can be noted, as illustrated by the low percentages in the top right and bottom left corners. A respondent appears to move primarily to neighbouring categories. As such, with a 33.4 per cent likelihood, the respondent shifts from “Excellent” to the nearest lower category “Very good”, while, likewise, with a 38.7 per cent likelihood from “Very good” to “Good”. The transition from “Good” is also primarily downwards, given that a respondent moves 23.8 per cent of the time to the category “Fair”. The lowest but one category turns the trend as a 28.7 per cent likelihood applies to the shift from “Fair” to “Good”. The lowest category, “Poor”, notes a 34.3 per cent likelihood that a respondent shifts to the category “Fair”. Lastly, the total reveals that approximately 40 per cent of the time a respondent marks a good health status.
After the dependent variable, the two variables of interest are described and subsequently analysed. Table 5 describes the Receiving help variable according to the categories of self-perceived health.
Table 5 shows that, over time, a minimum of 50.1 per cent and a maximum of 88.9 per cent of the respondents report receiving no help, while a minimum of 11.1 per cent and a maximum of 49.9 per cent apply to those who report receiving help. These boundaries indicate that respondents dominantly receive no help across the time horizon. Another finding is that receiving help negatively relates to health status. Of those who report a poor health status, 43.7 per cent of all respondents across years report receiving help, while of those who report an excellent health status, merely 14.7 per cent receive help. This is no surprise as poor health suggests a need for additional help, and vice versa. Across categories and years, the majority of the older people consistently report not receiving help; however, across years, the cohort that receives help grows from 20.4 per cent in 2011 to 31.4 per cent in 2022. Overall, an increasing trend in receiving help arises from the data. To reveal the trend in the variable, it is described in Table 6.
For Giving help, an inverse trend can be concluded as giving help positively relates to self-perceived health status. In total, 37.3 per cent of the older people across years who report excellent health actually give help to at least one other, while merely 10.8 per cent of those who report poor health provide a helping hand. Overall, a larger part of the population appears not to give help. Over time, a minimum of 55.7 per cent and a maximum of 91.7 per cent of the respondents report not giving help, while a minimum of 8.3 per cent and a maximum of 44.3 per cent applies to the givers of help. Moreover, a declining trend over the years suggests that fewer people give help. To conclude, the descriptive analysis documents a diminishing trend of giving help and an increasing one of receiving help. In the subsequent section, the regression analysis will explore the relations between self-perceived health and receiving as well as giving help in depth while accounting for the influence of other health determinants.
Results
The value of a helping hand is estimated through five estimators, of which two are considered supportive for the choice of estimator, while three are regarded as valuable for interpretation. The coefficients with standard errors and the estimators’ specifications of all five estimators are listed in Table 7.
Table 7 shows, in the second and third columns, the output of the FE and RE, which show differences in sign and significance, yet are primarily reported to support the Breusch and Pagan Lagrange test, the Hausman specification test, and the Mundlak specification test. Based on the FE and RE, the three tests suggest the RE being the most efficient, given that a Mundlak correction is implemented. The latter, i.e. CRE, is reported in column four and relies on a Generalised Least Squares estimation method which provides robust standard errors. It integrates longitudinal weights on top of the Mundlak means, which appear most relevant as supported by the zero p-value of the Mundlak specification test. The primary disadvantage of the CRE is that it is unable to take the order of the dependent variable, i.e. self-perceived health, into account. Nevertheless, it explains a considerable amount of variation (R-Squared 0.447). Moreover, it reports a non-zero panel-level deviation (0.439), which supports the use of a panel instead of a pooled estimator, as well as a non-zero variance due to random individual differences, i.e. the random effects (0.319, not documented in a table). Moreover, the CRE confirms the theory of Yair Mundlak as its time-variant coefficients are the same as those of the FE, yet estimated with the more efficient random effects method. For convenience, the effects are interpreted per variable as specified in Table 7. The odds ratio of the REO is referred to between brackets unless specified otherwise.
First, the results for the time-invariant variables Gender and Country, inestimable for the FEO, are highlighted. As such, older women appear to report a better health status (coefficient -0.018, SE 0.007, p<.05) on average across years, yet the REO marks this effect as insignificant (1.005, SE 0.040, p>.05), implying that there is no notifiable difference, on average across years, in the health reporting of men and women. For the variable Country, merely the ORs of the more accurate REO are interpreted as they express the same as the coefficients of the CRE. As such, Danish older people consistently mark a better health status (0.734, SE 0.056, p<.001) than the Swedish, while the odds to report a less healthy status than the Swedish are two to three times higher for older Spanish (3.249, SE 0.258, p<.001), Italian (2.262, 0.171, p<.001), and Slovenian citizens (2.198, 0.194, p<.001). The remaining countries report a more average health status, ranging incrementally from Austria (1.179, SE 0.077, p<.05), over Switzerland, Czech Republic and France, to Germany (1.863, SE 0.137, p<.001). In contrast to the findings from Figure 2, the Low Countries, i.e. Belgium and the Netherlands, report non-significant coefficients, implying that they do not differ from Sweden.
Second, the time-variant variables are interpreted. For four continuous variables, nonlinearity is tested through their squares. For age and its square, the CRE and FEO contrast in significance, while the REO marks the main effect insignificant (0.955, SE 0.044, p>.05) and the nonlinear negative effect on health as significant (1.001, SE 0.000, p<.01). None of the latter three estimators finds nor the years of education nor its squares significantly impacting the health status. However, they dominantly mark the total household income (0.897, SE 0.032, p<.01) and its square (1.034, SE 0.017, p<.05), as well as the life satisfaction level (0.807, SE 0.04, p<.001) as positive influencers of health. For the remaining seven categorical variables, two appear to be mainly not significant, i.e. the impact of COVID-19, and four out of five categories of the variable Job situation. For the latter, only being permanently sick or disabled increases the odds of reporting a lower health status (1.851, SE 0.306, p<.001) compared to the baseline, i.e. the older people who are employed. Additionally, four categorical variables are consistently significant. Households with a couple of which both are responding (1.205, 0.087, p<.01), as well as with multiple members of which at least one is responding (1.221, 0.120, p<.05), considerably increase the odds of reporting a less favourable health status compared to older people who live alone. Being limited in activities due to health problems drastically increases the expectation of reporting worse health (3.904, 0.131, p<.001), while participating in at least one activity decreases this expectation compared to the baseline of no participation (0.812, SE 0.037, p<.001). Regarding the two variables of interest, all three estimators consider that receiving help significantly impacts the health status. In particular, the REO reveals that receiving help from at least one other person implies a 24.8 per cent increase in the odds of reporting worse health (1.248, SE 0.056, p<.001). For the act of giving help, the interpretation of significance levels of the CRE, FEO and REO is twofold. Or, the main effects are considered significant as suggested by the CRE (coefficient -0.025, SE 0.008, p<.01) and FEO (0.903, SE 0.043, p<.05), and the interactions with Receiving help are considered not significant. Or, the interaction effect of giving help and receiving help (0.863, SE 0.064, p<.05), and not the main effect of giving help, is regarded as relevant for health status. For two reasons, the latter is assumed to be most rational. First, the CRE neglects the order of the dependent variable; second, the FEO is expected to be less efficient than the REO. As such, the value of a helping hand is confirmed by the fact that, on average across years, older people who receive help from at least one other person are 24.8 per cent more likely to report worse health. Yet, when they, on top, also give help, the odds are lower, i.e. merely 7.7 per cent higher, to report worse health. As such, this decrease of 17.1 percentage points reflects the positive value of a helping hand and suggests an improvement in health status thanks to the act of giving help.
To support the results of the regression analysis, a robustness check is documented (see Materials and Code availability). As such, to account for the SHARE imputation procedure, the CRE, FEO, and REO referred to in Table 7 are also estimated with the remaining four imputed datasets. The CRE reports for the 13 significant coefficients, the same significance level and sign for all five imputed datasets. On top, three estimated coefficients are numerically the same for these five regressions, while the remaining coefficients deviate on average by 0.004 and maximally by 0.011. For the FEO, the same significant eight estimated odds ratios appear with the same sign, yet with three times another significance level for two estimated odds ratios. The difference between the estimated FEO odds ratios is minimally 0.004 and maximally 0.091. For the REO, 18 estimated odds ratios maintain the same sign; however, six differ in significance level, of which three even altered into non-significant odds ratios across the five imputed datasets, namely “Total household income” as well as its square, and “Household: Multiple, at least 1 responding”. Besides the latter, the squared age is consistently identical, while the largest variation in the REO odds ratios is 0.106 and detected in the job situation category “Permanently sick or disabled”. Overall, these findings illustrate that the robustness of the regression output is primarily related to the complexity of the estimator, not the imputation procedure. To conclude, the findings documented in Table 7 based on the first imputed dataset are regarded as robust, except for the household type and total household income as well as its squares.
Besides the interpretation of the coefficients, the estimators CRE, FEO, and REO are used to predict margins and marginal effects. However, all three underperform in estimating predictions due to the Giving help variable. For the latter, its limited number of observations in certain time segments is expected to cause the underperformance. As such, solely the best performing, i.e. the CRE, is used to generate plots of and predictions for the average older European citizen. First, three plots with margins are documented for the effect of Receiving as well as Giving help on, respectively, age, income, and life satisfaction. Figure 3 reports the predictions for the self-perceived health status of older people according to four combinations of receiving and giving help.
Figure 3 CRE Margins of responses of the self-perceived health score according to age, visualised in steps of five years from 60 to 90 years. Four combinations of receiving and giving help are plotted, each from or to no other, and from or to at least one other. The legend specifies Receiving help and subsequently Giving help.
Figure 4 CRE Margins of responses of the self-perceived health score according to income (standardised), visualised in steps of 9,737.517 euro (0.4) from zero (-1.1) to 87,637.651 euro (2.5). Four combinations of receiving and giving help are plotted, each from or to no other, and from or to at least one other. The legend specifies Receiving help and subsequently Giving help.
Figure 5 CRE Margins of responses of the self-perceived health score according to the level of life satisfaction, visualised in steps of one from zero to ten. Four combinations of receiving and giving help are plotted, each from or to no other, and from or to at least one other. The legend specifies Receiving help and subsequently Giving help.
Table 8 illustrates that the predictive margins are consistently lower, i.e. reflecting better health status, for those who give help. The predictions are the same across imputed datasets, except for a varying third digit after the decimal point of two coefficients. As expected, receiving help is predicted to relate to a worse health status, i.e. a higher score.
Discussion
This study elaborates on the positive effects of giving help, which is commonly explored in the context of volunteering. It documents the relationship between self-perceived health status and receiving as well as giving help for older people in 12 European countries based on the data of SHARE. The results, obtained through an ordered random effects logistic panel estimator with Mundlak correction, support that giving help is primarily beneficial for the self-perceived health of older people who also receive help. This is an important finding as it documents the nuance of helping out beyond the commonly concluded positive effect of volunteering [1,4,9,34]. This finding is facilitated by the fact that the study exploits the informativeness of the order in the dependent variable, as well as the fact that it relies on a random-effects estimator, being the most efficient one for the study. Additionally, through repeating the analysis for each SHARE imputed dataset, as well as including known determinants of health like age or income, bias is expected to be limited. Nevertheless, despite its strengths, the study is exposed to weaknesses. Exploiting informativeness through the order of the dependent variable implies not exploiting the health information available in the original dataset. The latter is commonly done by constructing an index which combines a series of health-related indicators, e.g. an index reflecting the quality of life [9]. Similarly, the act of helping out is represented by a single indicator, while a combination of indicators is feasible. E.g. Lakomy [8] maps the effect of separate activities like volunteering, care-giving, club membership, and the like, on well-being. Furthermore, all estimators failed to capture the effect of COVID-19, while a positive influence, primarily on mental health, is expected [34,35]. For now, the simplicity of this binary indicator is the sole explanation for its insignificance. Lastly, additional mediation and interaction effects resulting from national or individual differences are not documented. However, the relationship between self-perceived health status and receiving as well as giving help is expected to be influenced by prospective health, social culture, status and engagement [10,11,16,36]. Nonetheless, the occurrence in isolation of the interaction effect found in this study between receiving and giving help remains remarkable. For future research, the exploration of the persistent effects of receiving and giving help in relation to health status is proposed in order to further document the value of a helping hand and safeguard the act of helping out in our societies.
Conclusion
Active ageing reflects a lifestyle which is beneficial for the health of older people. An important aspect of this lifestyle is the act of helping and its contribution to health. This study documents the value of giving help, which appears more beneficial for European older people who also receive help. As such, the act of giving help decreases the odds of reporting a less favourable health status by 17.1 percentage points. This finding suggests seizing the opportunity of stimulating older people who receive help, to also give help. This stimulus can be provided by caretakers, policymakers, family, and the like, as it is expected to improve the self-perceived health status overall.
Statement of funding: The SHARE data collection has been funded by the European Commission, DG RTD through FP5 (QLK6-CT-2001-00360), FP6 (SHARE-I3: RII-CT-2006-062193, COMPARE: CIT5-CT-2005-028857, SHARELIFE: CIT4-CT-2006-028812), FP7 (SHARE-PREP: GA N°211909, SHARE-LEAP: GA N°227822, SHARE M4: GA N°261982, DASISH: GA N°283646) and Horizon 2020 (SHARE-DEV3: GA N°676536, SHARE-COHESION: GA N°870628, SERISS: GA N°654221, SSHOC: GA N°823782, SHARE-COVID-19: GA N°101015924) and by DG Employment, Social Affairs & Inclusion through VS 2015/0195, VS 2016/0135, VS 2018/0285, VS 2019/0332, VS 2020/0313, SHARE-EUCOV: GA N°101052589 and EUCOVII: GA N°101102412. Additional funding from the German Federal Ministry of Research, Technology and Space (01UW1301, 01UW1801, 01UW2202), the Max Planck Society for the Advancement of Science, the U.S. National Institute on Aging (U01_AG09740-13S2, P01_AG005842, P01_AG08291, P30_AG12815, R21_AG025169, Y1-AG-4553-01, IAG_BSR06-11, OGHA_04-064, BSR12-04, R01_AG052527-02, R01_AG056329-02, R01_AG063944, HHSN271201300071C, RAG052527A) and from various national funding sources is gratefully acknowledged (see www.share-eric.eu).
Materials and Code availability: To provide insight into the longitudinal analysis completed in this article, do- and log-files of Stata are available via https://github.com/hansgevers/thevalueofahelpinghand.git. Additionally, the illustrations included in this paper, as well as the graphs of the calibrated longitudinal weights versus the design weights per country for imputed dataset one, are available via the hyperlink.
Statement of competing interests: There are no conflicts of interest. The content of this article solely relies on the view of the author.
Appendix A

Table A1.
Spearman Rank Order correlation coefficients for all 16 variables, continuous and categorical.
Table A1.
Spearman Rank Order correlation coefficients for all 16 variables, continuous and categorical.
| 1 | 2 | 3 | 4 | 5 | 6 | 7 | 8 | 9 | 10 | 11 | 12 | 13 | 14 | 15 | 16 | ||
|---|---|---|---|---|---|---|---|---|---|---|---|---|---|---|---|---|---|
| 1 | Self-perceived health | 1 | |||||||||||||||
| 2 | Age | 0.222 | 1 | ||||||||||||||
| 3 | Years of education | -0.193 | -0.157 | 1 | |||||||||||||
| 4 | Total household income | -0.248 | -0.165 | 0.181 | 1 | ||||||||||||
| 5 | Gender | 0.054 | 0.028 | -0.089 | -0.130 | 1 | |||||||||||
| 6 | Household type | -0.104 | -0.241 | 0.061 | 0.352 | -0.246 | 1 | ||||||||||
| 7 | Job situation | -0.011 | -0.174 | -0.117 | 0.001 | 0.177 | 0.059 | 1 | |||||||||
| 8 | Occurrence of COVID-19 | 0.012 | 0.225 | 0.022 | 0.054 | 0.017 | -0.062 | -0.056 | 1 | ||||||||
| 9 | Year of survey | 0.024 | 0.352 | 0.038 | -0.117 | 0.024 | -0.095 | -0.135 | 0.536 | 1 | |||||||
| 10 | Respondent’s unique number | 0.051 | 0.027 | -0.071 | -0.003 | -0.011 | 0.060 | 0.057 | 0.013 | 0.003 | 1 | ||||||
| 11 | Being limited | 0.533 | 0.206 | -0.083 | -0.151 | 0.065 | -0.108 | -0.032 | 0.035 | 0.042 | -0.022 | 1 | |||||
| 12 | Receiving help from others | 0.160 | 0.203 | -0.014 | -0.358 | 0.082 | -0.188 | -0.057 | -0.009 | 0.208 | -0.102 | 0.178 | 1 | ||||
| 13 | Giving help to others | -0.082 | -0.193 | 0.054 | -0.090 | -0.055 | 0.144 | 0.025 | -0.165 | -0.150 | -0.046 | -0.053 | 0.227 | 1 | |||
| 14 | Life satisfaction | -0.353 | -0.032 | 0.068 | 0.190 | -0.047 | 0.128 | -0.007 | 0.024 | 0.029 | -0.070 | -0.226 | -0.075 | 0.051 | 1 | ||
| 15 | Number of activities last year | -0.166 | -0.062 | 0.250 | 0.159 | 0.013 | -0.017 | -0.225 | -0.010 | 0.006 | -0.151 | -0.071 | 0.005 | 0.045 | 0.125 | 1 | |
| 16 | Country | 0.026 | -0.017 | 0.165 | -0.200 | 0.017 | -0.021 | -0.101 | -0.015 | 0.014 | 0.000 | 0.024 | 0.069 | 0.017 | -0.101 | 0.039 | 1 |
References
- de Wit, A.; Qu, H.; Bekkers, R. : The health advantage of volunteering is larger for older and less healthy volunteers in Europe: a mega-analysis. European Journal of Ageing 2022, 19(4), 1189–1200. [Google Scholar] [CrossRef] [PubMed]
- Kleiner, A.; Henchoz, Y.; Fustinoni, S.; Seematter-Bagnoud, L. : Volunteering transitions and change in quality of life among older adults: A mixed methods research. Archives of Gerontology and Geriatrics 2022, 98, 104556. [Google Scholar] [CrossRef]
- Weziak-Bialowolska, D.; Skiba, R.; Bialowolski, P. : Longitudinal reciprocal associations between volunteering, health and well-being: evidence for middle-aged and older adults in Europe. European Journal of Public Health 2024, 34(3), 473–481. [Google Scholar] [CrossRef]
- Huo, M.; Miller, L.; Kim, K.; Liu, S. : Volunteering, Self-Perceptions of Aging, and Mental Health in Later Life. Gerontologist 2021, 61(7), 1131–1140. [Google Scholar] [CrossRef] [PubMed]
- Heisler, M.; Choi, H.; Piette, J. D.; Rosland, A.; Langa, K. M.; Brown, S. : Adults with cardiovascular disease who help others: a prospective study of health outcomes. Journal of Behavioral Medicine 2013, 36(2), 199–211. [Google Scholar] [CrossRef] [PubMed]
- Lawton, R. N.; Gramatki, I.; Watt, W.; Fujiwara, D. : Does Volunteering Make Us Happier, or Are Happier People More Likely to Volunteer? Addressing the Problem of Reverse Causality When Estimating the Wellbeing Impacts of Volunteering. Journal of Happiness Studies 2021, 22(2), 599–624. [Google Scholar] [CrossRef]
- Pavlova, M.; Lühr, M. : Volunteering and political participation are differentially associated with eudaimonic and social well-being across age groups and European countries. Plos One 2023, 18(2), e0281354. [Google Scholar] [CrossRef]
- Lakomy, M. : The effect of roles prescribed by active ageing on quality of life across European regions. Ageing & Society 2023, 43(3) PII S0144686X21000726, 664–688. [Google Scholar] [CrossRef]
- Morawski, L.; Okulicz-Kozaryn, A.; Strzelecka, M. : Elderly Volunteering in Europe: The Relationship Between Volunteering and Quality of Life Depends on Volunteering Rates. Voluntas 2022, 33(2), 256–268. [Google Scholar] [CrossRef]
- Meneghini, A. M.; Colledani, D. : 'Doing well by doing good': When and how volunteering fosters hedonic and eudaimonic well-being. The Humanistic Psychologist 2024, 52(1), 102–118. [Google Scholar] [CrossRef]
- Hilbrand, S.; Coall, D. A.; Meyer, A. H.; Gerstorf, D.; Hertwig, R. : A prospective study of associations among helping, health, and longevity. Social Science & Medicine 2017, 187, 109–117. [Google Scholar] [CrossRef]
- Nappo, N.; Fiorillo, D.; Lavadera, G. : Unmet healthcare needs and volunteering during the COVID-19 pandemic in the European Union: Exploring heterogeneity in age classes. Annals of Public and Cooperative Economics 2025. [Google Scholar] [CrossRef]
- Hämäläinen, H.; Tanskanen, A.; Arpino, B.; Solé-Auró, A.; Danielsbacka, M. : Is Transition to Retirement Associated With Volunteering? Longitudinal Evidence from Europe. Research on Aging 2024, 46(9-10), 509–520. [Google Scholar] [CrossRef]
- Kalbarczyk, M.; Łopaciuk-Gonczaryk, B. : Social and private activity after retirement—substitutes or complements. BMC Geriatrics 2022, 22(1), 781. [Google Scholar] [CrossRef]
- Strauss, S. : Multiple engagement: the relationship between informal care-giving and formal volunteering among Europe's 50+population. Ageing & Society 2021, 41(7), 1562–1586. [Google Scholar] [CrossRef]
- Almeida-Meza, P.; Di Gessa, G.; Lacey, R.; McMunn, A.; Xue, B. : Care provision and social participation among older adults in Europe: longitudinal evidence from the Survey of Health, Ageing and Retirement in Europe and the English Longitudinal Study of Ageing. European Journal of Ageing 2025, 22(1), 24. [Google Scholar] [CrossRef]
- Hämäläinen, H.; Tanskanen, A. O.; Arpino, B.; Abuladze, L.; Solé-Auró, A.; Danielsbacka, M. : Changes in Resources and Volunteering: A Longitudinal Study of Active Engagement Among Older Europeans. The Gerontologist 2024, 65(1). [Google Scholar] [CrossRef]
- Nissanholtz-Gannot, R.; Peretz-Dayan, H. : Equal Opportunities in Aging: Income Level Moderates the Relationship Between Infrequent Participation in Formal Social Activities and Loneliness Among Older Adults. Journal of Applied Gerontology 2023, 42(9), 1982–1992. [Google Scholar] [CrossRef]
- Näsman, M.; Nyqvist, F.; Nygård, M.; Vercauteren, T.; Dury, S.; Serrat, R. : Multidimensional Civic Engagement in Later Life in 32 European Countries-an Exploration of the Roles of Socio-Structural Resources and Welfare State Commitment. Research on Aging 2026, 48(2), 113–126. [Google Scholar] [CrossRef]
- Sánchez-García, J.; Lima, M. L.; Marques, S.; Gil-Lacruz, A. I.; Gil-Lacruz, M. : National Perceptions of Over-70s' Status as a Moderator in the Link Between Volunteering and Subjective Well-Being Among Older Adults in 29 European Countries. Journal of Applied Social Psychology 2025, 55(6), 413–428. [Google Scholar] [CrossRef]
- SHARE-ERIC: Survey of Health, Ageing and Retirement in Europe (SHARE) Wave 4 (Version 9.0.0). 2024a. [CrossRef]
- SHARE-ERIC: Survey of Health, Ageing and Retirement in Europe (SHARE) Wave 5 (Version 9.0.0). 2024b. [CrossRef]
- SHARE-ERIC: Survey of Health, Ageing and Retirement in Europe (SHARE) Wave 6 (Version 9.0.0). 2024c. [CrossRef]
- SHARE-ERIC: Survey of Health, Ageing and Retirement in Europe (SHARE) Wave 7 (Version 9.0.0). 2024d. [CrossRef]
- SHARE-ERIC: Survey of Health, Ageing and Retirement in Europe (SHARE) Wave 8 (Version 9.0.0). 2024e. [CrossRef]
- SHARE-ERIC: Survey of Health, Ageing and Retirement in Europe (SHARE) Wave 9 (Version 9.0.0). 2024f. [CrossRef]
- SHARE-ERIC: Survey of Health, Ageing and Retirement in Europe (SHARE) Release Guide (Version 9.0.0). SHARE-ERIC. 28 March 2024. Available online: https://share-eric.eu/fileadmin/user_upload/Release_Guides/easySHARE_Release_9.0.0_ReleaseGuide.pdf (accessed on 13 December 2025).
- Pacifico, D. : sreweight: A Stata command to reweight survey data to external totals. The Stata Journal 2014, 14(1), 4–21. [Google Scholar] [CrossRef]
- De Luca, G.; Rossetti, C. : Survey of Health, Ageing and Retirement in Europe (SHARE) Computing Calibrated Weights. 29 March 2018. Available online: https://share-eric.eu/fileadmin/user_upload/pdf_documentation/SHARE_calibrated_weights_user_guide.pdf (accessed on 30 December 2025).
- Cullinan, J.; Gannon, B.; Lyons, S. : Estimating the extra cost of living for people with disabilities. Health Economics 2011, 20(5), 582–599. [Google Scholar] [CrossRef]
- Baetschmann, G.; Ballantyne, A.; Staub, K. E.; Winkelmann, R. : feologit: A new command for fitting fixed-effects ordered logit models. The Stata Journal 2020, 20(2), 253–275. [Google Scholar] [CrossRef]
- Huber, P.J. : The behavior of maximum likelihood estimates under nonstandard conditions. Proceedings of the Fifth Berkeley Symposium on Mathematical Statistics and Probability, Volume 1: Statistics 1967, 1(1), 221–233. [Google Scholar]
- White, H. : A Heteroskedasticity-Consistent Covariance Matrix Estimator and a Direct Test for Heteroskedasticity. Econometrica 1980, 48, 817–838. [Google Scholar] [CrossRef]
- Weziak-Bialowolska, D.; Bialowolski, P. : Helping and Volunteering During COVID-19: Associations With Well-Being and Psychological Distress. American Journal of Preventive Medicine 2024, 66(4), 645–654. [Google Scholar] [CrossRef] [PubMed]
- Kelle, N.; Bünning, M.; Simonson, J. : COVID-19 Pandemic, Volunteering, and Well-Being: Volunteering's Role in Mitigating Depressive Symptoms, Loneliness, and Perceived Social Exclusion during the Pandemic. Social Indicators Research 2025, 180(1), 49–68. [Google Scholar] [CrossRef]
- Garcia-Perez, A.; Cegarra-Navarro, J. G.; Sallos, M. P.; Martinez-Caro, E.; Chinnaswamy, A. : Resilience in healthcare systems: Cyber security and digital transformation. Technovation 2023, 121, 102583. [Google Scholar] [CrossRef]
Figure 1.
shows how the age distribution of respondents in the dataset varies across the time horizon. It reflects how the respondents’ average age moves from 70 years old in 2011, closer to the age of 80 in 2022. Moreover, the plot visualises the ageing of the sample population. Fewer respondents appear to reach the higher ages.
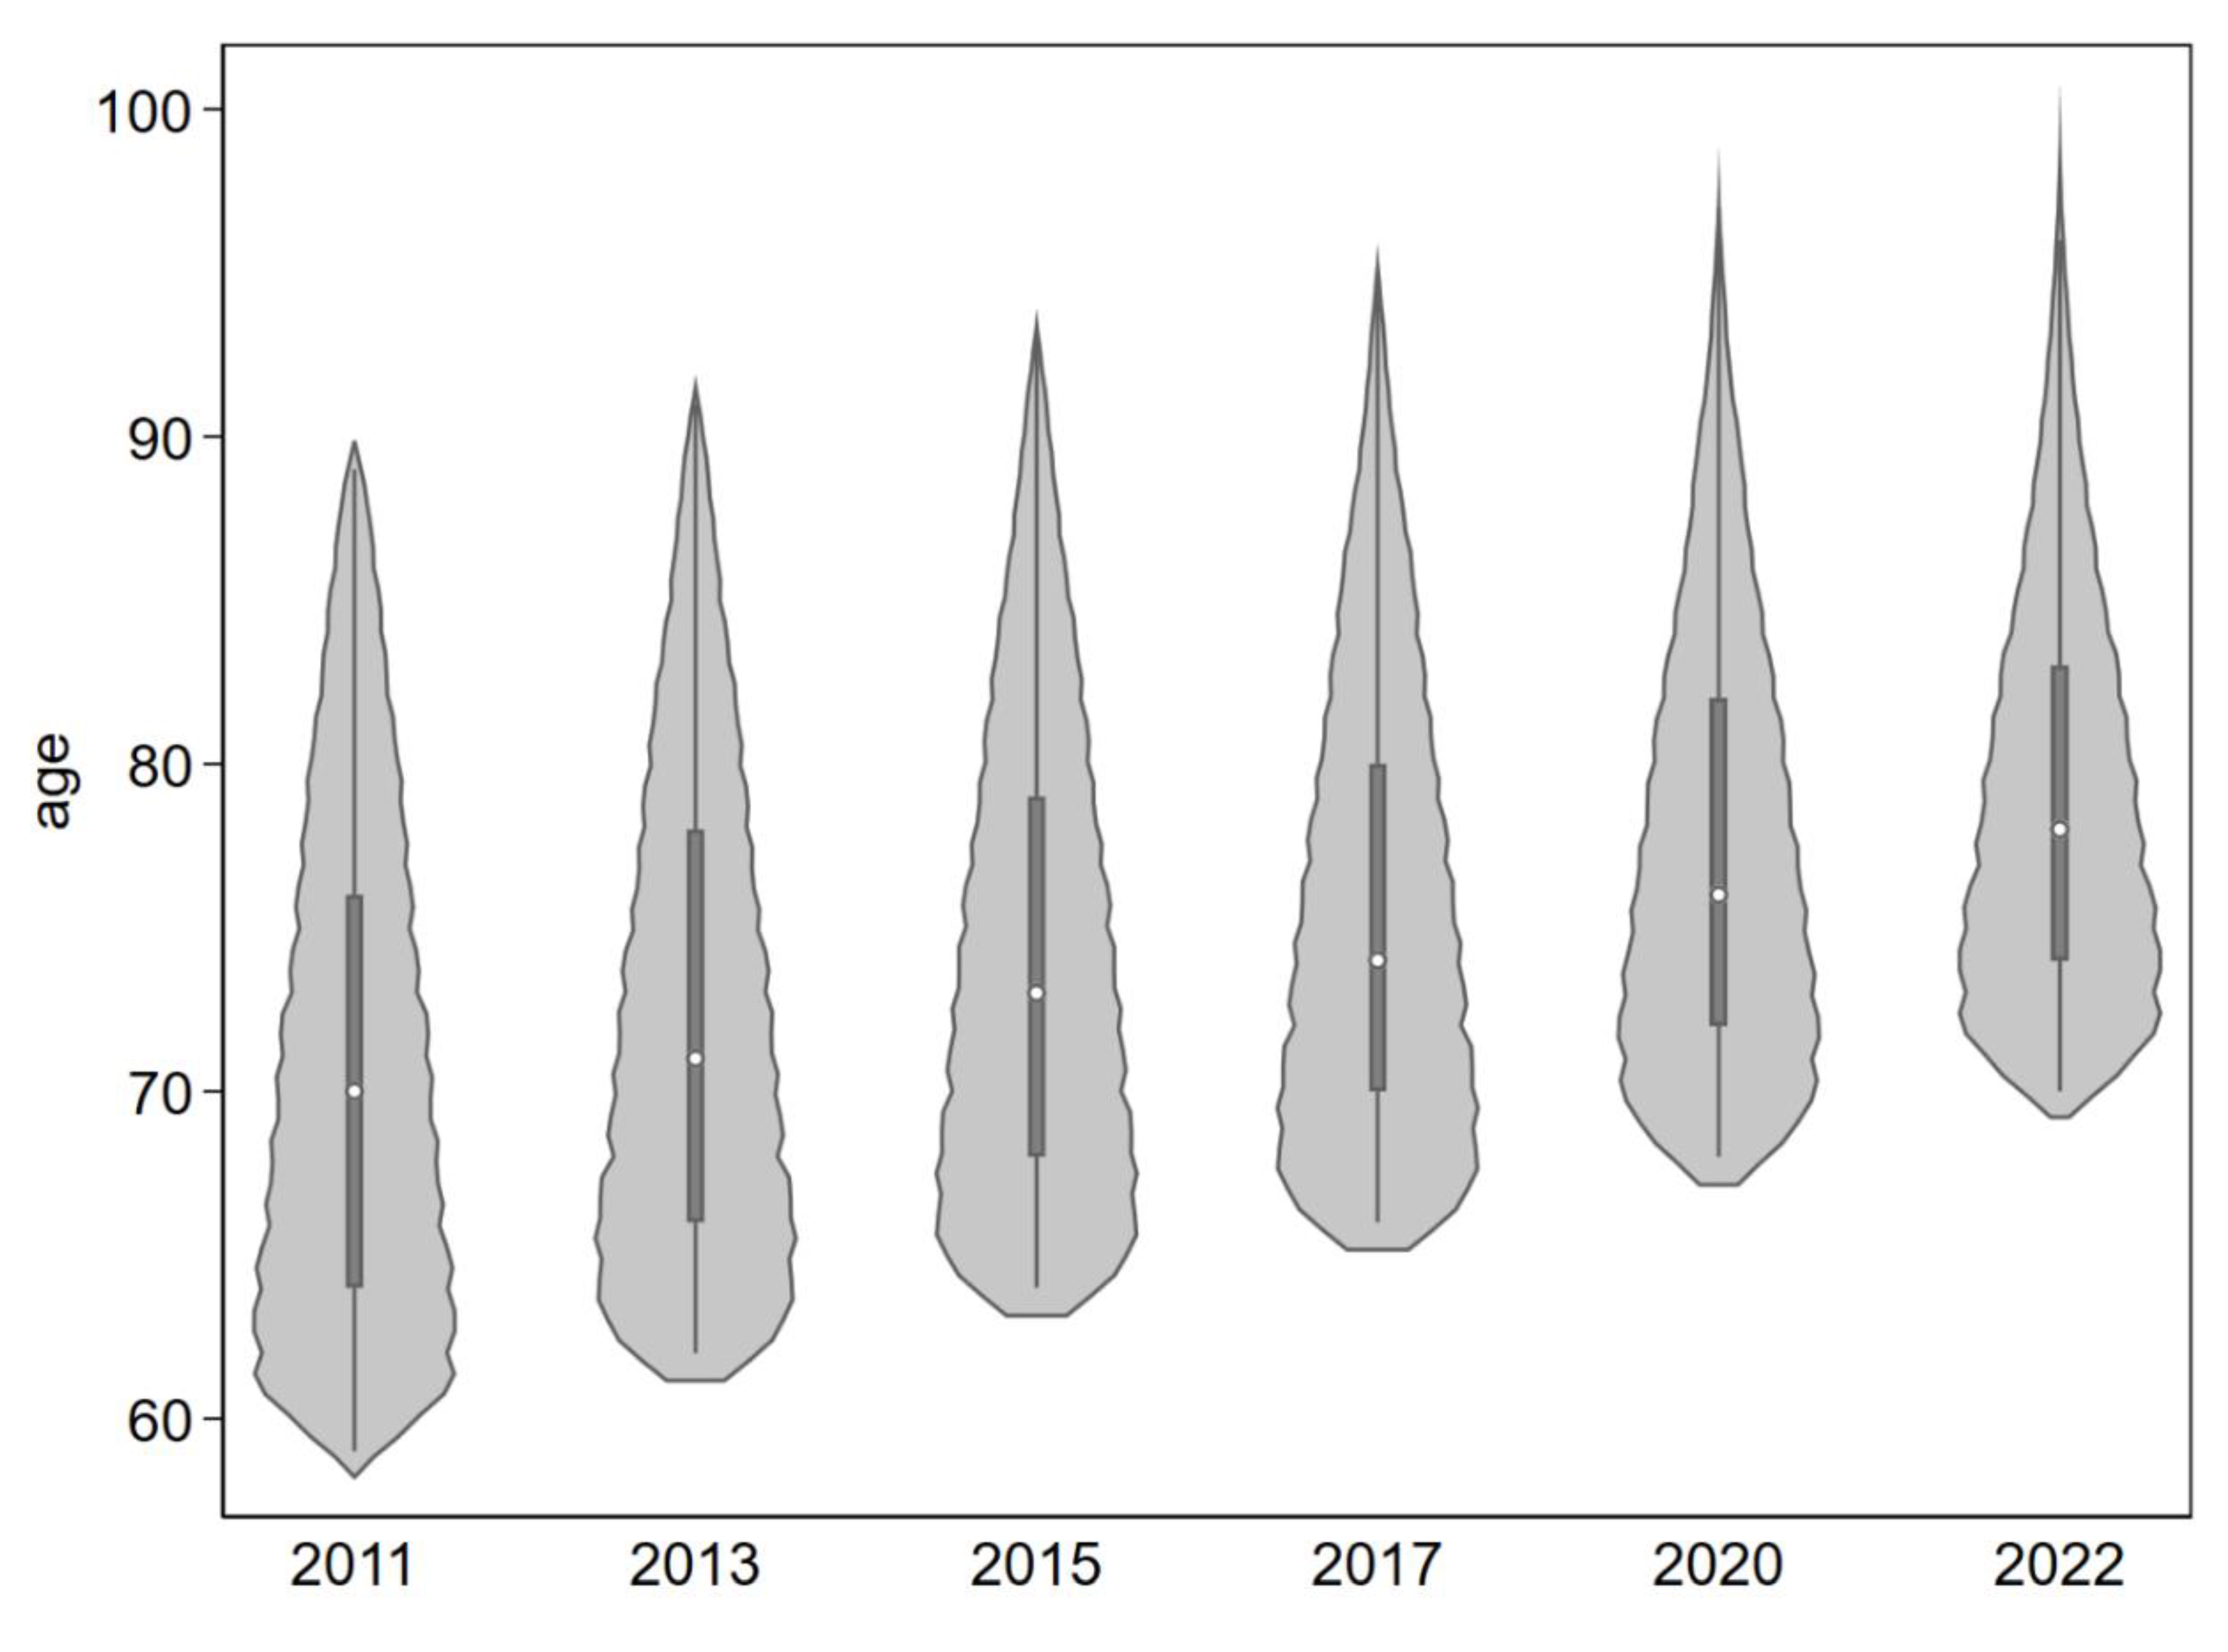
Figure 2.
reflects the average self-perceived health score across respondents per country per year. Denmark consistently notes the best, yet declining health scores across the time horizon, followed by Switzerland and Sweden. The Netherlands, Belgium and Austria cover more average scores. Among the low performers, the health status of the older people in the Czech Republic appears to have improved. France, Germany, Slovenia, and Italy complete the ranking. The lowest rank is for the older people in Spain, who consistently mark, on average, the lowest scores across the time horizon.
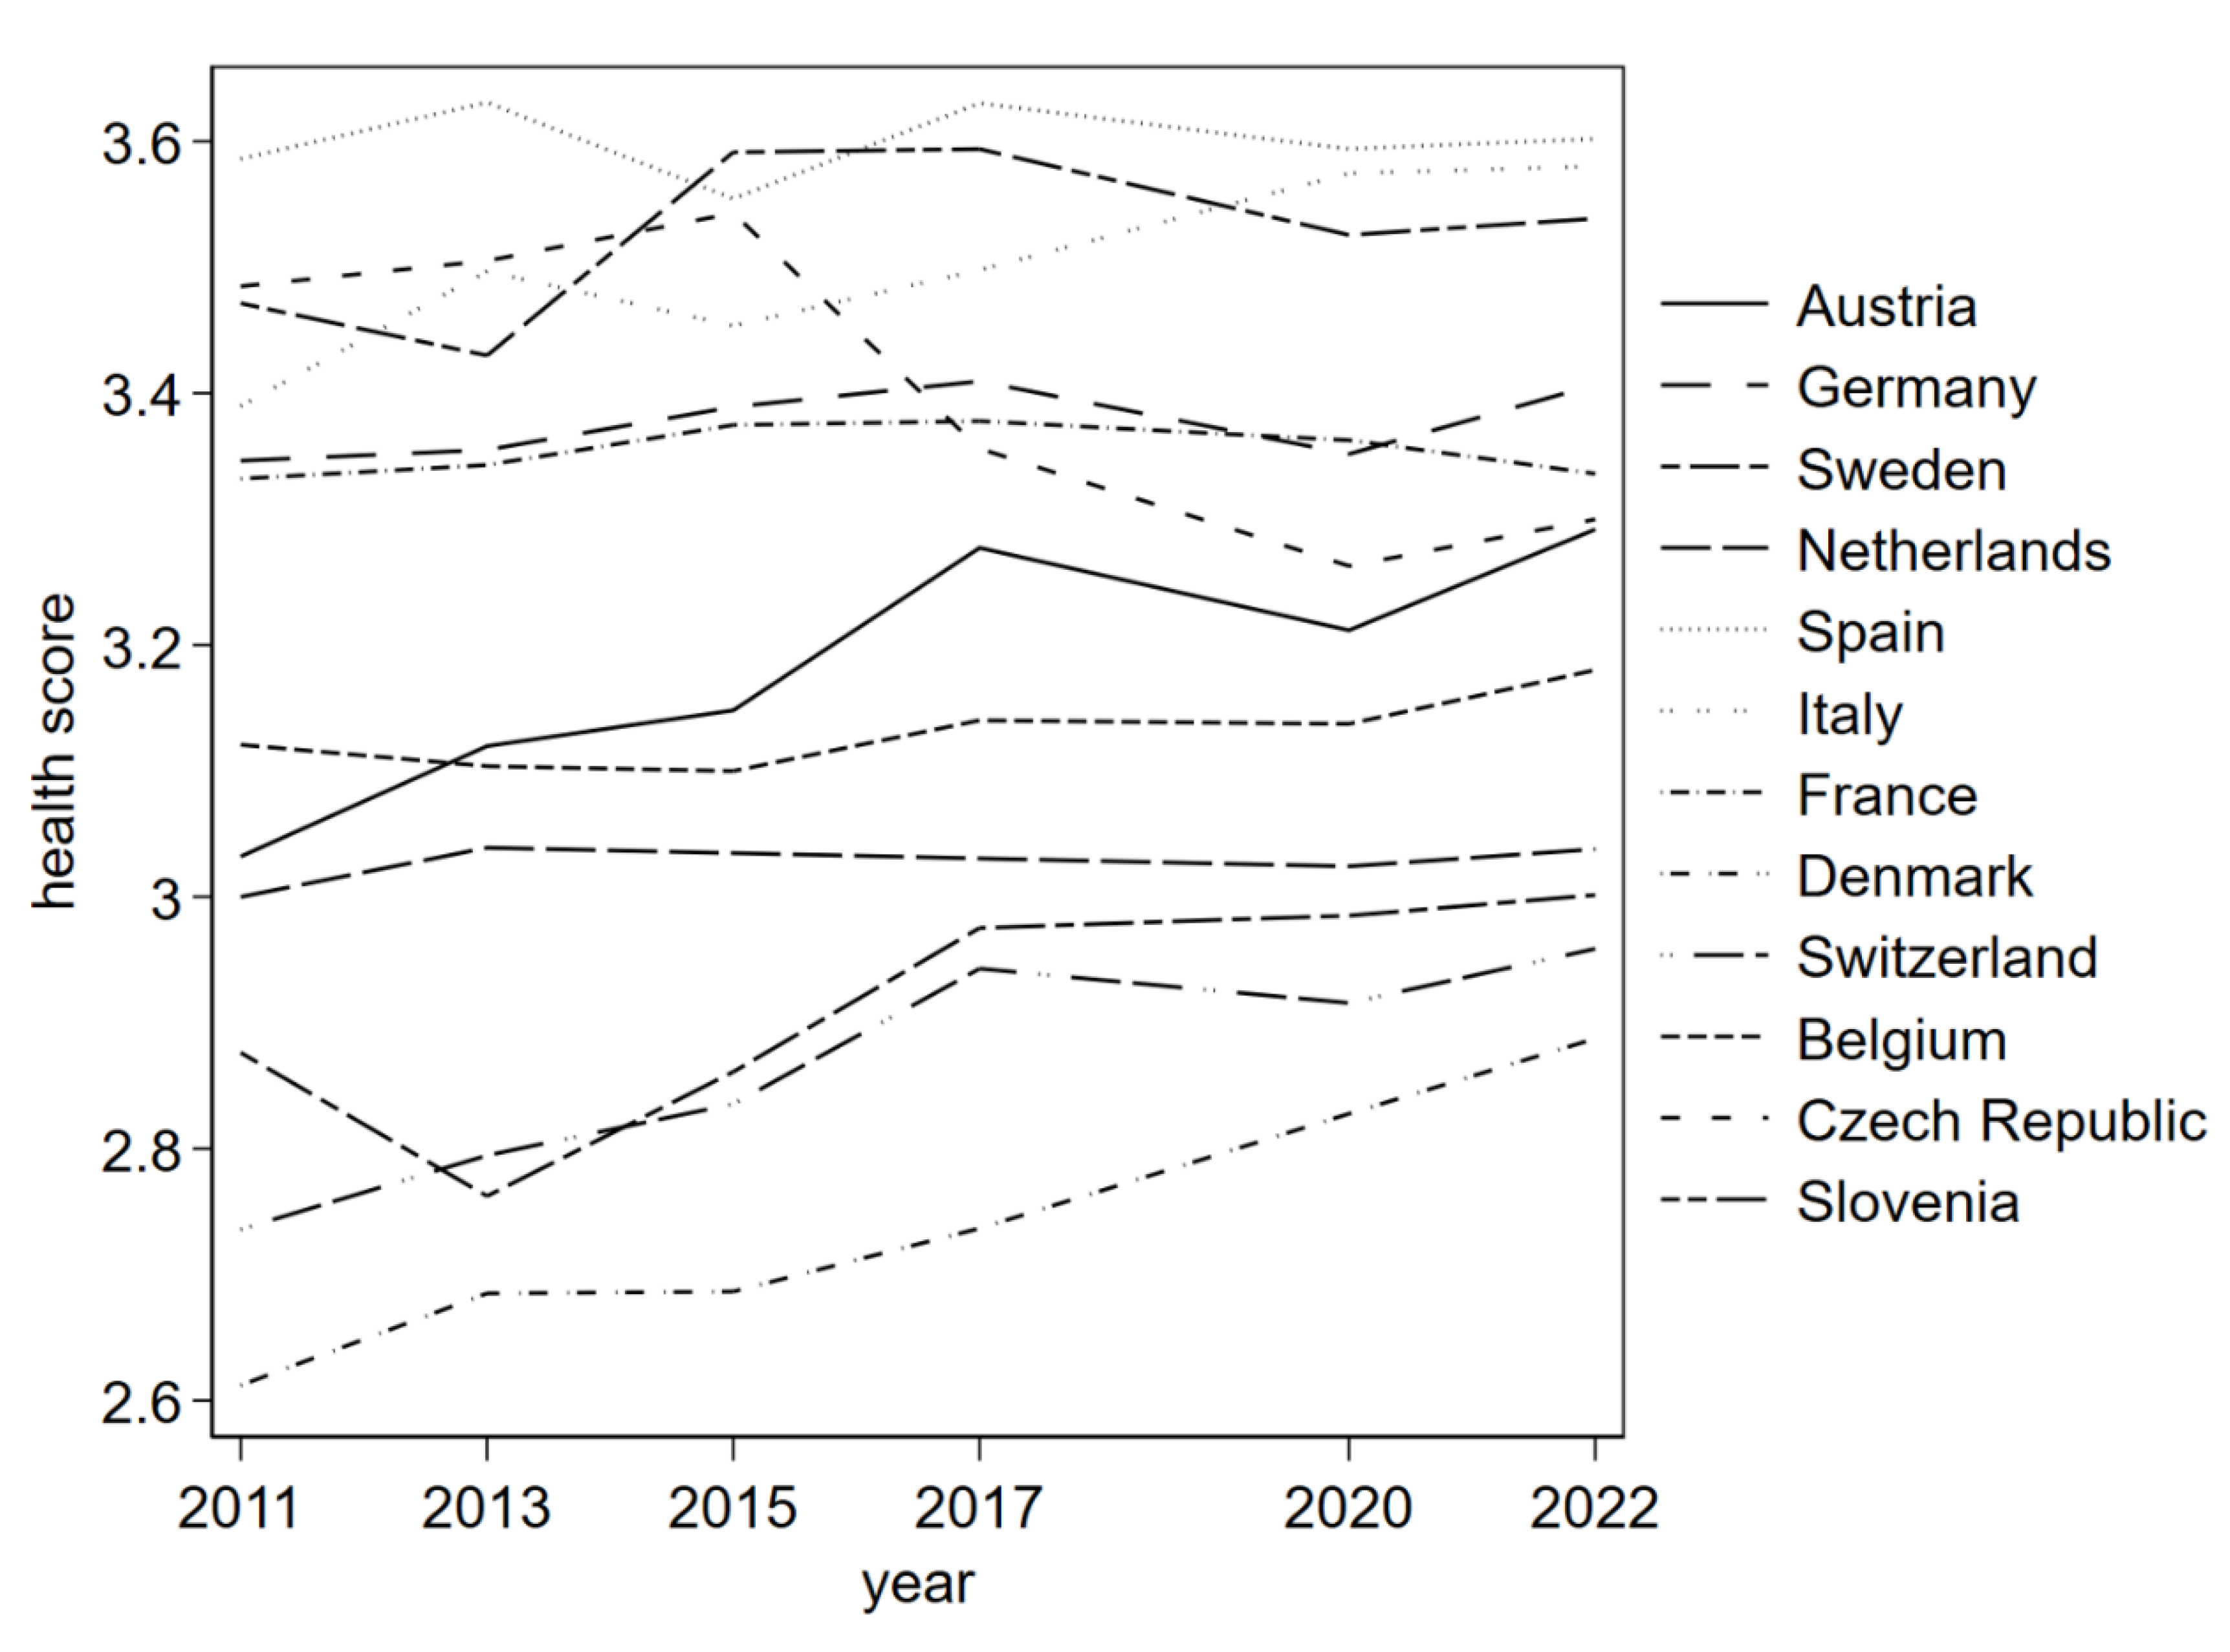
Figure 3.
reveals that self-reported health status is better, i.e. scored lower on a one-to-five scale (Excellent to Poor), when a respondent gives help to at least one other. This difference sustains from age 60 to 90, yet follows a convex upward-sloping path for all four categories, indicating the accelerating deterioration of health accompanying the linear increase in age. An important note is that the Y-axis indicates that the change covers less than a full shift from health status category three (Good) to four (Fair). The value of giving help is more explicit when comparing the health status between different ages. For example, a 65-year-old who receives as well as gives help, perceives having almost a similar health status as a 60-year-old who receives but doesn’t give help. Besides these beneficial effects across ages, the influence of another commonly known health determinant, i.e. income, is visualised in Figure 4.
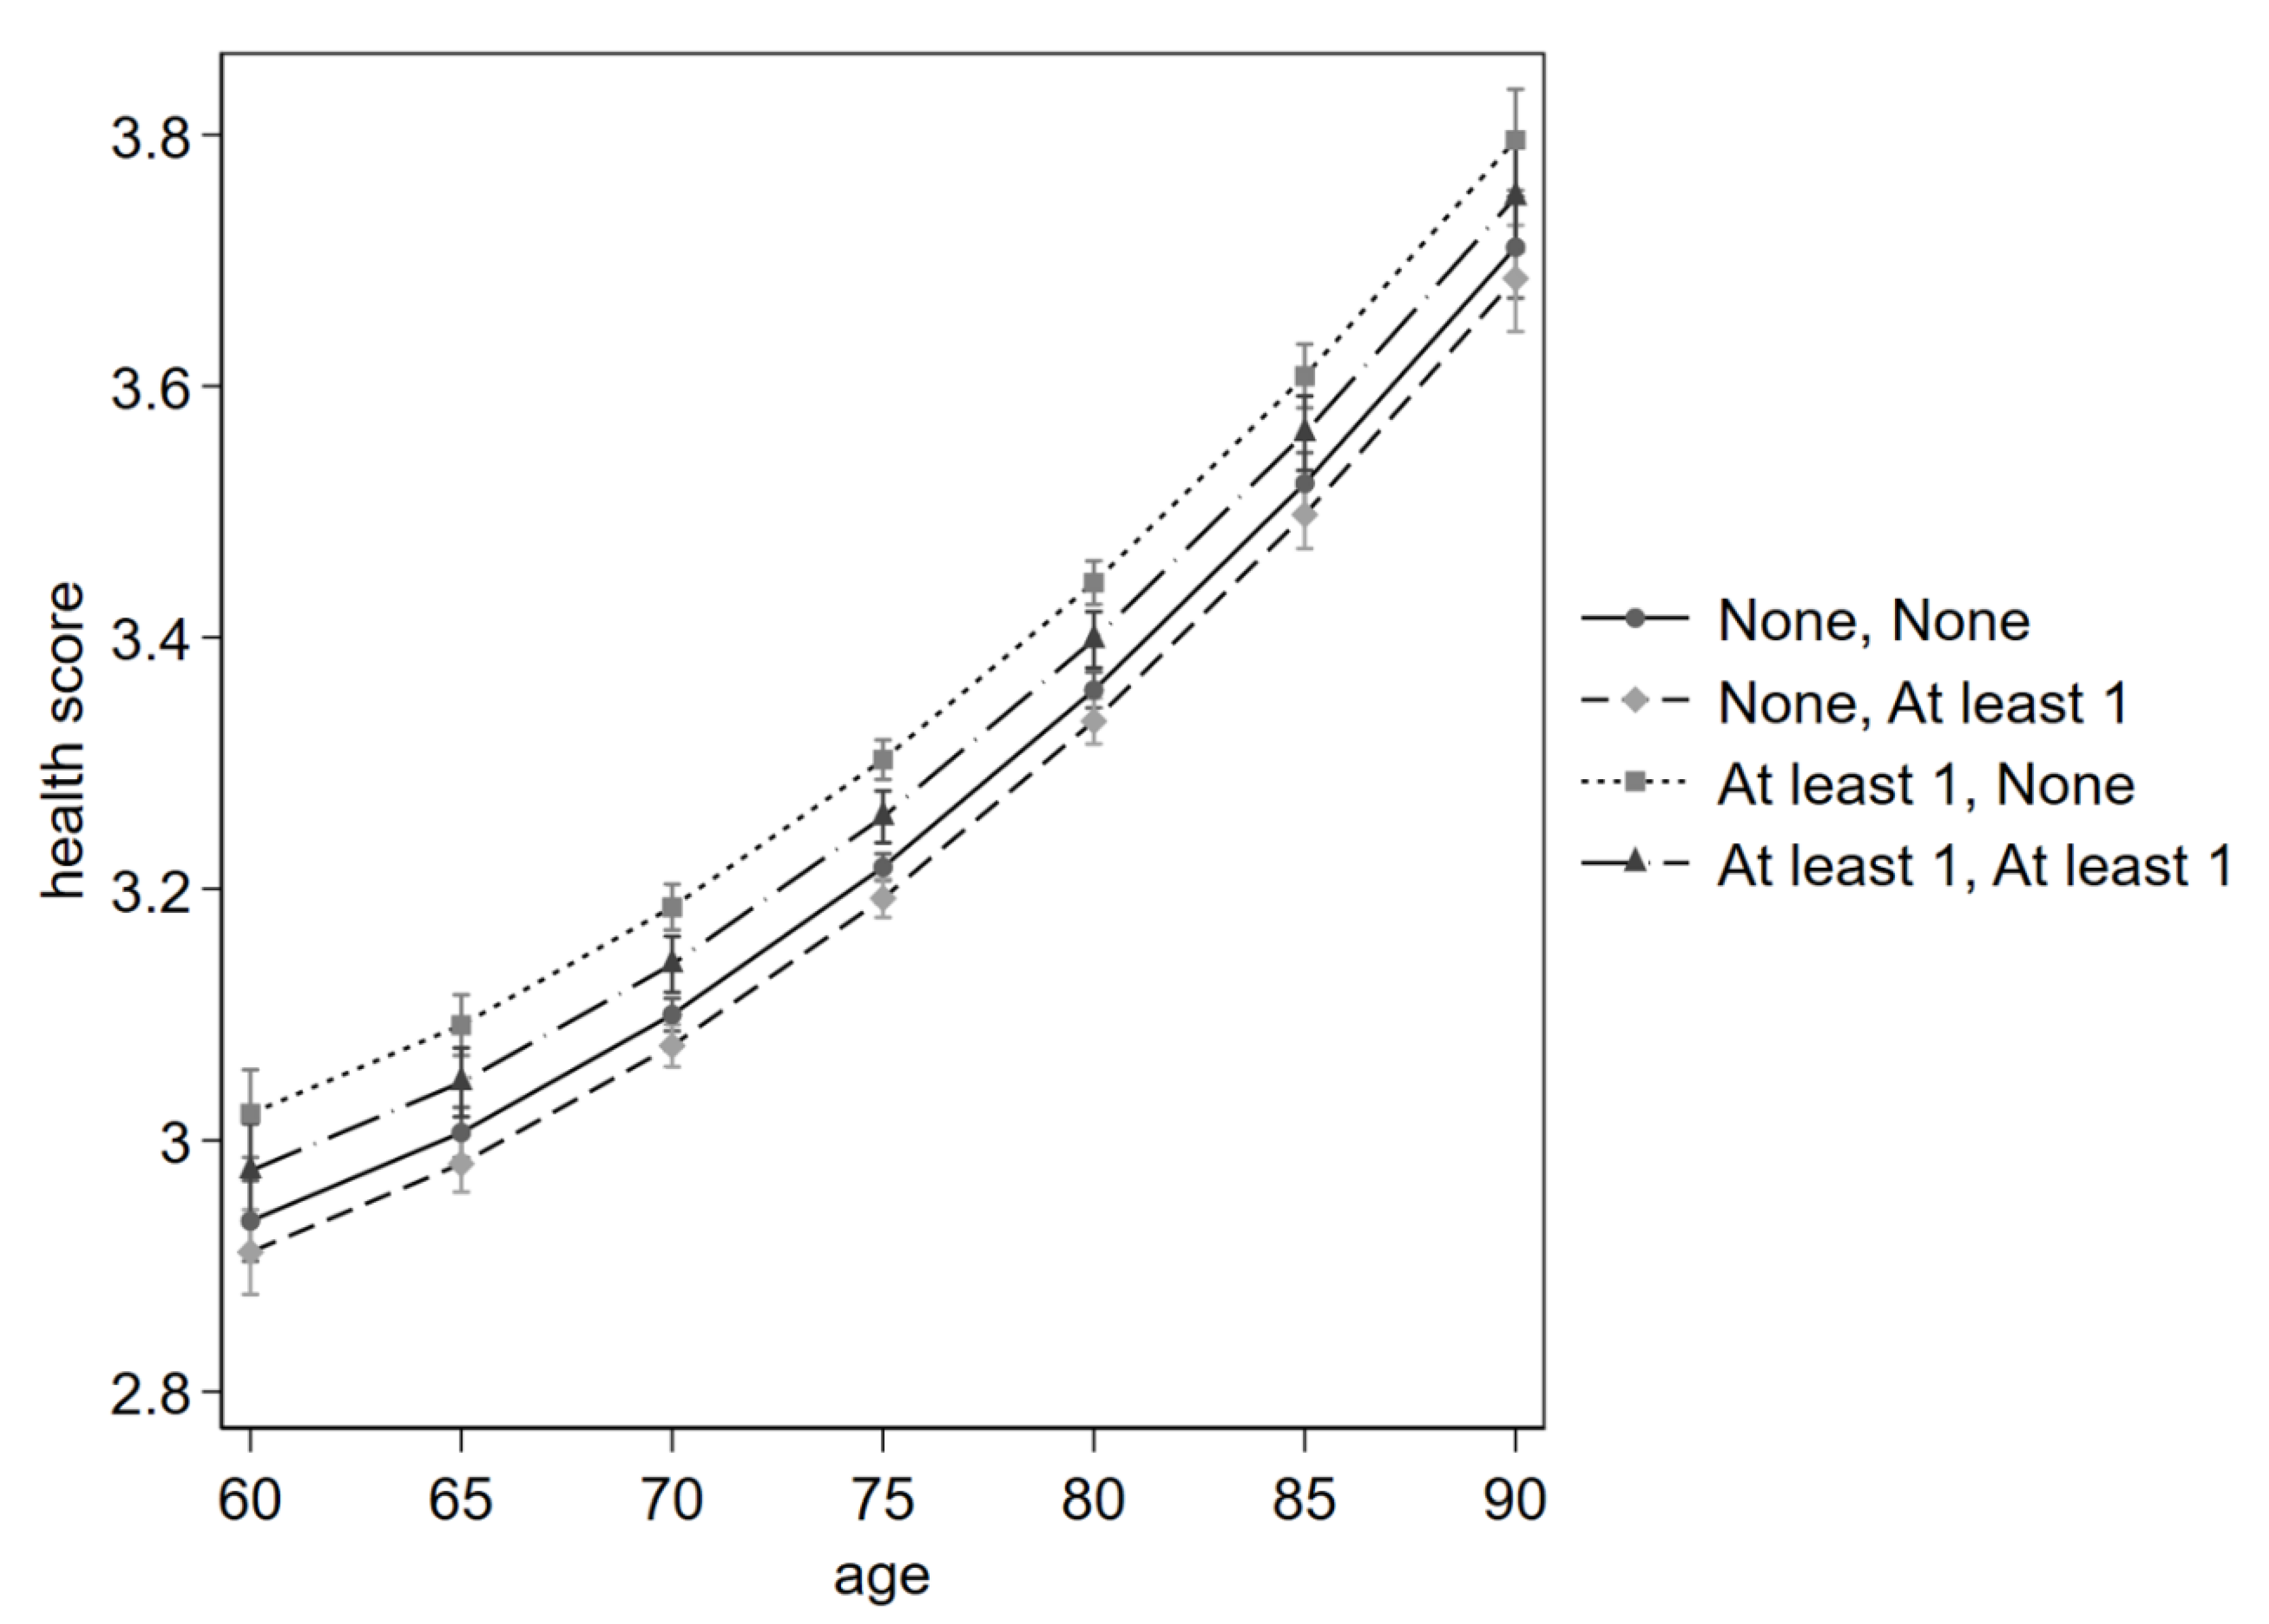
Figure 4.
reveals that a higher income relates to a better self-reported health status. The status follows a convex downward-sloping path over the standardised income on the X-axis. In contrast to Figure 3, the Y-axis ranges from 3.1 to 3.4, which hardly reflects a full shift from a fair (4) to good (3) health status. Moreover, the robustness test reveals that total household income is not consistently significant across the five imputed datasets. Nonetheless, Figure 4 supports comparison between the four categories of interest. For example, an older person not receiving help, who also gives help, reports approximately the same health status as one who has a five times higher income (2.5) and doesn’t give help. Lastly, the influence of subjective health determinant, i.e. life satisfaction, is visualised in Figure 5.
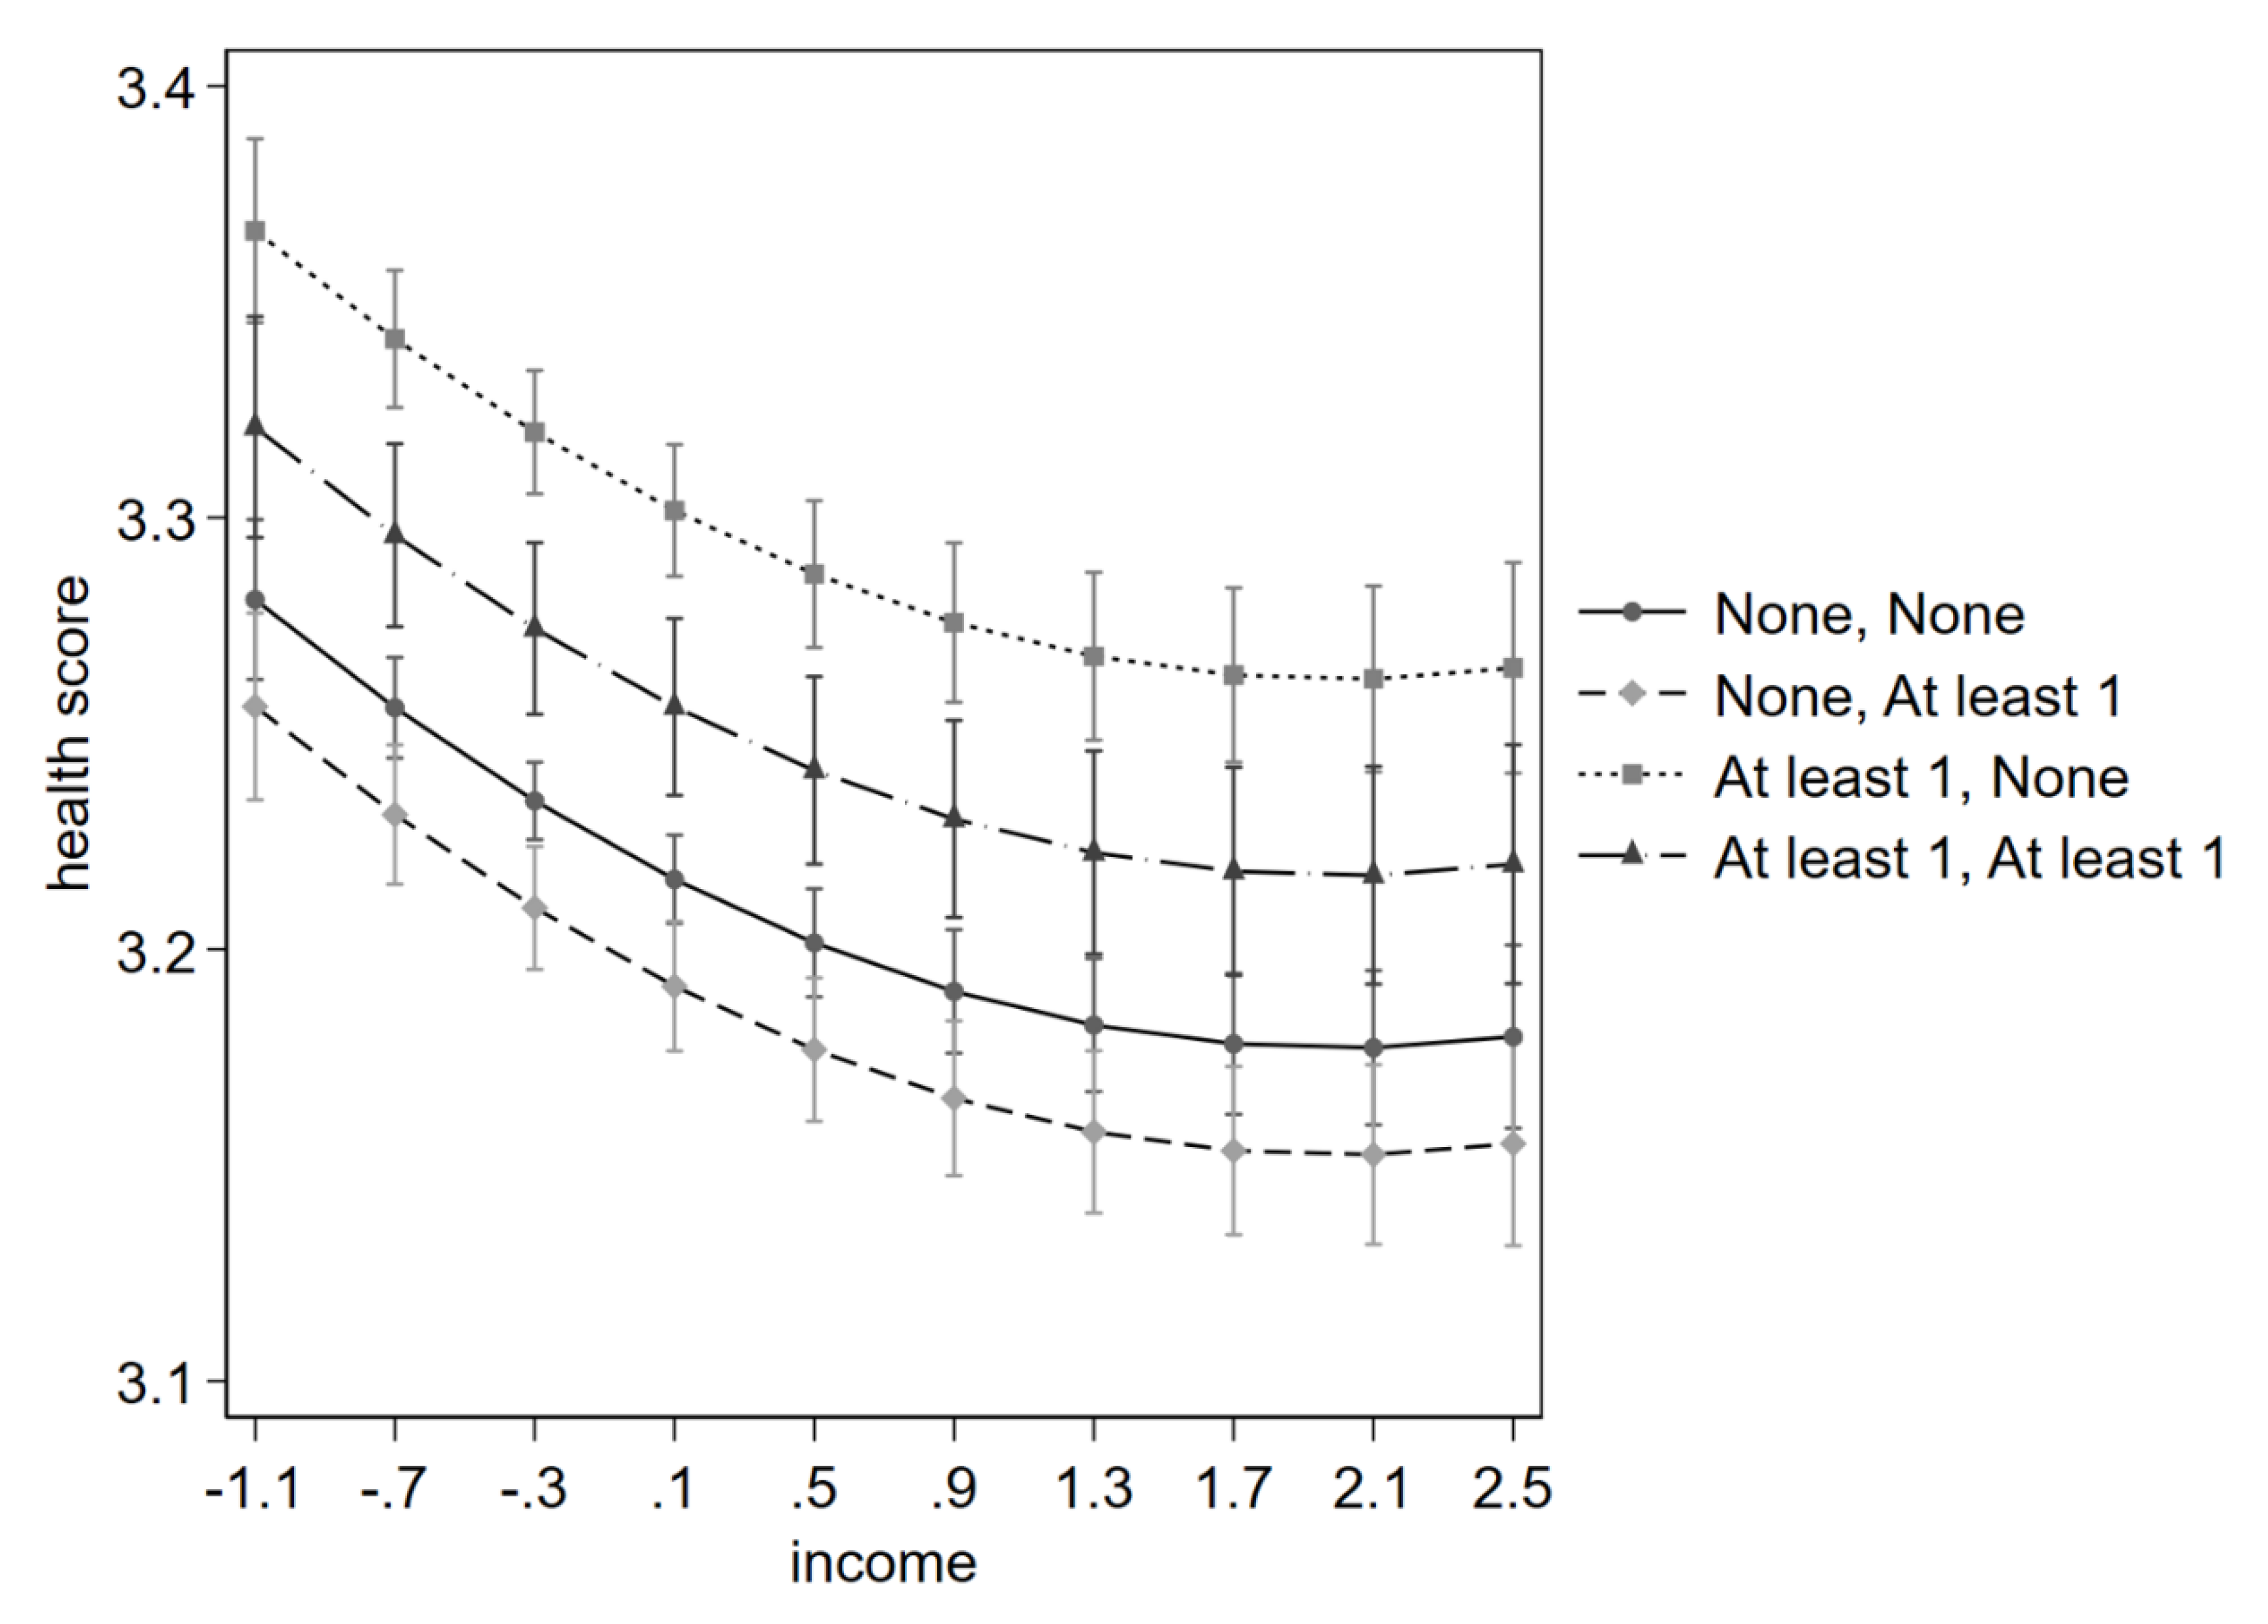
Figure 5.
shows the concave downward-sloping path of life satisfaction in relation to self-perceived health status. Older people who report being absolutely satisfied with life score almost one entire category higher, i.e. from “Fair” (4) to “Good” (3), compared to those who are completely dissatisfied with their life. Like for age and income, giving help consistently triggers reporting a better health status. This overall positive influence of giving help is expected to hold across the five imputed datasets, as illustrated in Table 8.
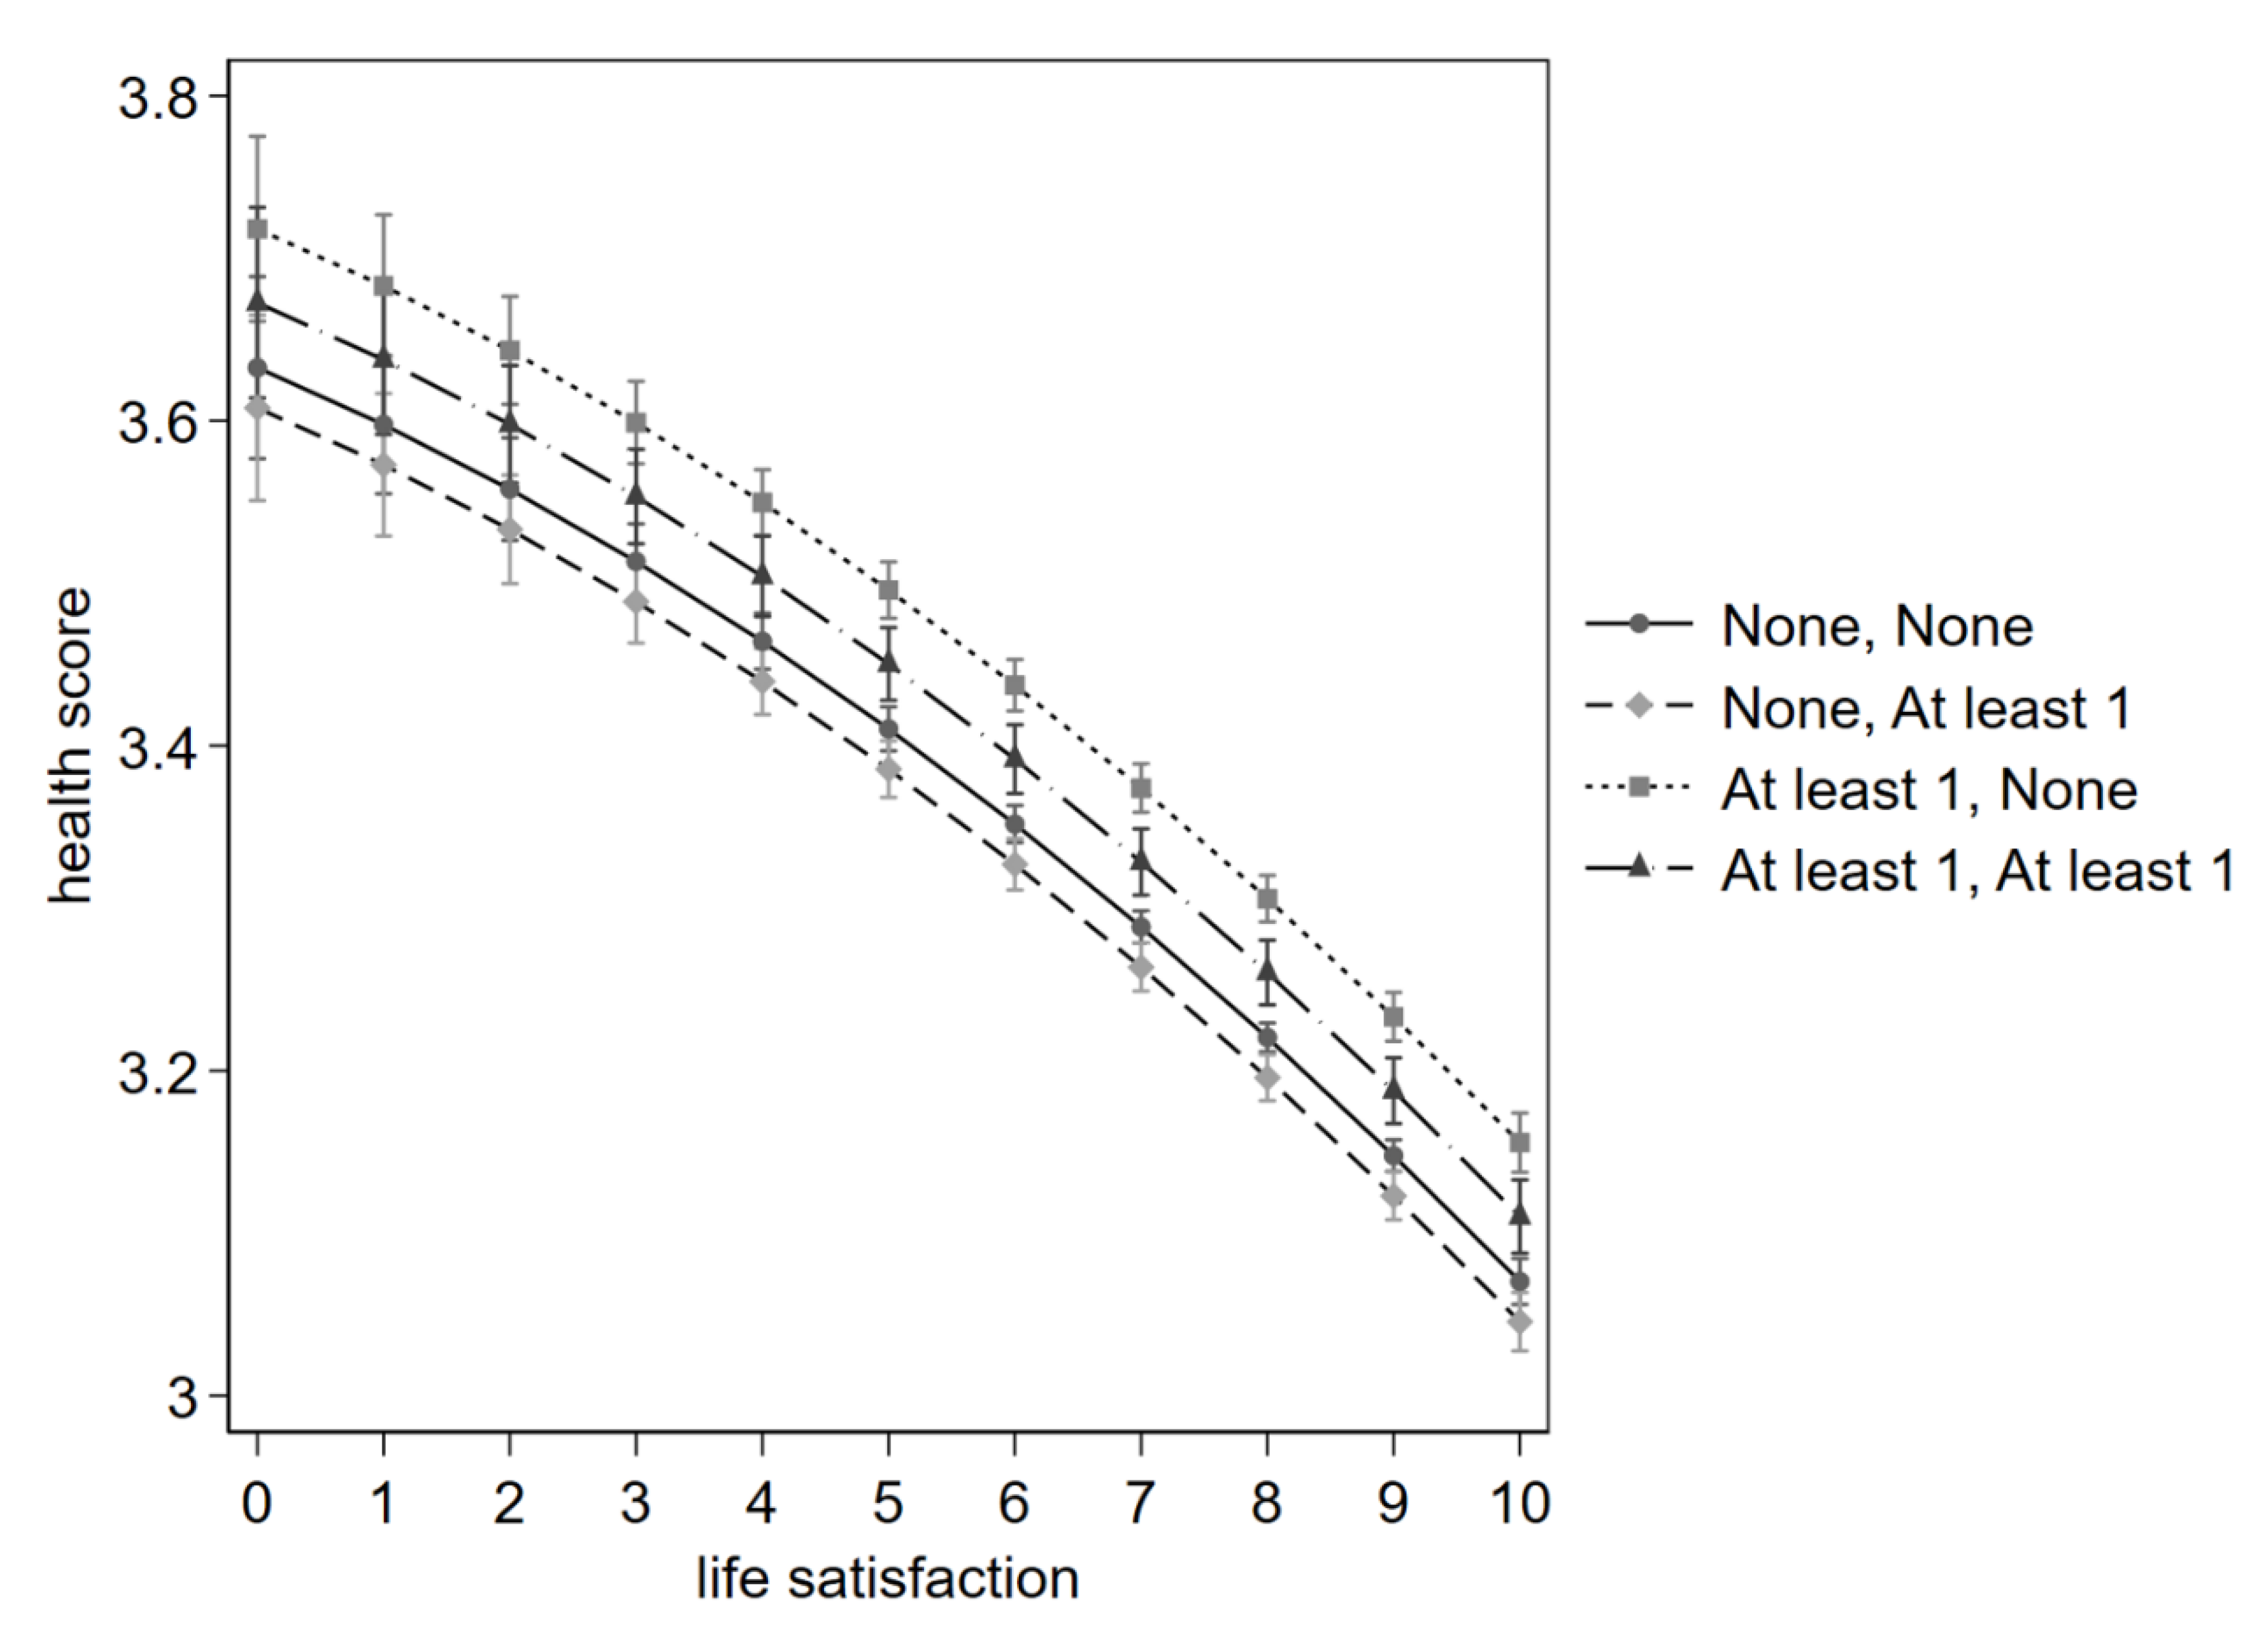
Table 1.
Summary statistics for the dependent, independent and panel level variables.
| Mean | SD | Minimum | Maximum | |
|---|---|---|---|---|
| Self-perceived health | - | - | 1 | 5 |
| Age | 73.863 | 7.675 | 59 | 100 |
| Years of education | 10.351 | 4.509 | 0 | 30 |
| Total household income | 27,489.207 | 24,343.792 | 0.000 | 93,998.211 |
| Life satisfaction | 7.812 | 1.705 | 0 | 10 |
| Gender | - | - | 1 | 2 |
| Household type | - | - | 0 | 2 |
| Job situation | - | - | 0 | 6 |
| Occurrence of COVID-19 | - | - | 0 | 1 |
| Year of survey | - | - | 2011 | 2022 |
| Respondent’s unique number | - | - | 1 | 29,995 |
| Being limited | - | - | 0 | 1 |
| Receiving help from others | - | - | 0 | 2 |
| Giving help to others | - | - | 0 | 2 |
| Number of activities last year | - | - | 0 | 2 |
| Country | - | - | 11 | 34 |
| Number of observations: 109,546 | ||||
| SD = Standard Deviation | ||||
Table 2.
Pearson correlations between the continuous variables.
| 1 | 2 | 3 | 4 | ||
|---|---|---|---|---|---|
| 1 | Age | 1.000 | - | - | - |
| 2 | Years of education | -0.147 | 1.000 | - | - |
| 3 | Total household income | -0.171 | 0.171 | 1.000 | - |
| 4 | Life satisfaction | -0.046 | 0.076 | 0.187 | 1.000 |
Table 3.
Self-perceived health distribution per category in per cent per year.
| 2011 | 2013 | 2015 | 2017 | 2020 | 2022 | |
|---|---|---|---|---|---|---|
| Excellent | 6.828 | 6.144 | 5.467 | 4.993 | 5.005 | 4.595 |
| Very good | 16.433 | 15.777 | 15.575 | 14.168 | 15.173 | 14.161 |
| Good | 37.576 | 38.797 | 37.986 | 39.700 | 40.738 | 40.671 |
| Fair | 28.008 | 28.187 | 29.533 | 29.350 | 29.300 | 29.669 |
| Poor | 11.155 | 11.096 | 11.440 | 11.789 | 9.785 | 10.904 |
Table 4.
Self-perceived health transition percentages for the period 2011 to 2022.
| Excellent | Very good | Good | Fair | Poor | |
|---|---|---|---|---|---|
| Excellent | 36.650 | 33.410 | 22.720 | 6.080 | 1.140 |
| Very good | 10.330 | 39.810 | 38.690 | 9.250 | 1.910 |
| Good | 2.670 | 13.070 | 56.220 | 23.830 | 4.200 |
| Fair | 0.770 | 3.420 | 28.710 | 52.260 | 14.840 |
| Poor | 0.270 | 1.290 | 10.280 | 34.330 | 53.830 |
| Total | 5.380 | 15.090 | 39.320 | 29.100 | 11.110 |
Table 5.
Proportions of receiving help from others relative to the five levels of self-perceived health.
Table 5.
Proportions of receiving help from others relative to the five levels of self-perceived health.
| 2011 | 2013 | 2015 | 2017 | 2020 | 2022 | Total | |
|---|---|---|---|---|---|---|---|
| Excellent | |||||||
| Received help from no other | 0.877 | 0.889 | 0.821 | 0.816 | 0.806 | 0.808 | 0.853 |
| Received help from at least 1 other | 0.123 | 0.111 | 0.179 | 0.184 | 0.194 | 0.192 | 0.147 |
| Very good | |||||||
| Received help from no other | 0.866 | 0.868 | 0.808 | 0.784 | 0.782 | 0.788 | 0.833 |
| Received help from at least 1 other | 0.134 | 0.132 | 0.192 | 0.216 | 0.218 | 0.212 | 0.167 |
| Good | |||||||
| Received help from no other | 0.837 | 0.843 | 0.791 | 0.755 | 0.739 | 0.716 | 0.799 |
| Received help from at least 1 other | 0.163 | 0.157 | 0.209 | 0.245 | 0.261 | 0.284 | 0.201 |
| Fair | |||||||
| Received help from no other | 0.753 | 0.747 | 0.669 | 0.675 | 0.643 | 0.645 | 0.706 |
| Received help from at least 1 other | 0.247 | 0.253 | 0.331 | 0.325 | 0.357 | 0.355 | 0.294 |
| Poor | |||||||
| Received help from no other | 0.610 | 0.601 | 0.523 | 0.530 | 0.505 | 0.501 | 0.563 |
| Received help from at least 1 other | 0.390 | 0.399 | 0.477 | 0.470 | 0.495 | 0.499 | 0.437 |
| Total | |||||||
| Received help from no other | 0.796 | 0.796 | 0.729 | 0.716 | 0.698 | 0.686 | 0.755 |
| Received help from at least 1 other | 0.204 | 0.204 | 0.271 | 0.284 | 0.302 | 0.314 | 0.245 |
Table 6.
Proportions of giving help to others relative to the five levels of self-perceived health.
| 2011 | 2013 | 2015 | 2017 | 2020 | 2022 | Total | |
|---|---|---|---|---|---|---|---|
| Excellent | |||||||
| Giving help to no other | 0.661 | 0.606 | 0.640 | 0.557 | 0.584 | 0.660 | 0.627 |
| Giving help to at least 1 other | 0.339 | 0.394 | 0.360 | 0.443 | 0.416 | 0.340 | 0.373 |
| Very good | |||||||
| Giving help to no other | 0.686 | 0.677 | 0.653 | 0.642 | 0.666 | 0.718 | 0.674 |
| Giving help to at least 1 other | 0.314 | 0.323 | 0.347 | 0.358 | 0.334 | 0.282 | 0.326 |
| Good | |||||||
| Giving help to no other | 0.744 | 0.732 | 0.726 | 0.716 | 0.738 | 0.778 | 0.739 |
| Giving help to at least 1 other | 0.256 | 0.268 | 0.274 | 0.284 | 0.262 | 0.222 | 0.261 |
| Fair | |||||||
| Giving help to no other | 0.785 | 0.790 | 0.809 | 0.803 | 0.818 | 0.850 | 0.806 |
| Giving help to at least 1 other | 0.215 | 0.210 | 0.191 | 0.197 | 0.182 | 0.150 | 0.194 |
| Poor | |||||||
| Giving help to no other | 0.874 | 0.884 | 0.898 | 0.902 | 0.917 | 0.901 | 0.892 |
| Giving help to at least 1 other | 0.126 | 0.116 | 0.102 | 0.098 | 0.083 | 0.099 | 0.108 |
| Total | |||||||
| Giving help to no other | 0.756 | 0.749 | 0.754 | 0.740 | 0.760 | 0.799 | 0.759 |
| Giving help to at least 1 other | 0.244 | 0.251 | 0.246 | 0.260 | 0.240 | 0.201 | 0.241 |
Table 7.
Estimation results for unordered as well as ordered fixed-effects and random-effects estimators.
Table 7.
Estimation results for unordered as well as ordered fixed-effects and random-effects estimators.
| FE | RE | CRE | FEO | REO | |
|---|---|---|---|---|---|
| Age | -0.045*** | 0.014* | -0.045*** | 0.993 | 0.955 |
| (0.007) | (0.006) | (0.008) | (0.051) | (0.044) | |
| Age squared | 0.000*** | 0.000 | 0.000*** | 1.001 | 1.001** |
| (0.000) | (0.000) | (0.000) | (0.000) | (0.000) | |
| Years of education | -0.003 | -0.006* | -0.003 | 0.977 | 0.991 |
| (0.007) | (0.003) | (0.007) | (0.041) | (0.034) | |
| Years of education squared | 0.000 | -0.001*** | 0.000 | 1.001 | 1.001 |
| (0.000) | (0.000) | (0.000) | (0.002) | (0.002) | |
| Total household income | -0.043*** | -0.072*** | -0.043*** | 0.908* | 0.897** |
| (0.006) | (0.006) | (0.007) | (0.035) | (0.032) | |
| Total household income squared | 0.011*** | 0.013*** | 0.011*** | 1.028 | 1.034* |
| (0.003) | (0.003) | (0.003) | (0.019) | (0.017) | |
| Gender: Female | - | -0.002 | -0.018* | - | 1.005 |
| (0.007) | (0.007) | (0.040) | |||
| Occurrence of COVID-19 | -0.004 | -0.012 | -0.004 | 1.042 | 1.014 |
| (0.009) | (0.007) | (0.009) | (0.056) | (0.049) | |
| Household: Couple, both responding | 0.076*** | 0.059*** | 0.076*** | 1.269** | 1.205** |
| (0.012) | (0.008) | (0.013) | (0.093) | (0.087) | |
| Household: Multiple, at least 1 responding | 0.099*** | 0.072*** | 0.099*** | 1.274* | 1.221* |
| (0.016) | (0.011) | (0.017) | (0.130) | (0.120) | |
| Job situation: Retired | 0.048*** | 0.107*** | 0.048** | 1.029 | 1.059 |
| (0.014) | (0.013) | (0.016) | (0.096) | (0.090) | |
| Job situation: Unemployed | 0.013 | 0.081* | 0.013 | 1.031 | 1.006 |
| (0.040) | (0.035) | (0.040) | (0.204) | (0.189) | |
| Job situation: Permanently sick or disabled | 0.168*** | 0.436*** | 0.168*** | 1.539** | 1.851*** |
| (0.029) | (0.025) | (0.032) | (0.247) | (0.306) | |
| Job situation: Homemaker | 0.047* | 0.130*** | 0.047* | 0.945 | 0.986 |
| (0.019) | (0.016) | (0.021) | (0.111) | (0.108) | |
| Job situation: Other | 0.007 | 0.071** | 0.007 | 0.829 | 0.885 |
| (0.028) | (0.025) | (0.029) | (0.119) | (0.122) | |
| Being limited | 0.427*** | 0.661*** | 0.427*** | 4.122*** | 3.904*** |
| (0.006) | (0.005) | (0.007) | (0.150) | (0.131) | |
| Life satisfaction | -0.033*** | -0.060*** | -0.033*** | 0.858** | 0.807*** |
| (0.008) | (0.007) | (0.008) | (0.044) | (0.040) | |
| Life satisfaction squared | -0.002*** | -0.003*** | -0.002*** | 0.995 | 0.999 |
| (0.001) | (0.000) | (0.001) | (0.004) | (0.003) | |
| Participated in at least 1 activity last year | -0.061*** | -0.127*** | -0.061*** | 0.863*** | 0.812*** |
| (0.009) | (0.008) | (0.010) | (0.039) | (0.037) | |
| Receiving help from at least 1 other (main effect) | 0.085*** | 0.130*** | 0.085*** | 1.223*** | 1.248*** |
| (0.008) | (0.007) | (0.008) | (0.059) | (0.056) | |
| Giving help to at least 1 other (main effect) | -0.025** | -0.067*** | -0.025** | 0.903* | 0.950 |
| (0.008) | (0.007) | (0.008) | (0.043) | (0.039) | |
| Receiving and Giving no help | 0.000 | 0.000 | 0.000 | 1.000 | 1.000 |
| (0.000) | (0.000) | (0.000) | (0.000) | (0.000) | |
| Receiving no help and Giving help to at least 1 other | 0.000 | 0.000 | 0.000 | 1.000 | 1.000 |
| (0.000) | (0.000) | (0.000) | (0.000) | (0.000) | |
| Receiving help from and Giving help to at least 1 other | -0.021 | -0.045*** | -0.021 | 0.956 | 0.863* |
| (0.014) | (0.013) | (0.013) | (0.082) | (0.064) | |
| Country: Austria | - | 0.105*** | 0.060** | - | 1.179* |
| (0.018) | (0.019) | (0.077) | |||
| Country: Germany | - | 0.330*** | 0.205*** | - | 1.863*** |
| (0.022) | (0.021) | (0.137) | |||
| Country: The Netherlands | - | 0.047* | -0.001 | - | 1.056 |
| (0.020) | (0.022) | (0.078) | |||
| Country: Spain | - | 0.349*** | 0.309*** | - | 3.249*** |
| (0.019) | (0.021) | (0.258) | |||
| Country: Italy | - | 0.267*** | 0.213*** | - | 2.262*** |
| (0.019) | (0.021) | (0.171) | |||
| Country: France | - | 0.255*** | 0.168*** | - | 1.785*** |
| (0.017) | (0.019) | (0.118) | |||
| Country: Denmark | - | -0.107*** | -0.099*** | - | 0.734*** |
| (0.021) | (0.023) | (0.056) | |||
| Country: Switzerland | - | -0.009 | 0.072*** | - | 1.219** |
| (0.019) | (0.021) | (0.091) | |||
| Country: Belgium | - | 0.085*** | 0.017 | - | 1.078 |
| (0.018) | (0.019) | (0.069) | |||
| Country: Czech Republic | - | 0.280*** | 0.123*** | - | 1.381*** |
| (0.018) | (0.021) | (0.122) | |||
| Country: Slovenia | - | 0.309*** | 0.213*** | - | 2.198*** |
| (0.020) | (0.022) | (0.194) | |||
| Constant | 4.078*** | 2.361*** | 0.397 | - | - |
| (0.277) | (0.225) | (0.355) | |||
| Number of observations | 109,546 | 109,546 | 109,546 | 130,636 | 109,528 |
| Number of respondents | 29,995 | 29,995 | 29,995 | 19,389 | 29,989 |
| R-squared | 0.118 | 0.394 | 0.447 | 0.129 | - |
| Panel-level standard deviation | - | - | 0.439 | - | 1.290 |
| Mundlak specification test Chi squared statistic | - | 7374 | 6818 | - | 2203 |
| Mundlak specification test p-value | - | 0 | 0 | - | 0 |
| Fixed effects | Yes | Yes | Yes | Yes | Yes |
| Random effects | No | Yes | Yes | No | Yes |
| Calibrated longitudinal weights | No | No | Yes | Yes | Yes |
| Mundlak means | No | No | Yes | Yes | Yes |
| Ordered | No | No | No | Yes | Yes |
| Standard errors (in parentheses) robust | No | No | Yes | Yes | Yes |
| Estimation method | OLS | GLS | GLS | BUC | ML |
| Baselines: Gender = Male, Household = Single, Job situation = Employed or self-employed, Receiving as well as Giving help = None, Country = Sweden | |||||
| Estimators: FE = Fixed-Effects, RE = Random-Effects, CRE = Correlated Random-Effects, FEO = Fixed-Effects Ordered, REO = Random-Effects Ordered | |||||
| Estimation methods: OLS = Ordinary Least Squares, GLS = Generalized Least Squares, BUC = Blow-up and Cluster, ML = Maximum Likelihood | |||||
| Estimation output: FE, RE, and CRE report coefficients, the FEO and REO report odds | |||||
| R-Squared: within for FE, overall for RE and CRE, pseudo for FEO | |||||
| The number of observations for FEO is 86,544 without copies. | |||||
| Regression output relies on the first imputed dataset (Imp1). | |||||
| Age, Years of education, Total household income and Life satisfaction are continuous variables. All others are categorical. | |||||
| *** p<.001, ** p<.01, * p<.05 | |||||
Table 8.
CRE Predictive margins for the combination of Receiving help and Giving help for five imputed datasets.
Table 8.
CRE Predictive margins for the combination of Receiving help and Giving help for five imputed datasets.
| 1 | 2 | 3 | 4 | 5 | ||
|---|---|---|---|---|---|---|
| Receiving help from no other and Giving help to no other | 3.231 | 3.231 | 3.231 | 3.231 | 3.231 | |
| (0.004) | (0.004) | (0.004) | (0.004) | (0.004) | ||
| Receiving help from no other and Giving help to at least 1 other | 3.207 | 3.207 | 3.207 | 3.207 | 3.208 | |
| (0.007) | (0.007) | (0.007) | (0.007) | (0.007) | ||
| Receiving help from at least 1 other and Giving help to no other | 3.317 | 3.317 | 3.317 | 3.317 | 3.317 | |
| (0.007) | (0.007) | (0.007) | (0.007) | (0.007) | ||
| Receiving help from and Giving help to at least 1 other | 3.271 | 3.271 | 3.270 | 3.271 | 3.271 | |
| (0.01) | (0.01) | (0.01) | (0.01) | (0.01) | ||
| Robust standard errors in parentheses | ||||||
| Number of observations = 109,546 | ||||||
Disclaimer/Publisher’s Note: The statements, opinions and data contained in all publications are solely those of the individual author(s) and contributor(s) and not of MDPI and/or the editor(s). MDPI and/or the editor(s) disclaim responsibility for any injury to people or property resulting from any ideas, methods, instructions or products referred to in the content. |
© 2026 by the author. Licensee MDPI, Basel, Switzerland. This article is an open access article distributed under the terms and conditions of the Creative Commons Attribution (CC BY) license.
Copyright: This open access article is published under a Creative Commons CC BY 4.0 license, which permit the free download, distribution, and reuse, provided that the author and preprint are cited in any reuse.


