Preprint
Article

This version is not peer-reviewed.

Quiet-Time Rapid Subauroral Plasma Flows at High Northern Magnetic Latitudes in the Dusk Sector

Submitted:

26 February 2026

Posted:

27 February 2026

You are already at the latest version

Abstract

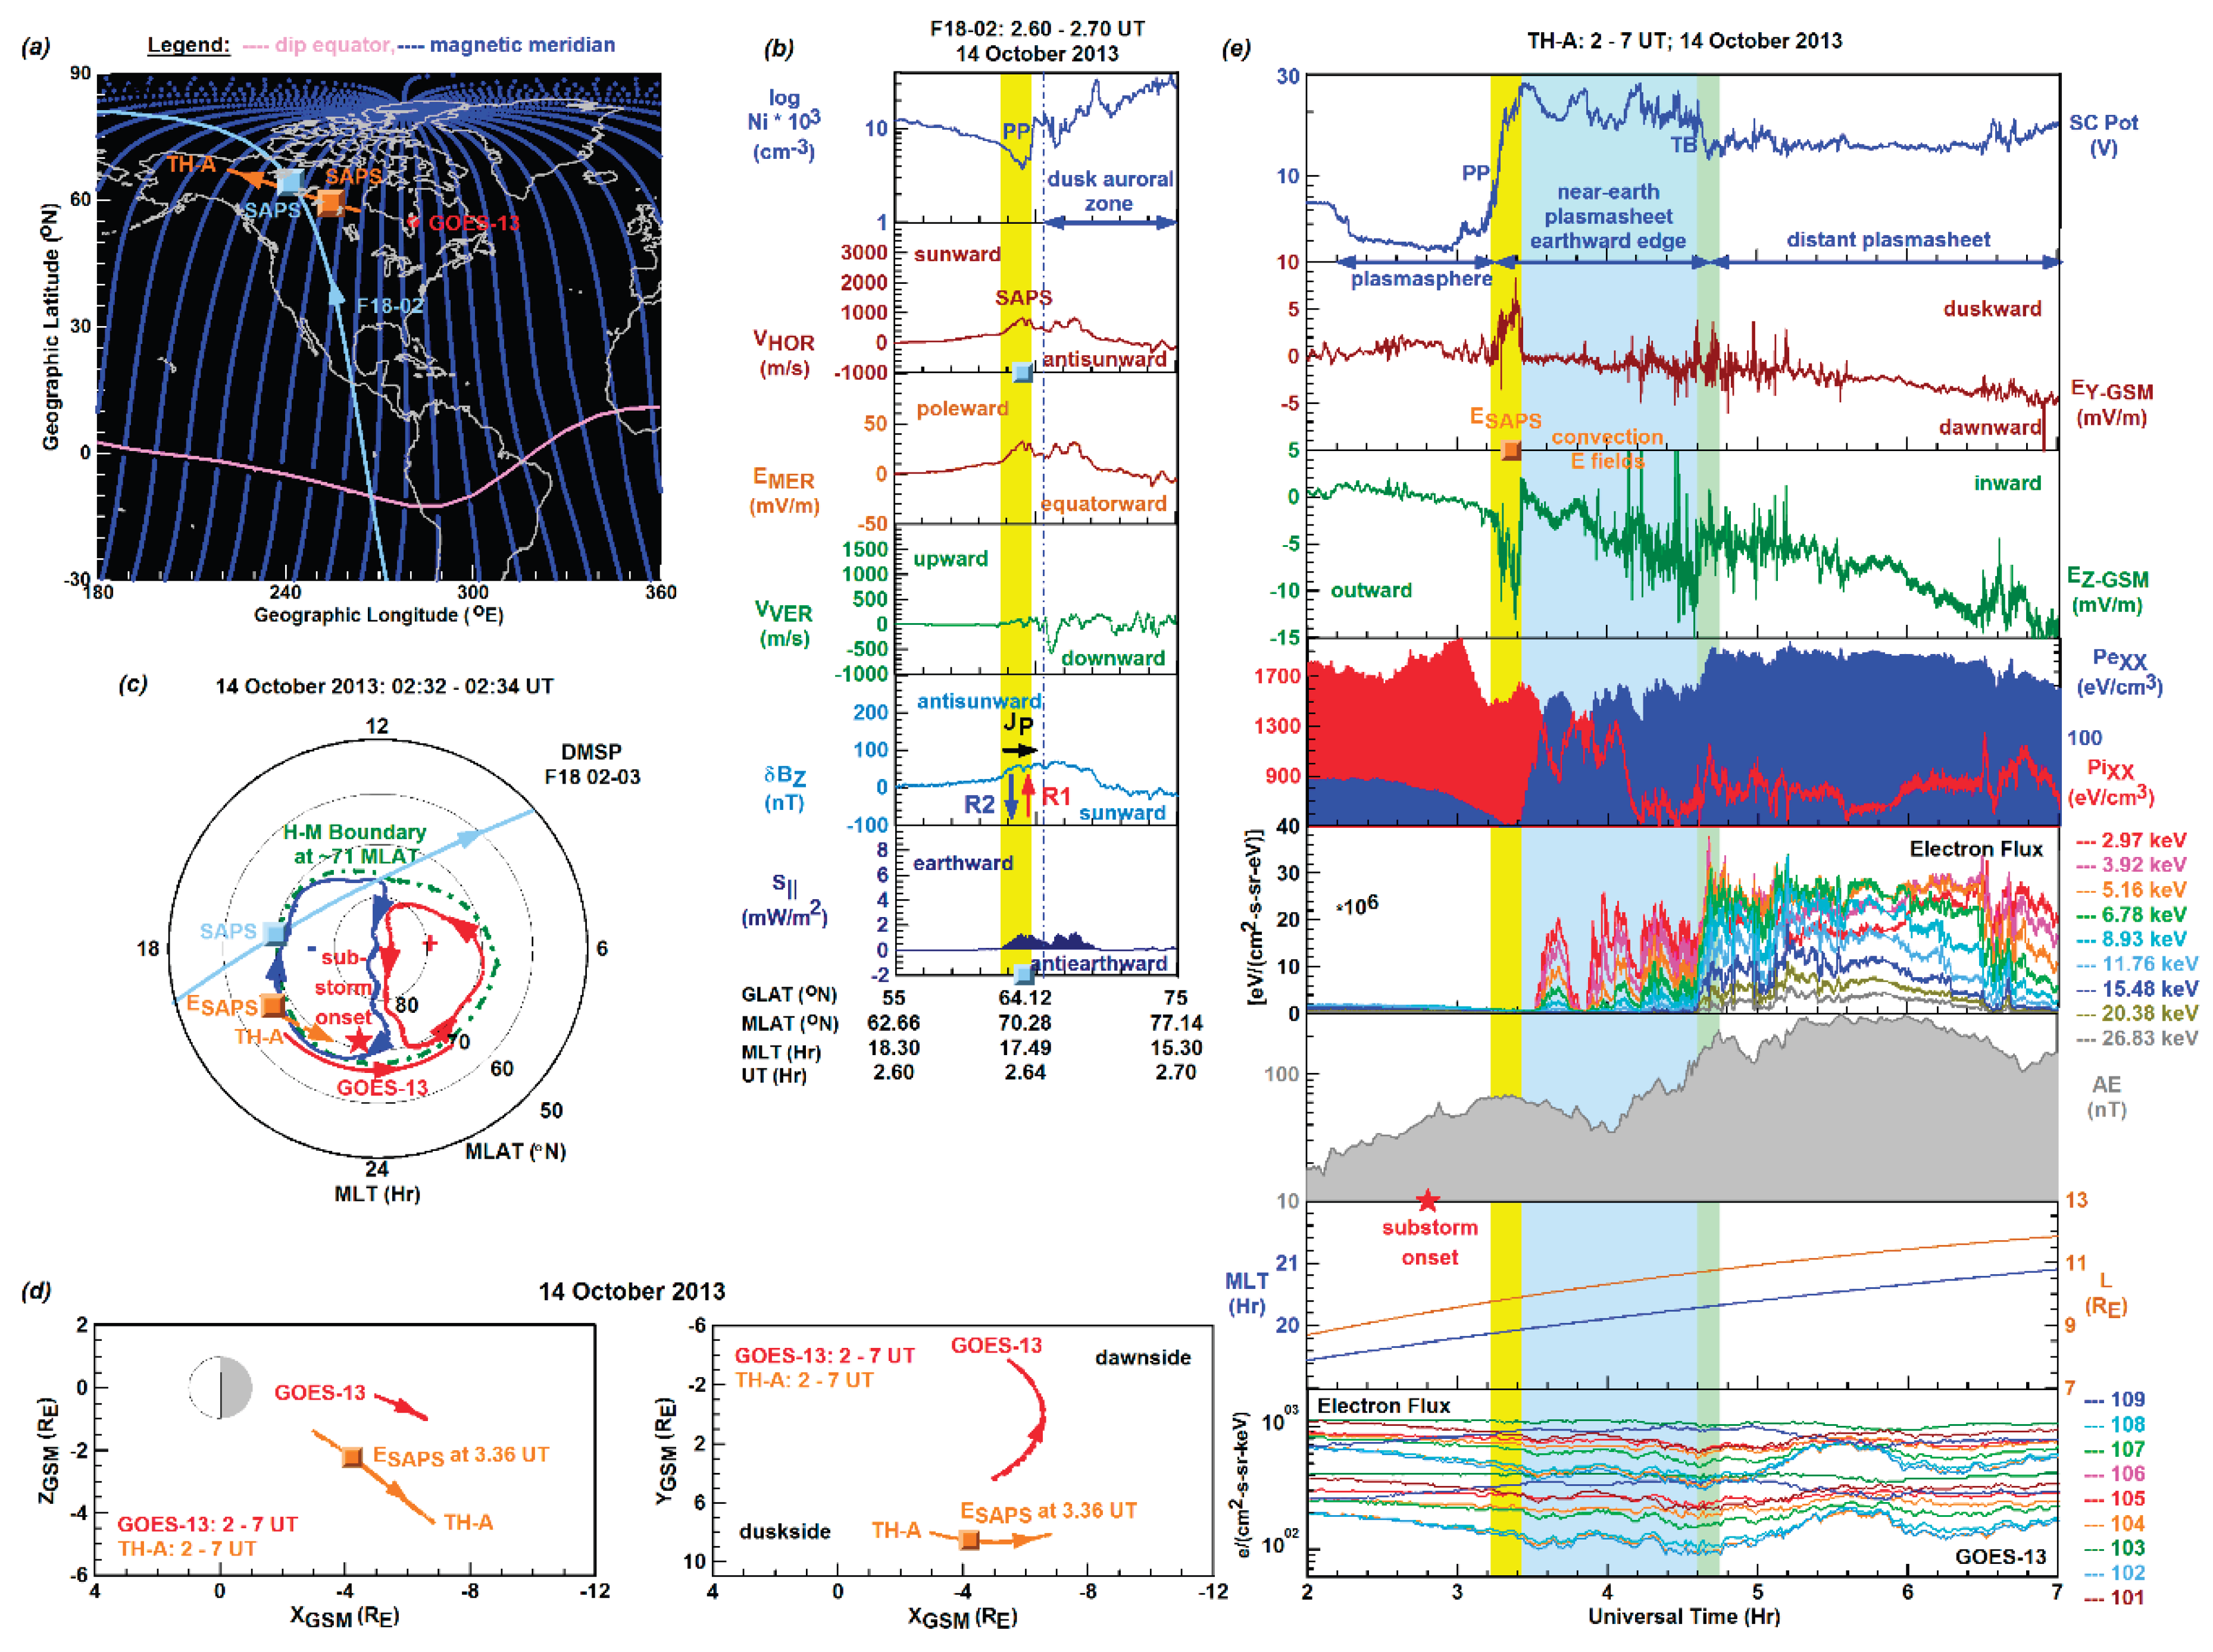
Rapid subauroral flows occurring at unusually high magnetic latitudes during quiet times and weak substorms are rarely investigated and poorly understood. We investigated the phenomenon in a comprehensive way by using multi-instrument and multipoint satellite observations along with a set of computed variables. We specified 5 Subauroral Polarization Streams (SAPS) and 28 Subauroral Ion Drifts (SAID) events observed in the Northern Hemisphere by spacecraft F18 in 2013. Driven by the strong poleward SAPS-SAID electric (E) fields (90–190 mV/m), high-latitude SAPS-SAID flows reached supersonic velocities (2400-5200 m/s) and developed at unusually high (≥68o) magnetic latitudes, in the dusk sector, sometimes on the dayside. The high-latitude SAPS/SAID flows appeared in the deep main trough and mostly within the downward region-2 current suggesting their previous development. Their underlying vertical upward/downward drifts, driven by eastward/westward zonal E fields, imply positive feedback mechanisms in progress. Earthward energy depositions into the high-latitude SAPS and SAID channels indicate magnetospheric electromagnetic energy generations in their respective voltage generators. Conjugate observations demonstrate the development of large outward SAID E field (EX≈10 mV/m) on 28 October 2013 and SAPS E field (EX≈10 mV/m) on 14 October 2013 at L≈10 RE on a short timescale at dusk.

Keywords: 
;  ;  ;  ;  ;  ;  ;  ;  ;  

1. Introduction

The ionospheric subauroral region is located equatorward of the electron auroral oval and accommodates the subauroral main ionospheric trough (MIT) [1] situated on the same magnetic field line as the plasmapause [2,3] demonstrating their strong association. Due to the subauroral region’s low conductivity, created by the lack of electron precipitation, large poleward electric (E) fields can establish themselves and consequently drive the plasma horizontally westward (or sunward) alongside the dusk convection cell. Such subauroral flows have a lifetime of less than 3 hours and appear within the main trough where the vertical ion drift is typically upward due to the collisional heat produced by the drifting ions and co-rotating neutrals [4]. Intense (> 1000 m/s) and narrow (1o-2o in magnetic latitude (MLAT)) westward flows are known as Subauroral Ion Drifts (SAID) [5,6,7] and Polarization Jets (PJs) [8]. Moderate (500-1000 m/s) [9] and broader (from 3o-5o up to 10o in MLAT) westward flows are called Subauroral Polarization Streams (SAPS) [10]. According to early studies, SAID flows were most frequently observed near magnetic midnight during the substorm recovery phase [4,11] while SAPS flows were typically observed in the dusk magnetic local time (MLT) sector during geomagnetic storms and substorms [12]. However, recent studies show the first appearance of SAID during the substorm expansion phase [13] and SAPS during the main phase of severe storms [14].
Although the development of SAID and SAPS is still highly debated, it is commonly agreed upon by the various traditional and modern generation theories that the poleward directed subauroral E field (i) drives the plasma westward in the subauroral flow channel and (ii) grows and that (iii) the SAID/SAPS channel receives electromagnetic energy known as Poynting flux powering Joule heating [15,16]. Regrading characteristic (ii), such subauroral E field growth (a) is due to the positive ionospheric feedback mechanisms created by the enhanced recombination rates reducing further both the plasma density within the main trough and the already low subauroral conductivity [4,7] and (b) occurs in direct correlation with the above-mentioned conductivity reduction and via positive ionospheric feedback mechanisms [6,7]. These (a-b) lead to the development of a trough-in-the-trough feature [17,18]. By the traditional generator theories, SAID and SAPS development is explained with conventional and inherently slow mechanisms unfolding in a voltage generator [19] or current generator [6,7]. But the modern generator theories are based on unconventional mechanisms and explain the development of SAID [20] and SAPS [21,22] as a fast-time process -occurring on a short timescale, ~10 min after the onset of substorm expansion phase- that unfolds in their respective magnetospheric voltage generators [23] where the Poynting flux is generated [24]. However, SAID flows can even develop during pseudobreakups [20] or local auroral activations not followed by fully developing substorms [25]. Via field-aligned electromagnetic energy transfer, from the magnetosphere to the subauroral flow channel, the downward Poynting flux becomes transferred along the plasmapause that acts as a power plant in the magnetosphere [26]. Then, the downward Poynting flux becomes accumulated in the subauroral flow channel, where the electron temperature becomes elevated. Consequently, both SAID and SAPS have their respective emissions and optical features appearing as east-west oriented arcs. These include the newly-discovered Strong Thermal Emission Velocity Enhancement (STEVE) phenomenon [27] associated with both (1) the 400 – 730 nm continuous spectrum where the peak emission is 630 nm red line [28] and (2) the enhanced SAID flow reaching sometimes an extreme magnitude [29,30,31,32], and the long-known stable auroral red (SAR) arc [33] that is associated with 630 nm red-line emission and strong SAID/SAPS flow [34]. It is also well understood that the short-lived STEVE arc and the long-lasting SAR arc are closely related phenomena, as SAR arc can transition to STEVE arc and STEVE arc can evolve into SAR arc [35,36,37].
SAID and SAPS are prominent features of the subauroral region and have been intensively studied since their first observations by using various types of measurements provided by satellites orbiting at various ionospheric altitudes and by ground-based radars. These studies show that SAID and SAPS develop (i) mainly during magnetically active times but also during magnetically quiet times and (ii) direct the electromagnetic energy from the magnetosphere to the ionosphere along the plasmapause. Poynting flux flowing into the SAPS channel is generated in the magnetospheric voltage generator (VGM) [24] and becomes concentrated at the interface of the oppositely directed large-scale Region 1 (R1) and R2 field-aligned currents (FACs) [15]. Poynting flux flowing into the SAID channel is produced in the inner-magnetosphere fast-time voltage generator (VGFT) [37] and is the manifestation of a new means of energy transfer triggering STEVE arc development [16].
Regarding large-scale statistical SAID studies, He et al. [38] investigated westward SAID flows for the first time based on an extensive database containing 18,226 SAID events observed by Defense Meteorological Satellite Program (DMSP) satellites during the time-period of 1987-2012. Their results show (a) SAID flows maximizing at 22:30 MLT and 60 MLAT, (b) the majority of SAID flows located at 56-65 MLAT and 20-23 MLT, and (c) no SAID flows detected earlier than 17 MLT and higher than 70 MLAT. Their findings are in good agreement with the previous statistical SAID investigations of Karlsson et al. [11] and Figueiredo et al. [13] but differ from the early results of Spiro et al. [5] reporting westward SAID flows observed by the Atmosphere Explorer-C (AE-C) satellite before 17 MLT and at higher than 70 MLAT. More recently, Laakso and Pfaff [39] studied 200 fast drift events observed by the Dynamics Explorer-2 (DE-2) satellite. Over an 18-month time-period, these drift events were observed in all MLT sectors and at latitudes higher than 50 MLAT. However, the authors specified only the high-speed flows below 55 MLAT occurring in the pre-midnight sector as SAID flows.
Focusing on SAPS, Erickson et al. [40] used Millstone Hill incoherent scatter radar measurements collected during 1979-2011 encompassing two solar cycles. For magnetically quiet and moderate times (SYM-H ≥ -100 nT), the authors documented SAPS flows at 50-68 MLAT from 22 MLT through magnetic midnight to 06 MLT. The statistical study of Kunduri et al. [41] was based on Super Dual Auroral Radar Network (SuperDARN) radar observations made between January 2011 and December 2014 during magnetically quiet times (-10 < SYM-H ≤ 10 nT; Kp < 3). Their results show that the quiet-time SAPS flows developed rarely, only 15% of the time, and preferred the midnight MLT sector in the 60 - 70 MLAT range, where the SAPS flows were weak. Landry et al. [42] used DMSP measurements collected during 1987 - 2012. Their statistical results show that under magnetically quiet conditions (AE ≤ 200 nT), moderate SAPS flows (~800 m/s) occurred from 18 MLT onwards and below 68 MLAT. He et al. [14] used DMSP measurements collected within the calendar years of 2000 - 2006 and investigated westward SAPS flows observed during 37 intense storms and 30 quiet-time substorms. Their quiet-time statistical results show that the quiet-time westward SAPS occurred during the onset of the substorm expansion phase, appeared first after 19 MLT, and their occurrence frequency maximized at ~21 MLT.
According to the above-described statistical studies, particularly to those that are based on DMSP measurements and therefore are relevant to this study, SAID and SAPS flows under magnetically quiet conditions are not expected to occur higher than 68 MLAT and earlier than 18 MLT. However, the recent study Gallardo-Lacourt et al. [43] reported the unexpected development of STEVE and enhanced SAID on 27 March 2023 at unusually high latitude (> 70 MLAT), which is ~10o magnetic latitude higher than the SAID-STEVE event’s usual location [44]. Furthermore, the unusual SAID-STEVE event was observed under magnetically quiet conditions and without any underlying substorm activity. These unusual features prompted new questions regarding the subauroral and magnetospheric dynamics underlying SAID and STEVE development [43,44].
In this study, we investigate quiet-time rapid subauroral flows appearing as enhanced high-latitude SAID and SAPS flows. These were observed under quiet geomagnetic conditions (-25 < SYM-H ≤ 25 nT; Kp ≤ 3) by DMSP spacecraft F18 close to and even higher than 70 MLAT, and sometimes earlier than 18 MLT in the Northern Hemisphere during the high-sunspot-number calendar year of 2013. Our results show that the rapid westward subauroral flows (i) were driven by their respective strong poleward E fields sometimes reaching 200 mV/m and (ii) became enhanced in the SAID channel to supersonic velocity reaching up to 5000 m/s and in the SAPS channel up to 2500 m/s during quiet-time substorms. Meanwhile, the earthward Poynting flux deposition locally maximized in the subauroral flow channel and often exceeded the auroral electromagnetic energy deposition. Occasionally, the enhanced westward SAID flow was accompanied by a strong downward drift driven by a large westward E field in the SAID channel. Two sets of magnetospheric conjugate observations demonstrate the enhanced high-latitude SAID and SAPS flows’ fast-time development.

2. Materials and Methods

For investigating intensified high-latitude subauroral flows and their topside-ionosphere plasma environments, we used multi-instrument data collected by the polar orbiting DMSP F18 satellite (~840 km altitude; ~101 min orbital period; ~98.7o inclination angle) along its sun-synchronous orbits [45]. These measurements were taken at high sunspot numbers (>75) during the calendar year of 2013, just one year before the 24th solar cycle peaked in 2014 (at ~170). At high sunspot numbers, when the scale height of the oxygen fraction (O+) is high, the plasma’s O+ composition at ~840 km altitude is high (> 85%). Under these conditions, the Ion Drift Meter (IDM) functions well and without limitations, and the cross-track drift data are generally good quality [46]. Meanwhile, the Scintillation Meter (SM) providing ion density (Ni) data and the Langmuir Probe (LP) producing electron temperature (Te) values are not affected by the plasma’s O+ content and are regarded as good quality. According to F18 data availability, which excluded entirely the measurements of electron temperature (Te), we used the data of ion density (Ni; 1/cm3), cross-track ion drift measured in the horizontal (HOR) and vertical (VER) directions (VHOR and VVER; m/s), and magnetic (B) field deflection components (δBY and δBZ; nT). We also included the B field components (BX, BY, BZ; nT) for computing both the vertical (X) component of the static or DC Poynting flux (SX; mW/m2) and the meridional (MER) component of the ionospheric E field (EMER; mV/m) in spacecraft-centered coordinate system. We followed the equation of SX = 1/μ0[(VXBZ-VZBX)dBZ-(-VXBY)dBY], where μ0=4π×10−7 H/m, X = downward, Y = ram direction, and Z = antisunward (see Figure 1 in Huang and Burke [47]), as reported by Huang et al. [48]. In our presentation, we marked the Poynting flux vector as S since it is a vector directed parallel (‖) to the approximately vertical (i.e., radial) magnetic field [49]. We plotted the earthward-directed S data as positive (S > 0) values. In geodetic coordinates, we computed the meridional (X) E field based on the equation of EX = VZBY - VYBZ reported by Kilcommons et al. [49] where positive/negative EX is poleward/equatorward directed in the northern hemisphere. We also used the values of east-west directed EY = VXBZ - VZBX [49], which is a zonal directed (ZON) E field (EZON; mV/m) and was obtained from the Madrigal Database. Since the accuracy of δB, SX and E field components depends on the quality of DMSP data used, the computed values reported in this study are regarded accurate and reliable because of the good quality high-sunspot-number DMSP data used.
For investigating the conjugate magnetosphere in the regime of near-Earth plasmasheet, we used a small collection of data recorded by the Time History of Events and Macroscale Interactions during Substorms (THEMIS) A (TH-A) satellite for the conjunction events of interest. In 2013, the three Earth-orbiting THEMIS satellites (TH-A, TH-D, and TH-E) completed their Tail Science phase with an apogee at ~12 RE on the nightside [50]. We used various types of THEMIS data including hot (up to 700 keV) electron density (Ne; cm-3) from the Ground Calculated Particle Moments (GMOM) suite, while the Electrostatic Analyzer (ESA) suite [51] provided the measuremnts of electron flux taken at various keV channels and of electron and ion pressure tensors (PeXX and PiXX; eV/cm3). E field components (EX, EY, EZ; mV/m) were provided by the Electric Field Instrument (EFI) suite [52].
Geostationary Operational Environmental Satellites (GOES) orbit the Earth at 6.6 RE, observe atmospheric and meteorological phenomena, and monitor the Earth’s space environment [53]. For observing particle injections occurring near the conjunction events of interest, we used electron flux measured in various directions by GOES-13 at 275 keV and 475 keV and by GOES-15 at 40 and 75 keV.
Orbit data included spacecraft location in Geocentric Solar Magnetospheric (GSM) coordinates, L shell (RE), magnetic local time (MLT; Hr), northern-hemisphere footprints in geographic [longitude (GLON), oE; latitude (GLAT), oN] coordinates, and geomagnetic latitude (MLAT, oN).
For observing the underlying ring current, geomagnetic and auroral conditions, we employed a small collection of variables provided by the OMNI database. These include the high resolution SYM-H (nT) index for observing ring current variations and specifying storm and non-storm time periods, the 3-hour Kp index for monitoring the underlying geomagnetic activity, and the auroral AE and AL indices (nT) for specifying substorms additionally to the SuperMAG-published substorm lists of Forsyth et al. [54] and Newell and Gjerloev et al. [55] specifying substorm onset times and locations.

3. Results

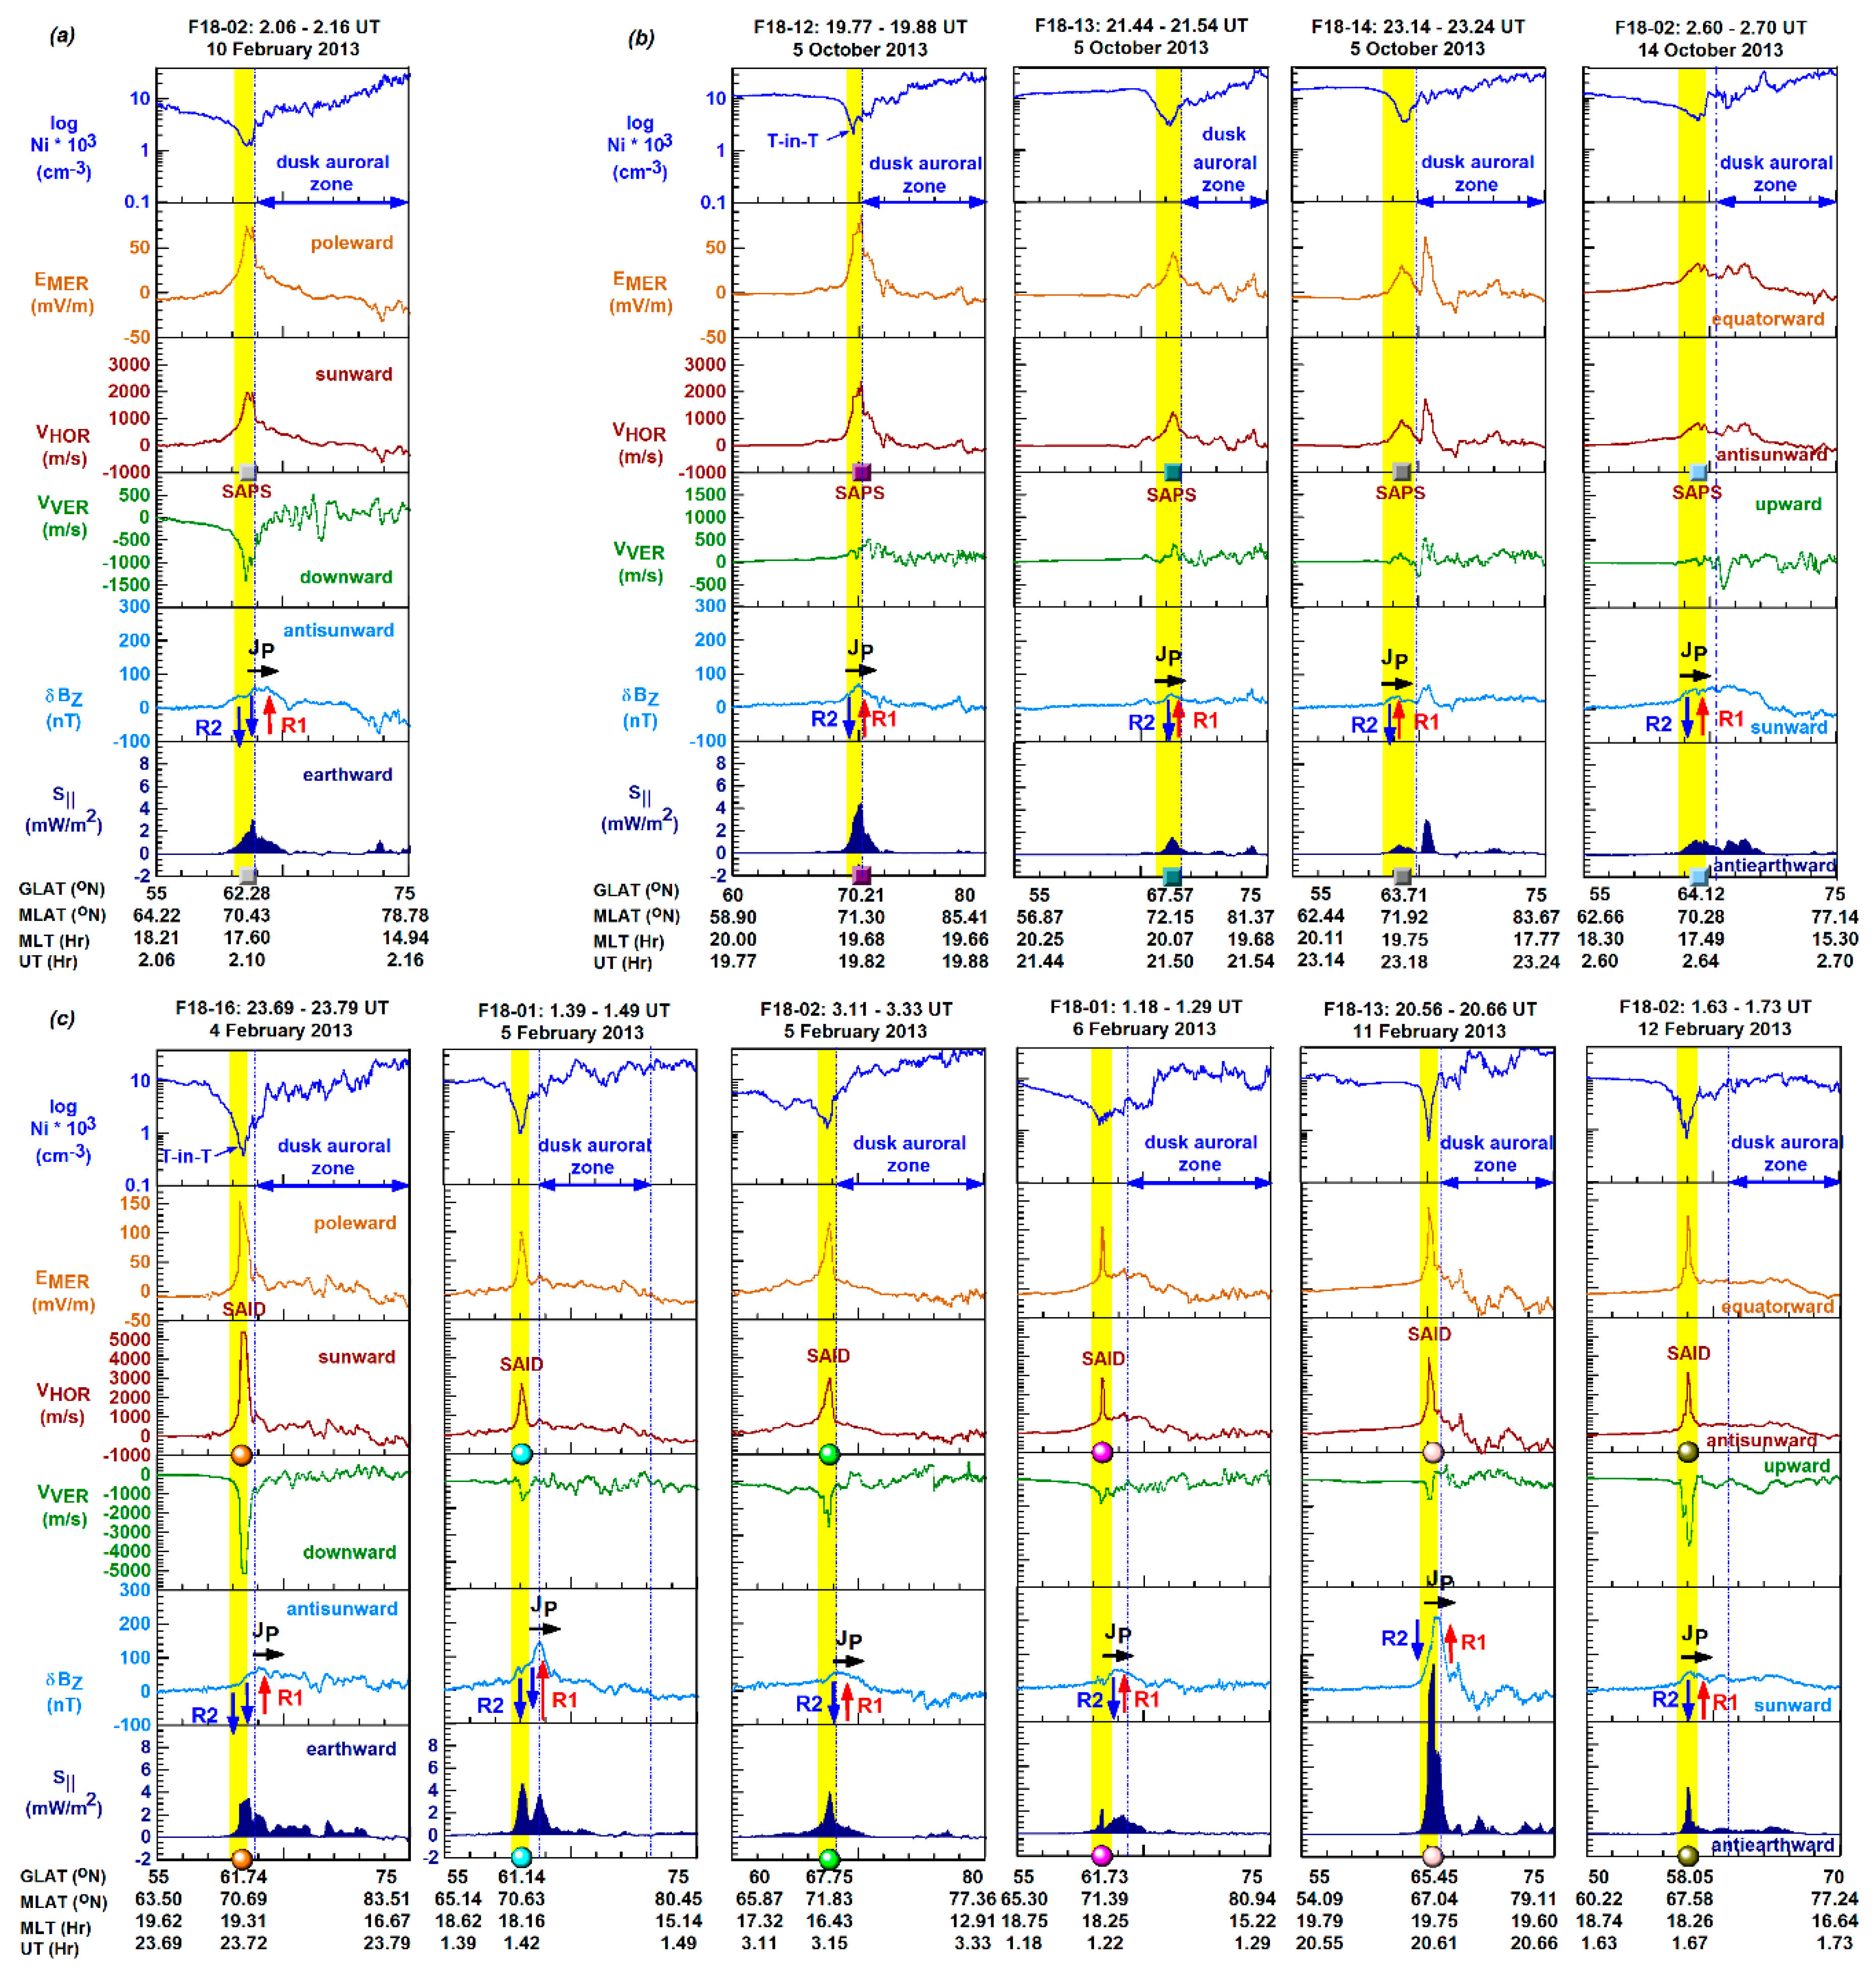
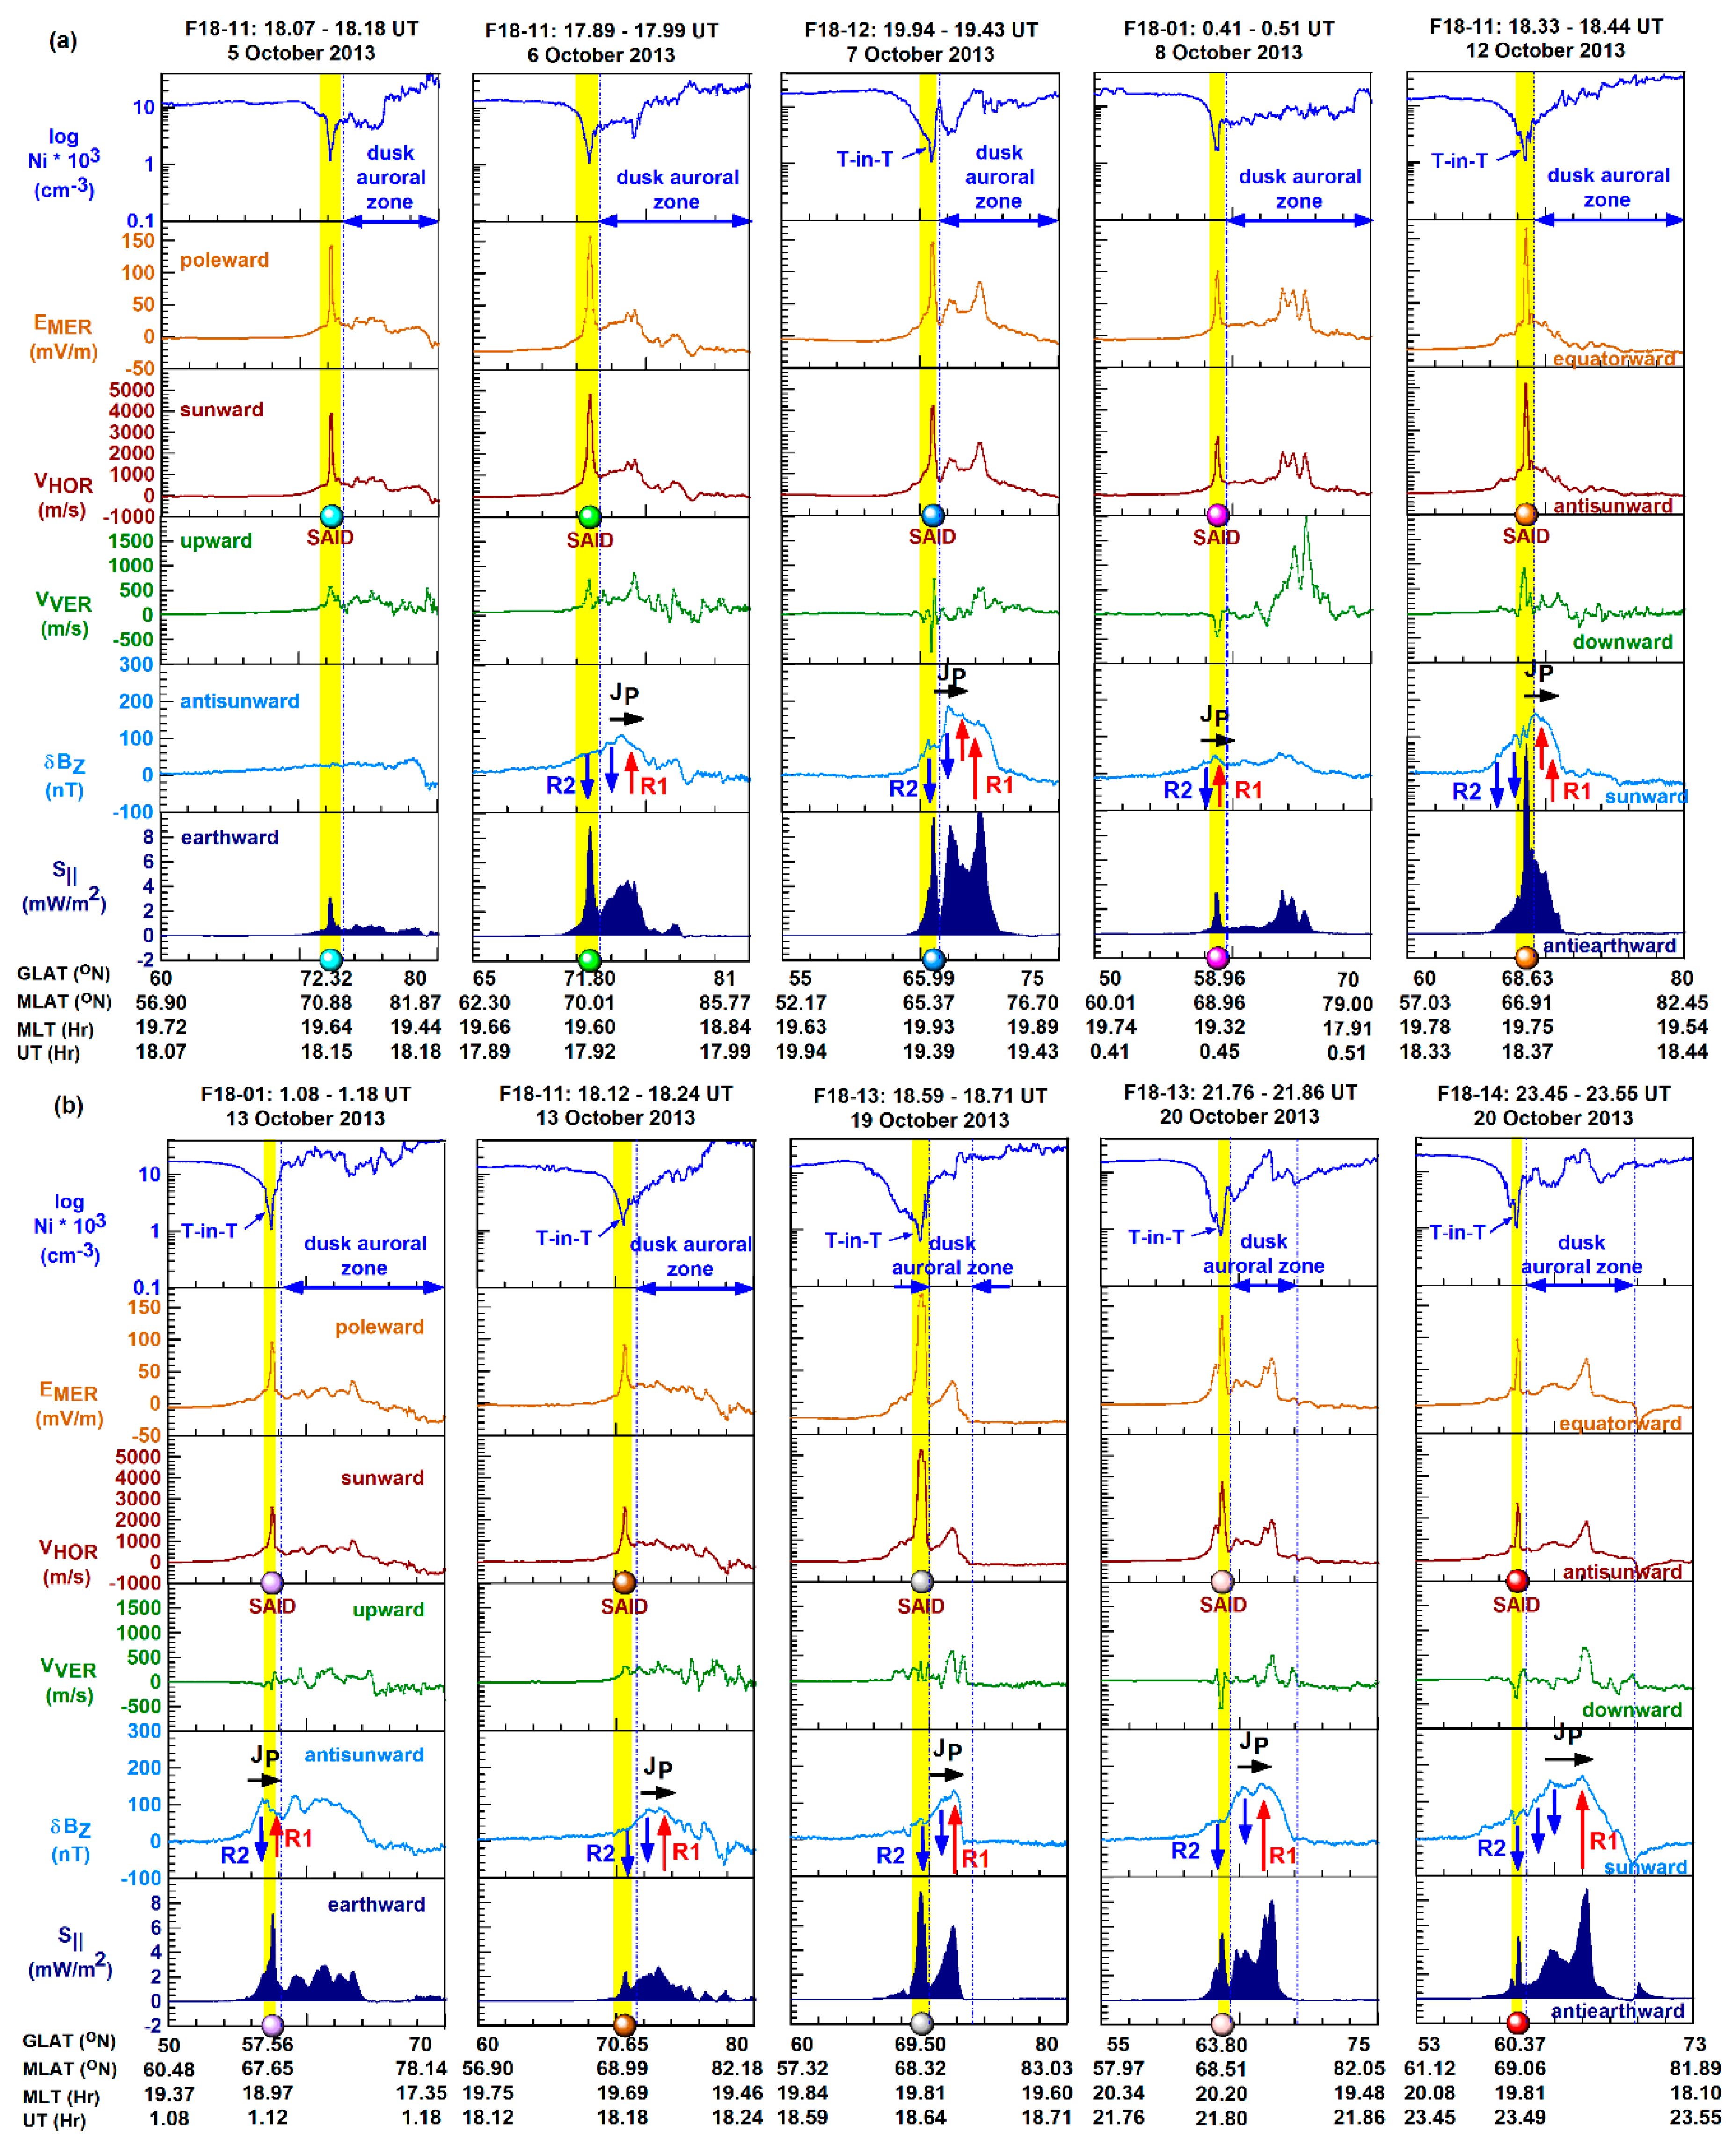
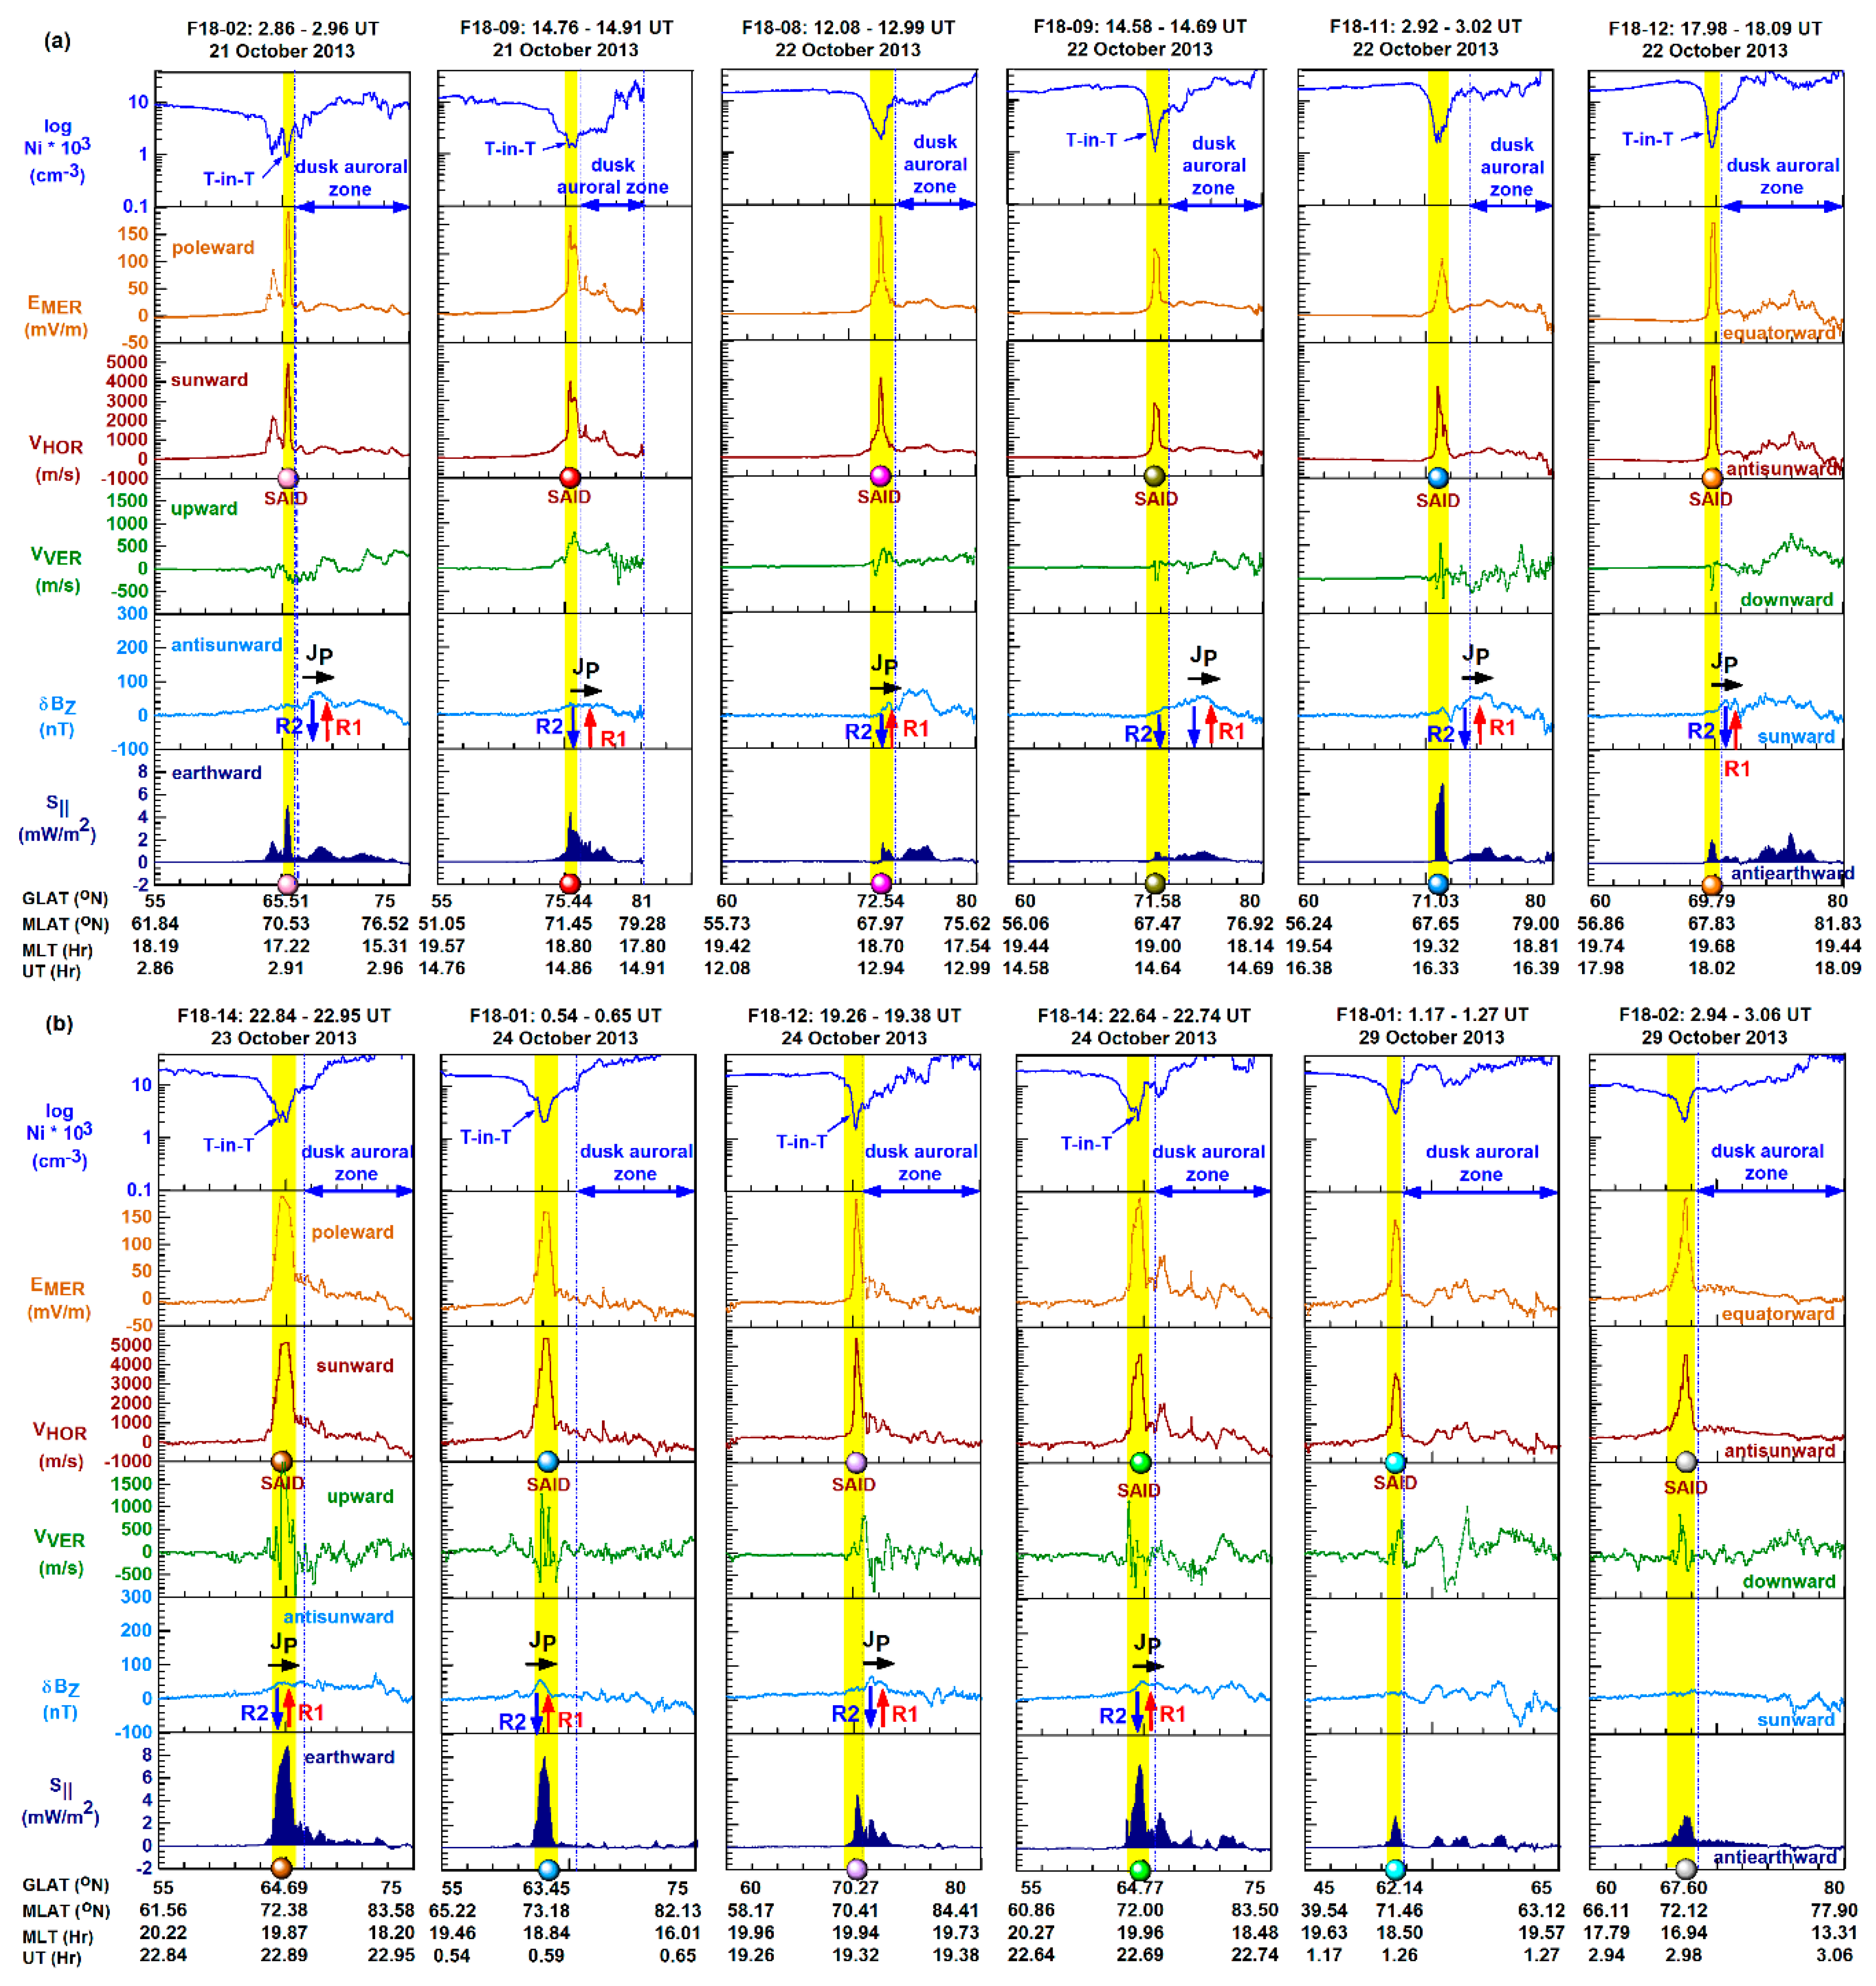
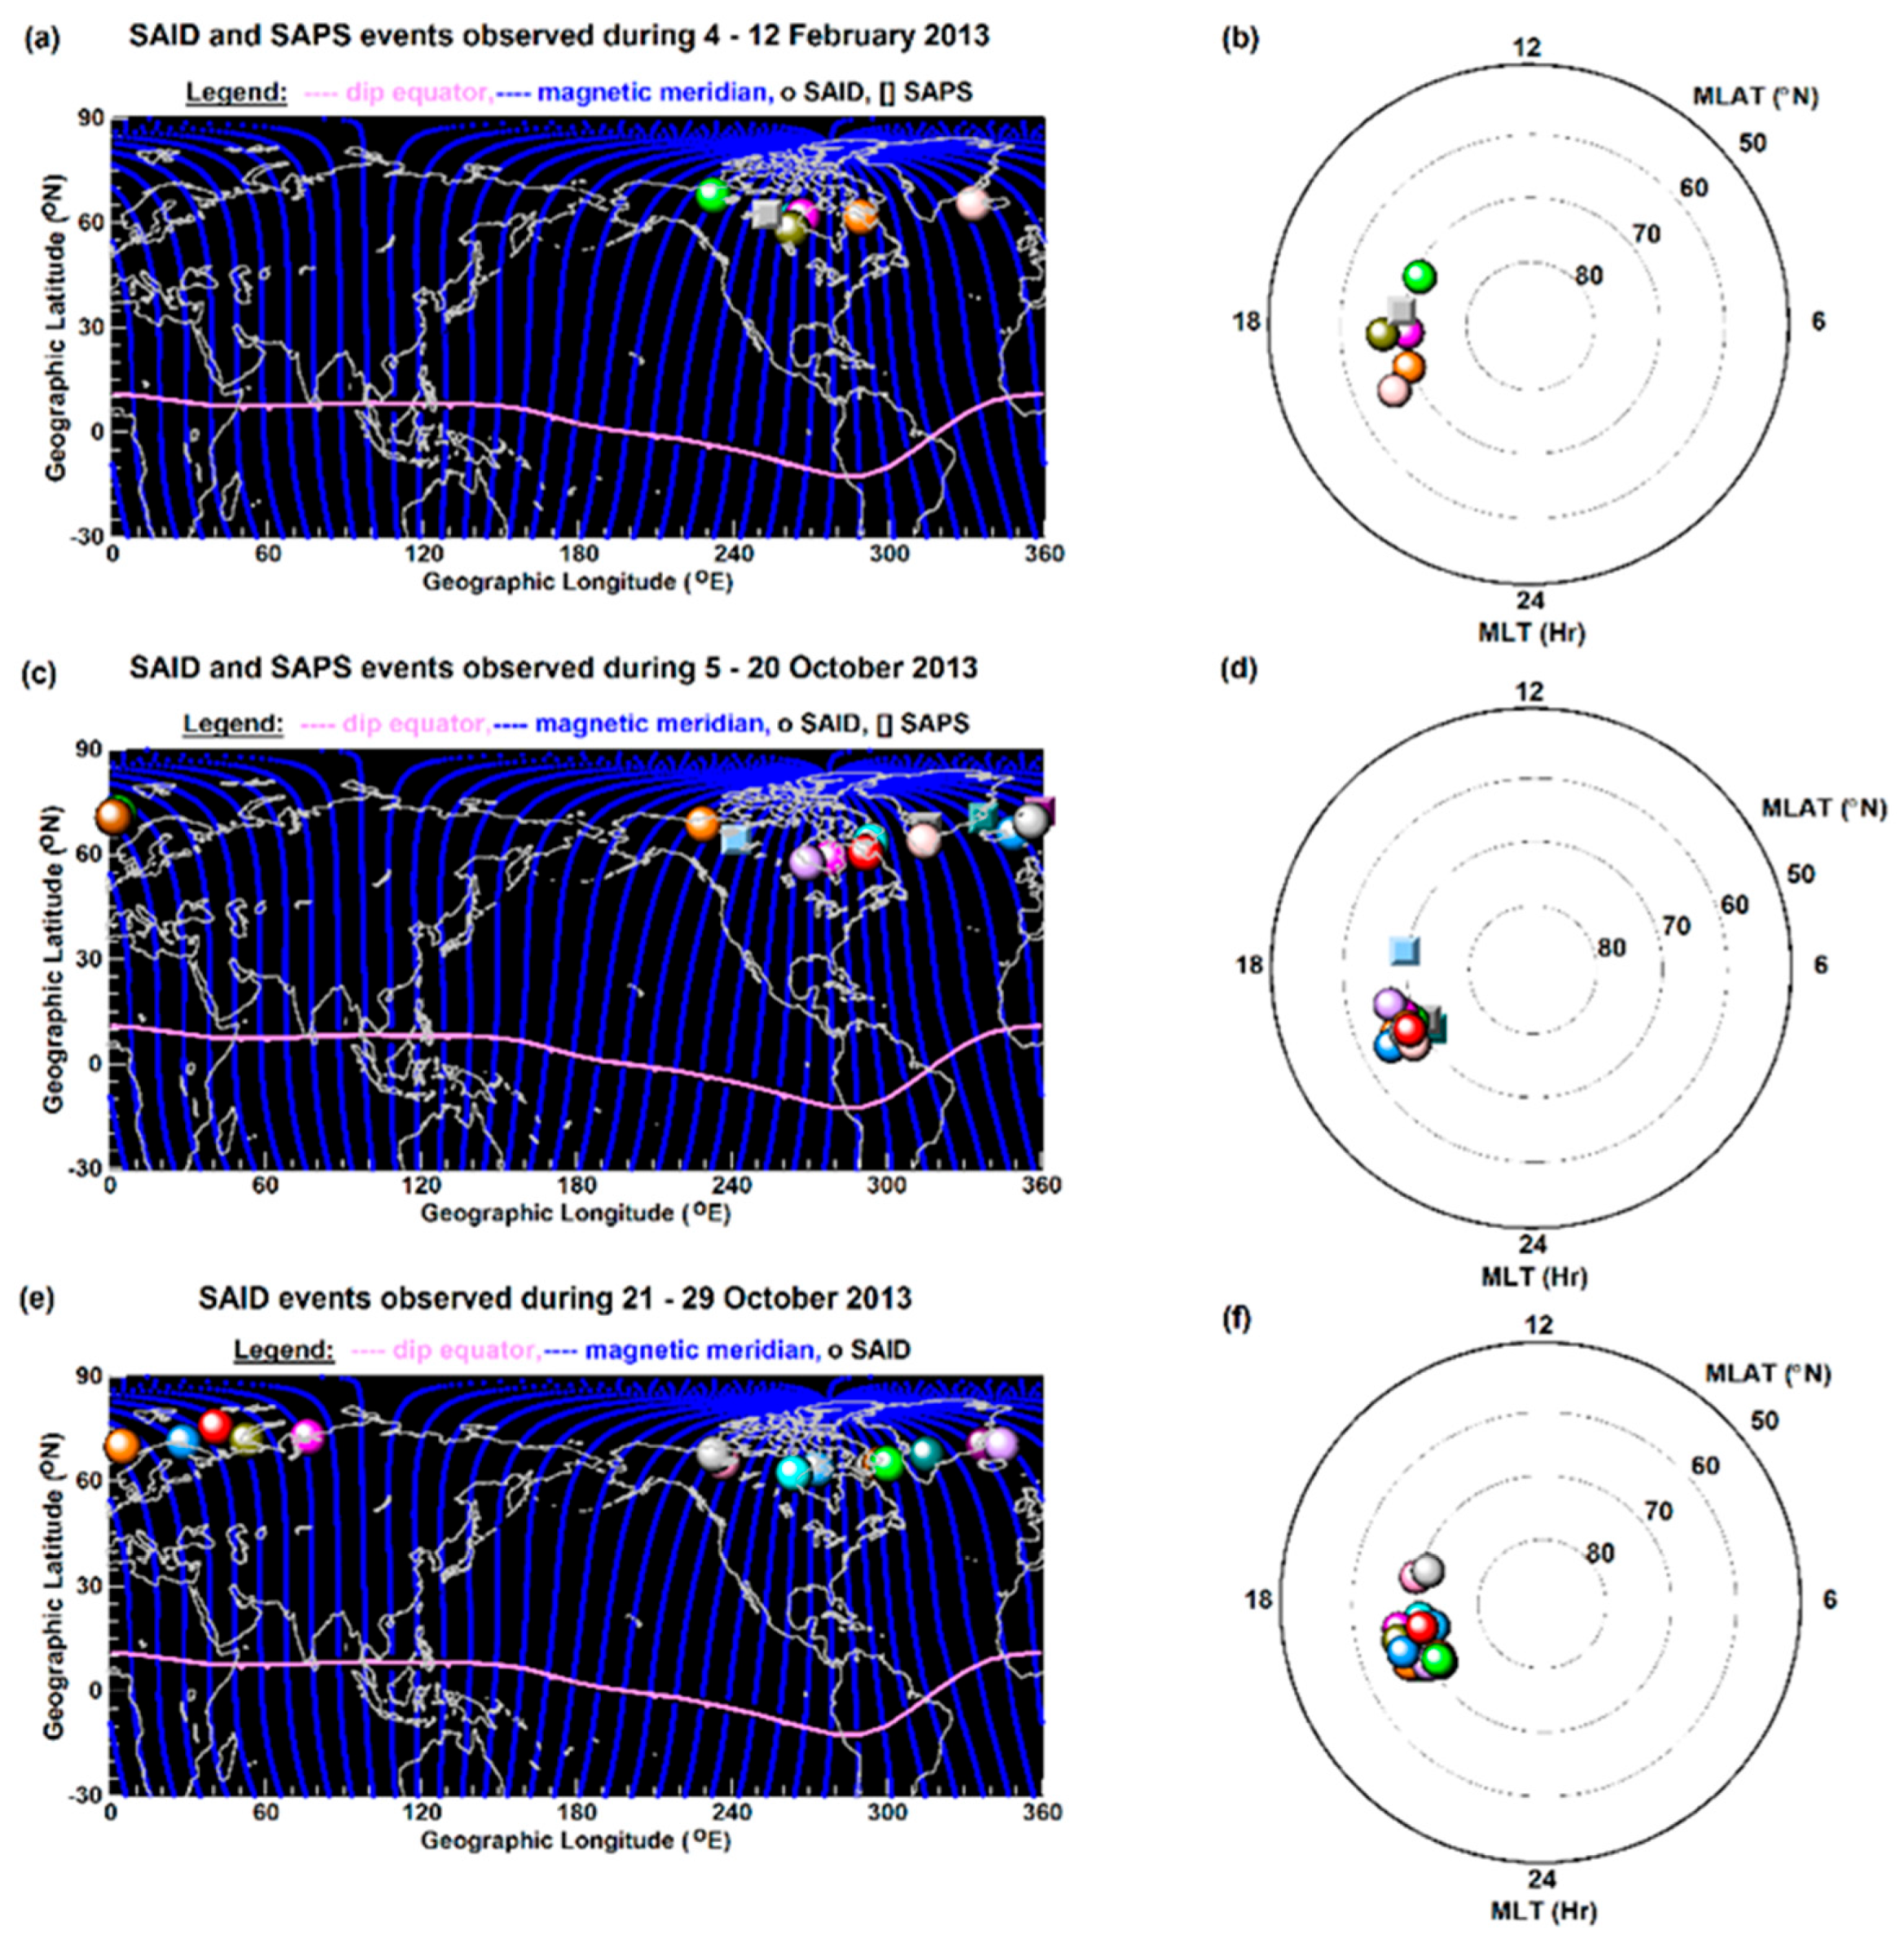
3.1. Rapid High-Latitude Subauroral Flows Investigated

We inspected the high-latitude F18 line plots for the calendar year of 2013. Since the F18 particle spectrometer was working, we could observe electron and ion spectrogram images. Based on the equatorward electron oval boundary, we located accurately the subauroral main trough and identified correctly the rapid subauroral plasma flows appearing at high magnetic latitudes and within the main trough.
We identified altogether 33 high-latitude subauroral flow events observed in the Northern Hemisphere by F18 in 2013. These observations were made during the months of February and October, in the dusk MLT sector, and at unusually high magnetic latitudes, near or higher than 70 MLAT (see Table 1 and Table 2).
These rapid subauroral flow events include 5 high-latitude SAPS events, 1 in February and 4 in October (see Table 1), and 28 high-latitude SAID events, 6 in February and 22 in October (see Table 2). All these high-latitude SAID and SAPS locations are mapped in Figure 1.
In Figure 1, each horizontal panel illustrates a northern-hemisphere geographic map and a northern MLT vs MLAT polar map where we plotted the locations of high-latitude SAPS (square symbols in colors) and SAID (dot symbols in colors). For illustrating the alignment of magnetic field lines and the location of magnetic North Pole, we mapped the modeled magnetic meridians (in blue) and the magnetic dip equator (in light magenta).
Figure 1’s top panel is for the month of February 2013 and covers 1 SAPS event and 6 SAID events. Its middle and bottom panels are for the month of October 2013 depicting their respective 3 SAPS and 10 SAID events up to 20 October and 12 SAID events from 21 October onward. We note here that all these events (i) are further illustrated in Figure 3, Figure 4 and Figure 5 with their respective line-plot sets and (ii) are plotted together on the same geographic map shown in Figure 7a and on the same polar plot shown in Figure 7b.
Overall, the northern geographic maps reveal that F18 tracked the rapid high-latitude SAPS/SAID flows mostly over the North American continent (i.e., in the longitude sector of magnetic North Pole, where the offset between the dip and geographic equators is the largest) and in the European sector, and occasionally in the Asian sector. Between these longitude sectors, the detections of rapid high-latitude SAPS/SAID flows were absent. This was due to the subauroral main trough’s absence on the dayside (~16 MLT) or weak presence on the nightside (~18 MLT) appearing shallow at lower latitudes and accommodating only a weak subauroral flow.
According to the MLT vs MLAT polar plots, the rapid high-latitude SAPS/SAID observations were made on the dusk side, between 16 and 20 MLT, and mostly close to and at 70 MLAT. Sometimes, F18 observed the rapid high-latitude SAID flows at higher than 70 MLAT and earlier than 18 MLT. Such detections are marked by the dot symbol in green in Figure 1b and by the dot symbols in light red and light gray in Figure 1f, and by the square symbol in light blue in Figure 1d (see more details in section 3.3).

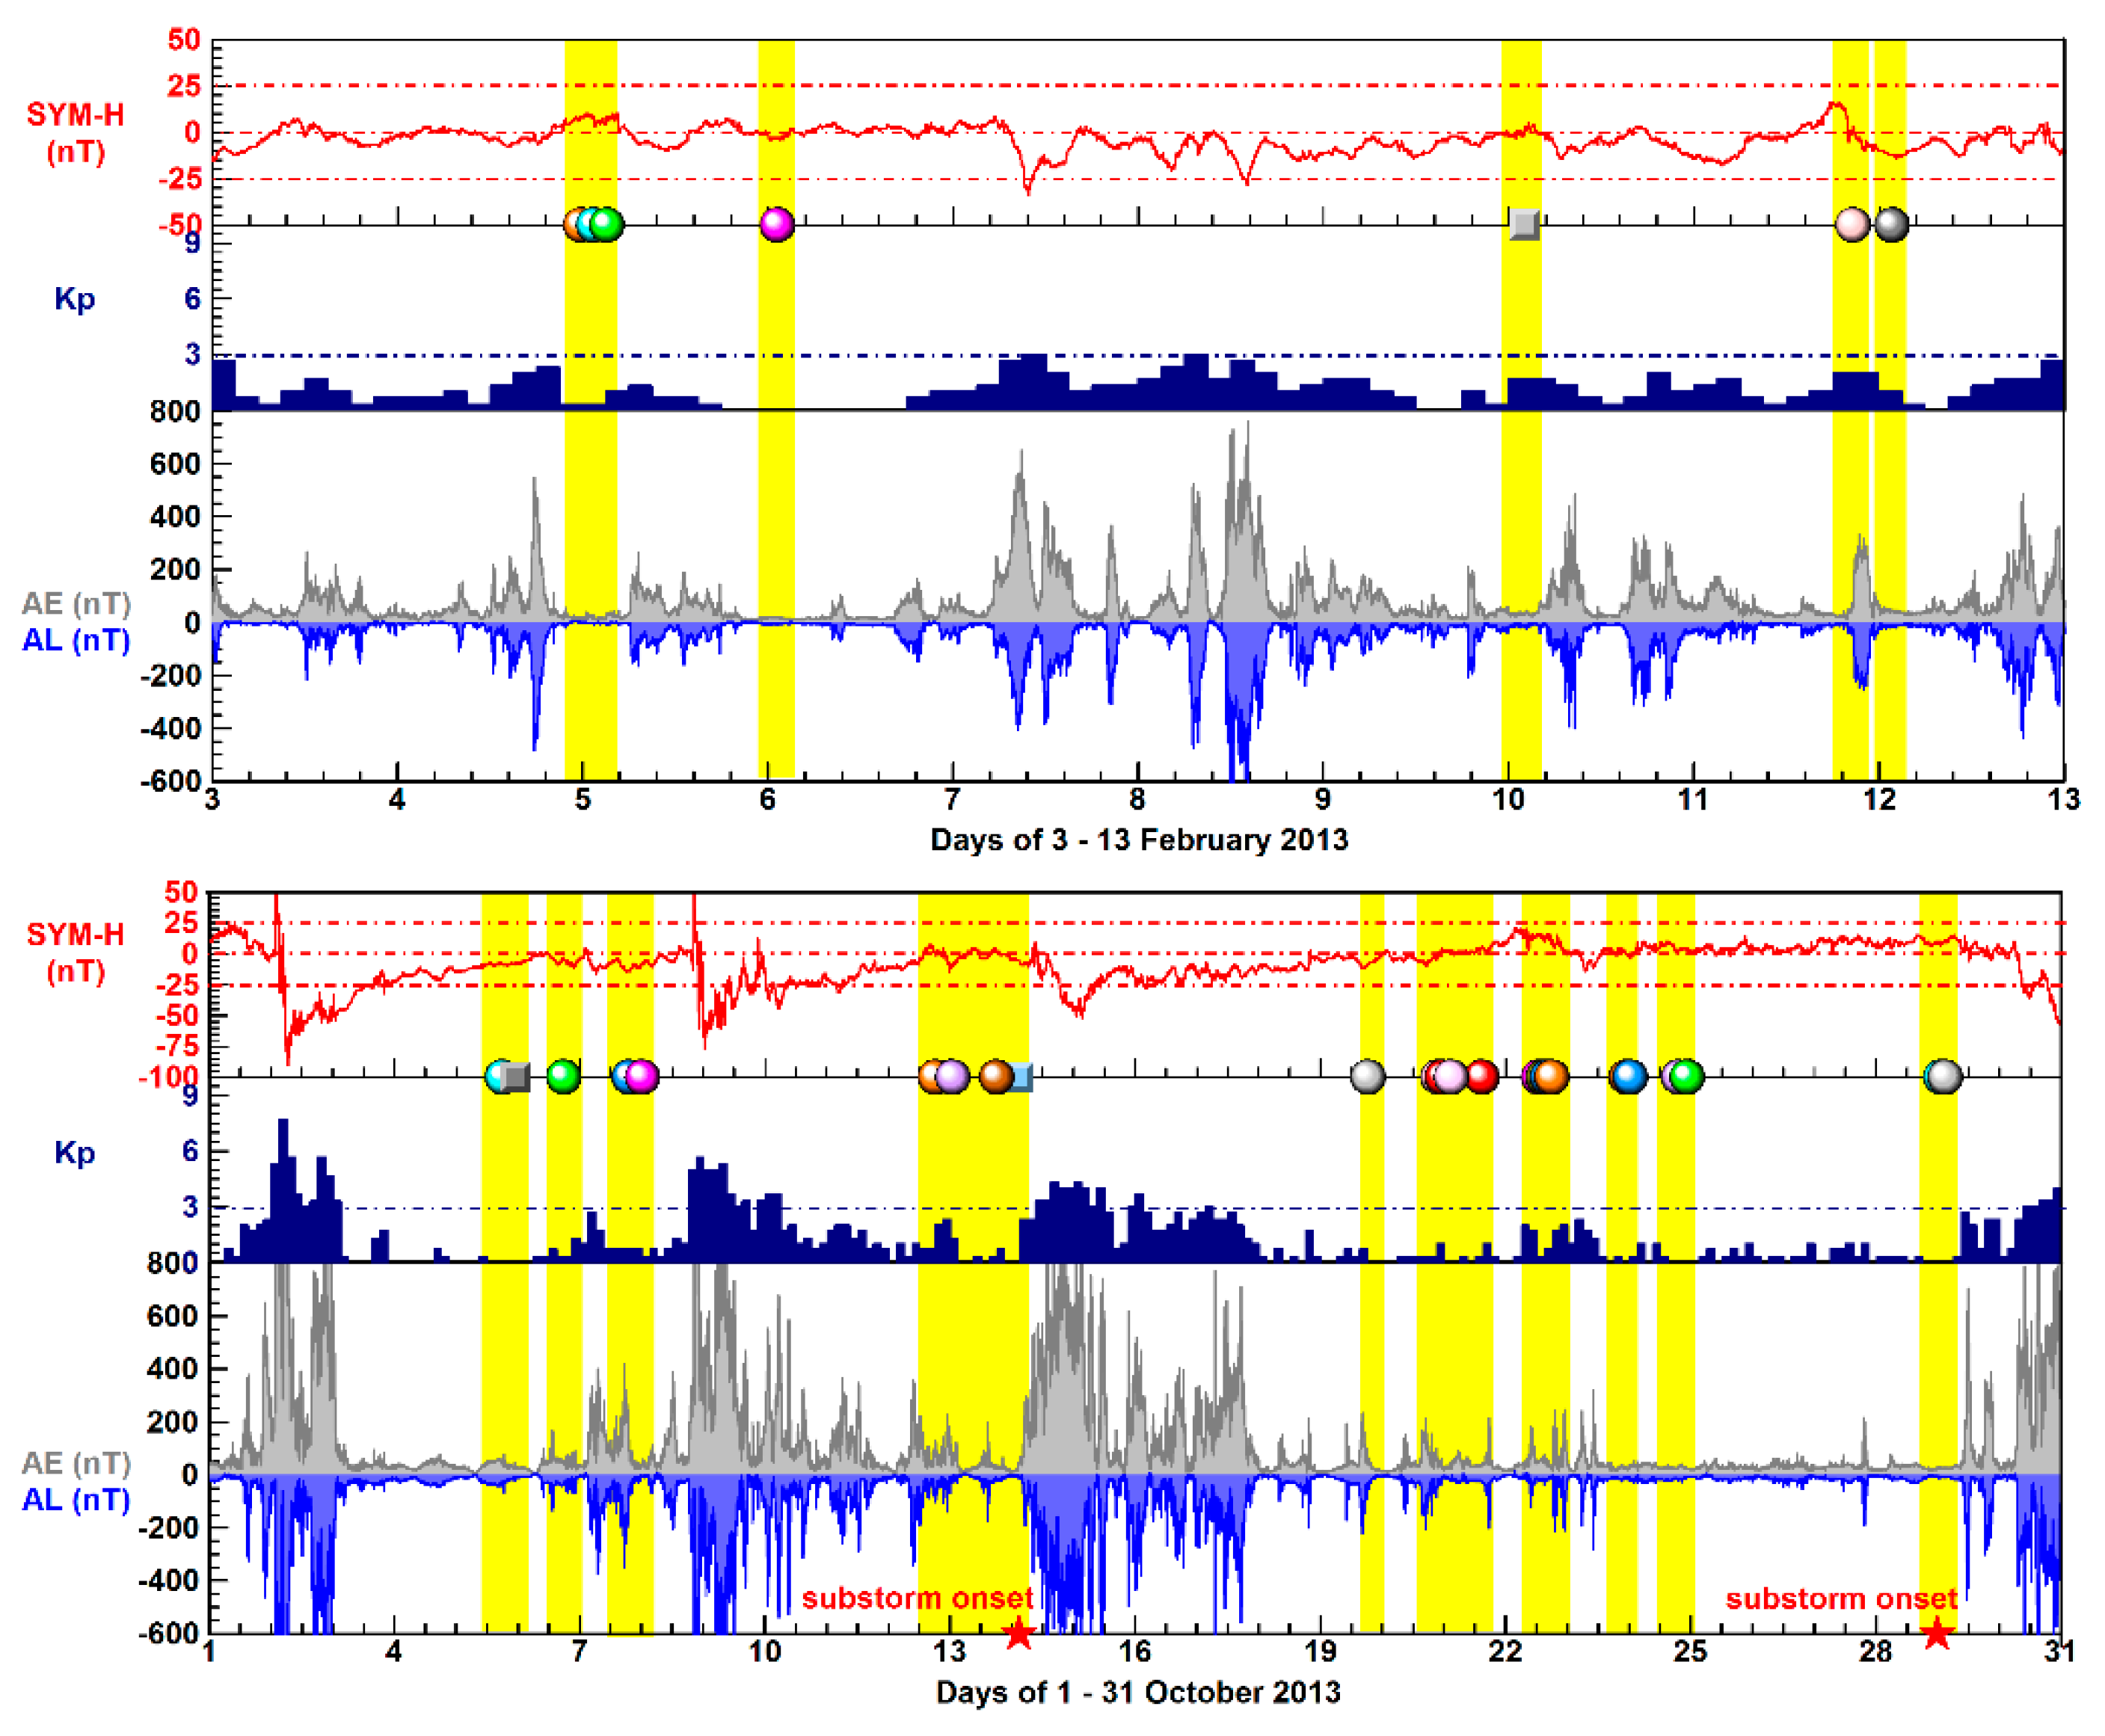
3.2. Underlying Interplanetary and Geomagnetic Conditions

Figure 2 illustrates the underlying ring current/storm, geomagnetic, and auroral/substorm conditions with the time series of SYM-H, Kp, and AE and AL. Here, we marked the rapid high-latitude SAPS/SAID detections (square/dot symbols in colors; shaded intervals in yellow). For indicating quiet geomagnetic conditions, we added the horizontal lines of SYM-H = ±25 nT and Kp = 3. These reveal that the rapid high-latitude SAPS/SAID flows were observed under magnetically quiet conditions. We marked also two substorm onsets (star symbols in red) occurring before their respective high-latitude subauroral flows.
Figure 2’s top panel covers the time-period of 1-13 February 2013, during which all the events (1 SAPS and 6 SAID) were observed during non-storm substorms. Figure 2’s bottom panel covers the entire October month of 2013. Then, most of the events (4 SAPS and 22 SAID) were observed during the late recovery phases of three consecutive storms and later on, under weak-storm substorm conditions. But on 29 October, the last two SAID events were observed during a non-storm weak substorm.

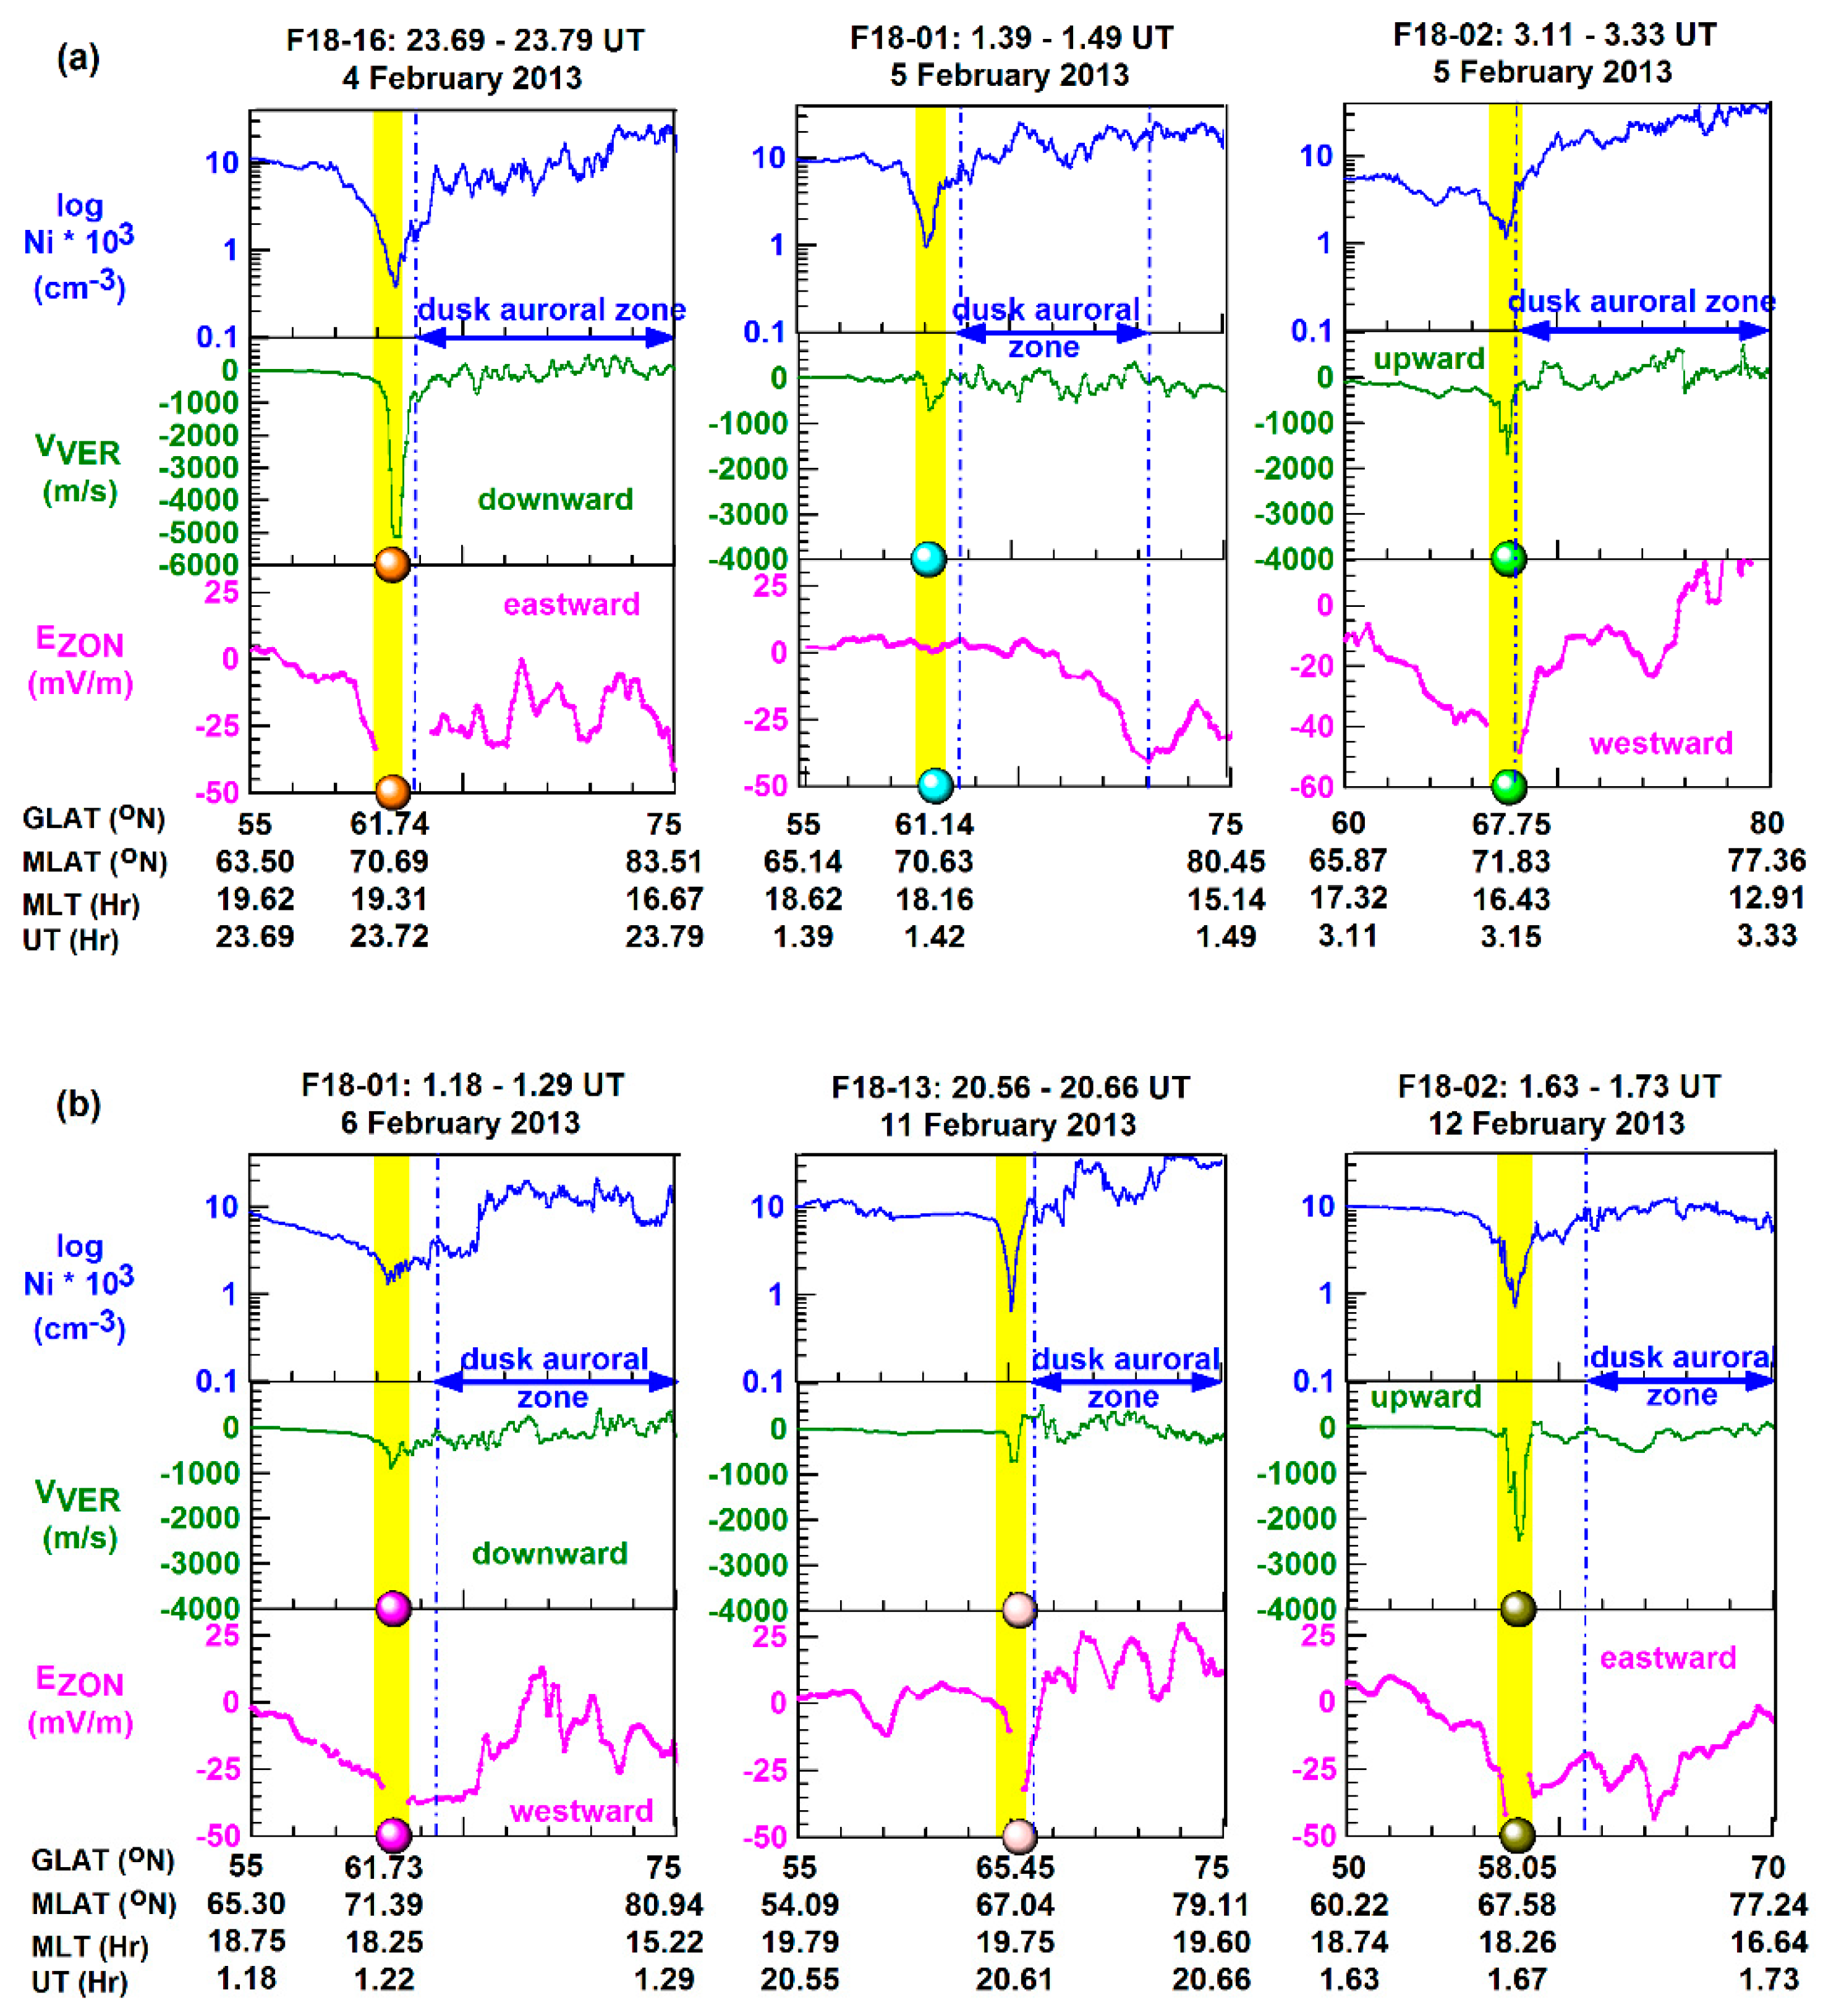
3.3. Characteristics of the Rapid High-Latitude SAPS and SAID Flows

In Figure 3, Figure 4 and Figure 5, the latitudinal line plots of ion density (Ni), meridional E field (EMER), ion drifts (VHOR and VVER), deflection component (δBZ), and Poynting flux (S) depict the rapid high-latitude SAID/SAPS flows within their respective ionospheric settings. For each line-plot set, we marked the region of duskside auroral zone (based on the electron particle data) along with the SAPS/SAID channel (square/dot symbol in color, shaded interval in yellow) depicted by the VHOR line plot. Based on the basic definitions (described in section 1), we specified the broader and weaker flows as SAPS and the spikey, narrower and stronger flows as SAID. In the δBZ plot, where δBZ is an east-west (antisunward-sunward) component, we specified the duskside downward (↓) R2 current (in blue) by the positive δBZ gradient, the upward (↑) R1 current (in red) by the negative δBZ gradient, and the poleward directed Pedersen current (JP; in black) within or near the SAPS/SAID channel. Since these are quiet-time SAPS/SAID events, the δBZ changes are small (≤ 100 nT), but sometimes reach ~200 nT. These line-plot sets depict the enhanced high-latitude SAPS/SAID flows within their own ionospheric settings, appearing sometimes as newly formed but mostly as previously formed (see details below) and characterized by a trough-in-the-trough (marked as T-in-T) plasma density feature.
Figure 3. The line-plot sets show the rapid high-latitude subauroral plasma flows and their environments (a-b) during the SAPS events of 2013 and (c) during the February 2013 SAID events. The feature of trough-in-the-trough is marked as T-in-T.
Preprints 200472 g003
Figure 4. The line-plot sets show the rapid high-latitude subauroral plasma flows and their environments (a-b) during the 5-20 October 2013 SAID events. The feature of trough-in-the-trough is marked as T-in-T.
Preprints 200472 g004
Figure 5. The line-plot sets show the rapid high-latitude subauroral plasma flows and their environments (a-b) during the 21-29 October 2013 SAID events. The feature of trough-in-the-trough is marked as T-in-T.
Preprints 200472 g005
Regarding the underlying generation mechanisms, we assumed fast-time SAPS/SAID development in an inner-magnetosphere voltage generator setting where the newly-developed outward SAPS/SAID E field mapped down along the magnetic field lines (threading the plasmapause) to the subauroral ionosphere as a poleward directed subauroral E field. In such a newly-developed SAPS/SAID event, the EMER line plot depicts the poleward subauroral E field (i.e., mapped-down outward SAPS/SAID E field), which drove the plasma westward (depicted by the VHOR line plot) in the newly-developed subauroral flow channel. Such a newly-formed subauroral flow appears without any underlying large-scale FACs [20,23], as shown by some of the SAID events in Figure 4 and Figure 5, since both the large-scale FACs’ development and flow take time in a newly-formed magnetospheric voltage generator [37].
However, most of the enhanced high-latitude SAPS/SAID flows (shown in Figure 3, Figure 4 and Figure 5) developed previously in the regime of ↓R2 current flown into the subauroral region. This is where the poleward Pedersen-current-related poleward E field becomes established and adds to the poleward subauroral E field (i.e. mapped-down inner-magnetosphere outward E field). In such a previously-formed SAPS/SAID event, the computed EMER (depicted by EMER line plot) represents the net poleward subauroral E field appearing in the regime of ↓R2 current. However, the Pedersen-current-related poleward subauroral E field grows via positive feedback mechanisms in direct correlation with the decreasing Pedersen conductivity/plasma density [7]. This leads to the development of a trough-in-the-trough plasma density feature [17,18] within the main trough accommodating the previously-developed (or old) subauroral flow (as shown in Figure 3, Figure 4 and Figure 5).
To describe the high-latitude SAPS/SAID events shown in Figure 3, Figure 4 and Figure 5, we start with the 5 SAPS events shown in Figure 3a,b. Both the wider poleward EMER (driving the plasma westward in the SAPS channel) and the broader high-latitude westward SAPS flow appeared within the main trough. There, the plasma streamed in the sunward direction and the earthward electromagnetic energy deposition (measured by the Poynting flux) increased up to S ≈ 4.5 mW/m2. At each SAPS channel’s poleward edge, the oppositely directed ↓R2-↑R1 FACs connected via poleward Pedersen currents implying that these high-latitude SAPS flows were old and developed previously in a voltage generator setting. These ↓R2-↑R1 FACs supported the growth of both (1) the poleward subauroral E field via the increasing poleward Pedersen current and (2) the SAPS flow by deepening the main trough (i.e., by locally decreasing the plasma density and increasing the conductivity) and therefore creating a trough-in-the-trough feature implying positive feedback mechanisms in progress [4,7]. An interesting feature is the underlying downward drift. In the 10 February SAPS event shown by Figure 3a, the rapid high-latitude SAPS flow (VHOR ≈ 2000 m/s) was driven by a strong poleward E field (EMER ≈ 75 mV/m) and was underlined by a strong vertical downward (-) drift reaching ~1500 m/s in magnitude. In Figure 3b, the SAPS events of 5 October show the first appearance of rapid high-latitude SAPS flow and underlying poleward E field in their strongest forms (VHOR ≈ 2400 m/s and EMER ≈ 90 mV/m) and their respective weakening (from 1200 m/s and 45 mV/m to 1000 m/s and 30 mV/m) during the next 3 UT hours while the underlying vertical drift was upward and weak (VVER < 500 m/s).
Continuing with the 28 SAID events shown in Figure 3c, Figure 4 and Figure 5, the rapid high-latitude SAID flow appeared within the main trough as a latitudinally narrow (≤ 2o) fast westward ion drift (2800 m/s ≤ VHOR ≤ 5200 m/s) streaming sunward and driven by its underlying strong poleward E field (90 mV/m ≤ EMER ≤ 190 mV/m).
In some of the SAID events like in the first SAID event on 24 October shown in Figure 5b, the trough-in-the-trough feature appeared evidencing positive feedback mechanisms in progress [4,7] and mostly in the regime of ↓R2 current implying that the SAID flow observed was old and formed previously in a voltage generator setting. However, some examples of the newly-formed SAID flow are shown in Figure 4a with the 5 October event and in Figure 5a,b with the 21 and 29 October events. Then, the δBZ line plot’s nearly horizontal orientation (without any positive gradient) depicts no signature of ↓R2 current flowing into the SAID channel, of which magnetospheric conjugate component developed in a fast-time voltage generator specified by Mishin [20,23] as VGFT. Finally, the S plot shows that within both the enhanced high-latitude SAID channel and the duskside auroral zone, the earthward directed electromagnetic energy deposition (depicted by the Poynting flux) increased locally. Here, we also highlight some specific features shown by Figure 3, Figure 4 and Figure 5 (see details below).
For Figure 3c, showing the 6 rapid high-latitude SAID flows observed during 4 - 12 February 2013, we draw attention to the underlying vertical drift that was downward directed and was further investigated (see more details in section 3.4). We also note the third SAID event (marked as dot symbol in green) occurring on 5 February at 71.83 MLAT (i.e., > 70 MLAT) where the earthward Poynting flux locally increased to S ≈ 4.75 mW/m2 and at 16.43 MLT (i.e., < 18 MLT).
For Figure 4, showing the 10 rapid high-latitude SAID flows observed during 5 – 20 October 2013, we notice the underlying vertical drift that was mostly upward directed. We also note the 6 October event in Figure 4a. Then, the SAID flow (marked as dot symbol in green) reached VHOR = 4800 m/s because of the strong poleward E field (EMER = 170 mV/m) at 70.01 MLAT, where the earthward Poynting flux locally increased to S ≈ 9 mW/m2.
For Figure 5, showing the 12 rapid high-latitude SAID flows observed during 21 - 29 October 2013, we highlight the 21 October (in Figure 5a) and 29 October (in Figure 5b) SAID events (marked as dot symbols in light red and light gray). Then, the rapid high-latitude SAID flow was observed at 70.53 MLAT and 72.12 MLAT (i.e., > 70 MLAT) and at 17.22 MLT and 16.94 MLT (i.e., < 18 MLT) and reached VHOR ≈ 5000 m/s and VHOR ≈ 4600 m/s driven by their respective large poleward E fields of EMER ≈ 190 mV/m and EMER ≈ 170 mV/m. Meanwhile, their respective underlying earthward energy deposition measured by the Poynting flux commonly reached S ≈ 5.5 mW/m2. We also note the earlier 24 October SAID events (marked as dot symbol in purple). Then, the rapid high-latitude SAID flow and its underlying poleward E field reached VHOR ≈ 5400 m/s and EMER ≈ 185 mV/m at 70.41 MLAT (i.e., > 70 MLAT) and 19.94 MLT. Meanwhile, the earthward Poynting flux increased up to S ≈ 4.5 mW/m2 within the SAID channel and reached S ≈ 2.5 mW/m2 in the duskside oval.

3.4. Enhanced Downward Drifts Underlying the Rapid High-Latitude SAID Flows

Figure 6 is constructed for the 6 SAID events of February 2013. Then, the underlying cross-track vertical drift was downward directed and sometimes as strong as the rapid cross-track horizontal drifts (as shown in Figure 3c). Here, the line-plot sets are constructed with the F18 data of Ni, VVER, and EZON. As before, we marked the duskside auroral zone and the SAID flow.
Although the zonal E field (EZON) data coverage is not continuous at subauroral latitudes, as indicated by the data gaps at SAID latitudes (dot symbol in color, shaded interval in yellow) in Figure 6, this figure shows quite clearly the sudden increase of westward zonal E field (EZON < 0) within the SAID channel. By interacting with the geomagnetic B field, this westward EZON drove plasma poleward (via E×B drift) within the SAID channel along the highly inclined magnetic field lines. Therefore, this poleward E×B drift had a large downward (VVER < 0) component that was observed by F18. These EZON < 0 and VVER < 0 observations are in good agreement with the early study of Isaev et al. [56] reporting the abrupt increase of westward E field (i.e., EZON < 0) in the main trough causing the F region plasma E×B drifting downward (i.e., VVER < 0). Such localized downward E×B drift increase can enhance plasma depletion within the trough/SAID channel by increasing the recombination rates [57] and further increasing the SAID flow via positive feedback mechanisms (see details in section 1). This is demonstrated with two exceptional SAID events, when the cross-track drifts equaled in the SAID channel: on 4 February shown in Figure 4c and Figure 7a (VHOR ≈ 5400 m/s, VVER ≈ -5200 m/s, EZON ≈ -35 mV/m) and on 12 February shown in Figure 4c and Figure 7b (VHOR ≈ 3200 m/s, VVER ≈ -2400 m/s, EZON ≈ -25 mV/m).
Figure 7. (top panel) The maps show the locations of all the rapid high-latitude subauroral flows observed in 2013. (middle and bottom panels) The column charts depict their statistics.
Preprints 200472 g007

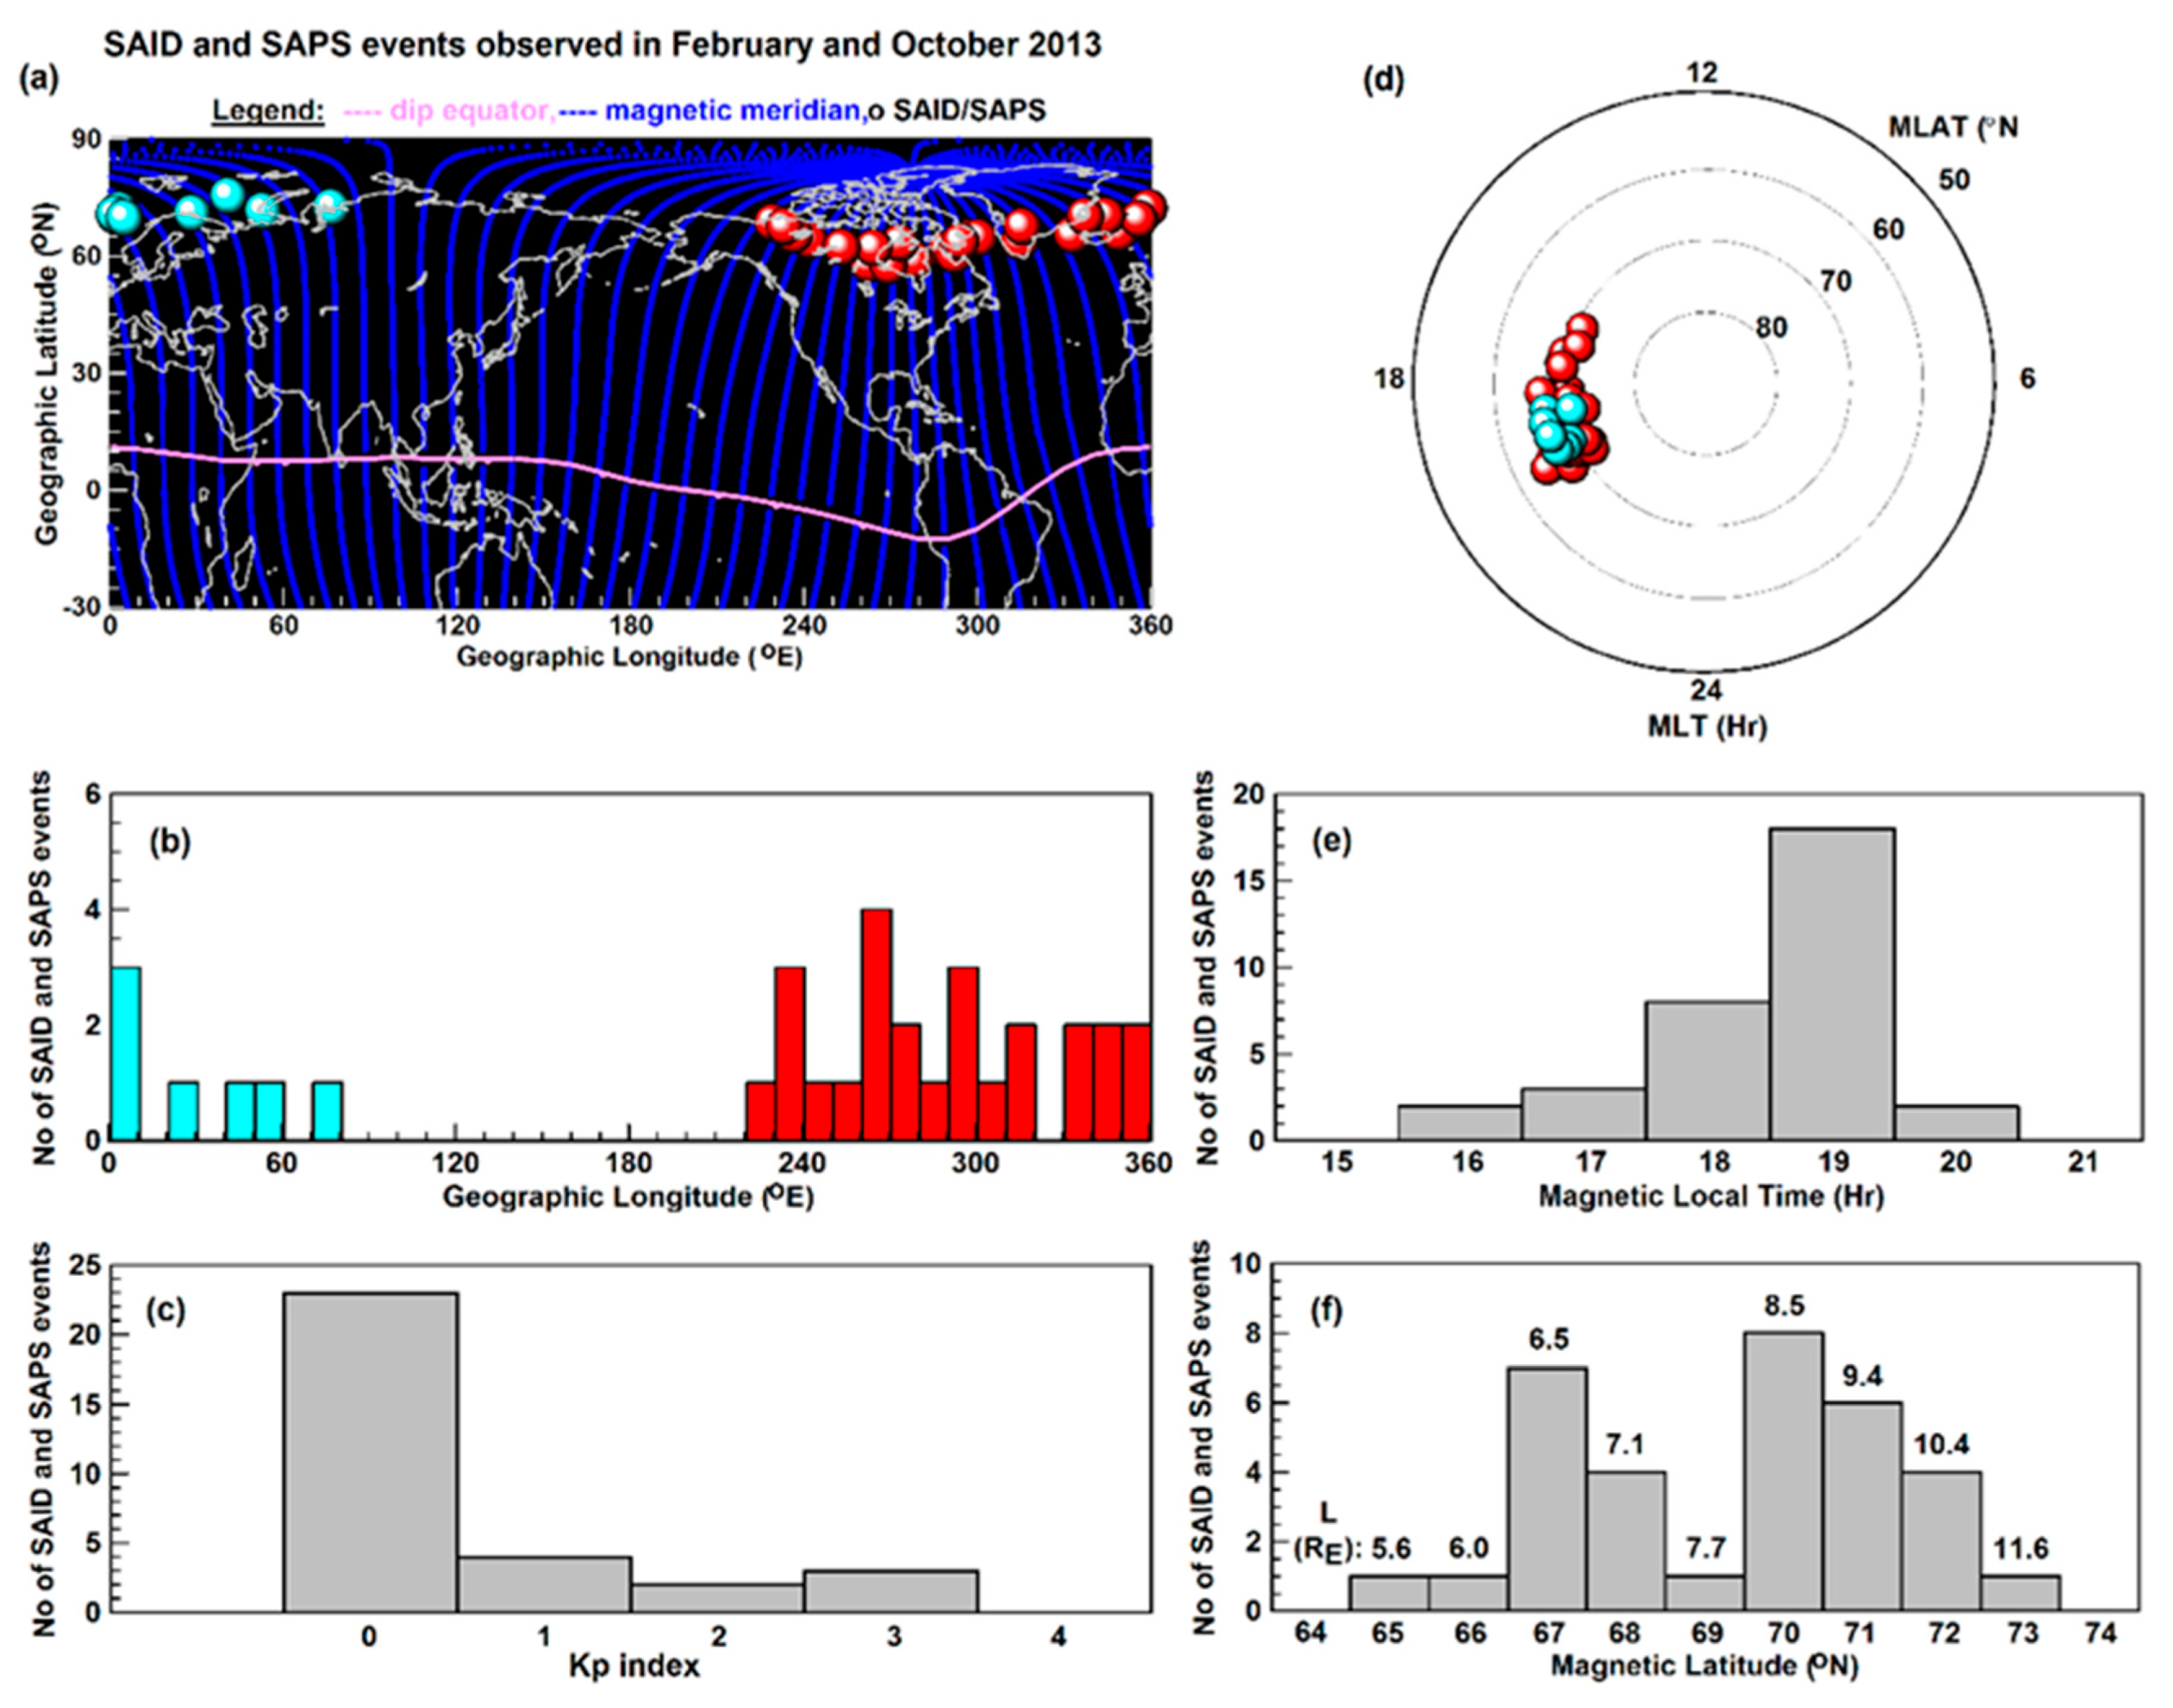
3.5. Statistical Results

Figure 7 shows the statistical details of the 33 rapid high-latitude SAPS/SAID flow events observed by F18. We investigated these events statistically in terms of location, time, and magnetic activity level by constructing column charts and plotting these variables against the number of events observed. Since most of these events are SAID events (28 out of 33), the statistical results are most characteristic of the 28 rapid high-latitude SAID flows observed.
In Figure 7a, the geographic map shows the 33 rapid high-latitude subauroral flow locations (marked as dot symbols in red in the American longitude sector and in cyan elsewhere). There is an apparent gap between the longitudes of 80oE and 220oE. Although F18 sampled all longitudes equally, the quality of measurements was not the same and sometimes poor-quality measurements resulted in large data gaps in this section. However, the good-quality measurements clearly indicated that the rapid high-latitude subauroral flows were absent in this section (see details in section 3.1). Therefore, the statistics of the rapid high-latitude subauroral flows investigated are quite realistic.
Statistically, Figure 7b shows that most of the high-latitude subauroral flow detections occurred in the (220-360)oE longitude sector, which is the northern magnetic pole’s larger longitude region. The rest of the detections were taken in the (0-80)oE longitude sector, with a maximum of 3 out of 33 events at 0oE. Consequently, there was no rapid high-latitude subauroral flow observed within (80-220)oE. In terms of the Kp index, Figure 7c shows statistically that most of these rapid high-latitude subauroral flows (23 out of 33 events) were observed under magnetically quiet conditions, when the Kp index was less than 1. Meanwhile, significantly less (4 out of 33) events occurred at Kp = 1 and at higher Kp such as at Kp = 2 (2 out of 33 events) and at Kp = 3 (3 out of 33 events).
In Figure 7d, the MLT vs MLAT polar map shows the 33 SAPS/SAID locations (dot symbols in cyan and red) appearing near 70 MLAT and in the dusk MLT sector: mostly on the nightside (> 18 MLT) and sometimes on the dayside (< 18 MLT).
Statistically and in terms of MLT, Figure 7e shows that most of the rapid high-latitude subauroral flows were observed (18 out of 33 events) at 19 MLT and significantly less (8 out of 33 events) at 18 MLT. Importantly, some of the observations were made on the dayside (< 18 MLT): 2 out of 33 events at 16 MLT and 3 out of 33 events at 17 MLT.
In terms of MLAT, Figure 7f shows that the rapid high-latitude subauroral flows appeared mostly (7 out of 33 events) at 67 MLAT and (8 out of 33 events) at 70 MLAT, and less frequently (4 out of 33 events) at 68 MLAT and 72 MLAT. Here, we indicated the L shell values, computed as L = 1/cos2(MLAT), for these magnetic latitudes. These illustrate that the majority of the rapid high-latitude subauroral flows (31 out of 33 events) were observed at MLAT > 67o and thus were located at L > 6.5 RE, up to 11.6 RE at 73 MLAT. Consequently, for the majority of the high-latitude subauroral flow events, the geosynchronous GOES satellites (orbiting at 6.6 RE) were not able to observe the reconnection/substorm-related particle injections since the GOES satellites orbited earthward of the plasmapause, and thus, within the plasmasphere. This is further demonstrated with two sets of magnetically conjugate observations covering the 29 October SAID event (shown in Figure 8) and the 14 October 2013 SAPS event (shown in Figure 9).

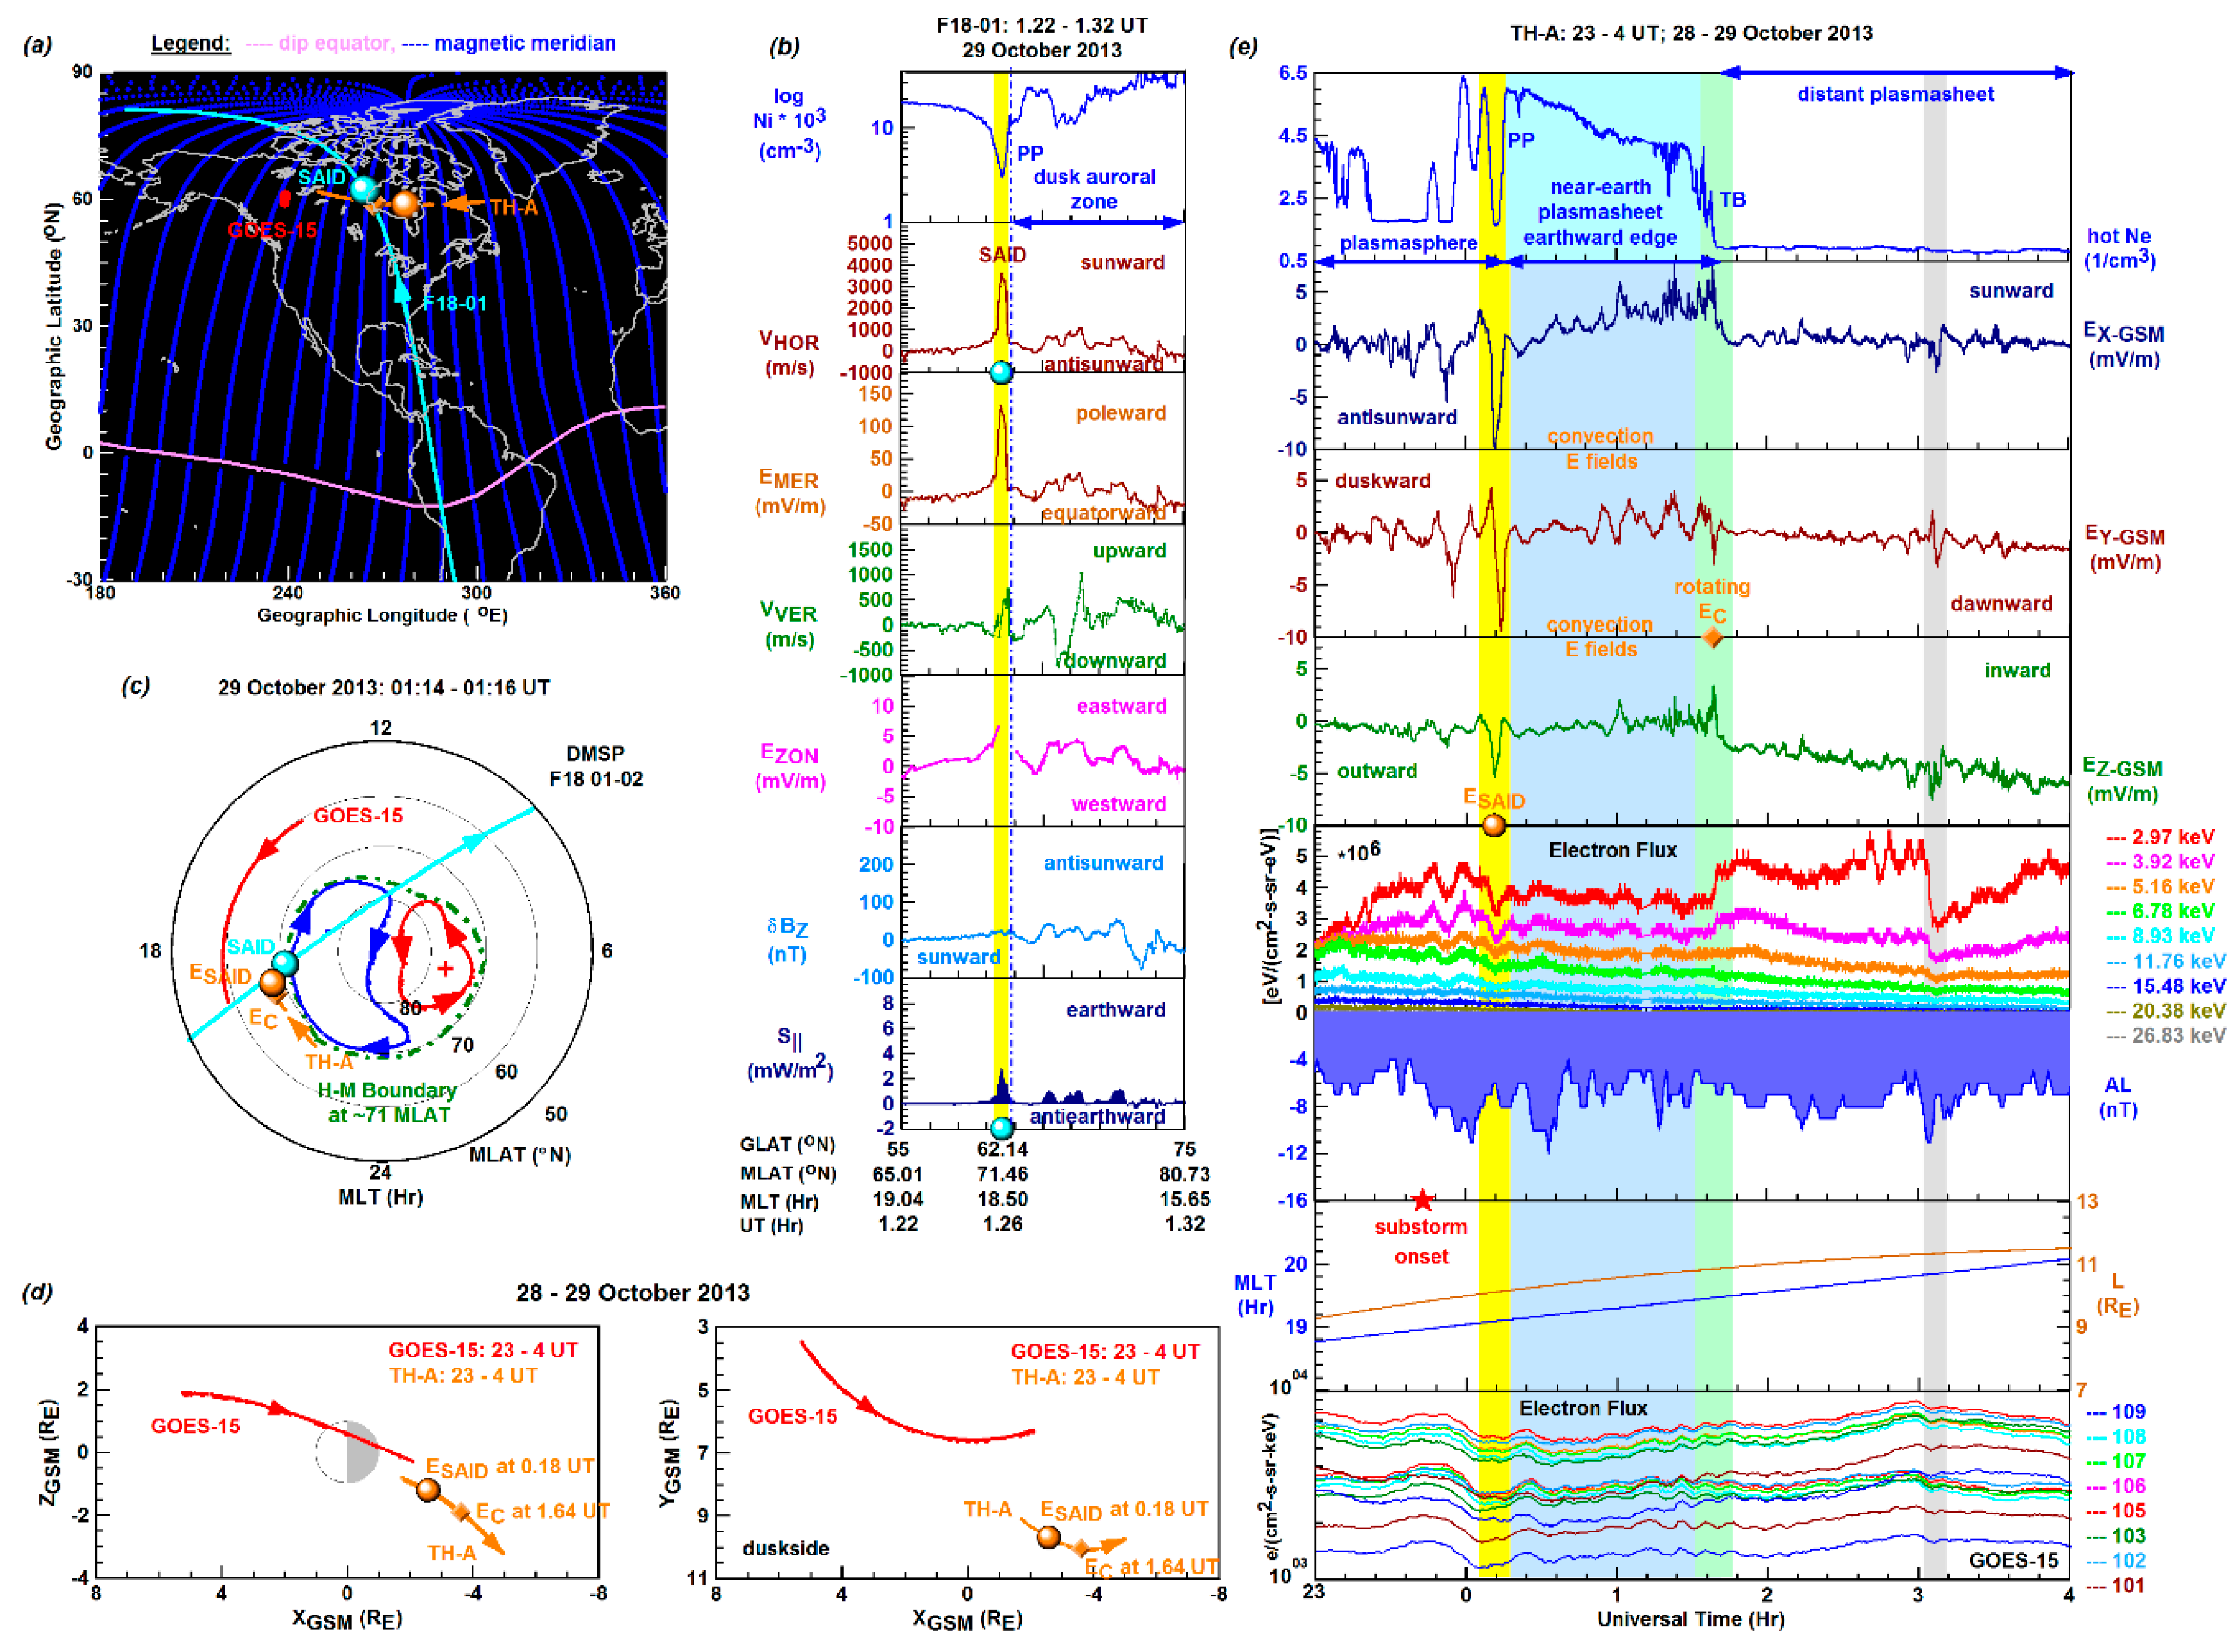
3.6. Conjugate Observations of the 29 October 2013 SAID Event

Figure 8 shows a set of correlated magnetically conjugate observations depicting the 29 October 2013 rapid high-latitude SAID event. These observations were made by F18 in the topside ionosphere at 1.26 UT and by TH-A in the inner magnetosphere at 0.18 UT. We note here that the location and the event observed by F18 are also shown in Figure 1e-f and in Figure 5b (with the second last line-plot set) respectively.
In Figure 8a, the geographical map covers a larger region of the North American longitude sector. We plotted the F18 pass (in cyan) tracking the rapid high-latitude SAID flow (dot symbol in cyan) and the TH-A footprints of interest (in orange), which crossed the F18 pass near the F18-observed SAID location. Along its way in the inner magnetosphere, TH-A observed the outward SAID E field (ESAID; dot symbol in orange) and the rotating convection E field (EC; symbol diamond in orange). At that time, the GOES-15 footprints of interest (in red) were located near and equatorward of both the high-latitude SAID flow and the TH-A footprints. This provides observational evidence that GOES-15 traveled on the earthward side of the plasmapause, within the plasmasphere, and therefore was not able to detect the particle injections occurring on the tailward side of the plasmapause observed by TH-A.
In Figure 8b, we show the DMSP F18 line plots of Ni, VHOR, EMER, VVER, EZON, δBZ, and S. These illustrate the rapid high-latitude SAID flow observed by F18 at 1.26 UT and 71.46 MLAT, and its underlying E field components and plasma environment. F18 observed the deep (Ni ≈ 3×103 cm-3) main trough along with the plasmapause (PP), depicted by the steep Ni gradient located on the trough’s poleward wall. Due to the absence of Te data, we cannot show the locally increased Te created by the locally increased downward heat flow generated by ring current energy dissipation and marking the PP location [58]. Within the main trough, the SAID flow was rapid (VHOR ≈ 3800 m/s) and appeared at high magnetic latitude (71.46 MLAT). In the newly-formed SAID channel (shaded interval in yellow), the underlying poleward-directed meridional E field was quite strong, developed in a voltage generator setting (δBZ ≈ 0), maximized at EMER ≈ 135 mV/m, and drove the westward drift (VHOR ≈ 3800 m/s). Furthermore, the upward drift locally increased to VVER ≈ 500 m/s because of the locally increased eastward zonal E field (EZON ≈ 7 mV/m) driving the plasma equatorward and upward along the steep magnetic field lines. This added to the typical upward drift developed due to the collisional heat produced by the drifting ions and co-rotating neutrals [4]. Meanwhile, the earthward electromagnetic energy deposition (measured by the Poynting flux) locally peaked within the SAID channel at S ≈ 3 mW/m2.
Figure 8c illustrates the MLT vs MLAT polar plots with the underlying two-cell polar convection. We sketched the dusk cell (in blue) and dawn cell (in red) based on the SuperDARN convection map [59] generated for the time-period of 01:14–01:16 UT, when F18 observed the rapid high-latitude SAID flow. Then, the polar convection was characterized by a dominating dusk cell (marked in blue) that crossed the magnetic midnight meridian and extended dawnward and by a smaller dawn cell (marked in red). We also indicated (in dark green) the Heppner-Maynard (H-M) boundary [60] located at ~71 MLAT and marking the low-latitude limit of the polar convection. This 71 MLAT is a modified location that was specified based on the F18 particle data. We made this modification by moving the SuperDARN-modeled H-M boundary location of 66 MLAT to 71 MLAT in order to obtain a scientifically correct presentation. There are inaccuracies associated with the SuperDARN estimated H-M boundary, which are due to the changing ionospheric propagation conditions [61]. We note here that all the convection maps generated for the 33 rapid high-latitude subauroral flows investigated are shown in Figures S1–S33 (see Supporting Information). We also mapped the F18 01-02 passes oriented in the nighttime-morning (22 – 10 MLT) direction and crossing the dusk cell on the dayside. Along its way, F18 tracked the rapid high-latitude SAID flow near the dusk convection cell at 18.5 MLT, on the nightside (> 18 MLT), and at 71.46 MLAT (i.e., > 70 MLAT). We also plotted the TH-A ground track of interest along with the foot points of the rotating inner-magnetosphere convection E field (EC) that mapped down to near the H-M Boundary and the inner-magnetosphere outward ESAID that mapped down to near the F18-observed topside-ionosphere SAID flow. We also plotted the GOES-15 footprints of interest (in red) that were located at ~60 MLAT and covered the 14 - 19 MLT sector. All these provide further observational evidence that the inner-magnetosphere outward ESAID (observed by TH-A) mapped down to the conjugate topside ionosphere as a poleward E field (i.e., EMER), near the F18-observed westward SAID flow. Thus, the outward ESAID (observed by TH-A) was the inner-magnetosphere driver of the rapid high-latitude SAID flow (observed by F18).
In Figure 8d, the X vs Z and X vs Y orbit plots (in GSM coordinates) show the orbit sections completed by TH-A (in orange) and GOES-15 (in red) during the 5-hour time interval of 23 – 4 UT on 28 – 29 October 2013. Then, TH-A travelled on the nightside, away from Earth, in the tailward direction, and below the magnetic equatorial plane and on the duskside. There, the positive directions are sunward, duskward, and inward (or earthward). Along its tailward journey, TH-A observed the antisunward/duskward/outward SAID E field components (EX, EY, EZ) earlier (at 0.18 UT) and the rotating convection E field (EC) later on (at 1.64 UT). Meanwhile, GOES-15 traveled closer to Earth, in the plasmasphere, from the dayside to the nightside and on the duskside.
Figure 8e illustrates the TH-A observations made under weak substorm conditions. We show the line plots of hot (up to 700 keV) electron density (Ne), E field components (EX, EY, EZ), electron flux measured at 9 different energy levels in the 2.97 - 26.83 keV range, AL index, TH-A orbit parameters (MLT and L) and electron flux measured by GOES-15 at 40 keV and 75 keV energy levels in 8 directions at each energy level.
To describe the main observations, we start with the Ne plot. As TH-A traveled on the duskside tailward, it observed first multiple Ne drop-offs that could be the signatures of the multiple plasmapause crossings TH-A made in the plasmasphere. Appearing as a broad Ne enhancement, TH-A observed the near-earth plasmasheet earthward edge (marked as shaded interval in cyan), which is a region of locally increased hot electron population, where the hot electrons are trapped (i.e., drift many times around the Earth [62]) and that is bounded by the main plasmapause (PP; shaded interval in yellow) at the earthward end and by the trapping boundary (TB; shaded interval in light green) at the tailward end separating the plasmasheet earthward edge from the distant plasmasheet [62,63,64].
On the main plasmapause (PP), TH-A observed the net outward SAID E field’s X and Z components: the antisunward (-) EX ≈ -10 mV and the outward (-) EZ ≈ -5 mV/m. Since the detection of Y component was made in the dusk sector, at ~19 MLT, TH-A observed its rotation from duskward (+) EY ≈ 4 mV/m) to dawnward (-) EY ≈ -10 mV/m at L≈10 RE. From such a large L shell, the strong net outward SAID E field mapped down along the main PP to the conjugate topside ionosphere (to ~68 MLAT, as shown in Figure 8b,c) as a poleward or meridional E field (EMER ≈ 130 mV/m; observed by DMSP F18) and drove the strong westward drift (VHOR ≈ 3800 m/s) streaming sunward along the dusk cell in the SAID channel (observed by F18).
On the trapping boundary (TB), TH-A observed the weak cross-tail convection E field’s rotating Y component (EY) from duskward (EY ≈ 3.5 mV/m) to dawnward (EY ≈ -3 mV/m) along with the sunward (EX ≈ 7 mV/m) and inward or earthward (EZ ≈ 5 mV/m) components. Since the plasmasheet earthward edge is located on auroral field lines, the trapping boundary/rotating EY coincides with the polar convection reversal. Accordingly, the mapped-down duskward EY drives the auroral sunward convection while the mapped-down dawnward EY drives polar antisunward convection [63].
Between the main plasmapause (PP) and the trapping boundary (TB), TH-A observed weak cross-tail convection E field variations. These convection E fields occurred within the plasmasheet earthward edge (shaded interval in light blue) and were located on auroral field lines [63,64], and their components were sunward (EX > 0), duskward (EY > 0) and inward or earthward (EZ > 0) directed. Their ionospheric conjugates drove the auroral sunward convection flows duskward and sunward.
Illustrated by the electron flux measurements of TH-A, the magnetotail-reconnection-related earthward dispersionless particle injections occurred not only tailward of the main PP (some of them are marked as shaded intervals in light gray and light green) but even earthward of the main PP because of the multiple plasmapause-crossings made by TH-A, when the AL index dipped during a series of substorms. Evidencing fast-time SAID development, occurring on a short timescale soon after substorm onset [20,23], the outward SAID E field was observed by TH-A during the substorm recovery phase at 0.18 UT as the substorm onset started at the end of the previous day (at 23.72 UT; marked as symbol star in red; see also Figure 2). TH-A made the SAID E field detection soon (half an UT hour) after the substorm onset. However, TH-A could not observe the charge separation (created by the hot electrons and ions and triggering ESAID development) because of its multiple PP crossings. Meanwhile, GOES-15 traveled (at 6.6 RE) on the duskside, but earthward of the main PP (located at ~10 RE). Therefore, the electron flux measurements made by GOES-15 within the plasmasphere show no signatures of dispersionless particle injections, only weak undulations. Possibly, a similar scenario occurred in the high-latitude SAID/STEVE event of 27 March 2023 reported by Gallardo-Lacourt et al. [30], when the enhanced high-latitude SAID flow developed at 69 MLAT (L ≈ 7.7 RE).

3.7. Conjugate Observations of the 14 October 2013 SAPS Event

Figure 9 is constructed the same way as Figure 8 and shows the 14 October 2013 high-latitude SAPS event with conjugate TH-A and F18 observations. This F18-observed SAPS event can also be viewed in Figure 1c,d and 3b. Because of the similarities between Figure 8 and Figure 9, we describe in detail only the new observations shown by Figure 9.
In Figure 9a, the geographic map illustrates the close locations of the F18-observed SAPS channel (square symbol in light blue) and the TH-A-observed outward SAPS E field (square symbol in orange) along with the GOES-13 ground track (in red) located just equatorward.
Figure 9b shows the moderate high-latitude SAPS flow (VHOR ≈ 900 m/s) observed by F18 at 70.28 MLAT and 2.64 UT within the deep main trough (Ni ≈ 4.1×103 cm-3) with the plasmapause (PP) located on its poleward wall, and the underlying poleward E field (EMER ≈ 30 mV/m) and weak upward drift (VVER ≈ 200 m/s). As shown by the oppositely directed ↓R2-↑R1 FACs, connected by the poleward directed Pedersen current, the SAPS flow was old. This is further illustrated with the weak earthward electromagnetic deposition (S ≈ 1.8 mW/m2) that implies weakening positive feedback mechanisms. Meanwhile, the small upward drift (VVER ≈ 100 m/s) suggests declining collisional heat produced by the drifting ions and co-rotating neutrals [4].
In Figure 9c, the MLT vs MLAT polar plot depicts the high-latitude SAPS flow (square symbol in light blue) location on the dayside at 17.49 MLT and just equatorward of the dusk cell of a two-cell polar convection operational during the F18 observation. Later on, TH-A observed the outward SAPS E field (ESAPS; square symbol in orange) that mapped down to the dusk cell’s equatorward edge on the nightside to 19.91 MLT. These F18 (< 18 MLT) and TH-A (> 18 MLT) observations imply a continuous SAPS flow channel of inner-magnetosphere origin that had been flowing along the dusk cell for a while. Meanwhile, the GOES-13 footprints (in red) were taken equatorward of the polar convection cells, at 64.4 MLAT, in a broader region of the magnetic midnight sector. Furthermore, the previous substorm onset (symbol star in red) occurred just before magnetic midnight (23:23 MLT), within the dusk cell, at 72 MLAT. This substorm onset is from the substorm list of Forsyth et al. [55].
In Figure 9d, the orbit plots show that the tailward traveling TH-A satellite observed the net outward SAPS E field’s outward (EZ < 0) and duskward (EY > 0) components below the equatorial plane and on the duskside. There, the positive directions are duskward and inward respectively. As GOES-13 orbited closer to Earth, near the equatorial plane, and from the duskside to the dawnside, it could not observe the substorm-related particle injections.
In Figure 9e, the TH-A line plots cover the 5-hour time period of 2 - 7 UT. These line plots are constructed with the data of spacecraft potential (SC Pot), SAPS E field components (EY and EZ; in GSM), electron and ion pressure tensors (PeXX and PiXX), electron flux in the 2.97 - 26.83 keV range and orbit parameters (MLT and L) along with the AE index, where the previous substorm onset is marked at 2.81 UT (symbol star in red) and the electron flux measured by GOES-13 at 275 keV and 475 keV channels in 9 directions.
Based on the SC Pot plot, we marked the plasmapause (PP; shaded interval in yellow) and the trapping boundary (TB; shaded interval in light green) and between them the near-earth plasmasheet earthward edge (shaded interval in cyan) along with the regions of plasmasphere and distant plasmasheet (see details in section 3.6). We show the TH-A-observed duskward (+) EY ≈ 6 mV/m and outward (-) EZ ≈ -10 mV/m) components of the net outward SAPS E field. These SAPS E field components were observed across the PP (at 3.36 UT; 9.85 RE; 19.91 MLT) along with the weak convection E field components developed within the near-earth plasmasheet earthward edge (see details in section 3.6). As shown by the electron and ion pressure sensors, the SAPS E field components (ESAPS; shaded interval in yellow) developed between the hot ion pressure gradient (see PiXX plot) associated with the R2 current and hot electron pressure gradient (see PeXX plot) associated with the R1 current. These imply that the outward net SAPS E field developed between the charge separation created by the hot ions (located earthward of the PP) and hot electrons (located near the PP). Meanwhile, the TH-A-measured electron flux illustrates the substorm-related dispersionless particle injections occurring on the tailward side of the PP that were not observed by GOES-13 since GOES-13 was traveling on the earthward side of the PP, within the plasmapause.

4. Summary of Results

In this study, we further explored the unusual phenomenon of rapid high-latitude subauroral flow, first reported by Gallardo-Lacourt et al. [43], by conducting a large-scale investigation. It was based on 33 events observed by DMSP F18 in the topside ionosphere during the high-sunspot-number calendar year of 2013 and on two magnetically conjugate events observed by TH-A in the inner magnetosphere.
This study’s topside-ionosphere results show that F18 observed the rapid subauroral flows investigated at unusually high northern magnetic latitudes (near and ≥ 68 MLAT) in the dusk MLT sector (sometimes on the dayside at < 18 MLT) under geomagnetically quiet conditions and weak substorms. These 33 events included 5 SAPS events and 28 SAID events that allowed us to conduct statistical investigations. These documented their preferred development mostly under magnetically quiet (Kp = 0) conditions, and during 18 - 19 MLT at 67 MLAT (6.5 RE) and at 70 - 72 MLAT (8.5 - 10.4 RE). With the individual multi-instrument F18 observations, we demonstrated the SAPS/SAID flows’ overall common features including:
(i) the underlying strong poleward E field: 90 -190 mV/m,
(ii) the underlying strong zonal E field (max|EZON|≈ 50 mV/m)
(iii) the associated deep subauroral main trough (min Ni ≈ 0.4 × 103 cm-3),
(iv) the trough-in-the-trough plasma density feature implying positive feedback
mechanisms in progress,
(v) the presence or absence of ↓R2 current implying previous or recent SAPS/SAID
development in a voltage generator setting,
(vi) the locally increased earthward electromagnetic energy deposition, measured by the Poynting flux (S ≤ 12 mV/m), implying the generation of electromagnetic energy in the conjugate inner-magnetosphere voltage generator,
(vii) the subsequent downward/earthward channeling of electromagnetic energy along the plasmapause into the SAPS/SAID flow channel.
This study’s inner-magnetosphere results present two sets of magnetically conjugate observations demonstrating the fast-time development of high-latitude SAPS on 14 October 2013 (see Figure 9e) and high-latitude SAID on 29 October 2013 (see Figure 8e).
By invoking the fast-time SAPS development theory put forward by Mishin [23] and Mishin et al. [22], the inner-magnetosphere outward SAPS E field (a) is an integral part of the substorm current wedge 2-loop (SCW2L) system created by the tailward R1 loop and earthward R2 loop, and (b) develops in a magnetospheric voltage generator (VGM). Figure 9e shows that TH-A observed the duskward and outward ESAPS field components (of the net SAPS E field) between the pressure gradients of hot ions (depicted by the PiXX plot) associated with the ↓R2 current loop located earthward of the PP and of hot electrons (depicted by the PeXX plot) associated with the ↑R1 current located at the PP at L ≈ 9.85 RE. These pressure gradients separated hot ions and electrons near the PP, created the charge separation wherein the net outward ESAPS developed. This is also where the magnetospheric voltage generator became generated. From such a high shell (L ≈ 9.85 RE), the net outward SAPS E field mapped down along the PP to the high-latitude subauroral ionosphere as a poleward E field that drove the westward SAPS flow observed by F18 (shown in Figure 9a–c).
By invoking the short-circuiting theory first put forward by Mishin & Puhl-Quinn [65] and further developed by Mishin [20,23], the inner-magnetosphere outward SAID E field (a) is an integral part of the short-circuiting loop set up during magnetotail reconnection/substorm-related earthward plasma injections, and (b) develops in a inner-magnetosphere fast-time voltage generator (VGFT). As shown in Figure 8e with the dispersionless particle injections, when the mesoscale plasma flows (MPFs) [66] are strong enough to pass through the plasmasheet earthward edge (marked in cyan) and to reach the plasmapause (marked as PP), then the outward (or tailward) SAID E field (marked as shaded interval in yellow) develops at the plasmapause. This is due to the charge separation created by the MPFs-related hot electrons that become stopped at the PP and by the MPFs-related hot ions that keep traveling earthward. Between the charge separation, the inner-magnetosphere fast-time voltage generator (VGFT) develops, where the mixture of hot ions and cold electrons provide resistivity [20,23]. We could not provide observational evidence of the short-circuiting-related charge separation because of the TH-A orbit’s east-west alignment. But we could illustrate other MPFs-related processes observed by TH-A (as shown in Figure 8e) such as the earthward directed dispersionless particle injections/MPFs thar were generated during a series of dipolarization events and were unfolding during a series of substorms (shown by the electron flux line plots and AL index). Furthermore, TH-A also observed the signature of stopped hot electrons at the PP. This is shown by the line plot of hot Ni depicting both the dispersionless nature of hot electron cutoff and the steep gradient of the main plasmapause, where the net outward SAID E field developed. TH-A observed its three E field components. All these TH-A observations provide evidence that the strong net outward SAID E field mapped down from L ≈ 10 RE to an unusually high magnetic latitude as a strong poleward E field that drove the rapid westward plasma flow (streaming sunward) as was observed by F18 (shown in Figure 8a–c).

5. Discussion

Our study is particularly relevant to the recent study of Gallardo-Lacourt et al. [43] reporting an unusual SAID-STEVE event observed on 27 March 2023 at high magnetic latitude, 68 MLAT, which is ~10o higher than the locations of SAID-STEVE events investigated by previous studies including the statistical study of Svaldi et al. [44].
Based on our findings and recently published results by other authors (cited below) and due to our improved understanding, we can both explain some of the high-latitude SAID features reported by Gallardo-Lacourt et al. [43] and answer some of the questions they put forward.
We start with the high-latitude SAID observation made by the Swarm-A satellite, as shown in Figure 2 of Gallardo-Lacourt et al. [43]. As also shown in our Figure 3, Figure 4 and Figure 5, the connection of ↓R2-↑R1 FACs on the SAID channel’s poleward side implies the deposition site of earthward flowing Poynting flux [15], generated in the VGFT [67], which possibly created a novel mode of energy transfer associated with the STEVE arc [16]. Consequently, this provides observational evidence of the high-latitude SAID flow’s fast-time development in a voltage generator setting by short-circuiting [20,23]. Furthermore, the trough-in-the-trough plasma density feature shown by the Ne plot (in Figure 2 of Gallardo-Lacourt et al. (2024) provides observational evidence of the positive feedback mechanisms operational [6,7] that are essential to the generation of SAID-linked subauroral arcs [67].
Regarding the absence of particle injections recorded during the high-latitude SAID-STEVE event observed on 27 March 2023 at 69 MLAT (L ≈ 7.7 RE) was due to GOES traveling in the plasmasphere (i.e., on the earthward side of the plasmapause) at ~6.6 RE. There, as also shown in our Figure 8, GOES could not observe the earthward particle injections associated with the fast-time development of inner-magnetosphere SAID E field. Based on the auroral SuperMAG AL (SML) index [68], Gallardo-Lacourt et al. [43] concluded the absence of underlying substorm activity. It was correctly indicated by the SML index derived from a large number of ground-based magnetometer stations [68]. But Gallardo-Lacourt et al. [43] could not explain the high-latitude SAID flow’s fast-time development in the absence of underlying substorm activity. However, according to the study of Mishin [23], SAID can develop after pseudobreakup when the earthward plasma injections (i.e., MPFs) are strong enough to reach the plasmapause and to trigger SAID development via short-circuiting, but not strong enough to trigger substorm development [23,69]. Consequently, the 27 March 2023 high-latitude SAID-STEVE event possibly occurred during a pseudobreakup.

6. Conclusions

From the observational results (listed as i-vii in section 4) we draw the following conclusions for the 33 rapid high-latitude SAPS/SAID flows investigated in this study. During the SAPS and SAID events investigated, the MPFs were strong enough both (a) to reach the steep and well-defined plasmapause at large L shells (8.5 - 10.4 RE) and (b) to trigger the emergence of ↓R2 current loop. These (a-b) triggered the respective fast-time development of a large SAID E field in an inner-magnetosphere VGFT generator and a large SAPS E field in a VGM. From such large L shells, these large net outward SAID and SAPS E fields mapped down to unusually high magnetic latitudes (68 - 72 MLAT) on the dusk side (16 - 20 MLT), where the main trough was deep, and consequently drove unusually strong westward SAID and SAPS flows streaming sunward.
Thus, the root cause of the unusually strong topside-ionosphere high-latitude SAID and SAPS flows observed by F18 in 2013 was their respective large outward inner-magnetosphere SAID and SAPS E fields developed at high L shells. In the topside ionosphere, the deep main trough and the positive feedback mechanisms created favorable conditions for the maintenance of the rapid high-latitude subauroral flows observed by F18 during the events investigated.

Supplementary Materials

The following supporting information can be downloaded at the website of this paper posted on Preprints.org. Applicable: Supporting Information.pdf

Author Contributions

Conceptualization, I.H..; methodology, I.H.; software, I.H. and B.C.L.; validation, I.H. and B.C.L.; formal analysis, I.H.; investigation, I.H..; resources, B.C.L.; data curation, I.H.; writing—original draft preparation, I.H..; writing—review and editing, B.C.L. and I.H.; visualization, I.H..; supervision, B.C.L.; project administration, B.C.L.; funding acquisition, B.C.L. All authors have read and agreed to the published version of the manuscript.

Funding

This research was funded by the United States Office of Naval Research under award number N62909-23-1-2057.

Institutional Review Board Statement

Not applicable.

Informed Consent Statement

Not applicable.

Data Availability Statement

The DMSP data set can be accessed online through https://cedar.openmadrigal.org/list (accessed on 4 Aug 2025). The SuperDARN convection maps can be accessed online: https://superdarn.ca/convection-maps (accessed on 27 September 2025). The THEMIS and GOES data sets can be accessed online through https://cdaweb.gsfc.nasa.gov/cdaweb/istp_public/ (accessed on 15 May 2025). The Kp, AE and SYM-H indices and the IEF EY and IMF BY and BZ components can be accessed online from the OMNI database: through https://cdaweb.gsfc.nasa.gov/cdaweb/istp_public/ (accessed on 7 August 2025). The SuperMAG provided various types of substorm lists can be accessed online from the SuperMAG substorm lists through https://supermag.jhuapl.edu/substorms/ (accessed on 20 September 2025)

Acknowledgments

We gratefully acknowledge that this material is based upon research supported by the United States Office of Naval Research under award number N62909-23-1-2057. We acknowledge the CEDAR Archival Madrigal Database for the DMSP data. The DMSP particle detectors were designed by Dave Hardy of Air Force Research Laboratory (AFRL). We also gratefully acknowledge the THEMIS and GOES data. We acknowledge the World Data Center for Geomagnetism at Kyoto (http://wdc.kugi.kyoto-u.ac.jp/wdc/Sec3.html) for providing the Kp AE indices and the use of SuperDARN convection maps. SuperDARN is a collection of radars funded by national scientific funding agencies of Australia, Canada, China, France, Italy, Japan, Norway, South Africa, United Kingdom and the United States of America. We also acknowledge the SuperMAG provided various types of substorm lists determined from SML index

Conflicts of Interest

The authors declare no conflicts of interest.

Abbreviations

The following abbreviations are used in this article:
B field Magnetic field
DMSP Defense Meteorological Satellite Program
E field Electric field
EC Convection Electric field
EMER Meridional Electric field
EZON Zonal Electric field
ESAID Sub-Auroral Ion Drift Electric field
EFI Electric Field Instrument
ESA Electrostatic Analyzer
FACs Field-Aligned Currents
GLAT Geographic Latitude
GLON Geographic Longitude
GOES Geostationary Operational Environmental Satellites
GSM Geocentric Solar Magnetospheric
H-M Heppner-Maynard
L L shell
MIT Main Ionospheric Trough
MLAT Magnetic Latitude
MLT Magnetic Local Time
Ne electron density
Ni Ion density
PJ Polarization Jet
PP Plasmapause
R1 Region 1
R2 Region 2
SAID Sub-Auroral Ion Drifts
SAPS Sub-Auroral Polarization Streams
SAR Stable Auroral Red
SML SuperMAG AL
SuperDARN Super Dual Auroral Radar Network
STEVE Strong Thermal Emission Velocity Enhancement
THEMIS Time History of Events and Macroscale Interactions during Substorms
TB Trapping Boundary
VG Voltage Generator
VGFT Fast-Time Voltage Generator
VGM Magntospheric Voltage Generator
VHOR cross-track horizontal drift velocity
VVER cross-track vertical drift velocity

References

  1. Muldrew, D.B. F layer ionization troughs deduced from Alouette data. Journal of Geophysical Research 1965, 70(11)(2), 635–2,650. [Google Scholar] [CrossRef]
  2. Rycroft, M J.; Thomas, J.O. The magnetospheric plasmapause and the electron density trough at the Alouette I orbit. Planetary and Space Science 1970, 18(1), 65–80. [Google Scholar] [CrossRef]
  3. Moffett, R. J.; Quegan, S. The mid-latitude trough in electron concentration of the ionospheric F layer: A review of observations and modeling. Journal of Atmospheric and Terrestrial Physics 1983, 45(5), 315–343. [Google Scholar] [CrossRef]
  4. Anderson, P.C.; Heelis, R.A.; Hanson, W.B. The ionospheric signatures of rapid subauroral ion drifts. Journal of Geophysical Research 1991, 96(A4)(5), 785–5,792. [Google Scholar] [CrossRef]
  5. Spiro, R.W.; Heelis, R.A.; Hanson, W.B. Rapid subauroral drifts observed by Atmosphere Explorer C. Geophysical Research Letter 1979, 6(8), 657–660. [Google Scholar] [CrossRef]
  6. Anderson, P.C.; Hanson, W.B.; Heelis, R.A.; Craven, J.D.; Baker, D.N.; Frank, L.A. A proposed production model of rapid subauroral ion drifts and their relationship to substorm evolution. Journal of Geophysical Research 1993, 98(92)(6), 069–6,078. [Google Scholar] [CrossRef]
  7. Anderson, P. C.; Carpenter, D.L.; Tsuruda, K.; Mukai, T.; Rich, F.J. Multisatellite observations of rapid subauroral ion drifts (SAID). Journal of Geophysical Research 2001, 106(A12), 29585–29600. [Google Scholar] [CrossRef]
  8. Galperin, Yu.L.; Ponomarev, V. N.; Zosimova, A.G. Plasma convection in the polar ionosphere. Annales de Geophysique 1974, 30(1), 1–7. [Google Scholar]
  9. Yeh, H.C.; Foster, J.C.; Rich, F.J.; Swider, W. Storm time electric field penetration observed at mid-latitude. Journal of Geophysical Research 1991, 96(A4), 5707–5721. [Google Scholar] [CrossRef]
  10. Foster, J.; Burke, W. A new categorization for sub-auroral electric fields. Eos. Transactions of the American Geophysical Union 2002, 83(36), 393–394. [Google Scholar] [CrossRef]
  11. Karlsson, T.; Marklund, G.T.; Blomberg, L.G.; Mälkki, A. Subauroral electric fields observed by the Freja satellite: A statistical study. Journal of Geophysical Research 1998, 103(A3), 4327–4314. [Google Scholar] [CrossRef]
  12. Foster, J.; Vo, H. Average characteristics and activity dependence of the subauroral polarization stream. Journal of Geophysical Research 2002, 107((A12).), SIA 16-1-SIA 16-10. [Google Scholar] [CrossRef]
  13. Figueiredo, S.; Karlsson, E.; Marklund, G. Investigation of subauroral ion drifts and related field-aligned currents and ionospheric Pedersen conductivity distribution. Annales Geophysicae 2004, 22(3), 923–934. [Google Scholar] [CrossRef]
  14. He, F.; Zhang, X.-X.; Wang, W.; Liu, L.; Ren, Z.-P.; Yue, X.; Hu, L.; Wan, W.; Wang, H. Largescale structure of subauroral polarization streams during the main phase of a severe geomagnetic storm. Journal of Geophysical Research: Space Physics 2018, 123(4), 2964–2973. [Google Scholar] [CrossRef]
  15. Liu, J.; Lyons, L.R.; Knipp, D.; Zhang, Q.; Wang, C.; Shen, Y.; Angelopoulos, V.; Ma, Y.; Tian, S.; Artemyev, A.; Qian, C.; Liang, J.; Wang, H.; Zou, Y. Poynting flux input to the auroral ionosphere: The impact of subauroral polarization streams and dawnside auroral polarization streams. Journal of Geophysical Research: Space Physics 2024, 129(5), e2024JA032605. [Google Scholar] [CrossRef]
  16. Kunduri, B.; Baker, J.; Ruohoniemi, J.M.; Bailey, S.M.; Gallardo-Lacourt, B. An examination of magnetosphere-ionosphere-thermosphere coupling during STEVE. AGU Fall Meeting 2022, held in Chicago, IL, 12-16 December 2022; pp. id. SA35B–07 December 2022. Available online: https://ui.adsabs.harvard.edu/abs/2022AGUFMSA35B..07K/abstract.
  17. Filippov, V.M.; Shestakova, L.V.; Galperin, Y.I. The band of rapid ion drift at subauroral F-region and its manifestation in high-latitude ionosphere structure. Cosmic Research 1984, 22, 557–564. [Google Scholar]
  18. Stepanov, A.E.; Gololobov, A.Y.; Khalipov, V.L.; Golikov, I.A. Ion upward flows in the subauroral polarisation jet. In Physics of auroral phenomena, proc. XLI annual seminar; Apatity, 2018; pp. 118–121. [Google Scholar] [CrossRef]
  19. Southwood, D.; Wolf, R. An assessment of the role of precipitation in magnetospheric convection. Journal of Geophysical Research 1978, 83(A11)(5), 227–5,232. [Google Scholar] [CrossRef]
  20. Mishin, E.V. Interaction of substorm injections with the subauroral geospace: 1. Multispacecraft observations of SAID. Journal of Geophysical Research: Space Physics 2013, 118(9)(5), 782–5,796. [Google Scholar] [CrossRef]
  21. Mishin, E.V. SAPS onset timing during substorms and the westward traveling surge. Geophysical Research Letters 2016, 43(13)(6), 687–6,693. [Google Scholar] [CrossRef]
  22. Mishin, E.; Nishimura, Y.; Foster, J. SAPS/SAID revisited: A causal relation to the substorm current wedge. Journal of Geophysical Research: Space Physics 2017, 122(8)(8), 516–8,535. [Google Scholar] [CrossRef]
  23. Mishin, E.V. The evolving paradigm of the subauroral geospace. Frontiers in Astronomy and Space Sciences 2023, 10, 1118758. [Google Scholar] [CrossRef]
  24. Mishin, E.V; Streltsov, A.V. Subauroral geospace, nonlinear wave and plasma structures in the auroral and subauroral geospacer; Elsevier (S&T), 2022; pp. 481–610. [Google Scholar] [CrossRef]
  25. Fukui, K.; Miyashita, Y.; Machida, S.; Miyoshi, Y.; Ieda, A.; Nishimura, Y.; Angelopoulos, V. A statistical study of near-Earth magnetotail evolution during pseudosubstorms and substorms with THEMIS data. Journal of Geophysical Research: Space Physics 2020, 125(1), e2019JA026642. [Google Scholar] [CrossRef]
  26. Streltsov, A.V.; Mishin, E.V. Ultralow frequency electrodynamics of magnetosphere-ionosphere interactions near the plasmapause during substorms. Journal of Geophysical Research: Space Physics 2018, 123(9), 7441–7451. [Google Scholar] [CrossRef]
  27. MacDonald, E.A.; Donovan, E.; Nishimura, Y.; Case, N.A.; Gillies, D.M.; Gallardo-Lacourt, B.; Archer, W.E.; Spanswick, E.L.; Bourassa, N.; Connors, M.; Heavner, M.; Jackel, B.; Kosar, B.; Knudsen, D.J.; Ratzlaff, C.; Schofield, I. New science in plain sight: Citizen scientists lead to the discovery of optical structure in the upper atmosphere. Science Advances 2018, 4(3), eaaq0030. [Google Scholar] [CrossRef] [PubMed]
  28. Gillies, D.M.; Donovan, E.; Hampton, D.; Liang, J.; Connors, M.; Nishimura, Y.; Gallardo-Lacourt, B.; Spanswick, E. First observations from the TREx spectrograph: The optical spectrum of STEVE and the picket fence phenomena. Geophysical Research Letters 2019, 46(13), 7207–7213. [Google Scholar] [CrossRef]
  29. Bailey, M.; Byrne, C.; Nezic, R.; Asher, D.; Finnegan, J. Historical observations of STEVE. The Observatory 2018, 138(1266), 227–245. [Google Scholar] [CrossRef]
  30. Gallardo-Lacourt, B.; Nishimura, Y.; Donovan, E.; Gillies, D.M.; Perry, G.W.; Archer, W.E.; Nava, O.A.; Spanswick, E.L. A statistical analysis of STEVE. Journal of Geophysical Research: Space Physics 2018, 123(11), 9893–9905. [Google Scholar] [CrossRef]
  31. Gallardo-Lacourt, B.; Perry, G.W.; Archer, W.E.; Donovan, E. How did we miss this? An upper atmospheric discovery named STEVE. Eos 2019, 100. [Google Scholar] [CrossRef]
  32. Nishimura, Y.; Dyer, A.; Kangas, L.; Donovan, E.; Angelopoulos, V. Unsolved problems in strong thermal emission velocity enhancement (STEVE) and the picket fence. Frontiers in Astronomy and Space Sciences 2023, 10, 1087974. [Google Scholar] [CrossRef]
  33. Barbier, D. Research on the 6300 Line of Atmospheric Luminescence Nocturne. Annals of Geophysics 1959, 15(2), 179–217. [Google Scholar]
  34. Kozyra, J.U.; Nagy, A.F.; Slater, D.W. High-altitude energy source(s) for stable auroral red arcs. Reviews of Geophysics 1997, 35(2), 155–190. [Google Scholar] [CrossRef]
  35. Martinis, C.; Griffin, I.; Gallardo-Lacourt, B.; Wroten, J.; Nishimura, Y.; Baumgardner, J.; Knudsen, D.J. Rainbow of the night: First direct observation of a SAR arc evolving into STEVE. Geophysical Research Letters 2022, 49(11), e2022GL098511. [Google Scholar] [CrossRef]
  36. Parnikova, S.G.; Ievenkoa, I.B.; Koltovskoia, I.I. Subauroral Luminosity STEVE over Yakutia during a Substorm: Analysis of the Event of March 1, 2017. Geomagnetism and Aeronomy 2022, 62(4), 434–443. [Google Scholar] [CrossRef]
  37. Mishin, E.V.; Streltsov, A.V. Toward the unified theory of SAID-linked subauroral arcs. Journal of Geophysical Research: Space Physics 2024, 129(1), e2023JA032196. [Google Scholar] [CrossRef]
  38. He, F.; Zhang, X.-X.; Chen, B. Solar cycle, seasonal, and diurnal variations of subauroral ion drifts: Statistical results. Journal of Geophysical Research: Space Physics 2014, 119(6), 5076–5086. [Google Scholar] [CrossRef]
  39. Laakso, H.; Pfaff, R. Fast plasma drifts in the high latitude ionosphere. Geophysical Research Letters 2023, 50(14), e2023GL103566. [Google Scholar] [CrossRef]
  40. Erickson, P.J.; Beroz, F.; Miskin, M.Z. Statistical characterization of the American sector subauroral polarization stream using incoherent scatter radar. Journal of Geophysical Research 2011, 116(A5), A00J21. [Google Scholar] [CrossRef]
  41. Kunduri, B.S.R.; Baker, J.B.H.; Ruohoniemi, J.M.; Thomas, E.G.; Shepherd, S.G.; Sterne, K.T. Statistical characterization of the large-scale structure of the subauroral polarization stream. Journal of Geophysical Research: Space Physics 2017, 122(6), 6035–6048. [Google Scholar] [CrossRef]
  42. Landry, R.G.; Anderson, P.C. An auroral boundary-oriented model of subauroral polarization streams (SAPS). Journal of Geophysical Research: Space Physics 2018, 123(4), 3154–3169. [Google Scholar] [CrossRef]
  43. Gallardo-Lacourt, B.; Nishimura, Y.; Kepko, L.; Spanswick, E.L.; Gillies, D.M.; Knudsen, D.J.; Burchill, J. K.; Skone, S. H.; Pinto, V.A.; Chaddock, D.; Kuzub, J.; Donovan, E.F. Unexpected STEVE observations at high latitude during quiet geomagnetic conditions. Geophysical Research Letters 2024, 51(19), e2024GL110568. [Google Scholar] [CrossRef]
  44. Svaldi, V.; Matsuo, T.; Kilcommons, L.; Gallardo-Lacourt, B. High-latitude ionospheric electrodynamics during STEVE and non-STEVE substorm events. Journal of Geophysical Research: Space Physics 2023, 128(4), e2022JA030277. [Google Scholar] [CrossRef]
  45. Rich, F.J.; Hairston, M. Large-scale convection patterns observed by DMSP. Journal of Geophysical Research 1994, 99(A3)(3), 827–3,844. [Google Scholar] [CrossRef]
  46. Hairston, M. Madrigal SSIES-2 manual. 2018. Available online: https://cdaweb.gsfc.nasa.gov/pub/data.
  47. Huang, C.Y.; Burke, W.J. Transient sheets of field-aligned current observed by DMSP during the main phase of a magnetic superstorm. Journal of Geophysical Research 2004, 109(A6), A06303. [Google Scholar] [CrossRef]
  48. Huang, C.Y.; Su, Y.; Sutton, E.K.; Weimer, D.R.; Davidson, R.L. Energy coupling during the August 2011 magnetic storm. Journal of Geophysical Research: Space Physics 2014, 119(2), 1219–1232. [Google Scholar] [CrossRef]
  49. Kilcommons, L.M.; Knipp, D.J.; Hairston, M.; Coley, W.R. DMSP Poynting flux: Data processing and inter-spacecraft comparisons. Journal of Geophysical Research: Space Physics 2022, 127(8), e2022JA030299. [Google Scholar] [CrossRef] [PubMed]
  50. The THEMIS Mission; Burch, J.L., Angelopoulos, V., Eds.; Science+Business Media: New York; BV, 2009. [Google Scholar] [CrossRef]
  51. McFadden, J. P.; Carlson, C. W.; Larson, D.; Bonnell, J.; Mozer, F.; Angelopoulos, V.; Glassmeier, K.-H.; Auster, U. THEMIS ESA First Science Results and Performance Issues. In The THEMIS Mission; Burch, J.L., Angelopoulos, V., Eds.; Springer: New York, NY. [CrossRef]
  52. Bonnell, J.W.; Mozer, F.S.; Delory, G.T.; Hull, A.J.; Ergun, R.E.; Cully, C.M.; Angelopoulos, V.; Harvey, P.R. The Electric Field Instrument (EFI) for THEMIS. Space Science Reviews 2008, 141, 303–341. [Google Scholar] [CrossRef]
  53. Grubb, R.N. The SMS/GOES space environment monitor subsystem. NOAA technical memorandum ERL SEL 1975, 42, Space Environment Laboratory, Boulder Colorado. Available online: https://repository.library.noaa.gov/view/noaa/18586/noaa_18586_DS1.pdf.
  54. Newell, P.T.; Gjerloev, J.W. Evaluation of SuperMAG auroral electrojet indices as indicators of substorms and auroral power. Journal of Geophysical Research 2011, 116(A12), A12211. [Google Scholar] [CrossRef]
  55. Forsyth, C.; Rae, I.J.; Coxon, J.C.; Freeman, M.P.; Jackman, C.M.; Gjerloev, J.; Fazakerley, A.N. A new technique for determining substorm onsets and phases from indices of the Electrojet (SOPHIE). Journal of Geophysical Research: Space Physics 2015, 120(12)(10), 592–10,606. [Google Scholar] [CrossRef]
  56. Isaev, N.V.; Gdalevich, G.L.; Benkova, N.P.; Gubsky, V.; Trushkina, E.P.; Kozlov, E.F.; Samorokin, N. I.; Stanev, G.; Teodosiev, D.; Samardjiev, T. Auroral electric field penetration into the middle-latitude trough. Advances in Space Research 1987, 7(8), 59–63. [Google Scholar] [CrossRef]
  57. Rishbeth, H. On explaining the behavior of the ionospheric F-region. Reviews of Geophysics 1968, 6(1), 33–71. [Google Scholar] [CrossRef]
  58. Titheridge, J.E. Plasmapause effects in the top side ionosphere. Journal of Geophysical Research 81(19) 1976, 3227–3233. [Google Scholar] [CrossRef]
  59. Thomas, E.G.; Shepherd, S.G. Statistical patterns of ionospheric convection derived from mid-latitude, high-latitude, and polar SuperDARN HF radar observations. Journal of Geophysical Research 2018, 123(4)(3), 196–3,216. [Google Scholar] [CrossRef]
  60. Heppner, J.P.; Maynard, N.C. Empirical high-latitude electric-field models. Journal of Geophysical Research 1987, 92(A5), 4467–4489. [Google Scholar] [CrossRef]
  61. Fogg, A.R.; Lester, M.; Yeoman, T.K.; Burrell, A.G.; Imber, S.M.; Milan, S.E.; Thomas, E.G.; Sangha, H.; Anderson, B.J. An improved estimation of SuperDARN Heppner-Maynard boundaries using AMPERE data. Journal of Geophysical Research: Space Physics 2020, 125(5), e2019JA027218. [Google Scholar] [CrossRef]
  62. Burrows, J.R.; McDiarmid, I.B. Critical Problems of Magnetospheric Physics; Dyer), E.R., Ed.; IUCSTP Secretariat: Washington, D.C.; National Academy of Sciences, 1972; pp. 83–106. Available online: https://adsabs.harvard.edu/full/1972cpmp.conf...83B.
  63. Frank, L.A. Relationship of the plasma sheet, ring current, trapping boundary, and plasmapause near the magnetic equator and local midnight. Journal of Geophysical Research 1971, 76(10)(2), 265–2,275. [Google Scholar] [CrossRef]
  64. Galperin, Yu.I.; Feldstein, Ya.I. Mapping of the precipitation region to the plasma sheet. Journal of geomagnetism and geoelectricity 1996, 48(5-6), 857–875. [Google Scholar] [CrossRef]
  65. Mishin, E.; Puhl-Quinn, P. SAID: Plasmaspheric short circuit of substorm injections. Geophysical Research Letters 2007, 34(24), L24101. [Google Scholar] [CrossRef]
  66. Mishin, E.; Sotnikov, V. The turbulent plasmasphere boundary layer and the outer radiation belt boundary. Plasma Physics and Controlled Fusion 2017, 59(12), 124003. [Google Scholar] [CrossRef]
  67. Mishin, E.V.; Streltsov, A.V. Toward the unified theory of SAID-linked subauroral arcs. Journal of Geophysical Research: Space Physics 2024, 129(1), e2023JA032196. [Google Scholar] [CrossRef]
  68. Newell, P.T.; Gjerloev, J.W. Evaluation of SuperMAG auroral electrojet indices as indicators of substorms and auroral power. Journal of Geophysical Research 2011, 116(A12), A12211. [Google Scholar] [CrossRef]
  69. Mishin, E.V.; Streltsov, A.V. Subauroral geospace, nonlinear wave and plasma structures in the auroral and subauroral geospacer; Elsevier (S&T), 2022; pp. 199–343. [Google Scholar] [CrossRef]
Figure 1. The positions of the rapid high-latitude subauroral flows investigated are depicted by (left vertical panel) the northern geographic maps and (right vertical panel) northern polar plots.
Preprints 200472 g001
Figure 2. The line plots depict the ring current, geomagnetic, and auroral conditions underlying the 2013 subauroral events investigated (dot/square symbols in colors; shaded intervals in yellow).
Preprints 200472 g002
Figure 6. The plot sets show the strong downward drifts and their westward E field drivers developed in the SAID events of February 2013.
Preprints 200472 g006
Figure 8. The magnetically conjugate observations depict the 29 October 2013 SAID event.
Preprints 200472 g008
Figure 9. The magnetically conjugate observations depict the 14 October 2013 SAPS event.
Preprints 200472 g009
Table 1. Rapid high-latitude westward SAPS flows and associated variables.
Westward SAPS Events Plasma Variables
Event
Number
Event
Date
UT (Hr:Mn) MLAT (oN) MLT (Hr:Mn) Ni
103 (cm3)
VHOR (m/s) EMER
(mV/m)
1 10 February 2013 02:06 70.43 17:36 1.2 2000 73
2 5 October 2013 19:49 71.30 19:41 2.1 2400 89
3 5 October 2013 21:30 72.15 20:04 3.5 1400 45
4 5 October 2013 23:11 71.92 19:45 3.5 1000 30
5 14 October 2013 02:38 70.28 17:29 4.1 900 30
Table 2. Rapid high-latitude westward SAID flows and associated variables.
Westward SAID Events Plasma Variables
Event
Number
Event
Date
UT (Hr:Mn) MLAT (oN) MLT (Hr:Mn) Ni
103 (cm3)
VHOR (m/s) EMER
(mV/m)
1 4 February 2013 23:43 70.69 19:19 0.4 5400 150
2 5 February 2013 01:25 70.63 18:09 1.0 2800 100
3 5 February 2013 03:10 71.83 16:25 1.2 3000 115
4 6 February 2013 01:13 71.39 18:15 1.5 3000 105
5 11 February 2013 20:19 67.04 19:45 0.6 4000 140
6 12 February 2013 01:40 67.58 18:16 0.7 3200 125
7 5 October 2013 18:09 70.88 19:38 1.1 4000 140
8 6 October 2013 17:55 70.01 19:36 1.0 5000 160
9 7 October 2013 19:23 65.37 19:56 1.0 4200 140
10 8 October 2013 00:27 68.96 19:19 1.9 2950 150
11 12 October 2013 18:22 66.91 19:45 1.2 5200 170
12 13 October 2013 01:07 67.65 18:58 1.0 2600 100
13 13 October 2013 18:11 68.99 19:41 1.3 2500 90
14 19 October 2013 18:32 68.32 19:48 0.6 5300 170
15 20 October 2013 21:48 68.51 20:12 0.8 3800 140
16 20 October 2013 23:29 69.06 19:48 1.1 2800 95
17 21 October 2013 03:13 70.53 17:13 1.0 5000 195
18 21 October 2013 02:53 71.45 18:48 1.5 4000 150
19 22 October 2013 12:54 67.97 18:42 2.0 4200 160
20 22 October 2013 14:51 67.47 19:00 1.0 2800 110
21 22 October 2013 16:18 67.65 19:19 1.9 3800 90
22 22 October 2013 18:12 67.83 19:41 1.5 4800 170
23 23 October 2013 22:53 72.38 19:52 2.0 5200 190
24 24 October 2013 00:35 73.18 18:50 2.0 5400 150
25 24 October 2013 19:19 70.41 19:56 1.4 5400 185
26 24 October 2013 22:41 72.00 19:57 2.5 4600 170
27 29 October 2013 01:15 71.46 18:30 3.0 3800 135
28 29 October 2013 02:58 72.12 16:56 2.5 5600 170
Disclaimer/Publisher’s Note: The statements, opinions and data contained in all publications are solely those of the individual author(s) and contributor(s) and not of MDPI and/or the editor(s). MDPI and/or the editor(s) disclaim responsibility for any injury to people or property resulting from any ideas, methods, instructions or products referred to in the content.
Copyright: This open access article is published under a Creative Commons CC BY 4.0 license, which permit the free download, distribution, and reuse, provided that the author and preprint are cited in any reuse.
Prerpints.org logo

Preprints.org is a free preprint server supported by MDPI in Basel, Switzerland.

Subscribe

Disclaimer

Terms of Use

Privacy Policy

Privacy Settings

© 2026 MDPI (Basel, Switzerland) unless otherwise stated