Submitted:
26 February 2026
Posted:
27 February 2026
You are already at the latest version
Abstract
Permanent deformation, manifested as rutting, remains one of the most critical threats to the structural integrity and functional performance of flexible pavements. The Mechanistic-Empirical Pavement Design Guide (MEPDG) includes rutting models that are highly sensitive to the dynamic modulus (E*) of asphalt mixtures – a parameter that can be determined experimentally or predicted by analytical models. In this study, the influence of E* prediction error on rutting estimation is systematically evaluated by comparing laboratory-measured E* values with those predicted by two models: NCHRP 1-37A and a locally calibrated model. The dynamic pavement behavior and rut depth predictions were determined using the finite layer program 3D-Move under standard traffic loads. Comparative analysis revealed that the NCHRP 1-37A model tends to underestimate E*, leading to significant overestimation of vertical strains and accumulated permanent deformation. In contrast, the locally calibrated model provided predictions that closely matched the laboratory measurements, resulting in minimal deviation in rut depth estimates. The results highlight the importance of local calibration and model selection to improve the reliability of mechanistic-empirical pavement predictions, enabling smarter pavement performance evaluation and supporting more sustainable pavement management practices, especially when laboratory testing is not feasible.
Keywords:
rutting
; dynamic modulus
; prediction algorithms
; flexible pavements
; sustainability
1. Introduction
One of the most common types of distress observed on flexible pavements is permanent deformation [1]. This surface distortion, known as rutting, can cause significant structural damage, reduce ride quality, and pose safety hazards due to water accumulation, reduced skid resistance, and increased risk of hydroplaning. The extent of rutting affects both the lateral and longitudinal pavement profiles, influencing drainage efficiency and vehicle stability.
Permanent deformation can result from several mechanisms, acting individually or together, including asphalt mix rutting, subgrade rutting, and densification [2,3,4]. Asphalt mix rutting occurs when depressions form along the wheel paths due to issues within the asphalt mix, such as improper compaction or deficiencies in the mix design. This distress is typically attributed to poor mix selection, inadequate design, or flaws in production. In this case, the subgrade remains stable, and the rutting is primarily confined to the asphalt layer. In contrast, subgrade rutting arises from deformations within the subgrade under repeated traffic loading. As the subgrade settles, it causes corresponding depressions on the pavement surface, compromising the structural integrity and ride quality of the road. Densification-related rutting results from insufficient compaction of individual layers during construction. Over time, as traffic loads pass over the pavement, the layers compact further, gradually leading to surface depressions and permanent deformation.
Focusing on asphalt layers, permanent deformation may consist of densification and/or flow rutting [5]. Initially, densification occurs due to compaction from traffic loads (post-compaction), while later-stage deformation results from material displacement under shear stress. Previous research [6,7] has identified three distinct rutting stages: an initial rapid densification phase, a steady-state deformation phase during the pavement’s operational lifespan, and a tertiary phase. The primary stage evolves rapidly due to post-compaction. In the next stage, rutting develops at a constant rate, mainly driven by shear stress. The final stage is characterised by accelerated plastic deformations while the material volume remains stable.
Multiple studies have explored the evolution of permanent deformation in asphalt mixtures. Common models relate permanent strain to the number of loading cycles based on a power law relationship, though they typically only capture the initial and steady-state phases without modelling tertiary deformation [8,9,10,11,12].
Given that rutting is a common distress in flexible pavements, the development of prediction models describing pavement rutting performance is a constantly evolving process. Empirical prediction models based on experience and observation lack accuracy and neglect the characteristics of the asphalt mix design [13,14,15].
In contrast, mechanistic-empirical models are more accurate in predicting rutting performance [16,17]. Moreover, machine learning (ML), including artificial neural networks (ANN) and recurrent neural networks (RNN), has been employed in the development of rutting prediction models [18,19,20,21].
In pavement design, while traditional methods set limits on subgrade strain to indirectly control permanent deformation, the Mechanistic-Empirical Pavement Design Guide (MEPDG) includes models that predict permanent deformation in asphalt pavements by considering the contributions from different pavement layers. MEPDG divides rutting contributions into four key layers: asphalt layer, granular base, subbase, and subgrade soil. Individual layer rut depths are projected over time based on traffic load repetitions [22]. The predictive models in MEPDG were initially formulated using laboratory data from repeated load tests. However, adjustments were necessary to align with field observations.
Asphalt mix properties, such as aggregate gradation, asphalt binder content, percentage of air voids, and filler, significantly influence the rutting resistance of asphalt mixtures through their impact on the stiffness modulus [23,24,25,26]. Specifically, increases in asphalt binder and air void content result in decreased rutting resistance, while an increase in stiffness modulus leads to enhanced rutting resistance [27]. Within the context of the MEPDG, asphalt mix dynamic modulus (E*) is regarded as a fundamental mechanical property of the asphalt mix. Therefore, it has a significant impact on the estimation of the rutting performance of asphalt layers during the pavement design process.
Depending on the level of analysis, MEPDG allows either the determination of E* through extensive, specialised laboratory testing or the prediction of E* using algorithms. Within the MEPDG methodology, two predictive algorithms are included: the viscosity-based NCHRP 1-37A model and the asphalt dynamic shear modulus-based model (NHCPR 1-40D). Given the importance of E* and the time-consuming procedure required to determine it in the laboratory, the need for reliable estimation through predictive algorithms is evident.
Predictive algorithms estimate E* based on mix properties, temperature, and load frequency. Numerous studies have evaluated different models, focusing on their applicability and accuracy [28,29,30,31,32,33,34,35,36]. Based on these evaluations, recalibration efforts have been undertaken, and alternative algorithms have been developed to better reflect local mixes and conditions. Although significant progress has been made in quantifying and refining the accuracy of E* predictive algorithms, limited attention has been given to quantifying and mitigating the impact of their inherent biases on pavement performance predictions, highlighting a crucial area for future research.
Previous studies have demonstrated that inaccuracies in E* prediction can lead to significant deviations in pavement performance estimation. A study by Hou et al. [37] concluded that the NCHRP 1-40D model provided better E* values than the NCHRP 1-37A model. Overall, these models were found to be useful for estimating pavement performance associated with the CAM model, particularly when actual E* tests or other performance tests are not feasible or practical in real-world applications. However, according to Georgouli et al. [38], the significant error in the E* values predicted by the NCHRP 1-37A and Hirsch models is partially mitigated in the final output, which is the fatigue cracking prediction. Still, the uncalibrated predictive algorithms led to an overestimation of fatigue cracking by 8–24%, whereas the implementation of a locally calibrated algorithm showed no significant difference.
According to Al-Tawalbeh et al. [39], analysis based on the uncalibrated Hirsch model indicated that predicted fatigue damage could vary by more than 50%, with an average deviation of 17.33%, and rutting predictions could change by up to 14%. Similarly, although the NCHRP 1-37A model demonstrated good prediction accuracy for Indiana mixtures, its use led to increased pavement distresses compared to designs based on measured E* values [40]. In contrast, limited performance deviations were observed when the NCHRP 1-40D model was applied to Egyptian mixes, reflecting the variability of model effectiveness across regions [41].
The above-mentioned studies on the effects of uncalibrated E* prediction models on pavement behaviour, especially regarding fatigue cracking and rutting, yield contradictory results, underlining the need for further investigation. Pavement sustainability best practices increasingly emphasize the importance of performance-based design supported by accurate pavement performance prediction. Reliable mechanistic–empirical modelling allows engineers to optimize pavement layer thicknesses and material selection while ensuring adequate resistance to key distresses such as rutting. This reduces premature failures and avoids unnecessary overdesign, ultimately minimizing life-cycle costs, material consumption, energy use, and environmental impacts associated with frequent rehabilitation activities. Against this background, this study examines the errors in E* estimation algorithms and their effects on rutting in asphalt pavements within the MEPDG. The tertiary rutting phase, typically associated with severe material failure, is excluded, as the adopted MEPDG-based rutting models primarily capture the initial and steady-state deformation stages. Laboratory-measured E* values (E*lab) are compared with those predicted by the NCHRP 1-37A model (E*1-37A) and a locally calibrated model developed by Georgouli et al. hereinafter referred to as the GR model (E*GR) [32]. Both measured and predicted E* values are then used as inputs in the dynamic analysis program 3D-Move [42] to simulate rutting in asphalt pavements over an analysis period. A comprehensive comparative analysis of the different rutting results is conducted.
2. Experimental Study
2.1. Asphalt Mix Properties
Multiple flexible pavement structures were considered and further analyzed (Figure 1). The pavement cross-sections differ in the thickness of the asphalt (HMA) layer, which ranges from 14 to 25 cm. The thickness of the base layer, as well as the elastic modulus of the base and subgrade layers, remain constant. The aim is to investigate whether HMA thickness, together with the estimated E* error, affects the calculated rutting.
The asphalt mix had a nominal maximum aggregate size of 19 mm and was produced using a 50/70 PEN penetration grade binder. Key mix properties, including aggregate gradation, specific gravity, asphalt content (Pb), air void percentage (Va), and effective binder content (Vbeff), were documented (Table 1).
2.2. Asphalt Mix Dynamic Modulus Testing and Estimation
Four specimens were fabricated, using a gyratory compactor, at 5% air void target. The initial dimensions of the specimens were 150mm diameter and 170mm height. The specimens were cut at the top and bottom edge and cored to meet the specified in the AASHTO T342-11 dimensions for further testing of the E*. The final dimensions of the specimens were 102±2mm average diameter and 150±2.5mm average height (Figure 2). All specimens were tested per AASHTO T342-11 at multiple temperatures (4, 15, 20, 25, 37, 54oC) and loading frequencies (25, 10, 5, 1, 0.5, 0.1 Hz). It is worthwhile to mention that although the AASHTO standard covers a wider temperature range (–10 °C to 54 °C), testing at temperatures below 4 °C was not feasible due to limitations in maintaining the required specimen temperature.
Additionally, two predictive models were used to estimate the dynamic modulus values at the aforementioned temperatures and frequencies: the viscosity-based 1-37A model [43] and GR [32] model. The viscosity-based 1-37A model was selected due to two reasons. First, it is included in input level 2 and 3 in the MEPDG software and second the global calibration factors of all asphalt concrete predictive performance models (including rut depth) have been determined using this model. The GR model was developed based on the 1-37A model following calibration to local conditions and asphalt mixes. The NCHRP 1-40D model which is also included in the input level 2 and 3 of the MEPDG software, was not utilized since according to relevant research results its predictive accuracy is significantly low for local mixes [32,38].
The general expression of both 1-37A and GR model is given in equation 1.
where Ε*: dynamic modulus of mixture (psi), η: viscosity of binder (106poise), f: loading frequency (Hz), Va: air voids (% by volume), Vbeff: effective binder (% by volume), ρ34: cumulative percentage retained on 3/4 inch (or 19 mm) sieve, ρ38: cumulative percentage retained on 3/8 inch (or 9.5 mm) sieve, ρ4: cumulative percentage retained on No. 4 (or 4,75mm) sieve, ρ200: percentage passing No. 200 (or 0,075mm) sieve.
2.3. Rutting Model Application
MEPDG’s rutting model in the HMA layer calculates permanent deformation based on vertical plastic strain and axle load repetitions. Laboratory test results are adjusted for field conditions using calibration factors resulting in Equation 2. Parameters of the equation are explained in Table 3.
The study performed a dynamic analysis at two vehicle speeds, 60km/h and 80km/h, using 3D-Move analysis program [42,44]. All the simulations were performed by using the typical 18-kip (8.16 ton) equivalent single-axle load (ESAL) approach. The loading configuration of the half axle is shown in Figure 3.
The wheel axle load is equal to 20kN and the pressure distributed over the circular area with a radius of 0.105m, is 0.577MPa. For simulation and comparison purposes, it is assumed that all pavement cross sections accommodate 25 million cumulative ESAL (18-kip equivalent single-axle load) repetitions over a 20-year period.
3. Data Analysis and Results
A comparative analysis assessed the predictive performance of E* models by comparing measured (E*lab) and estimated values (E*1-37A and E*GR.) (Figure 4).
The accuracy and performance of 1-37A and GR models, is described thoroughly in [38]. In brief, Root Mean Square Error (RMSE) (Table 4) calculations revealed that the GR model had the lowest deviation from laboratory-measured E*, compared to 1-37A model.
Figure 5, Figure 6 and Figure 7 illustrate the vertical strain profiles induced by a moving load traveling at 60 km/h, calculated at various depths within the asphalt layer (expressed in meters). The analysis considers dynamic modulus (E*) values obtained from laboratory testing (E*lab) and those predicted using the 1-37A (E*1-37A) and GR (E*GR) models, for total HMA layer thicknesses (h1) of 14, 20, and 25 cm. Figure 8, Figure 9 and Figure 10 present the corresponding results for a higher load speed of 80 km/h.
The developed vertical stains in every case have a similar waveform. After the main peak (~0.17s–0.18s and ~0.13.-0.14s for moving load at 60 and 80km/h, respectively), the strain response quickly dissipates, indicating that the material returns to its original state after loading. This behaviour is typical of asphalt materials, which exhibit viscoelastic recovery. At small depths near the surface vertical stress are tensile while with increasing depth until the bottom of the asphalt layer is compressive. As the depth increases, the peak strain magnitude also increases, suggesting that the material experiences greater deformation at larger depths. Furthermore, as the thickness of the HMA layer increases, the resulting strains are reduced in magnitude. A similar trend is observed with increasing load speed, higher vehicle speeds lead to lower strain levels within the asphalt layer.
Figure 11, Figure 12 and Figure 13 present a comparative analysis of the vertical strains developed at the bottom of the asphalt layer for varying HMA thickness of h1 = 0.14 m, 0.20 m, and 0.25 m, respectively and a moving load speed at 60km/h. The strains are calculated based on three different methods for estimating the dynamic modulus of the asphalt mix: laboratory testing (E*lab), the 1-37A predictive model (E*1-37A), and the GR predictive algorithm (E*GR).
According to the above figures, vertical strains tend to be overvalued when considering the E* values estimated from the 1-37A model. This is expected since E* is underestimated through the 1-37A model. However, vertical strain values calculated based on the E*GR values are very close to the ones that are obtained using the laboratory measured E* values. This is attributed to the fact that this predictive algorithm produces E* values close to the ones measured in the lab. The corresponding results for the 80 km/h load speed are omitted for brevity, as they exhibit similar trends to those discussed above.
To measure the deviations, the percentage error was computed using the vertical strain values derived from the E*lab values as a reference. Percentage error of calculated strains is presented in Figure 14, Figure 15 and Figure 16 in box-and-whisker plot. The box represents the interquartile range (IQR), which is the range between Q1 (25th percentile) and Q3 (75th percentile). A longer box suggests greater variability in the middle 50% of the data. The line inside the box indicates the median (Q2 or 50th percentile) of the dataset. The mean value is depicted with a marker. The lines extending from the box to the minimum and maximum values within 1.5 times the IQR are the whiskers. Values beyond this range are considered outliers. Any individual points outside the whiskers (Outliers), indicate potential extreme values. For clarity reasons the extreme values are not shown in the Figures below.
When considering the E*1-37A values, the percentage error in the calculated strains at the bottom of the HMA layer exhibits a wide range. For a moving load traveling at 60 km/h, the mean error is approximately −21%, −9%, and −15% for HMA layer thicknesses of 14 cm, 20 cm, and 25 cm, respectively. At a higher load speed of 80 km/h, the corresponding mean errors are approximately −18%, −23%, and 63%. Notably, for both speeds, the HMA layer with a thickness of 25 cm exhibits not only a higher mean error but also greater variability in the results, indicating increased sensitivity of the model predictions at larger pavement thicknesses.
In contrast, when the E*GR values are used, the range of percentage errors becomes considerably narrower. For a load speed of 60 km/h, the mean errors are approximately 1.9%, 3%, and 0.8% for HMA layer thicknesses of 14 cm, 20 cm, and 25 cm, respectively. Unlike the trend observed with the 1-37A model, the 25 cm HMA case exhibits both a smaller error range and a lower mean error. At the higher load speed of 80 km/h, the corresponding mean errors are approximately 10%, 10%, and −14%, with the overall range remaining nearly constant across different asphalt layer thicknesses.
It is evident that the error in the E* estimation models have a great effect on the calculated induced vertical strains at the bottom of the asphalt layer. The smaller the error the smaller the differences in the stains analysis.
Figure 17 and Figure 18 present the total permanent deformation of the asphalt layer at the end of the analysis period, calculated using E*lab, E*1-37A, and E*GR values for load speeds of 60 km/h and 80 km/h, respectively. The percentage difference of the permanent deformation is given in Table 5, with respect to the permanent deformation calculated when E*lab values are considered.
The results presented in the table indicate that the predicted permanent deformation is consistently higher when the E*1-37A values are used, with mean percentage errors ranging from approximately 24% to 27% at a load speed of 60 km/h and from 36% to 37% at 80 km/h. The differences are most pronounced at 20 cm. In contrast, the E*GR values yield substantially lower errors, within 3–4% at 60 km/h and around 9–10% at 80 km/h. These findings suggest that the GR model provides a much closer agreement with the laboratory-based E* values, demonstrating better predictive accuracy and reduced sensitivity to both load speed and HMA layer thickness. Moreover, the load speed is shown to influence the prediction errors as higher speeds correspond to larger discrepancies. This can be attributed to the viscoelastic nature of asphalt materials, where increased loading speed (or reduced loading time) leads to higher apparent stiffness and lower deformation.
The convergence of Δp(HMA) values when analysis is performed with the laboratory measured E* and those estimated with the GR model, highlights the necessity for local calibration of the E* prediction models to local conditions and mixtures.
4. Discussion
This study evaluated how the accuracy of dynamic modulus (E*) predictive algorithms affects the calculation of developed vertical strains and permanent deformation in asphalt layers of varying thickness. Using three approaches – laboratory-measured values, the 1-37A model, and the GR model – strain and permanent deformation behavior were assessed under moving load across three HMA thickness levels: 14 cm, 20 cm, and 25 cm. The main findings are summarized as follows:
- An increase in HMA layer thickness reduces vertical strains in the asphalt layer and decreases permanent deformation. This is consistent with the expected structural benefits of thicker asphalt layers, such as improved resistance to rutting.
- An increase in the loading speed (or decrease in loading time) leads to a reduction in both the vertical strains within the asphalt layer and the resulting permanent deformation. This is consistent with the viscoelastic behavior of asphalt materials, where higher loading rates cause the material to respond in a stiffer manner, reducing time-dependent deformation under moving loads.
- A detailed comparative analysis revealed significant differences in the prediction accuracy of the E* models. The GR model consistently produced dynamic modulus values that closely matched laboratory measurements, whereas the 1-37A model systematically underestimated E*.
- The agreement of the GR E* model with laboratory-determined E* values resulted in lower strain errors. The percentage error in vertical strains using E*GR values remained below 5% in all cases, with a notably narrow distribution of values, even for thicker pavements. In contrast, the 1-37A model systematically underestimated E*, leading to overestimation of vertical strains. The mean strain errors of the 1-37A model reached –21% for the 14 cm thick HMA layer, while the range of variation was considerably larger for the 25 cm thick HMA layer.
- The differences in E* and strain values are also evident in the analysis of permanent deformation. The 1-37A model overestimated ΔpHMA by more than 24% at a load speed of 60km/h and approximately 35% at 80 km/h. In contrast, predictions using the GR model exhibited only minor deviations from the laboratory results, with errors below 5% for 60 km/h and below 10% for 80 km/h.
- The thickness of the asphalt layer appears to have a greater influence on strain errors and a lesser effect on permanent deformation. It is important to note that no consistent trend was observed in strain error or rutting percentage difference with increasing pavement thickness. For example, the 1-37A model produced the highest strain error at 14 cm thickness (–21%) but also showed substantial errors at 25 cm (–15%), with a lower error at 20 cm (–9%). Similarly, the corresponding rutting percentage differences remained consistently high across all thicknesses, without a clear correlation to strain error magnitudes.
- The GR model, although more accurate overall, also exhibited fluctuations in both strain and rutting predictions without a definitive trend related to thickness. Increasing the asphalt layer thickness from 14 to 20 cm led to an increase in both strain errors and calculated permanent deformation. A further increase in asphalt layer thickness from 20 to 25 cm resulted in a decrease in both strain errors and the extent of permanent deformation.
5. Conclusions
In conclusion, the accuracy of the E* input directly affects the critical performance indicators of the pavement. Errors in predicting E* are particularly significant for pavement design regarding the rutting criterion, especially when the asphalt layer thickness is less than 20 cm. Local calibration of E* prediction models for mechanistic-empirical pavement design is therefore strongly recommended, and the choice of model is a critical factor. In the present comparative study, the 1-37A model appears to produce conservative results, while the calibrated GR model seems to optimize pavement design solutions to some extent.
Overall, it is important to have reliable predictions of pavement performance in order to achieve sustainable pavement management, since this will allow for optimal design choices, efficient resource use, and effective preventive maintenance. If pavement deterioration can be accurately predicted, then overdesign can be prevented, excessive use of asphalt resources and aggregates can be minimized, and the environmental impacts of repeated construction, such as energy use, greenhouse gas emissions, and traffic congestion, can be reduced. On the other hand, inaccurate prediction models can cause early deterioration or overly conservative designs, which will both result in increased life-cycle costs and environmental impacts. For this reason, therefore, improving the accuracy of mechanistic-empirical pavement performance predictions, especially those that are sensitive to important material properties such as dynamic modulus (E*), is an important step towards achieving smarter and more sustainable pavement infrastructure.
Future research could examine a wider range of asphalt mixes, temperatures, and traffic loading scenarios to further validate the applicability of this study’s results. Additionally, incorporating real-world performance data could enhance the robustness of predictive models and their practical integration into mechanistic-empirical pavement design systems.
Author Contributions
Conceptualization, K.G.; methodology, K.G. and C.P.; software, K.G.; validation, K.G., C.P. and A.L.; formal analysis, K.G.; writing—original draft preparation, K.G.; writing—review and editing, C.P and A.L. All authors have read and agreed to the published version of the manuscript.
Funding
This research received no external funding.
Data Availability Statement
The original contributions presented in this study are included in the article. Further inquiries can be directed to the corresponding author.
Conflicts of Interest
The authors declare no conflicts of interest.
References
- Topal, A.; Oner, J.; Sengoz, B.; Dokandari, P.A. Evaluation of Rutting Performance of Warm Mix Asphalt. Int. J. Civ. Eng. 2017, 15, 705–714. [Google Scholar] [CrossRef]
- Joumblat, R.; Al Basiouni Al Masri, Z.; Al Khateeb, G.; Elkordi, A.; El Tallis, A.R.; Absi, J. State-of-the-Art Review on Permanent Deformation Characterization of Asphalt Concrete Pavements. Sustainability 2023, 15(2), 1166. [Google Scholar] [CrossRef]
- Jia, M.; Li, H.; Ma, G.; Zhang, X.; Yang, B.; Tian, Y.; Zhang, Y. Investigation on Permanent Deformation of Unbound Granular Material Base for Permeable Pavement: Laboratory and Field Study. Int. J. Transp. Sci. Technol. 2023, 12(2), 373–386. [Google Scholar] [CrossRef]
- Shyaa, A.S.; Rahma, R.A. Review: Asphalt Pavement Rutting Distress and Effects on Traffic Safety. J. Traffic Transp. Eng. 2022, 10(1). [Google Scholar] [CrossRef]
- Albayati, A.H. A Review of Rutting in Asphalt Concrete Pavement. Open Eng. 2023, 13(1), 20220463. [Google Scholar] [CrossRef]
- Alamnie, M.M.; Taddesse, E.; Hoff, I. Advances in Permanent Deformation Modeling of Asphalt Concrete—A Review. Materials 2022, 15(10), 3480. [Google Scholar] [CrossRef]
- Zhang, J.; Zhu, C.; Li, X.; Pei, J.; Chen, J. Characterizing the Three-Stage Rutting Behavior of Asphalt Pavement with Semi-Rigid Base by Using UMAT in ABAQUS. Constr. Build. Mater. 2017, 140, 496–507. [Google Scholar] [CrossRef]
- Deng, Y.; Shi, X. Modeling the Rutting Performance of Asphalt Pavements: A Review. J. Infrastruct. Preserv. Resil. 2023, 4, 17. [Google Scholar] [CrossRef]
- Deng, X.; Zhang, X. Modeling Permanent Deformation in Asphalt Pavements: The Challenges of Tertiary Deformation. J. Mater. Civ. Eng. 2018, 30(5), 04018137. [Google Scholar] [CrossRef]
- Wang, X.; He, Y. Prediction of Permanent Deformation in Asphalt Pavements Using Power Law Models. Constr. Build. Mater. 2015, 84, 243–252. [Google Scholar] [CrossRef]
- Yalçın, E.; Çeloğlu, M.E.; Yılmaz, M.; Kök, B.V.; Alataş, T. Determination of Resistance to Creep Permanent Deformation of Hot Mix Asphalts Prepared with Various Additives. Civil Eng. J. 2018, 4(7), 1553–1564. [Google Scholar] [CrossRef]
- Ghani, U.; Milazzo, S.; Giancontieri, G.; Buttitta, G.; Gu, F.; Presti, D.L. Investigating the Ability of Road Specifications to Discriminate the Rutting Behavior of Rubberized Asphalt Mixtures in Italy. Infrastructures 2024, 9, 113. [Google Scholar] [CrossRef]
- Alnaqbi, A.J.; Zeiada, W.; Al-Khateeb, G.G.; Hamad, K.; Barakat, S. Creating Rutting Prediction Models through Machine Learning Techniques Utilizing the Long-Term Pavement Performance Database. Sustainability 2023, 15(18), 13653. [Google Scholar] [CrossRef]
- Hu, A.; Bai, Q.; Chen, L.; Meng, S.; Li, Q.; Xu, Z. A Review on Empirical Methods of Pavement Performance Modeling. Constr. Build. Mater. 2022, 342, 127968. [Google Scholar] [CrossRef]
- Deori, S.; Choudhary, R.; Tiwari, D.; Gangopadhyay, S. Calibration of HDM-4 Models for Indian Conditions of Flexible Pavement Having Modified Bitumen in Wearing Course. Int. J. Pavement Eng. 2018, 19(9), 772–785. [Google Scholar] [CrossRef]
- Liu, G.; Chen, L.; Qian, Z.; Zhang, Y.; Ren, H. Rutting Prediction Models for Asphalt Pavements with Different Base Types Based on RIOHTrack Full-Scale Track. Constr. Build. Mater. 2021, 305, 124793. [Google Scholar] [CrossRef]
- Liu, J.; Liu, F.; Zheng, C.; Zhou, D.; Wang, L. Optimizing Asphalt Mix Design through Predicting the Rut Depth of Asphalt Pavement Using Machine Learning. Constr. Build. Mater. 2022, 356, 129211. [Google Scholar] [CrossRef]
- Haddad, A.J.; Chehab, G.R.; Saad, G.A. The Use of Deep Neural Networks for Developing Generic Pavement Rutting Predictive Models. Int. J. Pavement Eng. 2022, 23(12), 4260–4276. [Google Scholar] [CrossRef]
- Choi, S.; Do, M. Development of the Road Pavement Deterioration Model Based on the Deep Learning Method. Electronics 2020, 9(1), 3. [Google Scholar] [CrossRef]
- Alharbi, F.; Smadi, O. Predicting Pavement Performance Utilizing Artificial Neural Network (ANN). Int. J. Adv. Eng. Manag. Sci. 2019, 5, 504–508. [Google Scholar] [CrossRef]
- Okuda, T.; Suzuki, K.; Kohtake, N. Proposal and Evaluation of Prediction of Pavement Rutting Depth by Recurrent Neural Network. In Proceedings of the 2017 6th IIAI International Congress on Advanced Applied Informatics (IIAI-AAI), Hamamatsu, Japan, 9–13 July 2017; IEEE: Piscataway, NJ, USA, 2017; pp. 1053–1054. [Google Scholar] [CrossRef]
- National Cooperative Highway Research Program (NCHRP). Guide for Mechanistic-Empirical Design of New and Rehabilitated Pavement Structures; Appendix GG-1: Calibration of Permanent Deformation Models for Flexible Pavements; Transportation Research Board: Washington, DC, USA, 2004. [Google Scholar]
- de Barros, L.M.; do Nascimento, L.A.H.; Aragão, F.T.S. Effects of Binder and Aggregate Properties on the Permanent Deformation of Asphalt Mixtures by Means of Uniaxial and Triaxial Tests. Constr. Build. Mater. 2022, 332, 127346. [Google Scholar] [CrossRef]
- Guo, R.; Nian, T.; Zhou, F. Analysis of Factors That Influence Anti-Rutting Performance of Asphalt Pavement. Constr. Build. Mater. 2020, 254, 119237. [Google Scholar] [CrossRef]
- Lira, B.; Ekblad, J.; Lundström, R. Evaluation of Asphalt Rutting Based on Mixture Aggregate Gradation. Road Mater. Pavement Des. 2021, 22(5), 1160–1177. [Google Scholar] [CrossRef]
- Safiuddin, M.; Tighe, S.; Uzarowski, L. Evaluation of Stiffness to Predict Rutting Resistance of Hot Mix Asphalt: A Canadian Case Study. Balt. J. Road Bridge Eng. 2014, 9, 35. [Google Scholar] [CrossRef]
- Rondón Quintana, H.A.; Zafra Mejia, C.A.; Reyes Lizcano, F.A. Rutting in Asphalt Mixtures—A Review. Rev. Ing. Univ. Medellín 2023, 22(43), a3. [Google Scholar] [CrossRef]
- El-Badawy, S.; Bayomy, F.; Awed, A. Performance of MEPDG Dynamic Modulus Predictive Models for Asphalt Concrete Mixtures: Local Calibration for Idaho. J. Mater. Civ. Eng. 2012, 24(11), 1412–1421. [Google Scholar] [CrossRef]
- Giuliana, G.; Nicolosi, V.; Festa, B. Predictive Formulas of Complex Modulus for High Air Void Content Mixes. In Proceedings of the 91st Annual Meeting of the Transportation Research Board (TRB), Washington, DC, USA, 22–26 January 2012. [Google Scholar]
- Khattab, A.M.; El-Badawy, S.M.; Al Hazmi, A.A.; Elmwafi, M. Evaluation of Witczak E* Predictive Models for the Implementation of AASHTOWare-Pavement ME Design in the Kingdom of Saudi Arabia. Constr. Build. Mater. 2014, 64, 360–369. [Google Scholar] [CrossRef]
- Sakhaeifar, M.S.; Kim, Y.R.; Kabir, P. New Predictive Models for the Dynamic Modulus of Hot Mix Asphalt. Constr. Build. Mater. 2015, 76, 221–231. [Google Scholar] [CrossRef]
- Georgouli, K.; Loizos, A.; Plati, C. Calibration of Dynamic Modulus Predictive Model. Constr. Build. Mater. 2016, 102, 65–75. [Google Scholar] [CrossRef]
- Solatifar, N. Performance Evaluation of Dynamic Modulus Predictive Models for Asphalt Mixtures. J. Rehabil. Civ. Eng. 2020, 8, 87–97. [Google Scholar] [CrossRef]
- Zhang, D.; Birgisson, B.; Luo, X. A New Dynamic Modulus Predictive Model for Asphalt Mixtures Based on the Law of Mixtures. Constr. Build. Mater. 2020, 255, 119348. [Google Scholar] [CrossRef]
- Gong, H.; Sun, Y.; Dong, Y.; Han, B.; Polaczyk, P.; Hu, W.; Huang, B. Improved Estimation of Dynamic Modulus for Hot Mix Asphalt Using Deep Learning. Constr. Build. Mater. 2020, 263, 119912. [Google Scholar] [CrossRef]
- Mohammadi Golafshani, E.; Behnood, A.; Karimi, M.M. Predicting the Dynamic Modulus of Asphalt Mixture Using Hybridized Artificial Neural Network and Grey Wolf Optimizer. Int. J. Pavement Eng. 2023, 24(1). [Google Scholar] [CrossRef]
- Hou, H.; Wang, T.; Wu, S.; Xue, Y.; Tan, R.; Chen, J.; Zhou, M. Investigation on the Pavement Performance of Asphalt Mixture Based on Predicted Dynamic Modulus. Constr. Build. Mater. 2016, 106, 11–17. [Google Scholar] [CrossRef]
- Georgouli, K.; Plati, C.; Loizos, A. Assessment of Dynamic Modulus Prediction Models in Fatigue Cracking Estimation. Mater. Struct. 2016, 49, 5007–5019. [Google Scholar] [CrossRef]
- Al-Tawalbeh, A.; Sirin, O.; Sadeq, M.; Sebaaly, H.; Masad, E. Evaluation and Calibration of Dynamic Modulus Prediction Models of Asphalt Mixtures for Hot Climates: Qatar as a Case Study. Case Stud. Constr. Mater. 2022, 17, e01532. [Google Scholar] [CrossRef]
- Batioja-Alvarez, D.; Lee, J.; Nantung, T. Evaluating Dynamic Modulus for Indiana Mechanistic-Empirical Pavement Design Guide Practice. Transp. Res. Rec. 2019, 2673(2), 346–357. [Google Scholar] [CrossRef]
- Saudy, M.; Breakah, T.; El-Badawy, S. Dynamic Modulus Prediction Validation for the AASHTOWare Pavement ME Design Implementation in Egypt. Sustainability 2023, 15(18), 14030. [Google Scholar] [CrossRef]
- Siddharthan, R.V.; Krishnamenon, N.; Sebaaly, P.E. Finite-Layer Approach to Pavement Response Evaluation. Transp. Res. Rec. 2000, 1709(1), 43–49. [Google Scholar] [CrossRef]
- Andrei, D.; Witczak, M.W.; Mirza, W. Appendix CC-4: Development of a Revised Predictive Model for the Dynamic (Complex) Modulus of Asphalt Mixtures. In Development of the 2002 Guide for the Design of New and Rehabilitated Pavement Structures (NCHRP Project 1-37A); Transportation Research Board: Washington, DC, USA, 1999. [Google Scholar]
- Ulloa, A.; Hajj, E.Y.; Siddharthan, R.V.; Sebaaly, P.E. Equivalent Loading Frequencies for Dynamic Analysis of Asphalt Pavements. J. Mater. Civ. Eng. 2013, 25(9), 1162–1170. [Google Scholar] [CrossRef]
Figure 1.
Pavement structure.
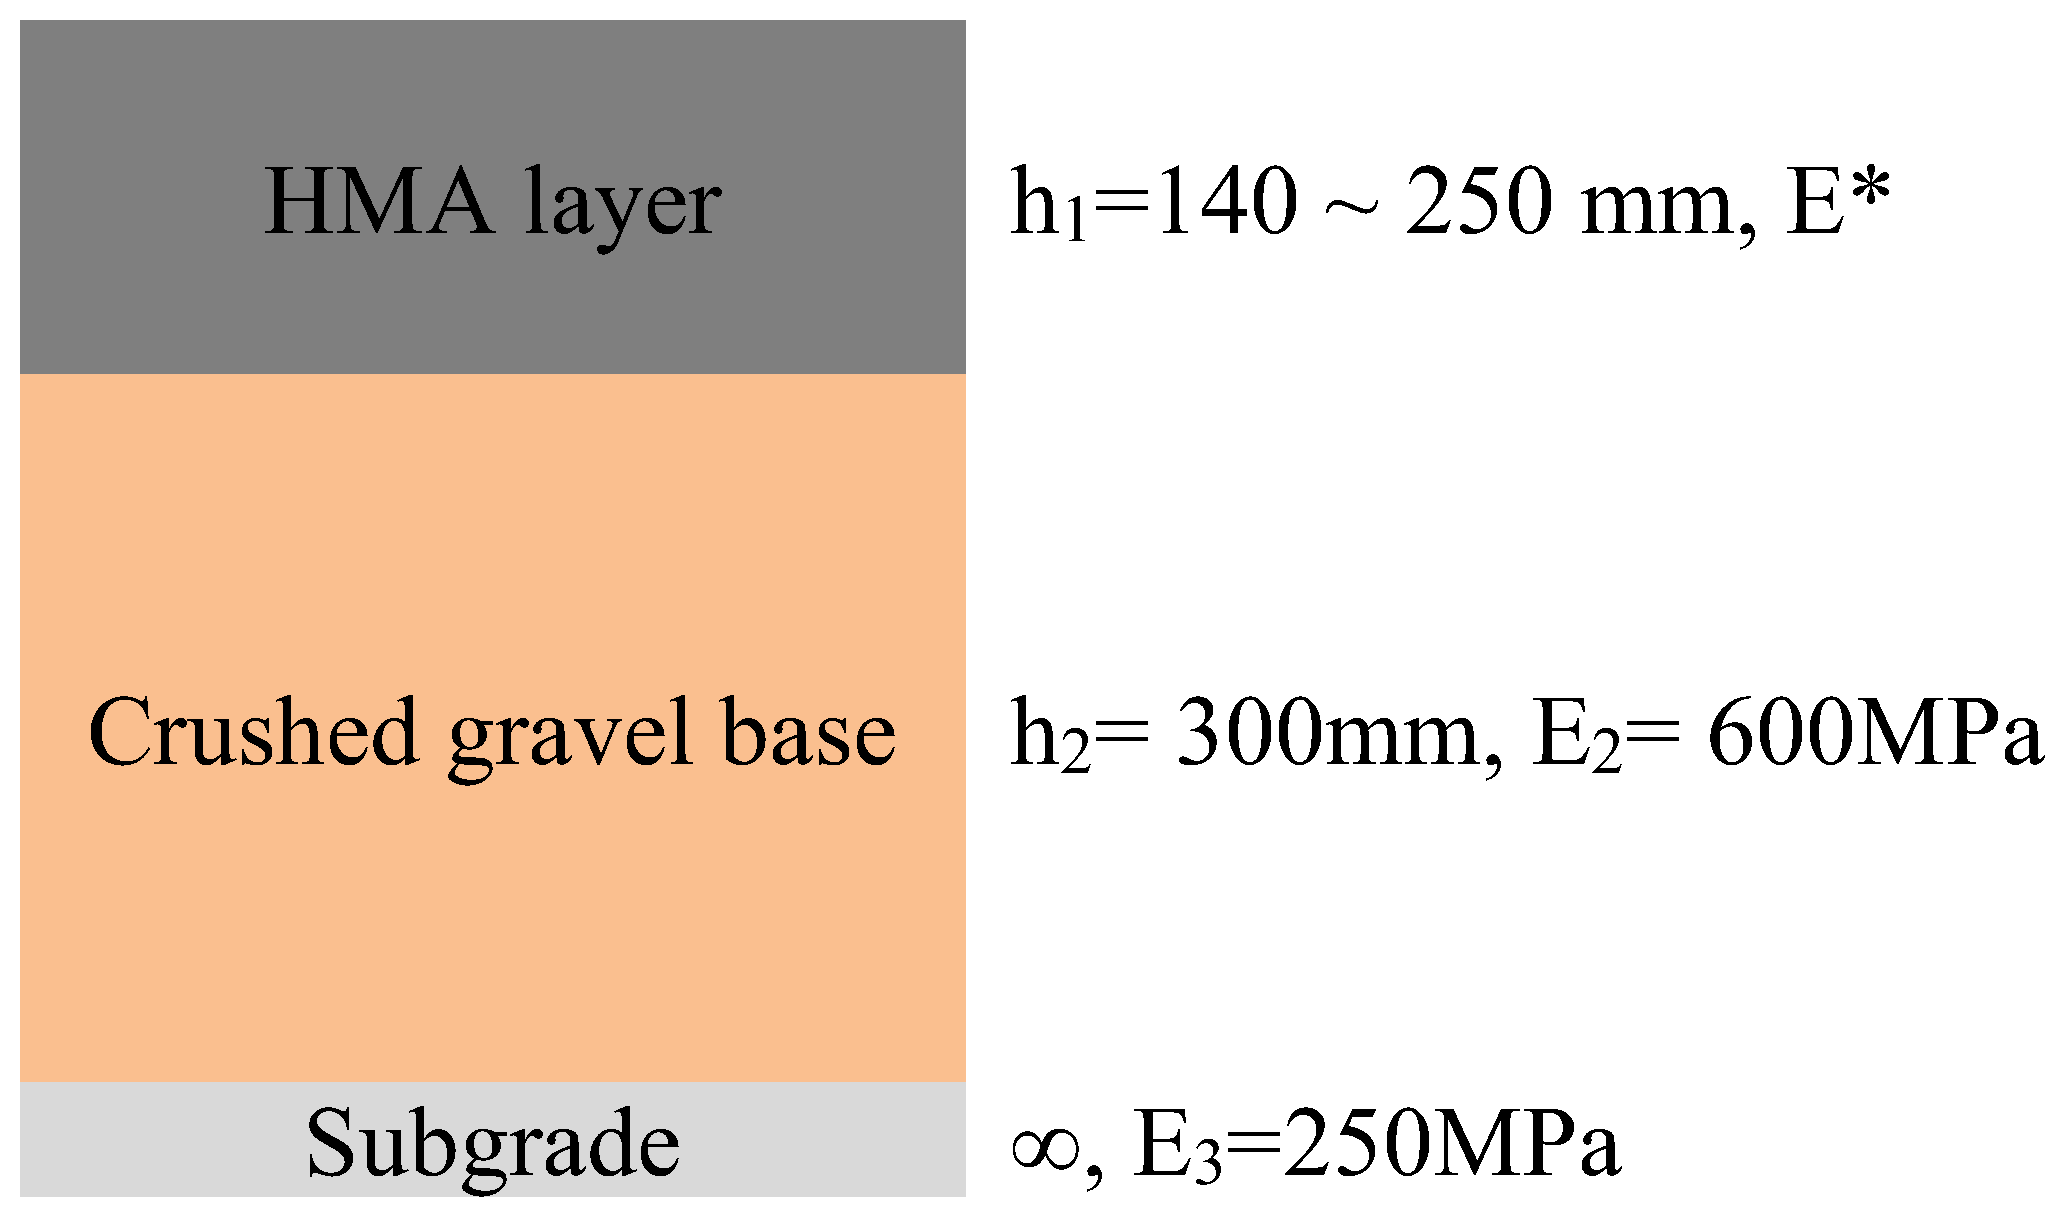
Figure 2.
Compaction and preparation of specimens.
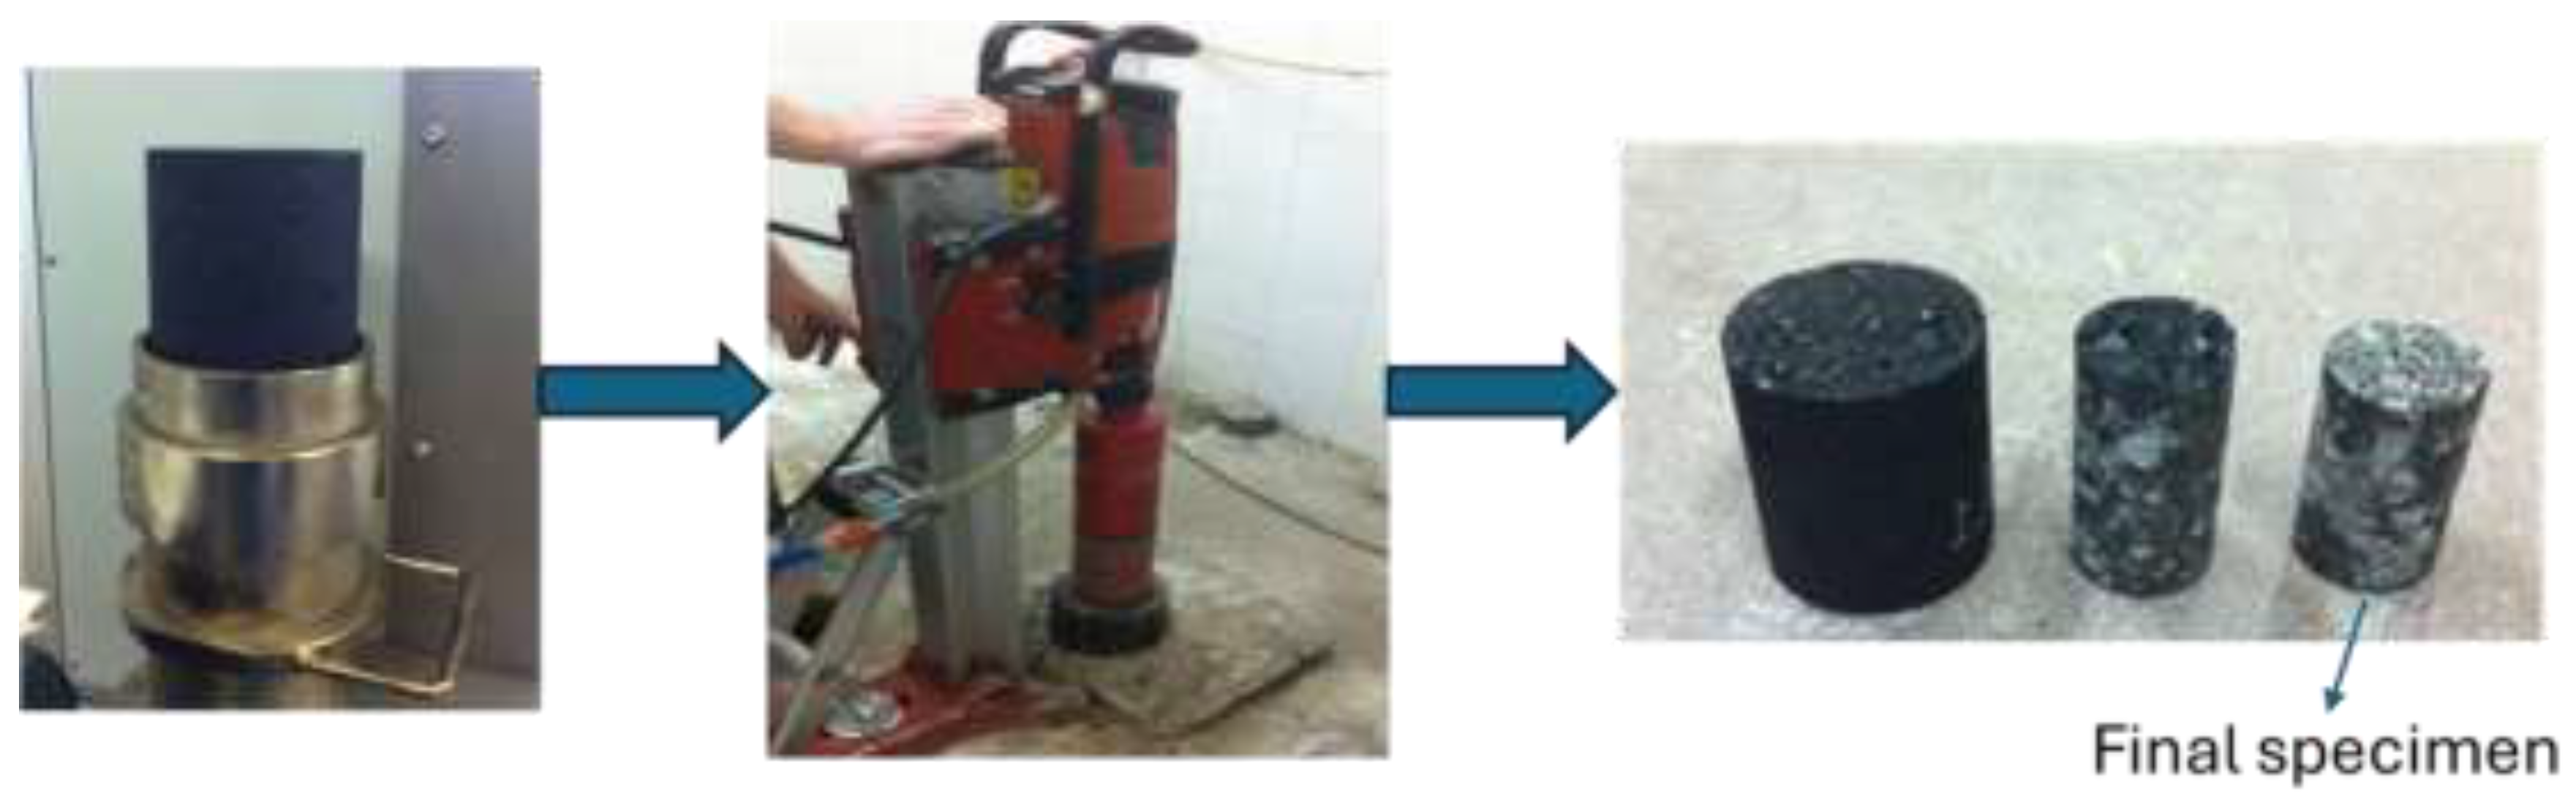
Figure 3.
Loading configuration (half axle).
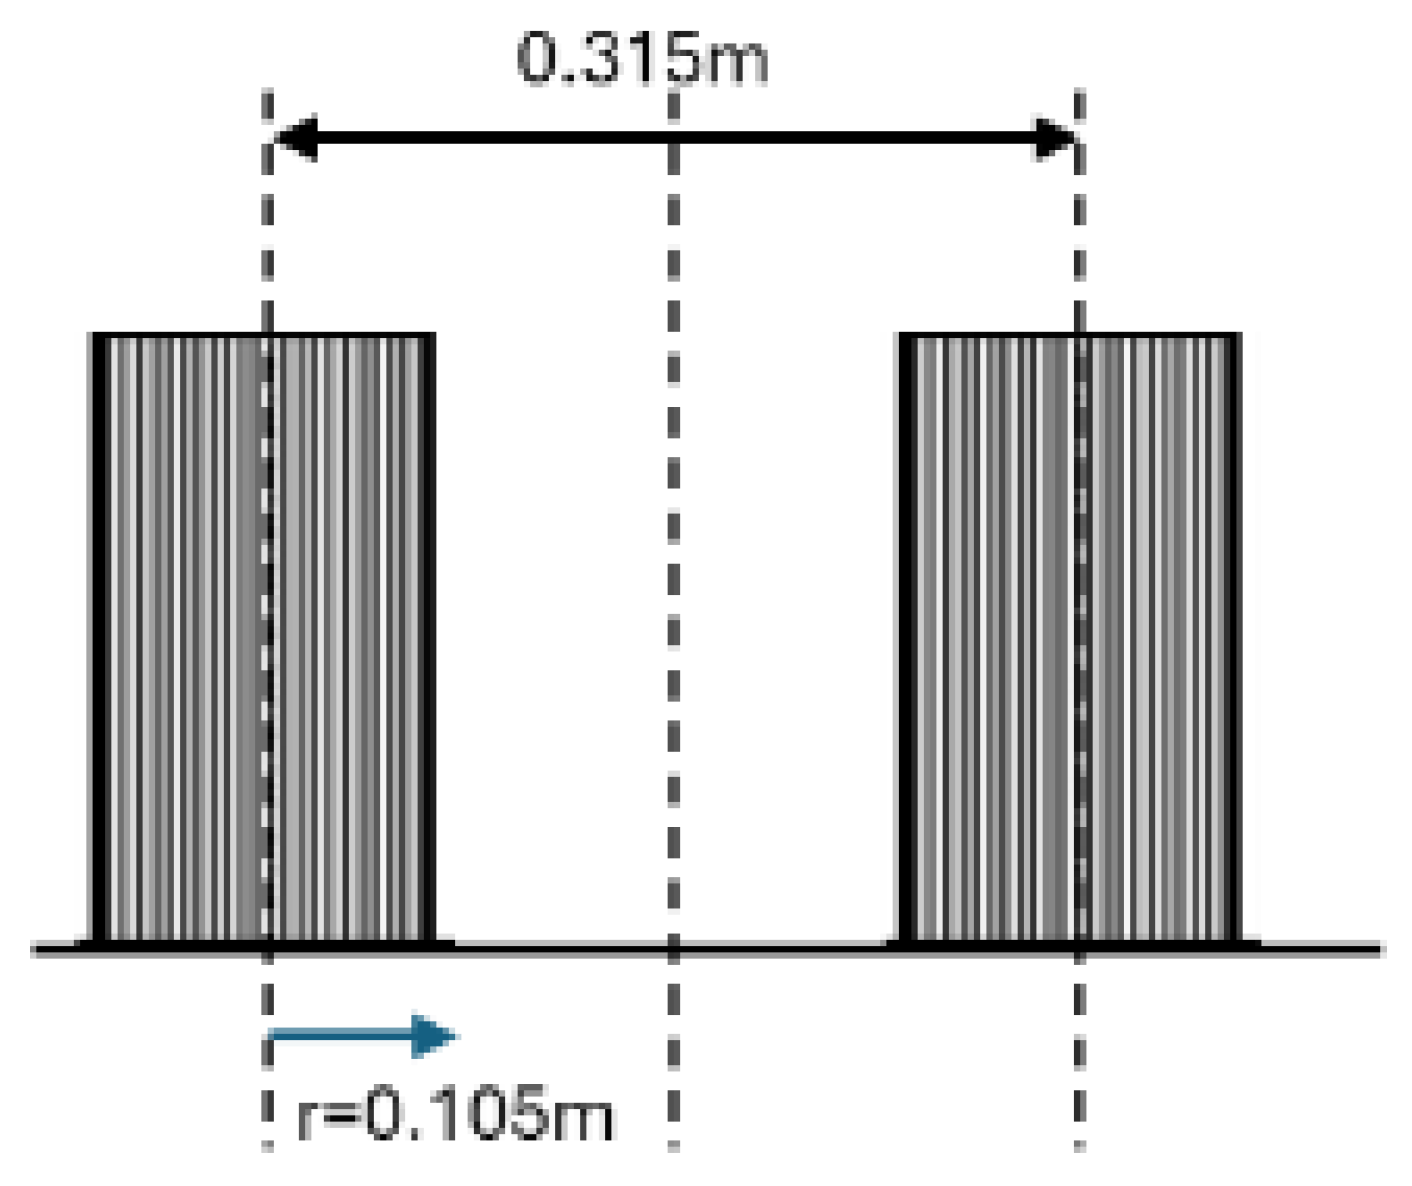
Figure 4.
Predicted and measured dynamic modulus master curve.
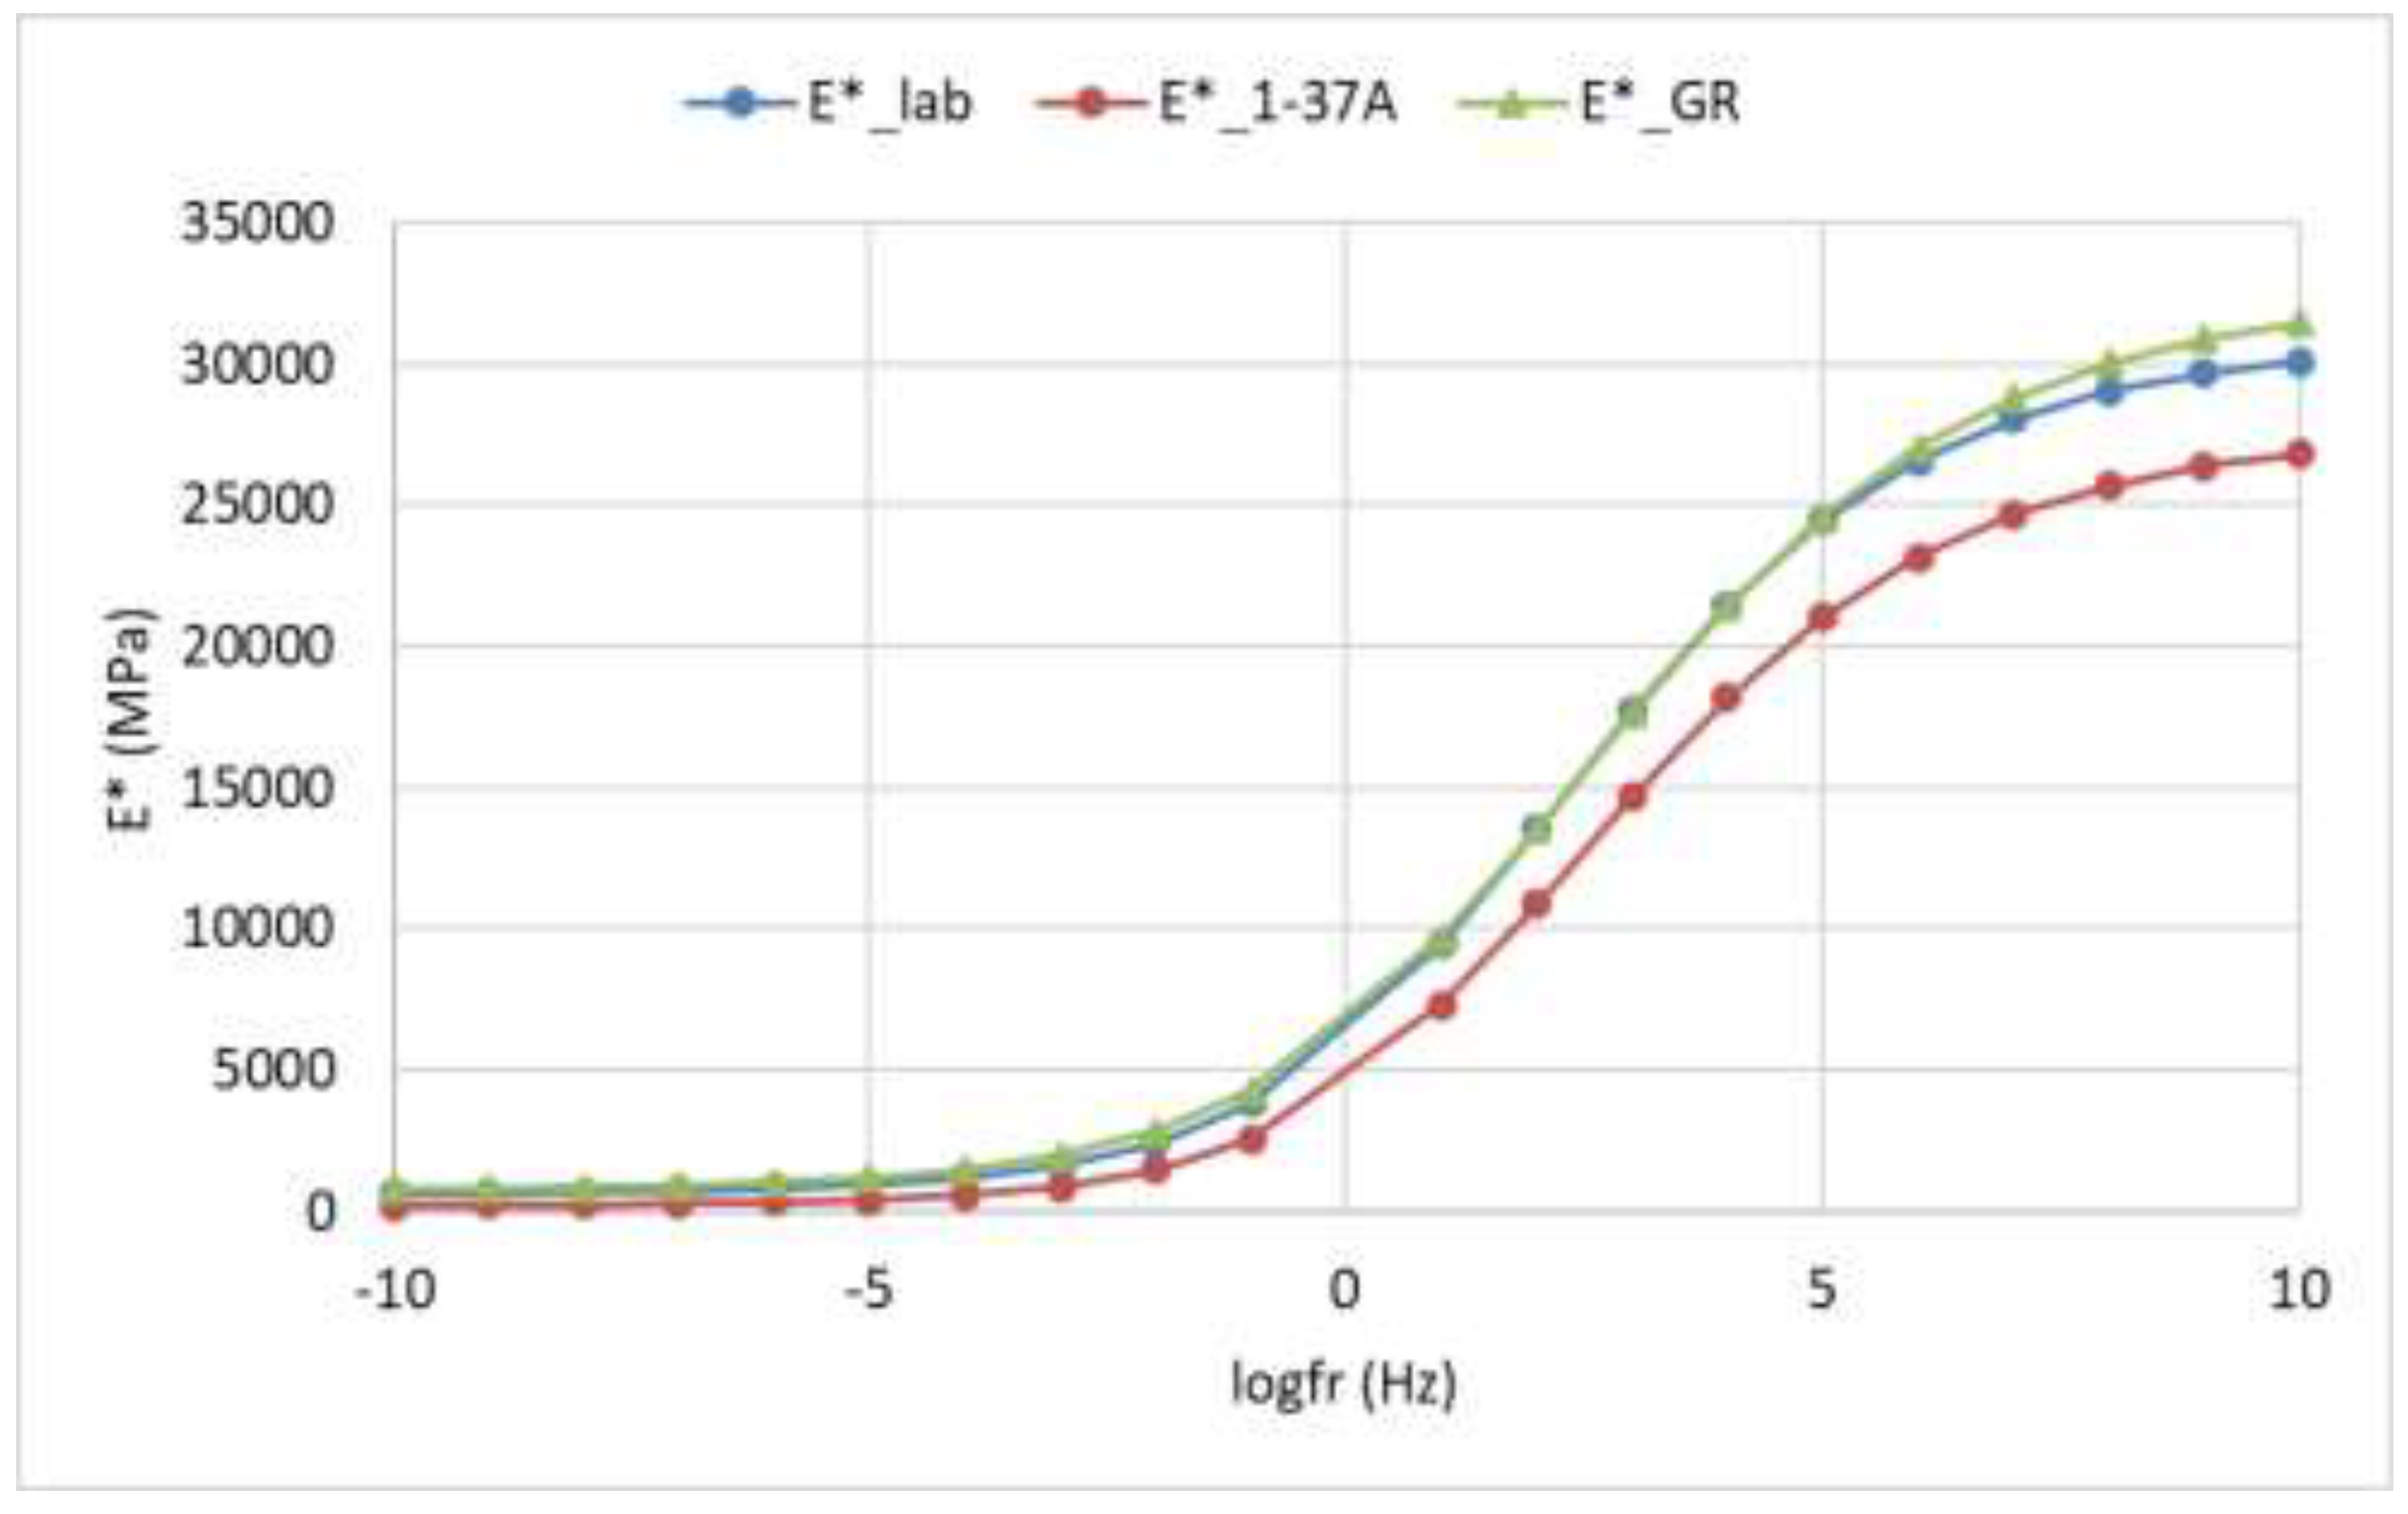
Figure 5.
Vertical strains in asphalt layer, moving load at 60km/h, h1=14 cm, (a) E*lab (b) E*1-37A, (c)E*GR.
Figure 5.
Vertical strains in asphalt layer, moving load at 60km/h, h1=14 cm, (a) E*lab (b) E*1-37A, (c)E*GR.
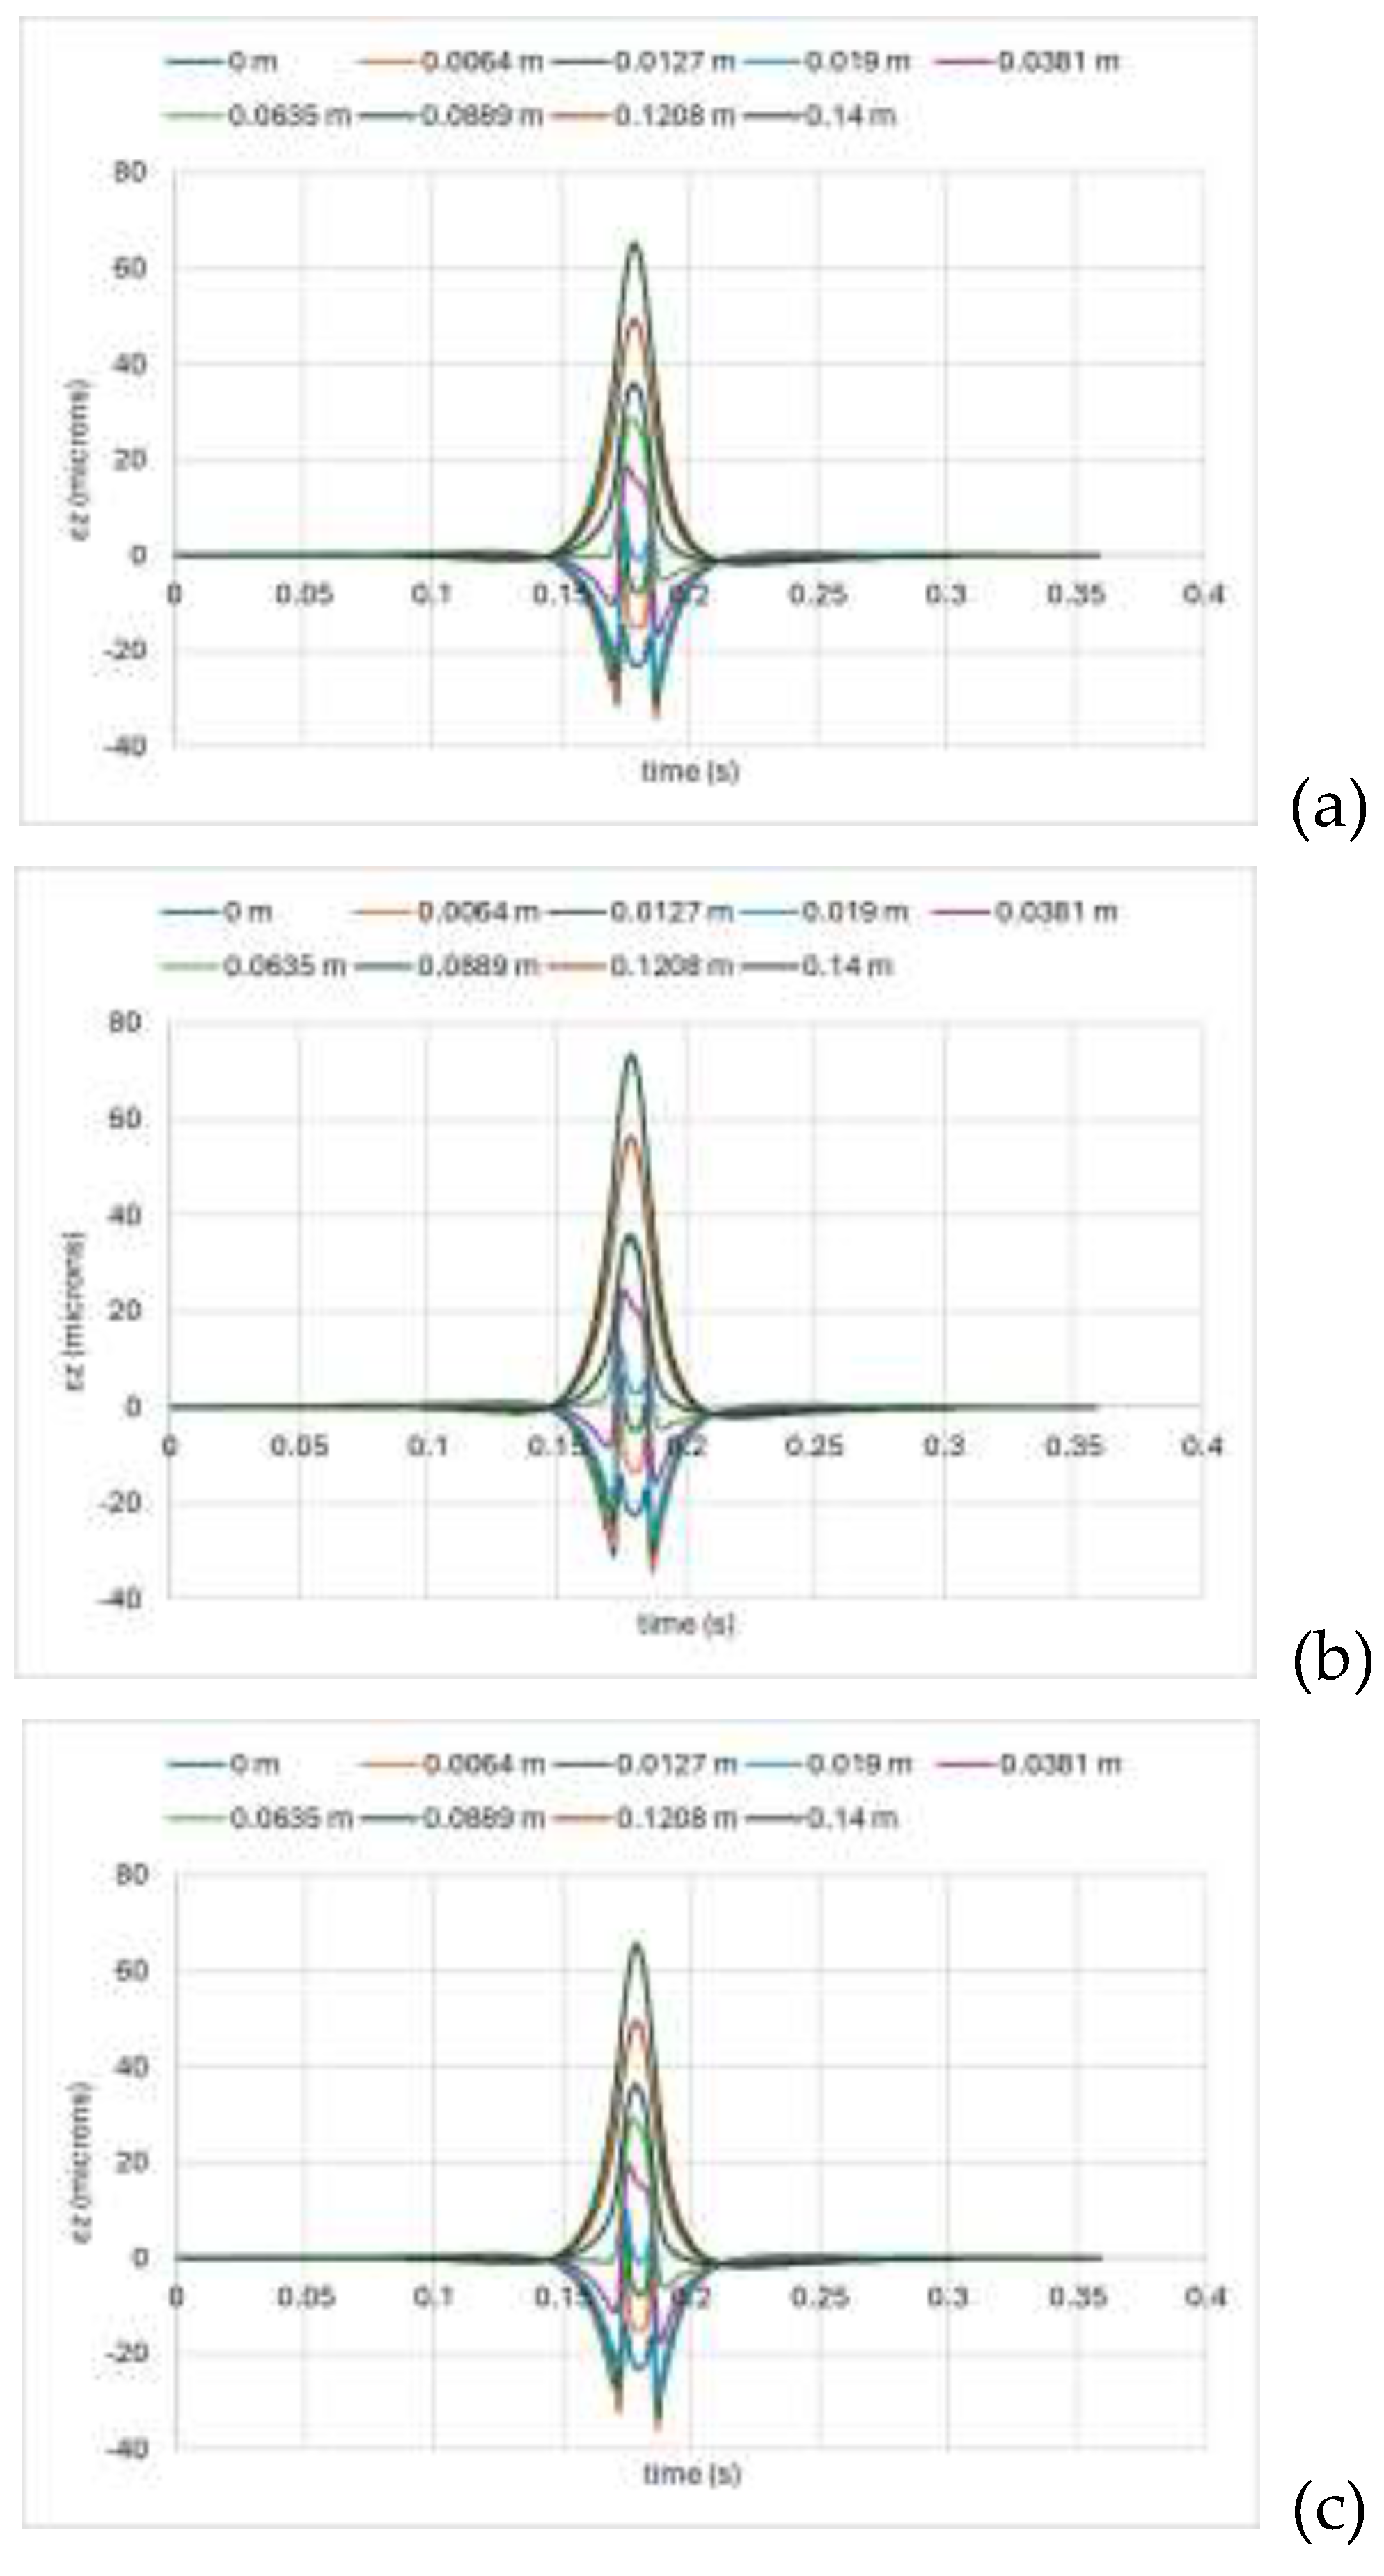
Figure 6.
Vertical strains in asphalt layer, moving load at 60km/h, h1=20 cm, (a) E*lab (b) E*1-37A, (c)E*GR.
Figure 6.
Vertical strains in asphalt layer, moving load at 60km/h, h1=20 cm, (a) E*lab (b) E*1-37A, (c)E*GR.
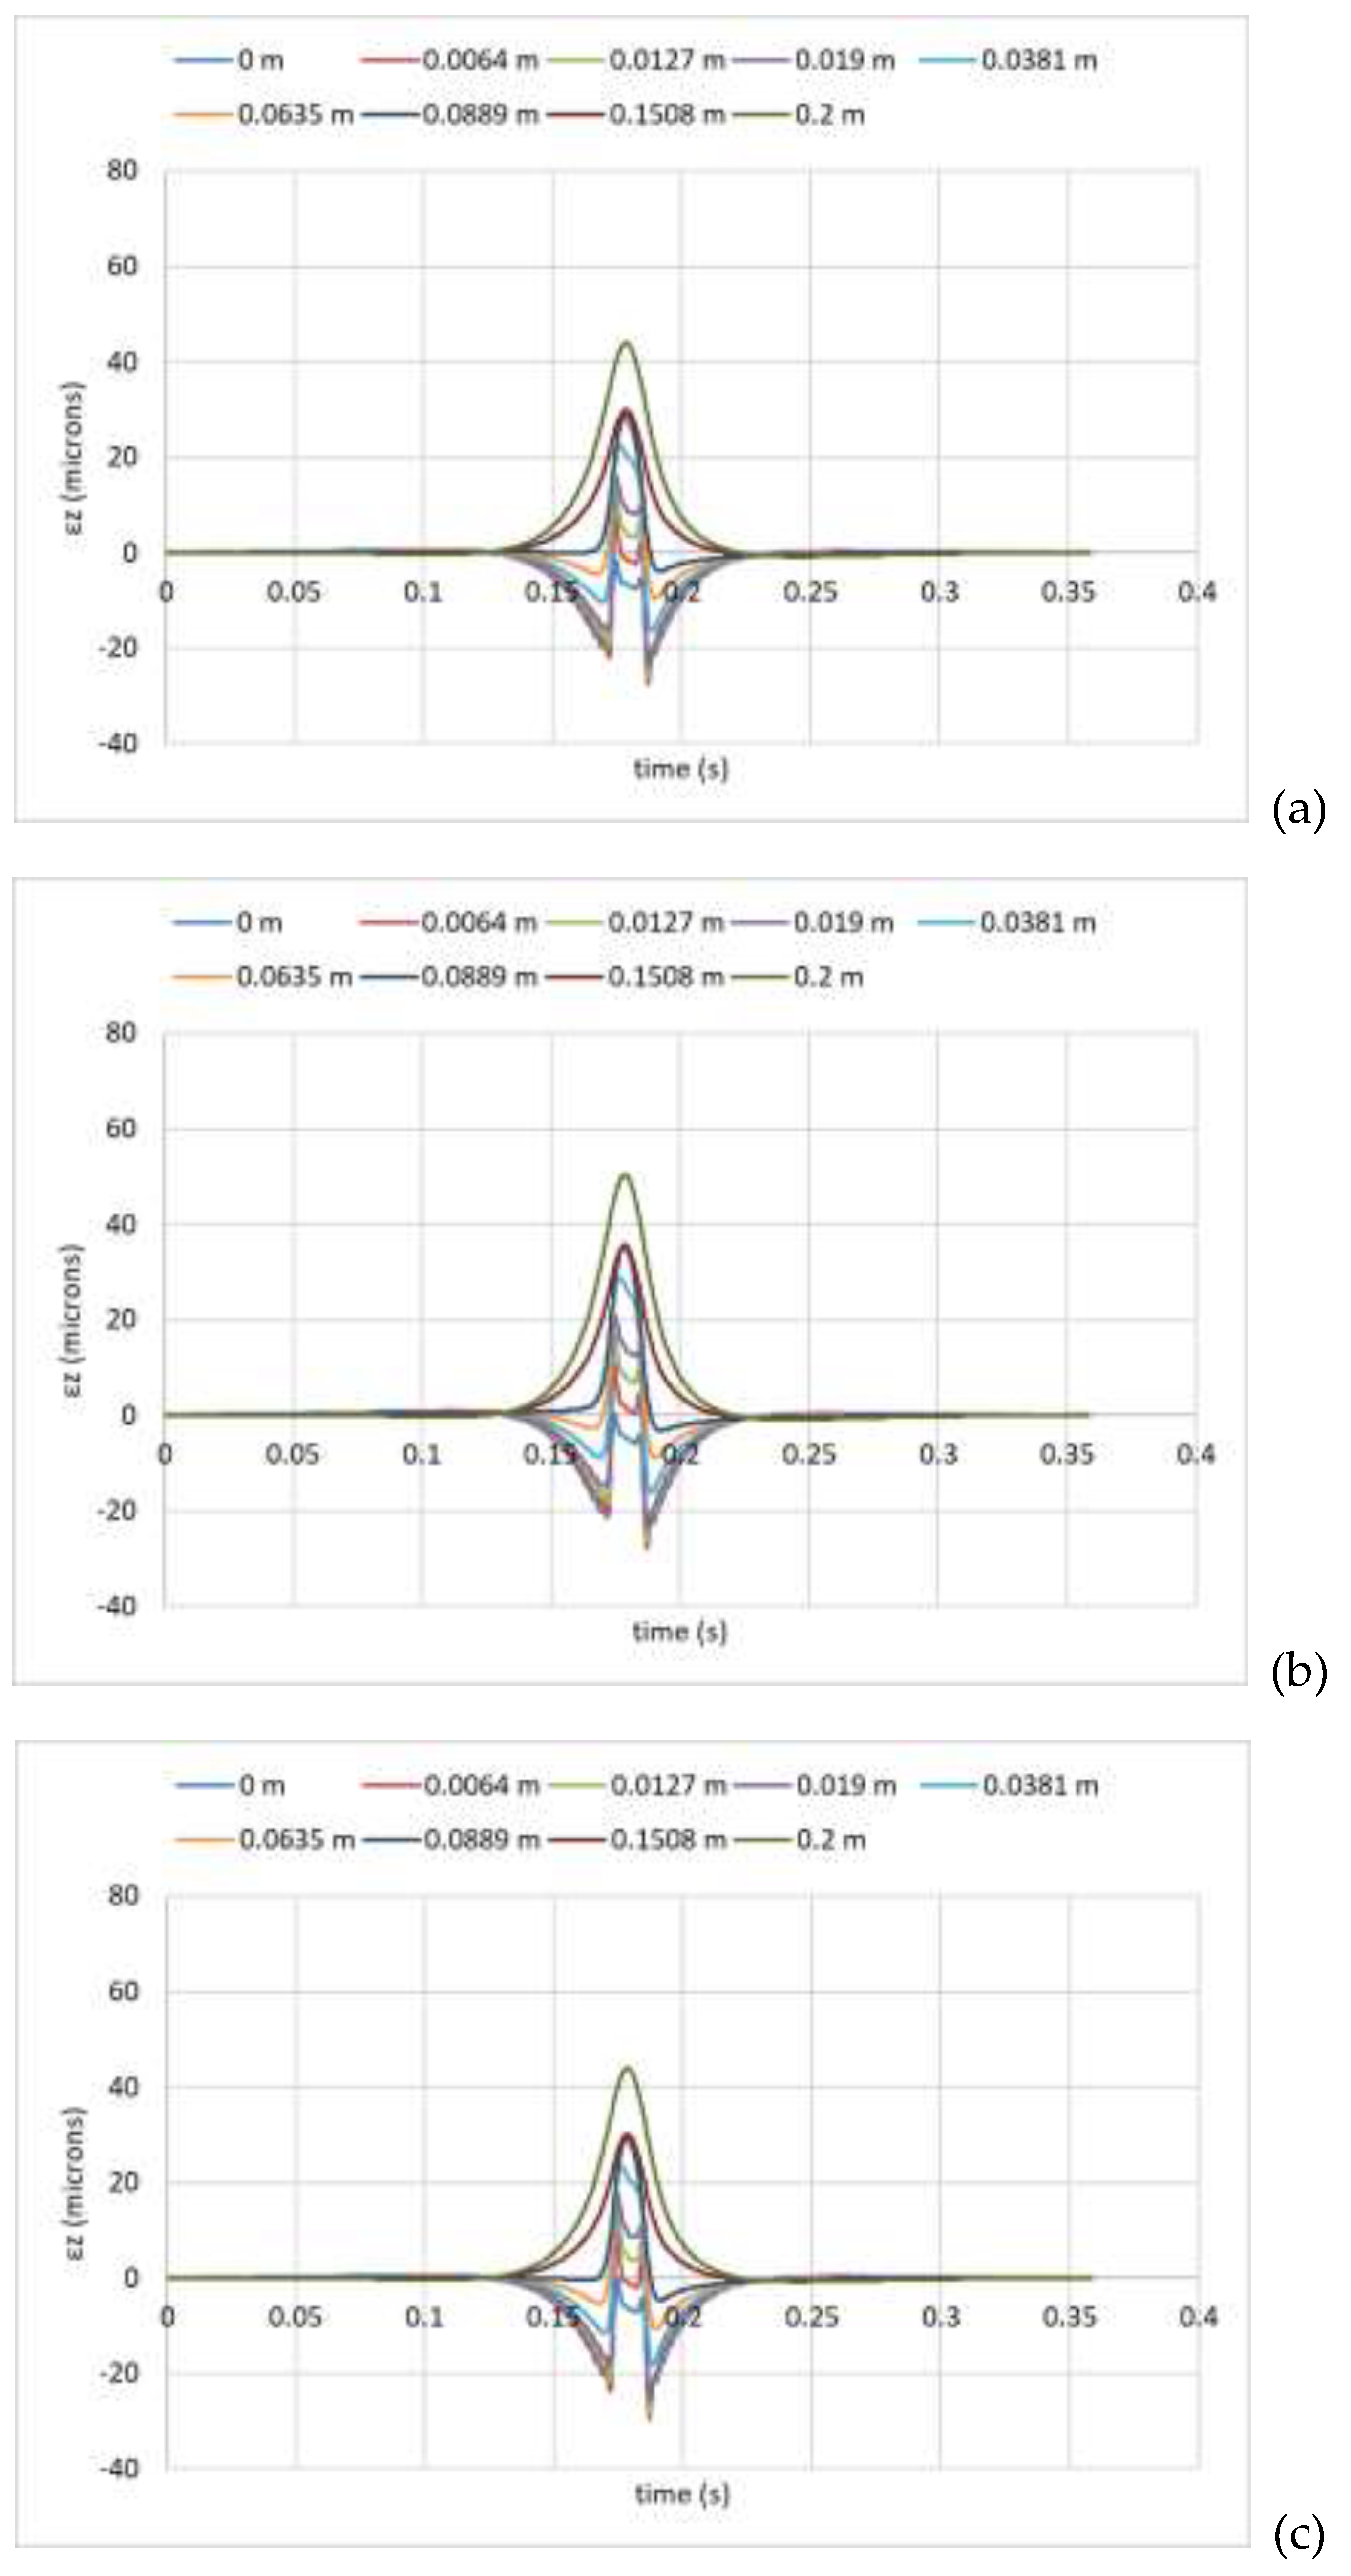
Figure 7.
Vertical strains in asphalt layer, moving load at 60km/h, h1=25 cm, (a) E*lab (b) E*1-37A, (c)E*GR.
Figure 7.
Vertical strains in asphalt layer, moving load at 60km/h, h1=25 cm, (a) E*lab (b) E*1-37A, (c)E*GR.
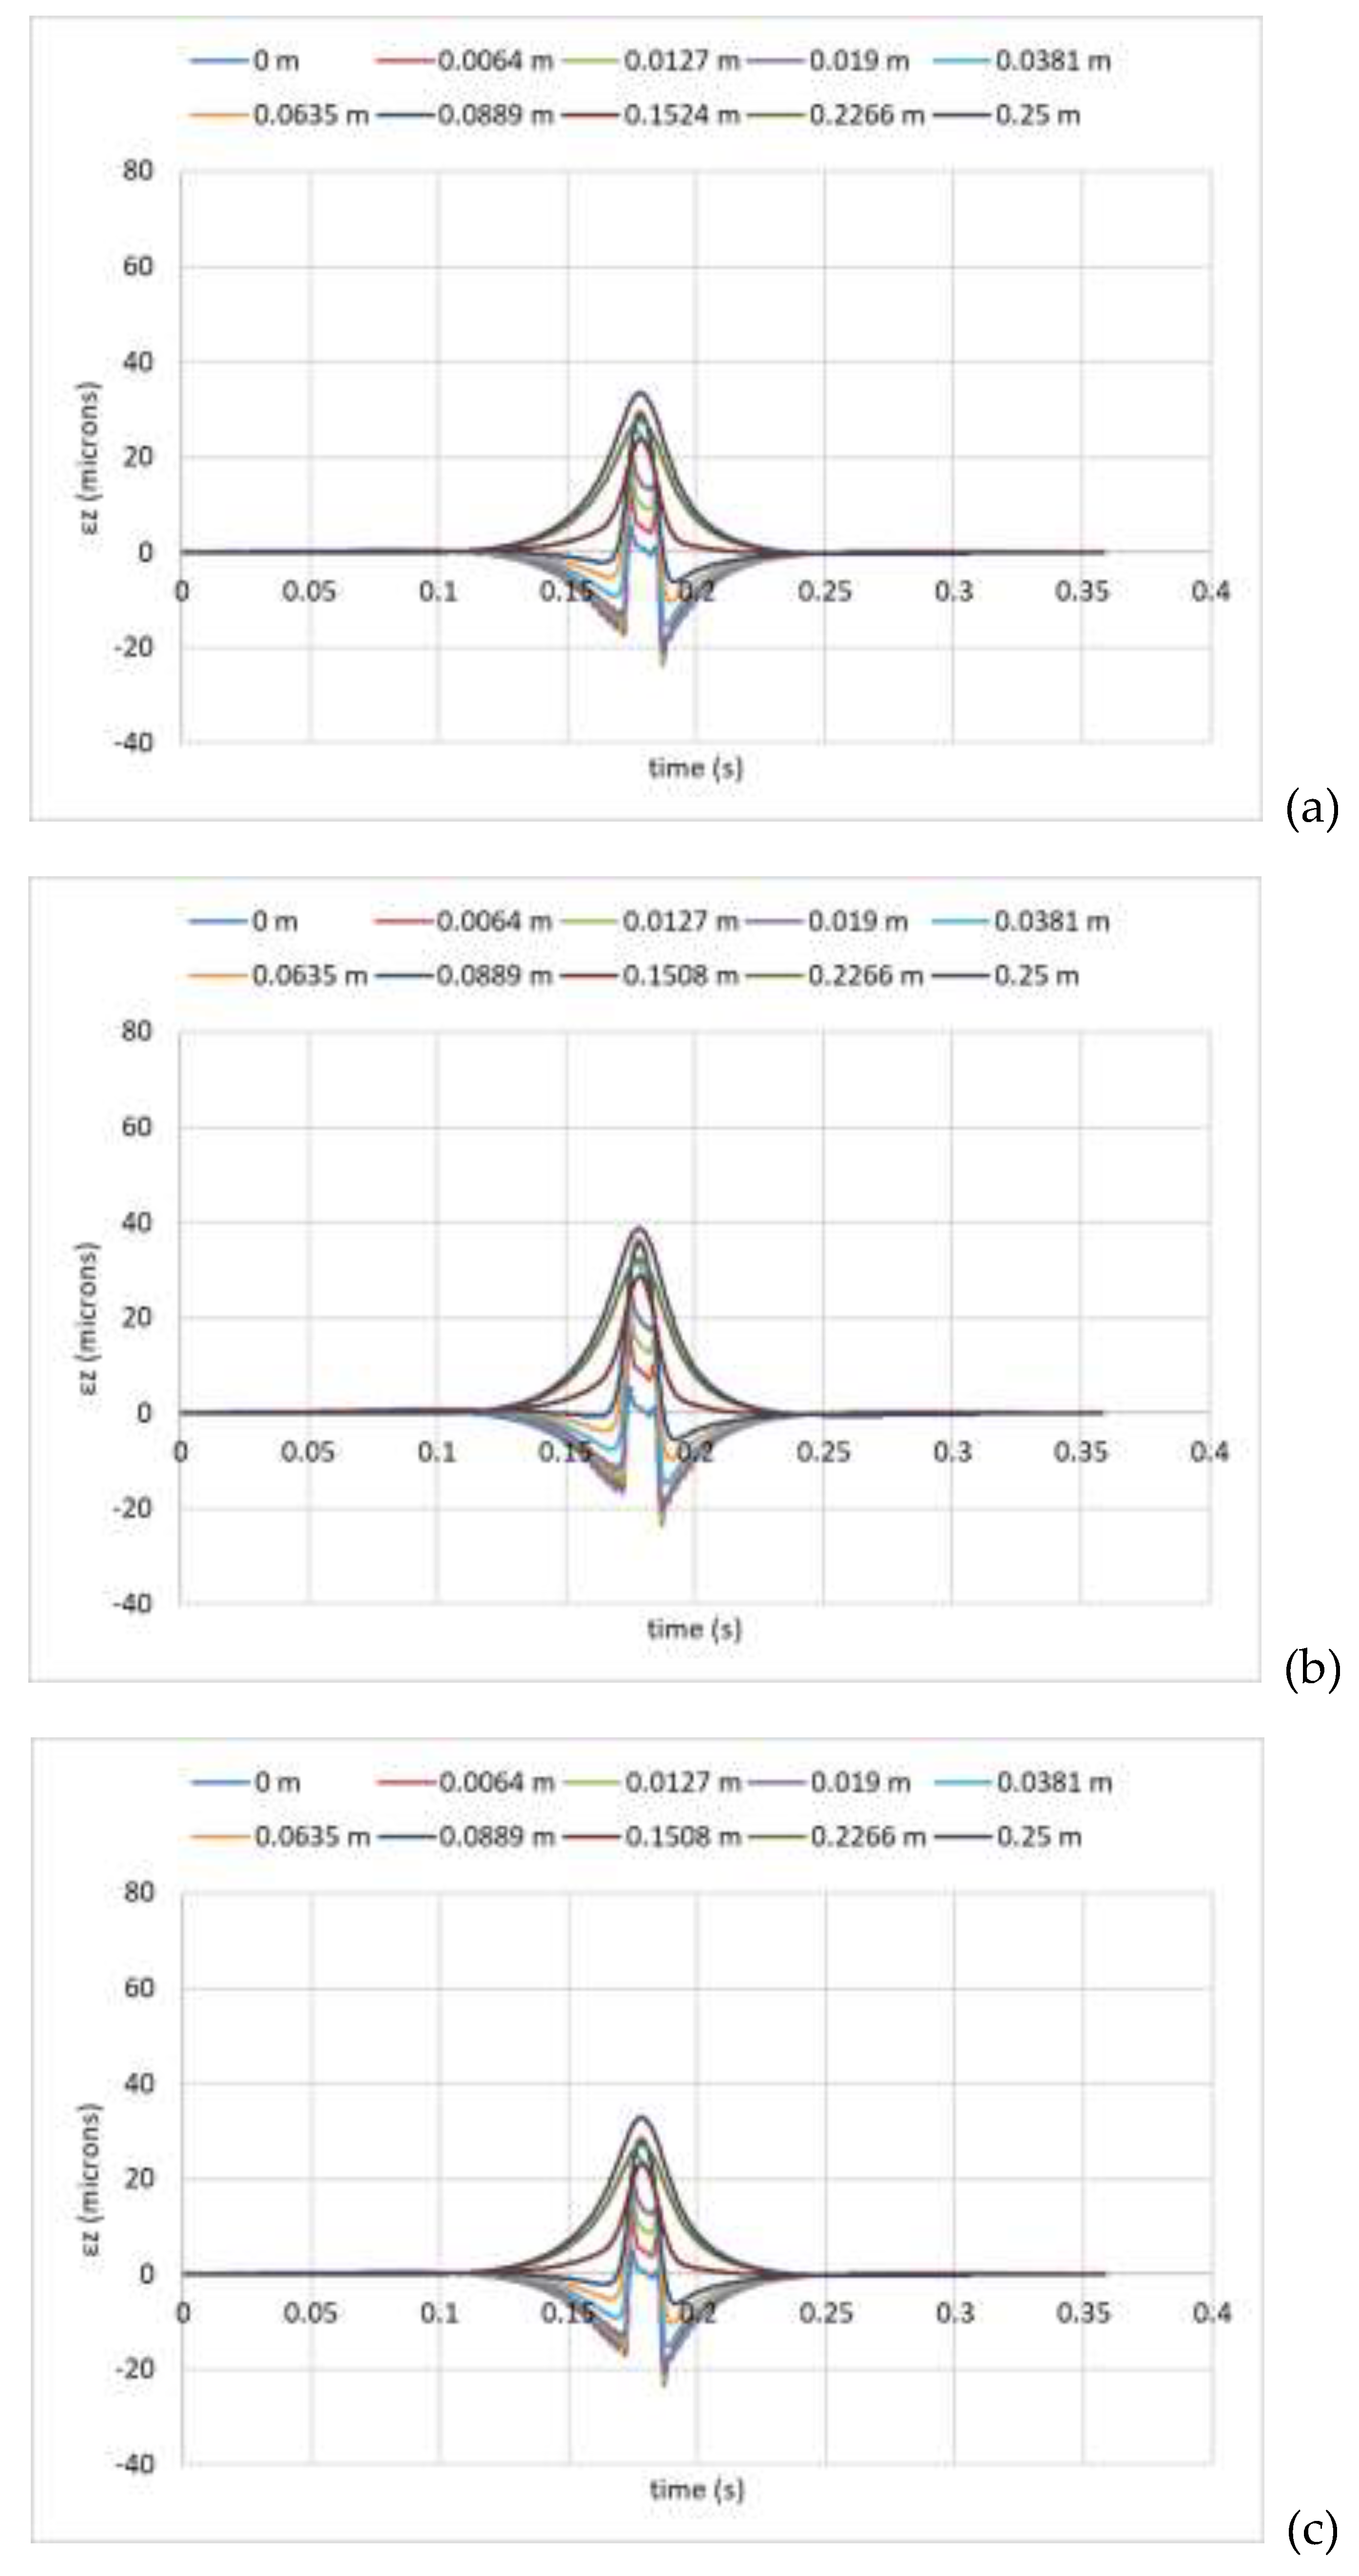
Figure 8.
Vertical strains in asphalt layer, moving load at 80km/h, h1=14 cm, (a) E*lab (b) E*1-37A, (c)E*GR.
Figure 8.
Vertical strains in asphalt layer, moving load at 80km/h, h1=14 cm, (a) E*lab (b) E*1-37A, (c)E*GR.
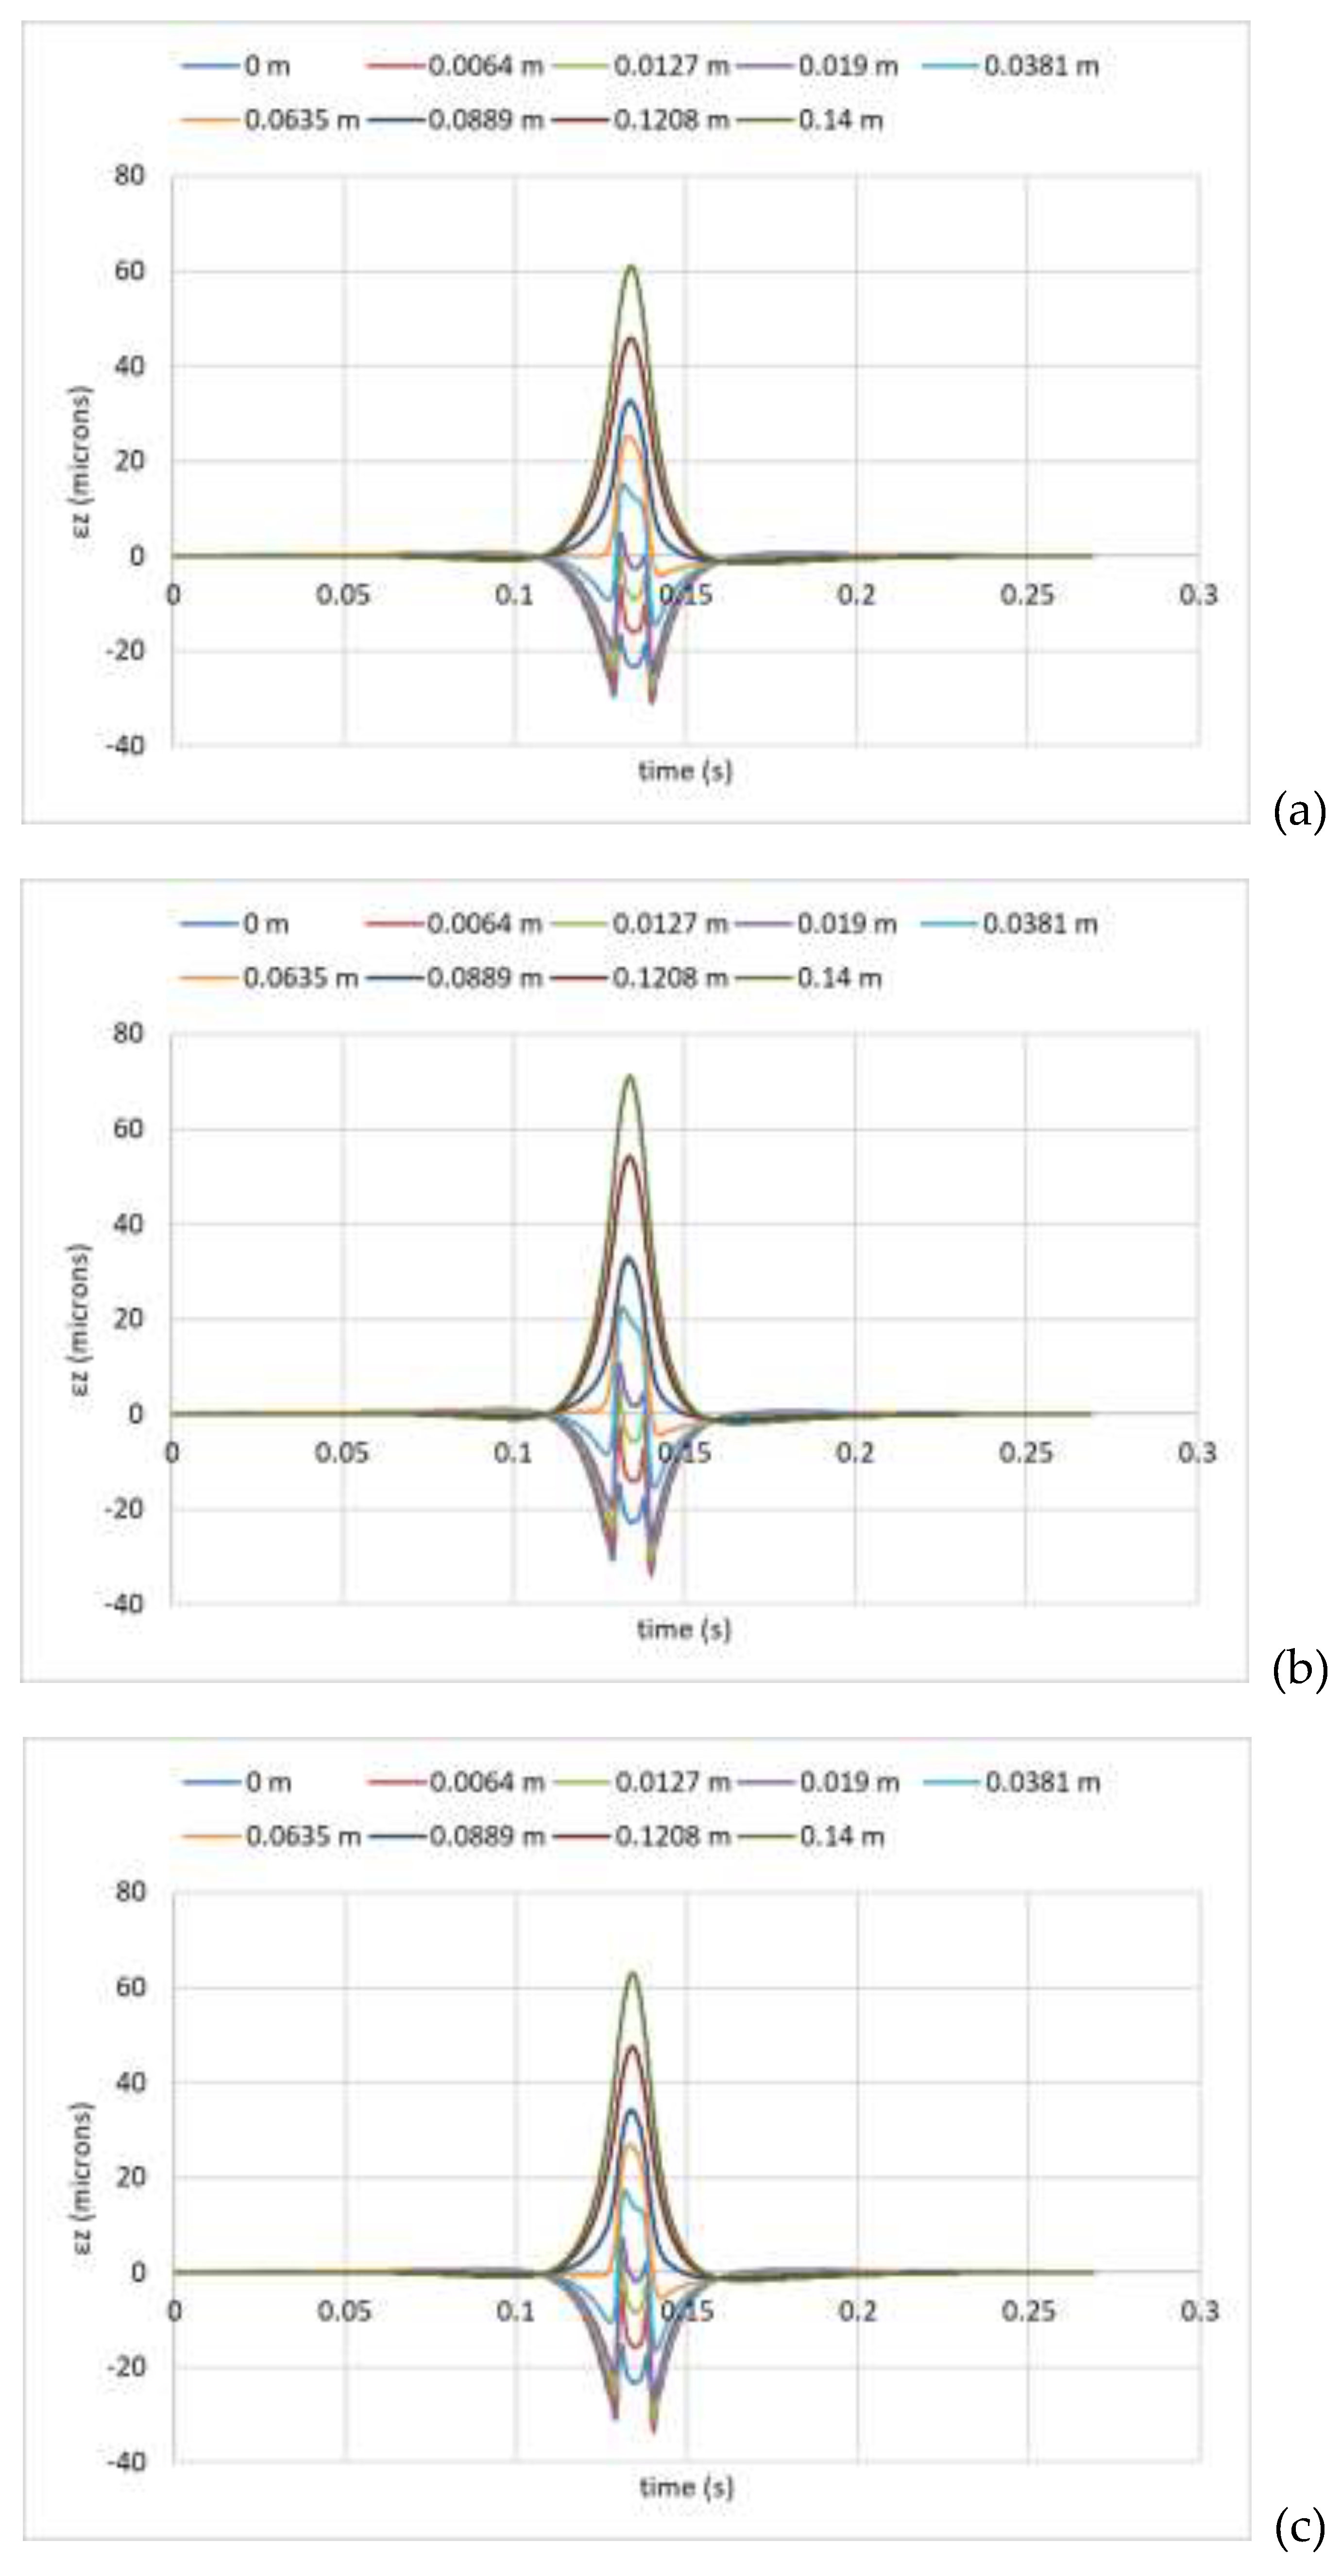
Figure 9.
Vertical strains in asphalt layer, moving load at 80km/h, h1=20 cm, (a) E*lab (b) E*1-37A, (c)E*GR.
Figure 9.
Vertical strains in asphalt layer, moving load at 80km/h, h1=20 cm, (a) E*lab (b) E*1-37A, (c)E*GR.
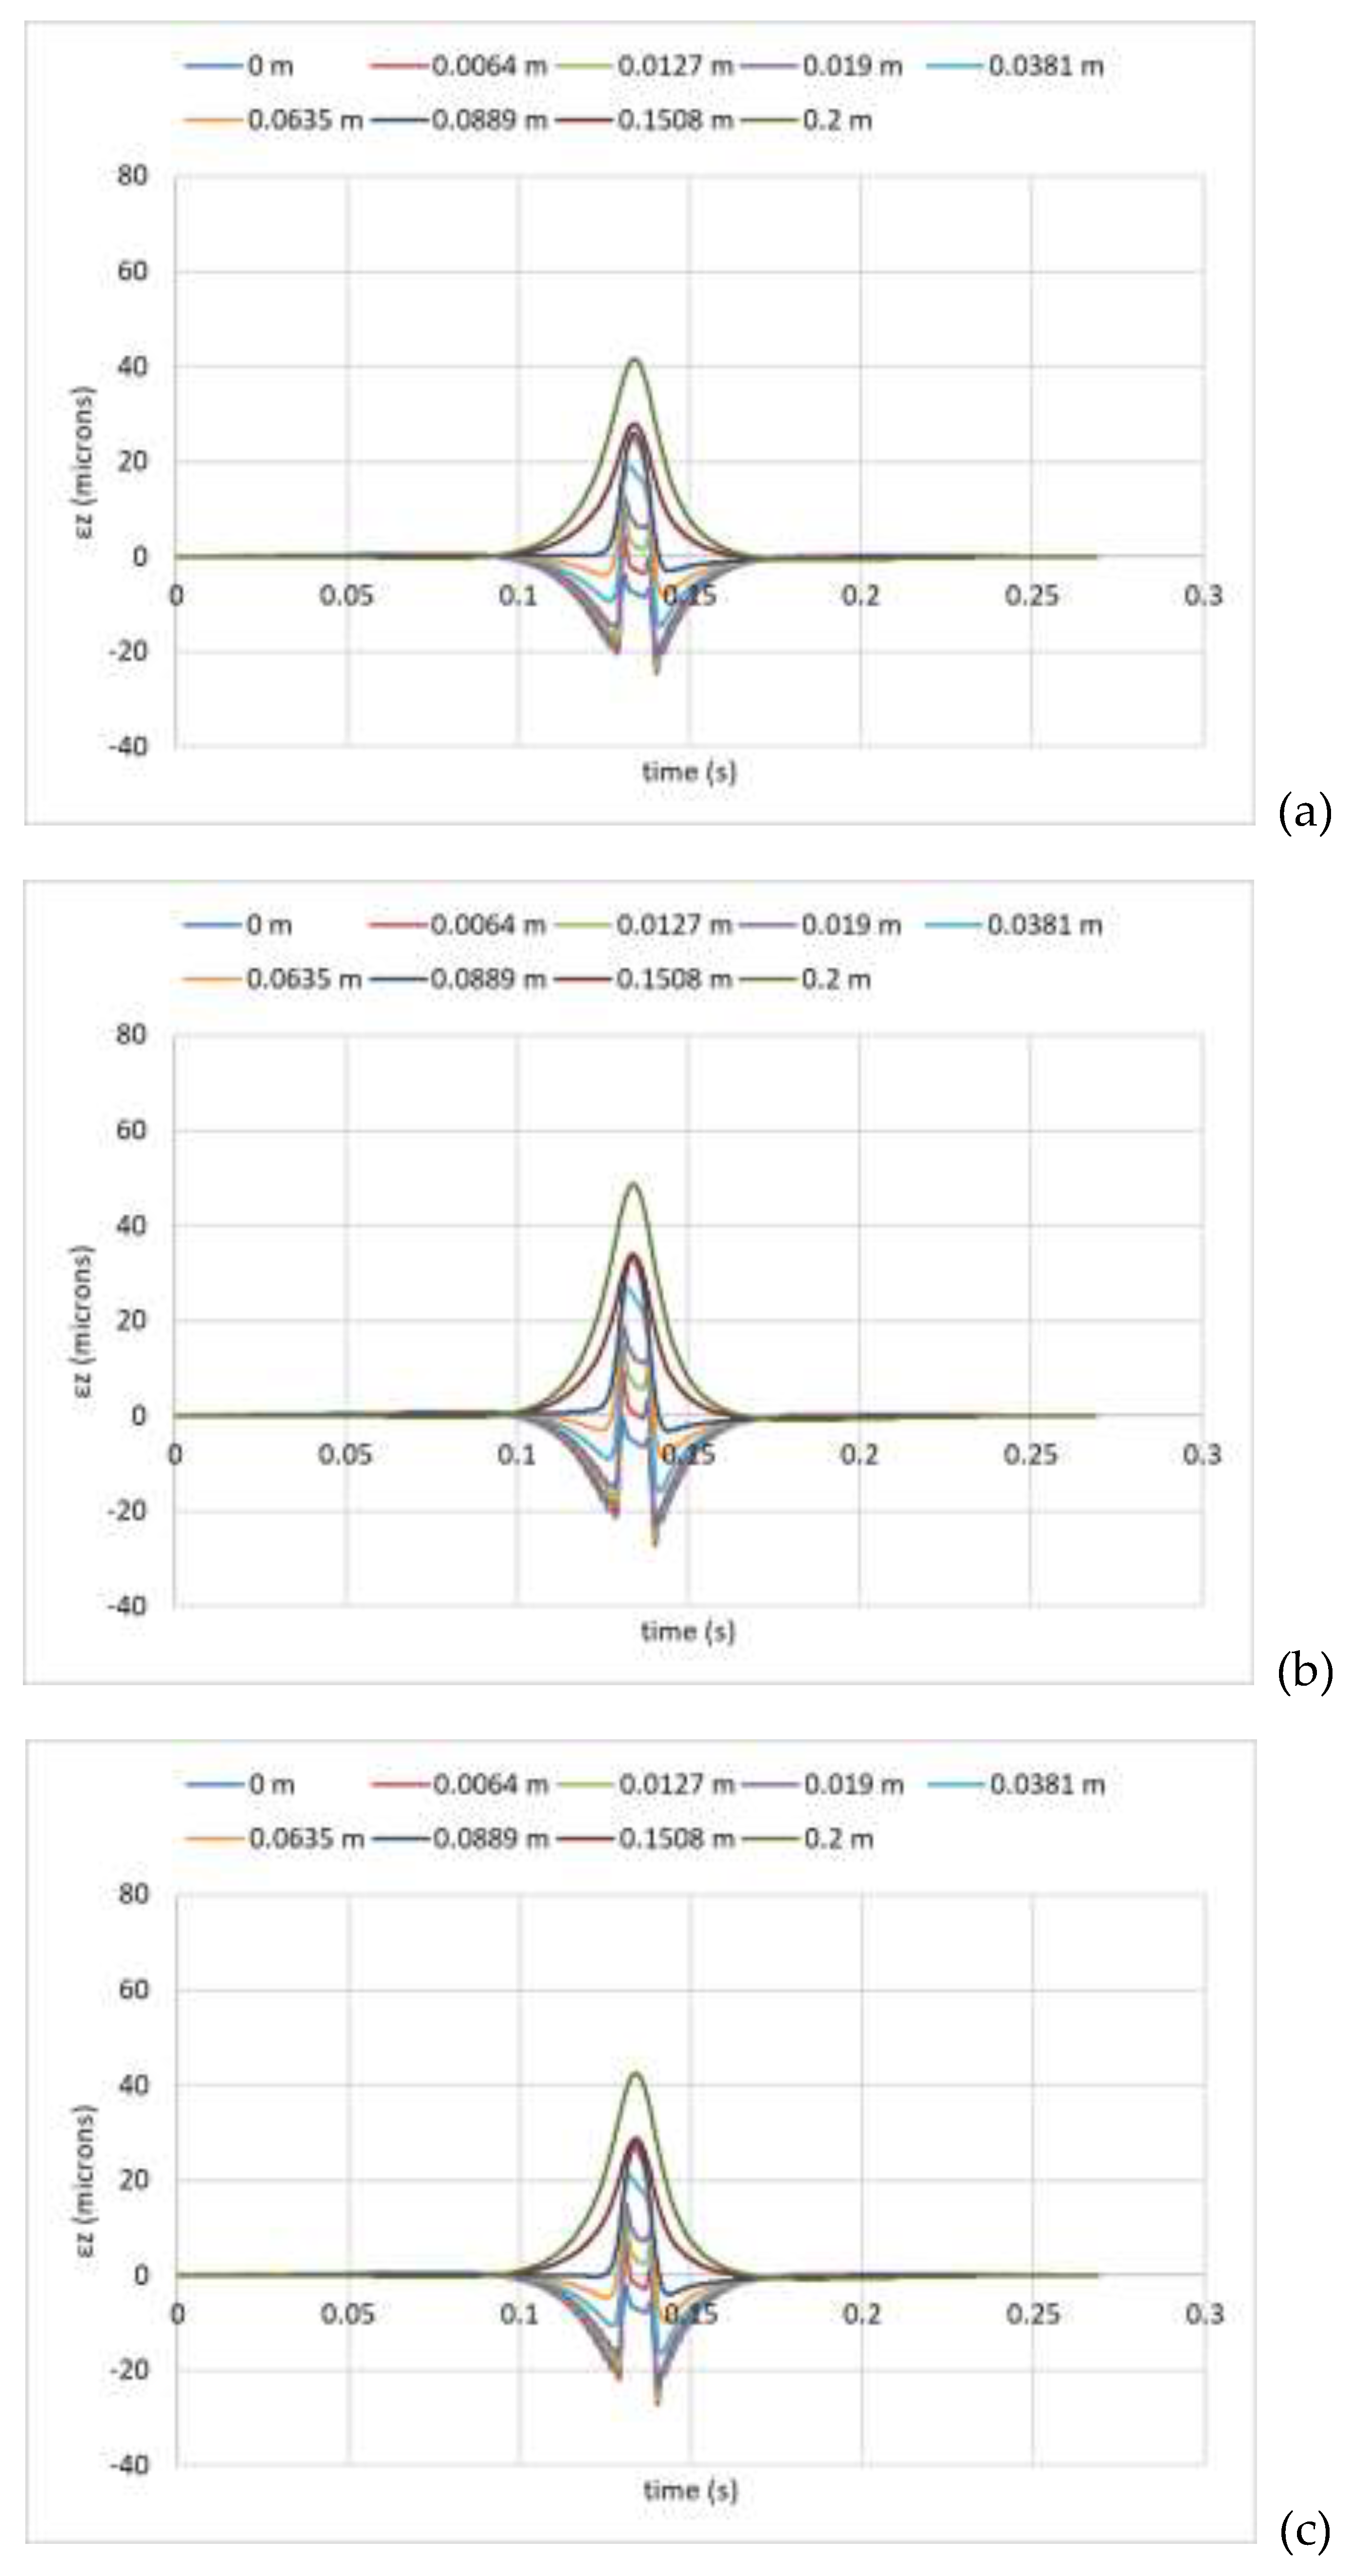
Figure 10.
Vertical strains in asphalt layer, moving load at 80km/h, h1=25 cm, (a) E*lab (b) E*1-37A, (c)E*GR.
Figure 10.
Vertical strains in asphalt layer, moving load at 80km/h, h1=25 cm, (a) E*lab (b) E*1-37A, (c)E*GR.
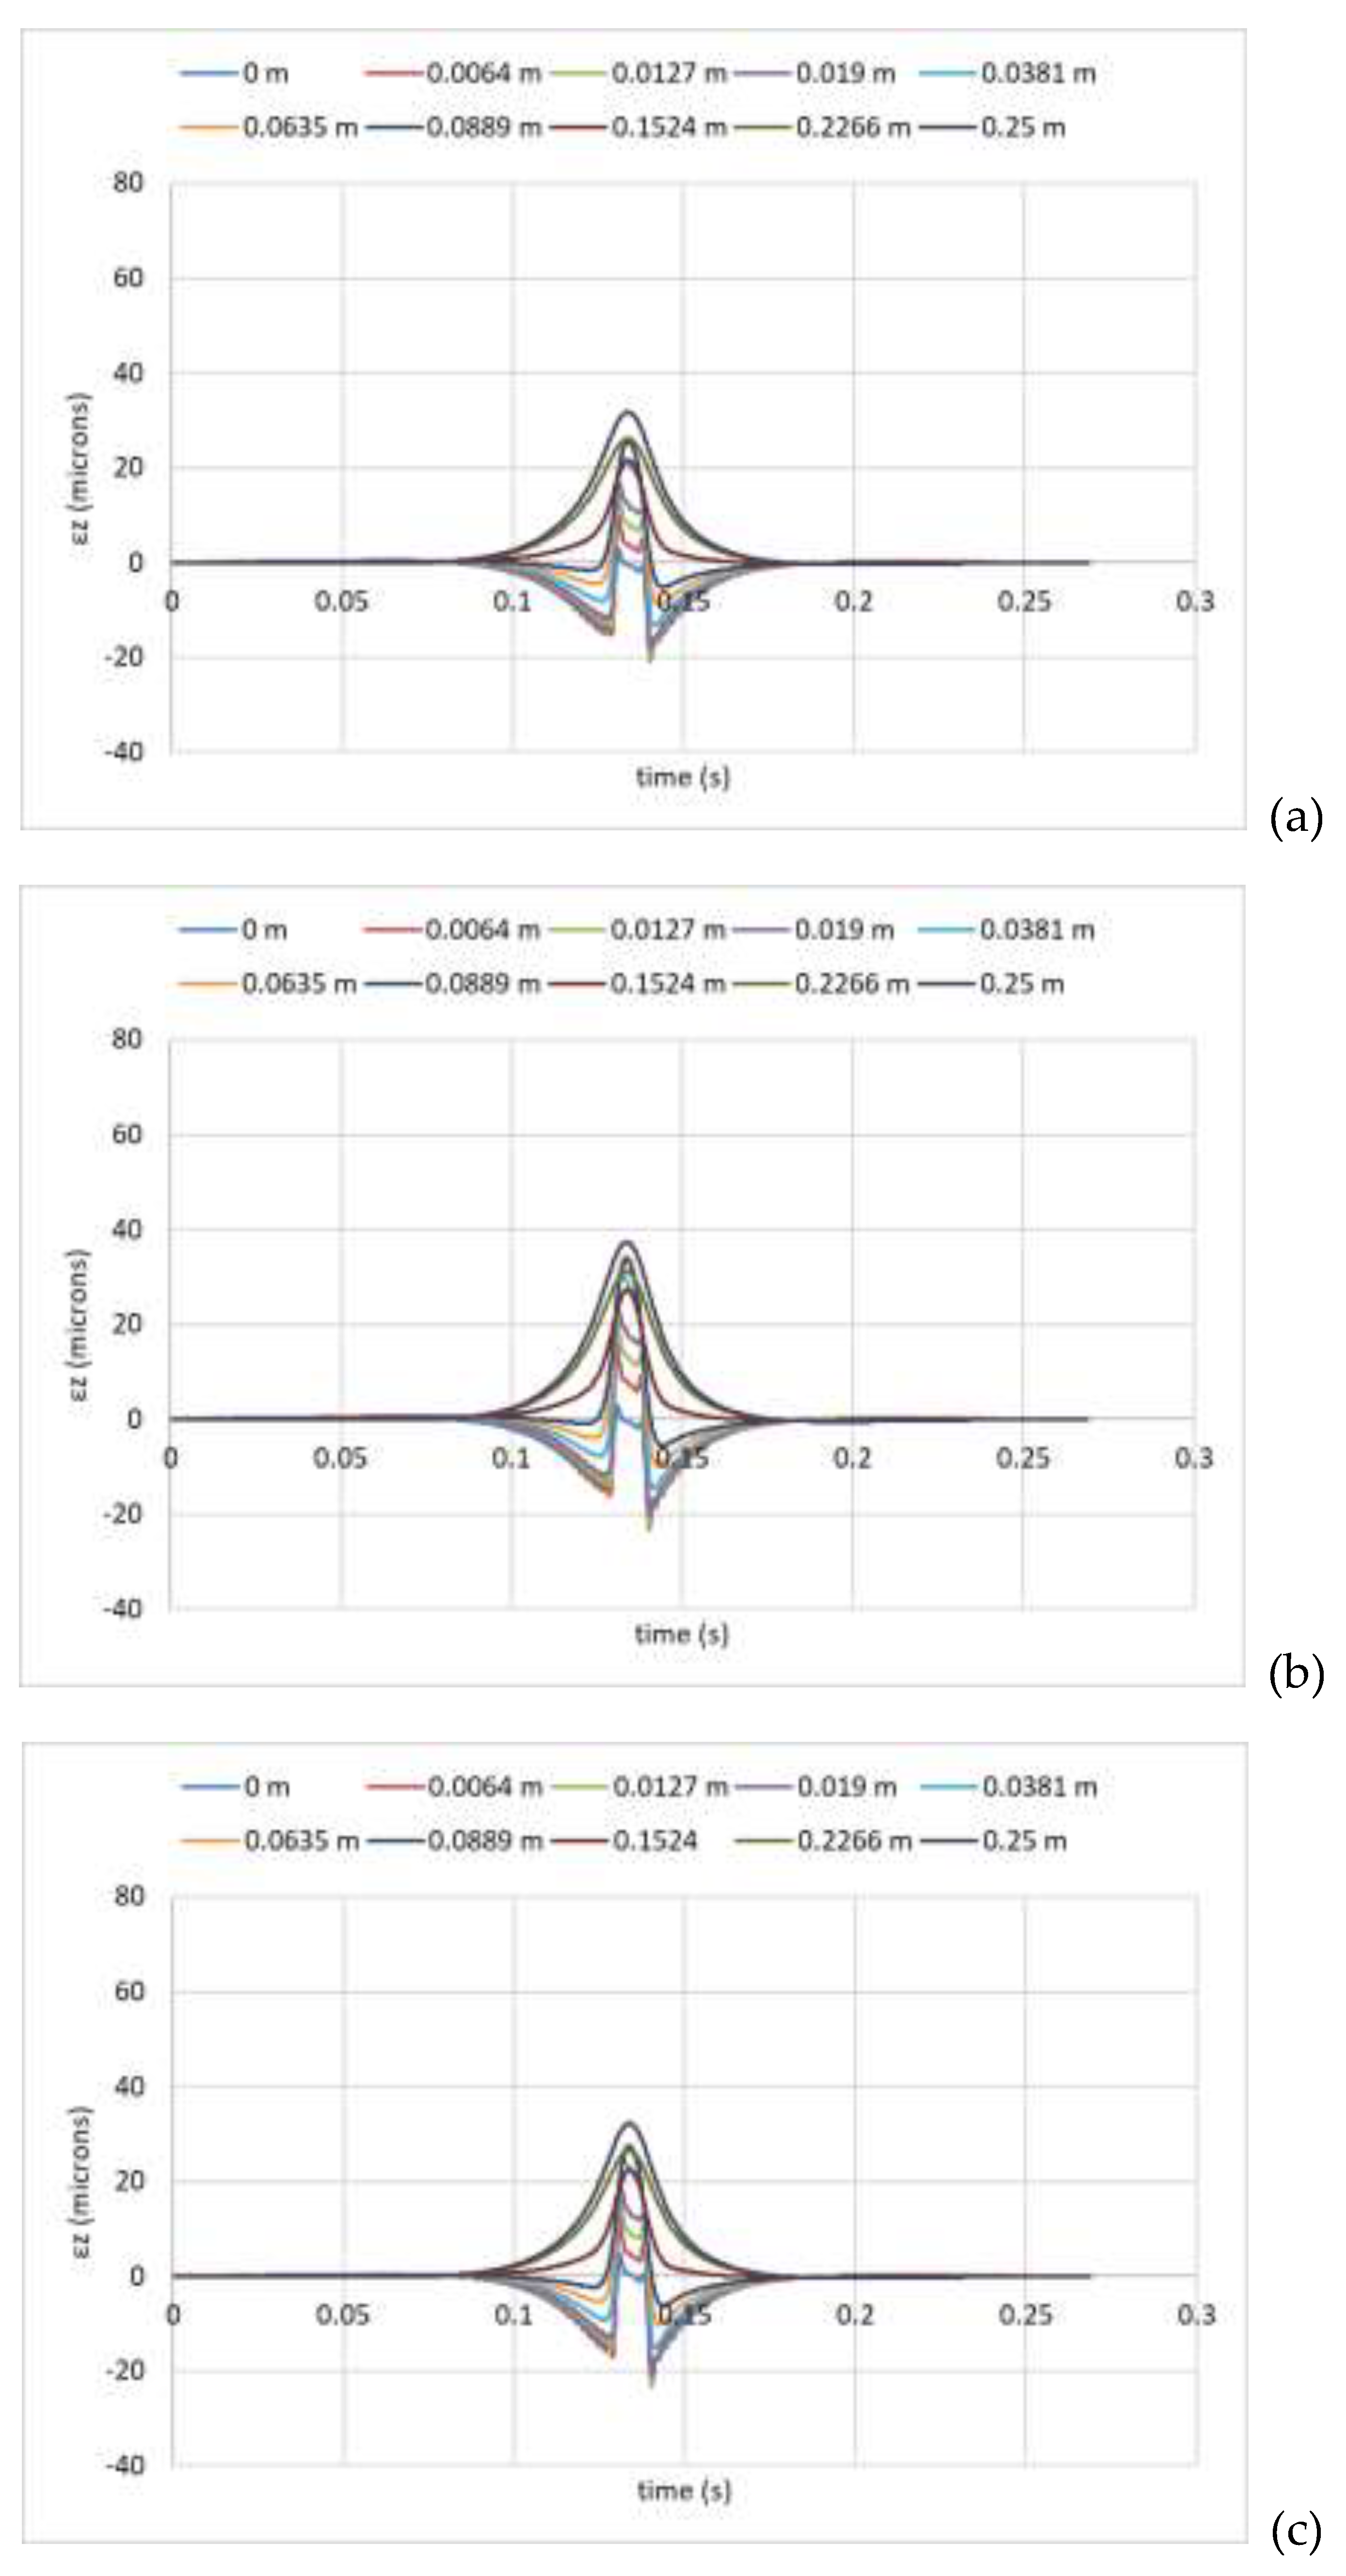
Figure 11.
Vertical strains developed at h1=0.14m.
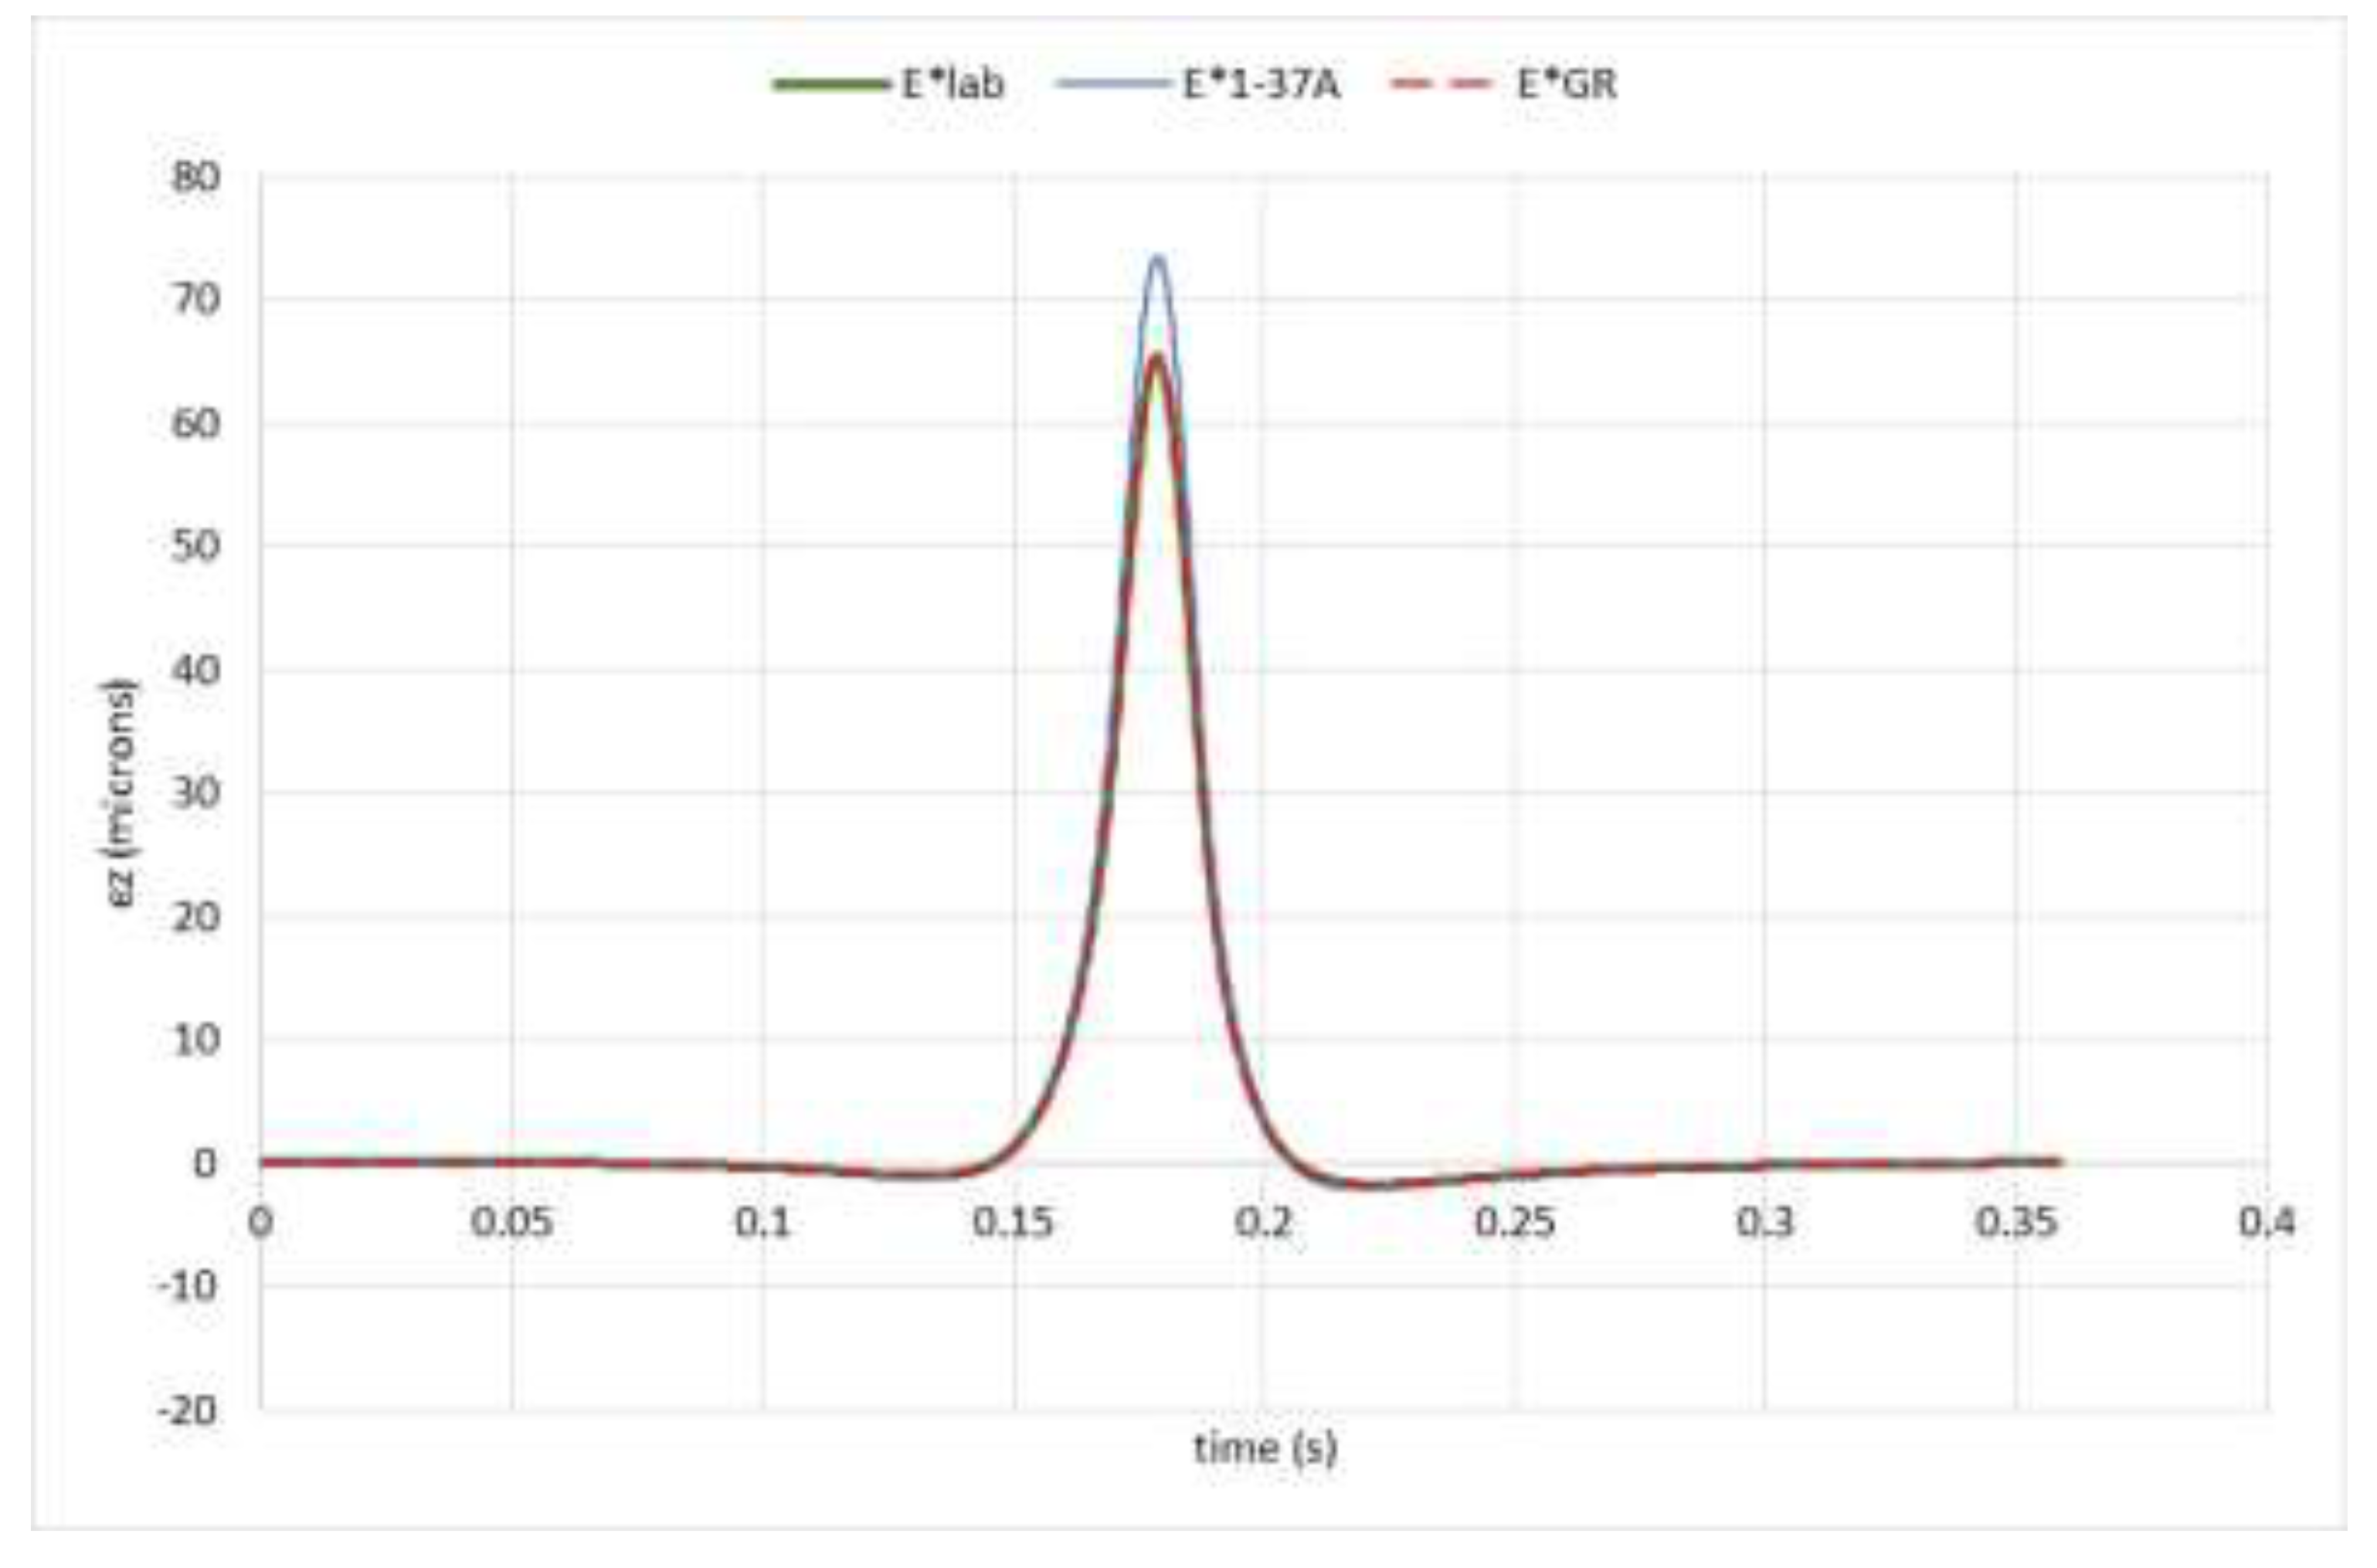
Figure 12.
Vertical strains developed at h1=0.20m.
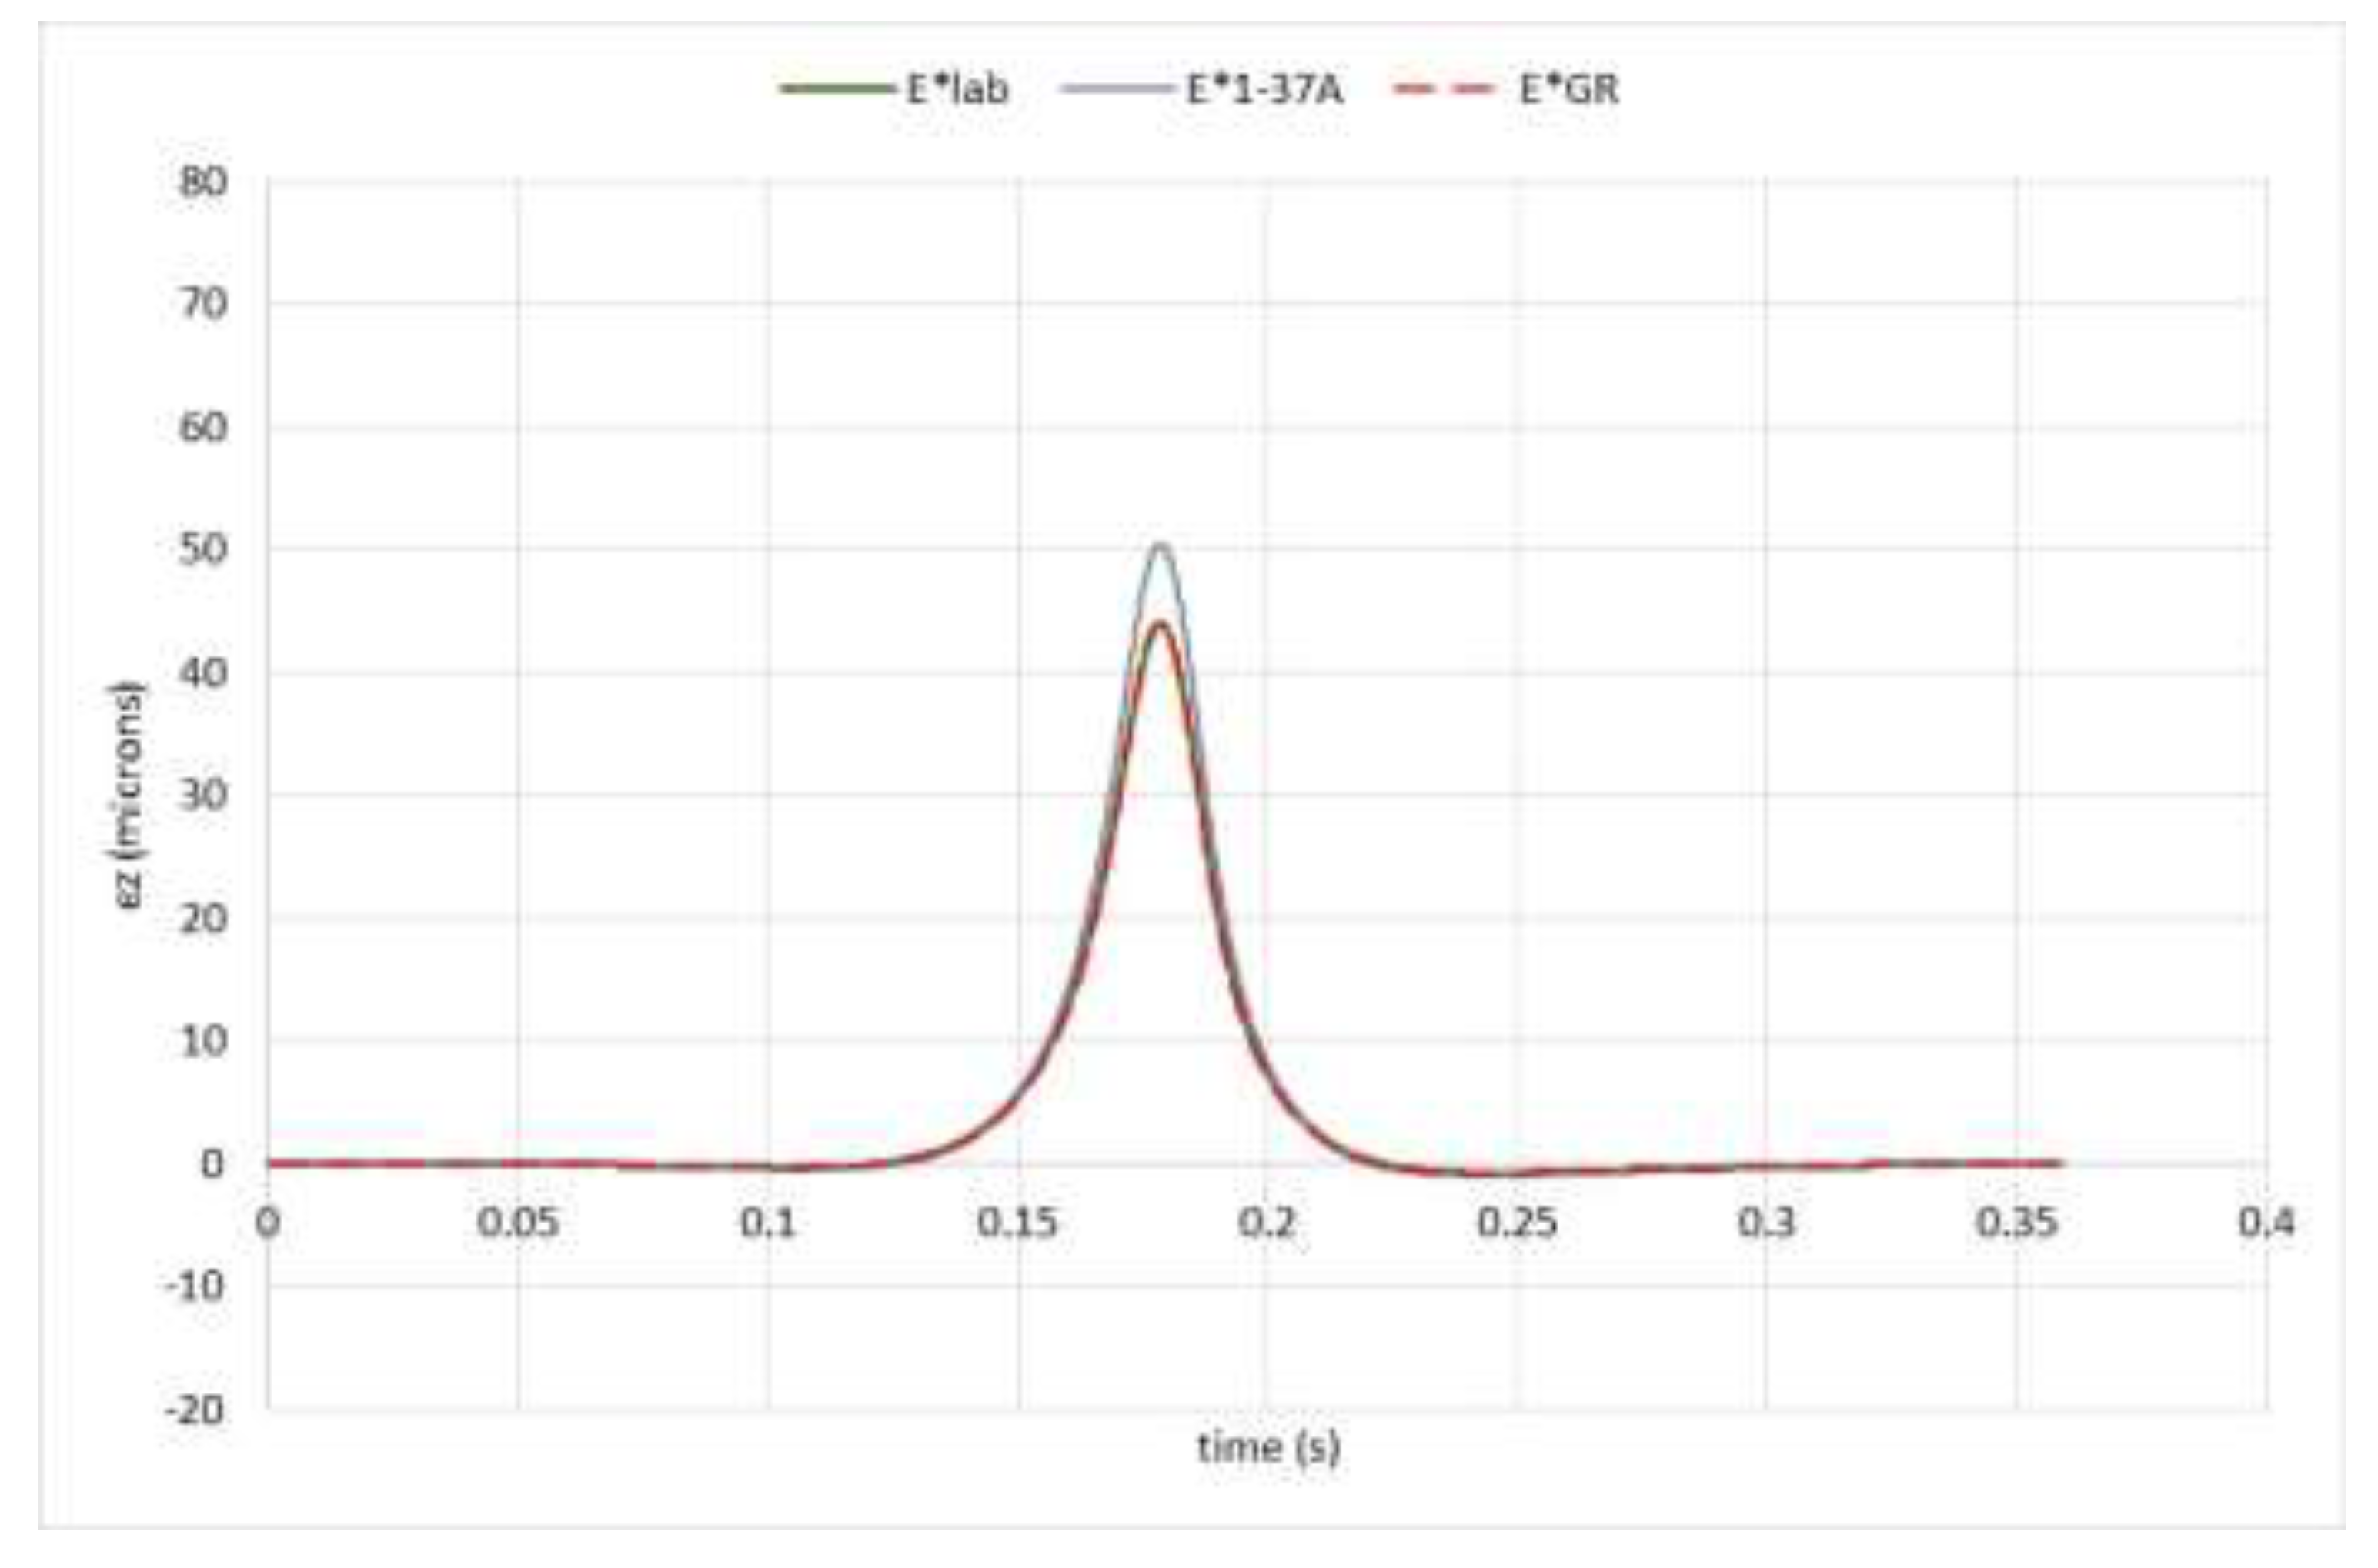
Figure 13.
Vertical strains developed at h1=0.25m.
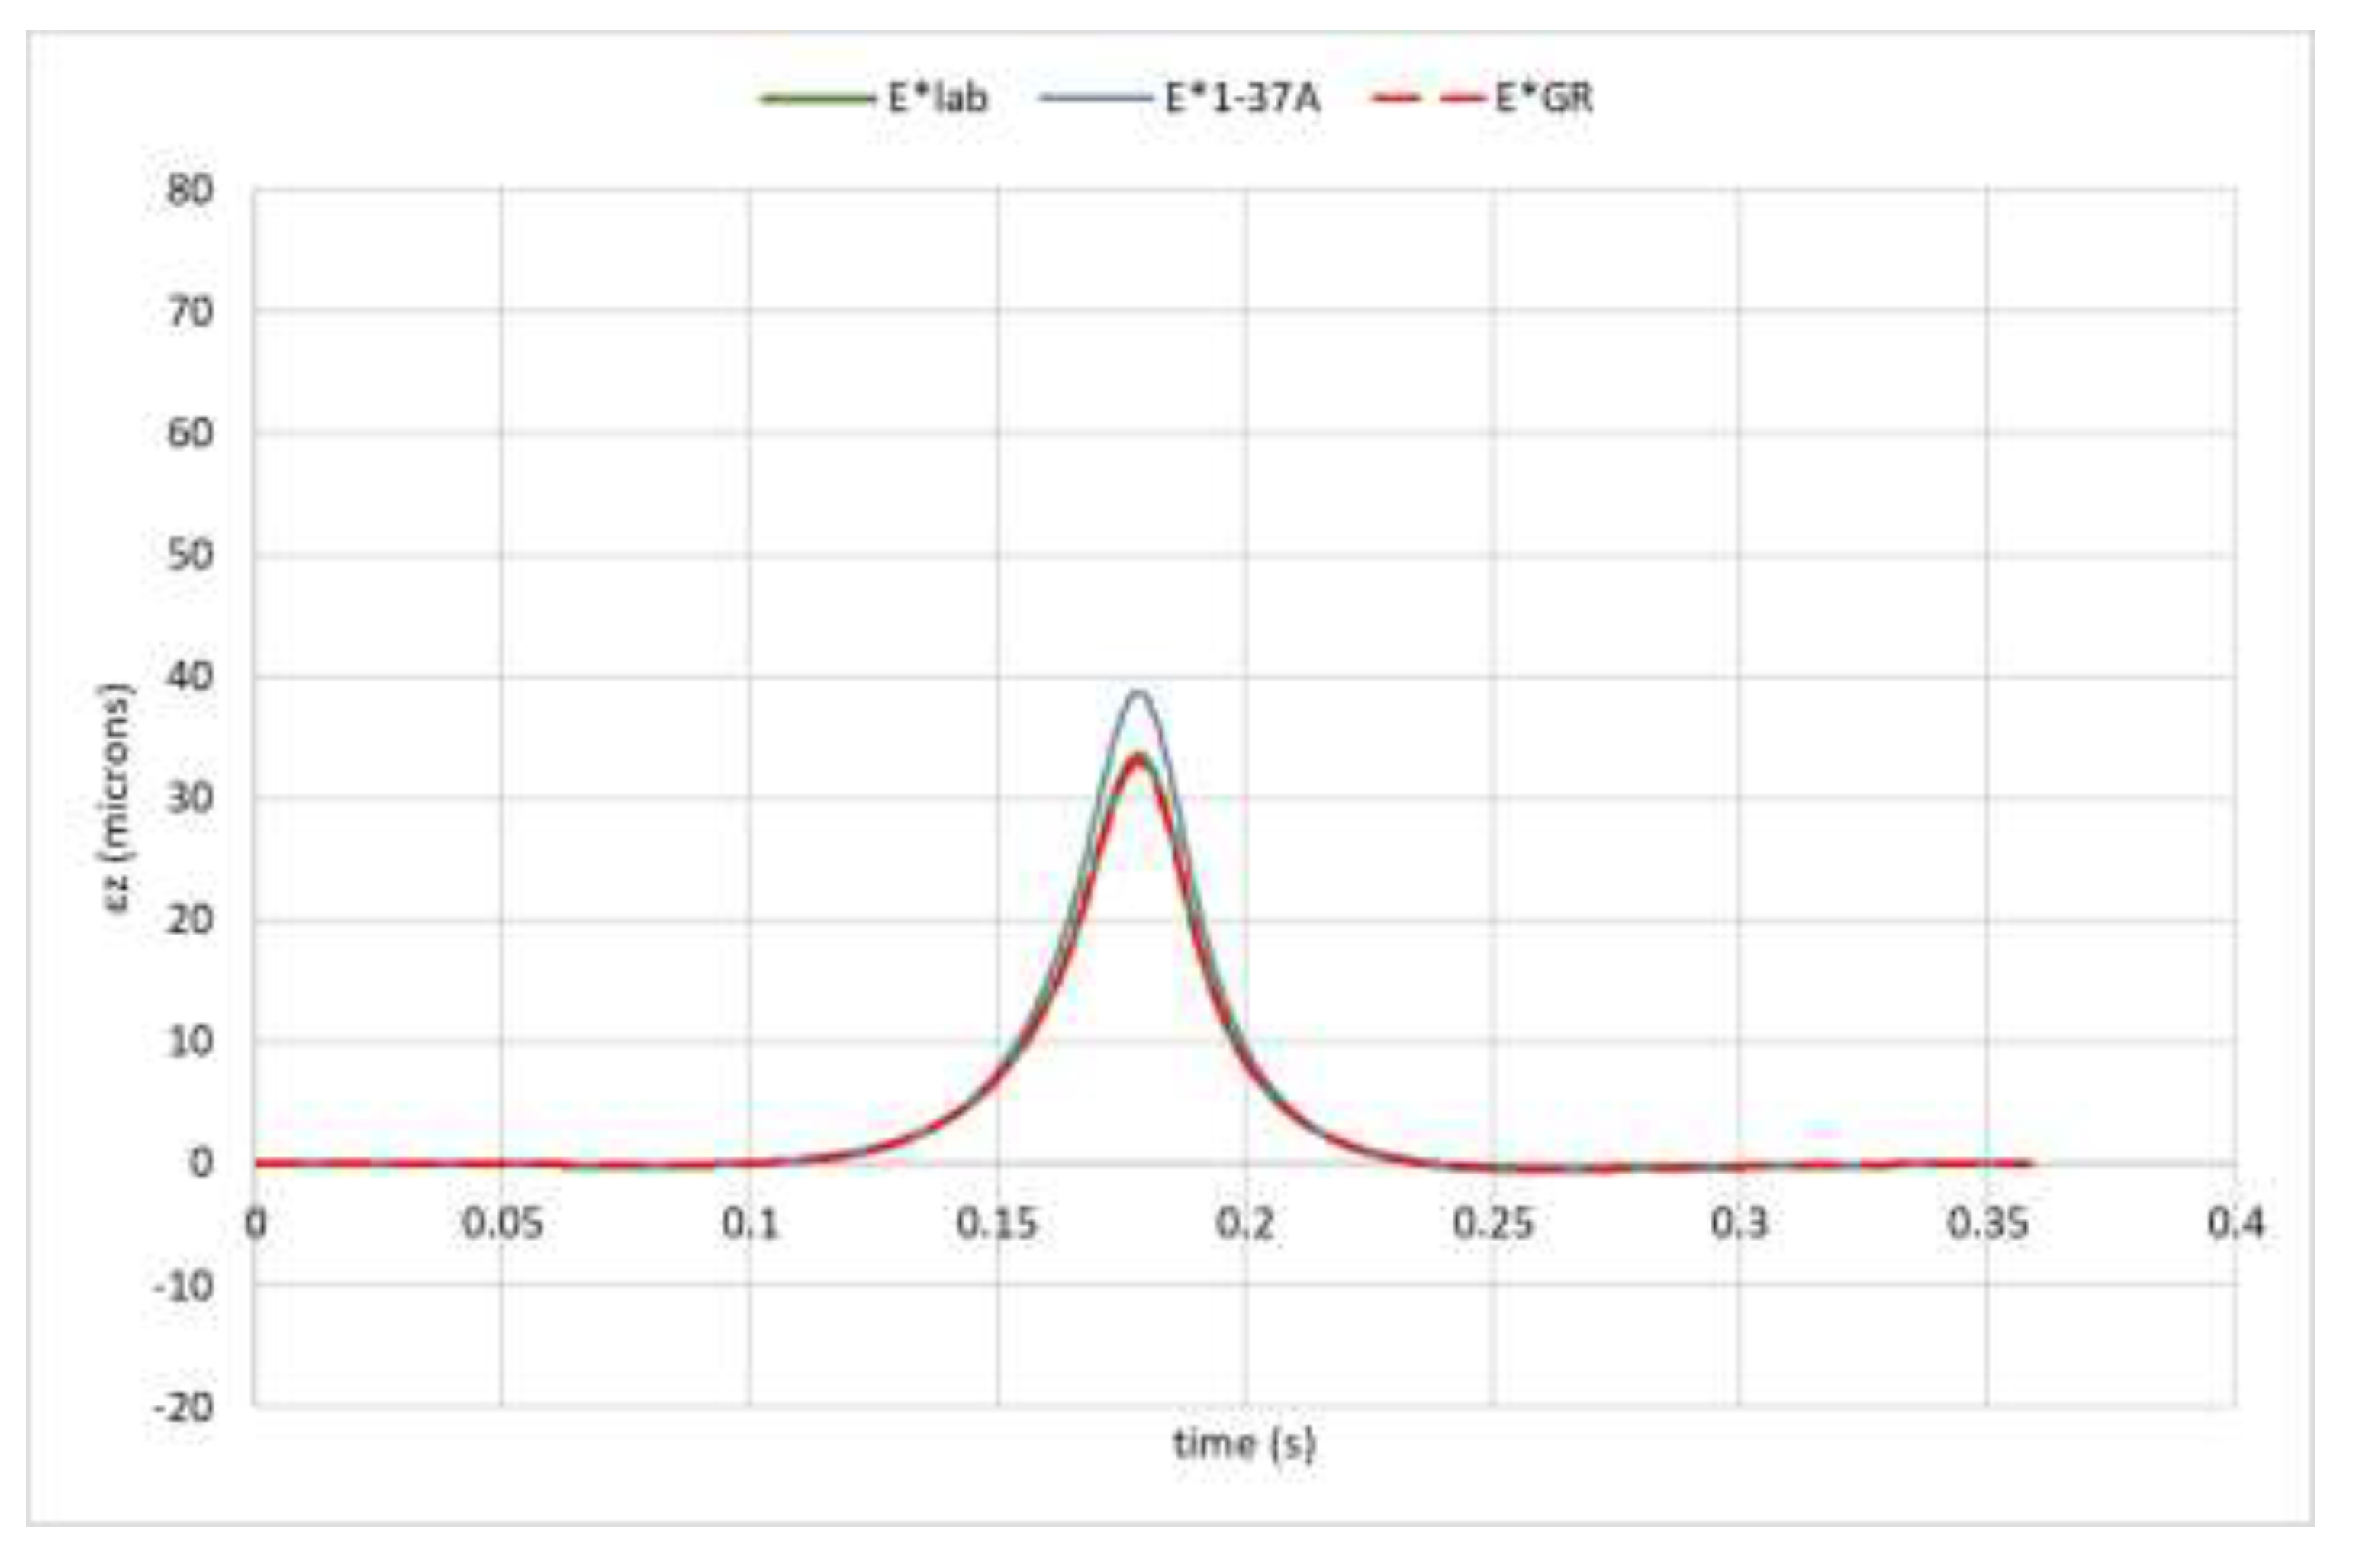
Figure 14.
Percentage errors of calculated vertical strains - h1=14cm.
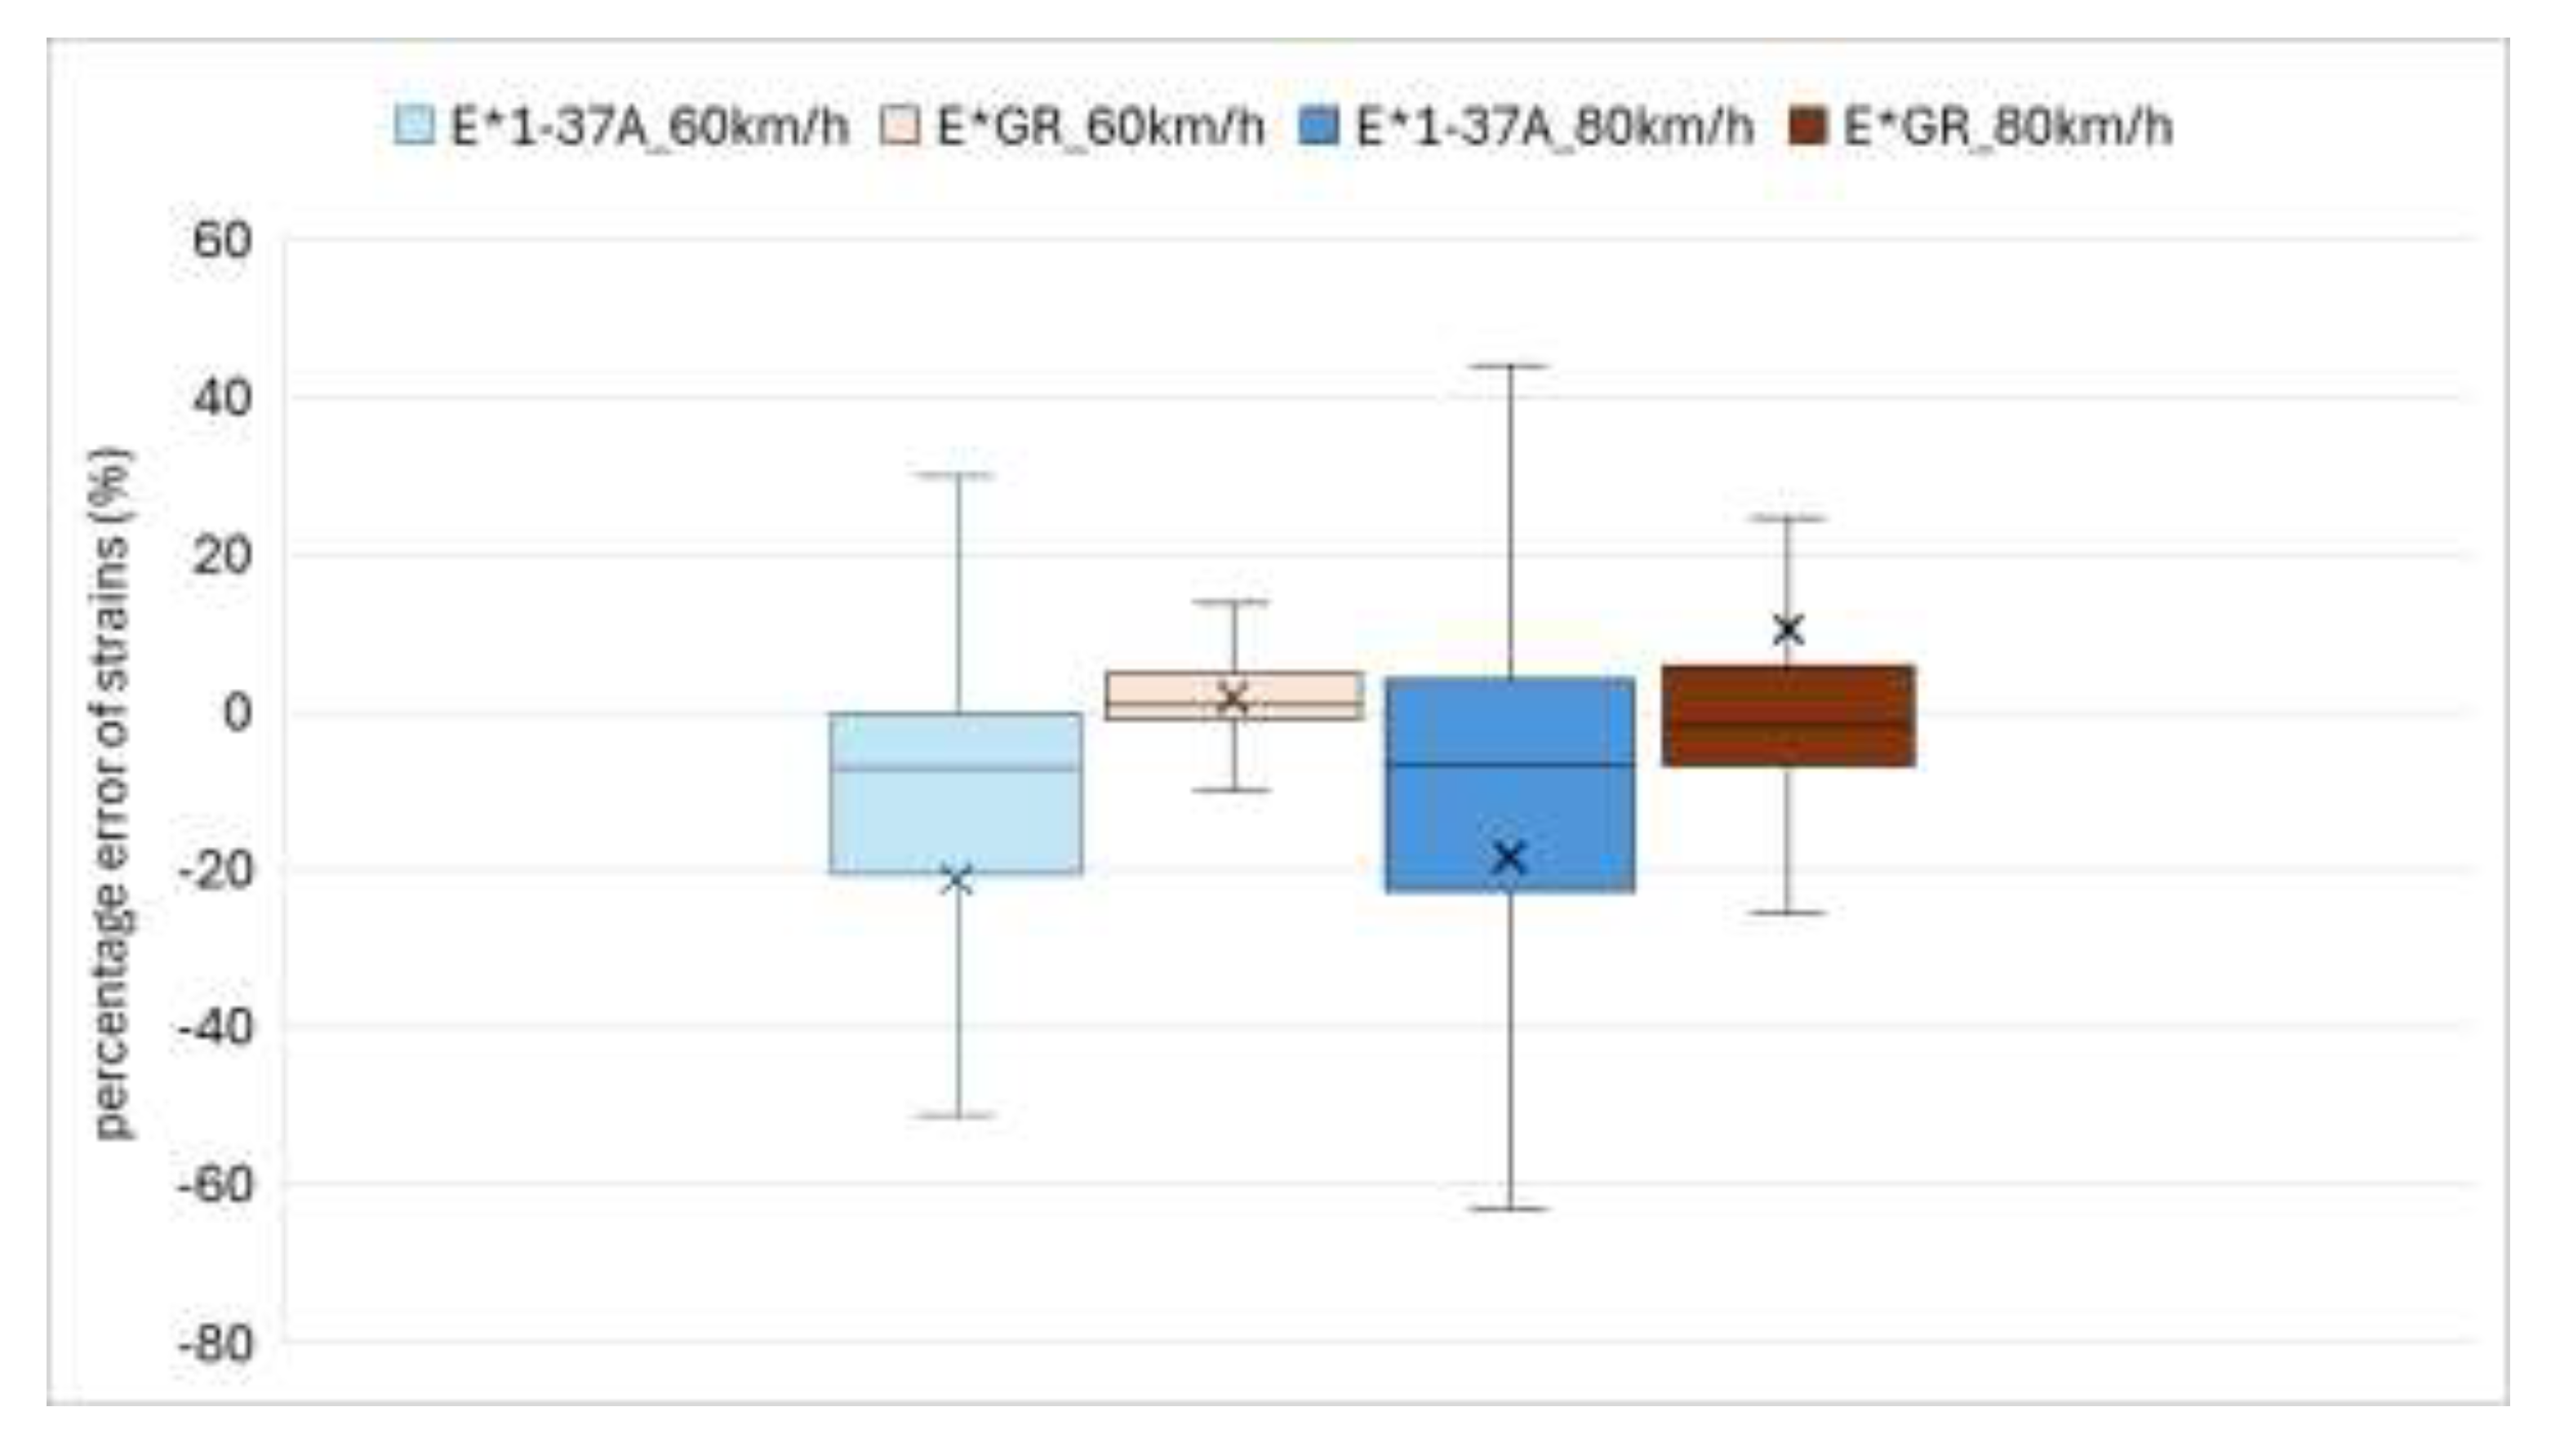
Figure 15.
Percentage errors of calculated vertical strains - h1=20cm.
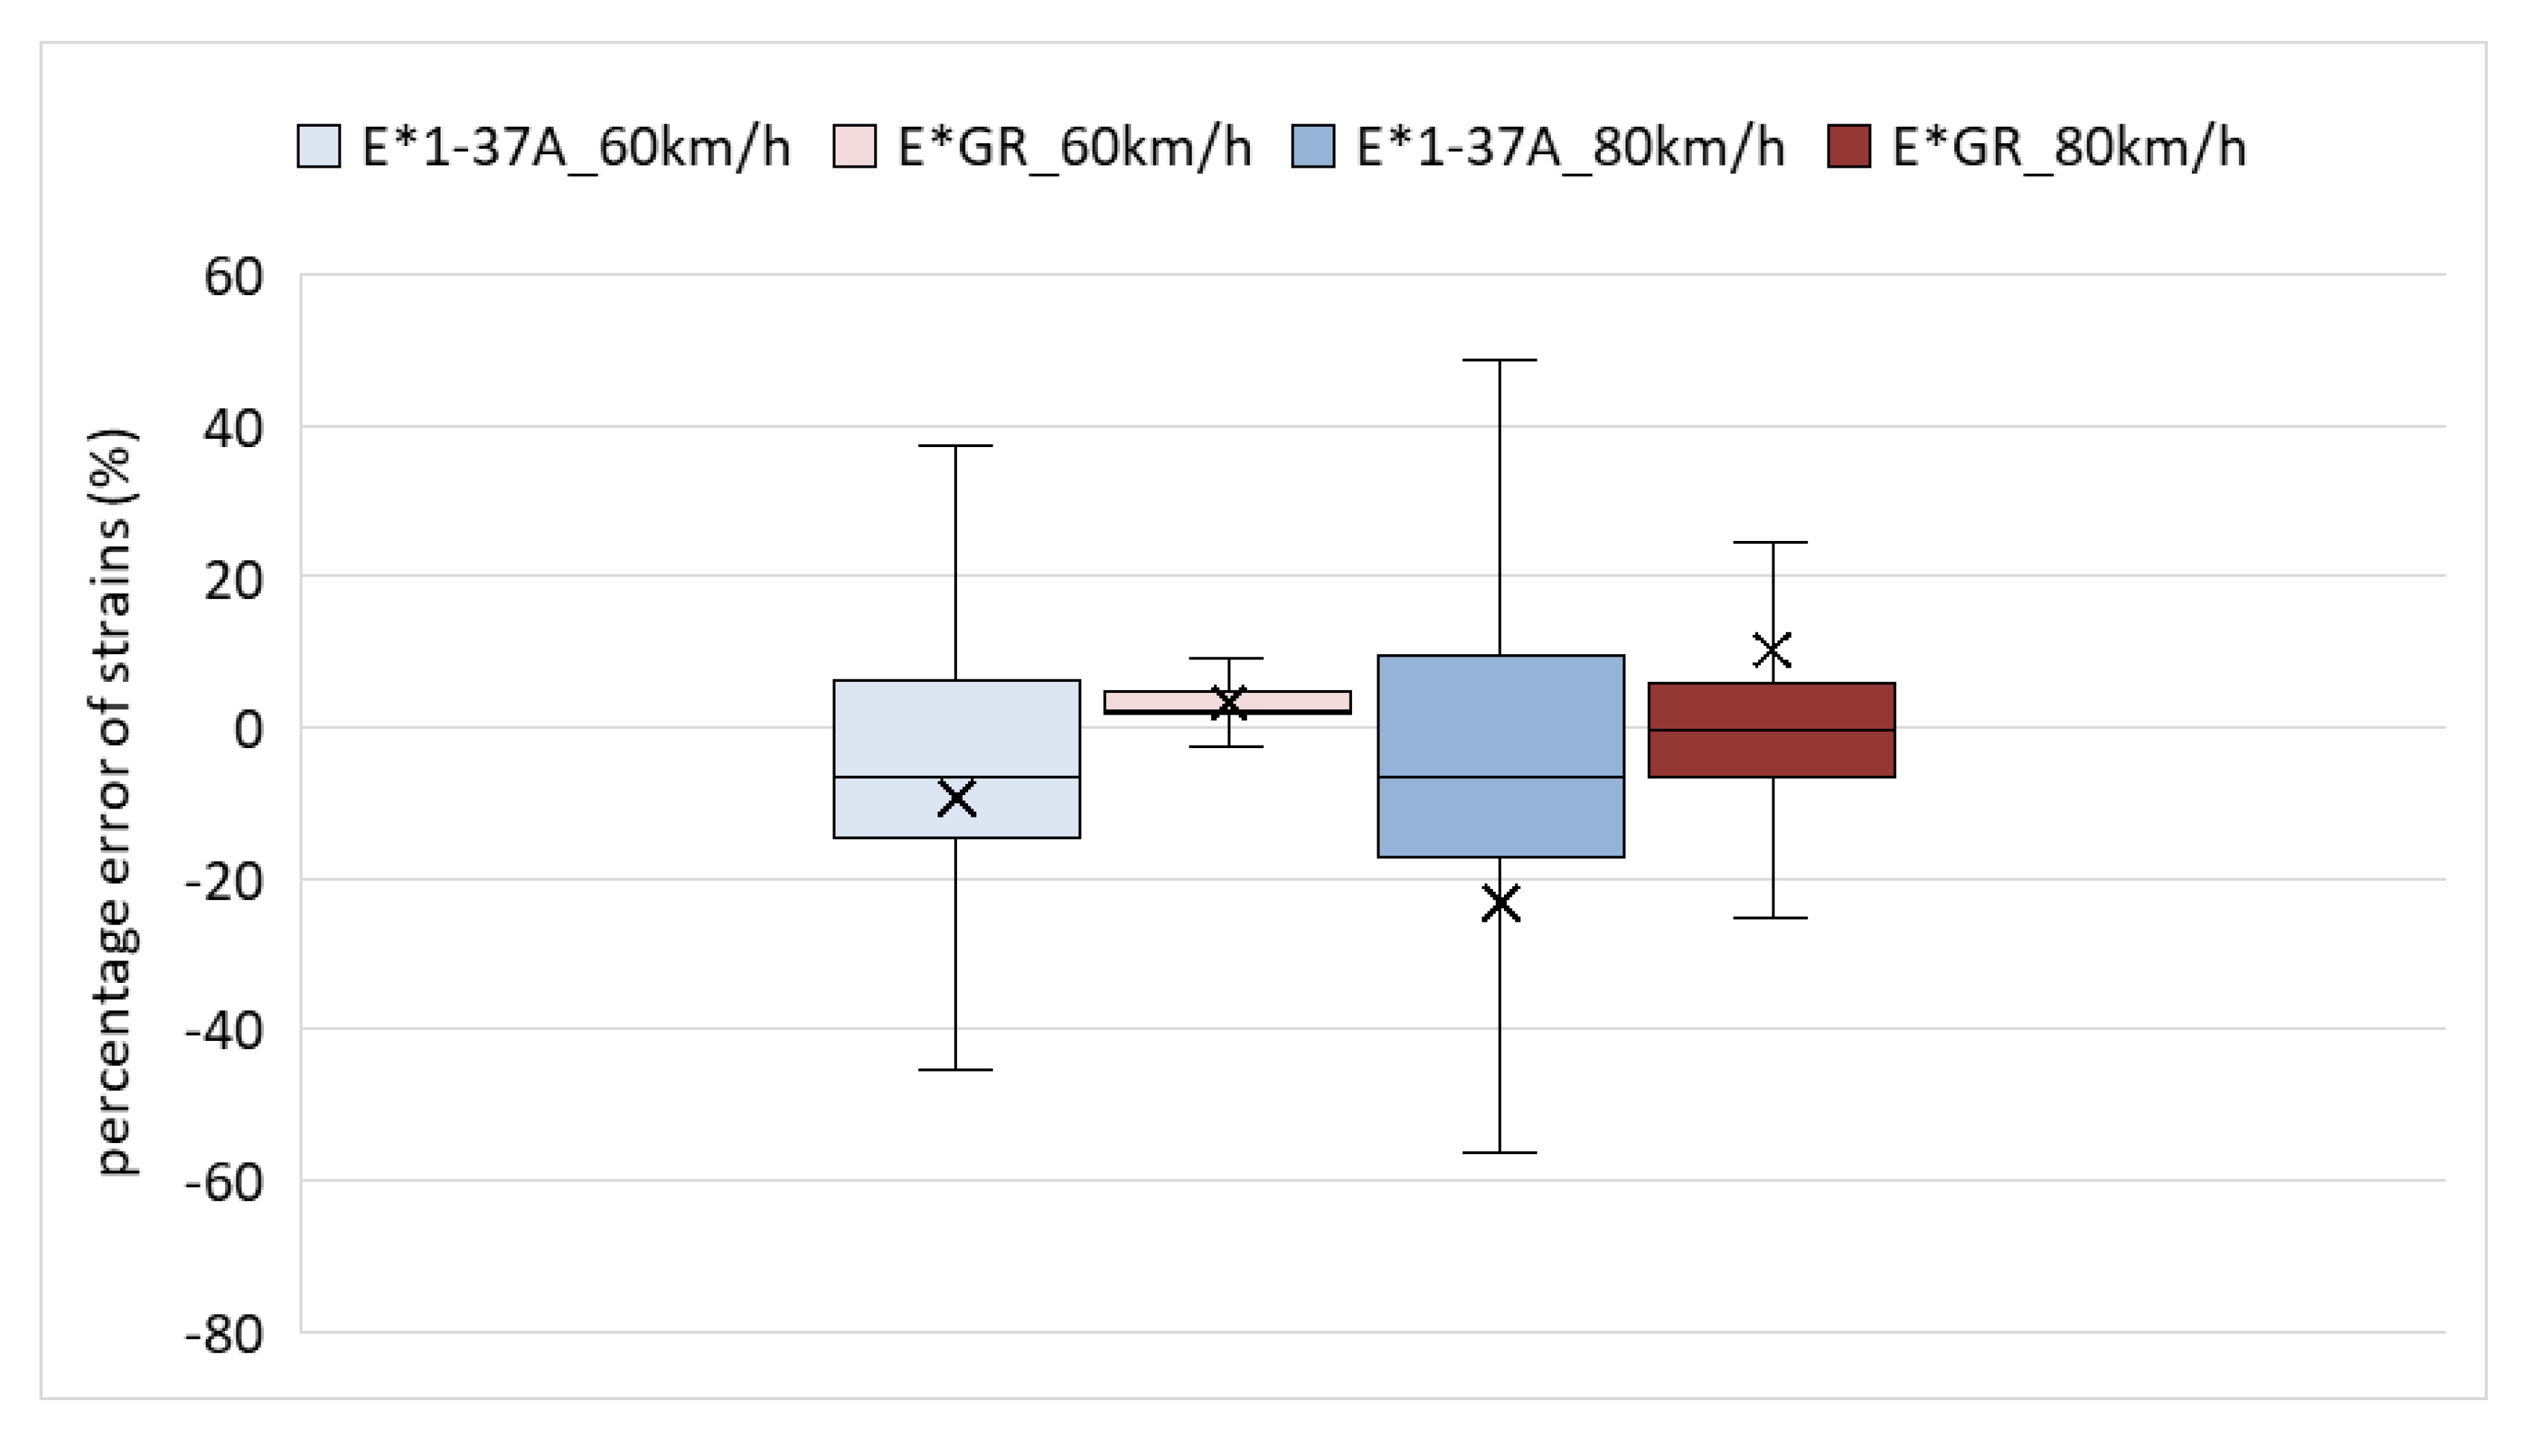
Figure 16.
Percentage errors of calculated vertical strains - h1=25cm.
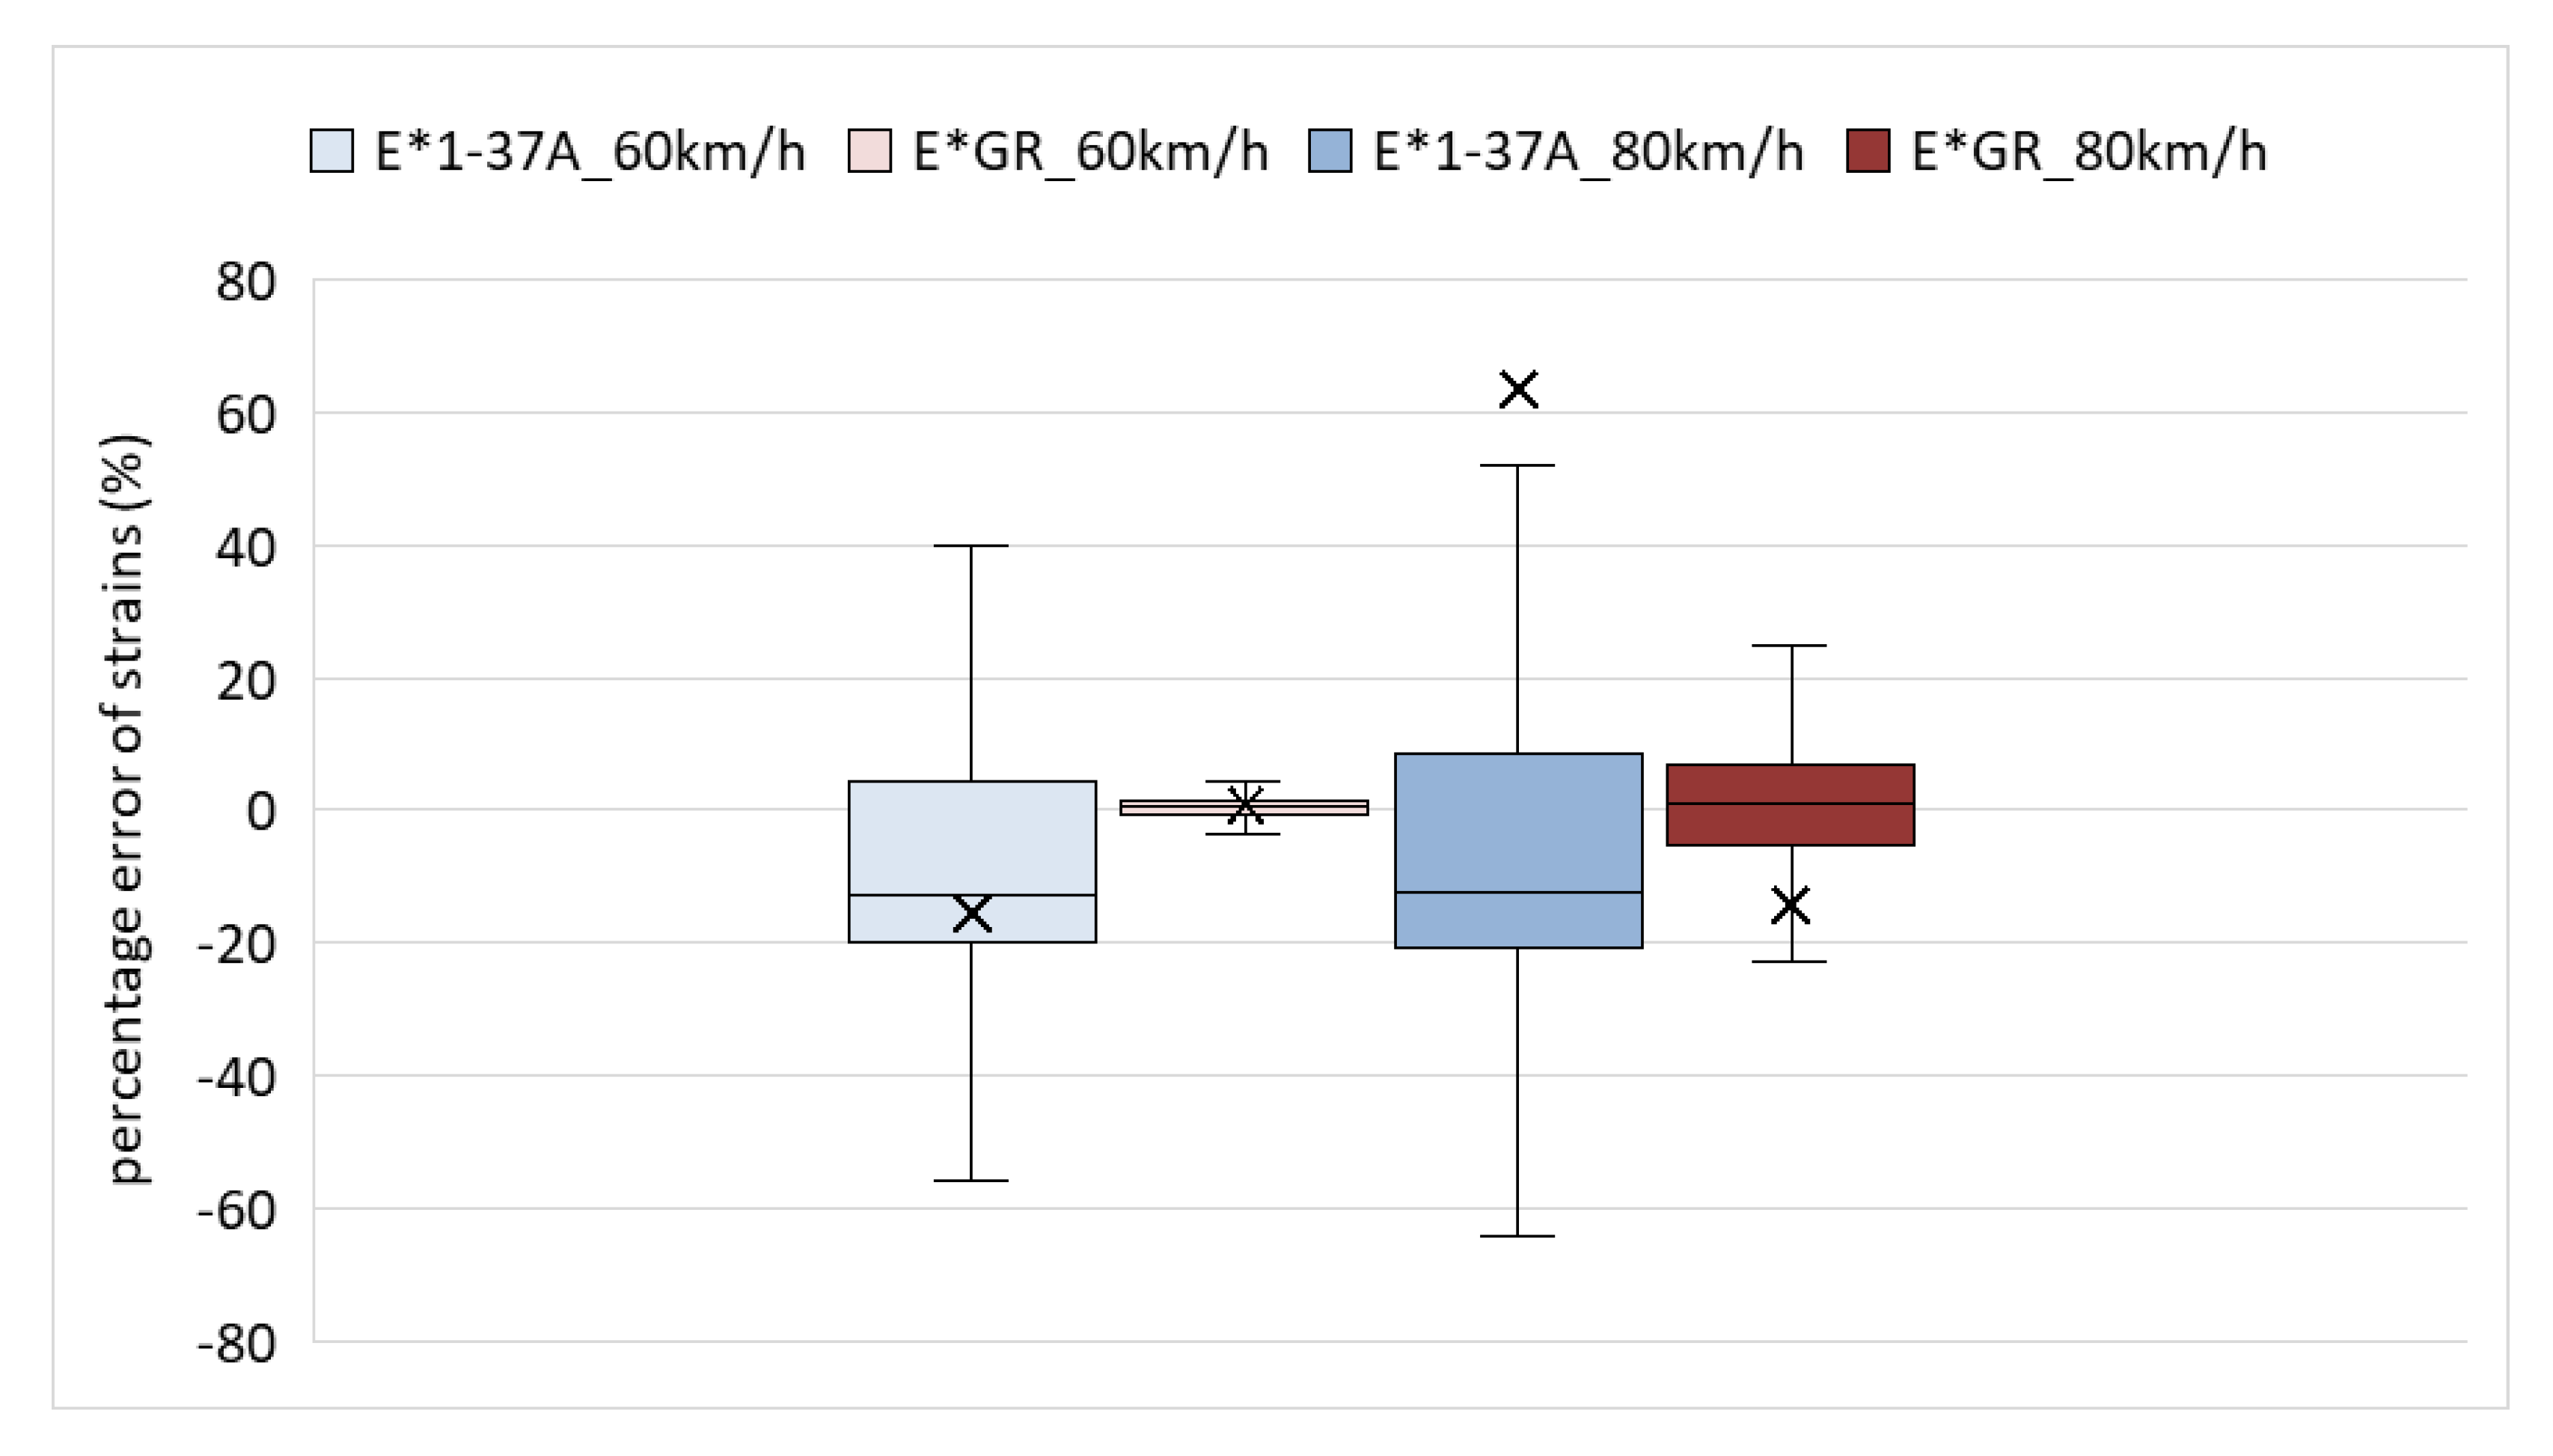
Figure 17.
Permanent deformation of the asphalt layer, load speed 60km/h.
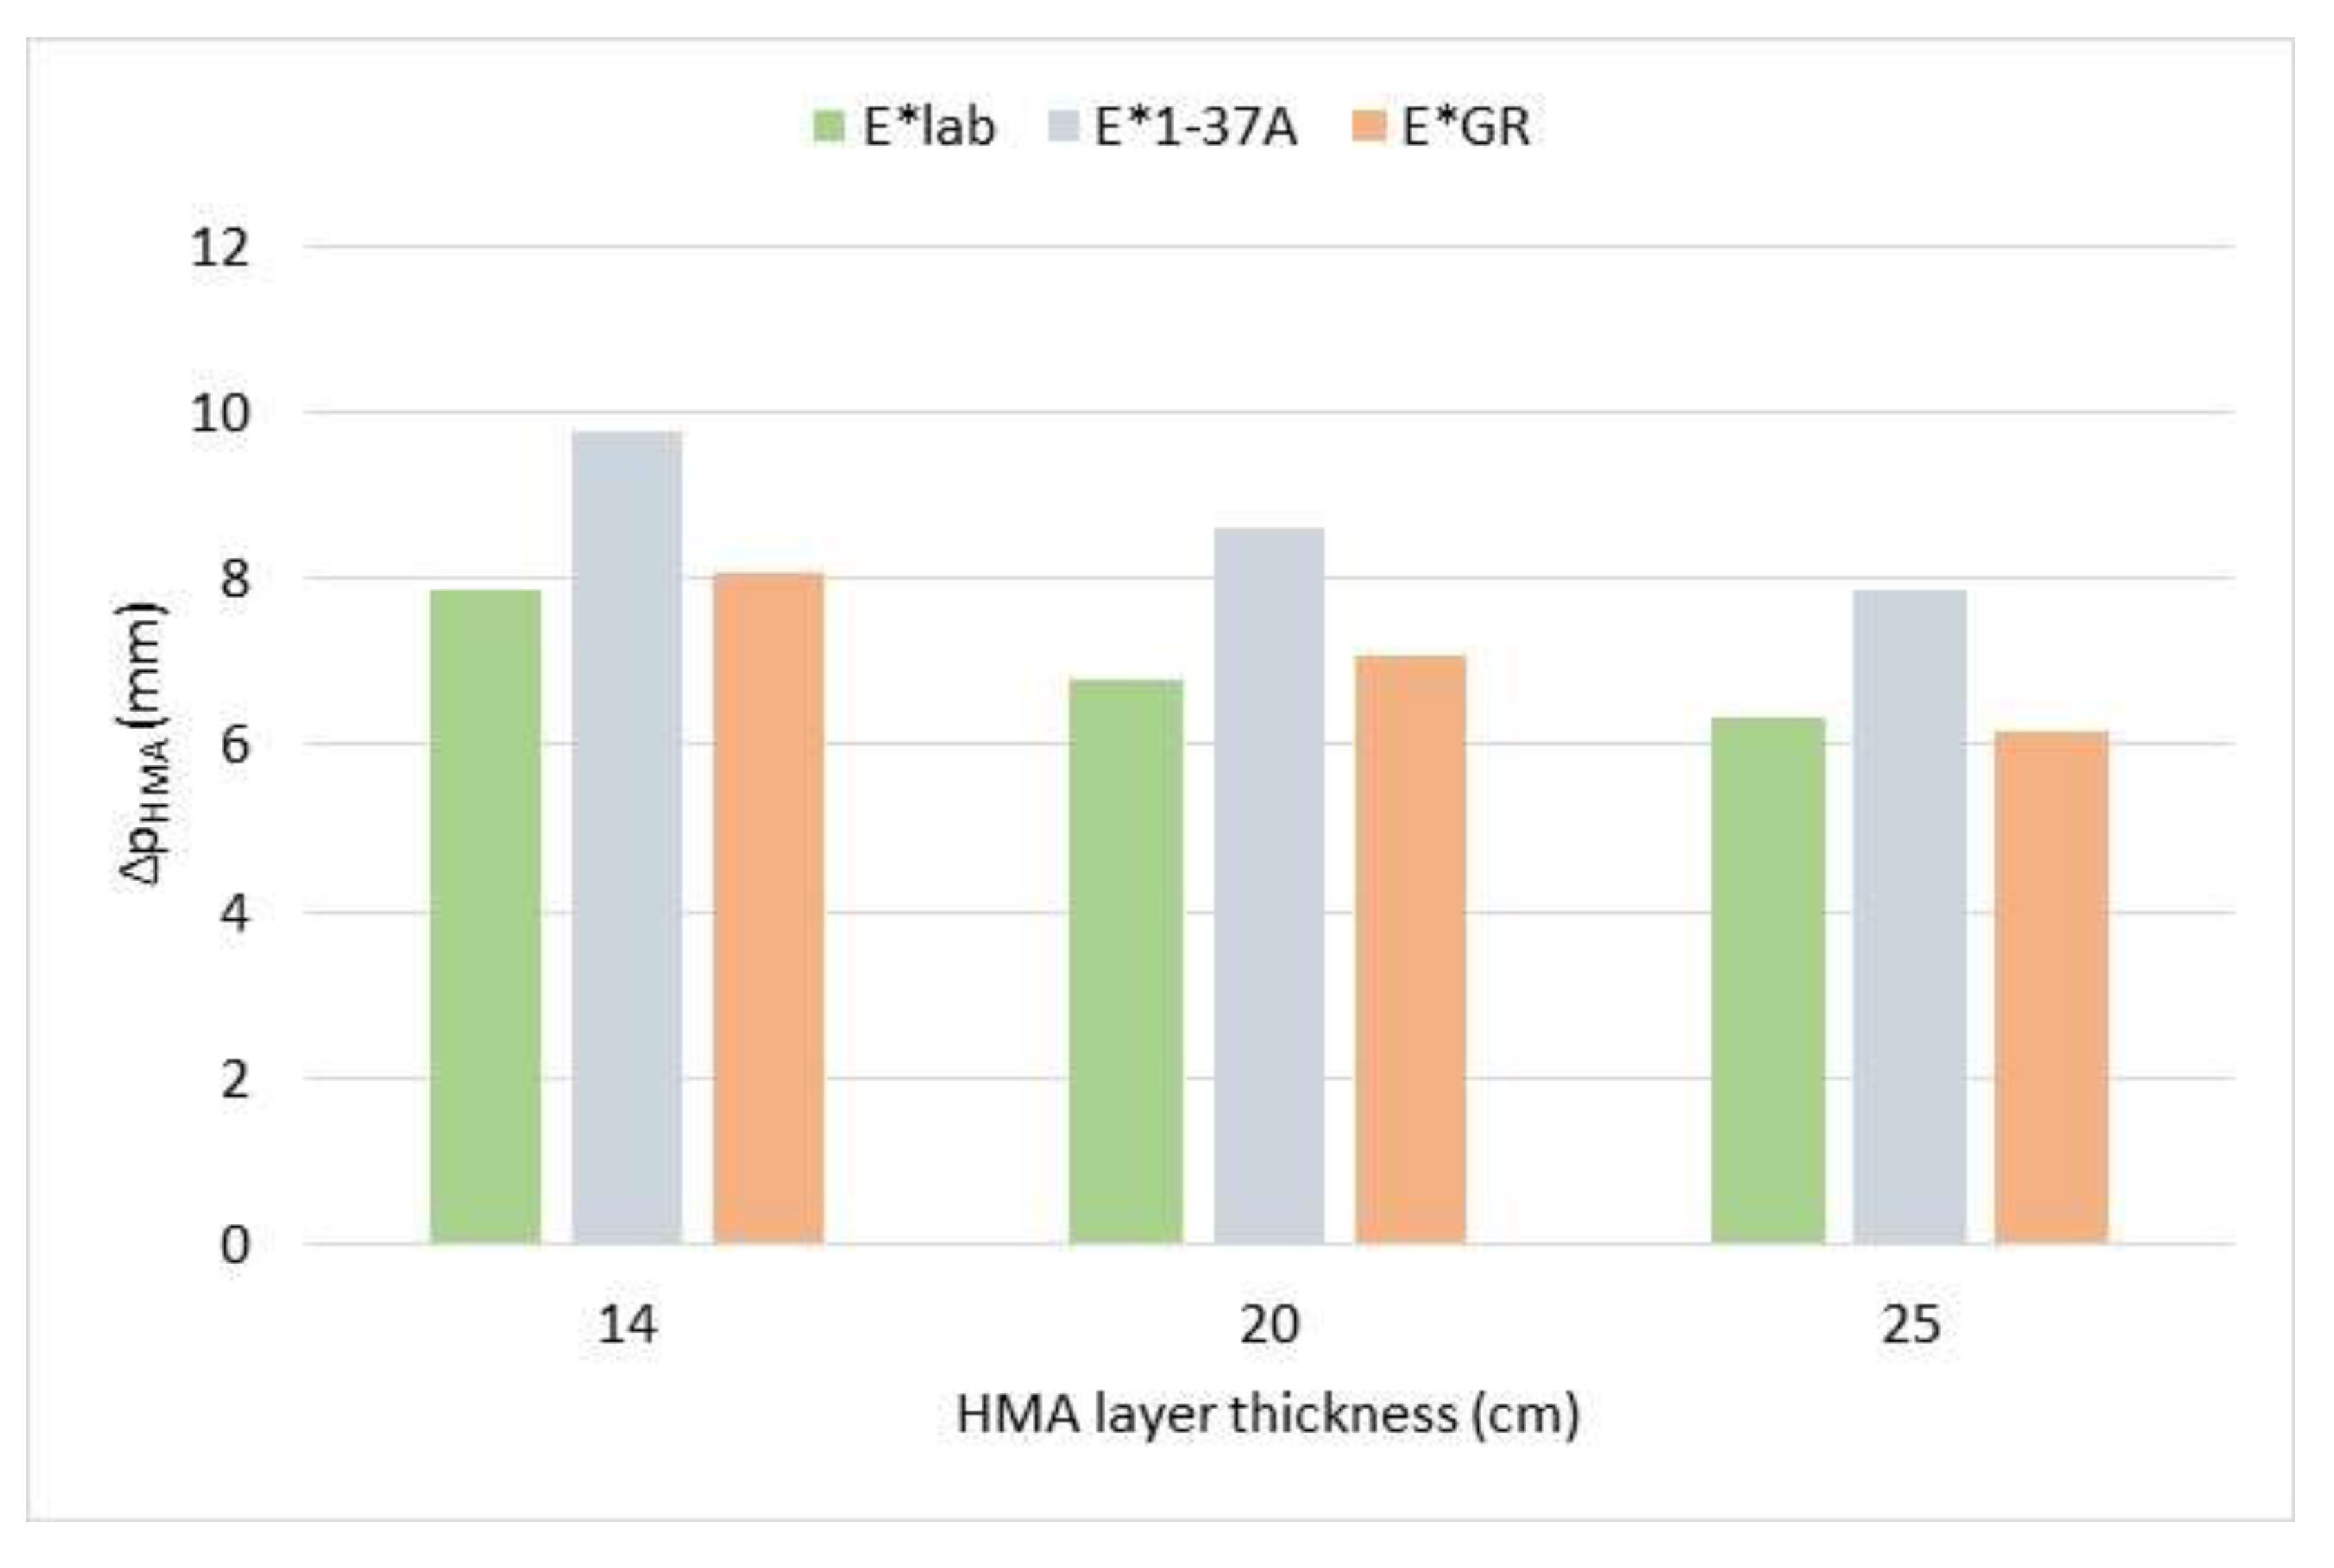
Figure 18.
Permanent deformation of the asphalt layer, load speed 80km/h.
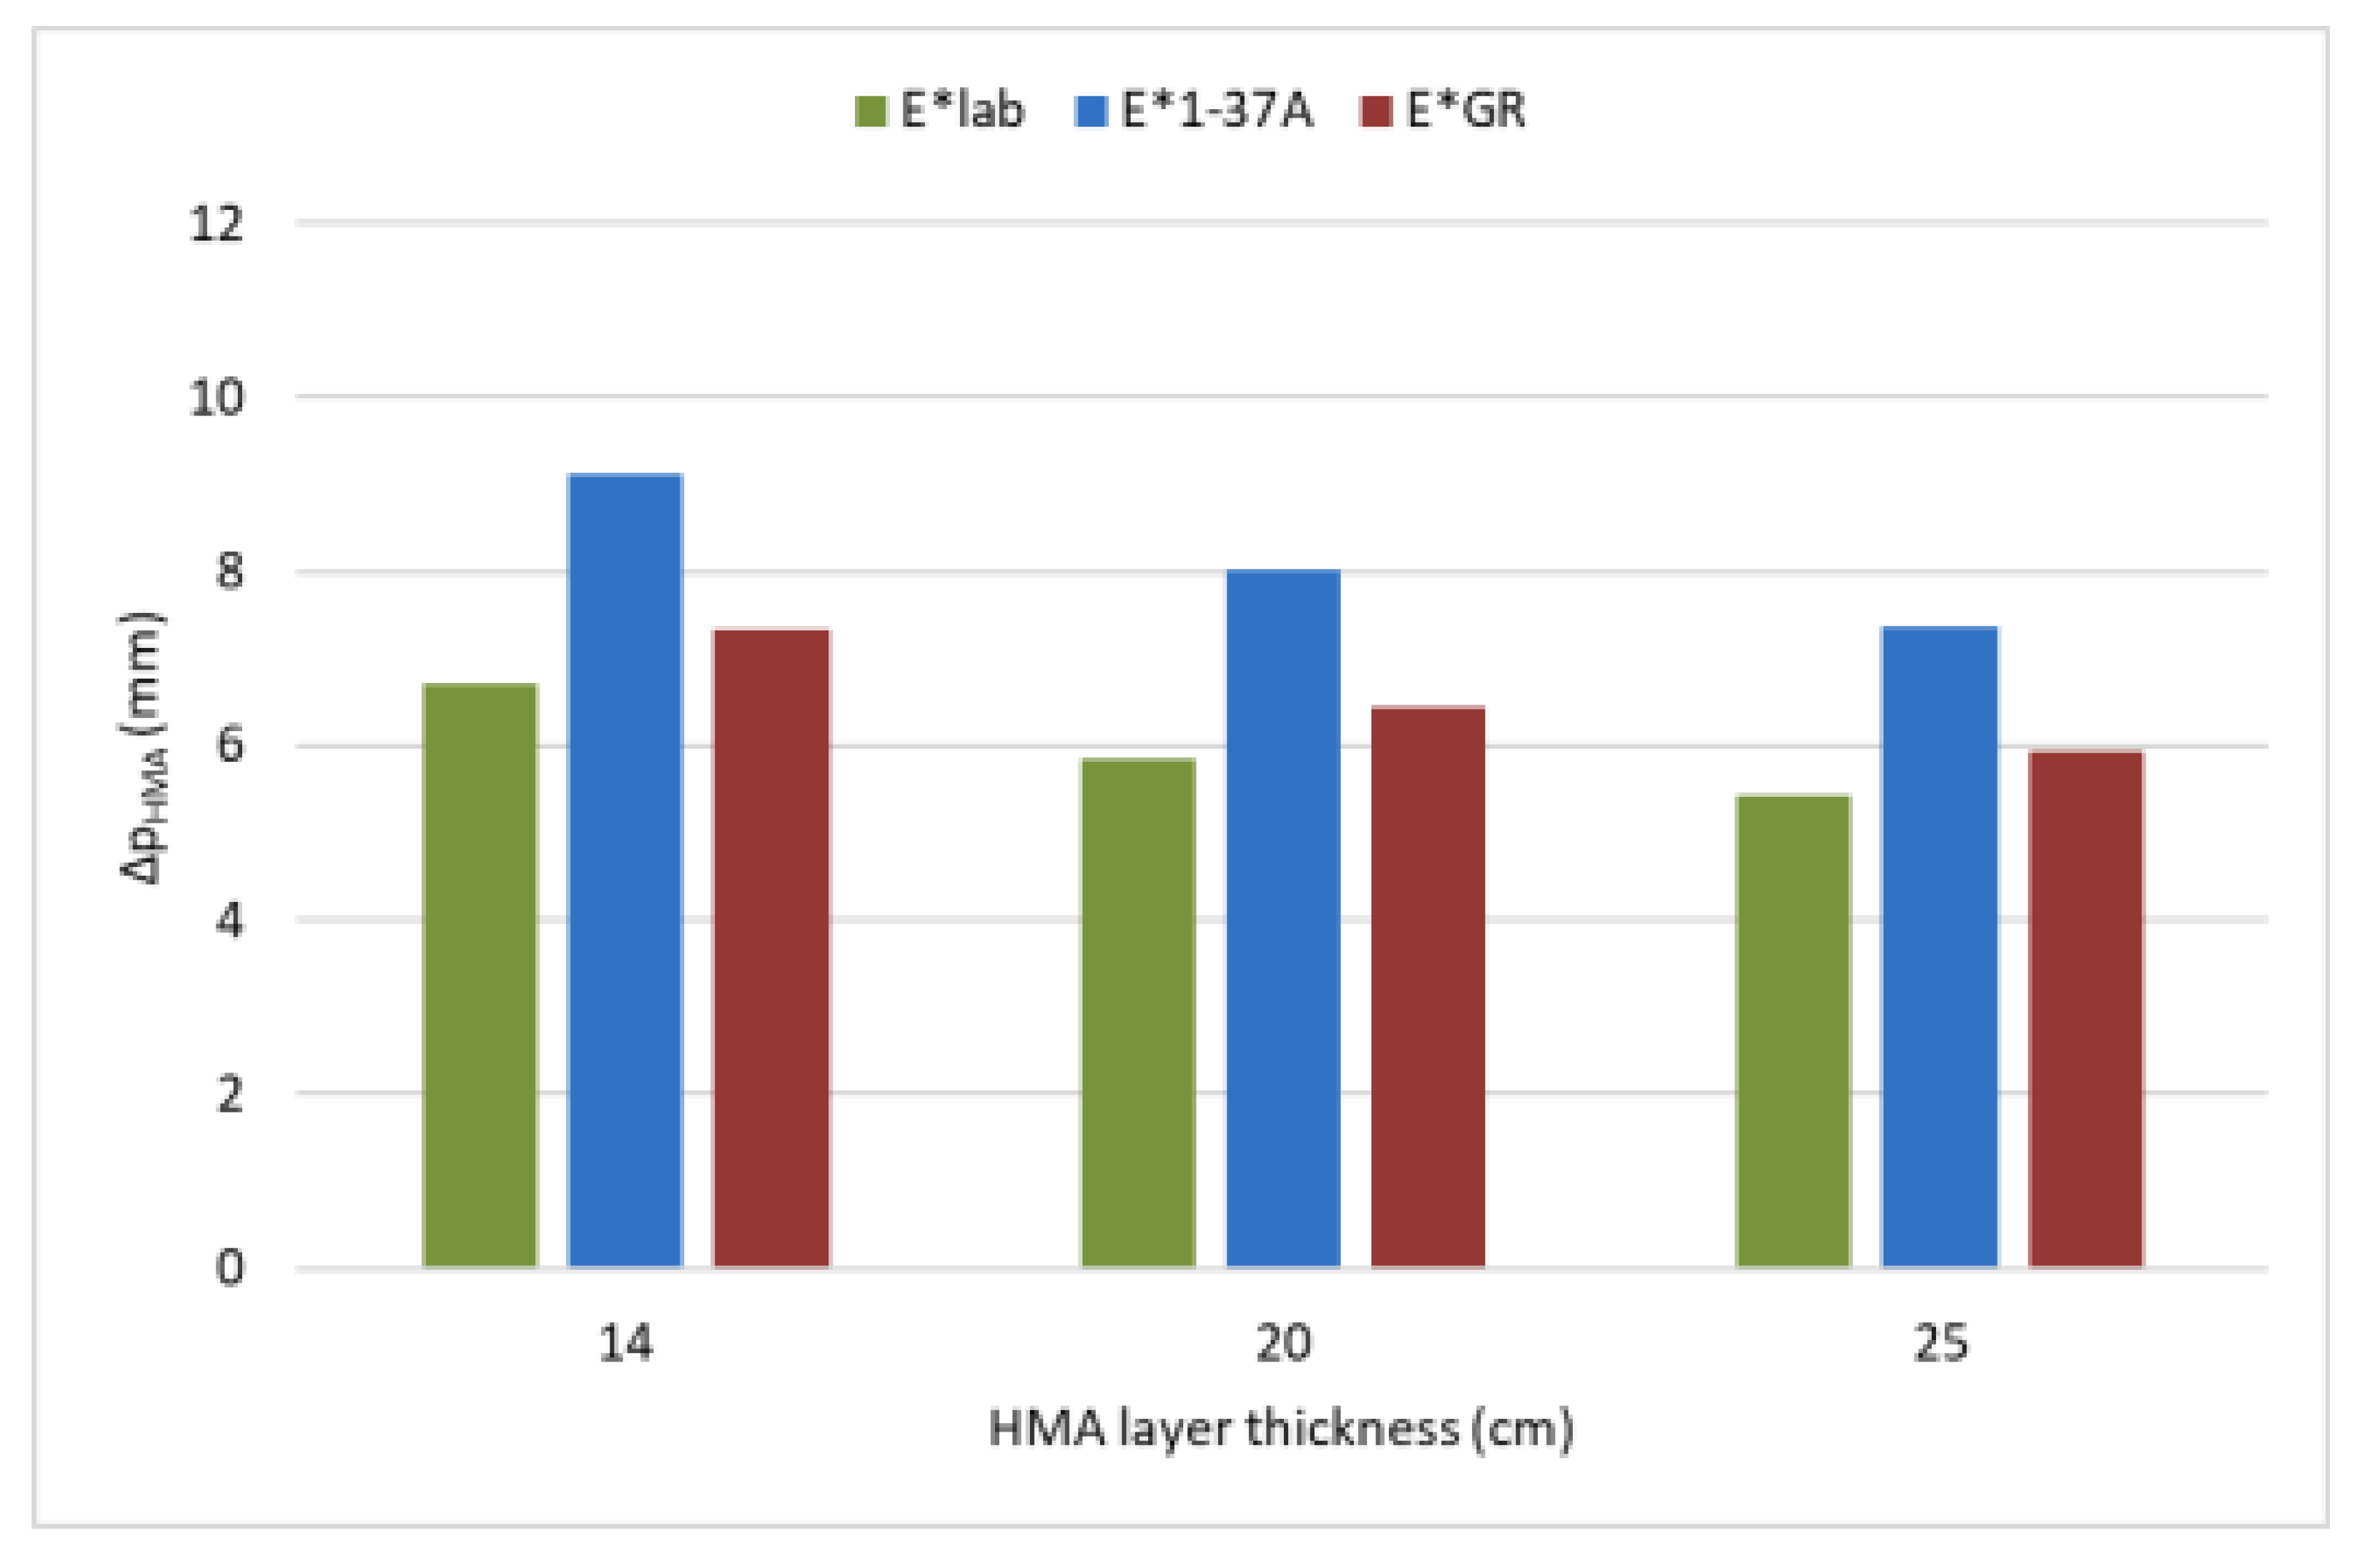

Table 1.
Asphalt mix characteristics.
| Sieve Size | Passing (%) | Specific gravity (kg/m3) | |
| 25.0 mm | 100 | 2670 | |
| 19.0 mm | 90.9 | ||
| 12.5 mm | 71.3 | ||
| 4.75 mm | 56.2 | 2590 | |
| 2.00 mm | 38.5 | ||
| 0.42 mm | 17.4 | ||
| 0.18 μm | 12.9 | ||
| 75μm (No. 200) | 5.5 | 2700 | |
| Pb | 4.2% | ||
| Va | 5% | ||
| Vbeff | 9.8% | ||
Table 2.
Coefficient values of E* predictive models.
| Coefficient | 1-37A | GR |
| b1 | 3.750063 | 3.900000 |
| b2 | 0.02932 | 0.374370 |
| b3 | 0.001767 | 0.029800 |
| b4 | 0.002841 | 0.012210 |
| b5 | 0.058097 | 0.086860 |
| b6 | 0.802208 | 0.942150 |
| b7 | 3.871977 | 3.044830 |
| b8 | 0.0021 | 0.011240 |
| b9 | 0.003958 | 0.002420 |
| b10 | 0.000017 | -0.000250 |
| b11 | 0.00547 | 0.001110 |
| b12 | 0.603313 | 1.076820 |
| b13 | 0.31335 | 0.47006 |
| b14 | 0.393532 | 0.62596 |
Table 3.
Rutting model parameters.
| Parameter | Meaning |
| Δp(HMA) | accumulated permanent vertical deformation (in) |
| εp(HMA) | accumulated permanent axial strain |
| εr(HMA) | elastic strain calculated by the structural response model in the mid-depth of each HMA sublayer (in/in) |
| hHMA | HMA layer thickness (in) |
| n | number of axle-load repetitions |
| T | mix or pavement temperature (oF) |
| kz | depth confinement factor (C1+C2×D)×0.328196D |
| k1r,2r,3r | global field calibration parameters k1r=-3.35412, k2r=0.4791, k3r=1.5606 |
| β1r, β2r, β3r | local or mixture field calibration constants (all set to 1.0) |
| C1 | -0.1039×(HHMA)2+2.4868×HHMA-17.342 |
| C2 | 0.0172×(HHMA)2-1.7331×HHMA+27.428 |
| D | depth below the surface (in) |
Table 4.
RMSE values of E* prediction models.
| Model | RMSE (%) |
| 1-37A | 41 |
| GR | 18 |
Table 5.
Percentage difference of Δp(HMA).
| Load speed 60km/h | Load speed 80km/h | |||||
| E* | HMA layer thickness (cm) | |||||
| 14 | 20 | 25 | 14 | 20 | 25 | |
| 1-37A | 24.3% | 26.5% | 23.8% | 36.3% | 37.0% | 35.8% |
| GR | 2.9% | 4.4% | 3.1% | 9.7% | 9.9% | 9.6% |
Disclaimer/Publisher’s Note: The statements, opinions and data contained in all publications are solely those of the individual author(s) and contributor(s) and not of MDPI and/or the editor(s). MDPI and/or the editor(s) disclaim responsibility for any injury to people or property resulting from any ideas, methods, instructions or products referred to in the content. |
© 2026 by the authors. Licensee MDPI, Basel, Switzerland. This article is an open access article distributed under the terms and conditions of the Creative Commons Attribution (CC BY) license (http://creativecommons.org/licenses/by/4.0/).
Copyright: This open access article is published under a Creative Commons CC BY 4.0 license, which permit the free download, distribution, and reuse, provided that the author and preprint are cited in any reuse.


