Submitted:
26 February 2026
Posted:
27 February 2026
You are already at the latest version
Preprints on COVID-19 and SARS-CoV-2
Abstract
Background/Objectives: The purpose of this study was (i) to determine the levels of interleukins in patients with COVID-19 admitted to the Intensive Care Unit (ICU), and (ii) to study their evolution over 72 hours, as well as (iii) to assess their relationship with morbidity and mortality. Methods: This was a prospective analytical study of critically ill patients with COVID-19 who were monitored from admission to three days of stay in the ICU. Demographics, comorbidities, clinical data and severity scores were recorded. IL-1β, IL-2, IL-6, IL-7, IL-8, IL-10 and antitumor necrosis factor alfa (TNF-α) were measured on the LuminexR 200™ Systems by an immunoassay determination method (ELISA). Clinical variables were collected and analytical variables were measured on the first and third day of admission. Results: In this study a decrease in IL-10 and IL-1β was observed, and an increase in TNF-α on the third day of ICU stay in critically ill patients with COVID-19. TNF-α, IL-10 and IL-8 are found to be higher in COVID-19 patients who die than in those who do not. In addition, we found an association of interleukins with clinical and laboratory variables. Conclusions: IL-10, TNF- α and IL-8 are useful for establishing a prognosis of morbidity and mortality in the first hours of ICU admission in patients with COVID-19. Interleukin levels (IL-10, IL-1β and TNF-α) evolve in the first three days of ICU admission towards a state of increased hyperinflammation that are related to clinical and analytical variables.
Keywords:
COVID-19
; interleukin
; mortality
1. Introduction
COVID-19 is an infectious disease that has spread worldwide causing more than 6 million deaths, with a cumulative infection-to-mortality ratio of 0.4% [1,2]. The most severe manifestation of this disease results in patients being admitted to the Intensive Care Unit (ICU), where the mortality rate is almost 30% [3,4]. This high mortality in patients admitted to the ICU is usually due to the combination of severe acute respiratory distress syndrome (ARDS), sepsis and multiorgan failure. The cause of these alterations is usually the cytokine storm [5,6] that triggers hyperinflammatory states. Thus, in COVID-19 disease, anti-inflammatory treatment to curb the underlying alterations is more important than antiviral treatment. Thus, in COVID-19 disease, anti-inflammatory treatment [7] to curb the underlying alterations is more important than antiviral treatment.
ICU patients are highly heterogeneous due to hemodynamic instability and various medical interventions such as fluid therapy, renal replacement therapy, and mechanical ventilation. It has been observed that there is an increased risk of severe COVID-19 disease in those male patients of advanced age and with underlying diseases such as diabetes, chronic respiratory diseases, coronary artery disease, end-stage renal failure and cirrhosis [8,9,10,11,12]. Progress is needed in identifying prognostic factors for severity in patients with COVID-19, and among them biomarkers related to poor clinical outcomes may be promising. Among these biomarkers are inflammatory markers that are often elevated on admission to the ICU, such as C-reactive protein (CRP), D-dimer (DD) and lactate dehydrogenase (LDH), along with lymphopenia and neutrophilia [13,14,15,16]. Although multiple risk factors for severe COVID-19 disease are known, an in-depth search for biomarkers that will help us better identify and prognosticate patients susceptible to the severe form of this disease is required.
The inflammatory process that occurs in these patients with severe COVID-19 disease is a dynamic process where a release of proinflammatory (antitumor necrosis factor alfa [TNF-α], IL-1ß, IL-12, IFN-γ and IL-6) and anti-inflammatory (IL-1 receptor antagonist [IL-1 ra], transforming growth factor beta [TGF-ß], interleukins 4, 6, 10, 11 and 13) cytokines concur. While the first phase is dominated by mediators with a proinflammatory effect, later phases are dominated by anti-inflammatory phenomena associated with a decrease in nitric oxide production [17]. Under physiological conditions, following infection there is an initial proinflammatory response that is counteracted by anti-inflammatory molecules that limit the potentially harmful effect of these proinflammatory molecules; together they have an immunomodulatory function. In pathological conditions, it may happen that the inflammatory activity cannot be counteracted by the anti-inflammatory activity or, on the contrary, the anti-inflammatory activity overwhelms the inflammatory effect leaving the host at the mercy of the infection [18]. Blood levels of interleukins may be useful as biomarkers of the inflammatory status of these patients. As early as 1996, T. S. Blackwell observed that excess production of some of these proinflammatory cytokines (TNF-α, IL-1ß, IL-6 and IL-8) in the early phase of sepsis correlated with the development of multiorgan failure and increased mortality [19].
Based on the aforementioned, the overall objective of this study was to (i) determine interleukins levels (IL-1β, IL-2, IL-6, IL-7, IL-8, IL-10 and TNF-α) in patients with COVID-19 admitted in ICU, and (ii) to study their evolution over 72 hours, as well as (iii) to assess their relationship with morbidity and mortality. Specific objectives include: firstly, a comparison of interleukin levels with severity parameters such as Sequential Organ Failure Assessment (SOFA), Acute Physiology and Chronic Health Evaluation II (APACHE), days of mechanical ventilation, days of ICU stay, fraction of inspired oxygen (FiO2) and partial pressure of oxygen/fraction of inspired oxygen (PaO2/FiO2); secondly, a correlation of interleukin levels with inflammatory markers: fibrinogen, DD, CRP and ferritin; and thirdly, a comparison of interleukin levels with mortality.
2. Materials and Methods
2.1. Study Design and Participants
This is a prospective, observational, analytical, follow-up study in critically ill patients with COVID-19. Patients admitted to the ICU with a diagnosis of COVID-19 from March to December 2020 at the Hospital Virgen de la Nieves in Granada (Spain) were recruited. The diagnosis of COVID-19 was confirmed by a positive real-time reverse transcriptase polymerase chain reaction (RT-PCR) test of nasal and throat swab samples and subsequent sequencing of SARS-CoV-2 specific RNA. The present study was conducted in accordance with the principles of the Declaration of Helsinki (last revised guidelines from 2013) [20], following the International Conference on Harmonization (ICH)/Good Clinical Practice (GCP) standards, and was approved by the Ethics Committee of the University of Granada (Ref. 149/CEIH/2016). Informed consents were collected from patients or their relatives or close associates after being informed about the study protocol.
Patients selected for the study were those admitted to the ICU in critical condition aged 18 years or older, who stayed at least 3 days and had a positive PCR test for SARS-CoV-2 according to the Chinese Clinical Guideline for the Classification of COVID-19 [21]. Patients were considered critically ill when they had respiratory failure requiring mechanical ventilation, needed vasopressor treatment (shock) or had other complications with organ failure requiring monitoring or ICU treatment. Patients under 18 years of age, pregnant women and those who did not have a positive CRP test but had symptoms compatible with COVID-19 were excluded.
2.2. Data Collection
Patient information (age, sex, comorbidities, date of ICU onset and discharge and COVID-19 CRP results) was collected in a database. Similarly, clinical parameters of patients (days of ICU stay, days of mechanical ventilation, SOFA score [22], APACHE II score [23] (measured only in the initial phase of the stay) and mortality) were collected on both the first and third day of ICU admission. In addition, complementary parameters such as mean arterial pressure, respiratory rate and other respiratory function variables such as FiO2 and PaO2/FiO2 were collected on both days.
Serum samples were obtained and processed immediately from the patients included in the study on the day of admission and on the third day in ICU. The following laboratory variables were analysed: a) biochemical variables: sodium, potassium, creatinine, alanine aminotransferase (ALT), aspartate aminotransferase (AST), gamma-glutamyl transferase (GGT), LDH, creatine kinase (CK); b) haematological variables: haemoglobin, haematocrit, leukocytes, percentage of lymphocytes, percentage of neutrophils, platelets, international normalised ratio (INR) and activated partial thromboplastin time (aPTT); c) inflammatory markers: fibrinogen, DD, CRP and ferritin. Biochemistry and immunochemistry parameters were determined with an Alinity and a Sysmex autoanalysers (Abbott Core Laboratory®). The methods of determination employed were enzymatic colorimetry and immunoassay. The remaining serum samples were frozen at -20 °C for subsequent determination of interleukins.
2.3. Assessment of Interleukins
Multiplex panels (Ref: HCYTA-60K-20) were used to measure the following interleukins: IL-1β, IL-2, IL-6, IL-7, IL-8, IL-10 and TNF-α. The samples were processed on the LuminexR 200™ Systems (Merck Millipore, Merck KGaA, Darmstadt, Germany) by an immunoassay determination method (ELISA). The Luminex technology, based on flow cytometry, employed a set of beads with a different colour code assigned to each bead and conjugated with a specific reagent for each analyte of interest, allowing simultaneous quantification of several analytes. The following reference values were considered: <13.6 pg/mL for IL-1β, <10 pg/mL for IL-2, <5.9 pg/mL for IL-6, <10 pg/mL for IL-7, <10 pg/mL for IL-8, <10 pg/mL IL-10 and <12.4 pg/mL for TNF-α.
2.4. Statistical Analysis
All information was collected in a database and statistical tests were processed with the statistical software SPSS version 21.0 (IBM SPSS, Armonk, New York, NY, USA). GraphPad Prism 9 software (GraphPad Software, San Diego, CA, USA) was used for plotting the graphs. Sample size calculation was performed to assess the difference between two means for a paired t-test, an alpha of 0.05, a power of 95% and a mean effect size (0.05) (G*Power software, version 3.1.9.6, Kiel, Germany). A total of 45 participants were required, however, for the present study a total of 120 participants were recruited. The sample size in this study was similar to those reported in previous research [24,25].
The assumption of normality was tested using the Kolmogorov-Smirnoff-Lilliefors test. Qualitative variables were presented as frequencies and percentages, and quantitative variables as or median (interquartile range). The relationship of dichotomous qualitative variables was found using the Chi-square test. The association of quantitative variables with mortality and mechanical ventilation was performed by Mann-Whitney U test. Quantitative variables between day 1 and day 3 of admission were compared by Wilcoxon signed-rank test for paired data to test the evolution of critically ill patients with COVID-19 in the ICU. The association of interleukins with the rest of the quantitative variables was tested by applying Spearman’s correlation coefficient. Cox proportional hazards model was used to estimate the risk of death adjusted for TNF-α levels categorized by median. A p-value less than 0.05 was considered to be statistically significant.
3. Results
A total of 120 patients requiring admission to the ICU, staying there for at least 3 days, and meeting all the inclusion criteria were recruited. The study sample comprised 88 (73.3%) men and 32 (26.7%) women. Significant differences were observed in the frequency of men and women with this disease admitted to the ICU, being more frequent in men (χ2 = 22.1; p <0.001). The mean age (SD) was 61.6 (13.6), with an age range of 21 to 96 years. Most of the patients diagnosed with COVID-19 presented dry cough, fever, asthenia, myalgia, ageusia, and anosmia. 57.5% of patients were non-smokers, 34.2% were ex-smokers, and 8.3% were smokers.
Most patients had underlying diseases such as cardiovascular diseases, diabetes, hyperlipidemia and chronic obstructive pulmonary disease. The median (p25th‒p75th) length of stay in the ICU was 14.0 (9.0‒28.0) days and median (p25th‒p75th) number of days on mechanical ventilation was 9.0 (0‒22.3) days. A total of 85 (70.8%) patients required mechanical ventilation. Table 1 shows the clinical characteristics on the first and third days, and the fourth column shows the evolution after 3 days in the ICU. A significant decrease in heart rate, respiratory rate, and FiO2 was found on the third day compared with the first day of admission.
The following interleukin results were obtained: Less than 1% of IL-1β and IL-2 levels were elevated. 89.5% of IL-6 results were elevated on both the first and third days. Regarding IL-7, 20.8% were elevated on the first day and 16.7% were elevated on the third day. In the case of IL-8, 95.8% of the results were elevated on the first day and 98.3% on the third day. 89.2% of IL-10 level results were elevated on the first day and 81.6% on the third day. Finally, TNF-α was elevated in 62.5% of cases on the first day and 73.3% on the second day.
Table 2 shows the results of the interleukins measured on the first and third days of admission and the evolution in that period in the ICU. A Wilcoxon signed-rank test showed that DD and TNF-α increase significantly on the third day of admission to the ICU, whereas fibrinogen, CRP, ferritin, IL-1β and IL-10 decrease significantly on the third day compared to the first day of admission to the ICU.
Mortality at 28 days was 30.8% (37 out of 120 patients). An association of interleukins with mortality at 28 days was performed, as shown in Table 3. In this case, it was observed that TNF-α and IL-10 increased significantly in those who died on the first and third days; that is, patients with the higher levels were more likely to die. We found that IL-8 on the third day of admission was also associated with mortality because its values were higher in the deceased than in the survivors.
Figure 1A,B shows the mortality receiver operating characteristic curve (ROC curve) with TNF-α. The areas under the curve were 0.678 (95% CI 0.567–0.789) for TNF-α on the first day (Figure 1A) and 0.676 (95% CI 0.561–0.790) for TNF-α on the third day (Figure 1B). Figure 1C shows the mortality ROC curve with IL-10 on the first day which shows an area under the curve of 0.673 (95% CI 0.568–0.777). In the same way, Figure 1D shows the mortality ROC curve with IL-10 on the third day which shows an area under the curve of 0.697 (95% CI 0.593–0.801).
Median survival time was calculated for those patients who died. Survival was measured by whether the patients had high or low levels of TNF-α. A cut-off point was defined at 14.8 pg/mL (median of the values of our sample). Median survival was 63.0 days (95% CI 49.7–76.3) for low values of TNF-α and 45.1 days (95% CI 32.9–57.3) for high values of TNF-α. The association between the two groups with higher or lower levels of TNF-α and survival was calculated. A chi-square of 2.212 (p <0.137) was obtained, so that patients with higher levels of TNF-α died in a higher percentage than those with lower levels of TNF-α. Figure 2 shows this difference in survival.
Interleukins were related to some variables involved in the severity of the patient, such as SOFA, APACHE, days of mechanical ventilation, days of stay in the ICU, FiO2 and PaO2/FiO2. Table 4 shows the correlations found. Most are positive correlations, the higher the levels of interleukins, the higher the severity of clinical variables.
Interleukins were also correlated with inflammation parameters such as fibrinogen, CRP, PCT, ferritin, and DD. Table 5 shows the correlations found. Most are positive correlations, the higher the levels of interleukins, the higher the levels of inflammatory markers.
4. Discussion
The purpose of the present study was (i) to determine the levels of interleukins in patients with COVID-19 admitted to the Intensive Care Unit (ICU), and (ii) to study their evolution over 72 hours, as well as (iii) to assess their relationship with morbidity and mortality. First, the vast majority of interleukins were elevated in these patients on the first and third days. Serum levels of IL-1 beta and IL-2 are mostly within reference values, and IL-7 is elevated in a very small number of patients. Therefore, we conclude that these molecules would not be useful in the diagnosis or follow-up of patients with COVID-19. As for the other molecules (IL-6, IL-8, IL-10, and TNF alpha), they were elevated in the vast majority of patients. Therefore, they could be useful molecules in the early diagnosis, prognosis, and follow-up of the septic process in patients with COVID-19. Second, regarding ICU stay, decreases in IL-1β and IL-10, as well as an increase in TNF-α, were observed on the third day of ICU stay in critically ill COVID-19 patients. Third, regarding morbidity and mortality, TNF-α and IL-10 on the first day were higher in COVID-19 patients who died compared to those who survived. Moreover, IL-8 levels on the third day were also related with mortality, as patients with higher interleukins were more likely to die. Additionally, we found an association between interleukins levels and clinical and laboratory outcomes.
In our study, patients showed an improvement in clinical and laboratory outcomes during the first three days of stay in ICU. Specifically, a decrease in fibrinogen, CRP and ferritin, along with an increase in DD, was observed on the third day, likely due to the supportive interventions following hospital protocols from ICU admission. Regarding inflammation, a decrease in IL-10 and an increase in TNF-α were also observed on the third day. This pattern in interleukins aligns with the model proposed by Siddiqi and Mehra [26]. These authors described a three-stage evolution of COVID-19 infection: stage 1 (mild), characterised by “early inflammation”; stage 2 (moderate), with pulmonary involvement —subdivided into IIa (without hypoxia) and IIb (with hypoxia)—; and stage 3 (severe), marked by “systemic hyperinflammation”. Our patients likely correspond to this third stage. At this phase, inflammatory cytokines and biomarkers, including IL-2, IL-6, IL-7, granulocyte colony-stimulating factor, macrophage inflammatory protein 1-α, TNF-α, CRP, ferritin and DD are elevated [27]. Additionally, a condition resembling secondary haemophagocytic lymphohistiocytosis may occur in patients in this advanced stage of disease [7]. Tailored treatment in stage 3 relies on the use of immunomodulatory agents to reduce systemic inflammation and prevent overwhelming multi-organ dysfunction. At this stage, the use of corticosteroids, along with the use of cytokine inhibitors such as tocilizumab (an IL-6 inhibitor) or anakinra (IL-1 receptor antagonist) would be warranted [7]. Overall, the prognosis in this critical phase would be poor, making early identification and timely therapeutic intervention crucial for improving outcomes.
IL-6, a biomarker that has been studied in inflammatory diseases, is a glycoprotein involved in inflammation whose release is induced by interleukin-1. In our study, we did not observe a relationship between IL-6 and mortality, which may be attributed by the use of Tocilizumab in patients with the highest severity. The mechanism of action of this drug involves binding to both soluble and membrane-bound IL-6 receptors (IL-6Rs and IL-Rm) and inhibits IL-6-mediated signalling. IL-6 have been reported in a variety of conditions associated with inflammatory processes such as sepsis [28], neoplasms, autoimmune diseases, acquired immunodeficiency syndrome, alcoholic liver disease and infections or transplant rejection [29,30,31,32,33]. Moreover, high IL-6 concentrations have also been found to be associated with both cardiovascular and all-cause mortality in the general elderly population [34].
In our study IL-8 was associated with mortality on day 3, showing correlations with clinical outcomes of severity ‒with PaO2/FiO2 on both days and with days of mechanical ventilation on day 3‒, and with biochemical severity linked parameters ‒ with DD on day 1 and with CRP on day 3‒. Additionally, several studies suggested the direct relationship of IL-8 with severity in patients with sepsis [35,36,37] and COVID-19 [38]. Furthermore, a recent study [39] found that elevated serum levels of IL-6, IL-8 and TNF-α at admission were significantly associated with mortality (p <0.001, p =0.020 and p =0.014, respectively).
Likewise, our study showed that IL-10 was related to mortality on both, day 1 and day 3 of ICU admission. IL-10 levels were also correlated with clinical outcomes of disease severity, the number of days on mechanical ventilation (on both days), ICU length of stay (on day 3) and FiO2 (on day 3). Furthermore, IL-10 was associated to biochemical markers of COVID-19 severity, like CRP on both days and DD on the first day. In patients with neonatal sepsis in a hyperinflammatory state, the combination of IL-10, IL-8 and PCT has been shown to achieve early diagnosis of organ dysfunction [36]. A similar approach was observed using combined biomarkers such as of IL-10, IL-17 and PCTs, demonstrating greater diagnostic accuracy compared to the individual markers [40].
In the present study, TNF-α showed a relationship with mortality on both days (first and third day of ICU stay), and with clinical variables of disease severity, including the number of days on mechanical ventilation (on both days) and ICU length stay (on the third day). TNF-α is essential for activating innate immunity against infectious agents, but dysregulation of TNF-α signalling can lead to severe complications. It is speculated that inflammation regulated by these cytokines leads to tissue destruction and pulmonary oedema through a mechanism of endothelial and epithelial cytoskeletal breakdown allowing fluid influx during vasodilatation [41]. TNF-α recruits neutrophils in respiratory epithelia that are sensitised by the virus, and release matrix metalloproteinase, which is strongly associated with irreversible pulmonary fibrosis in COVID-19 patients [42]. TNF-α levels have been found to be consistently higher in patients with severe COVID-19 [43] and in those suffering from comorbidities such as obesity, hypertension, and chronic heart failure [44,45,46]. As shown in Figure 2, TNF-α was a strong predictor of long-term survival. In our study, those patients with TNF-α levels below 14.8 had an 80-day survival rate greater than 70%, whereas those with TNF-α levels above 14.8 had an 80-day survival rate below 10%.
5. Conclusions
IL-8, IL-10 and TNF-α are useful for establishing a prognosis of morbidity and mortality in the early ICU admission of critically ill COVID-19 patients. Interleukin levels ‒IL-10, IL-1β and TNF-α‒ evolve in the first three days of ICU admission towards a state of increased hyperinflammation that are related to clinical and analytical variables. Notably, elevated TNF-α strongly predicted poor long-term survival, confirming its potential as a key prognostic biomarker. Our findings support the optimisation of critical care patient monitoring in COVID-19 through routine analysis of the comprehensive cytokine profile, enabling early risk stratification and improved clinical management of severe cases. This reinforces the value of multi-biomarker approaches in critical care settings.
Author Contributions
Conceptualization, Y.G.-M., J.M.-L., J.M.-C., J.M.P.-V., L.H.-Q., H.V.-L. and E.P.; methodology, Y.G.-M., J.M.-C., J.M.P.-V., L.H.-Q., H.V.-L. and E.P.; software, Y.G.-M., J.M.-L. and E.P.; validation, Y.G.-M., J.M.-L., J.M.-C., J.M.P.-V., L.H.-Q., H.V.-L. and E.P.; formal analysis, Y.G.-M., J.M.-L. and E.P.; investigation, Y.G.-M., J.M.-L., J.M.-C., J.M.P.-V., L.H.-Q., H.V.-L. and E.P.; data curation, Y.G.-M., J.M.-L. and E.P.; writing—original draft preparation, Y.G.-M., J.M.-L. and E.P.; writing—review and editing, Y.G.-M., J.M.-L. and E.P.; project administration, Y.G.-M., J.M.P.-V. and E.P.; funding acquisition, J.M.-C., J.M.P.-V. and E.P. All authors have read and agreed to the published version of the manuscript.
Funding
This publication was supported by the European Regional Development Fund (ERDF) “a way of making Europe”, funded via the Consejería de Transformación Económica, Industria, Conocimiento y Universidades de la Junta de Andalucía (REF. A-CTS-708-UGR20) and by Project FIS PI10/1993 from the Spanish Carlos III Health Institute. L. H.-Q. (REF. FPU18/03702) and H. V.-L. (REF. FPU18/03655) were awarded a FPU fellowship from the Spanish Ministry of Education.
Institutional Review Board Statement
The study was conducted in accordance with the Decla-ration of Helsinki and approved by the Ethics Committee of the University of Granada (protocol code 149/CEIH/2016).
Informed Consent Statement
Informed consents were collected from patients or their relatives or close associates after being informed about the study protocol.
Acknowledgments
The authors thank “FEDER/Junta de Andalucía-Consejería de Transformación Económica, Industria, Conocimiento y Universidades, Proyecto A.CTS.708.UGR20” and the FIBAO foundation in Granada (Spain). We also acknowledge all the patients who participated in our study and the personnel from the hospital Virgen de las Nieves.:
Abbreviations
The following abbreviations are used in this manuscript:
| ALT | Alanine aminotransferase (Alanina aminotransferasa) |
| APACHE II | Acute Physiology and Chronic Health Evaluation II |
| APTT / aPTT | Activated partial thromboplastin time |
| ARDS | Acute respiratory distress syndrome |
| AST | Aspartate aminotransferase |
| BR | Breathing rate |
| CI | Confidence Interval |
| CK | Creatine kinase |
| COVID-19 | Coronavirus Disease 2019 |
| CRP | C-reactive protein |
| DD | D-dimer (Dímero D) |
| ELISA | Enzyme-linked immunosorbent assay |
| FiO2 | Fraction of inspired oxygen |
| GCP | Good Clinical Practice |
| GGT | Gamma-glutamyl transferase |
| HR | Heart rate |
| ICH | International Conference on Harmonization |
| ICU | Intensive Care Unit |
| IFN-γ | Interferon-gamma |
| IL-1 ra | IL-1 receptor antagonist |
| IL-1β | Interleukin-1beta |
| IL-2 | Interleukin-2 |
| IL-4 | Interleukin-4 |
| IL-6 | Interleukin-6 |
| IL-6Rm | Membrane-bound IL-6 receptors |
| IL-6Rs | Soluble IL-6 receptors |
| IL-7 | Interleukin-7 |
| IL-8 | Interleukin-8 |
| IL-10 | Interleukin-10 |
| IL-11 | Interleukin-11 |
| IL-12 | Interleukin-12 |
| IL-13 | Interleukin-13 |
| IL-17 | Interleukin-17 |
| INR | International normalised ratio |
| LDH | Lactate dehydrogenase |
| MAP | Mean arterial pressure |
| MV / MVD | Mechanical ventilation / Mechanic ventilation days |
| PaFi | PaO2/FiO2 ratio |
| PaO2/FiO2 | Partial pressure of oxygen/Fraction of inspired oxygen |
| PCT | Procalcitonin |
| ROC | Receiver operating characteristic |
| RT-PCR | Real-time reverse transcriptase polymerase chain reaction |
| SARS-CoV-2 | Severe acute respiratory syndrome coronavirus 2 |
| SD | Standard deviation |
| SOFA | Sequential Organ Failure Assessment |
| TGF-ß | Transforming growth factor beta |
| TNF-α | Tumor necrosis factor-alpha |
References
- Wang, H.; Paulson, K.R.; Pease, S.A.; Watson, S.; Comfort, H.; Zheng, P.; Aravkin, A.Y.; Bisignano, C.; Barber, R.M.; Alam, T.; et al. Estimating Excess Mortality Due to the COVID-19 Pandemic: A Systematic Analysis of COVID-19-Related Mortality, 2020–21. Lancet 2022, 399, 1513–1536. [Google Scholar] [CrossRef]
- Barber, R.M.; Sorensen, R.J.D.; Pigott, D.M.; Bisignano, C.; Carter, A.; Amlag, J.O.; Collins, J.K.; Abbafati, C.; Adolph, C.; Allorant, A.; et al. Estimating Global, Regional, and National Daily and Cumulative Infections with SARS-CoV-2 through Nov 14, 2021: A Statistical Analysis. Lancet 2022, 399, 2351–2380. [Google Scholar] [CrossRef] [PubMed]
- Maamar, A.; Guillot, P.; Joussellin, V.; Delamaire, F.; Painvin, B.; Bichon, A.; Jartre, O.B.d.l.; Mauget, M.; Lesouhaitier, M.; Tadié, J.M.; et al. Moderate-to-Severe ARDS: COVID-19 Patients Compared to Influenza Patients for Ventilator Parameters and Mortality. ERJ Open Res. 2023, 9, 00554–2022. [Google Scholar] [CrossRef] [PubMed]
- Auld, S.C.; Harrington, K.R.V.; Adelman, M.W.; Robichaux, C.J.; Overton, E.C.; Caridi-Scheible, M.; Coopersmith, C.M.; Murphy, D.J.; Collaborative, E.C.-19. Trends in ICU Mortality From Coronavirus Disease 2019: A Tale of Three Surges. Crit. Care Med. 2022, 50, 245–254. [Google Scholar] [CrossRef] [PubMed]
- Meyer, N.J.; Gattinoni, L.; Calfee, C.S. Acute Respiratory Distress Syndrome. Lancet 2021, 398, 622–637. [Google Scholar] [CrossRef] [PubMed]
- Kim, J.S.; Lee, J.Y.; Yang, J.W.; Lee, K.H.; Effenberger, M.; Szpirt, W.; Kronbichler, A.; Shin, J.I. Immunopathogenesis and Treatment of Cytokine Storm in COVID-19. Theranostics 2021, 11, 316–329. [Google Scholar] [CrossRef]
- Mehta, P.; McAuley, D.F.; Brown, M.; Sanchez, E.; Tattersall, R.S.; Manson, J.J. COVID-19: Consider Cytokine Storm Syndromes and Immunosuppression. Lancet 2020, 395, 1033–1034. [Google Scholar] [CrossRef]
- Singh, A.K.; Singh, R. Hyperglycemia without Diabetes and New-Onset Diabetes Are Both Associated with Poorer Outcomes in COVID-19. Diabetes Res. Clin. Pract. 2020, 167, 108382. [Google Scholar] [CrossRef]
- Rastad, H.; Ejtahed, H.S.; Shafiee, G.; Safari, A.; Shahrestanaki, E.; Khodaparast, Z.; Hassani, N.S.; Rezaei, M.; Nazari, M.; Zakani, A.; et al. The Risk Factors Associated with COVID-19-Related Death among Patients with End-Stage Renal Disease. BMC Nephrol. 2021, 22, 33. [Google Scholar] [CrossRef]
- Loffi, M.; Piccolo, R.; Regazzoni, V.; Di Tano, G.; Moschini, L.; Robba, D.; Quinzani, F.; Esposito, G.; Franzone, A.; Danzi, G.B. Coronary Artery Disease in Patients Hospitalised with Coronavirus Disease 2019 (COVID-19) Infection. Open Heart 2020, 7, e001428. [Google Scholar] [CrossRef]
- Guan, W.J.; Liang, W.H.; Shi, Y.; Gan, L.X.; Wang, H.B.; He, J.X.; Zhong, N.S. Chronic Respiratory Diseases and the Outcomes of COVID-19: A Nationwide Retrospective Cohort Study of 39,420 Cases. J. Allergy Clin. Immunol. Pract. 2021, 9, 2645–2655. [Google Scholar] [CrossRef]
- Iavarone, M.; D’Ambrosio, R.; Soria, A.; Triolo, M.; Pugliese, N.; Del Poggio, P.; Perricone, G.; Massironi, S.; Spinetti, A.; Buscarini, E.; et al. High Rates of 30-Day Mortality in Patients with Cirrhosis and COVID-19. J. Hepatol. 2020, 73, 1063–1071. [Google Scholar] [CrossRef] [PubMed]
- Mosquera-Sulbaran, J.A.; Pedreañez, A.; Carrero, Y.; Callejas, D. C-Reactive Protein as an Effector Molecule in Covid-19 Pathogenesis. Rev. Med. Virol. 2021, 31*, e2221. [Google Scholar] [CrossRef] [PubMed]
- Zhan, H.; Chen, H.; Liu, C.; Cheng, L.; Yan, S.; Li, H.; Li, Y. Diagnostic Value of D-Dimer in COVID-19: A Meta-Analysis and Meta-Regression. Clin. Appl. Thromb. Hemost. 2021, 27, 10760296211010976. [Google Scholar] [CrossRef]
- Henry, B.M.; Aggarwal, G.; Wong, J.; Benoit, S.; Vikse, J.; Plebani, M.; Lippi, G. Lactate Dehydrogenase Levels Predict Coronavirus Disease 2019 (COVID-19) Severity and Mortality: A Pooled Analysis. Am. J. Emerg. Med. 2020, 38, 1722–1726. [Google Scholar] [CrossRef] [PubMed]
- Penttilä, P.A.; Van Gassen, S.; Panovska, D.; Vanderbeke, L.; Van Herck, Y.; Quintelier, K.; Emmaneel, A.; Filtjens, J.; Malengier-Devlies, B.; Ahmadzadeh, K.; et al. High Dimensional Profiling Identifies Specific Immune Types along the Recovery Trajectories of Critically Ill COVID19 Patients. Cell. Mol. Life Sci. 2021, 78, 3987–4002. [Google Scholar] [CrossRef]
- Groeneveld, P.H.; Kwappenberg, K.M.; Langermans, J.A.; Nibbering, P.H.; Curtis, L. Relation between Pro- and Anti-Inflammatory Cytokines and the Production of Nitric Oxide (NO) in Severe Sepsis. Cytokine 1997, 9, 138–142. [Google Scholar] [CrossRef]
- Chen, L.; Deng, H.; Cui, H.; Fang, J.; Zuo, Z.; Deng, J.; Li, Y.; Wang, X.; Zhao, L. Inflammatory Responses and Inflammation-Associated Diseases in Organs. Oncotarget 2017, 9, 7204–7218. [Google Scholar] [CrossRef]
- Blackwell, T.S.; Christman, J.W. Sepsis and Cytokines: Current Status. Br. J. Anaesth. 1996, 77, 110–117. [Google Scholar] [CrossRef]
- World Medical Association. World Medical Association Declaration of Helsinki: Ethical Principles for Medical Research Involving Human Subjects. JAMA 2013, 310, 2191–2194. [Google Scholar] [CrossRef]
- National Health Commission; National Administration of Traditional Chinese Medicine. Diagnosis and Treatment Protocol for Novel Coronavirus Pneumonia (Trial Version 7). Chin. Med. J. 2020, 133, 1087–1095. [Google Scholar] [CrossRef] [PubMed]
- Vincent, J.L.; Moreno, R.; Takala, J.; Willatts, S.; De Mendonça, A.; Bruining, H.; Reinhart, C.K.; Suter, P.M.; Thijs, L.G. The SOFA (Sepsis-Related Organ Failure Assessment) Score to Describe Organ Dysfunction/Failure. Intensive Care Med. 1996, 22, 707–710. [Google Scholar] [CrossRef] [PubMed]
- Knaus, W.A.; Draper, E.A.; Wagner, D.P.; Zimmerman, J.E. APACHE II: A Severity of Disease Classification System. Crit. Care Med. 1985, 13, 818–829. [Google Scholar] [CrossRef] [PubMed]
- de Alencar, J.C.G.; Moreira, C.L.; Müller, A.D.; Chaves, C.E.; Fukuhara, M.A.; da Silva, E.A.; Miyamoto, M.F.S.; Pinto, V.B.; Bueno, C.G.; Lazar Neto, F.; et al. Double-Blind, Randomized, Placebo-Controlled Trial With N-Acetylcysteine for Treatment of Severe Acute Respiratory Syndrome Caused by Coronavirus Disease 2019 (COVID-19). Clin. Infect. Dis. 2021, 72, e736–e741. [Google Scholar] [CrossRef]
- Taher, A.; Lashgari, M.; Sedighi, L.; Rahimi-Bashar, F.; Poorolajal, J.; Mehrpooya, M. A Pilot Study on Intravenous N-Acetylcysteine Treatment in Patients with Mild-to-Moderate COVID19-Associated Acute Respiratory Distress Syndrome. Pharmacol. Rep. 2021, 73, 1650–1659. [Google Scholar] [CrossRef]
- Siddiqi, H.K.; Mehra, M.R. COVID-19 Illness in Native and Immunosuppressed States: A Clinical-Therapeutic Staging Proposal. J. Heart Lung Transplant. 2020, 39, 405–407. [Google Scholar] [CrossRef]
- Wu, C.; Chen, X.; Cai, Y.; Xia, J.; Zhou, X.; Xu, S.; Huang, H.; Zhang, L.; Zhou, X.; Du, C.; et al. Risk Factors Associated With Acute Respiratory Distress Syndrome and Death in Patients With Coronavirus Disease 2019 Pneumonia in Wuhan, China. JAMA Intern. Med. 2020, 180, 934–943. [Google Scholar] [CrossRef]
- Kishimoto, T. IL-6: From Its Discovery to Clinical Applications. Int. Immunol. 2010, 22, 347–352. [Google Scholar] [CrossRef]
- Steinmetz, H.T.; Herbertz, A.; Bertram, M.; Diehl, V. Increase in Interleukin-6 Serum Level Preceding Fever in Granulocytopenia and Correlation with Death from Sepsis. J. Infect. Dis. 1995, 171, 225–228. [Google Scholar] [CrossRef]
- Hack, C.E.; De Groot, E.R.; Felt-Bersma, R.J.; Nuijens, J.H.; Strack Van Schijndel, R.J.; Eerenberg-Belmer, A.J.; Thijs, L.G.; Aarden, L.A. Increased Plasma Levels of Interleukin-6 in Sepsis. Blood 1989, 74, 1704–1710. [Google Scholar] [CrossRef]
- Hummel, M.; Czerlinski, S.; Friedel, N.; Liebenthal, C.; Hasper, D.; von Baehr, R.; Hetzer, R.; Volk, H.D. Interleukin-6 and Interleukin-8 Concentrations as Predictors of Outcome in Ventricular Assist Device Patients before Heart Transplantation. Crit. Care Med. 1994, 22, 448–454. [Google Scholar] [CrossRef] [PubMed]
- Buck, C.; Bundschu, J.; Gallati, H.; Bartmann, P.; Pohlandt, F. Interleukin-6: A Sensitive Parameter for the Early Diagnosis of Neonatal Bacterial Infection. Pediatrics 1994, 93, 54–58. [Google Scholar] [CrossRef] [PubMed]
- Garbers, C.; Hermanns, H.M.; Schaper, F.; Müller-Newen, G.; Grötzinger, J.; Rose-John, S.; Scheller, J. Plasticity and Cross-Talk of Interleukin 6-Type Cytokines. Cytokine Growth Factor Rev. 2012, 23, 85–97. [Google Scholar] [CrossRef] [PubMed]
- Li, H.; Liu, W.; Xie, J. Circulating Interleukin-6 Levels and Cardiovascular and All-Cause Mortality in the Elderly Population: A Meta-Analysis. Arch. Gerontol. Geriatr. 2017, 73, 257–262. [Google Scholar] [CrossRef]
- Chen, X.; Liu, X.; Dong, R.; Zhang, D.; Qin, S. A Retrospective Observational Study of the Association Between Plasma Levels of Interleukin 8 in 42 Patients with Sepsis-Induced Myocardial Dysfunction at a Single Center Between 2017 and 2020. Med. Sci. Monit. 2021, 27, e933065. [Google Scholar] [CrossRef]
- Zeng, G.; Chen, D.; Zhou, R.; Zhao, X.; Ye, C.; Tao, H.; Sheng, W.; Wu, Y. Combination of C-Reactive Protein, Procalcitonin, IL-6, IL-8, and IL-10 for Early Diagnosis of Hyperinflammatory State and Organ Dysfunction in Pediatric Sepsis. J. Clin. Lab. Anal. 2022, 36, e24505. [Google Scholar] [CrossRef]
- Zhang, X.; Wang, J.; Guo, S. Predictive Value of IL-8 for Mortality Risk in Elderly Sepsis Patients of Emergency Department. Cytokine 2024, 184*, 156774. [Google Scholar] [CrossRef]
- Vahabi, M.; Rostamian, A.; Mirsharif, E.S.; Latifi, K.; Iranparast, S.; Ghazanfari, T. Neutrophil Markers as Predictors of COVID-19 Severity at Hospital Admission: A Cross-Sectional Study. Iran. J. Allergy Asthma Immunol. 2025, 24, 21–30. [Google Scholar] [CrossRef]
- Del Valle, D.M.; Kim-Schulze, S.; Huang, H.H.; Beckmann, N.D.; Nirenberg, S.; Wang, B.; Lavin, Y.; Swartz, T.H.; Madduri, D.; Stock, A.; et al. An Inflammatory Cytokine Signature Predicts COVID-19 Severity and Survival. Nat. Med. 2020, 26, 1636–1643. [Google Scholar] [CrossRef]
- Zhang, W.; Wang, W.; Hou, W.; Jiang, C.; Hu, J.; Sun, L.; Hu, L.; Wu, J.; Shang, A. The Diagnostic Utility of IL-10, IL-17, and PCT in Patients with Sepsis Infection. Front. Public Health 2022, 10, 923457. [Google Scholar] [CrossRef]
- Mauad, T.; Duarte-Neto, A.N.; da Silva, L.F.F.; de Oliveira, E.P.; de Brito, J.M.; do Nascimento, E.C.T.; de Almeida Monteiro, R.A.; Ferreira, J.C.; de Carvalho, C.R.R.; do Nascimento Saldiva, P.H.; et al. Tracking the Time Course of Pathological Patterns of Lung Injury in Severe COVID-19. Respir. Res. 2021, 22, 32. [Google Scholar] [CrossRef]
- Savin, I.A.; Zenkova, M.A.; Sen’kova, A.V. Pulmonary Fibrosis as a Result of Acute Lung Inflammation: Molecular Mechanisms, Relevant In Vivo Models, Prognostic and Therapeutic Approaches. Int. J. Mol. Sci. 2022, 23, 14959. [Google Scholar] [CrossRef]
- Huang, C.; Wang, Y.; Li, X.; Ren, L.; Zhao, J.; Hu, Y.; Zhang, L.; Fan, G.; Xu, J.; Gu, X.; et al. Clinical Features of Patients Infected with 2019 Novel Coronavirus in Wuhan, China. Lancet 2020, 395, 497–506. [Google Scholar] [CrossRef]
- Wu, Z.; McGoogan, J.M. Characteristics of and Important Lessons From the Coronavirus Disease 2019 (COVID-19) Outbreak in China: Summary of a Report of 72,314 Cases From the Chinese Center for Disease Control and Prevention. JAMA 2020, 323, 1239–1242. [Google Scholar] [CrossRef]
- Zheng, K.I.; Gao, F.; Wang, X.B.; Sun, Q.F.; Pan, K.H.; Wang, T.Y.; Ma, H.L.; Chen, Y.P.; Liu, W.Y.; George, J.; et al. Letter to the Editor: Obesity as a Risk Factor for Greater Severity of COVID-19 in Patients with Metabolic Associated Fatty Liver Disease. Metabolism 2020, 108, 154244. [Google Scholar] [CrossRef]
- Lighter, J.; Phillips, M.; Hochman, S.; Sterling, S.; Johnson, D.; Francois, F.; Stachel, A. Obesity in Patients Younger Than 60 Years Is a Risk Factor for COVID-19 Hospital Admission. Clin. Infect. Dis. 2020, 71, 896–897. [Google Scholar] [CrossRef]
Figure 1.
(A) TN-Fα ROC curve on the first (A) and third (B) days with mortality. (C) ROC curve of IL-10 on the first day with mortality. (D) ROC curve of IL-10 on the third day with mortality.
Figure 1.
(A) TN-Fα ROC curve on the first (A) and third (B) days with mortality. (C) ROC curve of IL-10 on the first day with mortality. (D) ROC curve of IL-10 on the third day with mortality.
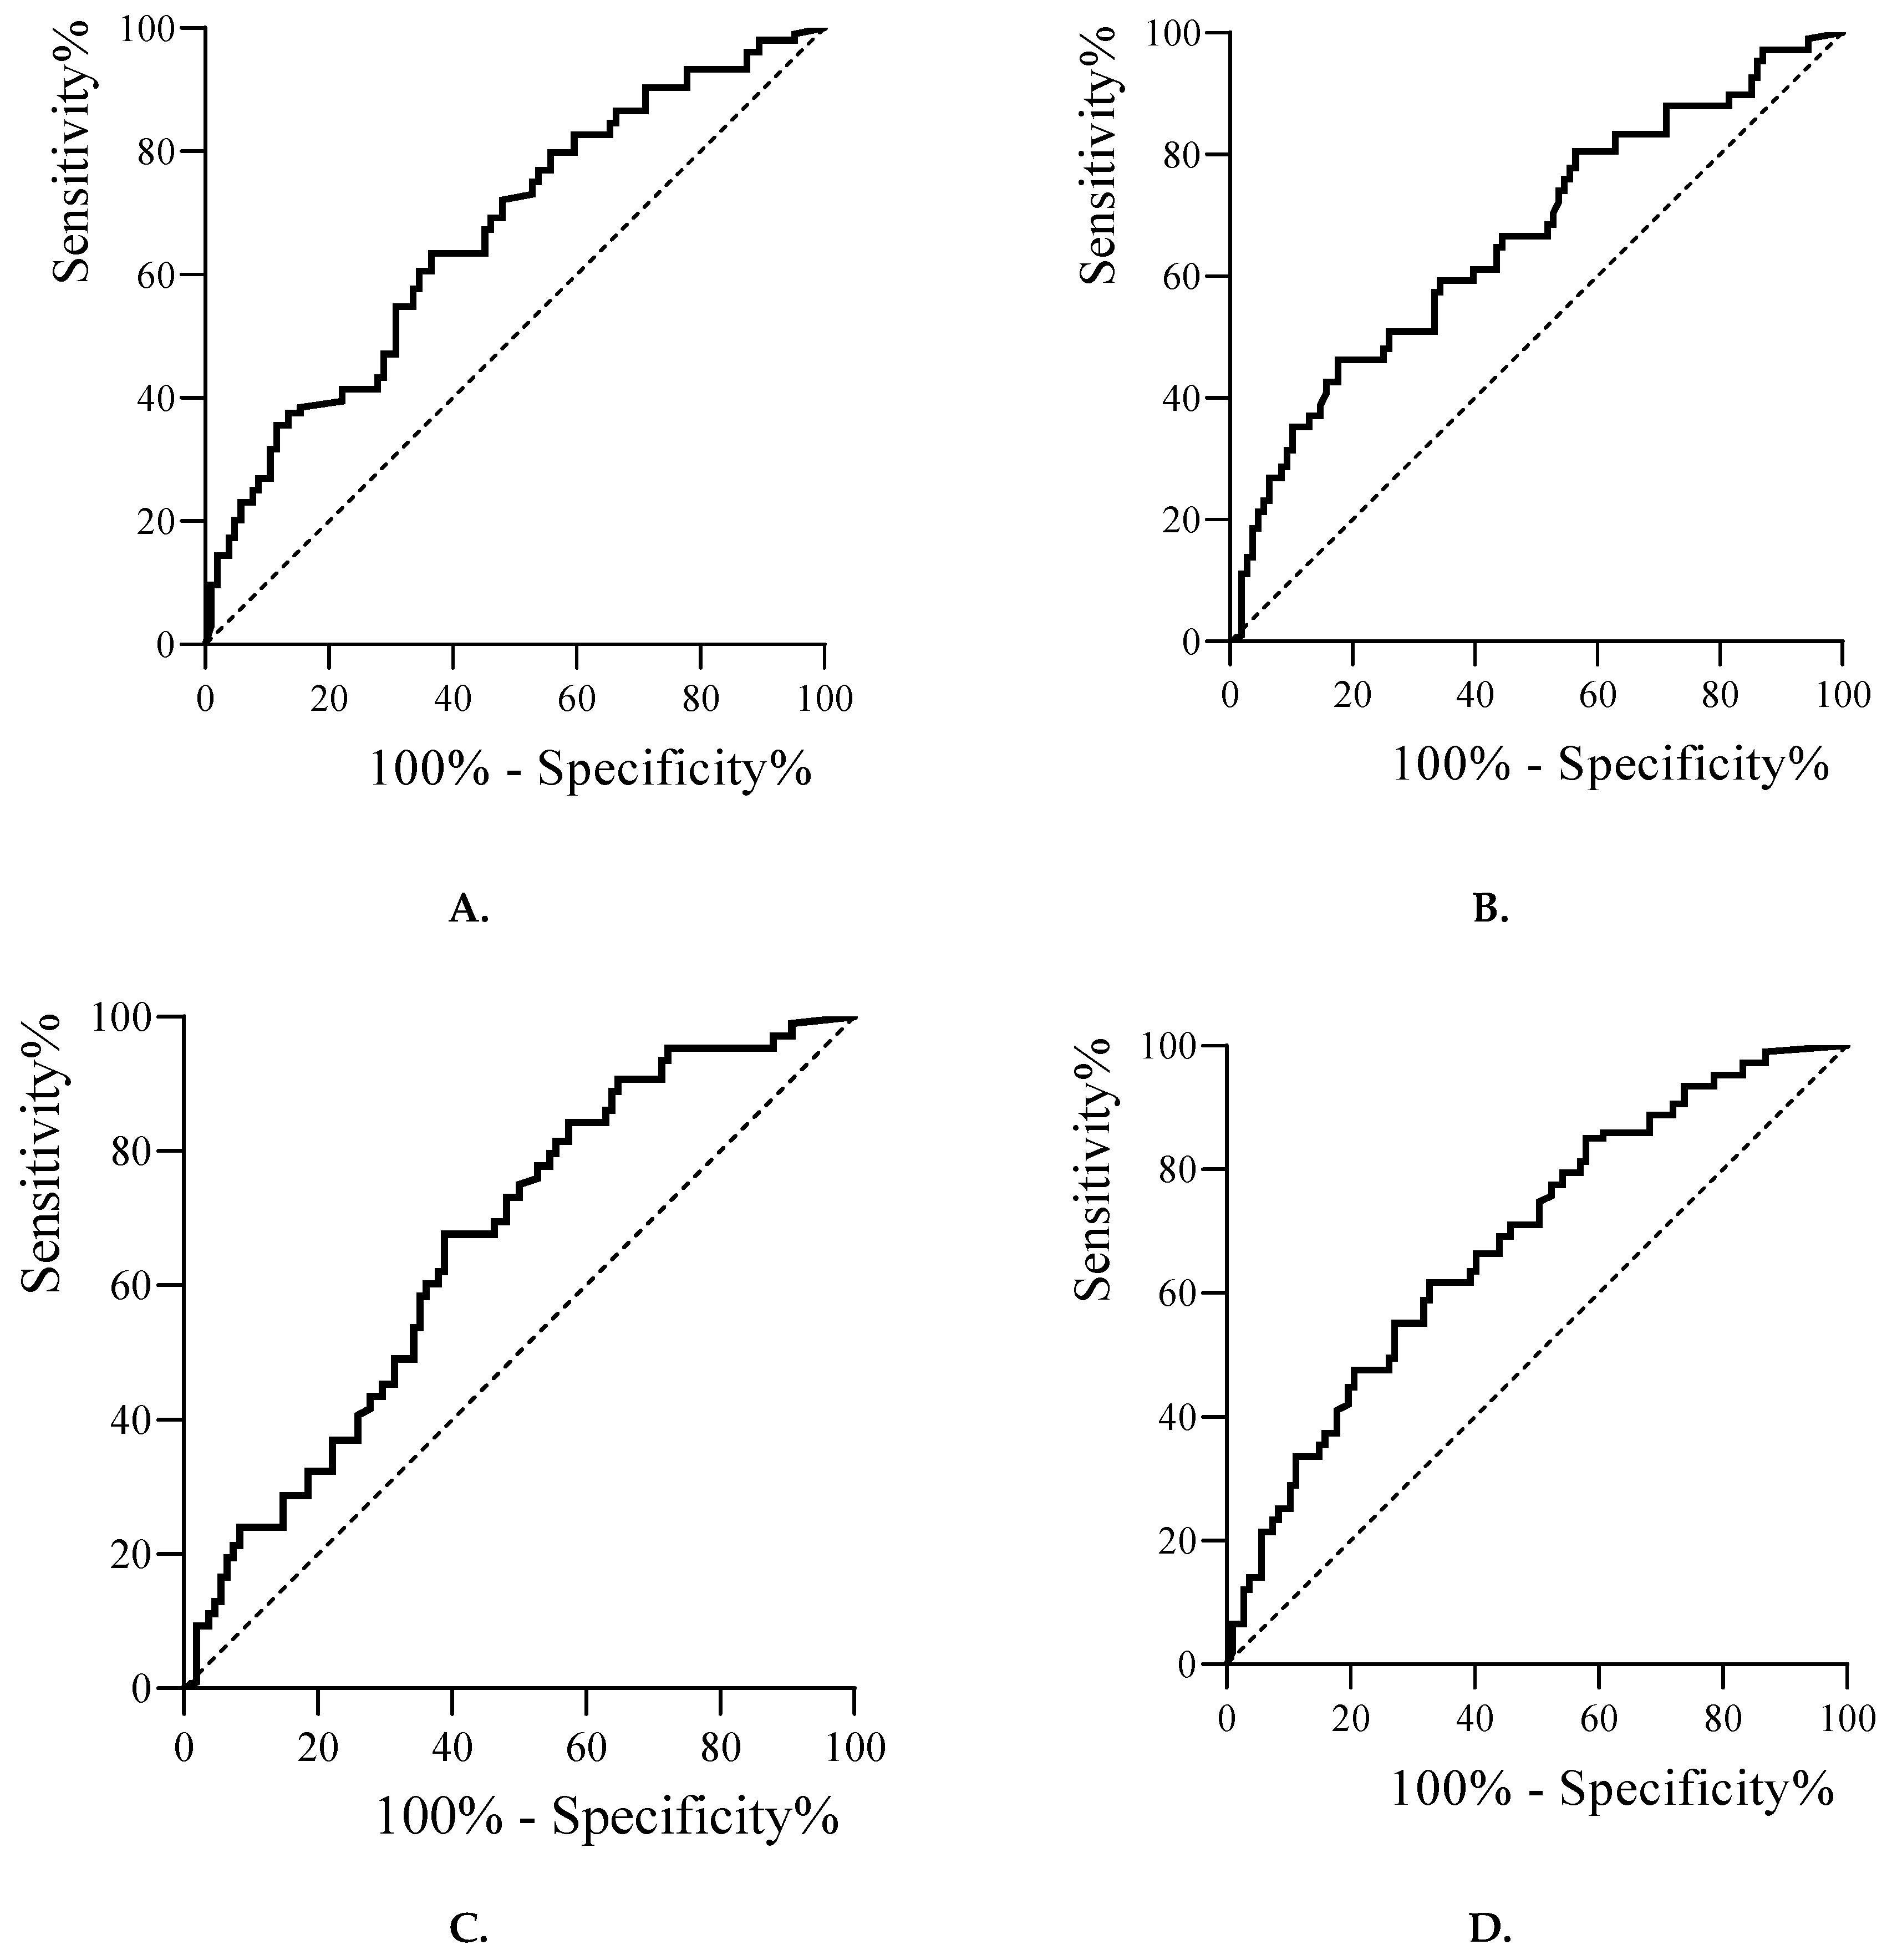
Figure 2.
Survival curves of patients with COVID-19 based on TNF-α levels. Cox regression model shows overall survival for TNF-α levels categorized by the median. There was worse survival if TNF-α levels was high (green, above cutoffs of 14.8 pg/mL) versus low (blue, below cutoffs). Each line indicates the predicted survival probability over follow-up time in ICU.
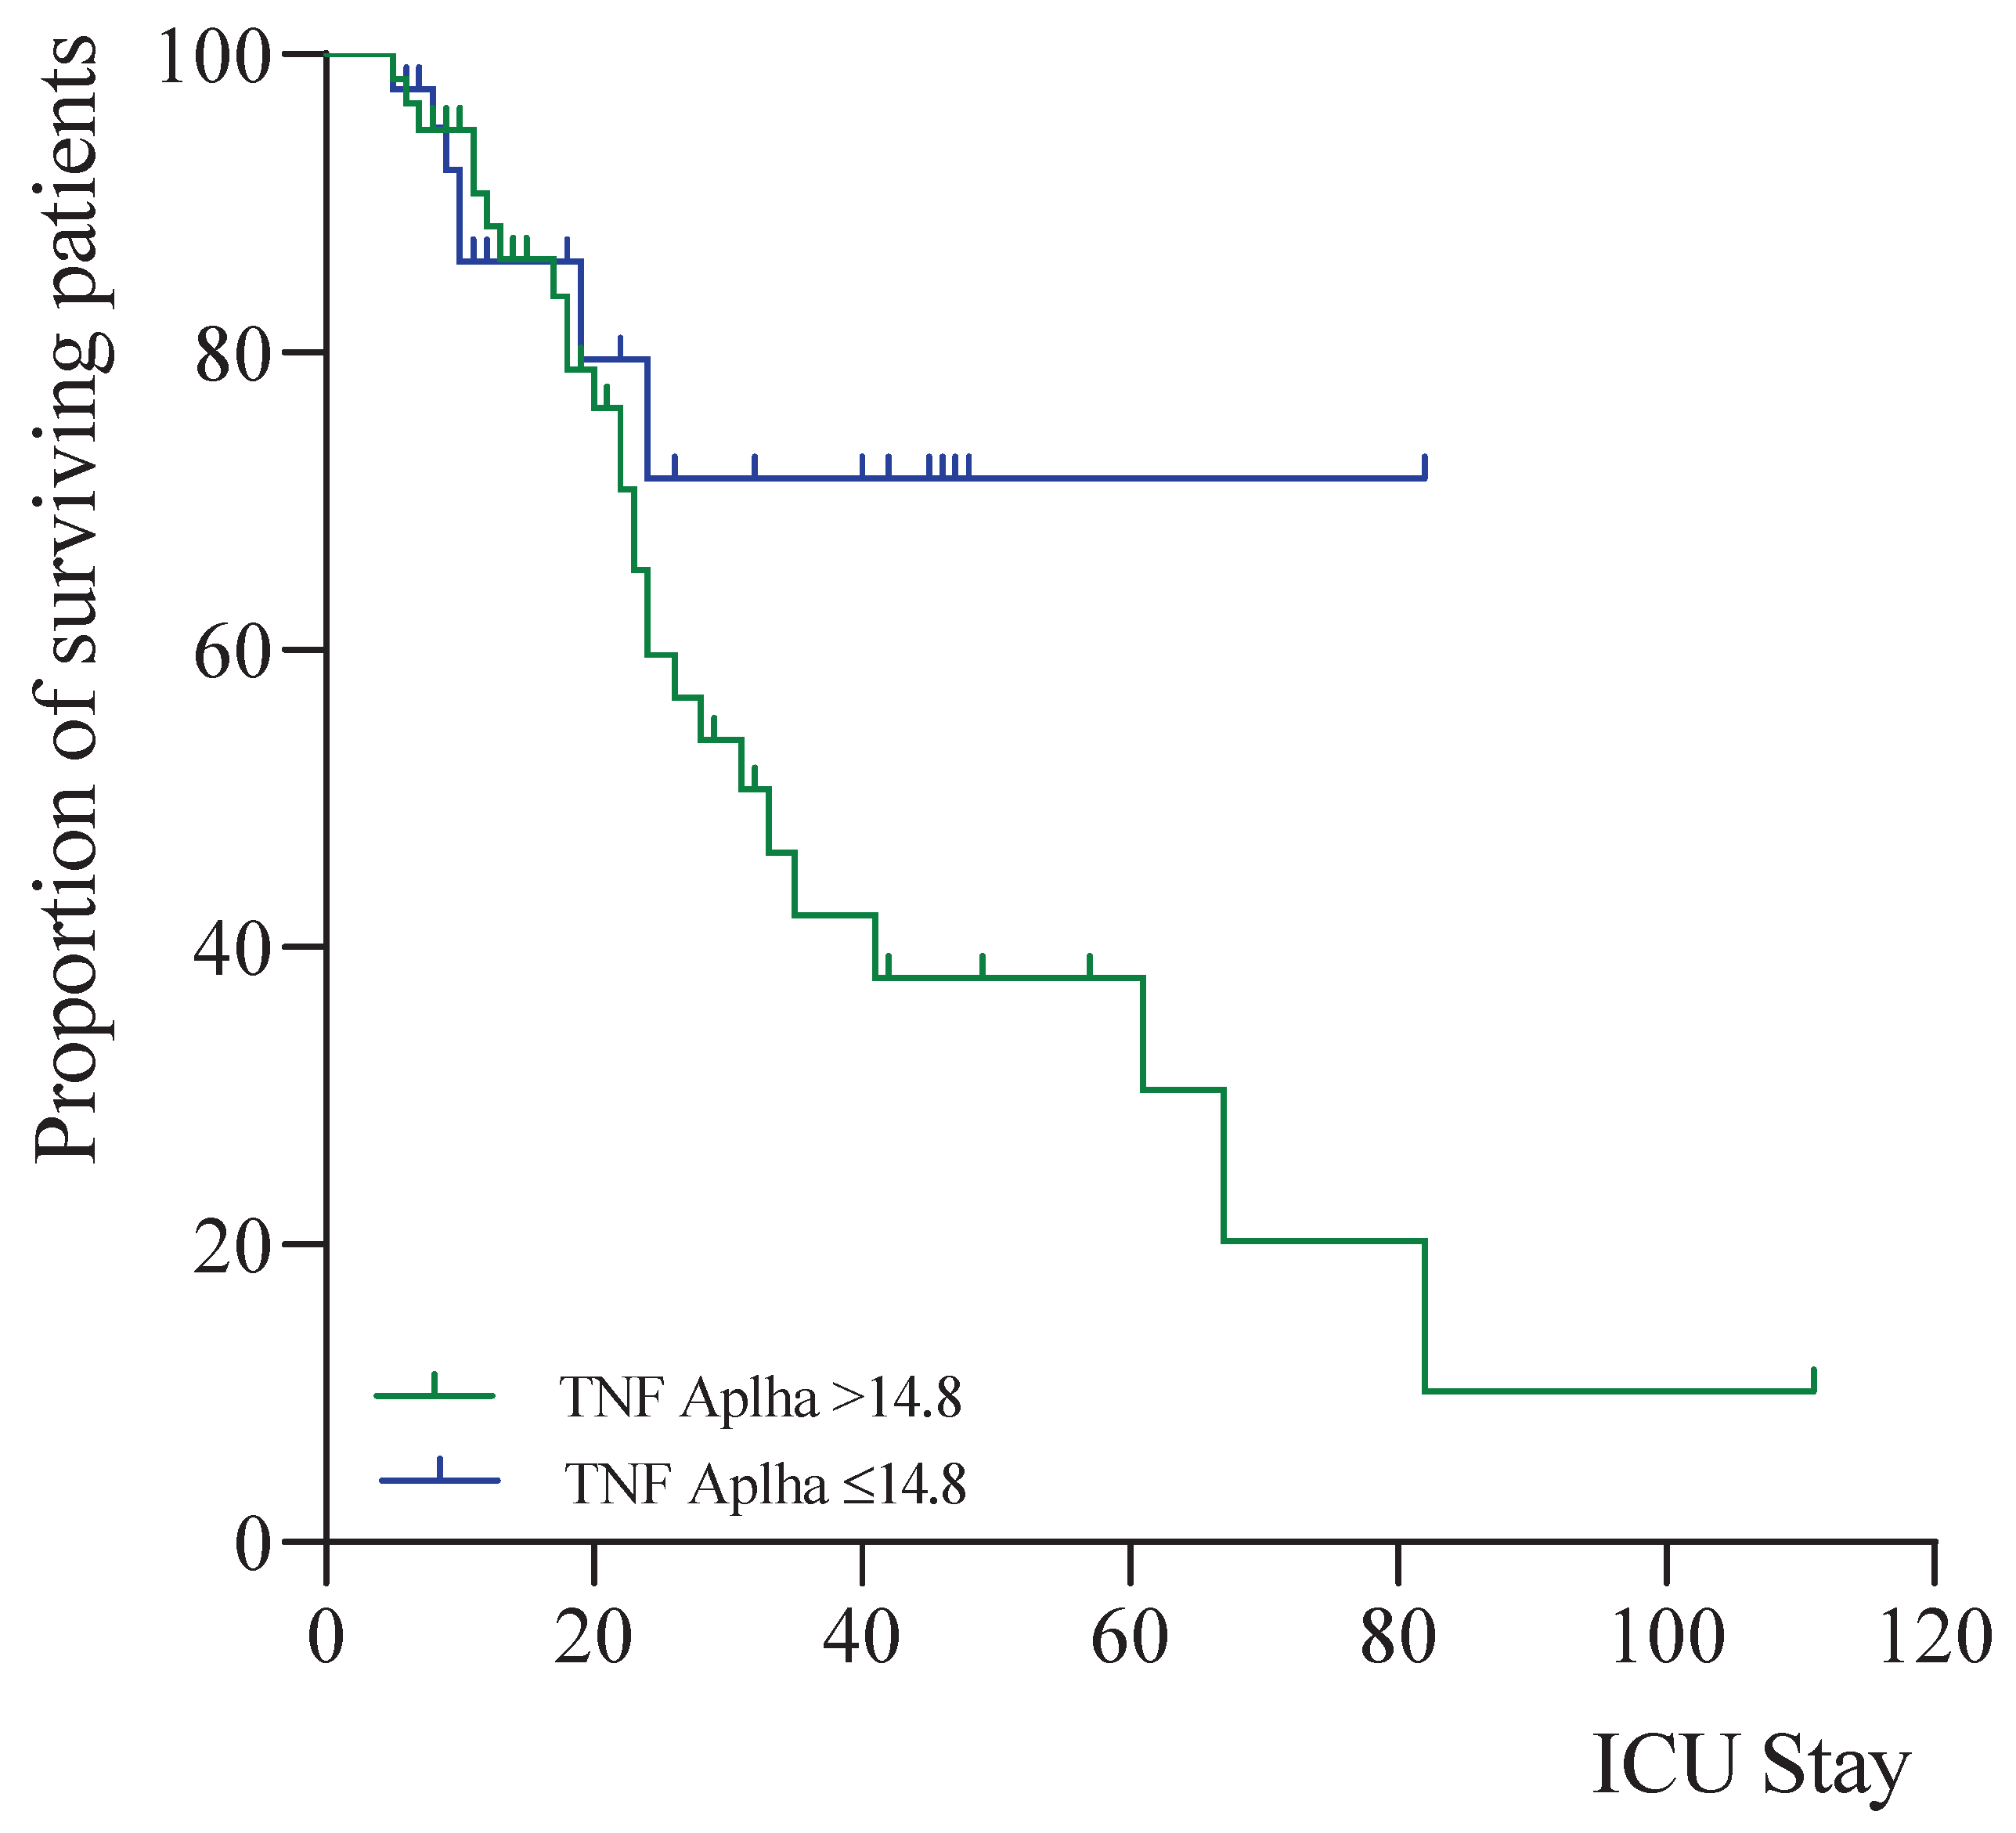

Table 1.
Clinical characteristics and evolution after three days of critical patients with COVID-19.
Table 1.
Clinical characteristics and evolution after three days of critical patients with COVID-19.
| n = 120 | 1st day median (p25th-p75th) |
3rd day median (p25th-p75th) |
p-value |
|---|---|---|---|
| Age (years) | 63.0 (56.0-72.0) | ||
| ICU stay (days) | 14.0 (9.0-28.0) | ||
| MV (days) | 9.0 (0.0-22.3) | ||
| SOFA (score) | 3.0 (3.0-4.0) | 5.0 (3.0-7.0) | 0.959 |
| APACHE II (score) | 13.0 (8.0-17.0) | ||
| MAP (mmHg) | 98.0 (81.8-110) | 84.0 (75.0-95.8) | 0.095 |
| HR (bpm) | 78.0 (65.0-89.0) | 62.5 (52.3-80.0) | 0.006* |
| BR (rpm) | 27.0 (22.0-30.0) | 22.0 (19.0-24.0) | 0.002* |
| FiO2 (%) | 0.85 (0.70-1.00) | 0.60 (0.50-0.70) | 0.001** |
| PaO2/FiO2 | 149 (100-224) | 200 (131-234) | 0.646 |
Statistical significance: *p <0.05; **p <0.01. MV: Mechanic ventilation. SOFA: Sequential Organ Failure Assessments. APACHE II: Acute Physiology and Chronic Health Evaluation II. MAP: Mean arterial pressure. HR: Heart rate. BR: Breathing rate. FiO2: Fraction of inspired oxygen. PaO2/FiO2: Partial pressure of oxygen/Fraction of inspired oxygen.
Table 2.
Interleukins evolution and other biochemical and hematological parameters on the third day of admission to the ICU of patients with COVID-19.
Table 2.
Interleukins evolution and other biochemical and hematological parameters on the third day of admission to the ICU of patients with COVID-19.
| n = 120 | 1st day median (p25th-p75th) |
3rd day median (p25th-p75th) |
P-value) |
|---|---|---|---|
| Biochemical variables | |||
| Sodium (mEq/L) | 139 (137-141) | 140 (137-144) | 0.059 |
| Potassium (mEq/L) | 4.10 (3.70-4.30) | 4.00 (3.70-4.40) | 0.763 |
| Creatinine (mg/dL) | 0.81 (0.72-1.12) | 0.74 (0.63-0.91) | 0.001** |
| ALT (U/L) | 34.5 (23.0-47.5) | 38.0 (25.0-62.8) | 0.001** |
| AST (U/L) | 34.0 (23.0-46.5) | 28.0 (20.0-42.5) | 0.014* |
| GGT (U/L) | 60.0 (40.5-105.3) | 95.5 (58.3-156.0) | 0.001** |
| LDH (U/L) | 495 (414-621) | 435 (352-510) | 0.001** |
| Creatine kinase (U/L) | 76.0 (35.5-141.8) | 39.0 (21.5-105.5) | 0.007* |
| Haematological variables | |||
| Haemoglobin g/dL | 13.5 (11.8-14.5) | 12.6 (11.1-13.7) | 0.001** |
| Haematocrit (%) | 38.8 (34.7-38.8) | 36.8 (33.0-40.2) | 0.001** |
| Leukocytes *103/µL | 9.67 (7.51-13.7) | 8.80 (6.86-11.84) | 0.013* |
| Lymphocytes (%) | 6.00 (3.68-9.03) | 9.15 (5.40-13.83) | 0.001** |
| Neutrophils (%) | 89.9 (86.1-92.8) | 84.4 (77.6-89.9) | 0.001** |
| Platelets *103/µL | 237 (197-295) | 264 (204-343) | 0.001** |
| INR | 1.08 (1.00-1.18) | 1.06 (0.97-1.14) | 0.088 |
| APTT (s) | 28.8 (26.9-32.2) | 28.8 (26.8-31.1) | 0.500 |
| Inflammatory markers | |||
| Fibrinogen (mg/dL) | 678 (541-792) | 573 (403-686) | 0.001** |
| DD (ng/mL) | 980 (553-1633) | 1400 (895-4550) | 0.001** |
| CRP (mg/L) | 131.1 (52.9-187.9) | 64.0 (23.5-122.6) | 0.001** |
| Ferritin (ng/mL) | 1447 (720-2107) | 1333 (740-2419) | 0.028* |
| IL-1β (pg/mL) | 0.51 (0.01-0.95) | 0.46(0.01-0.95) | 0.013* |
| IL-2 (pg/mL) | 0.93 (0.29-1.63) | 1.09 (0.30-1.57) | 0.865 |
| IL-6 (pg/mL) | 44.0 (16.0-105.0) | 47.0 (13.3-141.9) | 0.109 |
| IL-7 (pg/mL) | 2.39 (0.08-7.50) | 2.02 (0.04-7.05) | 0.141 |
| IL-8 (pg/mL) | 53.7 (31.1-102.0) | 69.3 (36.7-129.0) | 0.073 |
| IL-10 (pg/mL) | 43.2 (18.6-81.8) | 27.9 (12.2-49.8) | 0.001** |
| TNFα (pg/mL) | 14.80 (8.98-23.30) | 19.29 (11.01-31.41) | 0.001** |
Statistical significance: *p <0.05; **p <0.01. ALT: Alanine aminotransferase. AST: Aspartate aminotransferase. GGT: Glutamyl transferase. LDH: Lactate dehydrogenase. INR: International Normalized Ratio. APTT: Activated partial thromboplastin time. DD: D-dimer. CRP: C reactive protein. IL-1β: Interleukin-1beta. IL-2: Interleukin-2. IL-6: Interleukin-6. IL-7: Interleukin-7. IL-8: Interleukin 8. IL-10: Interleukin-10. TNFα: Tumor necrosis factor-alpha.
Table 3.
Association of interleukins with 28-day mortality in patients with COVID-19.
| n = 120 | 1st day | 3rd day | ||||
|---|---|---|---|---|---|---|
| Survivors Median (p25th-p75th) |
Deceased Median (p25th-p75th) |
P-value | Survivors Median (p25th-p75th) |
Deceased Median (p25th-p75th) |
P-value | |
| IL-1β (pg/mL) | 0.547 (0.010-1.261) | 0.547 (0.269-0.871) | 0.899 | 0.431 (0.010-0.976) | 0.547 (0.188-1.044) | 0.489 |
| IL-2 (pg/mL) | 1.151 (0.355-1.608) | 1.313 (0.250-1.66) | 0.947 | 1.20 (0.40-1.57) | 1.32 (0.20-1.64) | 0.912 |
| IL-6 (pg/mL) | 34.0 (15.7-87.6) | 69.1 (15.9-203.0) | 0.290 | 59.2 (15.8-172.7) | 24.5 (10.1-66.0) | 0.447 |
| IL-7 (pg/mL) | 2.40 (0.05-6.57) | 2.30 (0.040-10.128) | 0.861 | 1.29 (0.04-6.99) | 3.90 (0.05-7.64) | 0.185 |
| IL-8 (pg/mL) | 51.4 (31.6-86.6) | 63.4 (31.0-162.7) | 0.238 | 59.3 (26.8-107.7) | 103.1 (44.0-144.5) | 0.026* |
| IL-10 (pg/mL) | 34.1 (13.2-62.7) | 52.6 (35.7-124.5) | 0.004* | 19.7 (10.5-40.9) | 43.3 (22.6-97.7) | 0.001** |
| TNFα (pg/mL) | 13.2 (20.4) | 19.0 (12.9-35.6) | 0.003* | 16.1 (10.7-28.0) | 25.5 (16.8-60.5) | 0.004* |
Statistical significance: *p <0.05; **p <0.01. IL-1β: Interleukin-1beta. IL-2: Interleukin-2. IL-6: Interleukin-6. IL-7: Interleukin-7. IL-8: Interleukin 8. IL-10: Interleukin-10. TNFα: Tumor necrosis factor-alpha.
Table 4.
Association between interleukins and clinical parameters of ICU patient severity.
| n = 120 | SOFA | APACHE | MVD | ICU stay | FiO2 | PaFi | |
|---|---|---|---|---|---|---|---|
| 1st day | IL-1β (pg/mL) | -.152 | .028 | -.164 | -.220* | -.052 | .057 |
| IL-2 (pg/mL) | .004 | -.079 | -.123 | -.185 | .088 | -.161 | |
| IL-6 (pg/mL) | .280 | .127 | -.164 | -.200 | .262 | .058 | |
| IL-7 (pg/mL) | -.333* | -.011 | -.082 | -.087 | .164 | -.133 | |
| IL-8 (pg/mL) | .100 | .085 | .085 | -.050 | .032 | -.415* | |
| IL-10 (pg/mL) | .198 | .201 | .198* | .072 | .028 | .070 | |
| TNFα (pg/mL) | .178 | .171 | .222* | .122 | -.172 | -.089 | |
| 3rd day | IL-1β (pg/mL) | -.013 | -.083 | -.136 | .017 | -.205 | |
| IL-2 (pg/mL) | .103 | .070 | -.132 | .002 | -.163 | ||
| IL-6 (pg/mL) | -.999 | -.233 | -.206 | .171 | .097 | ||
| IL-7 (pg/mL) | .626 | -.032 | -.009 | -.013 | -.032 | ||
| IL-8 (pg/mL) | .256 | .276* | .147 | .034 | -.336* | ||
| IL-10 (pg/mL) | .305 | .377** | .289* | -.219* | -.114 | ||
| TNFα (pg/mL) | .274 | .276* | .214* | -.062 | -.114 | ||
Statistical significance: *p <0.05; **p <0.01. SOFA: Sequential Organ Failure Assessments. APACHE II: Acute Physiology and Chronic Health Evaluation II. MVD: Mechanic ventilation days. ICU: Intensive Care Unit. IL-1β: Interleukin-1beta. IL-2: Interleukin-2. IL-6: Interleukin-6. IL-7: Interleukin-7. IL-8: Interleukin 8. IL-10: Interleukin-10. TNFα: Tumor necrosis factor-alpha.
Table 5.
Correlations between interleukins and inflammatory markers.
| n=120 | Fibrinogen | DD | CRP | Ferritin | |
|---|---|---|---|---|---|
| 1st day | IL-1β (pg/mL) | .005 | -.021 | -.040 | .007 |
| IL-2 (pg/mL) | .059 | -.045 | .072 | .082 | |
| IL-6 (pg/mL) | -.003 | .165 | .138 | .083 | |
| IL-7 (pg/mL) | -.030 | -006 | -.082 | -.186 | |
| IL-8 (pg/mL) | .044 | .202* | .137 | -.093 | |
| IL-10 (pg/mL) | .007 | .189* | .281* | .023 | |
| TNFα (pg/mL) | .139 | .130 | .104 | .053 | |
| 3rd day | IL-1β (pg/mL) | .162 | -.106 | .069 | .053 |
| IL-2 (pg/mL) | -.001 | -.065 | -.022 | .055 | |
| IL-6 (pg/mL) | -.029 | .593* | .261 | .084 | |
| IL-7 (pg/mL) | .024 | -.037 | .059 | -.106 | |
| IL-8 (pg/mL) | .191 | .010 | .334** | .007 | |
| IL-10 (pg/mL) | .148 | .101 | .355** | .059 | |
| TNFα (pg/mL) | .051 | .032 | .121 | .079 |
r = Correlation coefficient. Statistical significance: *p< 0.05; **p< 0.01. DD: D-dimer. CRP: C reactive protein. IL-1β: Interleukin-1beta. IL-2: Interleukin-2. IL-6: Interleukin-6. IL-7: Interleukin-7. IL-8: Interleukin 8. IL-10: Interleukin-10. TNFα: Tumor necrosis factor-alpha.
Disclaimer/Publisher’s Note: The statements, opinions and data contained in all publications are solely those of the individual author(s) and contributor(s) and not of MDPI and/or the editor(s). MDPI and/or the editor(s) disclaim responsibility for any injury to people or property resulting from any ideas, methods, instructions or products referred to in the content. |
© 2026 by the authors. Licensee MDPI, Basel, Switzerland. This article is an open access article distributed under the terms and conditions of the Creative Commons Attribution (CC BY) license (http://creativecommons.org/licenses/by/4.0/).
Copyright: This open access article is published under a Creative Commons CC BY 4.0 license, which permit the free download, distribution, and reuse, provided that the author and preprint are cited in any reuse.


