
Submitted:
20 February 2026
Posted:
27 February 2026
You are already at the latest version
Abstract
Object detection technologies form the foundation of real-time performance across a broad spectrum of applications, ranging from autonomous systems to medical imaging. This study analyzes the extensive architectural evolution of the YOLO series, the benchmark for this field, from its initial version to the cur rent YOLO26 model. Throughout the paper, structural transformations in the backbone, neck, and detection head components are examined chronologically. The review focuses on critical technical milestones, including the transition from anchor-based to anchor-free systems, the integration of attention mechanisms, and optimizations to loss functions. Furthermore, by evaluating the density of literature, data labeling tools, and the wide range of applications, the study exam ines the evolutionary logic of object detection architectures and the technological framework of modern models in comprehensive detail.
Keywords:
object detection
; segmentation
; You Only Look Once
; deep learning
; YOLO
; YOLOv12
; YOLO26
1. Introduction
Object detection is a foundational element in contemporary computer vision systems, especially those demanding real-time performance, such as autonomous vehicles [1,2,3], unmanned aerial vehicles [4,5,6], security systems [7,8], robotic applications [9,10], and augmented reality [11] Over time, numerous methods for real-time object detection have been introduced, which are generally classified into two principal paradigms according to their detection pipelines: two-stage and one-stage detectors. In two-stage models, the detector initially generates region proposals, followed by classification and refinement of their locations. The main representatives of these methods are Region-based CNN(R-CNN) [12], Fast R-CNN [13], and Faster R-CNN[14]. R-CNN processes roughly 2,000 region proposals per image, feeding each proposal separately into the CNN for feature extraction and classification [15]. Despite its high accuracy, running the CNN for each candidate region is quite slow and computationally expensive. Fast R-CNN, in contrast to R-CNN, produces a common feature map by feeding the image to the CNN once. Then, all candidate regions are extracted from this feature map using Region of Interest (RoI) pooling. While Fast R-CNN is significantly faster than R-CNN because the CNN is only run once, it still depends on the Selective Search algorithm, which remains a major computational bottleneck.
Faster R-CNN enables the network itself to directly generate region proposals by using a Region Proposal Network (RPN) instead of Selective Search, which is the main bottleneck of Fast R-CNN. In this way, the method provides significant improvements in both speed and accuracy. However, due to the complexity of the architecture and the presence of the region proposal stage, the inference speed of the model often remains insufficient for real-time requirements.
To overcome these limitations, one-stage object detection methods have been developed. These methods eliminate the region proposal step entirely, performing classification and localization in a single stage. Among single-stage approaches, the You Only Look Once (YOLO) family stands out as one of the most effective and widely used methods, balancing speed and accuracy. YOLO formulates detection as a single regression problem, allowing real-time inference through a unified forward pass. Over time, the YOLO family has evolved into a progressively more advanced framework through architectural refinements, stronger backbone networks, improved feature-fusion mechanisms, and optimized training strategies [16]. Figure 1 illustrates the chronological evolution of the YOLO family from YOLOv1 to YOLO26.
In the literature, there are various review studies that examine the evolution of the YOLO family over the years. The study conducted by Vijayakumar et al. [17] evaluates the development process from the first version of YOLO to YOLOv8; however, it mainly outlines high-level differences and lacks in-depth architectural or component-level analysis. However, the study does not include more recent versions released after YOLOv8 and therefore excludes developments related to the current versions of the YOLO family. Jiang et al. [18] focused only on YOLOv2 to YOLOv5 and analyzed trends such as citation statistics and web search frequency, yet the study did not delve into technical aspects such as architectural structures, modular changes, or design motivations. Similarly, the works of Terven et al. [19] and Hussain [20] provide overviews of YOLOv1 to YOLOv8 but largely remain descriptive compilations of existing features. Moreover, none of these studies cover newer versions from YOLOv8 to YOLO26, leaving a noticeable gap in comprehensive architectural and optimization-focused evaluations. In this review, we address this gap by examining all versions of YOLO—from YOLOv1 to the most recent YOLO26—in terms of their architectural design principles, core components, feature-fusion strategies, loss functions, strengths, and limitations.
2. Background
2.1. Data Annotation Tools
Data annotation is a core step that requires determining the position and class of each object so that the model can correctly recognize objects within an image. In this process, objects in images are marked with a bounding box in rectangular form using an annotation tool, and each box is assigned the relevant class. YOLO represents each object in a single-line text format; it contains the object’s class ID, bounding box centre coordinates, and the box’s normalized width and height values. Once labelling is complete, a .txt file with the same name is created for each image, containing lines that describe all objects in that image[21]. The dataset is then split into training and validation subdirectories to conform to the standard structure expected by YOLO. Accurate and consistent annotation directly impacts model performance; it is therefore critical that boxes fully encompass the object, class labels are used consistently, and small objects in particular are carefully annotated [22]. In this regard, numerous modern annotation tools have been developed to simplify and accelerate data labelling processes. A summary of the sources, and key features of commonly used data labelling platforms in the literature is provided in Table 1.
Table 1 shows that annotation platforms differ according to their intended use. LabelImg and VoTT are sufficient for individual or small-scale projects due to their simple structures, while Roboflow and Supervisely are more suitable for large data sets with their automatic labelling and cloud-based management features. CVAT is frequently preferred in both academic and corporate projects due to its advanced video annotation and web-based workflow. LabelMe and Label Studio, on the other hand, have advantages in research projects with different data types thanks to their multi-format output support and flexible annotation options.
2.2. Benchmark Datasets
There are many benchmark datasets already labeled in the literature. These datasets enable the evaluation of different architectures on the same data, ensuring that model performances are compared in a fair, repeatable, and objective manner. They are also frequently preferred for measuring the generalization capacity of new methods due to their offering of different resolutions, object densities, and scenario diversities. Table 2 summarizes the fundamental benchmark datasets.
Table 2 shows that the benchmark datasets offer a wide variety adapted to different problem domains. General object detection, autonomous driving, aerial and drone imagery, and human or health-focused datasets differ significantly in terms of resolution, object density, number of classes, and scene complexity. This variety makes it possible to evaluate whether models perform consistently across a wide range of conditions rather than being limited to a single scenario.
In particular, datasets containing a large number of classes, dense or small objects, or severe occlusions serve as rigorous testing environments for evaluating a model’s generalization ability and capacity to distinguish objects in challenging scenes. Consequently, comprehensive benchmark datasets play a crucial role in accurately identifying potential overfitting or underfitting issues and enabling fair, repeatable, and objective comparisons between models.
2.3. Data Augmentation Techniques
To improve the robustness of deep learning-based object detection frameworks, data augmentation techniques are utilized to systematically alter the chromatic and geometric characteristics of images, ensuring better generalization across varied real-world environments. In the existing literature, hue, saturation, and exposure (brightness) variations represent the most prevalent color-based enhancement strategies.
Specifically, hue shifting randomly adjusts the image’s color spectrum to account for spectral variations caused by different illuminants, which is crucial for outdoor scene analysis. The saturation modification fluctuates the intensity of the colors to replicate the effects of various atmospheric conditions and sensor configurations. Furthermore, brightness adjustment regulates the global illumination of the scene to simulate extreme lighting conditions, such as deep shadows or high exposure, thereby enhancing the model’s stability. A visual representation of these color-based augmentation techniques is provided in Figure 2.
Regarding data augmentation techniques based on geometric transformations, the most frequently employed methods are rotation, scaling, and shearing. The rotation process represents real-life scenarios where objects may appear in different orientations by randomly rotating images within a specific angular range; thus, it enhances robustness against tilted camera angles or moving platforms. Scaling facilitates the accurate detection of both small and large objects by simulating varying distances through random zooming in or out. Shearing creates a linear deformation in the image to mimic distortions caused by oblique camera positions or off-perspective angles. A representative visual of these transformations is also provided in Figure 3.
Another approach utilized in data augmentation is patch-based methods. Mixup generates intermediate samples by blending two images and their corresponding labels at specific ratios, thereby smoothing decision boundaries and providing the model with additional generalization capability against overfitting. CutMix is based on the principle of cropping a random rectangular region from one image and pasting it onto another; this particularly assists in the realistic modeling of complex scenes where objects exhibit occlusion. The Copy-Paste method works by extracting objects defined by segmentation masks from one image and pasting them into another. This method reduces class imbalance by enabling the artificial multiplication of rare classes and allows models to better learn objects within diverse contexts. A representative visual of these transformations is also provided in Figure 4.
2.4. Performance Measurement Metrics
Object detection models can only be fairly compared in terms of accuracy, speed, and computational cost if these metrics, which are widely accepted in the literature, are applied consistently. Therefore, fundamental performance indicators such as Intersection over Union (IoU), Average Precision (AP), Mean Average Precision (mAP), Frame Per Second (FPS), and Floating Point Operations (FLOPs) play a critical role in the study of object detection. IoU measures the overlap ratio between the predicted bounding box and the actual bounding box. IoU is defined as the ratio of the intersection area of two boxes to their union area. It is expressed mathematically in Equation 1 and is also explained visually in Figure 5, which shows the intersection and union areas of the predicted box and the actual box on an example object, illustrating how IoU is calculated.
As depicted in Figure 5, IoU ranges between 0 and 1, and as it approaches 1, the model’s localization accuracy increases. In object detection, a prediction is generally considered a true positive (TP) if the IoU exceeds a certain threshold value. Since IoU evaluates localization errors independently of object classification errors, it is used as a fundamental baseline metric in the performance analysis of all object detection models, including modern YOLO versions.
Object detection models can generate multiple bounding boxes for the same object, as the network produces predictions across numerous locations and scales on the feature maps. This situation leads to redundant detections of a single object, particularly due to dense predictions originating from high-resolution layers. Consequently, a post-processing stage is required to refine prediction results and select only the most accurate bounding box. This stage is predominantly executed using NMS, the most widely adopted method in the literature (1).
NMS begins by ranking all candidate boxes generated by the model according to their confidence scores. Initially, the box with the highest score is selected, and other boxes exhibiting an Intersection over Union (IoU) similarity above a predefined threshold (i.e., those with significant overlap) are discarded. Thus, redundant predictions for the same object are suppressed, leaving only the most representative box. This process is iterated until no boxes remain.
The selection of the IoU threshold directly influences NMS performance:
- High IoU threshold: May lead to the merging of distinct, closely situated objects.
- Low IoU threshold: May cause the retention of multiple predictions for the same object, thereby increasing the False Positive (FP) rate.
Therefore, NMS is a critical component in object detection regarding both accuracy and output quality. Although NMS-free training strategies have been developed in recent models (e.g., YOLOv10) to eliminate the need for NMS, it remains a fundamental component in many modern detectors.
| Algorithm 1: Non-Maximum Suppression Algorithm |
|
Precision indicates the accuracy rate of the model’s positive predictions and measures the impact of false positives (FP) on performance. In other words, precision shows how many of the objects detected by the model are actually correct. As expressed in Equation 2, the Precision value is particularly important in critical applications, where false detections need to be reduced.
Recall indicates the model’s rate of capturing actual objects. Recall is the ratio of true positives to all actual positives, measuring the model’s tendency to miss objects (FN). It is calculated as defined in Equation 3.
Precision and recall often show an inversely proportional relationship; therefore, the Precision–Recall (PR) curve is used to evaluate the overall performance of models. The PR curve is a graphical representation of the precision and recall values obtained under different threshold values, and the size of the area under the curve indicates that the model is more balanced and successful. The AP metric derived from this curve represents the area under the PR curve for a specific IoU threshold value. Equation 4 shows the mathematical formula for the AP metric. The average of the AP values calculated for all classes is called mAP.
In addition to model accuracy, the Frames Per Second (FPS) metric is crucial for real-time application requirements. FPS indicates the number of images a model can process per second. It is calculated using the formula in Equation 5.
In Equation 5, the parameter is the total inference time required to process a single image in seconds. The FLOPs metric, which quantitatively expresses the computational load of the model, measures the total number of floating point operations performed during a forward pass. FLOPs vary depending on the model and layer type, and calculated as shown in Equation 6 for a convolution layer.
In Equation 6, H, W, and denote the height, width, and number of channels of the output feature map, respectively; K denotes the filter size; and denotes the number of input channels. Another important metric, the number of parameters, refers to the total number of learnable weights in the model. The number of parameters is particularly important in terms of model size and hardware requirements, and its formula is given in Equation 7.
is the weight parameters in the i-th layer, is the bias parameters, and L is the total number of layers. As the number of parameters decreases, the model’s memory requirements decrease; as it increases, accuracy generally improves, but computational cost also increases.
3. Evolution of the YOLO Family
This section provides a concise yet technically grounded overview of the evolution of the YOLO family, spanning from YOLOv1 to YOLO26. For each iteration, the primary architectural modifications, the evolution of backbone, neck, and head structures, and the design objectives driving these changes are examined. Rather than delving into exhaustive algorithmic derivations, the purpose is to demonstrate, within a clear comparative framework, how the models have progressively advanced in terms of representation capacity, multi-scale feature processing, and detection efficiency.
3.1. YOLOv1
YOLOv1 was proposed by Joseph Redmon et al.[40] in 2015 and published at the IEEE CVPR conference. It is considered one of the first methods to introduce a single-stage and real-time approach to object detection. In previous methods, object detection was a multi-stage process involving a combination of independent steps such as region proposal, classification, and regression.
The model divides the input image into an grid. In this setup, each grid cell is responsible for detecting the objects whose centers fall within its own region. These predictions are produced by a deep CNN architecture, whose detailed configuration is given in Table 3. The architecture consists of 24 convolutional layers followed by two fully connected layers, which extract multi-scale features from the image. These feature maps are then passed to the fully connected layers, where the bounding box coordinates and class probabilities are computed. The overall detection process is illustrated in Figure 6.
As a result of this process, the model generates a bounding box independent of the B classes for each cell and calculates the center coordinates (x,y), width–height values (w,h), and a confidence score for these boxes. The confidence score includes both the probability of an object being present in the cell and the IoU value, which represents the overlap ratio between the predicted box and the actual object. The information produced by the model creates a single output tensor of size for the entire image. Since multiple boxes can be generated for the same object, NMS is applied to eliminate redundant and overlapping boxes. NMS ensures that the final detection results are obtained by retaining only the bounding box with the highest confidence score among those with high IoU that overlap. The loss function used in training YOLOv1 has a multi-component structure because the model simultaneously performs location regression, class probability estimation, and object presence prediction. This function is a combined error metric that aggregates location prediction errors, bounding box confidence scores, and class probabilities as a sum of squares, as proposed in the original work. Thus, the model learns both correct classification and correct localization simultaneously within a single optimization framework. The full loss function of YOLOv1 is defined as in Equation 8.
In this formula, indicates that the j-th box in the corresponding grid cell contains an object, while indicates that there is no object in that box. To ensure that position error is given higher importance, is set to 5, and to prevent excessive penalties from regions without objects from negatively affecting the model, is set to 0.5. Using the square root difference instead of the square difference for width (w) and height (h) errors prevents large boxes from contributing more to the error than small boxes, ensuring stable learning of the model.
YOLOv1 achieved significantly higher speed and accuracy compared to object detection methods of its time. The model achieved 63.4 mAP on the PASCAL VOC 2007 dataset, operating at approximately 45 FPS and demonstrating performance suitable for real-time systems. The lighter variant, known as Fast YOLO, achieved 155 FPS, outperforming all competitors of the time in terms of speed.
Despite its success, YOLOv1 has certain limitations due to its structural design. The requirement to assign at most one class and two bounding box predictions to each grid cell causes challenges, especially when detecting small objects that are very close to each other. As a result, the model often misses objects in dense areas such as flocks of birds or small objects in crowded scenes. Furthermore, since YOLOv1 learns the aspect ratios of objects directly from the data, it cannot easily adapt to unusual shapes or sizes it did not encounter during training. Finally, the loss function used evaluates errors in small boxes in the same way as large boxes, making it even more difficult to accurately locate small objects.
3.2. YOLOv2
YOLOv2, also known as YOLO9000, was proposed by Joseph Redmon and Ali Farhadi [41] at the end of 2016 and then presented at the Computer Vision and Pattern Recognition (CVPR) conference in 2017. YOLOv2 was developed with the aim of increasing accuracy while maintaining the speed superiority of YOLOv1. The innovations in this version are concentrated both at the architectural level and in training strategies. One of the most significant changes in YOLOv2 is the Darknet-19 architecture used as the backbone. Darknet-19 is a deeper and more robust model through the systematic use of and 1×1 convolution layers and the addition of the Batch Normalization technique. Therefore, the model has achieved stronger representation capabilities on high-resolution images. The details of the architecture are provided in Table 4.
YOLOv2 has also utilised the anchor boxes approach to improve the accuracy of bounding box predictions. Inspired by the R-CNN family, this approach enables the model to adapt to objects of different scales and aspect ratios. In this context, YOLOv2 adopts a direct location prediction strategy, whereby each anchor box is predicted to be located in relation to its own grid cell, rather than generating direct and unlimited offsets for anchor boxes. To this end, sigmoid activation is used to keep the box centre coordinates within the grid cell boundaries, while width and height are obtained by exponentially scaling the anchor dimensions. Thus, the predicted parameters are combined with the grid cell and anchor dimensions to calculate the final box coordinates using Equation 9 and the object probability using Equation 10. This approach is visualised in Figure 7, and the equations are also expressed.
Another significant innovation introduced in YOLOv2 is the High-Resolution Classifier technique. The model ensures that higher-level features are learned by pre-training on resolution images rather than low-resolution images in the early stages of training. As a result of these innovations, YOLOv2 achieved 76.8 mAP on VOC 2007, providing a significant increase in accuracy over YOLOv1. Furthermore, maintaining approximately 40 FPS in real time has made YOLOv2 a highly effective solution in both industrial and academic contexts.
3.3. YOLOv3
YOLOv3 was introduced in 2018 by Joseph Redmon and Ali Farhadi [42] as the next milestone in the YOLO family following YOLOv2. With the introduction of YOLOv3, the YOLO architecture has adopted a structure consisting of three layers: backbone, neck, and head. The architectural design of the backbone, neck, and head layers is shown schematically in Figure 8. The backbone is the spine of the model that extracts distinctive features from the input image. At this stage, early layers capture basic features such as edges and textures, while deeper layers produce object-specific, more abstract, and semantic representations. Consequently, a hierarchical feature set is obtained, forming the basis of the object detection process.
The Neck is an intermediate module that reorganizes and enriches feature maps obtained from the backbone. It usually contains FPN, PAN, or additional convolution blocks. The neck structure improves both spatial resolution and semantic consistency, enabling the head layer to be fed with a more powerful and representative feature set. The head is the layer that produces output, predicting the object classes and box locations in the network. It generates classification and regression outputs for each candidate region using features processed by the Neck. After this stage, a standard filtering method such as NMS is applied to eliminate redundant or overly overlapping predictions and select the most probable object detections. From this section onwards, the architectures of the YOLO family is explained according to the backbone–neck–head structure.
In YOLOv3, this architecture is configured as a Darknet-53-based backbone, a multi-scale neck, and a three-scale detection head. The overall structure of the YOLOv3 architecture is shown in Figure 9. The following subsections discuss the fundamental components of YOLOv3 in detail.
3.3.1. YOLOv3 Backbone
Darknet-53, which is the backbone of the YOLOv3 model, is a feature extraction network consisting solely of and convolutional layers, with a total depth of 53 layers. In comparison to Darknet-19, used in previous versions, it has a much stronger representation capacity. One of the most important features of Darknet-53 is the use of residual units at every stage of the architecture. A residual unit consists of a CBL → CBL → add structure and prevents gradient vanishing by providing a skip connection between the input and output. It allows deep networks to be trained more stably. The RES1, RES8, and RES4 blocks that follow one another within the backbone are structures where these residual connections are repeated a different number of times (see Table 5). Another notable aspect of Darknet-53 is the complete removal of max-pooling layers, which are commonly used in classical convolutional networks. As seen in the diagram, downsampling is instead performed solely using strided CBL (conv+BN+leakyReLU) blocks. It better preserves spatial information and reduces computational cost. The backbone produces three basic feature maps with dimensions of , , and , starting from the input image. The highest resolution map carries the details of small objects, while the deepest map contains high-level semantic information. Thus, while maintaining the speed advantage preserved since YOLOv1, significant gains in accuracy have been achieved.
3.3.2. YOLOv3 Neck
The multi-scale feature maps produced by Backbone in sizes , , and are processed in the neck component, represented by red, pink, and yellow blocks in the image, to achieve a more consistent and enhanced representation. The primary goal of the neck is to transfer the semantic information obtained in the deep layers to higher resolution layers without losing spatial details. In this context, the deep feature map is first passed through a CBL block, then upscaled to with an up block. This upscaled map is concatenated with the feature map from the backbone’s middle level. Following this combination, the structure is reprocessed through the CBL×5 block, creating a more balanced representation both semantically and spatially. Then, the same process is repeated to transfer the representation to the level; at this stage, high-resolution edge and texture information from the early layers of the backbone is fused with the semantic information carried throughout the derivation. This cross-scale transfer mechanism provides a significant advantage, particularly in the detection of small objects, and enables the consistent transfer of feature maps at three different resolutions to the head section.
3.3.3. YOLOv3 Head
The head section of YOLOv3 directly converts three feature maps, scaled by the neck, into object detection output. There is a prediction layer for each scale (, , and ), and three different anchor boxes are used at each scale; thus, object location, size, object probability, and class predictions are made across a total of nine anchors. The high-resolution map is suitable for detecting small objects; the scale represents medium-sized objects more evenly, while the scale reliably detects large objects thanks to its wide spatial context. One of the key innovations in the Head section is the use of independent logistic (sigmoid) classification during class prediction instead of softmax, as in previous versions. This approach provides more flexible modeling in cases where class labels may overlap and offers a more stable training process. Furthermore, all processing steps performed up to the prediction layer—CBL blocks, up-sampling, concat operations, multiple structures—form a functional whole, as shown in detail in the figure. Thus, YOLOv3 becomes a powerful multi-scale detector capable of simultaneously detecting objects of different sizes with high accuracy.
3.4. YOLOv4
The backbone–neck–head architecture, which emerged with YOLOv3, was further formalized into a standardized framework in the literature following the introduction of YOLOv4 [43].
3.4.1. YOLOv4 Backbone
CSPDarknet53, used as the backbone in YOLOv4, is a feature extractor that offers high representational power for object detection thanks to its deep structure and wide receptive field capacity. The architecture begins with the CBM (Conv–BN–Mish) block applied after the input and is then progressively deepened with the CSP1, CSP2, CSP8, and CSP4 blocks belonging to the CSP architecture (Figure 10). CSP blocks split feature maps into two branches and then recombine them, providing both parameter efficiency and contributing to a more stable gradient flow. The Res Unit structure within each CSP block is a deeper representation unit formed by the connection of two CBM blocks, helping the model process high-level semantic information while preserving low-level details. The Mish activation function, used as the activation function, ensures that the gradient flow is transmitted in a smooth and continuous manner, increasing the stability of the learning process and strengthening the representational power of the extracted features. The CBL ×3 + SPP + CBL ×3 sequence in the final stage of the backbone combines max-pooling operations with different kernel sizes, expanding the receptive field without increasing computational cost. The Spatial Pyramid Pooling (SPP) structure specifically enriches contextual information, helping the model represent large and complex objects more successfully. Thanks to these integrated components, the backbone forms the basis of YOLOv4’s performance as a powerful and efficient feature extractor.
3.4.2. YOLOv4 Neck
Feature maps obtained from the backbone are organized for multi-scale pooling and information transfer in the neck section. At this stage, both Concat operations and CBL + Up2D blocks are used to combine high-resolution features with deep features. The CBL ×5 blocks located throughout the neck enable the reprocessing of features at different resolution levels and the creation of more detailed representations. The upsampling operations performed with Up2D allow semantically rich low-resolution features to be transferred to high resolution, while the Concat structures combine this information with the detailed features coming from the backbone. Thus, the details of small objects are preserved, and the necessary semantic information for large objects is integrated. The fundamental strength of the neck section is its ability to perform this multi-layered information fusion without incurring a speed penalty; CBL blocks normalize and efficiently transform features, while Concat–Up2D flows ensure that information from different scales is combined into a consistent representation. Additionally, lightweight configurations representing the attention mechanism optimize feature processing in this section without creating unnecessary computational overhead.
3.4.3. YOLOv4 Head
The head section of the model performs multi-scale object detection by producing three different outputs in parallel. This structure works by reprocessing each feature map from the neck using CBL ×5 blocks and then creating the final detection map with the CBL + Conv2D 1×1 layer (Figure 10). The outputs generated are , , and in size, respectively, where N represents the total number of channels expanded with class and coordinate predictions of the anchor count. Within this anchor-based approach, the model predicts class probability, object score, and bounding box values across three anchor boxes at each scale. The CIoU loss used in bounding box regression creates a faster and more stable learning process by optimizing not only the amount of overlap but also the distance between box centers and the aspect ratio match. DIoU-NMS is applied during the filtering stage of predictions, and this method provides a more accurate selection, especially in areas with dense objects, by taking into account the center distances of the boxes. Various augmentation and data enhancement techniques such as CmBN, DropBlock, Self-Adversarial Training, and Mosaic are used to support the head during the training process. When all these components work together, the head structure demonstrates strong performance in terms of high accuracy, fast convergence, and adaptation to multi-scale object distributions.
3.5. YOLOv5
YOLOv5 was developed by Ultralytics as a production-oriented framework rather than a formal academic study, marking a significant shift to the PyTorch ecosystem. The architecture utilizes a CSP-backbone and PANet-based neck, offering a scalable range of models from Nano to XLarge to balance inference speed and accuracy [?].
3.5.1. YOLOv5 Backbone
The backbone consists of successive convolutional layers that transform the pixel input image into representations with progressively decreasing resolutions but increasing channel sizes. In the first stage of the backbone, convolutions extract high-resolution edge, texture, and local structure information. The CBS (Conv–BN–SiLU) blocks, which are the building blocks of YOLOv5, ensure that the post-convolution activation is performed with a saturating function (SiLU); the derivative continuity of this activation increases the stability of gradient-based backpropagation. C3 blocks come into play in deeper layers. The C3 block, an implementation of the CSPNet architecture, splits the input feature map into two branches: one passes directly, while the other passes through one or more bottleneck (CBS→CBS) blocks. This split information flow, as stated in the paper, reduces gradient repetition, increases parameter efficiency, and mitigates the vanishing gradient problem in deep networks. At the end of C3, these two paths are merged along the channel axis via a concat operation, blending both global and local features into a single representation. The SPPF (Spatial Pyramid Pooling – Fast) module is a pooling structure designed to expand YOLOv5’s receptive field without increasing computational cost. Instead of the large-kernel pooling layers used in traditional SPP, SPPF consists of maximum pooling operations applied sequentially: → → . These three pooling layers are applied on top of each other’s outputs, ultimately yielding spatial context information at different scales. Furthermore, since all operations are built upon 5×5 pooling, computational costs are significantly reduced compared to classical SPP (Figure 11). Thus, SPPF creates a fast pyramid pooling mechanism that is both highly efficient and provides a wide receiver area.
3.5.2. YOLOv5 Neck
The Neck layer combines feature maps from three different resolution levels of the backbone using a PANet-based architecture. The primary goal of PANet is to enhance small object detection by creating both top-down and bottom-up information flow, unlike FPN, which only provides top-down information flow. In YOLOv5, low-resolution feature maps from the deep level are first 2× upscaled to increase their spatial dimensions. These upscaled maps are concatenated with the backbone’s higher-resolution C3 outputs. The concatenation doubles the channel dimension, merging both fine-grained detail information and deep semantic context into the same tensor. This combined tensor is then passed through CBS and C3 blocks again, transforming it into a high-dimensional and meaningful feature set. In the second stage of the neck, PANet’s “bottom-up path augmentation” logic is applied. At this stage, the medium-resolution combined feature maps are downsampled by 2× again and merged with the C3 outputs of deeper layers. Thus, the neck produces multi-level feature maps with high semantic richness for three different scales. As emphasized in the paper, this PA-Net-based structure offers a more compatible computation/performance balance with the YOLO architecture compared to alternative fusion methods such as BiFPN, NAS-FPN, and ASFF.
3.5.3. YOLOv5 Head
The head component performs anchor-based prediction using feature maps generated at three different resolutions. Each detection layer predicts the position (x,y,w,h), objectness, and class probabilities using three different anchor boxes. This output creates a tensor of size (5 + N) × 3 for each grid cell, where 5 represents the x, y, w, h, and objectness values, and N represents the number of classes. Coordinates are calculated as predicted offsets relative to anchor boxes and normalized using sigmoid + exponential transformations. Outputs are optimized using a three-component loss function, as described in the paper: BCE Loss for class and objectness, and IoU-based CIoU Loss for location prediction. CIoU provides a more stable convergence than classic IoU and GioU because it considers not only the intersection area but also the center distance and aspect ratio matching. The anchor boxes themselves are optimized specifically for the dataset using K-Means + Genetic Algorithm; this mechanism allows the model to adapt more quickly to different datasets. By combining these three components, YOLOv5 creates three parallel detection heads specialized for small objects at high resolution, medium-sized objects at medium resolution, and large objects at low resolution. When evaluating the CSP-based gradient efficiency of the backbone, the multi-scale fusion of the neck enhanced with PANet, and the optimized anchor–CIoU-based prediction of the head together, YOLOv5 stands out as a modern object detection architecture that can operate in real time and achieve high mAP scores on challenging datasets such as COCO.
3.6. YOLOv6
Meituan Vision AI Department introduced YOLOv6 in September 2022 [44]. This next-generation object detection framework was presented as a high-performance solution specifically optimized for industrial applications. Unlike previous YOLO versions, YOLOv6 aims to establish an optimal balance between inference speed and accuracy across various hardware platforms. To this end, advanced techniques such as a re-parameterizable backbone, a decoupled head design, and an anchor-free detection strategy have been integrated into the model. By focusing on hardware-friendly structures and efficient training protocols, YOLOv6 offers a scalable architecture that both meets real-time operational requirements and adapts to large-scale industrial scenarios.
3.6.1. YOLOv6 Backbone
The backbone architecture of YOLOv6 is based on a re-parameterizable architecture that behaves differently during training and inference phases. The EfficientRep Backbone, used in small models, leverages the high representational power provided by multi-branch RepVGG blocks during training. As seen in the Figure 12, these branches consist of RepConv and RepBlock structures. During inference, unnecessary branches are removed, and these paths mathematically fold into a single convolution kernel, creating a simple, highly parallel, and lightweight structure. This transformation provides a speed advantage by reducing memory access costs on GPUs. At the end of the backbone, a SimSPP (Simplified Spatial Pyramid Pooling) block is integrated to enhance the receptive field. EfficientRep is not sufficient for large-scale models because the single-path architecture exponentially increases the number of parameters. Therefore, the YOLOv6-M and YOLOv6-L models use the CSPStackRep Backbone. Within CSPStackRep, 1×1 convolutions perform channel transformations; RepConv pairs increase depth while using shortcut connections to preserve existing features.
3.6.2. YOLOv6 Neck
The neck section of YOLOv6 is based on Rep-PAN, a PANet-based architecture that combines feature maps at different resolutions. As illustrated in the diagram, this structure uses Upsample and Concat layers to facilitate both top-down and bottom-up flows, combining fine details at lower levels with strong signals from semantic information at higher levels. This two-way information flow enables better detection of small objects. The core block used in the neck is either RepBlock or CSPStackRep Block, depending on the model size. When RepBlock is used, computation relies primarily on simple and fast 3×3 convolutions, while CSPStackRep prevents redundant learning by routing some features through the CSP path. This architecture produces feature maps at 8×, 16×, and 32× scales through a three-level FPN-PAN combination.
3.6.3. YOLOv6 Head
The model’s head design uses a fully decoupled head, unlike the coupled-head structure in YOLOv5. In this design, classification and regression tasks are processed in separate branches, as theseiki tasks require different feature sensitivities. Unlike other decoupled-head designs, YOLOv6 adopts an “Efficient Decoupled Head” design that uses Conv and Conv2D layers to create a lightweight and fast prediction unit. This architecture produces three main outputs at each scale: class scores, bounding box regression, and object center distance estimates. YOLOv6 uses an anchor-free approach; that is, each cell point estimates the distance to the four sides of the box through regression. This approach eliminates the large anchor set and complex assignment process, reducing computation and making the training process more stable. Additionally, the Task Alignment Learning (TAL) mechanism used in YOLOv6 synthesizes the classification and IoU predictions produced by the head, enabling a more accurate distribution in positive example selection.
3.7. YOLOv7
YOLOv7, released in 2022, introduces architectural innovations such as E-ELAN and re-parameterized convolutions to optimize the balance between inference speed and detection accuracy [45]. These advancements provide a highly efficient framework that serves as a robust benchmark for real-time object detection tasks in complex environments.
3.7.1. YOLOv7 Backbone
The backbone architecture is built upon the Extended Efficient Layer Aggregation Network (ELAN) blocks (see Figure 13). Designed to address information flow challenges within deep neural networks and ensure more efficient gradient propagation, the ELAN structure utilizes a multi-branch skip connection mechanism. This backbone processes multiple convolutional branches in parallel and subsequently concatenates them to generate richer feature representations. As shown in the schematic, the backbone maintains spatial downsampling through dedicated Transition Blocks (MP-1), which combine strided convolutions and max-pooling in parallel branches to minimize the loss of low-level spatial details. The integration of these optimized ELAN modules—composed of several CBS (Conv–BN–SiLU) units—effectively reduces both parameter count and computational intensity while expanding the network’s learning capacity.
3.7.2. YOLOv7 Neck
The neck section of YOLOv7, positioned between the backbone and the head in Figure 13, employs a multi-scale feature fusion mechanism. A key innovation highlighted in the diagram is the SPPCSPC (Spatial Pyramid Pooling with Cross Stage Partial Channel) block, which enhances the receptive field without sacrificing resolution. The neck further utilizes ELAN-H blocks and Upsample operations to merge deep semantic information from low-resolution layers with the granular details of high-resolution feature maps. To ensure high operational speed, the architecture integrates RepConv (Re-parameterizable Convolution) layers before the prediction stage. These layers retain the representational power of multi-branched structures during training, while collapsing into a single convolutional layer during inference to optimize throughput.
3.7.3. YOLOv7 Head
The head structure of YOLOv7 features a fully decoupled classification and regression architecture, as illustrated in Figure 13. To ensure more stable learning, an "auxiliary head" is utilized during the training phase to generate an additional supervision signal; this component is disabled during inference, thereby incurring no additional computational cost. For positive sample selection, a coarse-to-fine label assignment mechanism is employed, which initially identifies a broad set of positive candidates and subsequently refines them based on quality to facilitate a more stable gradient flow. As shown in the schematic, the features from the neck pass through RepConv layers before reaching the Predict modules. While advanced IoU-based loss functions are applied for bounding box regression, adaptive label smoothing mechanisms are implemented in the classification branch to ensure a more consistent feature distribution. Although the head operates on an anchor-based principle, the anchor configurations have been re-optimized to provide a more balanced distribution across the various scales.
3.8. YOLOv8
YOLOv8, introduced by Ultralytics in January 2023, is one of the most advanced iterations of the YOLO series, designed to push the boundaries of speed and accuracy in computer vision tasks [46]. Distinguishing itself from previous versions by adopting a fully anchor-free architecture, YOLOv8 aims to improve performance while simplifying the training process. The model has set a new standard by using a decoupled head architecture for independent classification and localization tasks, along with an optimized feature-extraction backbone.
3.8.1. YOLOv8 Backbone
The backbone architecture of YOLOv8 is built upon C2f blocks, which represent an evolved iteration of the C3 blocks found in YOLOv5. As illustrated in Figure 14, the C2f module expands the Cross Stage Partial principle with a lighter internal structure, enhancing both computational efficiency and feature reuse. This block incorporates a higher number of shortcut connections and lightweight bottleneck layers, ensuring that information loss is minimized in deeper layers. Furthermore, the backbone prioritizes the preservation of fine details; consequently, downsampling is performed using stride-2 Conv layers at essential stages. The final stage of the backbone integrates an SPPF (Spatial Pyramid Pooling Fast) block to refine feature maps before they enter the neck, providing high representational power with low FLOP costs.
3.8.2. YOLOv8 Neck
The neck architecture of YOLOv8, shown in the center of Figure 14, incorporates a multi-layer feature fusion mechanism similar to an enhanced Path Aggregation Network. This structure processes feature maps of varying scales through both top-down and bottom-up pathways using Upsample, Concat, and Conv operations to ensure a more uniform distribution of semantic information. Specifically, more semantic context is transmitted to high-resolution layers, which is critical for small object detection. The C2f blocks utilized within the neck provide deeper nonlinearity without increasing channel dimensions, allowing for more meaningful representations. Consequently, the neck region effectively integrates multi-scale contextual information, standing out as one of the most robust components of the YOLOv8 framework.
3.8.3. YOLOv8 Head
YOLOv8 introduces a fully anchor-free head structure, represented by the three Detect modules in Figure 14. In this anchor-free approach, each grid point determines bounding box coordinates by directly performing four-way regression for left, right, top, and bottom distances. This methodology simplifies the learning process by entirely eliminating the need for anchor counts and aspect ratio tuning. Due to the decoupled head architecture, classification and regression tasks are executed through separate branches, allowing each task to maintain its own optimization surface. Within the YOLOv8 head, the integration of a task-aligned assignment strategy and more efficient objective regression mechanisms enhances both accuracy and stability, directly outputting the final predictions from the Detect stages.
3.9. YOLOv9
YOLOv9, introduced by Wang et al. [47], represents a significant paradigm shift in object detection by addressing the inherent information loss in deep neural networks. Traditional architectures often suffer from the "information bottleneck" as data passes through successive layers, leading to degraded gradient signals. To overcome this, YOLOv9 incorporates Programmable Gradient Information (PGI) and the Generalized Efficient Layer Aggregation Network (GELAN). These innovations allow the model to retain essential data features across deep layers, ensuring that the objective function receives complete information for weight updates, thereby achieving superior performance without the need for large-scale pre-training.
3.9.1. YOLOv9 Backbone
YOLOv9 utilizes an innovative backbone architecture called GELAN, which stands for Generalized Efficient Layer Aggregation Network. As shown in Figure 15, the backbone is constructed using a sequence of convolutional layers, RepNCSP ELAN 4 blocks, and A down module for downsampling. GELAN is specifically designed to mitigate the information bottleneck problem typically encountered in deep neural networks. These blocks achieve higher information density through parameter sharing and channel mixing techniques. The backbone concludes with an SSPELAN (Spatial Pyramid Pooling - ELAN) module, which enhances multi-scale feature extraction while maintaining computational efficiency. Therefore, the backbone provides both high accuracy and more stable optimization during training.
3.9.2. YOLOv9 Neck
The neck architecture of YOLOv9, illustrated in the central part of Figure 15, has been restructured to align with the Programmable Gradient Information (PGI) mechanism. The neck layers, which consist of Upsample, Concat, and RepNCSP ELAN 4 blocks, are optimized to consider not only the forward information flow but also the quality of backward-propagating gradient signals. The integration of A down modules within the neck makes gradient updates for low-level feature maps more meaningful. This multi-scale feature fusion structure achieves a more balanced accumulation of information across both high-resolution and deep semantic levels.
3.9.3. YOLOv9 Head
The YOLOv9 head architecture employs a multi-scale detection strategy, as indicated by the three Detect blocks in Figure 15. A key feature of the head is its integration with PGI, which dynamically manipulates gradient calculations during training to recover visual information that would otherwise be lost. This methodology ensures stability, particularly in bounding box regression, and provides substantial improvements in small object detection. While the head structure follows an efficient design, it incorporates new normalization strategies that enhance gradient quality in both anchor and class predictions. Owing to this architecture, YOLOv9 can achieve high performance on the COCO dataset even without extensive pre-training.
3.10. YOLOv10
YOLOv10, introduced by Wang et al. [48], marks a significant advancement in real-time object detection by focusing on a holistic efficiency–accuracy co-design. The primary objective of this architecture is to eliminate the post-processing latency caused by NMS while simultaneously reducing redundant computations throughout the network. By optimizing the model’s depth, width, and kernel sizes, YOLOv10 achieves a streamlined pipeline that supports high-performance detection without the computational overhead traditionally found in earlier YOLO versions.
3.10.1. YOLOv10 Backbone
The backbone of YOLOv10 is constructed using an optimized sequence of C2f and SCDown (Spatial-Channel Downsampling) modules to maintain high semantic density while reducing FLOP costs. As shown in Figure 16, these stages systematically reduce the spatial resolution while increasing channel depth. The backbone concludes with a C2fCIB block that incorporates compact inverted bottlenecks and an SPPF layer to aggregate multi-scale features effectively. This co-design approach ensures that the backbone provides a robust foundation for both speed and accuracy.
3.10.2. YOLOv10 Neck
The neck architecture utilizes a refined PAN-FPN framework designed for optimal feature fusion. As illustrated in Figure 16, it incorporates a PSA (Position-Sensitive Attention) module to capture long-range dependencies and enhance the global representation of features. The neck integrates Upsample layers, Concat operations, and additional C2fCIB and SCDown blocks to ensure stable feature alignment. This structure is specifically optimized to minimize information loss when propagating semantic data from high-resolution layers to deeper levels, supporting the consistent predictions required by the NMS-free approach.
3.10.3. YOLOv10 Head
The head of YOLOv10 features a native NMS-free design, depicted by the three Detect branches in Figure 16. This advancement is achieved through a consistent dual assignment mechanism that ensures the model directly produces non-overlapping boxes during inference. By establishing consistent positive assignments between the classification and regression tasks, the architecture transforms bounding box prediction into a truly end-to-end operation. Hence, the YOLOv10 head significantly accelerates the inference process by removing the post-processing bottleneck, ensuring high detection accuracy in real-time scenarios.
3.11. YOLOv11
YOLOv11, the latest iteration in the YOLO series developed by Ultralytics [?], is engineered to provide a superior balance between computational efficiency and detection accuracy. Building upon the architectural successes of its predecessors, YOLOv11 introduces refined bottleneck structures and enhanced attention mechanisms to improve feature extraction in complex environments. By optimizing the trade-off between parameter count and inference speed, the model delivers high-performance results suitable for real-time applications on a wide range of hardware platforms.
3.11.1. YOLOv11 Backbone
The backbone of YOLOv11 is designed for high-resolution representation and efficient feature propagation. As illustrated in Figure 17, the backbone primarily utilizes C3K2 blocks, which serve as an optimized evolution of the C2f architecture. These blocks operate with smaller convolutional kernels to reduce computational overhead while preserving low-level spatial details. A significant addition to the backbone is the C2PSA (C2f with Position-Sensitive Attention) module, which integrates spatial attention to help the model focus on the most informative regions of the input image. The backbone concludes with an SPFF (Spatial Pyramid Pooling Fast) layer that aggregates multi-scale features to ensure robustness across varying object sizes.
3.11.2. YOLOv11 Neck
The neck architecture of YOLOv11 implements a PAN-FPN structure to facilitate effective multi-scale feature fusion. As shown in the central part of Figure 17, it integrates Upsample, Concat, and C3K2 blocks to blend high-level semantic information with low-level spatial features. This design minimizes the loss of semantic data, particularly for small-scale objects, by ensuring stable feature alignment across different dimensions. The use of C3K2 blocks within the neck allows for high semantic density while keeping the overall computational cost low.
3.11.3. YOLOv11 Head
The head of YOLOv11 features an anchor-free, decoupled design, represented by the three independent Detect branches in Figure 17. This architecture processes classification, objectness scoring, and bounding box regression through separate pathways, allowing for faster convergence during training and higher precision during inference. A dynamic assignment strategy is used for positive sample selection, thereby enhancing the stability of bounding box regression. Despite its lightweight design, the YOLOv11 head delivers superior detection accuracy and high frame rates, making it highly effective for diverse computer vision tasks.
3.12. YOLOv12
YOLOv12 redefines real-time object detection by placing attention mechanisms at its core, effectively combining the strengths of traditional CNNs with the contextual intelligence of transformers [49]. By integrating the Residual ELAN (R-ELAN) backbone and Area Attention modules, the model achieves high semantic density without the heavy computational burden typically associated with self-attention. This architecture allows for superior feature extraction while maintaining the inference speeds required for real-time applications.
3.12.1. YOLOv12 Backbone
Unlike all previous YOLO versions, YOLOv12 utilizes an attention-centric backbone. This structure, termed R-ELAN and represented by the A2C2f blocks in Figure 18, integrates Area Attention mechanisms into ELAN blocks to provide both a wide receptive field and high semantic density. To reduce the heavy computational cost associated with traditional self-attention, Area Attention divides windows into expanded local regions, thereby performing a fast yet powerful attention operation. The R-ELAN backbone integrates the high-level contextual relationships of transformers while preserving the low-level feature extraction capabilities of CNNs.
3.12.2. YOLOv12 Neck
The neck section of YOLOv12 merges cross-scale attention mechanisms with a PAN-FPN framework, as illustrated by the interconnection of Upsample and Concat blocks in Figure 18. This architecture enhances detail sensitivity in high-resolution layers while stably propagating semantic information from lower levels to higher ones. The integration of A2C2f and C3k2 modules within this section plays an active role in preserving details for small objects by focusing on significant feature regions. Furthermore, the convolutional blocks are specifically optimized to minimize the computational overhead typically associated with attention-based processes.
3.12.3. YOLOv12 Head
The head structure of YOLOv12 is an anchor-free, multi-task capable architecture. As indicated by the Detection blocks in Figure 18, tasks such as object detection, segmentation, and classification can be handled within the same framework. Attention mechanisms provide higher sensitivity in bounding box regression, where coordinates are calculated in an anchor-free format as left, right, top, and bottom distances. The classification branch incorporates lightweight attention blocks that capture long-range dependencies. Furthermore, to achieve highly competitive results, YOLOv12 employs auxiliary loss structures derived from reference attention maps alongside traditional IoU-based losses.
3.13. YOLOv26
Released in September 2025 by Ultralytics, YOLO26 represents a strategic evolution in the YOLO lineage, shifting the focus from attention-centric designs toward edge-optimized efficiency and deployment readiness [50]. While previous iterations pushed accuracy through complex transformer-like structures, YOLO26 is purpose-built for real-time performance on low-power and latency-sensitive devices. By integrating an end-to-end NMS-free inference pipeline and removing the Distribution Focal Loss (DFL), the model achieves a significant reduction in computational overhead, reportedly delivering substantial speed improvements on CPU-based inference compared to its predecessors.
As illustrated in Figure 19, the architecture follows a streamlined processing pipeline that begins with a Preprocessing stage for resizing and normalization. The data then flows into the Backbone Feature Extraction and Multi-Scale Feature Maps stages, where essential spatial information is captured without the heavy latency associated with global self-attention. These features are subsequently refined through a Lightweight Feature Fusion Neck, which ensures efficient cross-scale information flow while maintaining the architectural simplicity required for fast execution on edge devices.
The final stage of the pipeline utilizes a Direct Regression Head to generate NMS-Free Predictions, effectively removing the traditional post-processing bottleneck. During the training phase, YOLO26 incorporates STAL Assignment (Small-Target-Aware Label Assignment) to improve the detection of tiny objects and the MuSGD Optimizer to ensure stable convergence. Finally, the model undergoes a Quantization step to optimize it for resource-constrained environments, allowing the system to deliver final Predictions with high accuracy and minimal computational cost.
4. Publication Trends and Applications of YOLO
YOLO’s first version was proposed in 2015, and its latest version was introduced in 2025. Therefore, the number of publications produced between 2015 and 2025 was examined. In this context, annual publication counts were analyzed in major academic databases widely used in the literature, namely Association for Computing Machinery (ACM), IEEE Xplore, Scopus, and Web of Science (WoS). During the search process, the keywords “You Only Look Once” and “YOLO” were searched in the titles and abstracts of the articles.
The data obtained are presented in Table 6. An examination of the table reveals a clear and continuous increase in the number of publications from 2015 to 2025 across all databases. When the total volume of records is considered, a substantial number of publications is observed: 3,897 in ACM, 17,577 in IEEE Xplore, 121,895 in Scopus, and 16,833 in Web of Science.
In particular, a sharp rise is evident after 2019, with publication counts accelerating significantly between 2020 and 2025. The highest annual figures are observed in 2025 for all databases, indicating that research interest in YOLO has continued to grow steadily. Overall, the data demonstrate the increasing scientific attention devoted to YOLO-based studies over the past decade.
The application areas of YOLO, which has experienced a steady increase in publications over the years, as shown in Table 6, have also been examined. In this context, the main application areas were first recognized, and each was subsequently divided into subcategories. References to representative studies in the literature related to these categories have been included. Table 7 presents a summary of this classification of YOLO’s application areas.
Table 7 shows that YOLO has a wide range of applications, and the studies in each category demonstrate that the model can be successfully adapted to different types of problems. When subtasks are examined, it is clear that YOLO performs effectively across varying levels of difficulty, including small-object detection, multi-object segmentation in complex scenes, detection under different environmental conditions, and object detection across multiple modalities. Representative studies show that the model has been widely adopted in both academic and industrial applications, and these studies have also achieved quite good results.
5. Discussion
The evolution of the YOLO family from v1 to YOLO26, as evidenced in Table 8, reflects a steady progression from complex anchor-based structures toward fully end-to-end systems. The predefined anchor box structures used in earlier versions (v2–v5) have been replaced by anchor-free designs introduced with YOLOv8. The most critical milestone in this transition is the NMS-free inference mechanism introduced with YOLOv10 and YOLO26. The general trends in Table 9 indicate that the elimination of post-processing stages has established a new benchmark for speed and efficiency, particularly for real-time industrial applications. From an architectural perspective, a strategic divergence is emerging between feature quality and hardware speed. While YOLOv12, featured in Table 8, targets high semantic success through R-ELAN-based attention mechanisms, YOLO26 marks a return to hardware-friendly convolutional designs using C3k2 blocks and an edge-optimized backbone. This shift demonstrates that the field is moving away from a "one-size-fits-all" model toward two distinct branches of specialization: models that maximize accuracy via attention mechanisms and those that prioritize maximum throughput through streamlined convolutional structures. Yet, the evolution of "Neck" and "Head" components reveals that performance gains are increasingly driven by gradient flow optimization rather than by mere increases in network depth. Innovations such as PGI in YOLOv9 and STAL in YOLO26 aim to address information bottlenecks within the network. When examining the parameter and FLOPs trends in Table 9, it is evident that modern architectures achieve superior performance with significantly fewer resources. This development suggests that the future of object detection technology will likely be built on intelligent label assignment and loss-function optimization rather than further increasing architectural complexity.
6. Conclusion
Object detection has become a foundational component in real-time computer vision applications spanning autonomous systems, medical imaging, security, and industrial automation. In these domains, localization accuracy and inference speed remain critical design constraints. The YOLO family has addressed these requirements through a progressively refined single-stage architecture that balances detection performance with computational efficiency.
This study presents a technical analysis of the YOLO family from YOLOv1 to YOLO26, analyzing architectural transitions, feature fusion strategies, and developments in loss functions. A central theme across this progression is the systematic reduction of computational overhead, most notably through the adoption of anchor-free detection heads and, in later iterations such as YOLOv10 and YOLO26, the elimination of Non-Maximum Suppression (NMS) from the inference pipeline.
Recent developments within the ecosystem reflect a divergence in design philosophy. Architectures such as YOLOv12 emphasize semantic representation through attention-based mechanisms, while models like YOLO26 prioritize deployment efficiency on resource-constrained hardware. This divergence suggests a broader shift away from general-purpose detectors toward application-specific architectural solutions. Ongoing challenges, including small object detection and high-density scene understanding, continue to drive architectural innovation. Prospective directions include multi-modal sensor fusion (LiDAR, radar), task-adaptive training frameworks, and hardware-aware neural architecture search (NAS). The analysis presented here serves as both a reference for next-generation detector design and a practical guide to variant selection across industrial use cases.
Author Contributions
Conceptualization: M.Y., S.T. Methodology: M.Y., S.T. Investigation: M.Y. and H.S. Writing-original draft preparation: M.Y., H.S., S.T. and M.K. Writing-review and editing: M.Y., H.S. and M.K.
Funding
Not applicable.
Informed Consent Statement
Not applicable.
Data Availability Statement
Not applicable.
Conflicts of Interest
The authors declare no competing interests.
References
- Sakhare, K.V.; Tewari, T.; Vyas, V. Review of vehicle detection systems in advanced driver assistant systems. Archives of Computational Methods in Engineering 2020, 27, 591–610. [Google Scholar] [CrossRef]
- Chen, Y. Multi-task learning for dangerous object detection in autonomous driving. Information Sciences 432, 559–571. [CrossRef]
- Ahmed, I.; Jeon, G.; Chehri, A. A smart IoT enabled end-to-end 3D object detection system for autonomous vehicles. IEEE Transactions on Intelligent Transportation Systems 24, 13078–13087. [CrossRef]
- Azad, M. Intelligent computational methods for damage detection of laminated composite structures for mobility applications: a comprehensive review. Archives of Computational Methods in Engineering 32, 441–469. [CrossRef]
- Zhao, C. Deep learning-based object detection in maritime unmanned aerial vehicle imagery: Review and experimental comparisons. Engineering Applications of Artificial Intelligence 128, 107513. [CrossRef]
- Song, G. Small object detection in unmanned aerial vehicle images using multi-scale hybrid attention. Engineering Applications of Artificial Intelligence 128, 107455. [CrossRef]
- Zhang, H.; Ma, X. Misleading attention and classification: an adversarial attack to fool object detection models in the real world. Computers & Security 122, 102876. [CrossRef]
- Li, C. An efficient advanced-YOLOv8 framework for THz object detection. IEEE Transactions on Instrumentation and Measurement 73, 1–11. [CrossRef]
- Cao, Z. Detecting the shuttlecock for a badminton robot: A YOLO based approach. Expert Systems with Applications 164, 113833. [CrossRef]
- Mou, F. Pose estimation and robotic insertion tasks based on YOLO and layout features. Engineering Applications of Artificial Intelligence 114, 105164. [CrossRef]
- Ghasemi, Y. Deep learning-based object detection in augmented reality: A systematic review. Computers in Industry 139, 103661. [CrossRef]
- Girshick, R. Rich feature hierarchies for accurate object detection and semantic segmentation. In Proceedings of the Proceedings of the IEEE conference on computer vision and pattern recognition.
- Girshick, R. Fast r-cnn. In Proceedings of the Proceedings of the IEEE international conference on computer vision.
- Ren, S. Faster r-cnn: Towards real-time object detection with region proposal networks. Advances in neural information processing systems 28. [CrossRef]
- Chen, Z.; Liao, I.; Liao, I. Improved fast r-cnn with fusion of optical and 3d data for robust palm tree detection in high resolution uav images. International Journal of Machine Learning and Computing 10, 122–127. [CrossRef]
- Sapkota, R.; Karkee, M. Ultralytics YOLO evolution: An overview of YOLO26, YOLO11, YOLOv8 and YOLOv5 object detectors for computer vision and pattern recognition. arXiv arXiv:2510.09653.
- Vijayakumar, A.; Vairavasundaram, S. Yolo-based object detection models: A review and its applications. Multimedia Tools and Applications 83, 83535–83574. [CrossRef]
- Jiang, P. A Review of Yolo algorithm developments. Procedia computer science 199, 1066–1073. [CrossRef]
- Terven, J.; Córdova-Esparza, D.M.; Romero-González, J.A. A comprehensive review of yolo architectures in computer vision: From yolov1 to yolov8 and yolo-nas. Machine learning and knowledge extraction 5, 1680–1716. [CrossRef]
- Hussain, M. Yolov1 to v8: Unveiling each variant–a comprehensive review of yolo. IEEE access 12, 42816–42833. [CrossRef]
- Maity, S.; Bhattacharyya, A.; Singh, P.K.; Kumar, M.; Sarkar, R. Last decade in vehicle detection and classification: a comprehensive survey. Archives of Computational Methods in Engineering 2022, 29, 5259–5296. [Google Scholar] [CrossRef]
- Ma, J.; Ushiku, Y.; Sagara, M. The effect of improving annotation quality on object detection datasets: A preliminary study. In Proceedings of the Proceedings Of The IEEE/CVF conference on computer vision and pattern recognition.
- LabelImg, T. Available from.
- Russell, B. LabelMe: a database and web-based tool for image annotation. International journal of computer vision 77, 157–173. [CrossRef]
- C.V.A.T. Available from.
- Roboflow. Available from.
- Studio, L. Data labeling software for machine-learning datasets. Available from.
- Supervisely: Curate, Label and Build Production Models in One Platform.
- VoTT (Visual Object Tagging Tool. Available from.
- Everingham, M. The pascal visual object classes (voc) challenge. International journal of computer vision 88, 303–338. [CrossRef]
- Lin, T. Microsoft COCO: Common objects in context. In Proceedings of the ECCV 2014 Proceedings Part V; Springer International Publishing.
- Kuznetsova, A. The open images dataset v4: Unified image classification, object detection, and visual relationship detection at scale. International journal of computer vision 128, 1956–1981. [CrossRef]
- Shao, S. Objects365: A large-scale, high-quality dataset for object detection. In Proceedings of the Proceedings of the IEEE/CVF international conference on computer vision.
- Yu, F. Bdd100k: A diverse driving dataset for heterogeneous multitask learning. In Proceedings of the Proceedings of the IEEE/CVF conference on computer vision and pattern recognition.
- Zhu, P. Vision meets drones: A challenge. arXiv arXiv:1804.07437.
- Du, D. The unmanned aerial vehicle benchmark: Object detection and tracking. In Proceedings of the Proceedings of the European conference on computer vision (ECCV.
- Shao, S. Crowdhuman: A benchmark for detecting human in a crowd. arXiv arXiv:1805.00123. [CrossRef]
- Yang, S. Wider face: A face detection benchmark. In Proceedings of the Proceedings of the IEEE conference on computer vision and pattern recognition.
- Yan, K. DeepLesion: automated mining of large-scale lesion annotations and universal lesion detection with deep learning. Journal of medical imaging 5, 036501–036501. [CrossRef]
- Redmon, J. You only look once: Unified, real-time object detection. In Proceedings of the Proceedings of the IEEE conference on computer vision and pattern recognition.
- Redmon, J.; Farhadi, A. YOLO9000: better, faster, stronger. In Proceedings of the Proceedings of the IEEE conference on computer vision and pattern recognition.
- Redmon, J.; Farhadi, A. Yolov3: An incremental improvement. arXiv arXiv:1804.02767. [CrossRef]
- Bochkovskiy, A.; Wang, C.Y.; Liao, H.Y.M. Yolov4: Optimal speed and accuracy of object detection. arXiv arXiv:2004.10934. [CrossRef]
- Li, C. YOLOv6: A single-stage object detection framework for industrial applications. arXiv arXiv:2209.02976. [CrossRef]
- Wang, C.Y.; Bochkovskiy, A.; Liao, H.Y. YOLOv7: Trainable bag-of-freebies sets new state-of-the-art for real-time object detectors. In Proceedings of the Proceedings of the IEEE/CVF conference on computer vision and pattern recognition.
- Jocher, A.; Chaurasia, A.; Qiu, A. Ultralytics YOLOv8. Available from.
- Wang, C.Y.; Yeh, I.H.; Liao, H.Y.M. YOLOv9: Learning What You Want to Learn Using Programmable Gradient Information. arXiv 2024, arXiv:2402.13616. [Google Scholar] [CrossRef]
- Wang, A.; Chen, H.; Liu, L.; Chen, K.; Lin, Z.; Han, J.; Ding, G. YOLOv10: Real-Time End-to-End Object Detection. arXiv 2024. [arXiv:cs.CV/2405.14458]. [Google Scholar]
- Tian, Y.; Ye, Q.; Doermann, D. Yolov12: Attention-centric real-time object detectors. arXiv 2025, arXiv:2502.12524. [Google Scholar]
- Sapkota, R.; Cheppally, R.H.; Sharda, A.; Karkee, M. YOLO26: Key Architectural Enhancements and Performance Benchmarking for Real-Time Object Detection. arXiv 2026, arXiv:cs. [Google Scholar]
- Xue, L. DBH-YOLO: A novel algorithm for surface defects detection of postharvest blue honeysuckle berry fruit. Postharvest Biology and Technology 233, 114045. [CrossRef]
- Latha, R. Fruits and vegetables recognition using YOLO. In Proceedings of the 2022 International Conference on Computer Communication and Informatics (ICCCI), 2022; IEEE. [Google Scholar]
- Sachin, C. Vegetable classification using you only look once algorithm. In Proceedings of the 2019 international conference on cutting-edge technologies in engineering (ICon-CuTE), 2019; IEEE. [Google Scholar]
- Reddy, M.; Aishwarya, N. A deep learning approach to identify fresh and stale fruits and vegetables with YOLO. In Proceedings of the 2023 International Conference on Advances in Electronics, Communication, Computing and Intelligent Information Systems (ICAECIS), 2023; IEEE. [Google Scholar]
- Lawal, O. Real-time cucurbit fruit detection in greenhouse using improved YOLO series algorithm. Precision Agriculture 25, 347–359. [CrossRef]
- Gao, G. Using improved YOLO V5s to recognize tomatoes in a continuous working environment. Signal, Image and Video Processing 18, 4019–4028. [CrossRef]
- Yang, L.; Noguchi, T.; Hoshino, Y. Development of a pumpkin fruits pick-and-place robot using an RGB-D camera and a YOLO based object detection AI model. Computers and Electronics in Agriculture 227, 109625. [CrossRef]
- Li, J. An improved YOLOv5-based vegetable disease detection method. Computers and Electronics in Agriculture 107345. [CrossRef]
- Mathew, M.; Mahesh, T. Leaf-based disease detection in bell pepper plant using YOLO v5. Signal, Image and Video Processing 16, 841–847. [CrossRef]
- Wang, X.; Liu, J. Vegetable disease detection using an improved YOLOv8 algorithm in the greenhouse plant environment. Scientific reports 14, 4261. [CrossRef]
- Moraes, J. Yolo-Papaya: A papaya fruit disease detector and classifier using CNNs and convolutional block attention modules. Electronics 12, 2202. [CrossRef]
- Liu, J.; Wang, X. Tomato diseases and pests detection based on improved Yolo V3 convolutional neural network. Frontiers in plant science 11, 898. [CrossRef]
- Tian, Y. MD-YOLO: Multi-scale Dense YOLO for small target pest detection. Computers and Electronics in Agriculture 213, 108233. [CrossRef]
- Hua, W.; Chen, Q. A survey of small object detection based on deep learning in aerial images. Artificial Intelligence Review 58, 1–67. [CrossRef]
- Han, W. A context-scale-aware detector and a new benchmark for remote sensing small weak object detection in unmanned aerial vehicle images. International Journal of Applied Earth Observation and Geoinformation 112, 102966. [CrossRef]
- Yang, X. TAD-YOLO: A lightweight nearshore ship detection method for small USVs in maritime trade surveillance. Ocean Engineering 341, 122618. [CrossRef]
- Magalhães, R.; Falcão, A.; Barbosa, A. Vessel detection leveraging satellite imagery and YOLO in maritime surveillance. Remote Sensing Applications: Society and Environment 101730. [CrossRef]
- Prabhu, B. RescueNet: YOLO-based object detection model for detection and counting of flood survivors. Modeling Earth Systems and Environment 8, 4509–4516. [CrossRef]
- Chandra, N.; Vaidya, H. Automated detection of landslide events from multi-source remote sensing imagery: Performance evaluation and analysis of YOLO algorithms. Journal of Earth System Science 133, 127. [CrossRef]
- Mittal, U.; Chawla, P.; Tiwari, R. EnsembleNet: A hybrid approach for vehicle detection and estimation of traffic density based on faster R-CNN and YOLO models. Neural Computing and Applications 35, 4755–4774. [CrossRef]
- Zarei, N.; Moallem, P.; Shams, M. Fast-Yolo-rec: Incorporating Yolo-base detection and recurrent-base prediction networks for fast vehicle detection in consecutive images. IEEE access 10, 120592–120605. [CrossRef]
- Koay, H. YOLO-RTUAV: Towards real-time vehicle detection through aerial images with low-cost edge devices. Remote Sensing 13, 4196. [CrossRef]
- Carrasco, D.P.; Rashwan, H.A.; García, M.Á.; Puig, D. T-YOLO: Tiny vehicle detection based on YOLO and multi-scale convolutional neural networks. Ieee Access 2021, 11, 22430–22440. [Google Scholar] [CrossRef]
- Wang, Z.; Zhang, K.; Wu, F.; Lv, H. YOLO-PEL: The efficient and lightweight vehicle detection method based on YOLO algorithm. Sensors 2025, 25, 1959. [Google Scholar] [CrossRef]
- Liu, Y.; Huang, Z.; Song, Q.; Bai, K. PV-YOLO: A lightweight pedestrian and vehicle detection model based on improved YOLOv8. Digital Signal Processing 2025, 156, 104857. [Google Scholar] [CrossRef]
- Hsu, W.Y.; Lin, W.Y. Ratio-and-scale-aware YOLO for pedestrian detection. IEEE transactions on image processing 30, 934–947. [CrossRef] [PubMed]
- Liu, W. VP-YOLO: A human visual perception-inspired robust vehicle-pedestrian detection model for complex traffic scenarios. Expert Systems with Applications 126837. [CrossRef]
- Falaschetti, L. Embedded Real-Time Vehicle and Pedestrian Detection Using a Compressed Tiny YOLO v3 Architecture. IEEE Transactions on Intelligent Transportation Systems.
- Yu, J.; Ye, X.; Tu, Q. Traffic sign detection and recognition in multiimages using a fusion model with YOLO and VGG network. IEEE Transactions on Intelligent Transportation Systems 23, 16632–16642. [CrossRef]
- Han, Y. EDN-YOLO: Multi-scale traffic sign detection method in complex scenes. Digital Signal Processing 153, 104615. [CrossRef]
- Chu, J.; Zhang, C.; Yan, M.; Zhang, H.; Ge, T. TRD-YOLO: a real-time, high-performance small traffic sign detection algorithm. Sensors 2023, 23, 3871. [Google Scholar] [CrossRef]
- Cui, Y.; Guo, D.; Yuan, H.; Gu, H.; Tang, H. Enhanced YOLO network for improving the efficiency of traffic sign detection. Applied Sciences 2024, 14, 555. [Google Scholar] [CrossRef]
- Du, S.; Pan, W.; Li, N.; Dai, S.; Xu, B.; Liu, H.; Xu, C.; Li, X. TSD-YOLO: Small traffic sign detection based on improved YOLO v8. IET Image Processing 2024, 18, 2884–2898. [Google Scholar] [CrossRef]
- Zhang, X. A fast learning method for accurate and robust lane detection using two-stage feature extraction with YOLO v3. Sensors 18, 4308. [CrossRef]
- Huu, P.; Thi, Q.; Quynh, P.T. Proposing Lane and Obstacle Detection Algorithm Using YOLO to Control Self-Driving Cars on Advanced Networks. Advances in Multimedia 2022, 3425295. [Google Scholar] [CrossRef]
- Roy, A. WilDect-YOLO: An efficient and robust computer vision-based accurate object localization model for automated endangered wildlife detection. Ecological Informatics 75, 101919. [CrossRef]
- Lu, X.; Lu, X. An efficient network for multi-scale and overlapped wildlife detection. Signal, Image and Video Processing 17, 343–351. [CrossRef]
- Dalal, S. A hybrid LBP-CNN with YOLO-v5-based fire and smoke detection model in various environmental conditions for environmental sustainability in smart city. Environmental Science and Pollution Research 1–18. [CrossRef]
- Zailan, N. An automatic garbage detection using optimized YOLO model. Signal, Image and Video Processing 18, 315–323. [CrossRef]
- Aly, G. YOLO based breast masses detection and classification in full-field digital mammograms. Computer methods and programs in biomedicine 200, 105823. [CrossRef]
- Pascual-González, M. Hyperparameter optimization of YOLO models for invasive coronary angiography lesion detection and assessment. Computers in Biology and Medicine 196, 110697. [CrossRef]
- Baccouche, A.; Garcia-Zapirain, B.; Olea, C.C.; Elmaghraby, A.S. Breast Lesions Detection and Classification via YOLO-Based Fusion Models. Computers, Materials & Continua 2021, 69. [Google Scholar] [CrossRef]
- Lee, E.; Kim, J.S.; Park, D.K.; Whangbo, T. YOLO-MR: Meta-Learning-Based Lesion Detection Algorithm for Resolving Data Imbalance. IEEE Access 2024, 12, 49762–49771. [Google Scholar] [CrossRef]
- Peng, J. Autonomous recognition of multiple surgical instruments tips based on arrow OBB-YOLO network. IEEE Transactions on Instrumentation and Measurement 71, 1–13. [CrossRef]
- Koskinen, J. Automated tool detection with deep learning for monitoring kinematics and eye-hand coordination in microsurgery. Computers in Biology and Medicine 141, 105121. [CrossRef]
- Xu, Z.; Luo, F.; Chen, F.; Wu, H.; Yu, M. Surgical tool detection in open surgery based on improved-YOLOv8. Biomedical Signal Processing and Control 2025, 105, 107548. [Google Scholar] [CrossRef]
- Yurdakul, M.; Taşdemir, Ş. BC-YOLO: MBConv-ECA based YOLO framework for blood cell detection. Signal, Image and Video Processing 19, 712. [CrossRef]
- Sazak, H.; Kotan, M. Automated Blood Cell Detection and Classification in Microscopic Images Using YOLOv11 and Optimized Weights. Diagnostics 2024, 15, 22. [Google Scholar] [CrossRef]
- Chang, Y.J. Modified YOLO network model for metaphase cell detection in antinuclear antibody images. Engineering Applications of Artificial Intelligence 127, 107392. [CrossRef]
- Wu, Y.; Gao, D.; Fang, Y.; Xu, X.; Gao, H.; Ju, Z. SDE-YOLO: A novel method for blood cell detection. Biomimetics 2023, 8, 404. [Google Scholar] [CrossRef] [PubMed]
- Mao, Y.; Zhang, H.; Wu, W.; Gao, X.; Lin, Z.; Lin, J. DWS-YOLO: A Lightweight Detector for Blood Cell Detection. Applied Artificial Intelligence 2024, 38, 2318673. [Google Scholar] [CrossRef]
- Li, M.; Wang, H.; Wan, Z. Surface defect detection of steel strips based on improved YOLOv4. Computers and Electrical Engineering 102, 108208. [CrossRef]
- Hussain, M. YOLO-v1 to YOLO-v8, the rise of YOLO and its complementary nature toward digital manufacturing and industrial defect detection. Machines 11, 677. [CrossRef]
- Li, P. Study on the interaction behaviors identification of construction workers based on ST-GCN and YOLO. Sensors 23, 6318. [CrossRef] [PubMed]
- Onososen, A. Drowsiness Detection of Construction Workers: Accident Prevention Leveraging Yolov8 Deep Learning and Computer Vision Techniques. Buildings 15, 500. [CrossRef]
- Ge, W. Detection and localization strategy based on YOLO for robot sorting under complex lighting conditions. International Journal of Intelligent Robotics and Applications 7, 589–601. [CrossRef]
- Vaghela, R. Optimizing object detection for autonomous robots: A comparative analysis of YOLO models. Measurement 118676. [CrossRef]
- Zendehdel, N.; Chen, H.; Leu, M. Real-time tool detection in smart manufacturing using You-Only-Look-Once (YOLO) v5. Manufacturing Letters 35, 1052–1059. [CrossRef]
- Zhao, H. Real-time object detection and robotic manipulation for agriculture using a YOLO-based learning approach. In Proceedings of the 2024 IEEE International Conference on Industrial Technology (ICIT), 2024; IEEE. [Google Scholar]
- Narejo, S. Weapon detection using YOLO V3 for smart surveillance system. Mathematical Problems in Engineering 2021, 9975700. [Google Scholar] [CrossRef]
- Wang, G. Fighting against terrorism: A real-time CCTV autonomous weapons detection based on improved YOLO v4. Digital Signal Processing 132, 103790. [CrossRef]
- Zhang, Y. Smr–yolo: Multi-scale detection of concealed suspicious objects in terahertz images. Photonics. [CrossRef]
- Chen, M. YOLO-SRW: An Enhanced YOLO Algorithm for Detecting Prohibited Items in X-Ray Security Images. IEEE Access.
- Gündüz, M.Ş.; Işık, G. A new YOLO-based method for real-time crowd detection from video and performance analysis of YOLO models. Journal of Real-Time Image Processing 2023, 20, 5. [Google Scholar] [CrossRef] [PubMed]
- Ruchika, R.; Verma, S. Analytical study of YOLO and its various versions in crowd counting. In Proceedings of the Intelligent Data Communication Technologies and Internet of Things: Proceedings of ICICI, 2021; Springer; pp. 975–989. [Google Scholar]
- Li, X.; Luo, R.; Islam, F. Tracking and detection of basketball movements using multi-feature data fusion and hybrid YOLO-T2LSTM network. Soft Computing 28, 1653–1667. [CrossRef]
- Agrawal, J. Football player detection and tracking using deep learning approach. In Proceedings of the 2024 International Conference on Artificial Intelligence and Quantum Computation-Based Sensor Application (ICAIQSA), 2024; IEEE. [Google Scholar]
- Khobdeh, S.; Yamaghani, M.; Sareshkeh, S. Basketball action recognition based on the combination of YOLO and a deep fuzzy LSTM network: SB Khobdeh et al. The Journal of Supercomputing 80, 3528–3553. [CrossRef]
- Sun, Z. BiFA-YOLO: A novel YOLO-based method for arbitrary-oriented ship detection in high-resolution SAR images. Remote Sensing 13, 4209. [CrossRef]
- Cai, S.; Meng, H.; Wu, J. FE-YOLO: YOLO ship detection algorithm based on feature fusion and feature enhancement. Journal of Real-Time Image Processing 21, 61. [CrossRef]
- Guan, L. A lightweight framework for obstacle detection in the railway image based on fast region proposal and improved YOLO-tiny network. IEEE Transactions on Instrumentation and Measurement 71, 1–16. [CrossRef]
- Ristić-Durrant, D.; Franke, M.; Michels, K. A review of vision-based on-board obstacle detection and distance estimation in railways. Sensors 21, 3452. [CrossRef] [PubMed]
- Al Muksit, A. YOLO-Fish: A robust fish detection model to detect fish in realistic underwater environment. Ecological Informatics 72, 101847. [CrossRef]
- Park, J.H.; Kang, C. A study on enhancement of fish recognition using cumulative mean of YOLO network in underwater video images. Journal of Marine Science and Engineering 8, 952. [CrossRef]
- Zhou, W. Yolotrashcan: A deep learning marine debris detection network. IEEE Transactions on Instrumentation and Measurement 72, 1–12. [CrossRef]
- Lin, F. Improved YOLO based detection algorithm for floating debris in waterway. Entropy 23, 1111. [CrossRef]
- Kufel, J. Chest X-ray foreign objects detection using artificial intelligence. Journal of Clinical Medicine 12, 5841. [CrossRef] [PubMed]
- Hogeweg, L. Foreign object detection and removal to improve automated analysis of chest radiographs. Medical physics 40, 071901. [CrossRef] [PubMed]
- Pan, K.; Hu, H.; Gu, P. Wd-yolo: A more accurate yolo for defect detection in weld x-ray images. Sensors 23, 8677. [CrossRef]
- Guo, W. Defect detection for industrial neutron radiographic images based on modified YOLO network. Nuclear Instruments and Methods in Physics Research Section A: Accelerators, Spectrometers, Detectors and Associated Equipment 1056, 168694. [CrossRef]
- Hatton-Jones, K. A YOLO based software for automated detection and analysis of rodent behaviour in the open field arena. Computers in Biology and Medicine 134, 104474. [CrossRef] [PubMed]
- Zheng, Z.; Li, J.; Qin, L. YOLO-BYTE: An efficient multi-object tracking algorithm for automatic monitoring of dairy cows. Computers and Electronics in Agriculture 209, 107857. [CrossRef]
- Xie, Y. Recognition of big mammal species in airborne thermal imaging based on YOLO V5 algorithm. integrative Zoology 18, 333–352. [CrossRef] [PubMed]
- Ferrante, G. Evaluating YOLO architectures for detecting road killed endangered Brazilian animals. Scientific reports 14, 1353. [CrossRef] [PubMed]
Figure 1.
Chronological evolution of the YOLO family from YOLOv1 to YOLOv6.
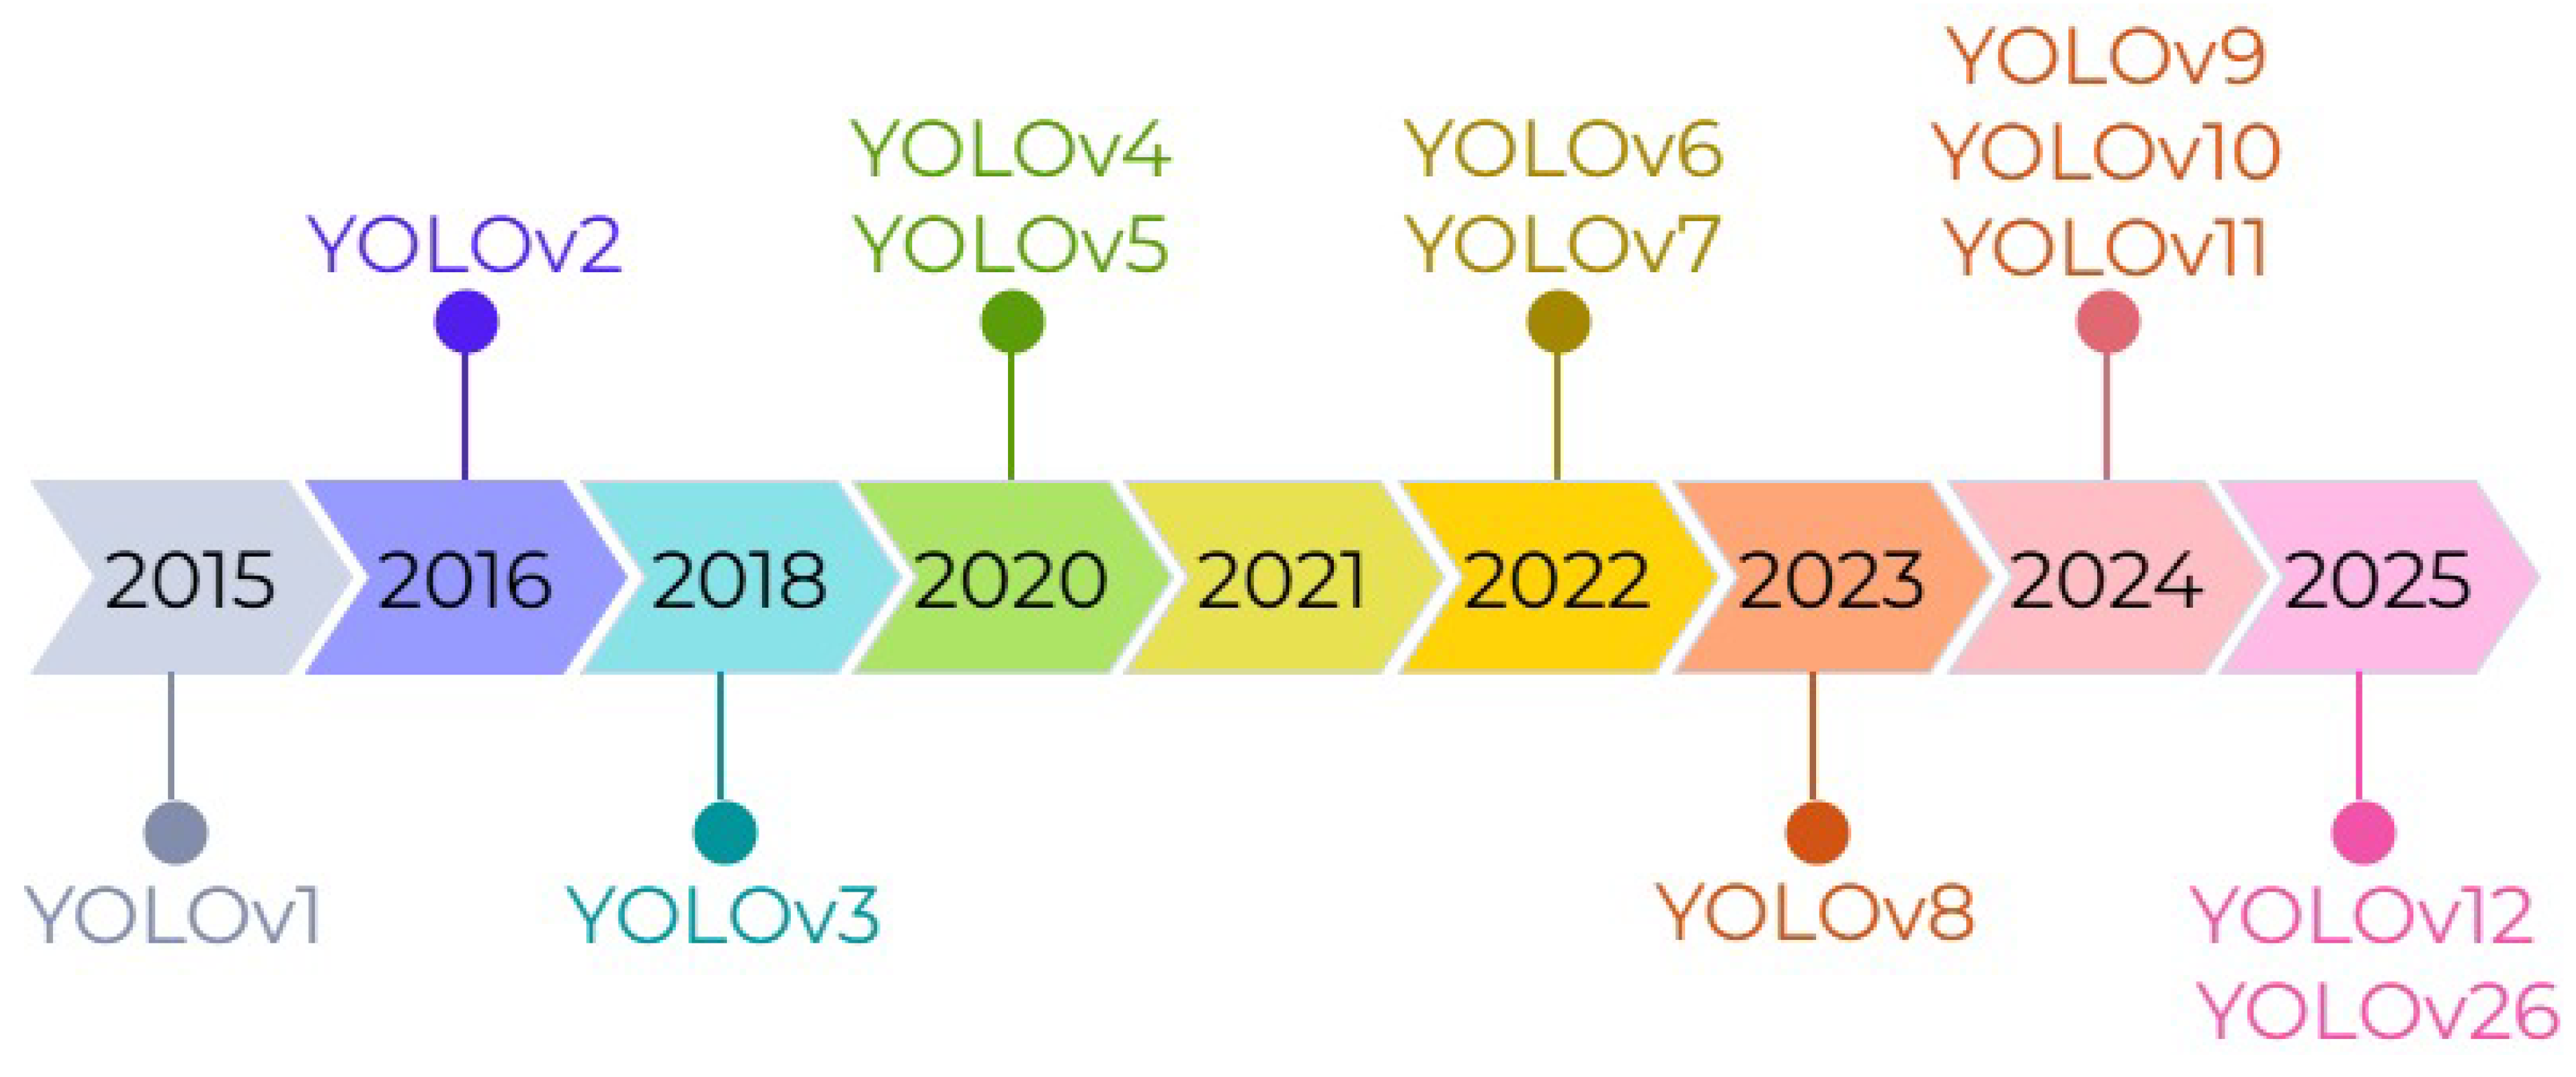
Figure 2.
Color-based augmentation techniques.
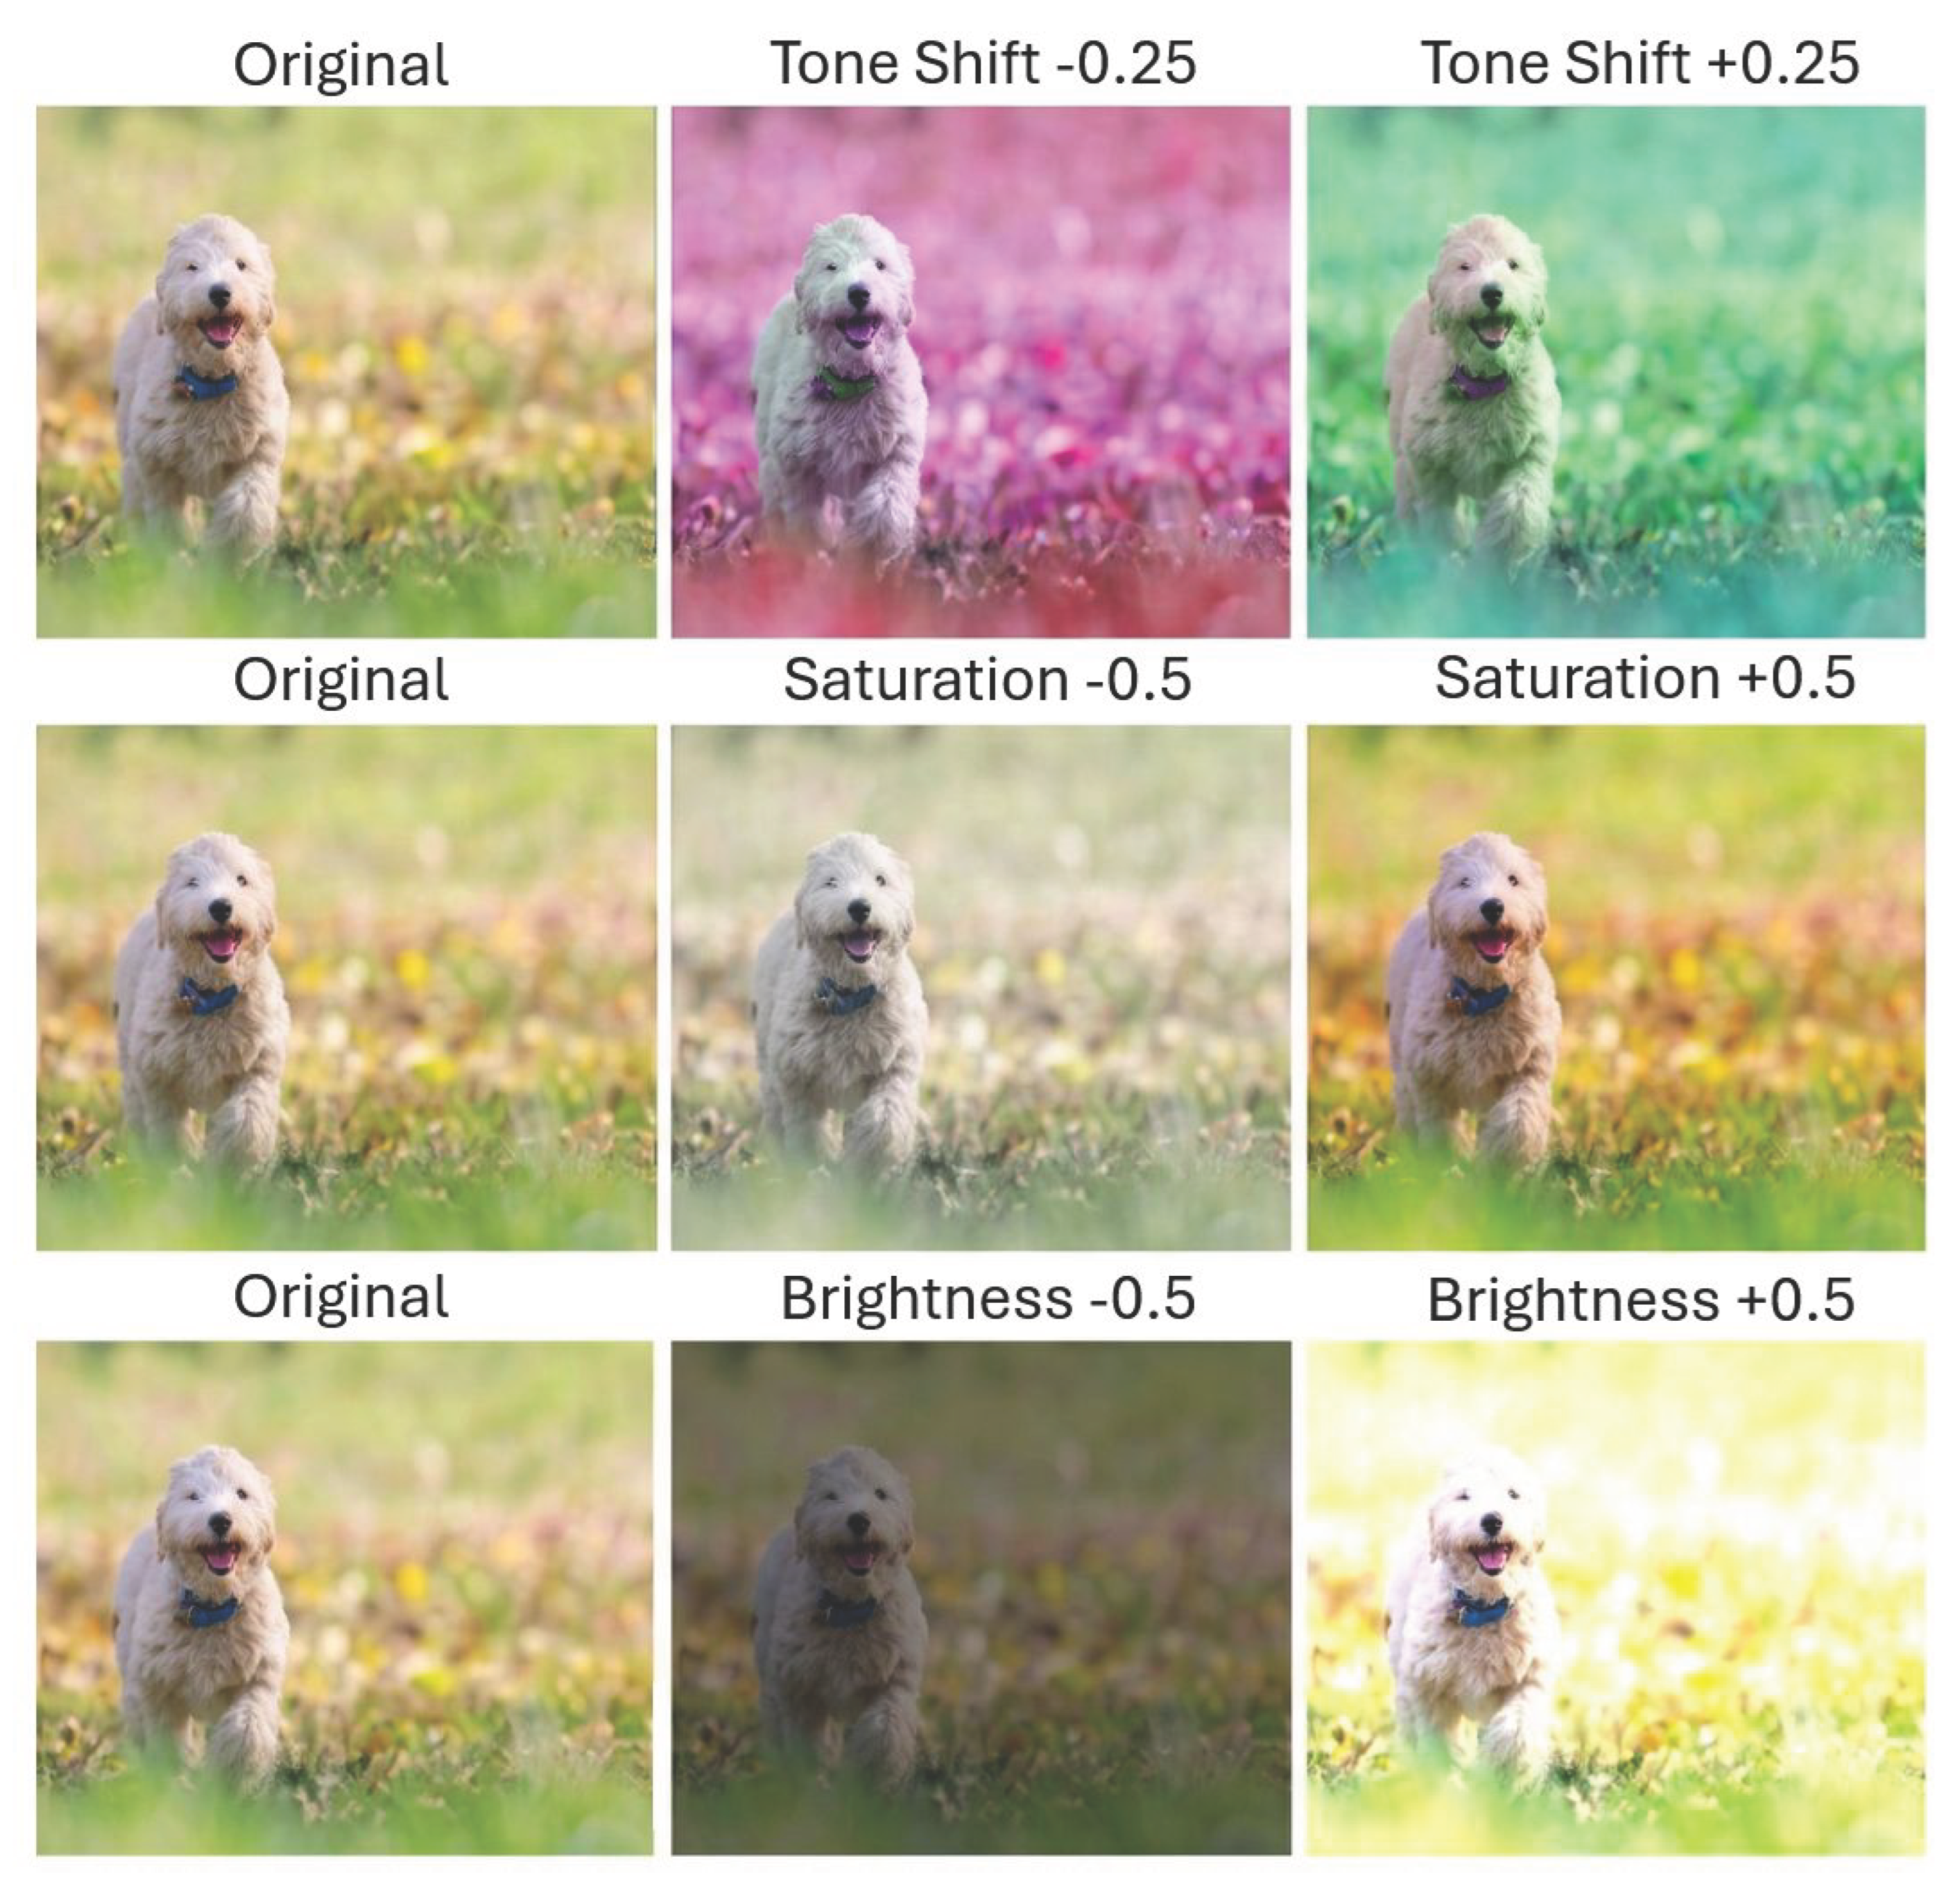
Figure 3.
Geometric augmentation techniques including rotation, scaling, and shearing transformations.
Figure 3.
Geometric augmentation techniques including rotation, scaling, and shearing transformations.
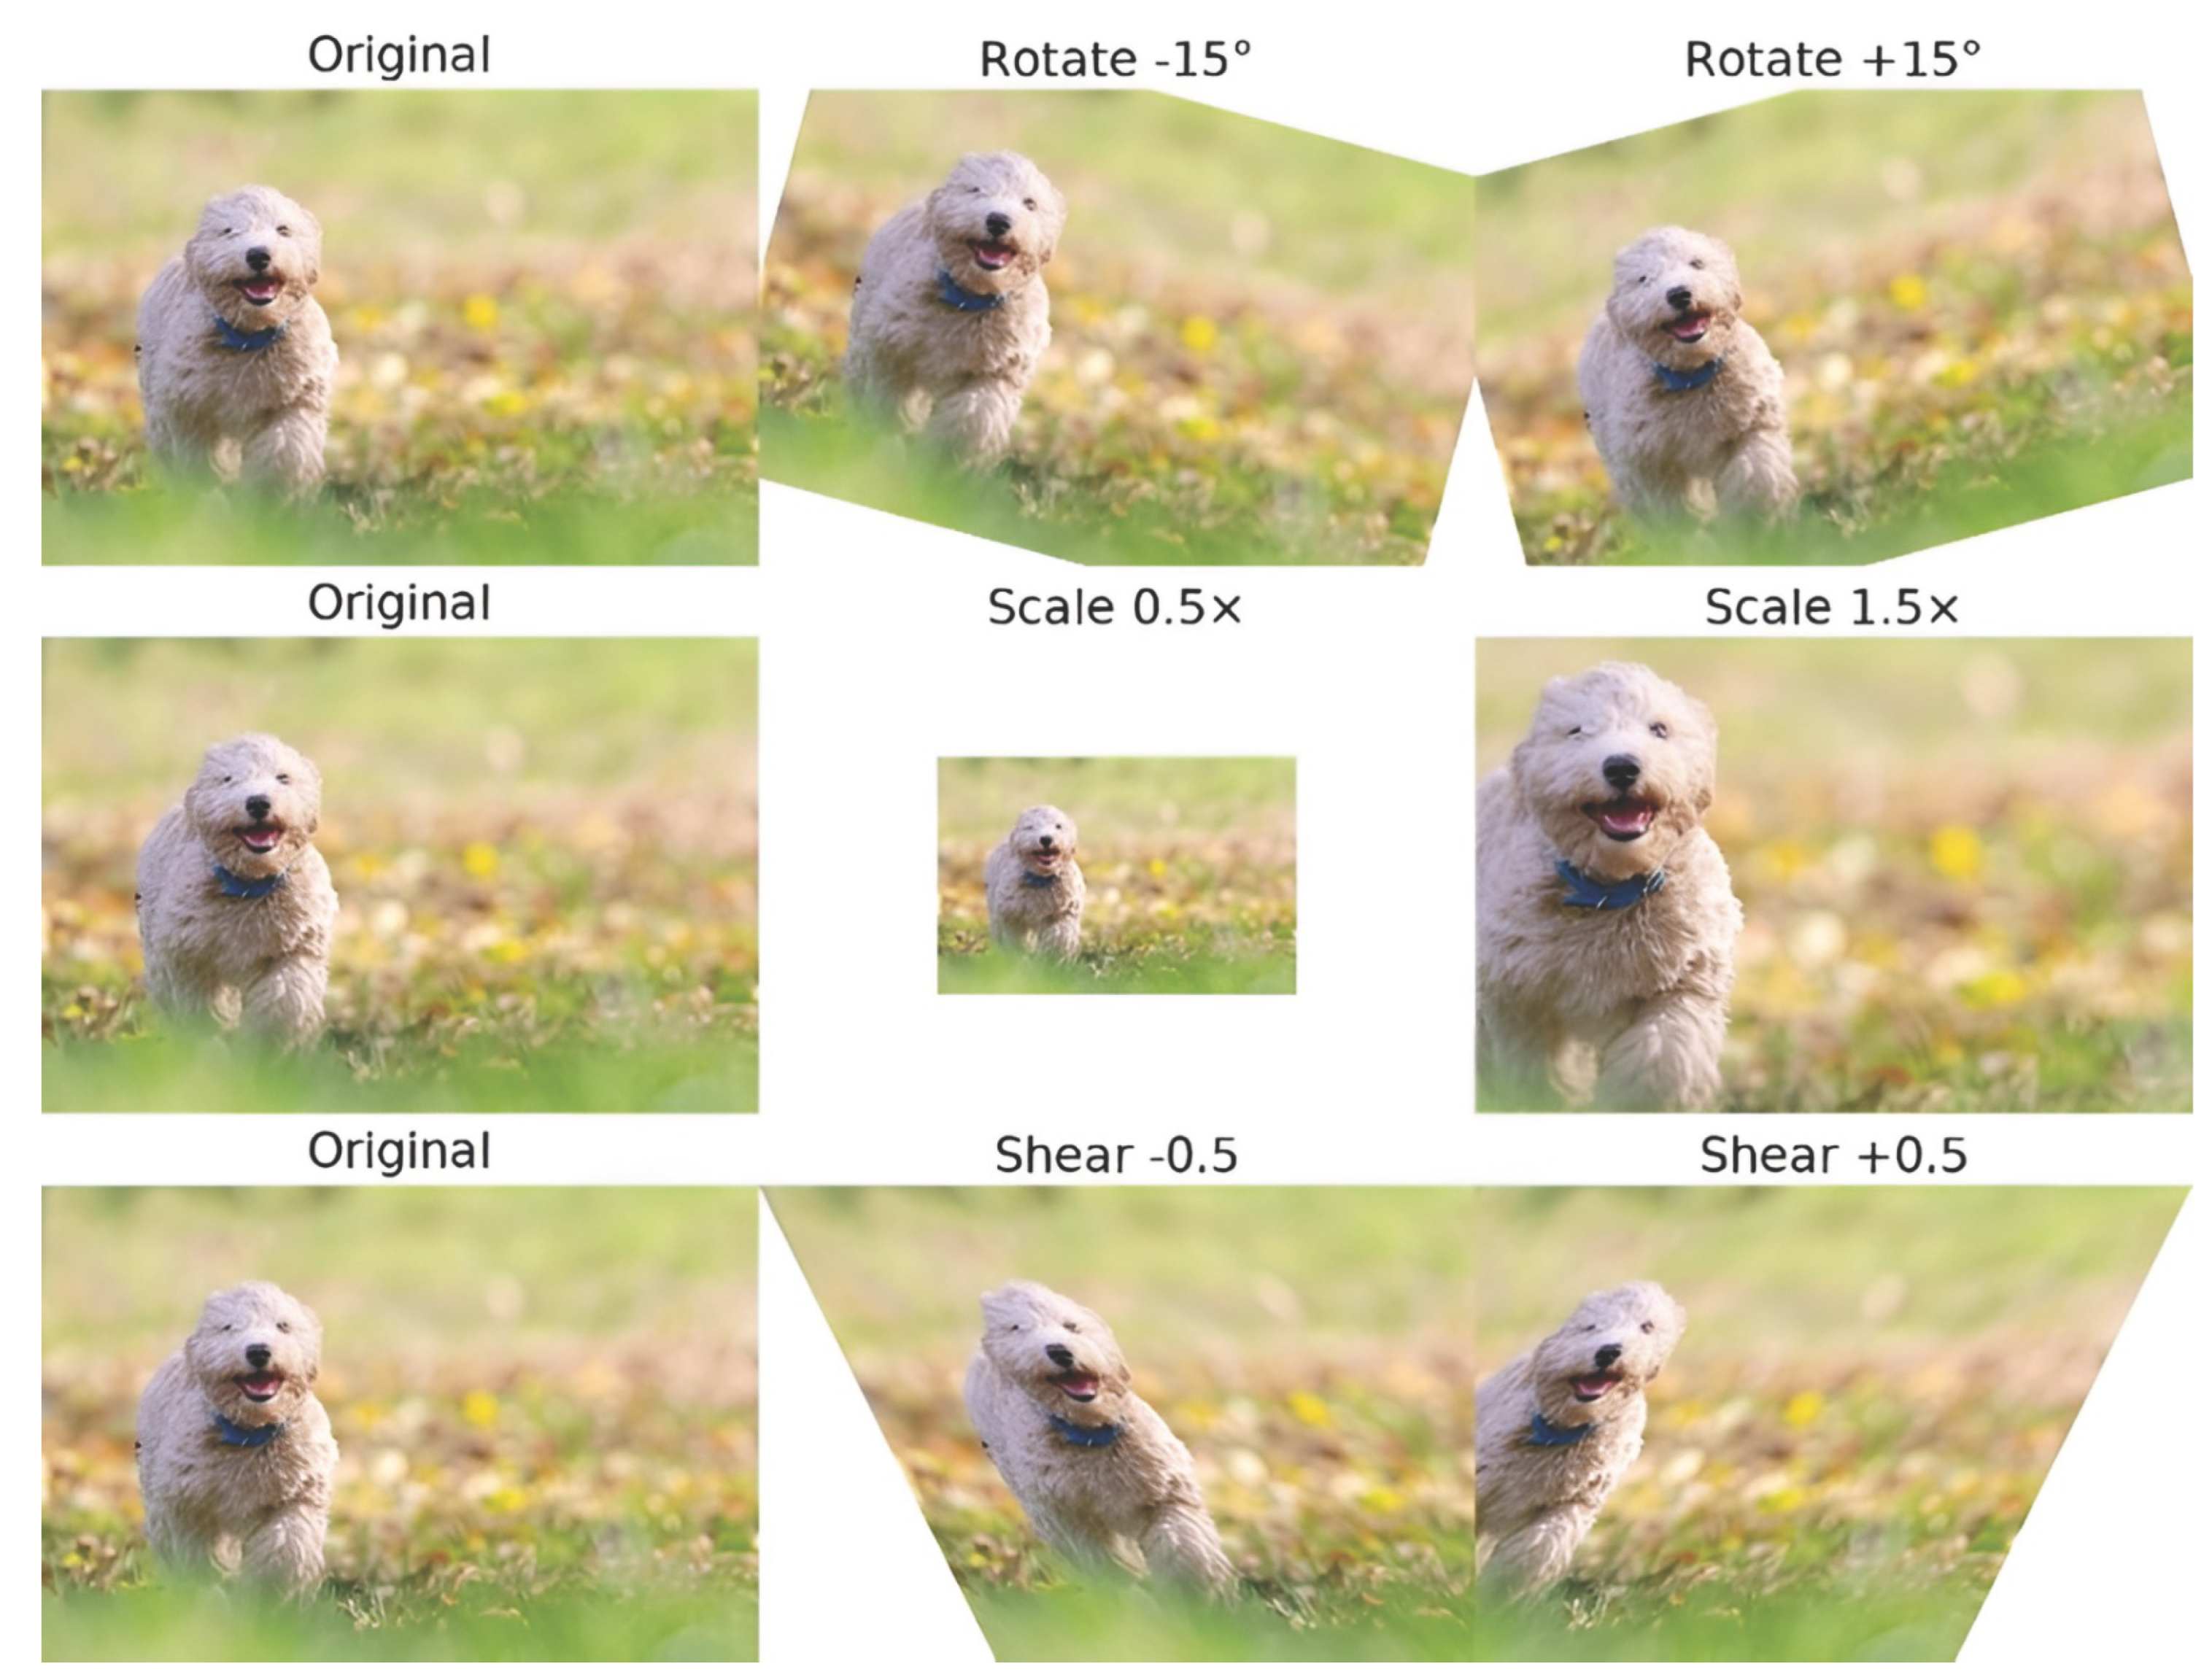
Figure 4.
Patch-based augmentation strategies: Mixup, CutMix, and Copy-Paste techniques.
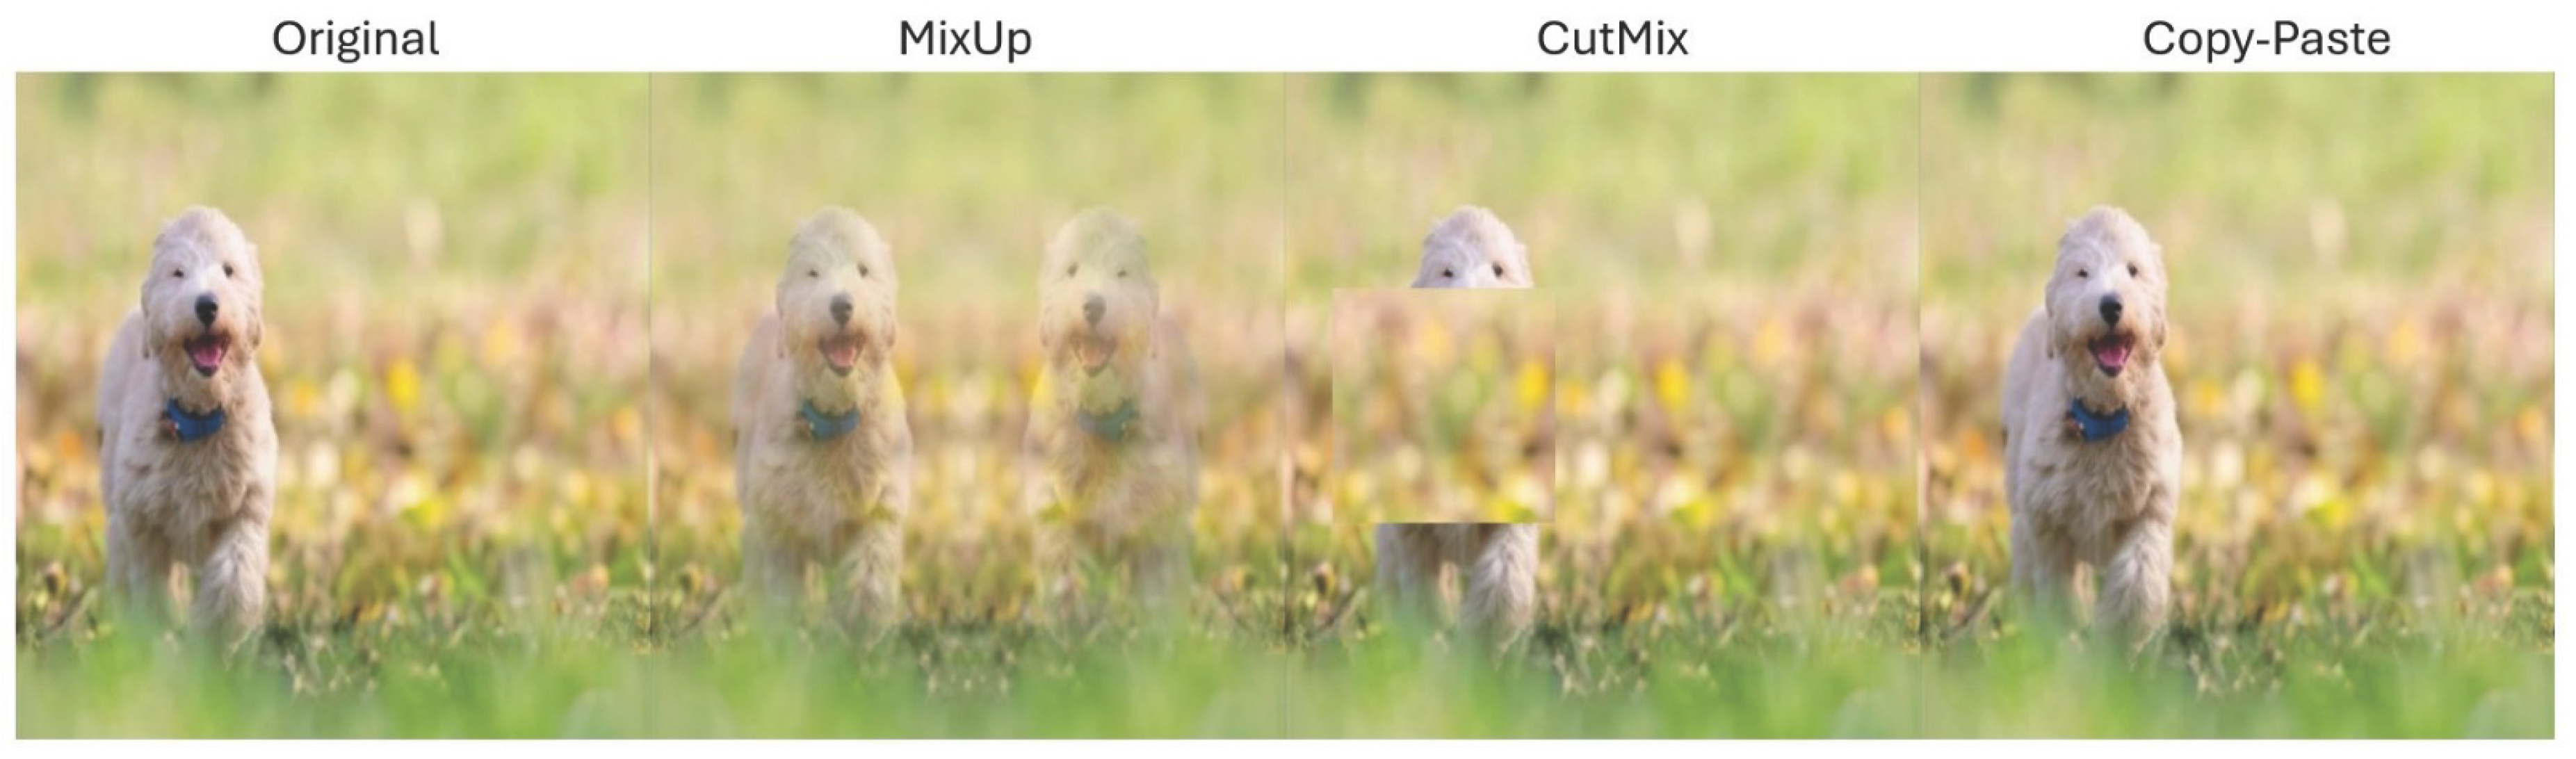
Figure 5.
Visual representation of the IoU metric, showing the overlap between predicted and ground-truth bounding boxes.
Figure 5.
Visual representation of the IoU metric, showing the overlap between predicted and ground-truth bounding boxes.
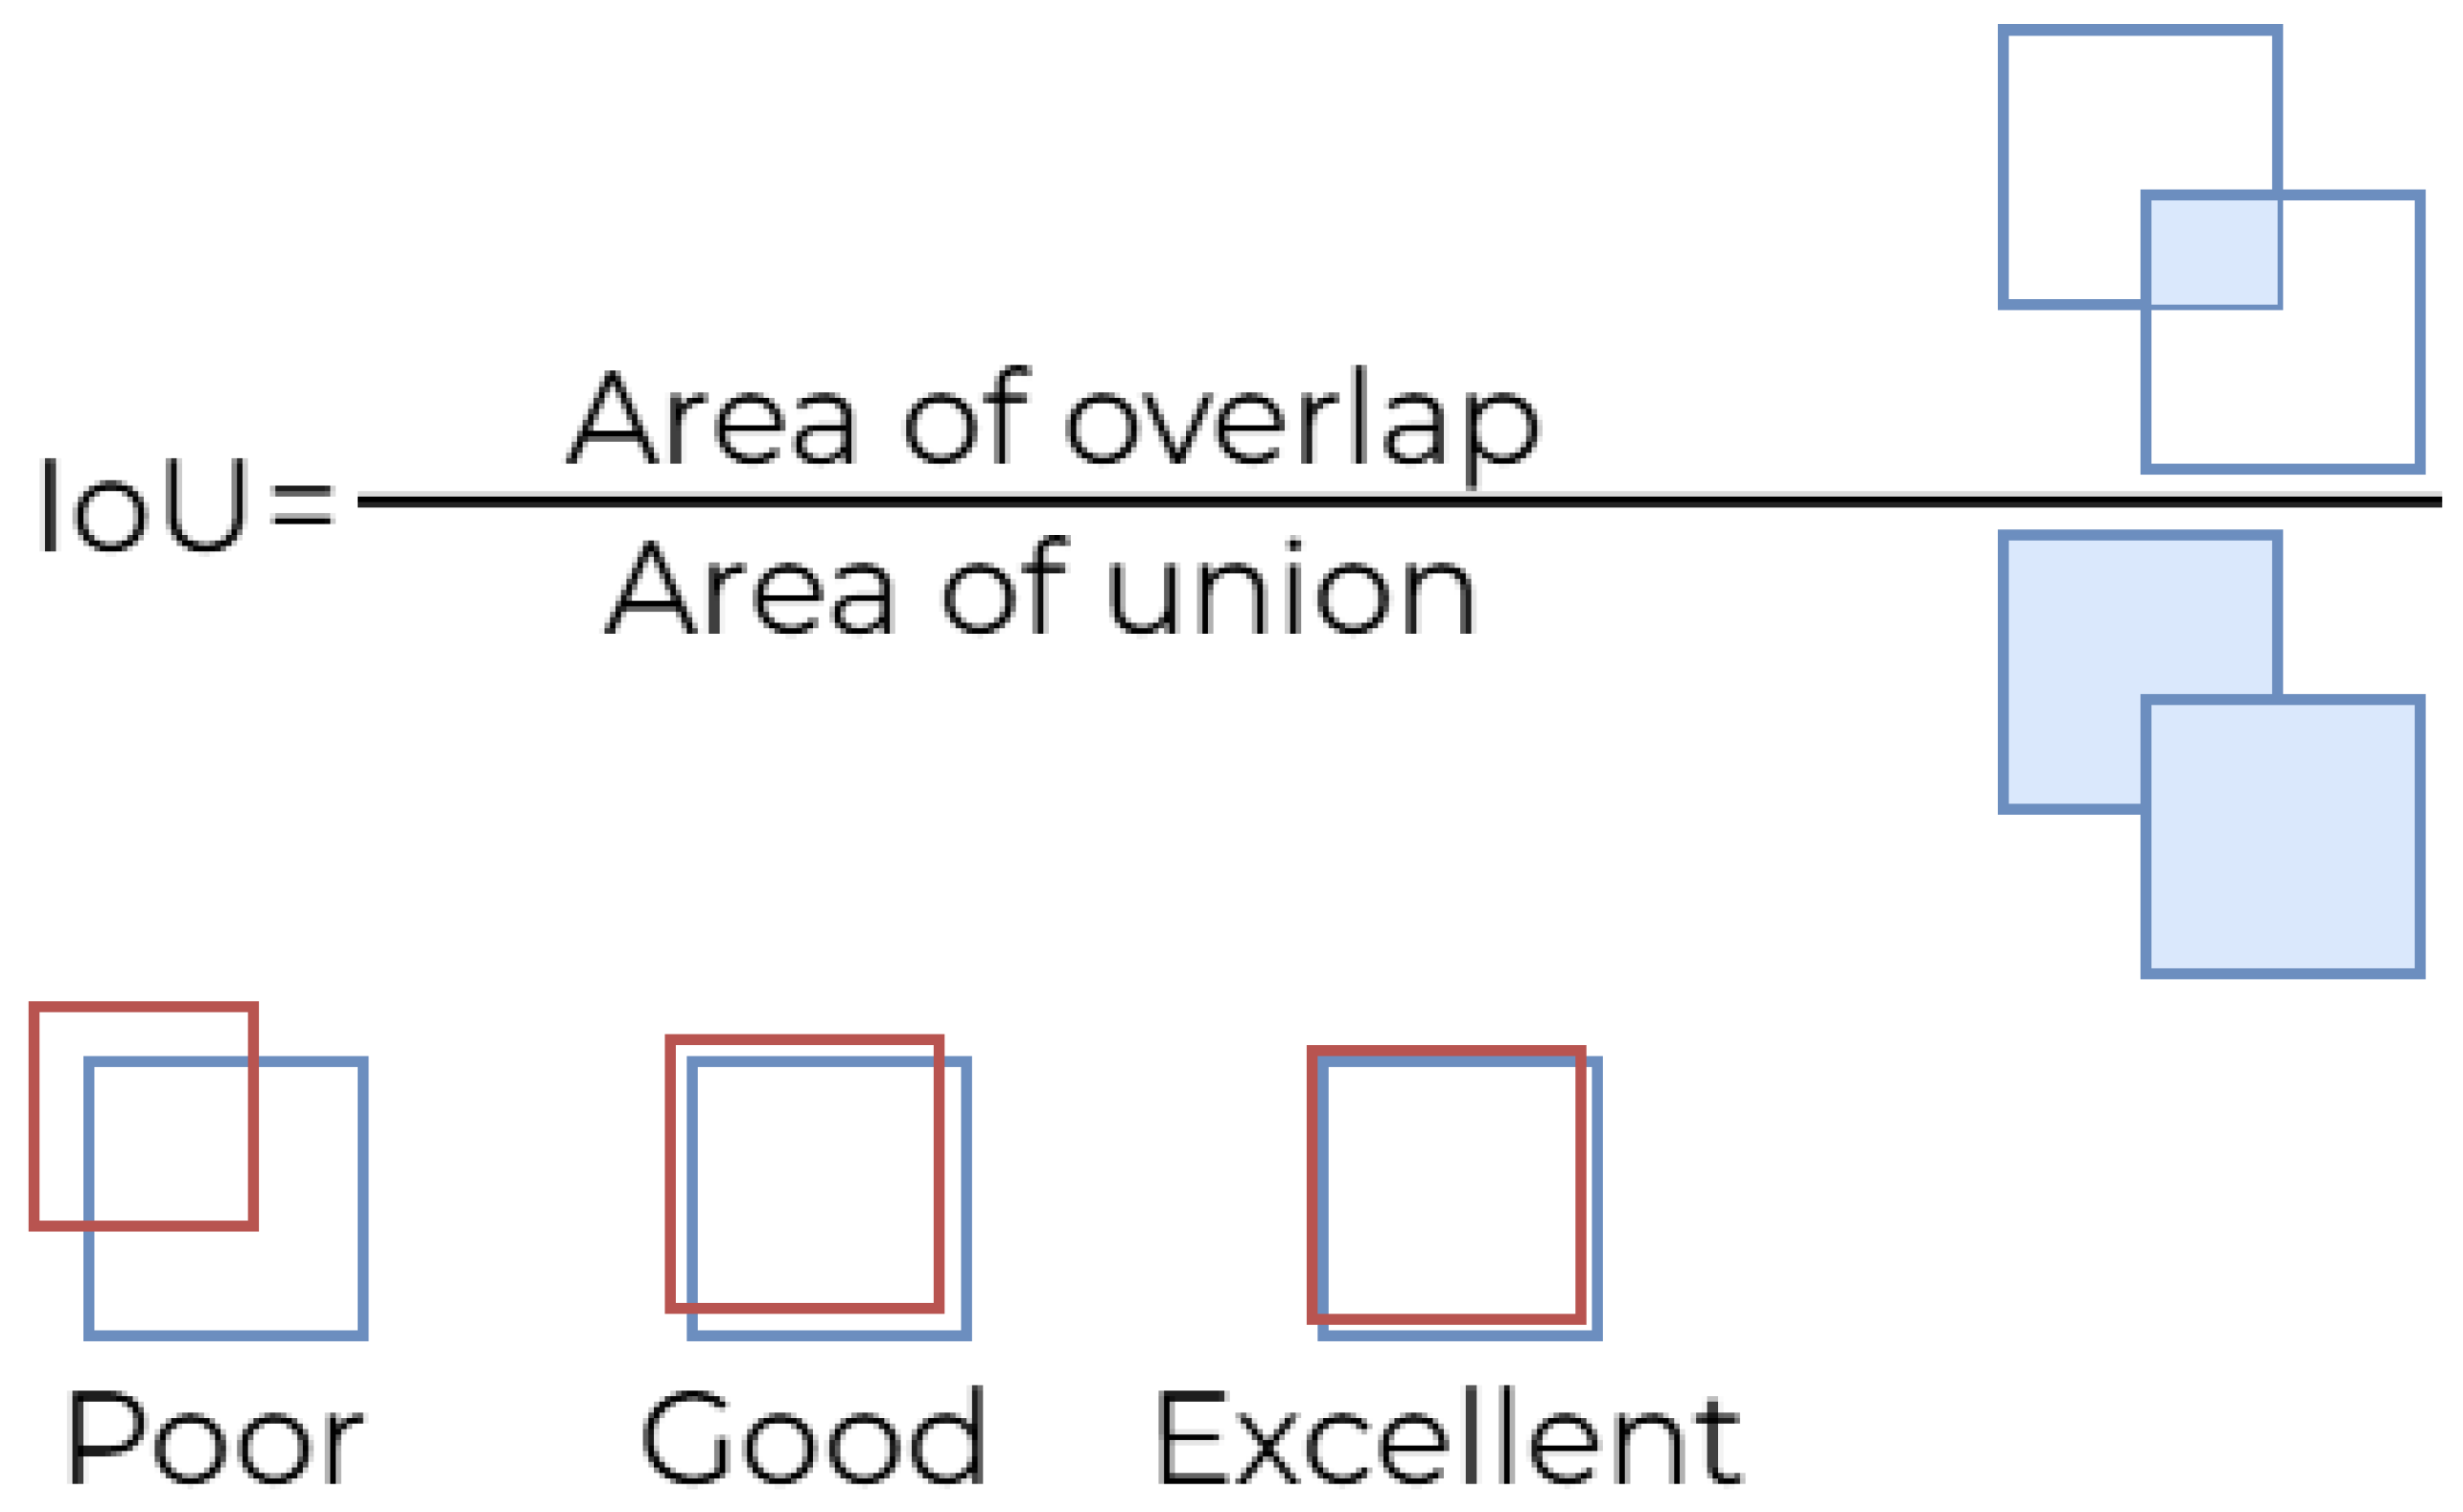
Figure 6.
Overview of the YOLOv1 detection pipeline: grid-based prediction of bounding boxes and class probabilities, followed by NMS to produce the final detections [40].
Figure 6.
Overview of the YOLOv1 detection pipeline: grid-based prediction of bounding boxes and class probabilities, followed by NMS to produce the final detections [40].
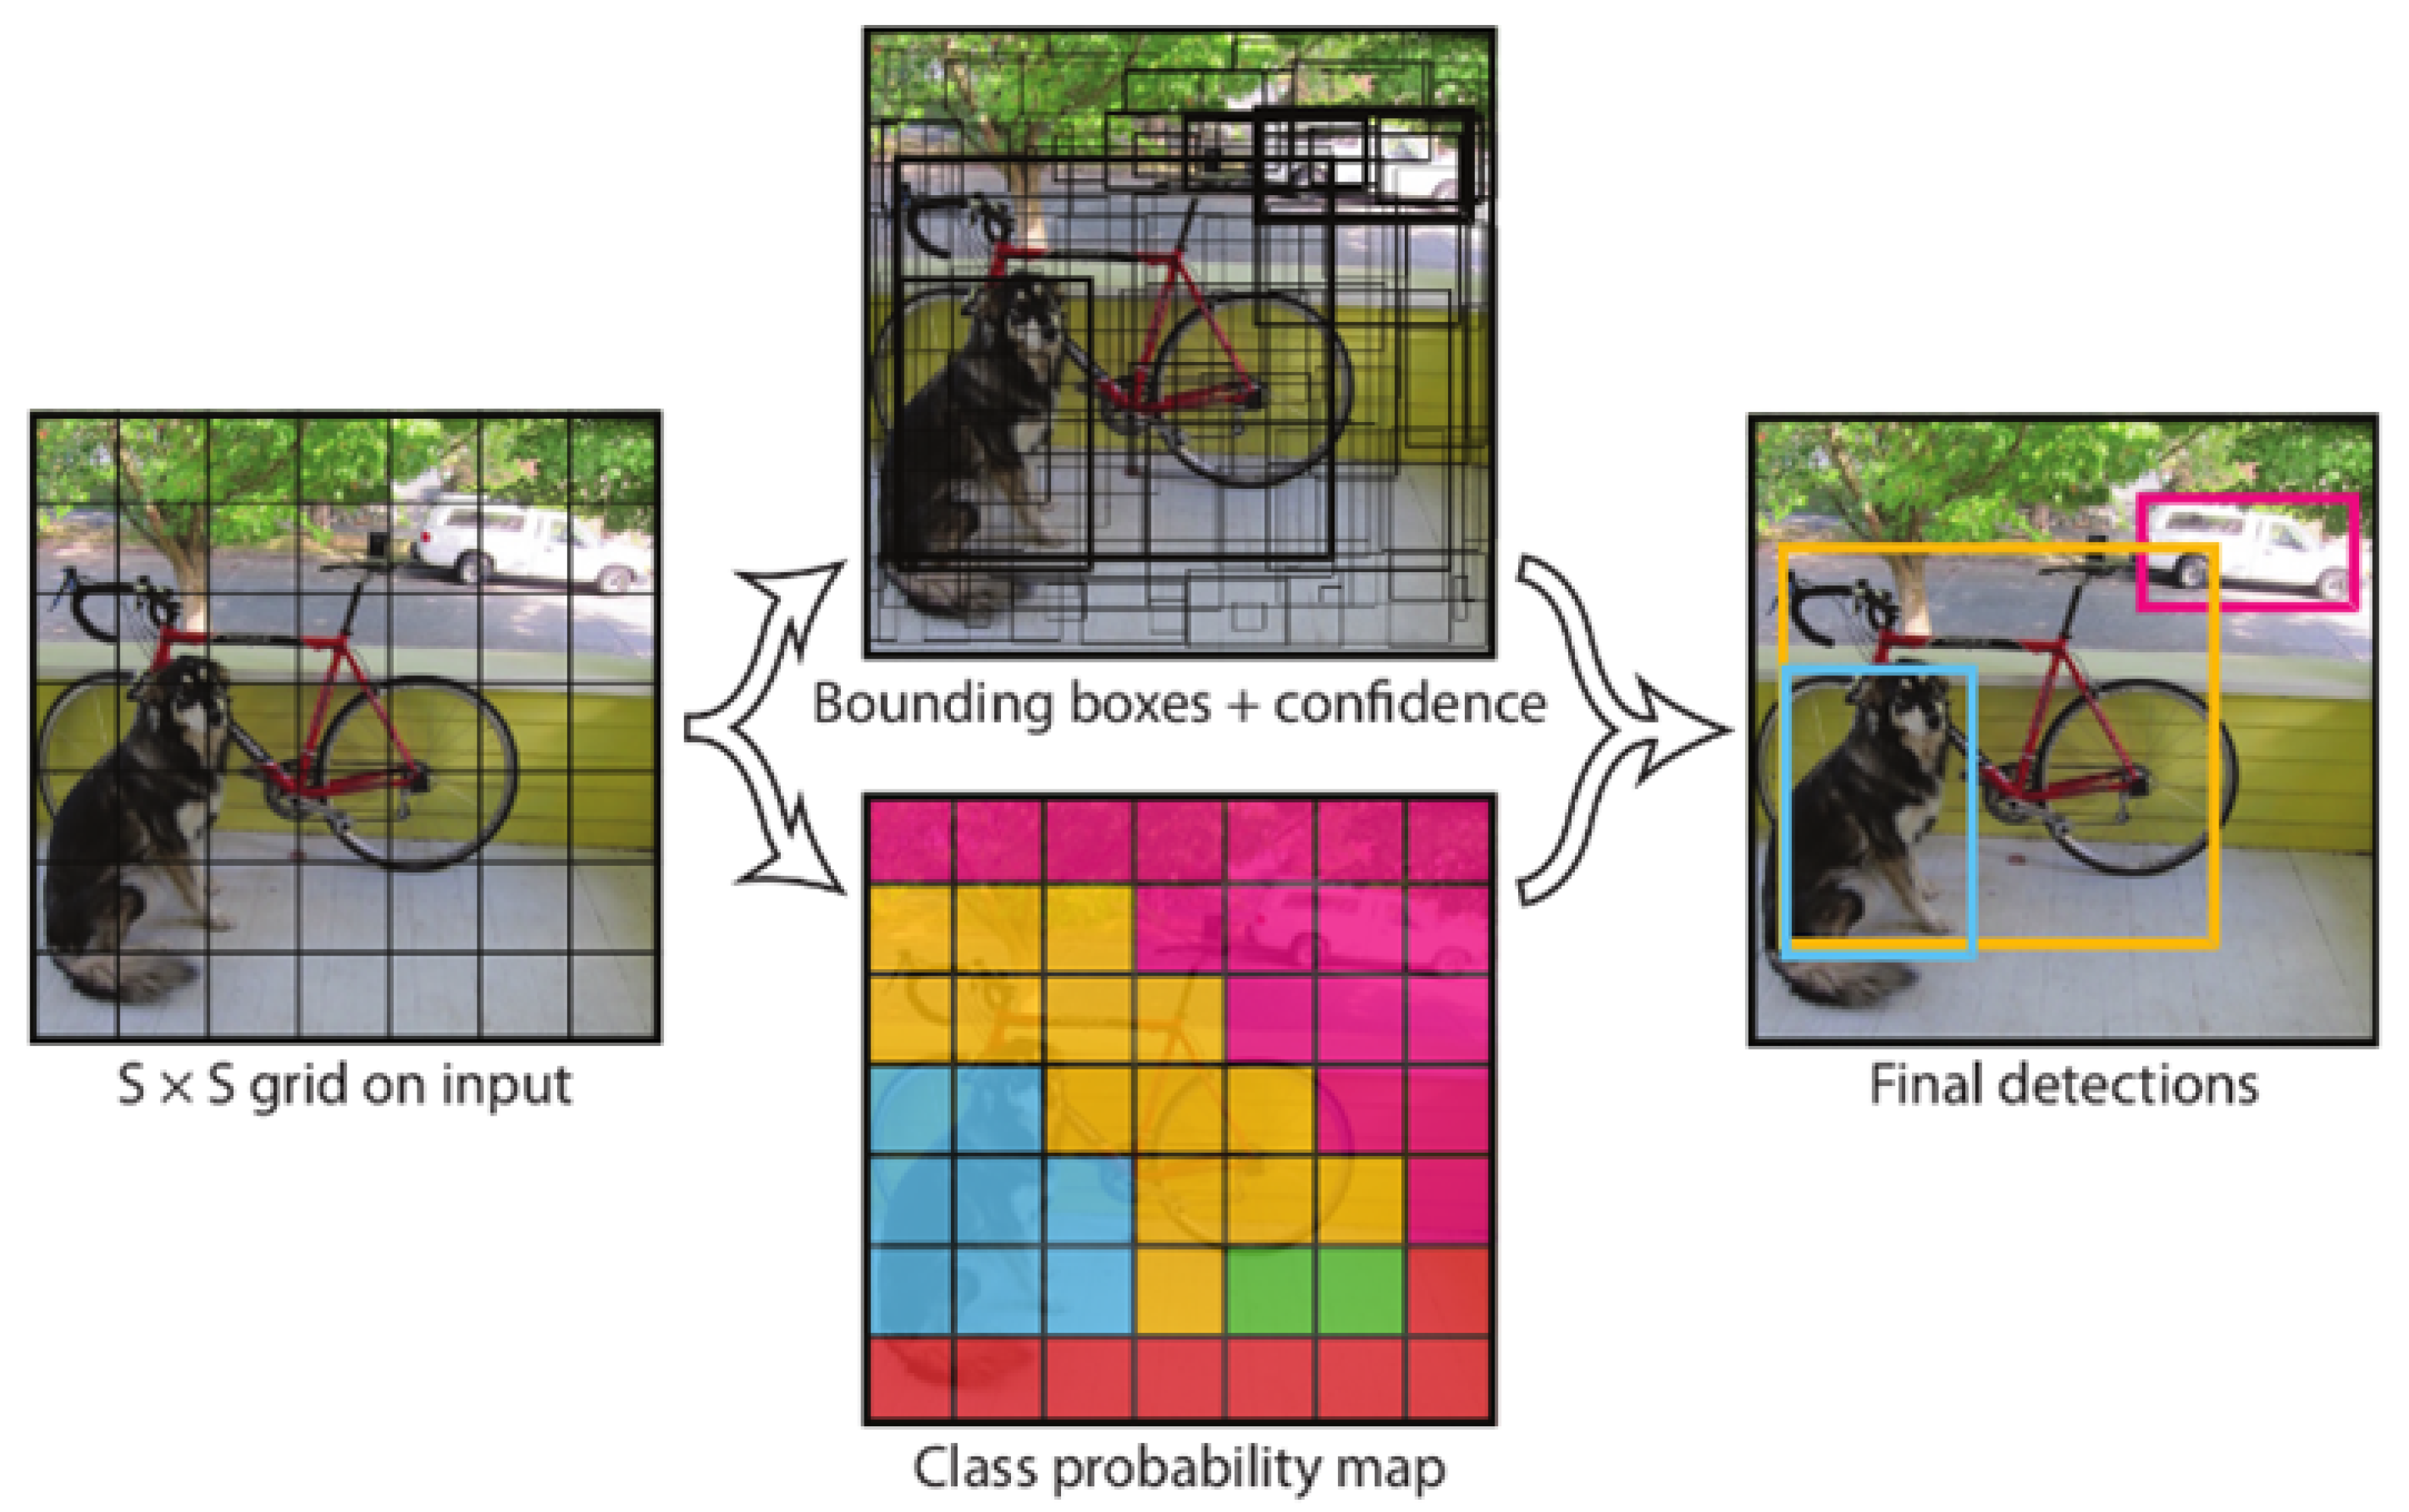
Figure 7.
Bounding boxes with predefined anchor dimensions and constrained location prediction [41].
Figure 7.
Bounding boxes with predefined anchor dimensions and constrained location prediction [41].
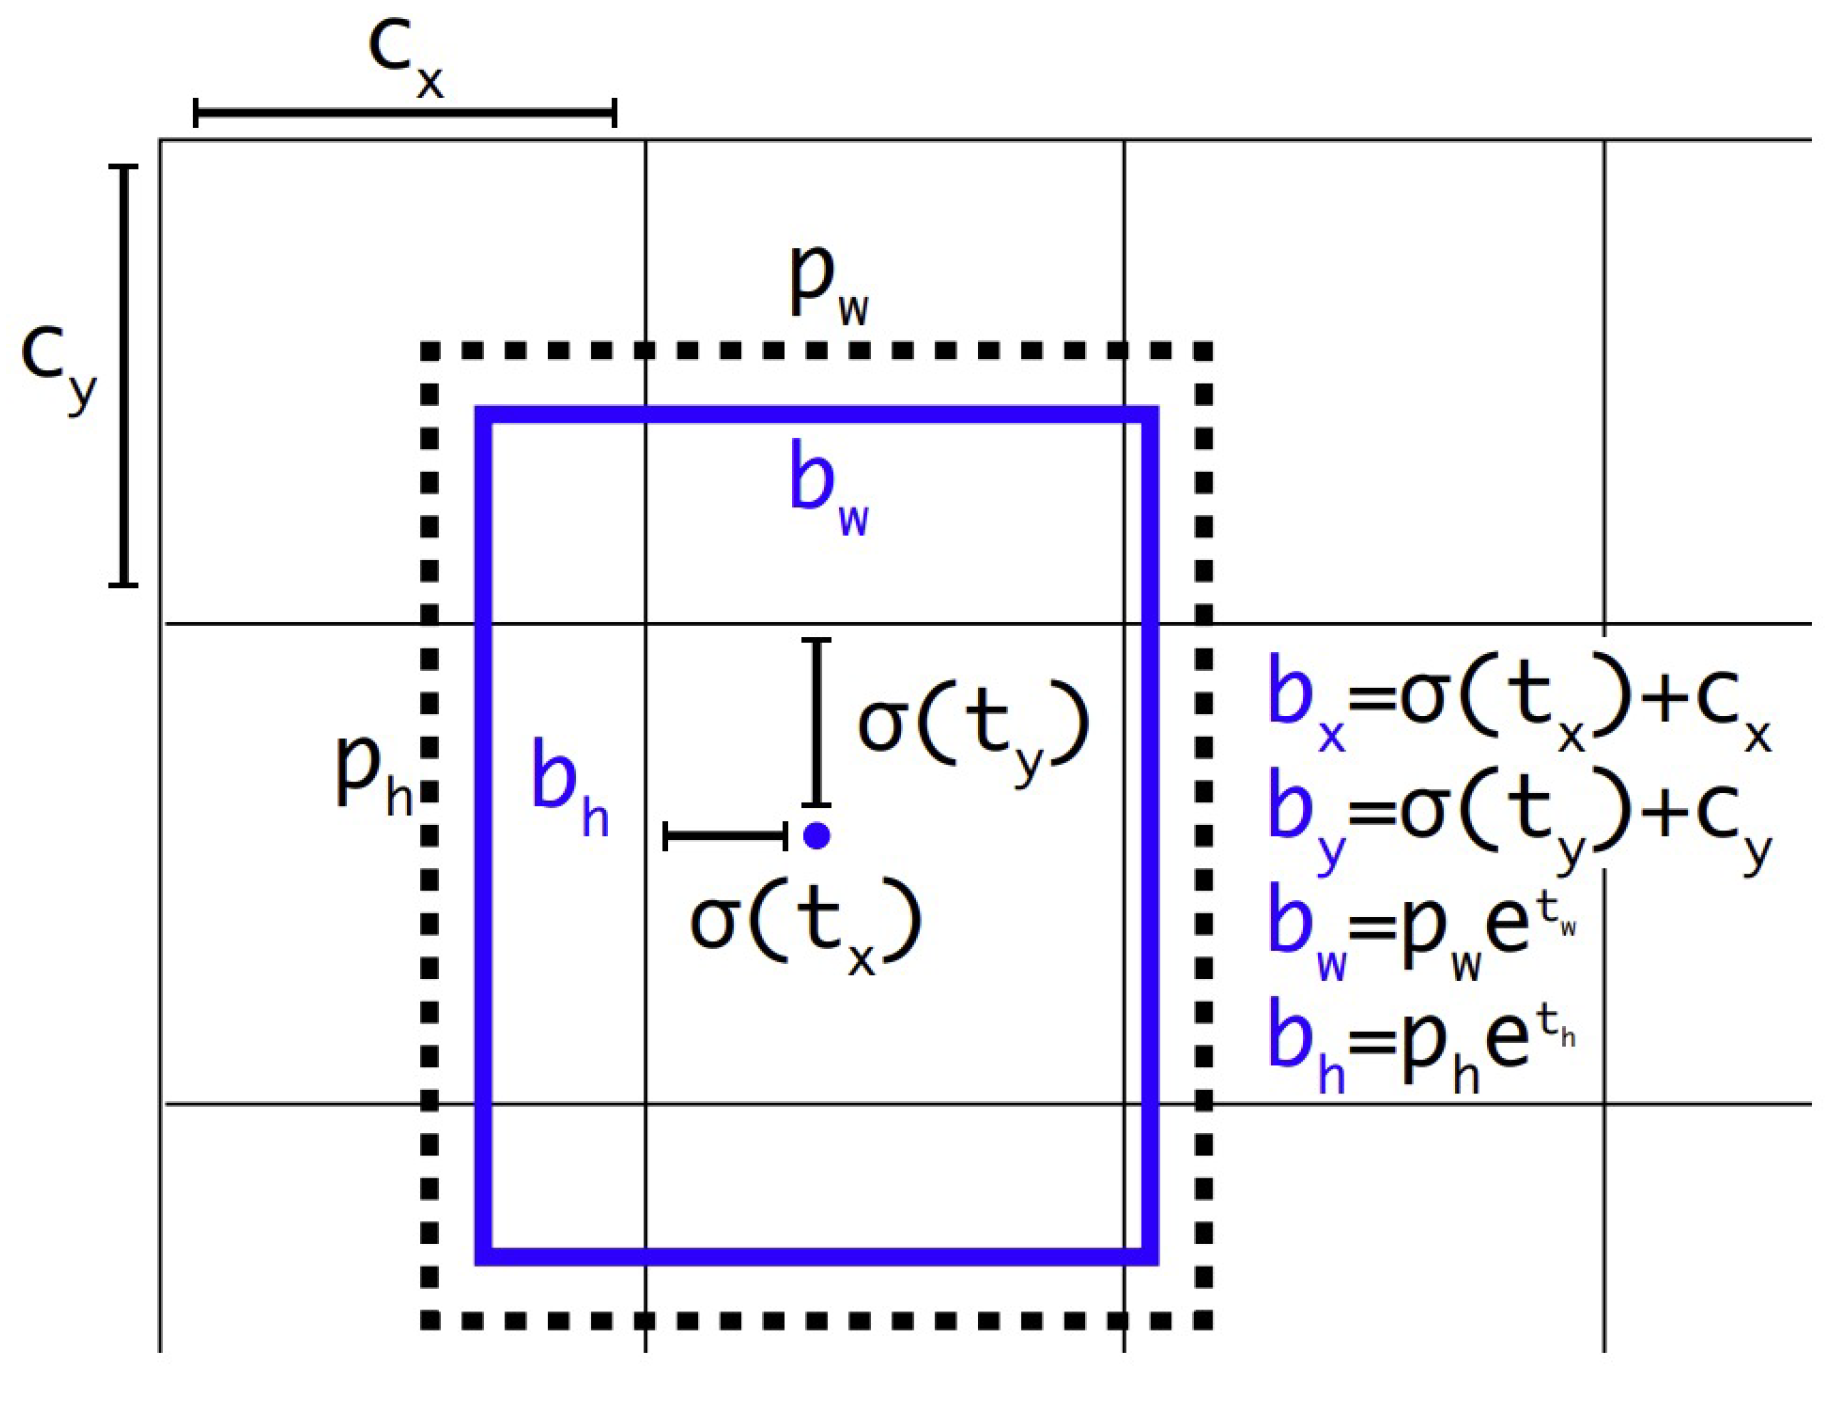
Figure 8.
The backbone–neck–head architecture of YOLO-based object detectors.
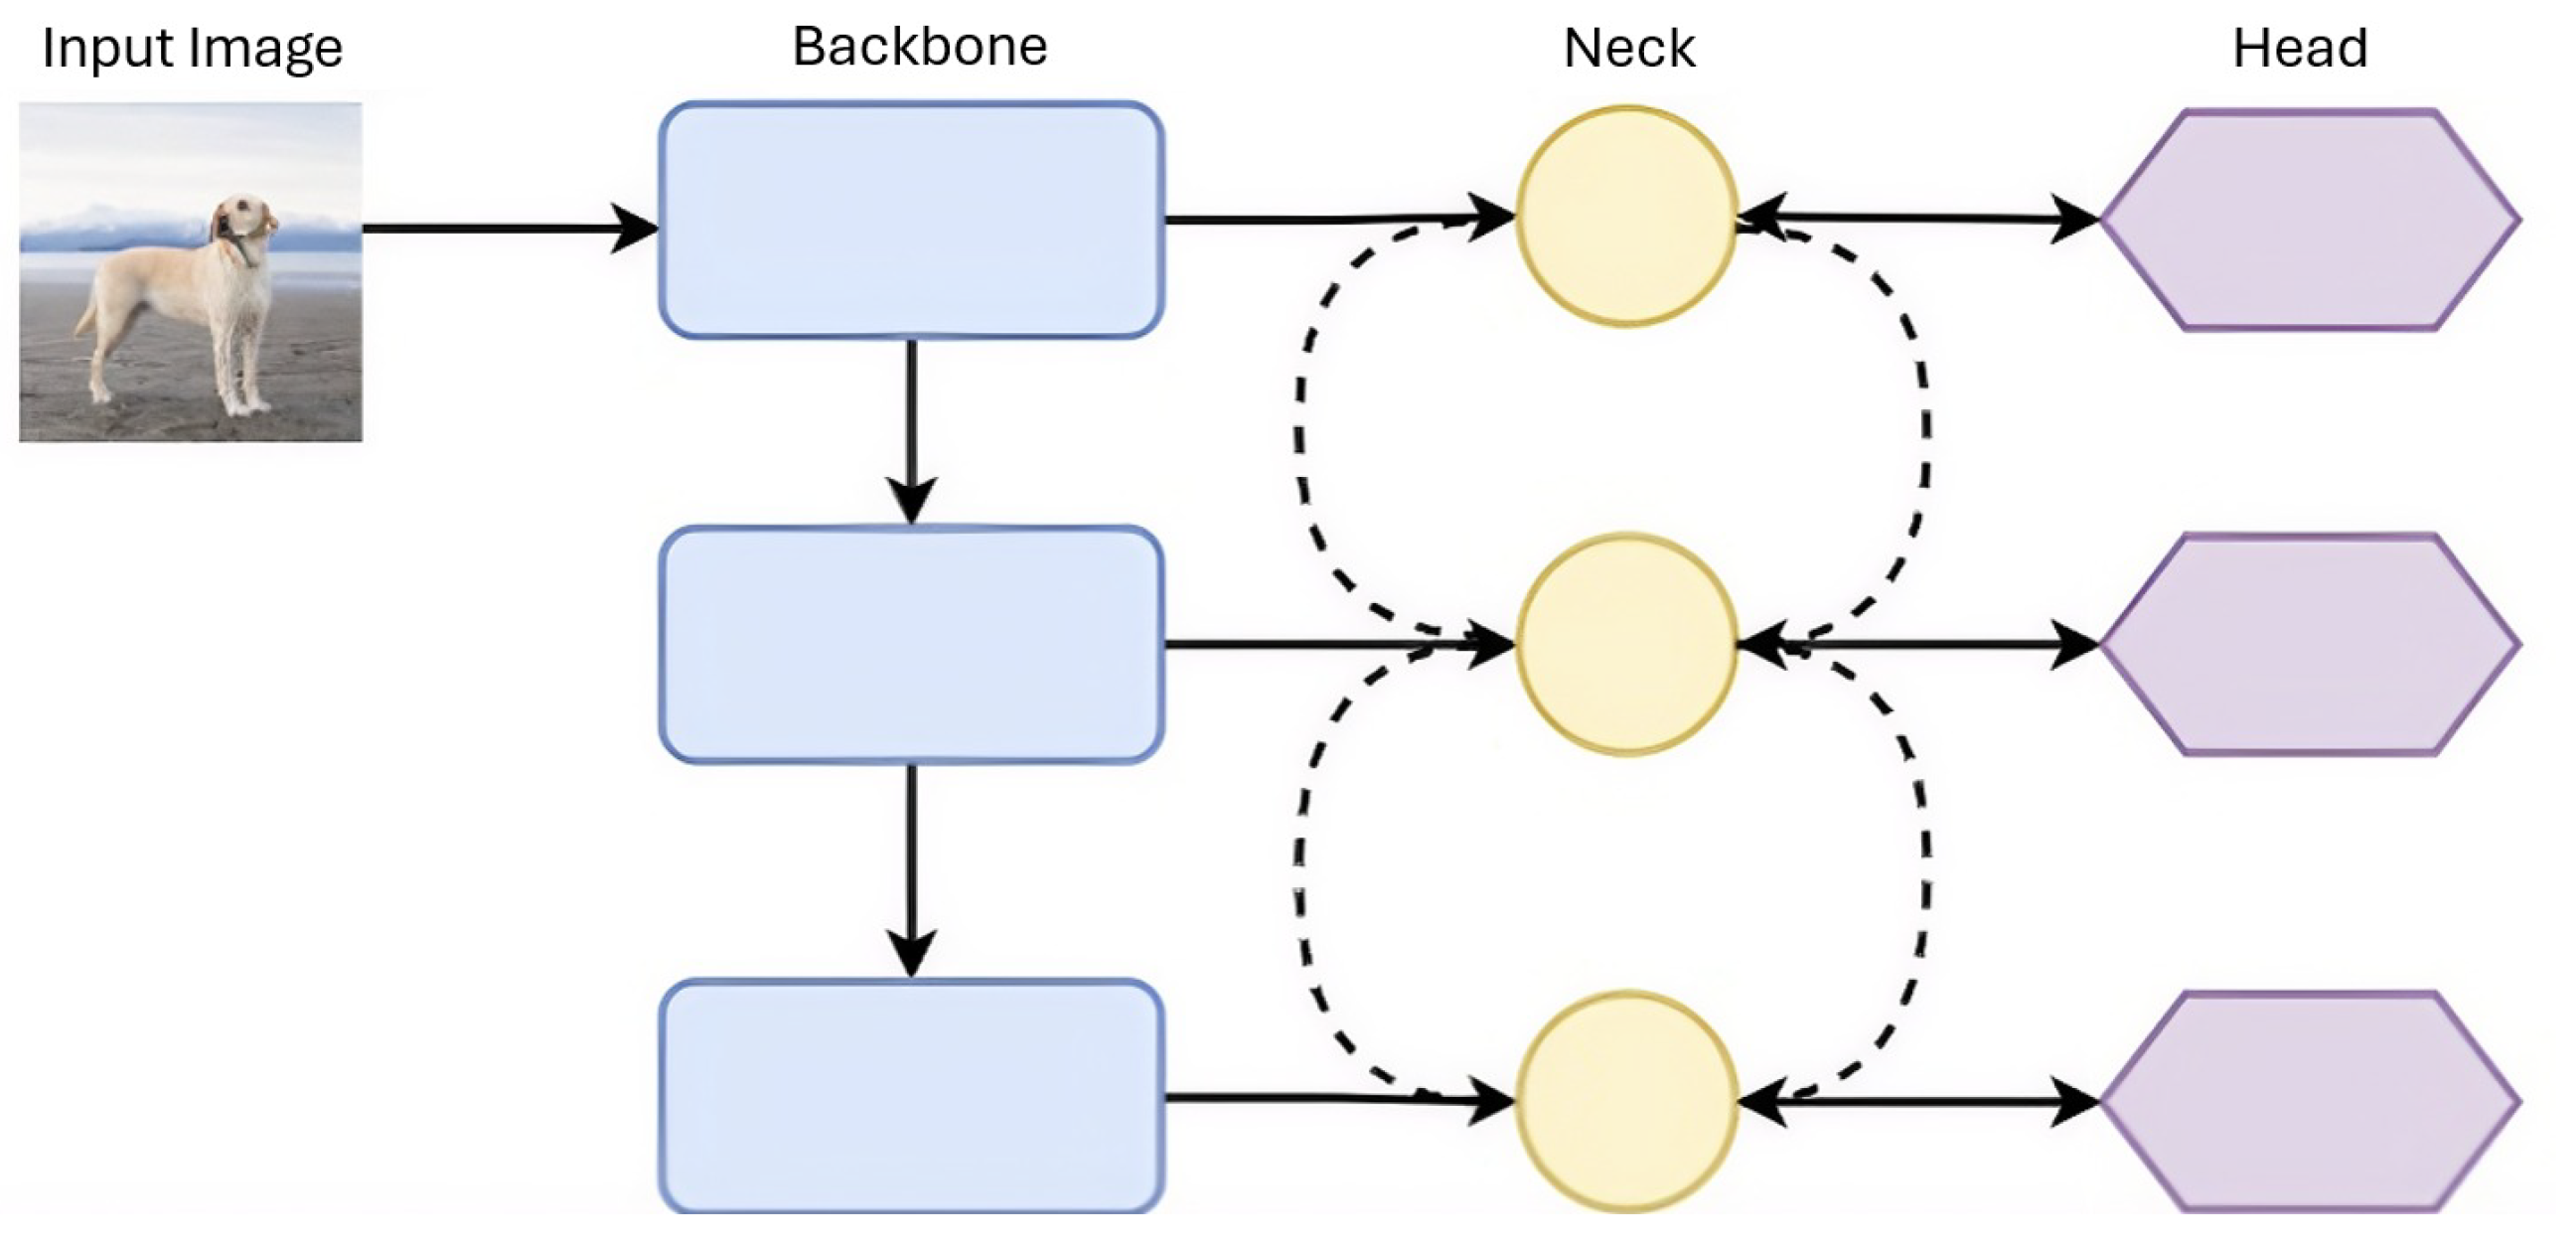
Figure 9.
Schematic diagram of YOLOv3.
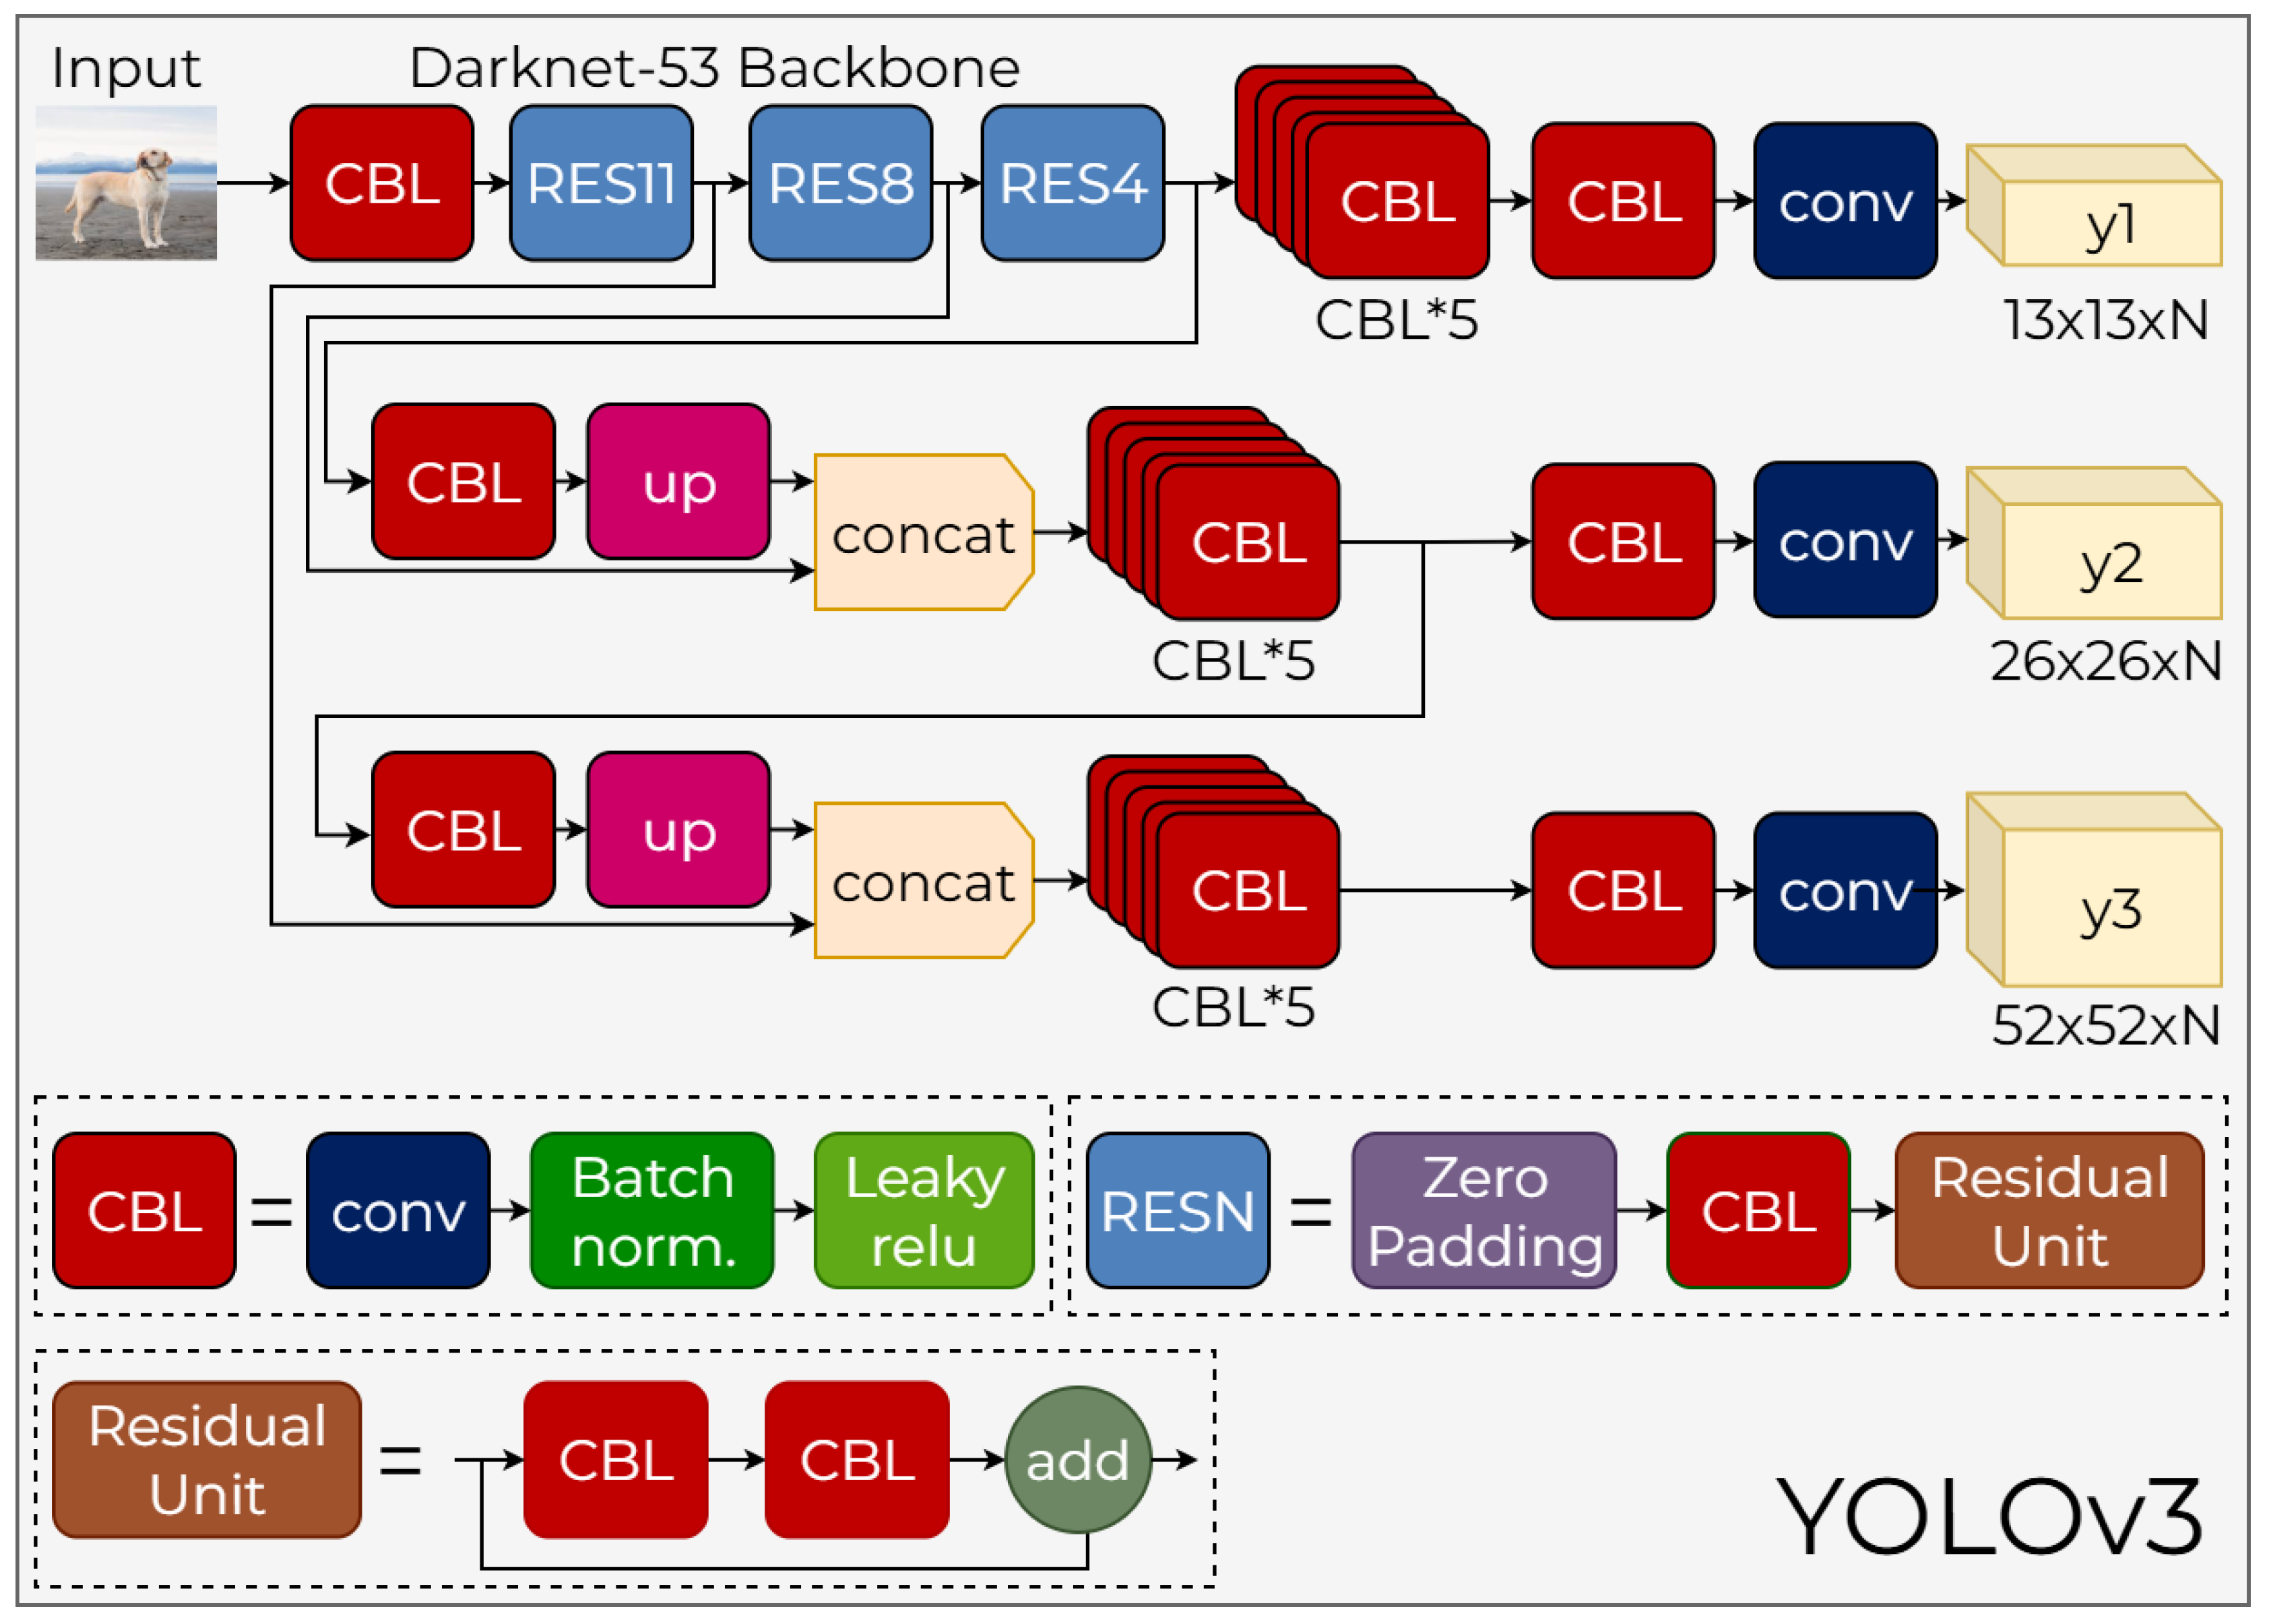
Figure 10.
Schematic diagram of the YOLOv4 architecture
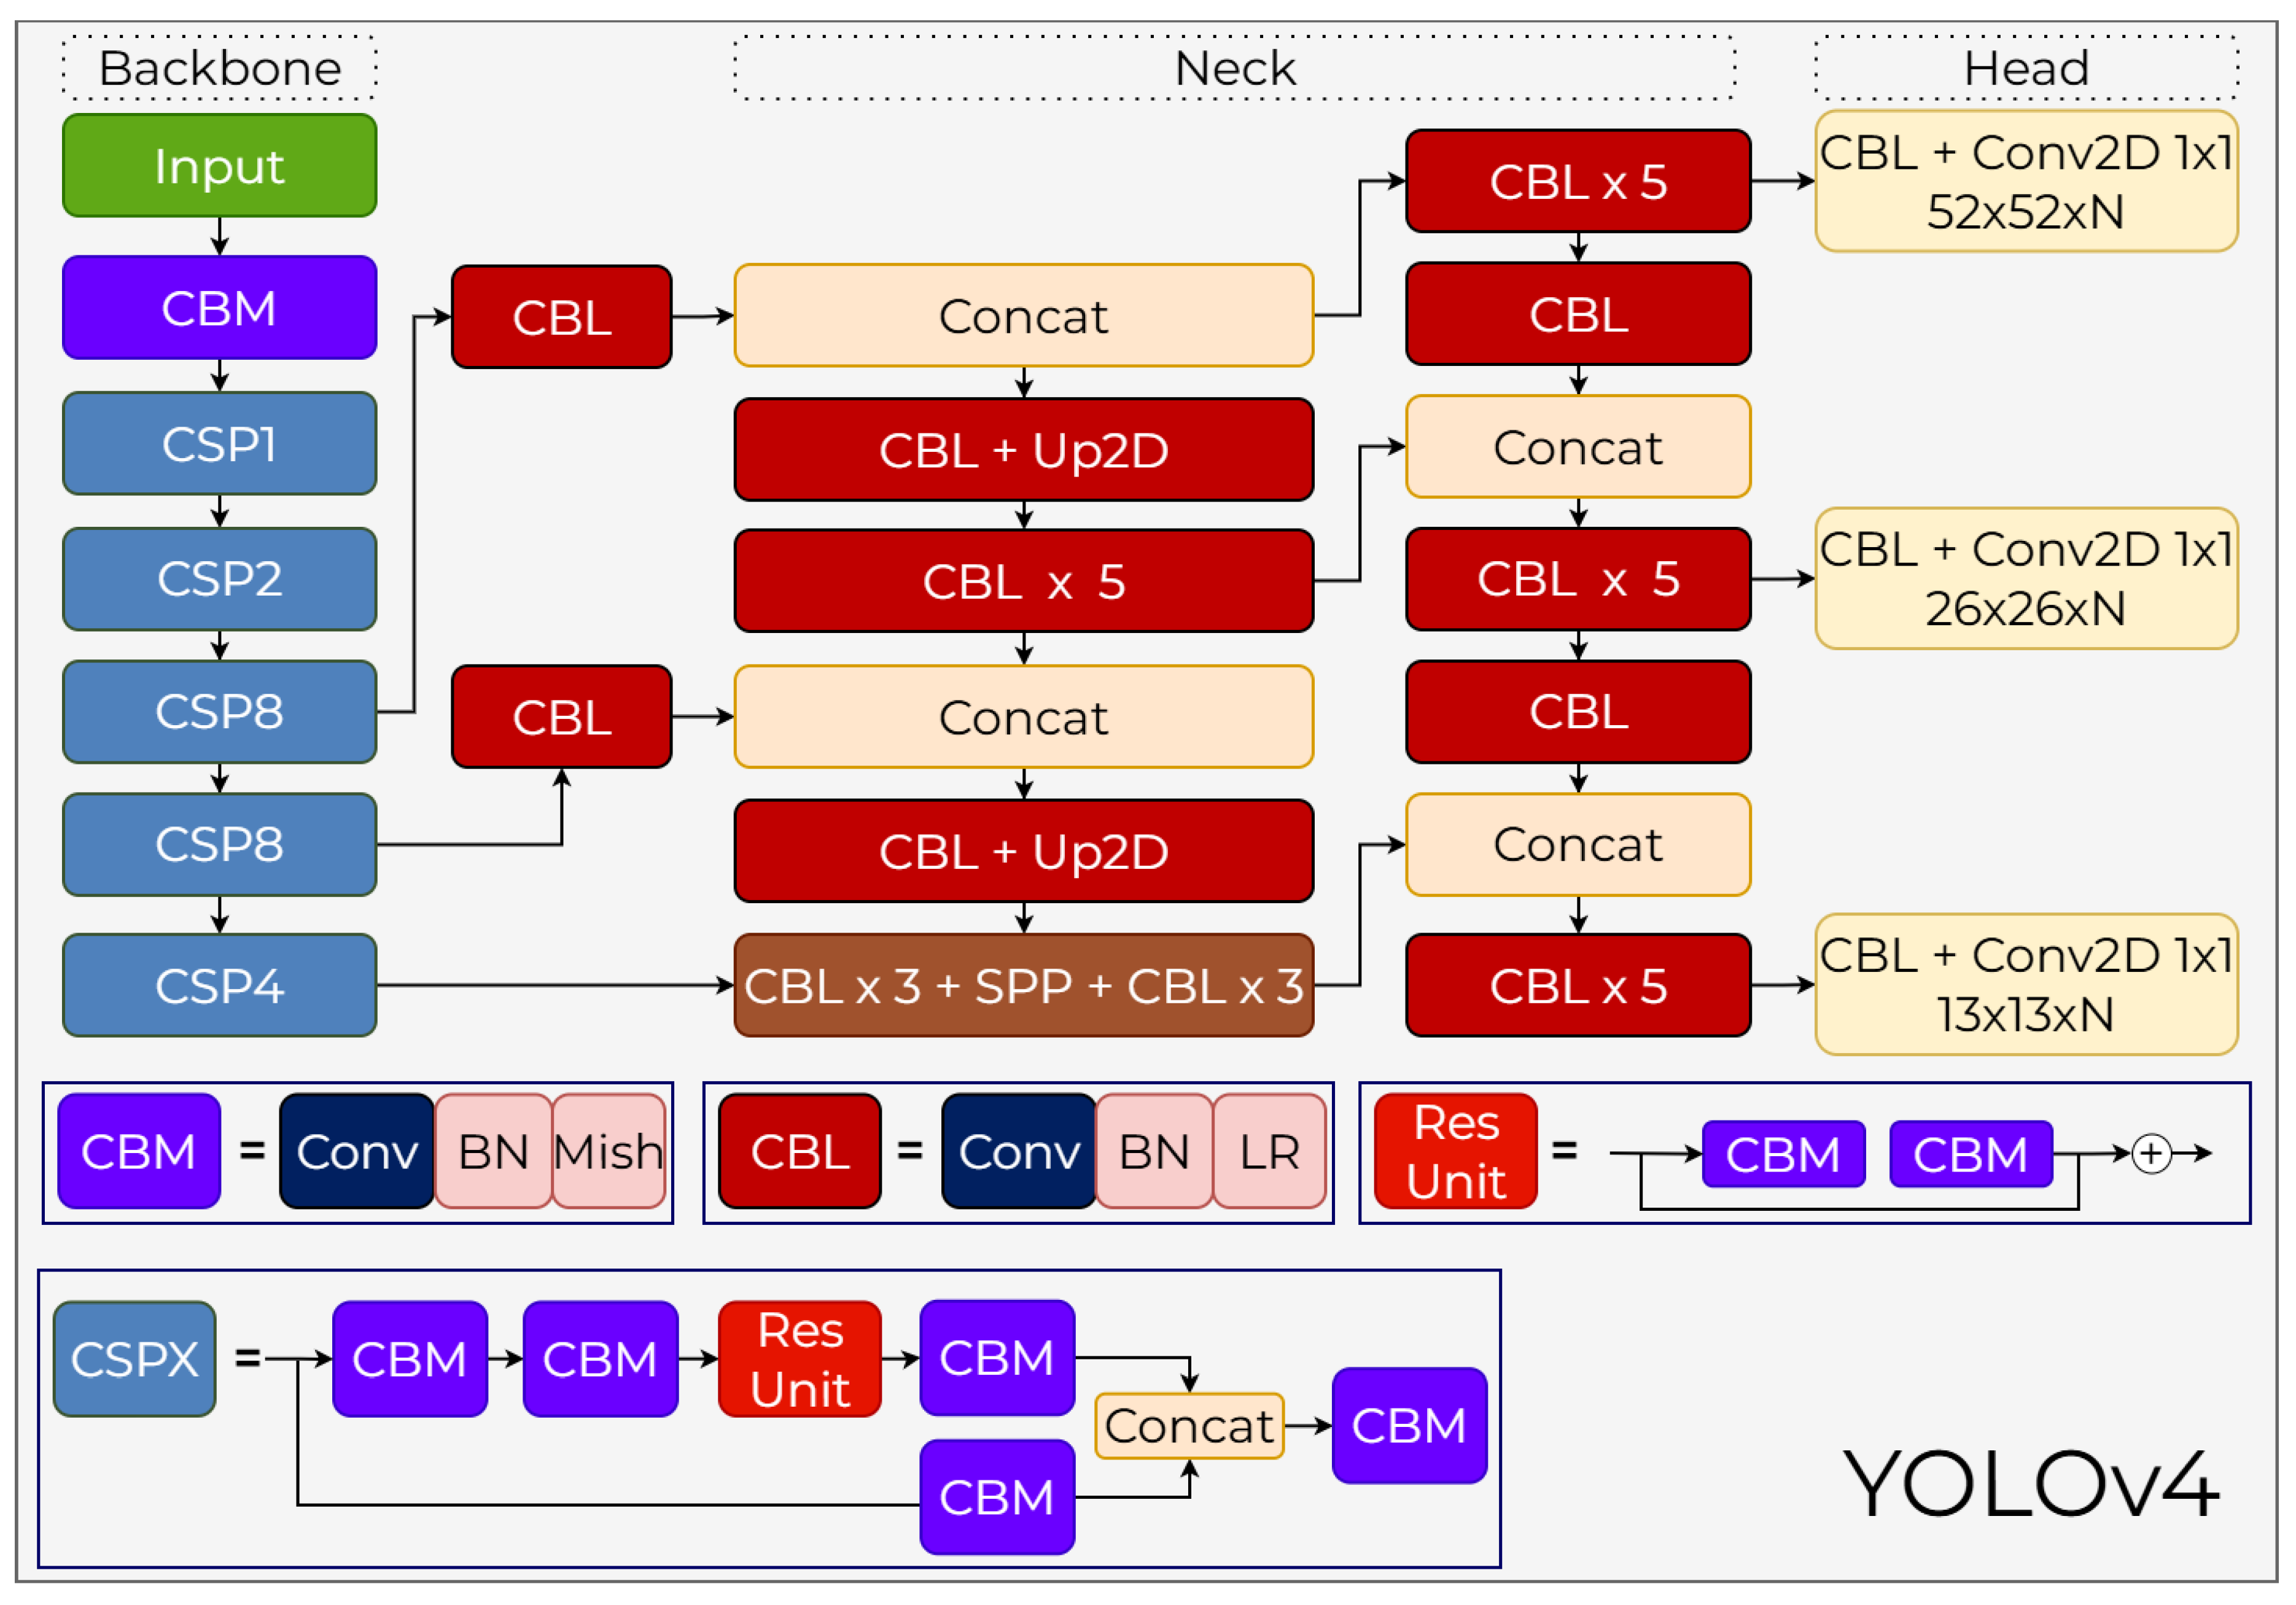
Figure 11.
Schematic diagram of the YOLOv5 architecture.
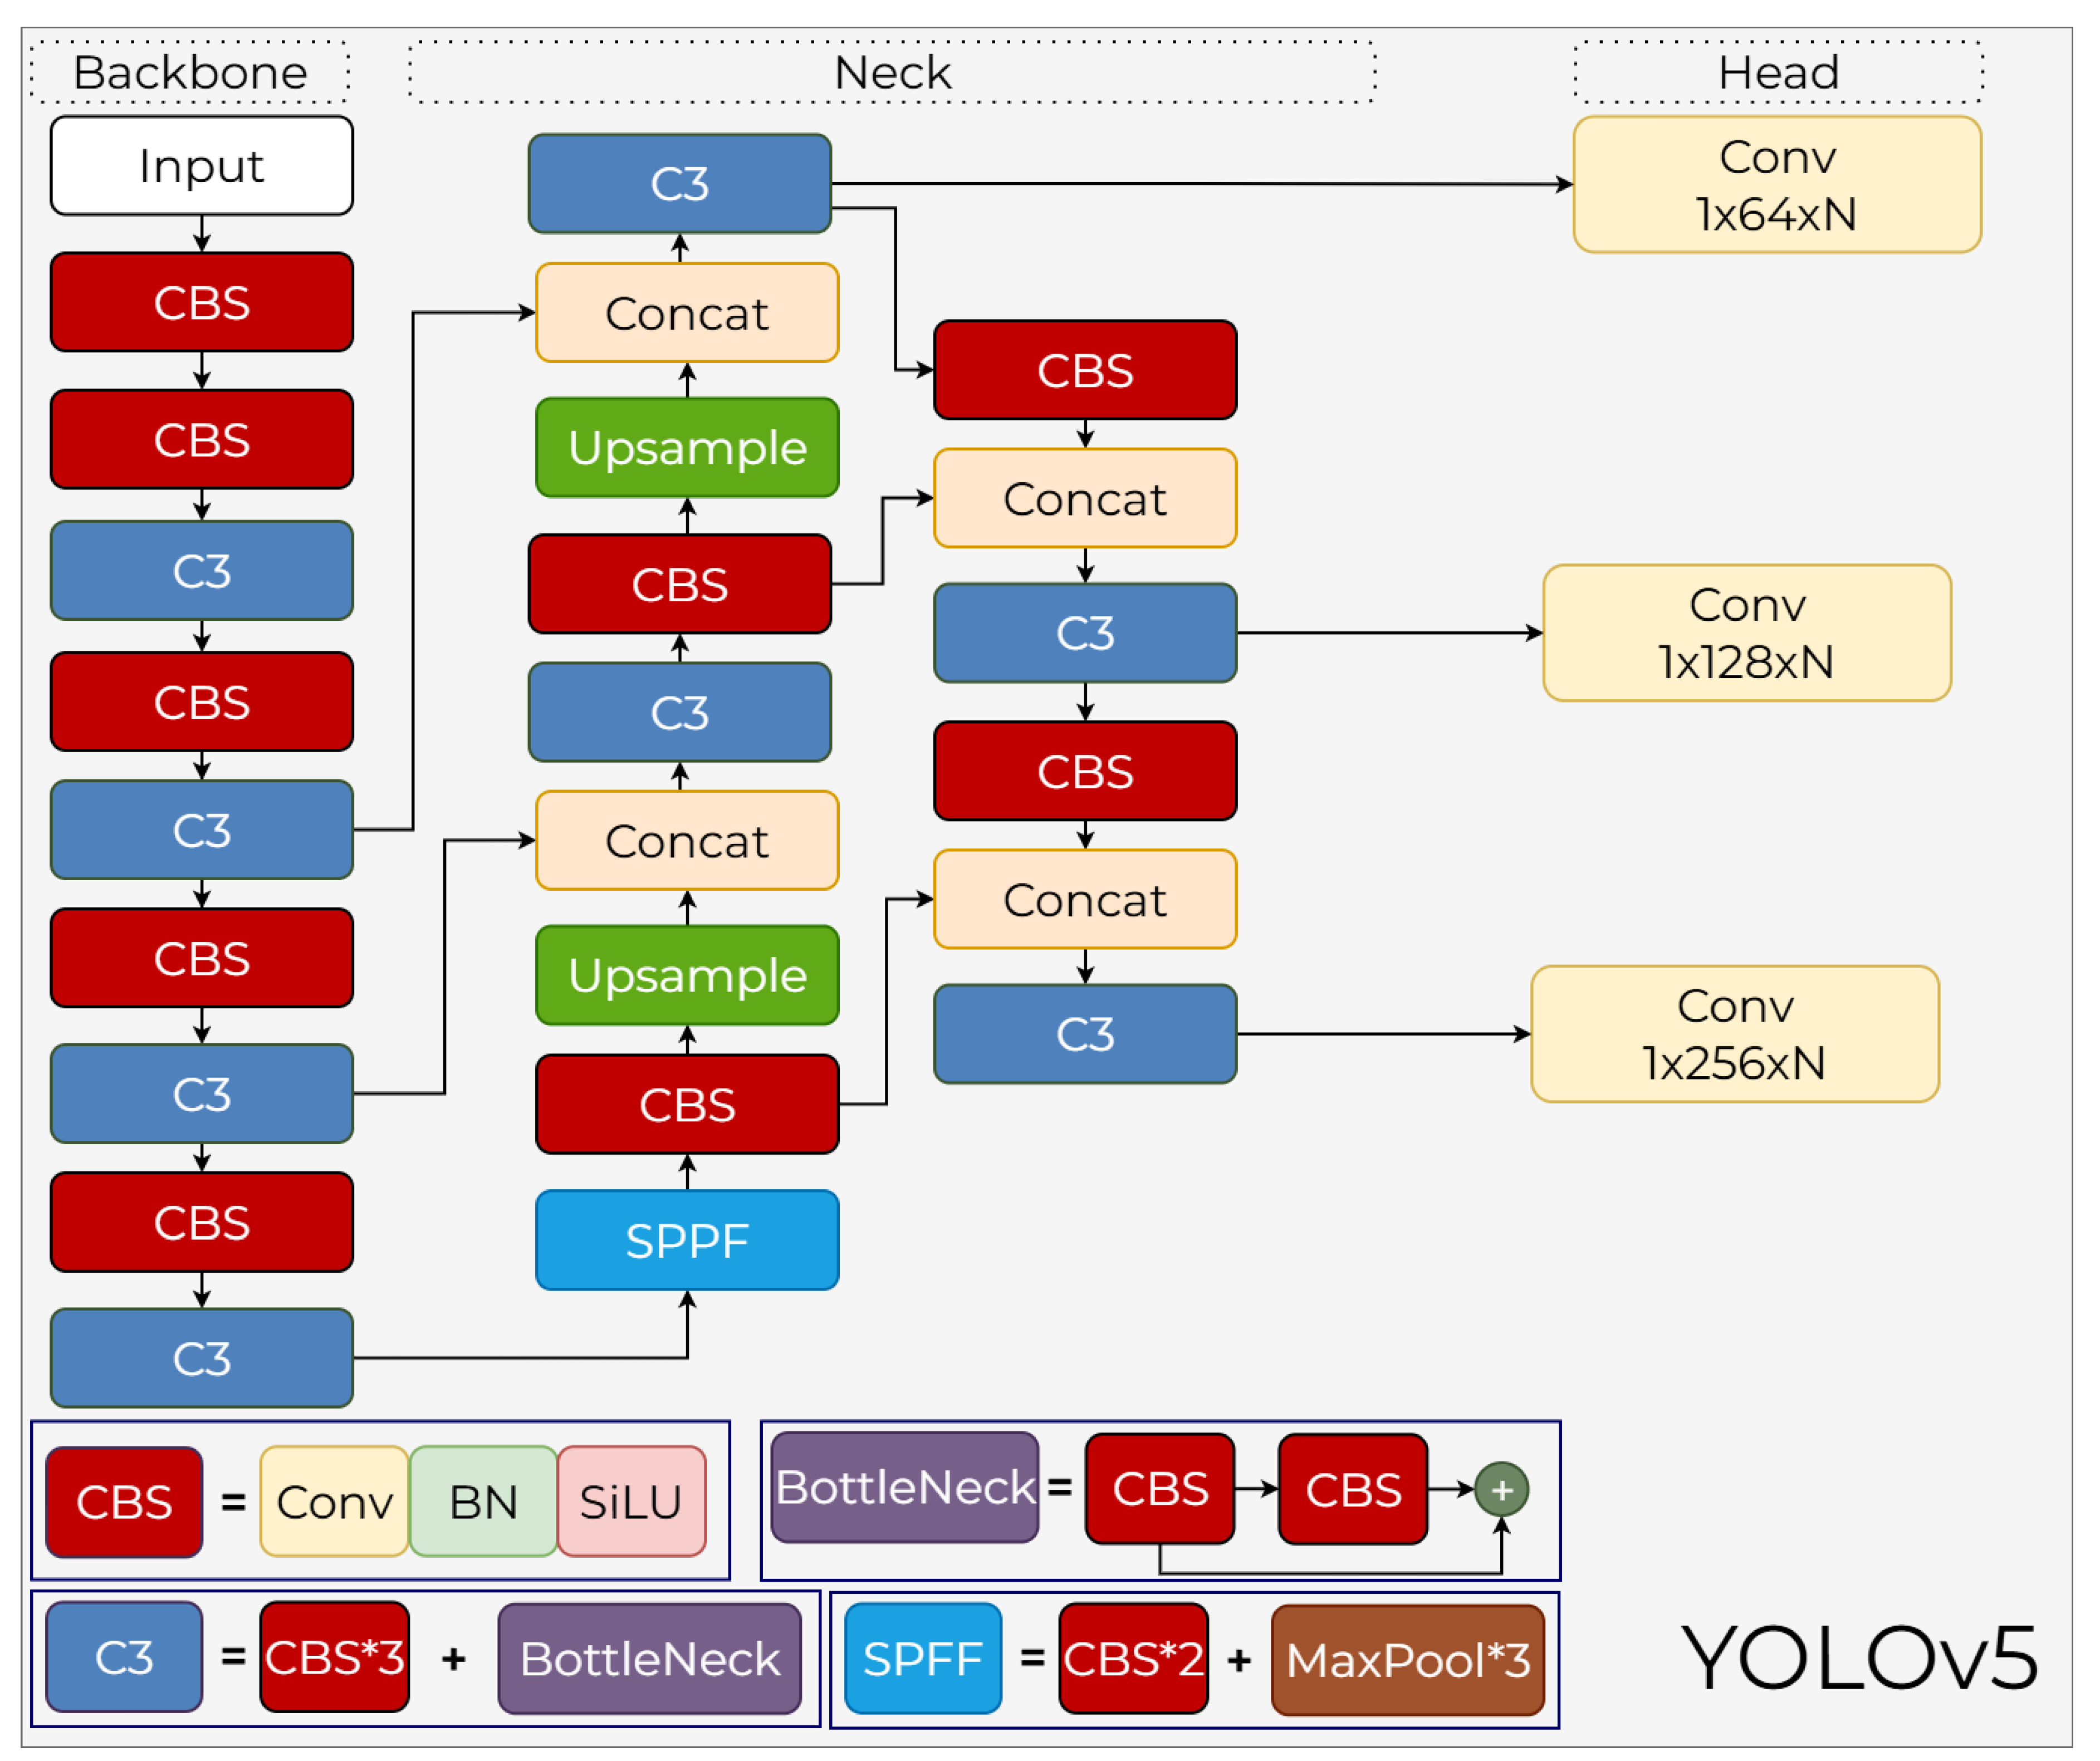
Figure 12.
Schematic diagram of the YOLOv6 architecture
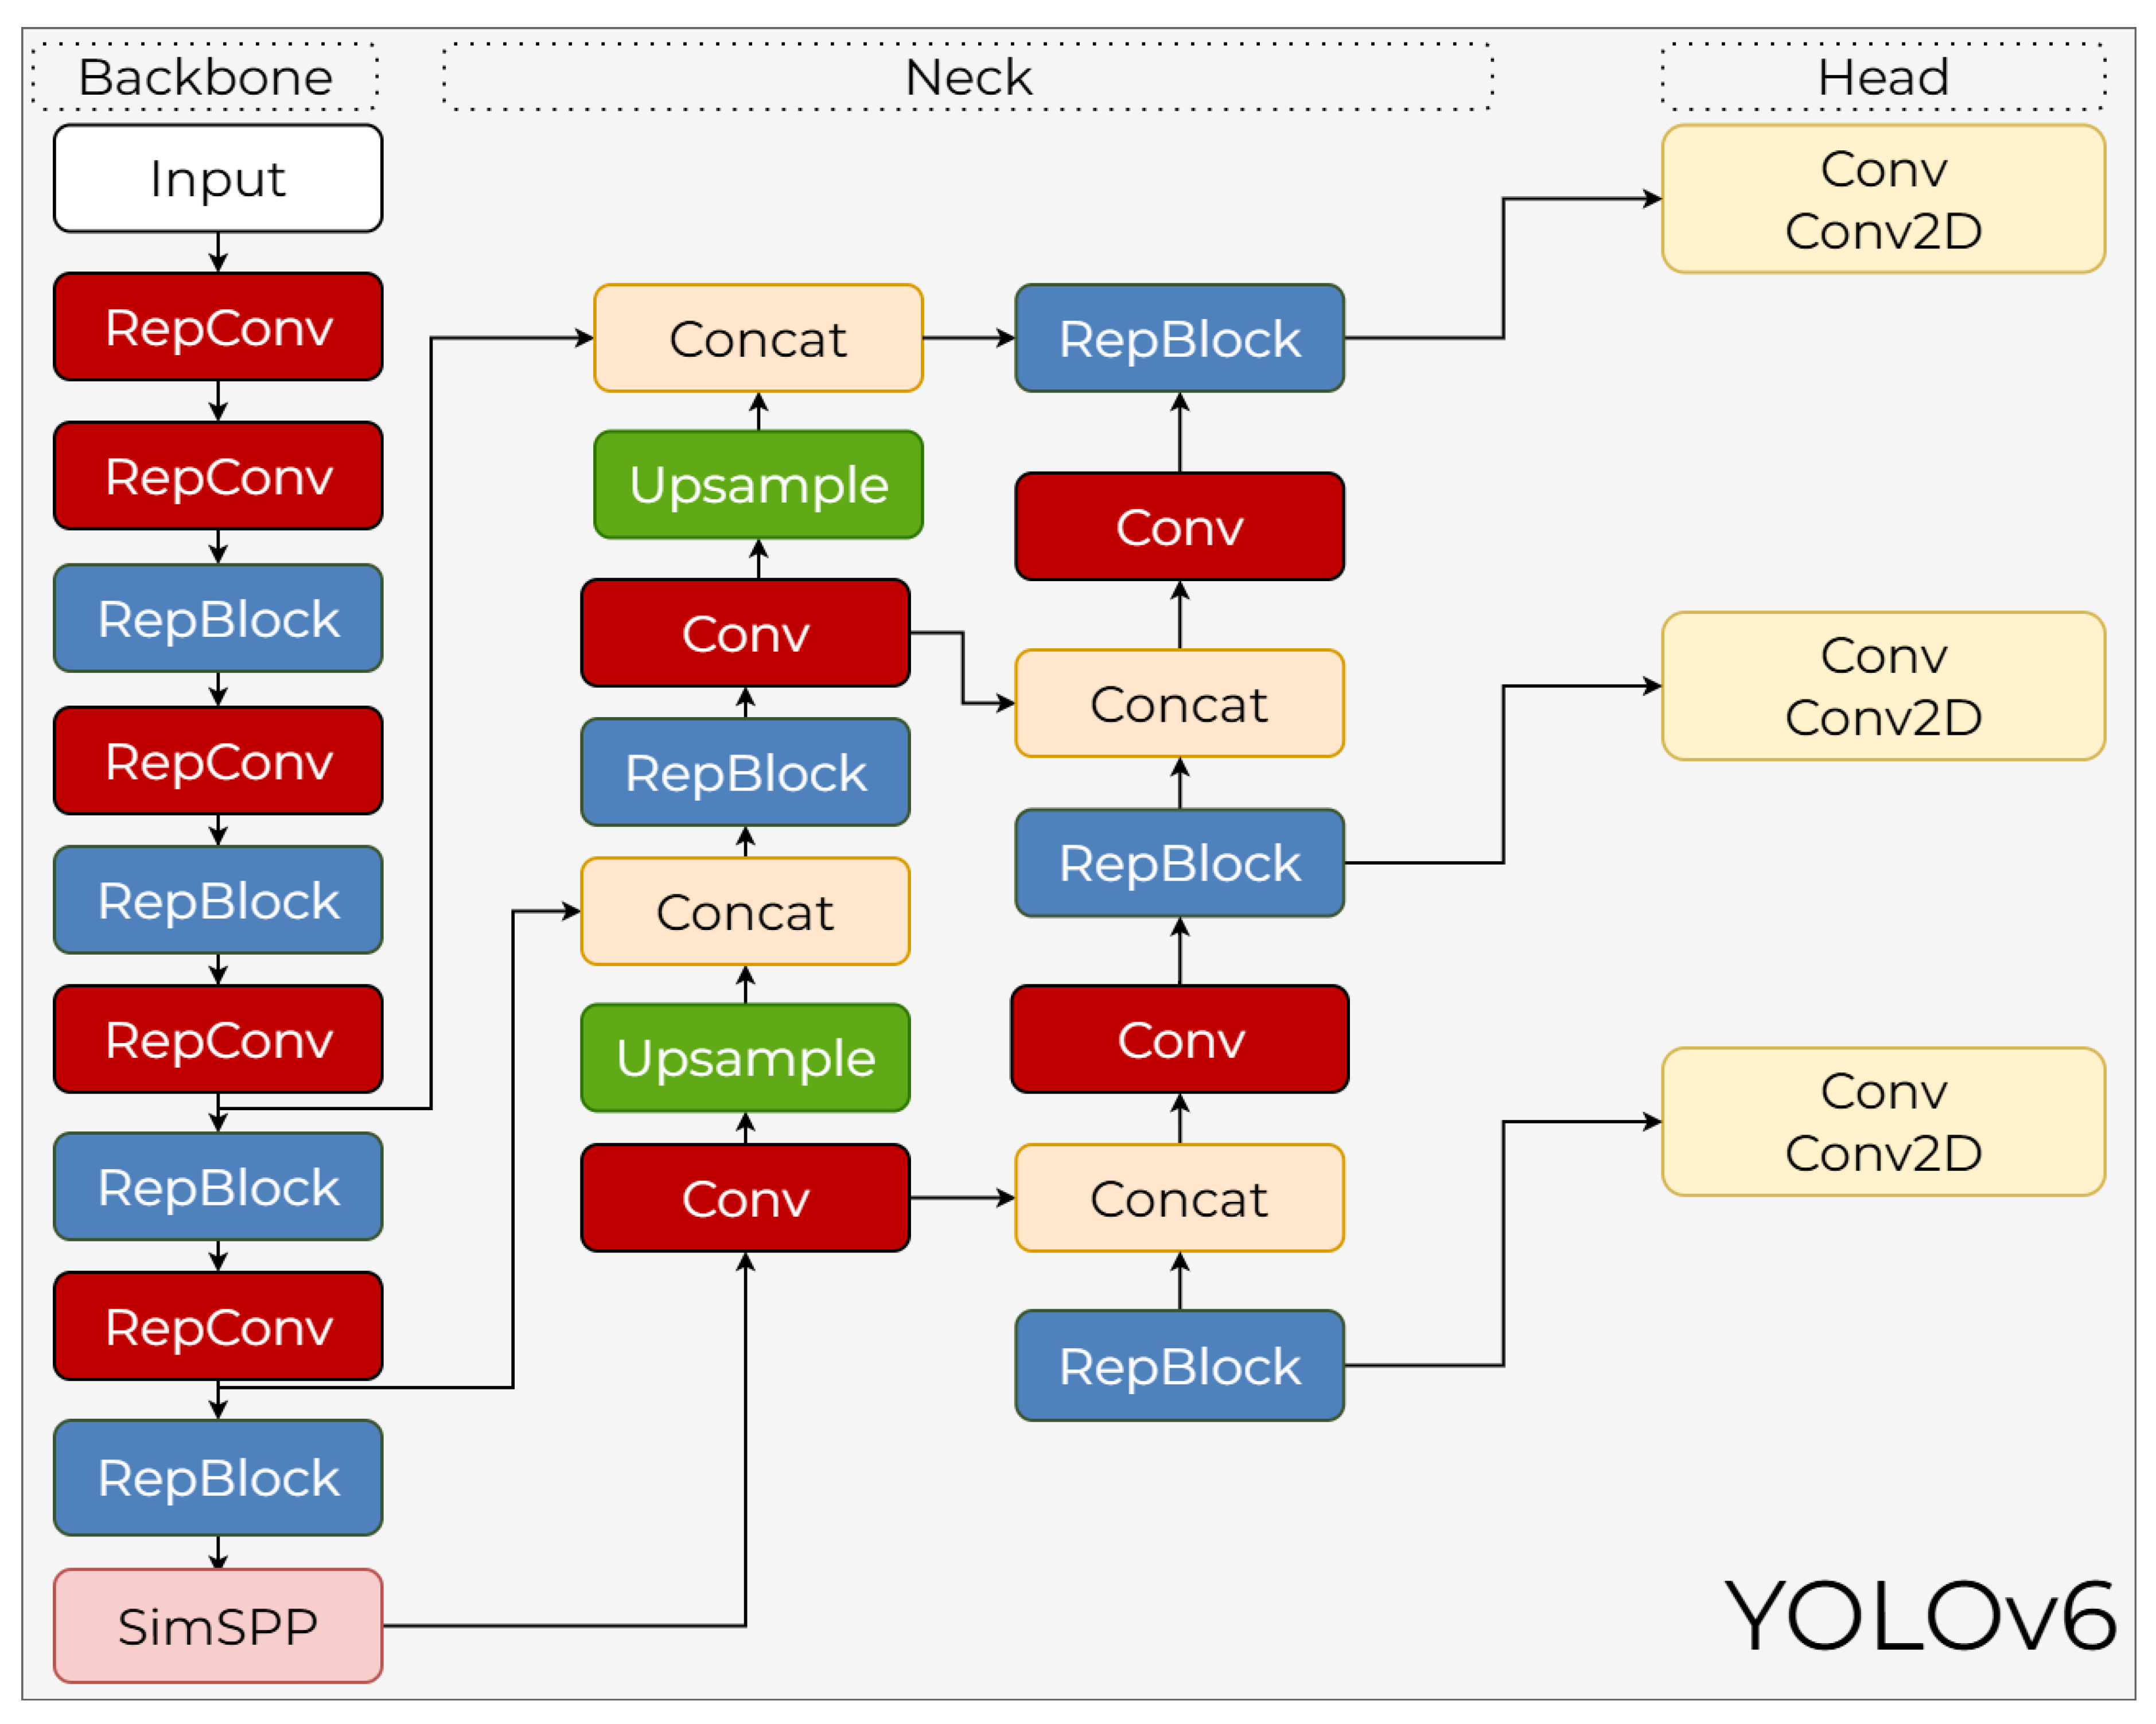
Figure 13.
Schematic diagram of the YOLOv7 architecture.
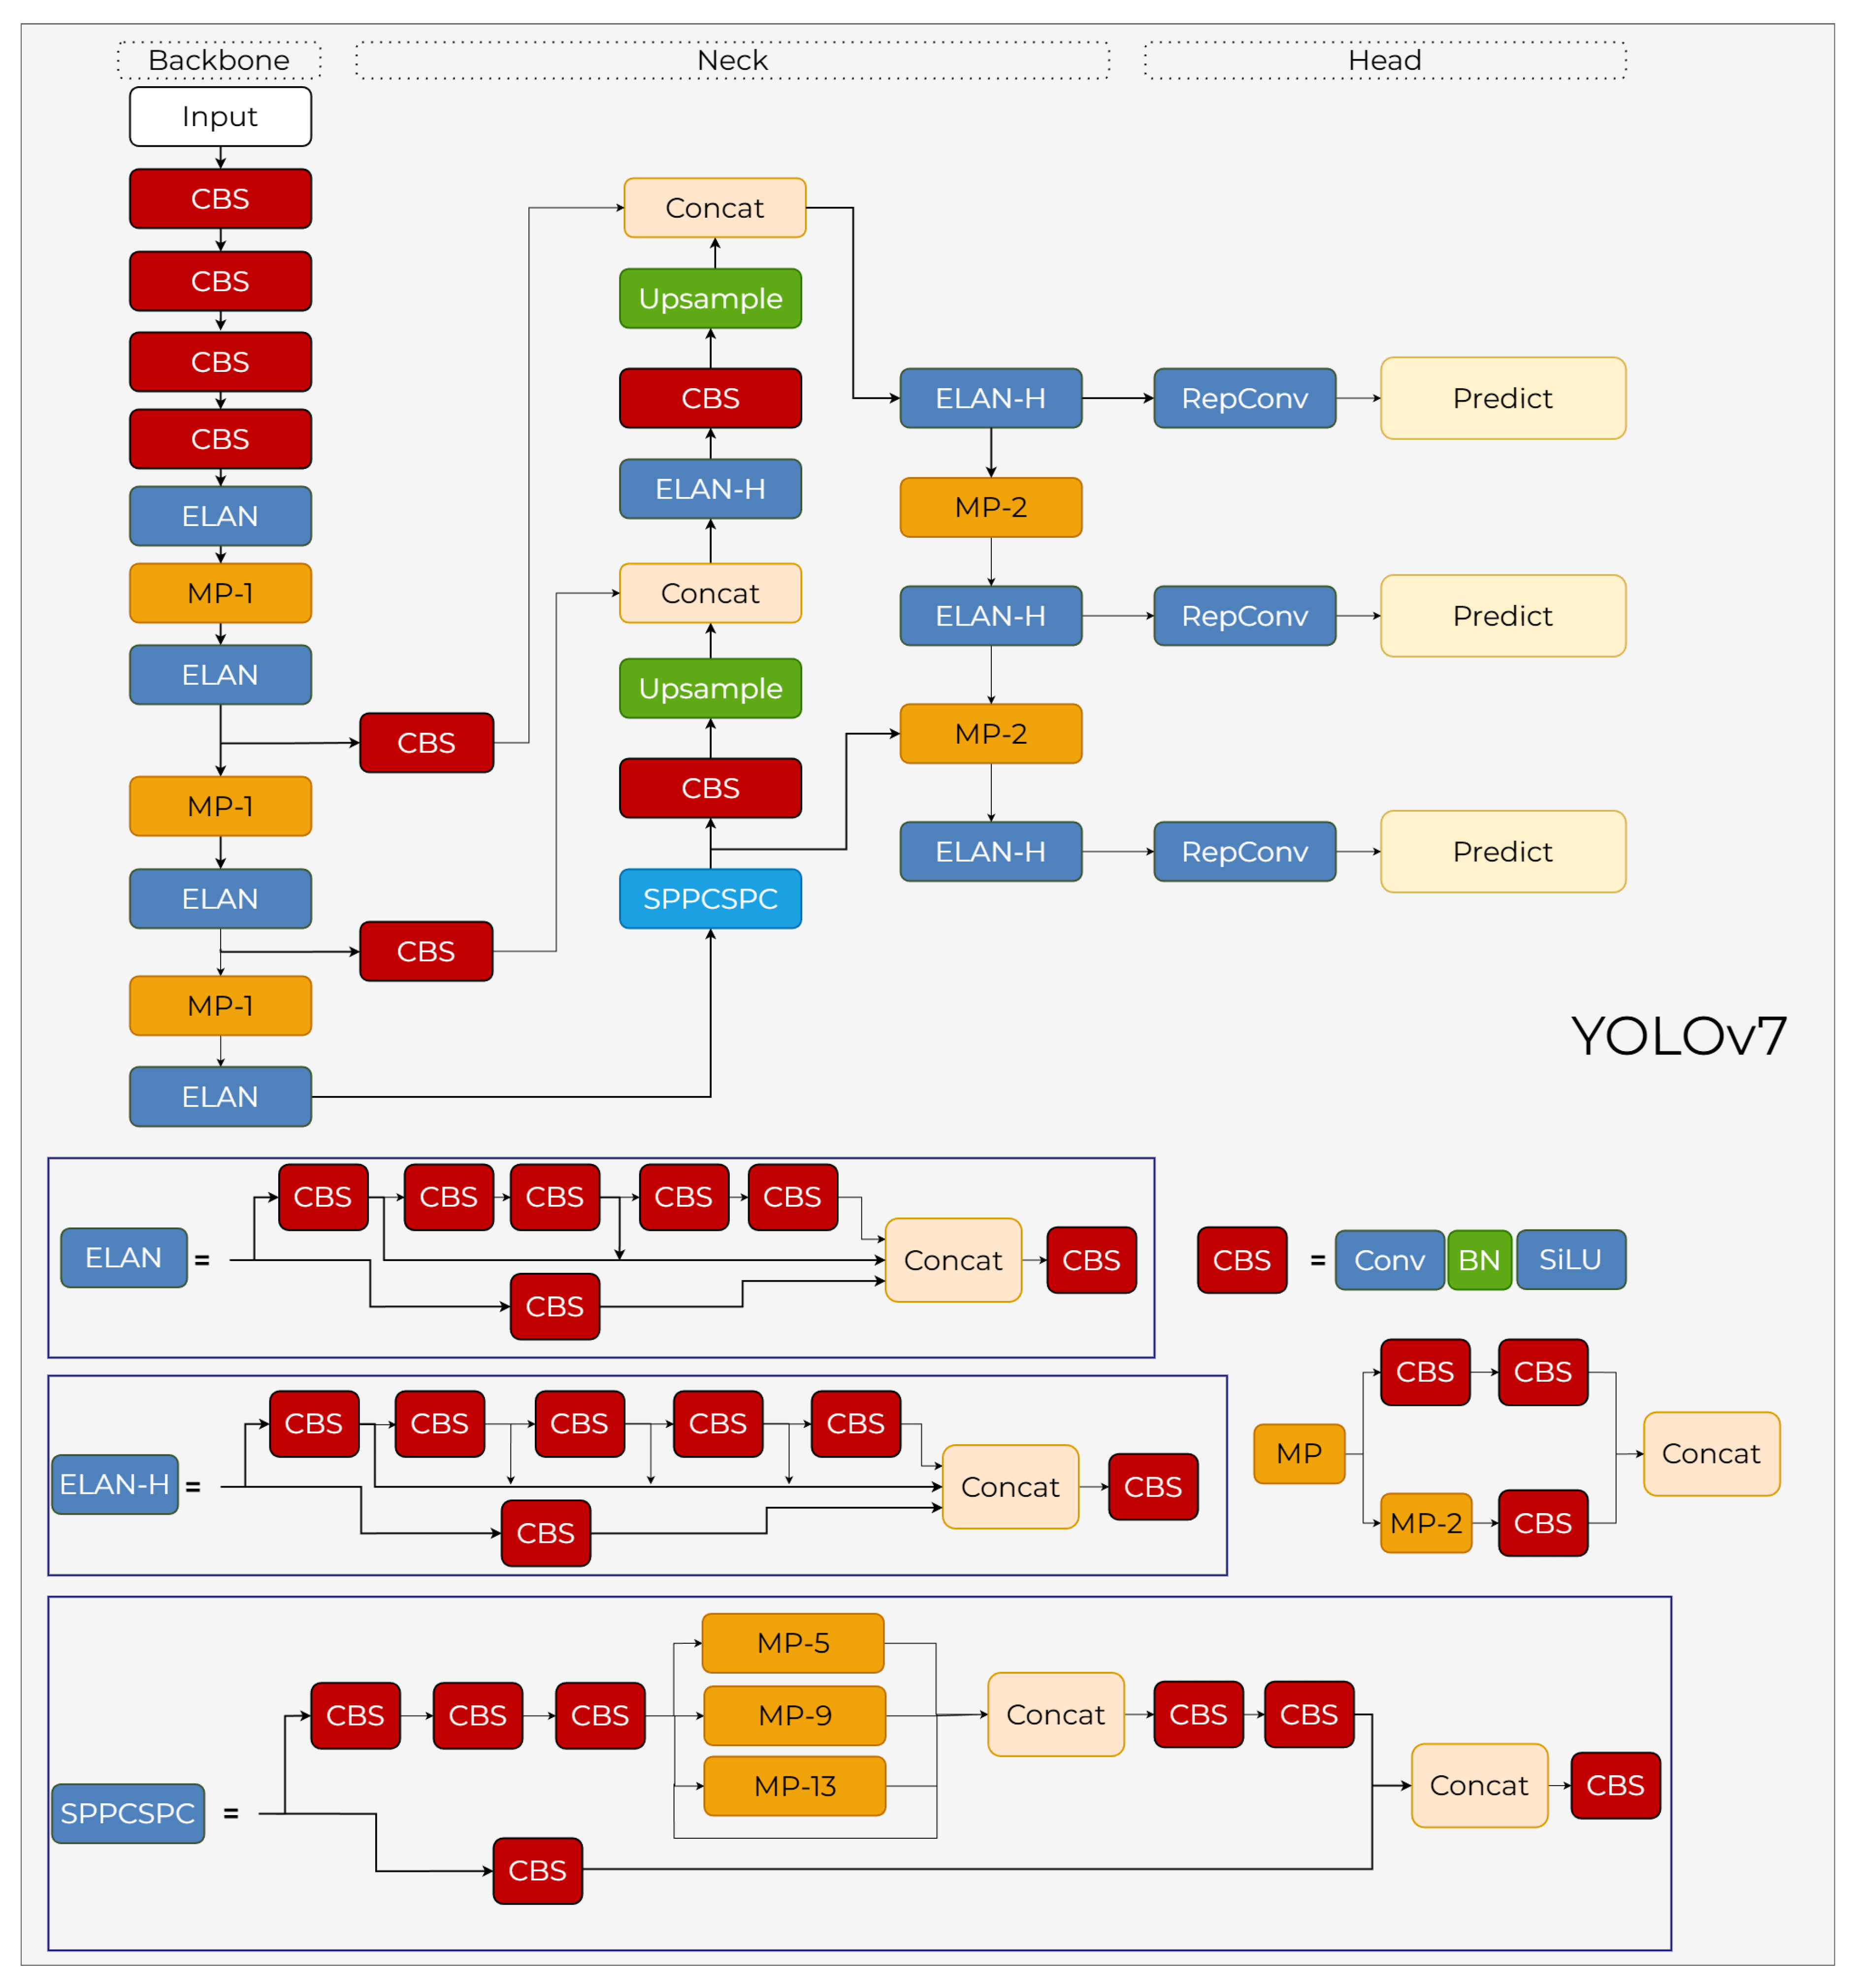
Figure 14.
Schematic diagram of the YOLOv8 architecture.
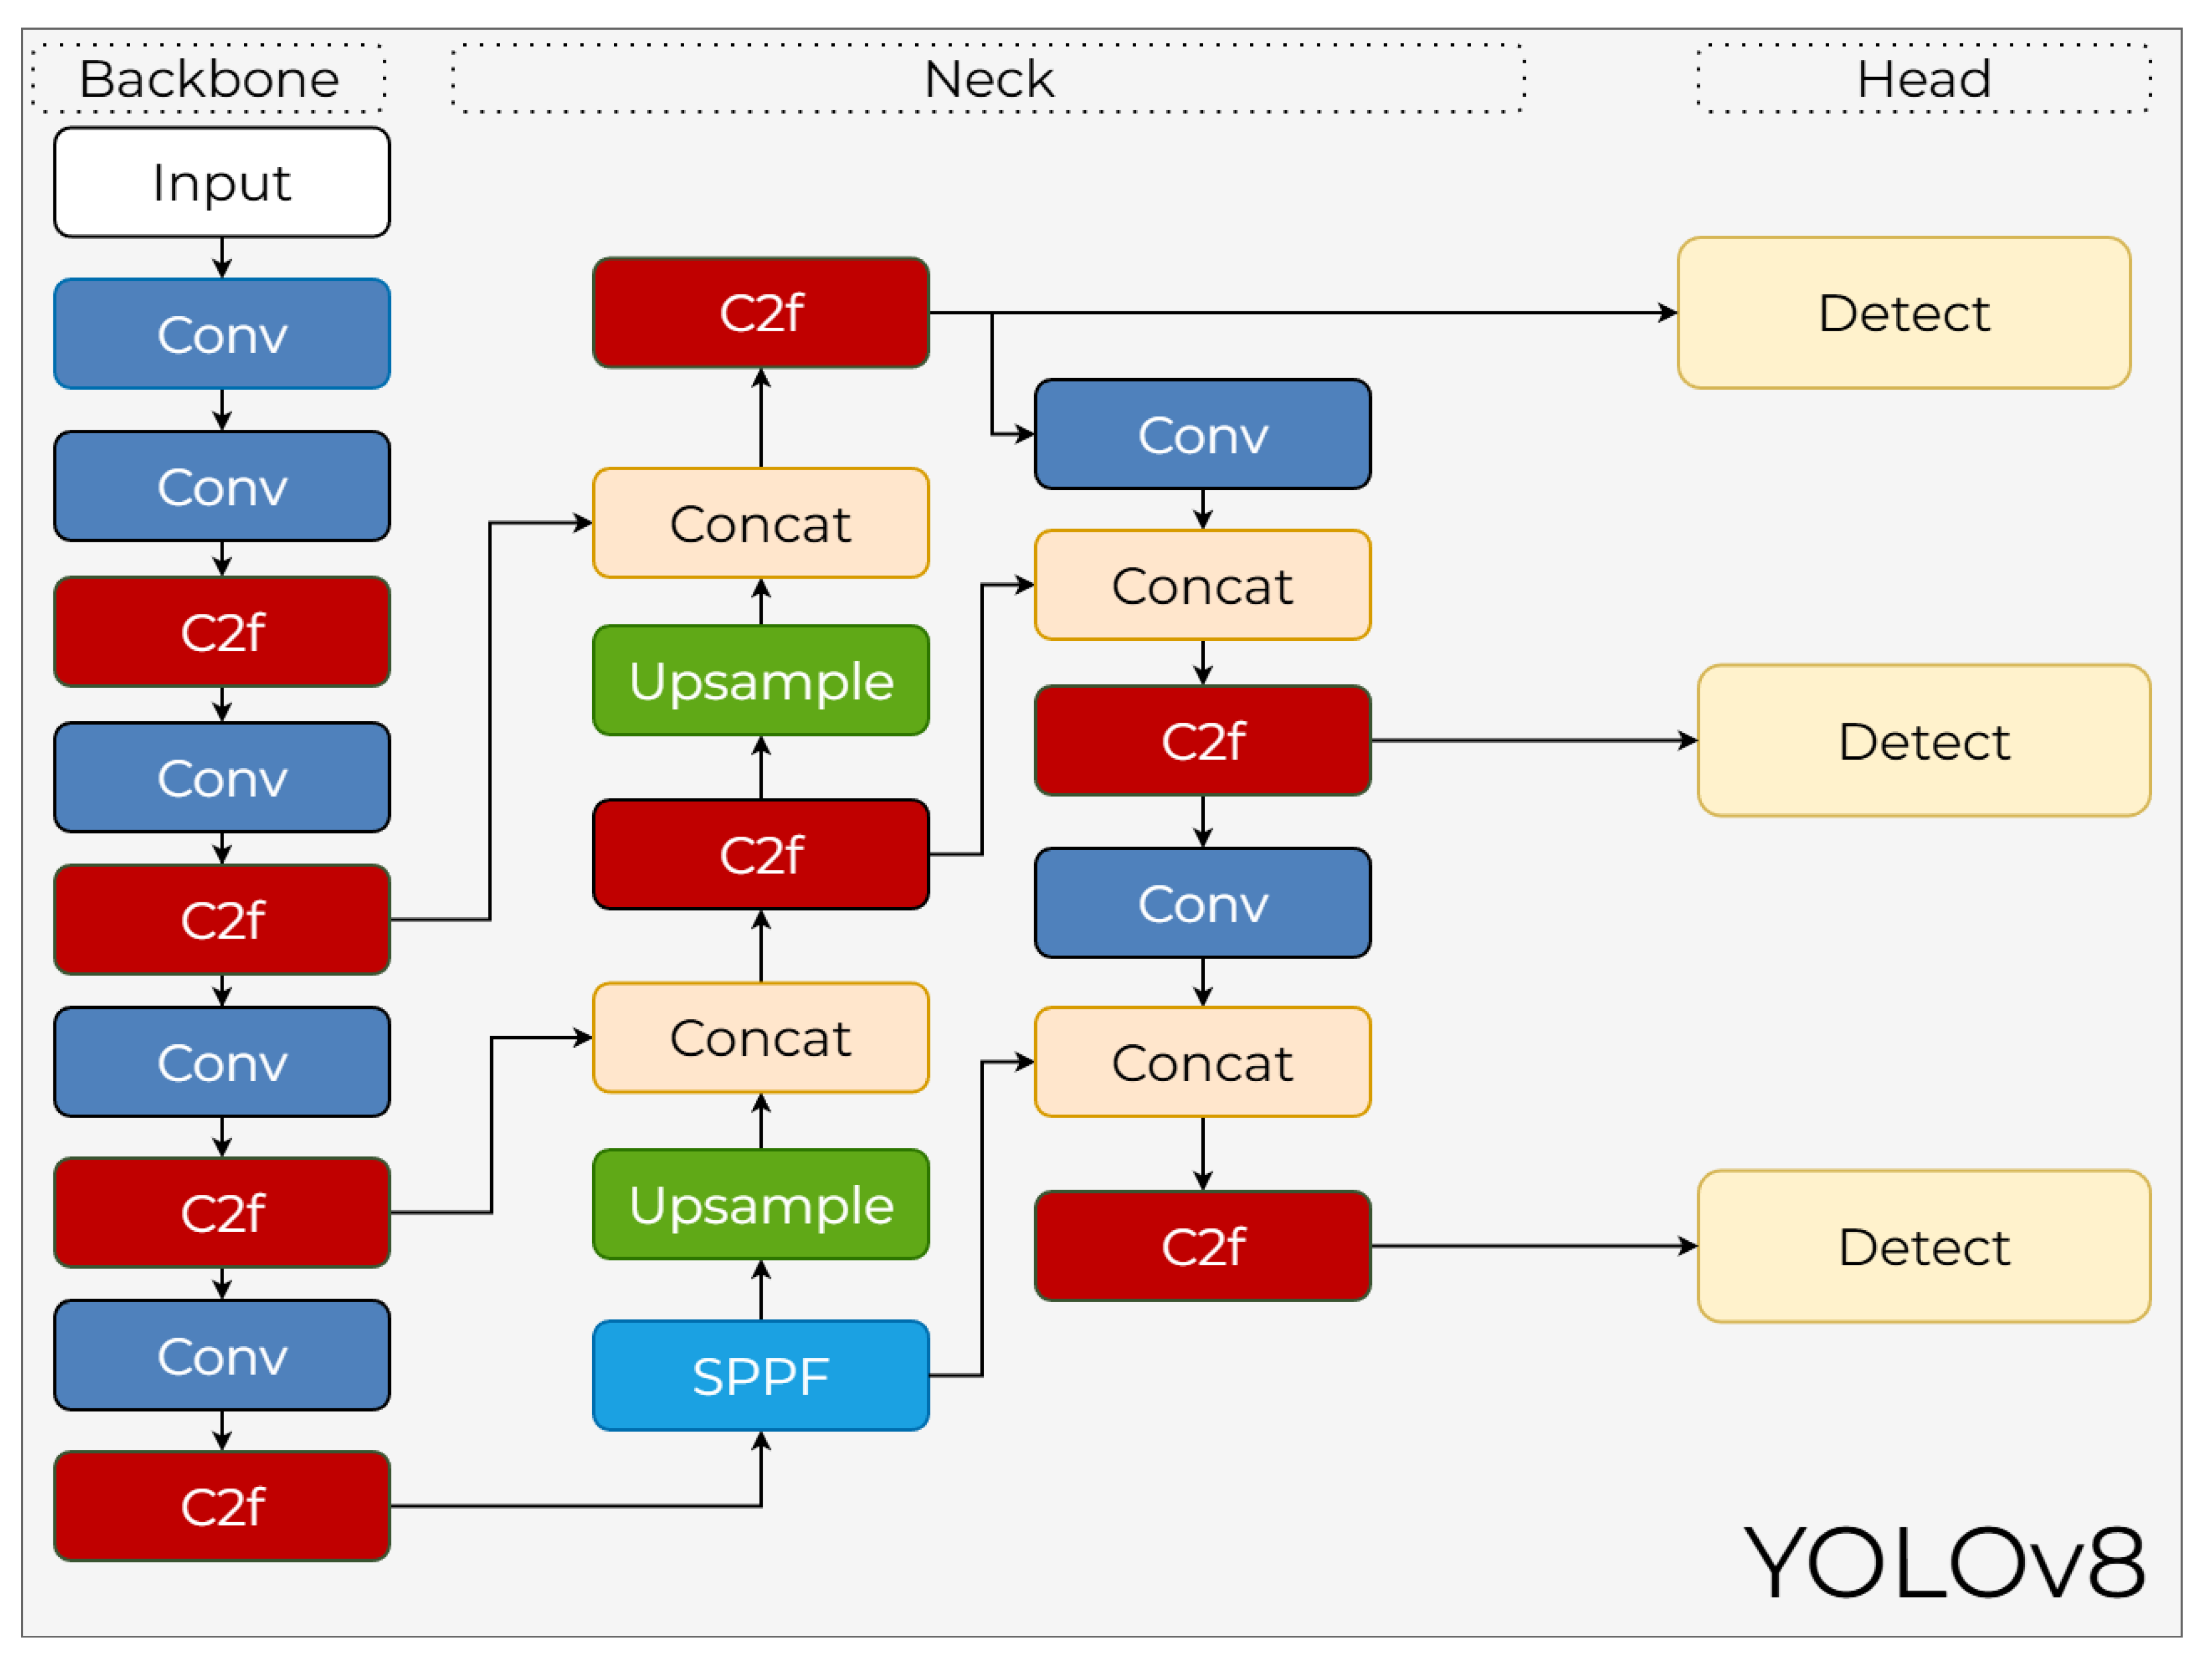
Figure 15.
Schematic diagram of the YOLOv9 architecture.
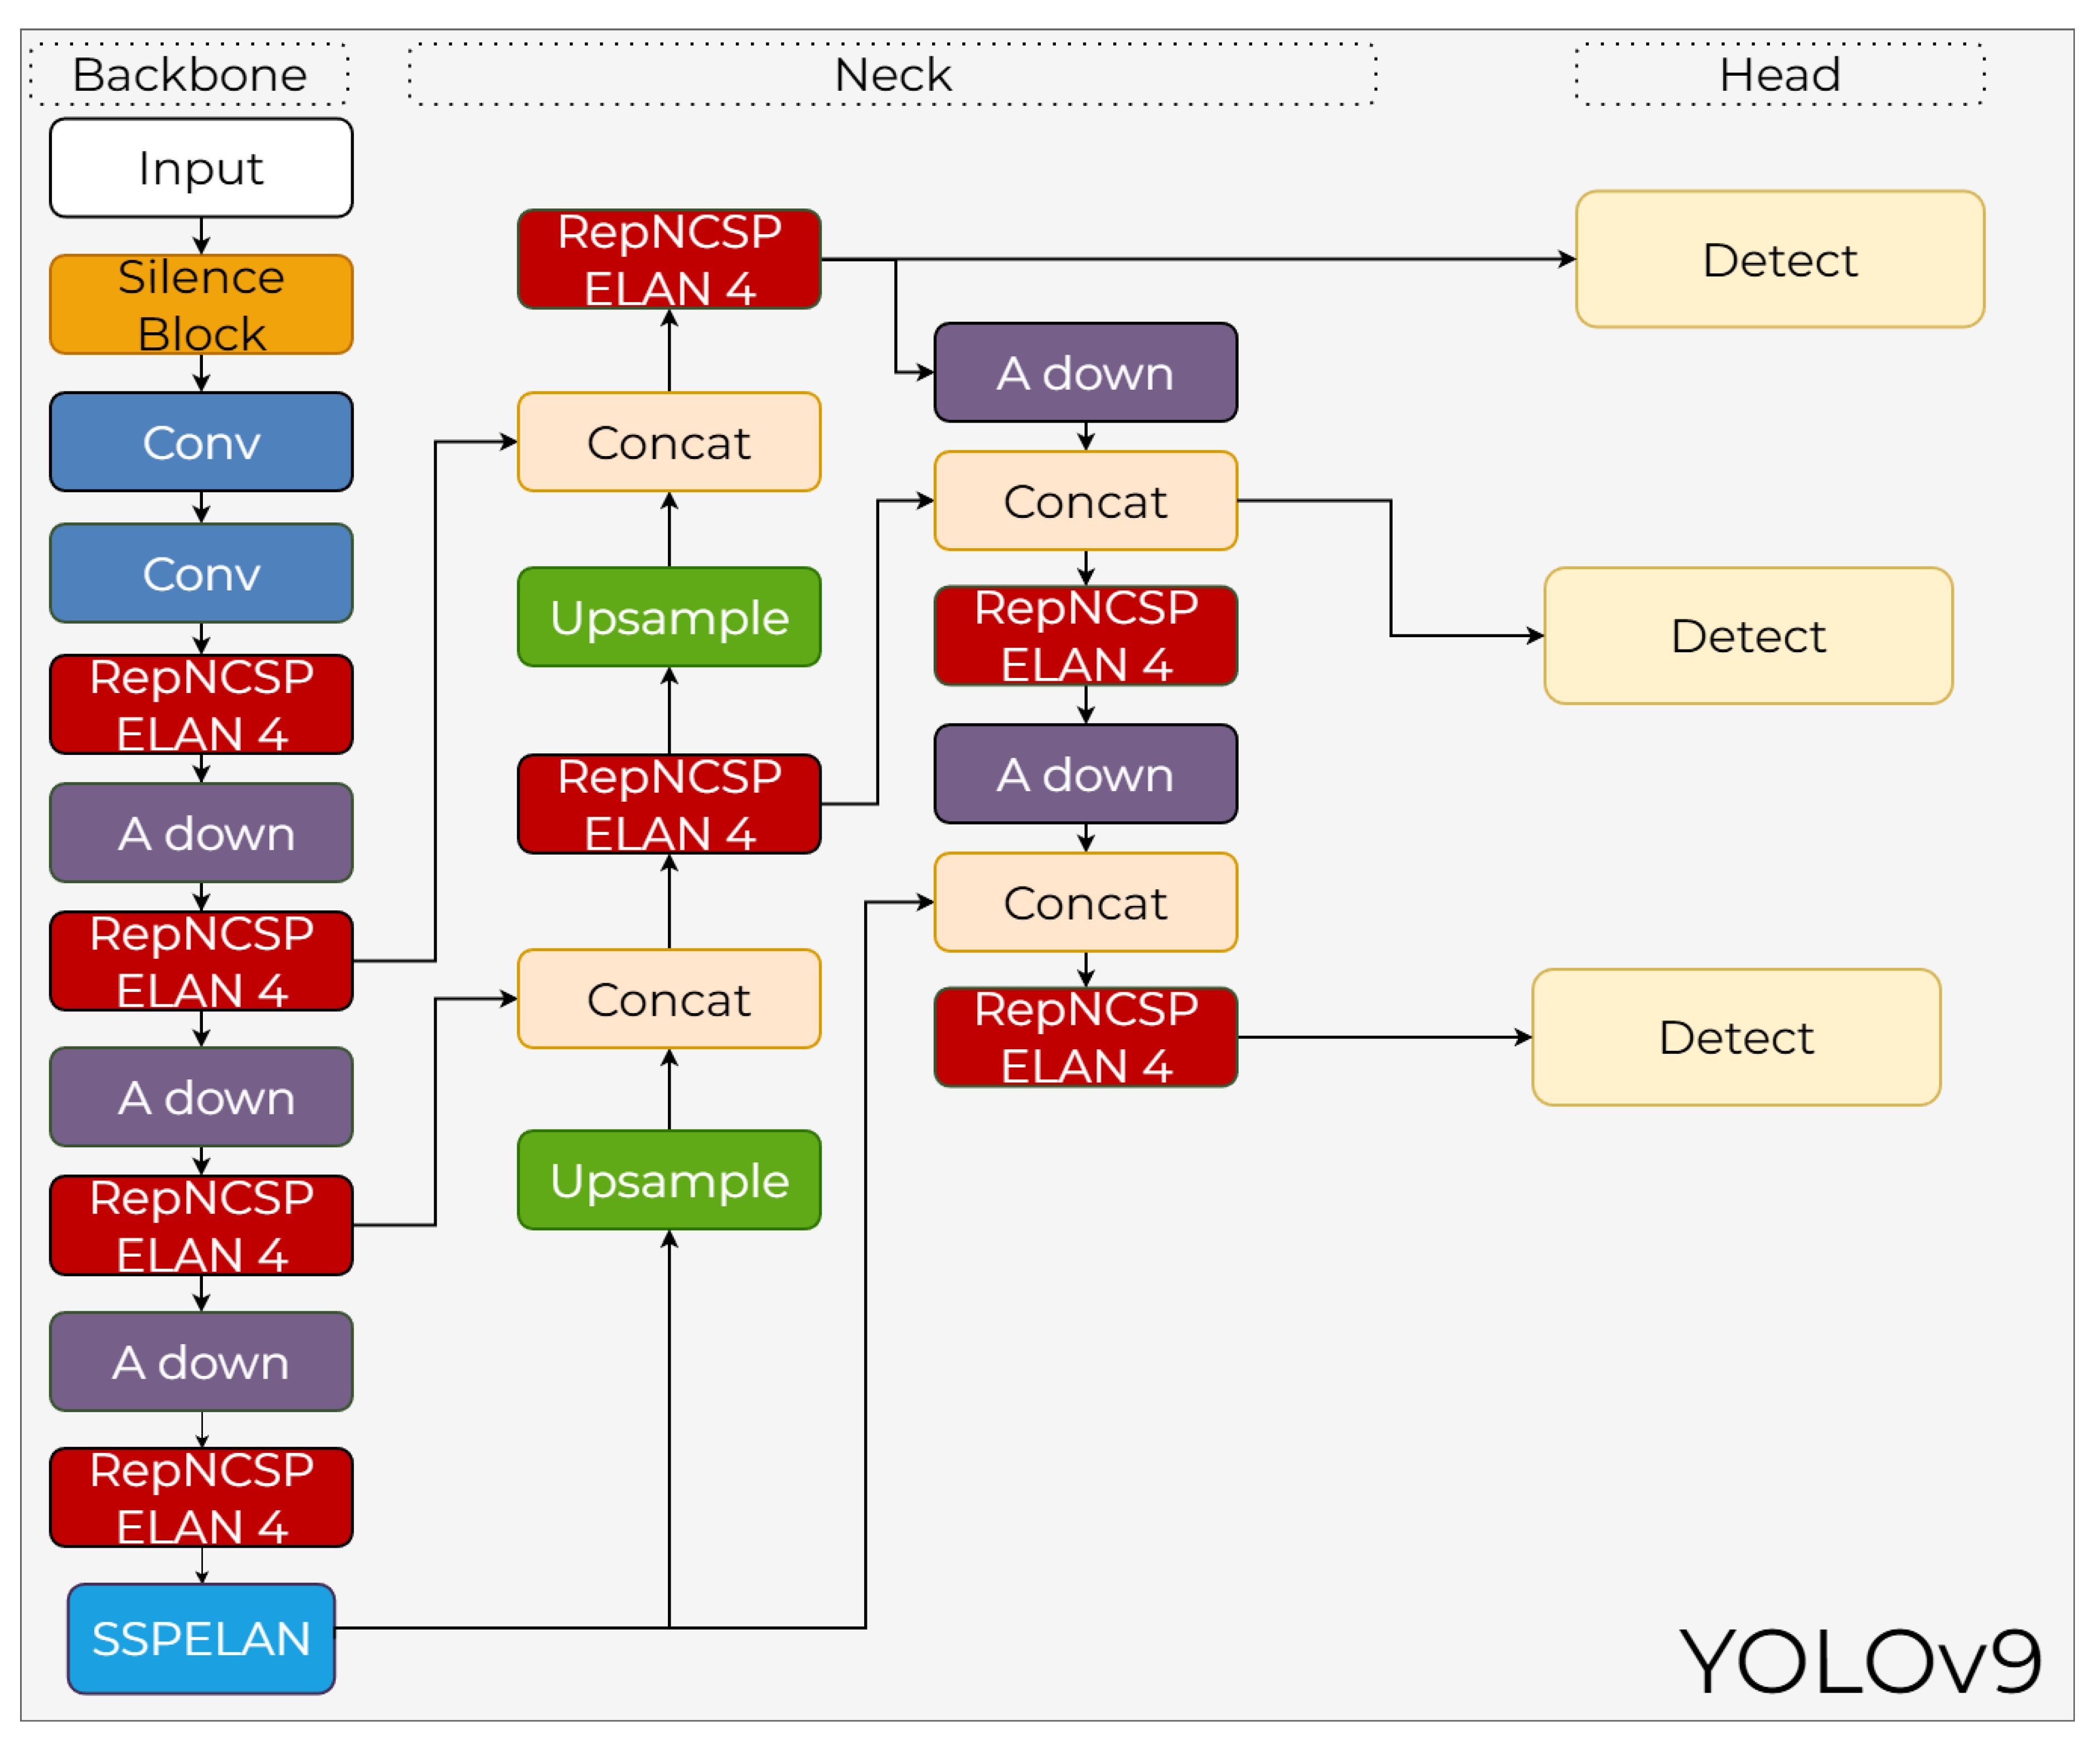
Figure 16.
Schematic diagram of the YOLOv10 architecture.
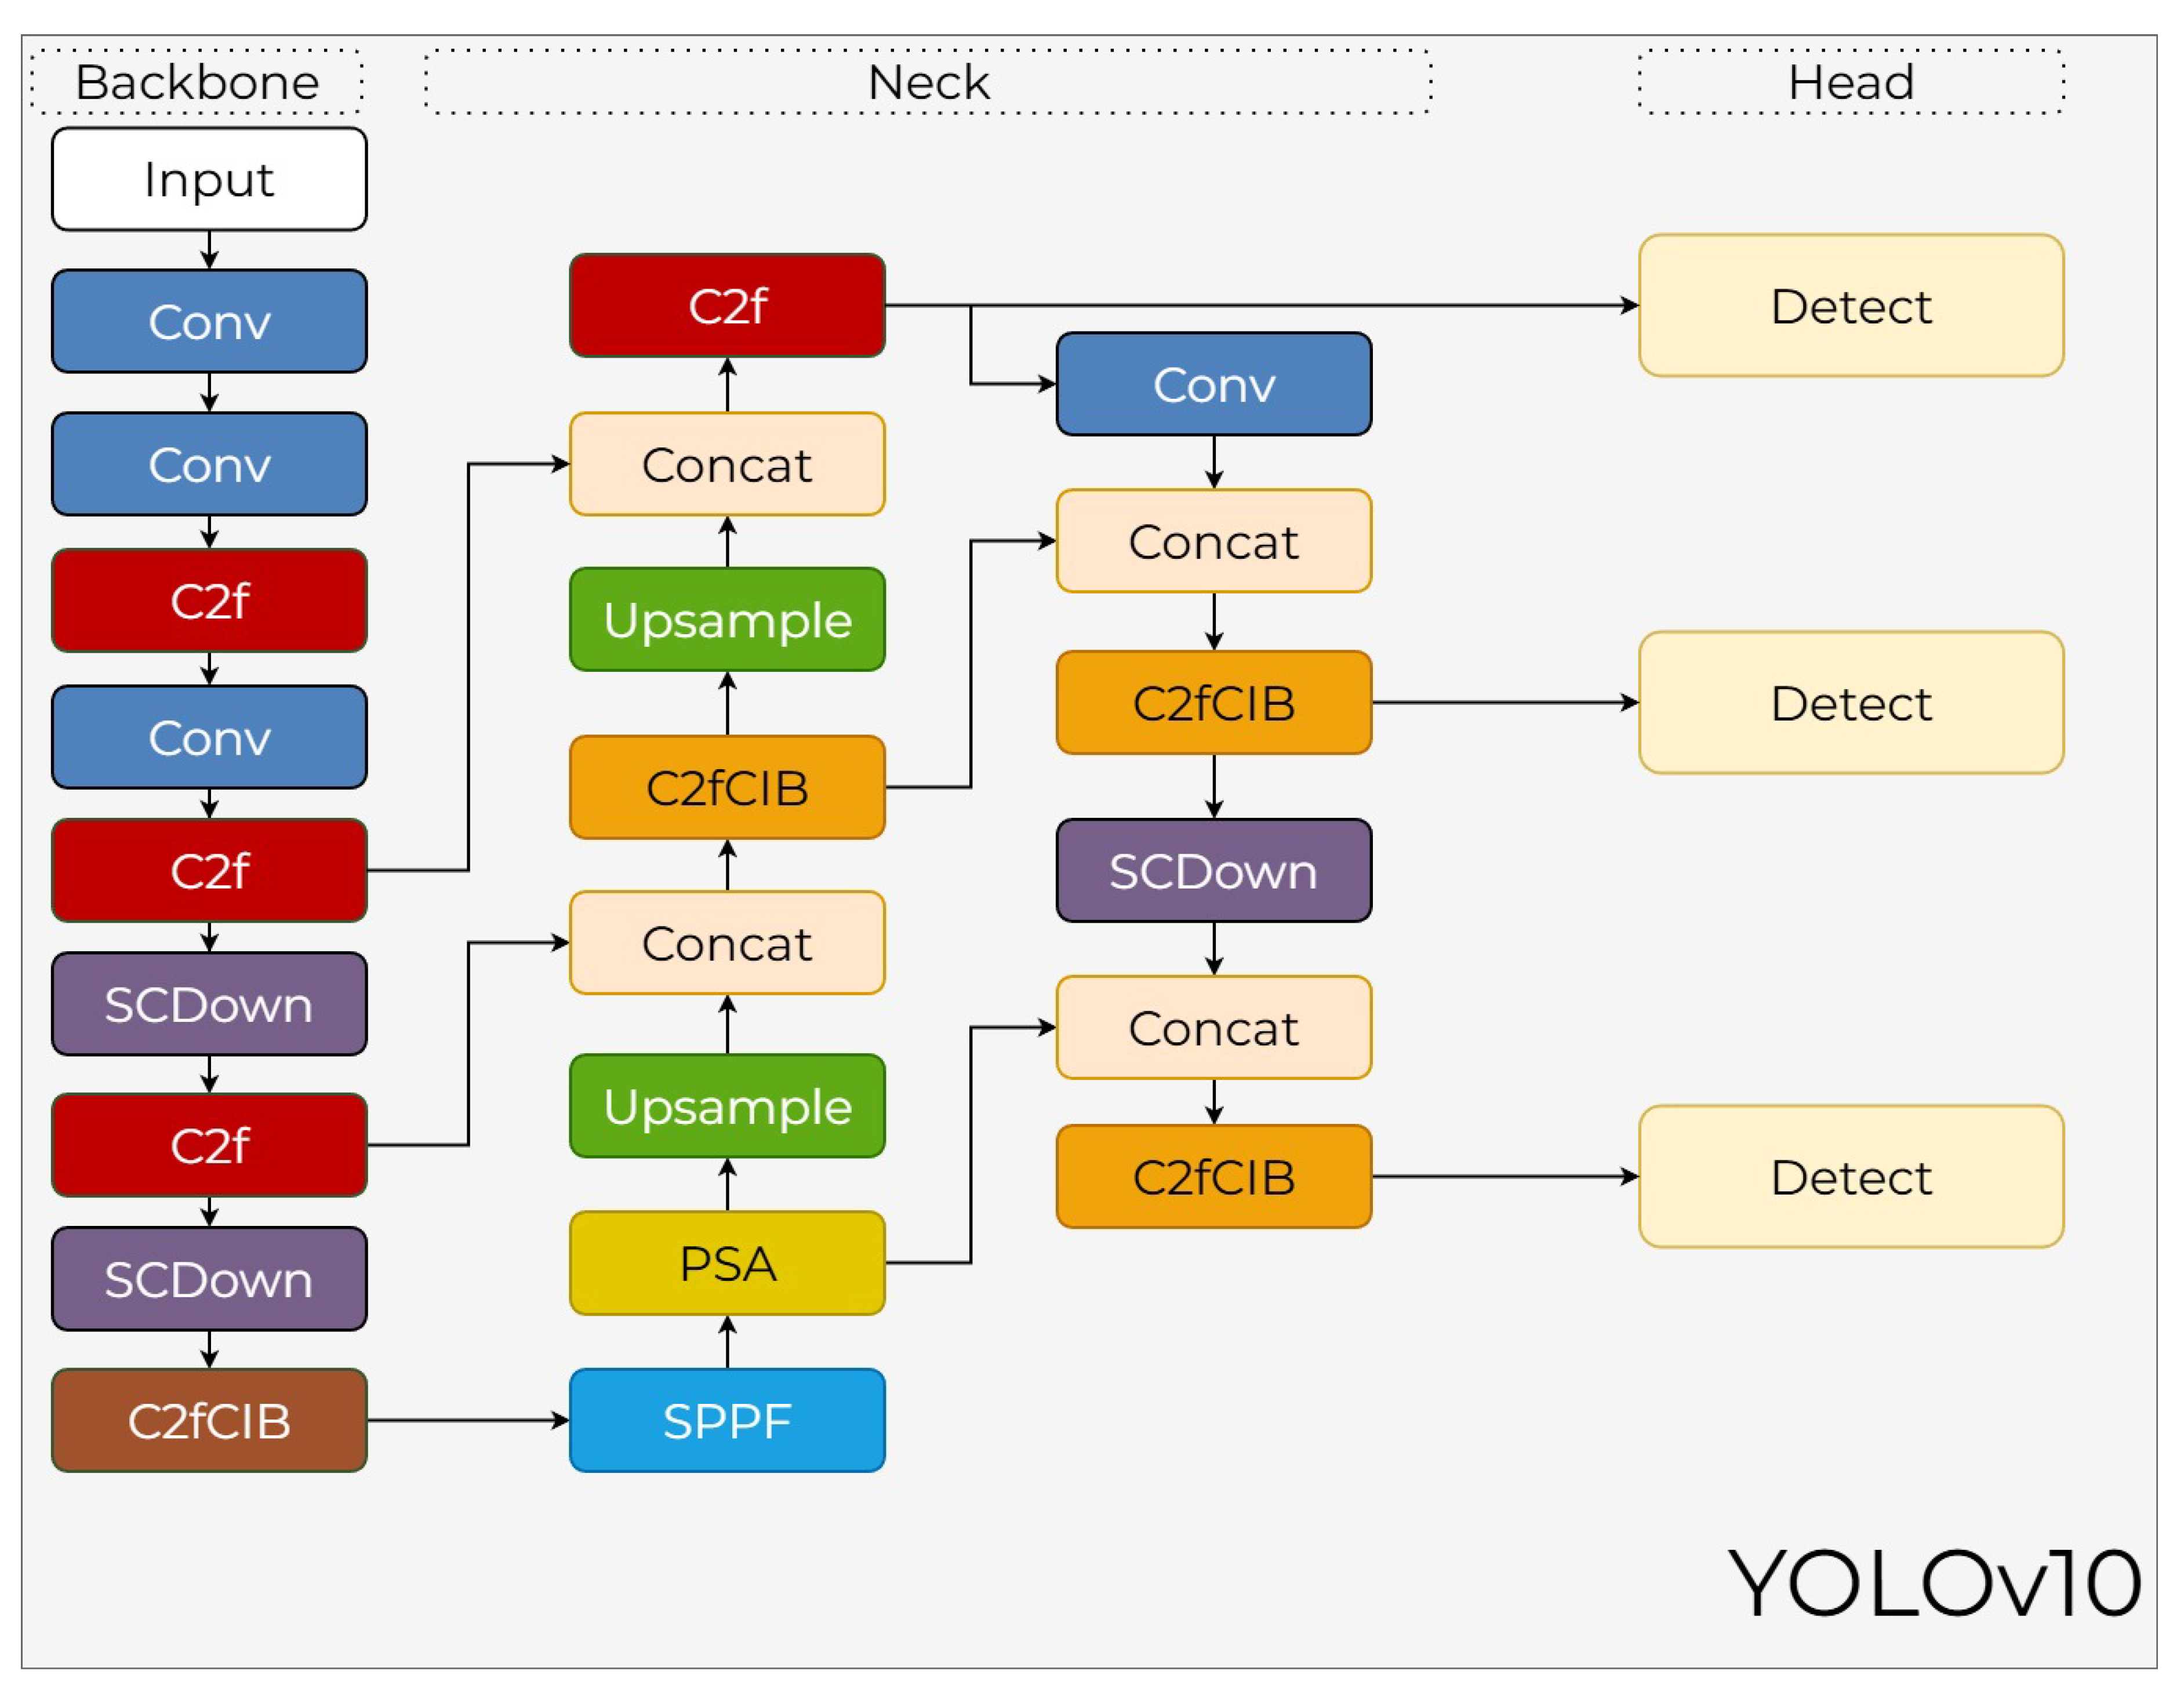
Figure 17.
Schematic diagram of the YOLOv11 architecture
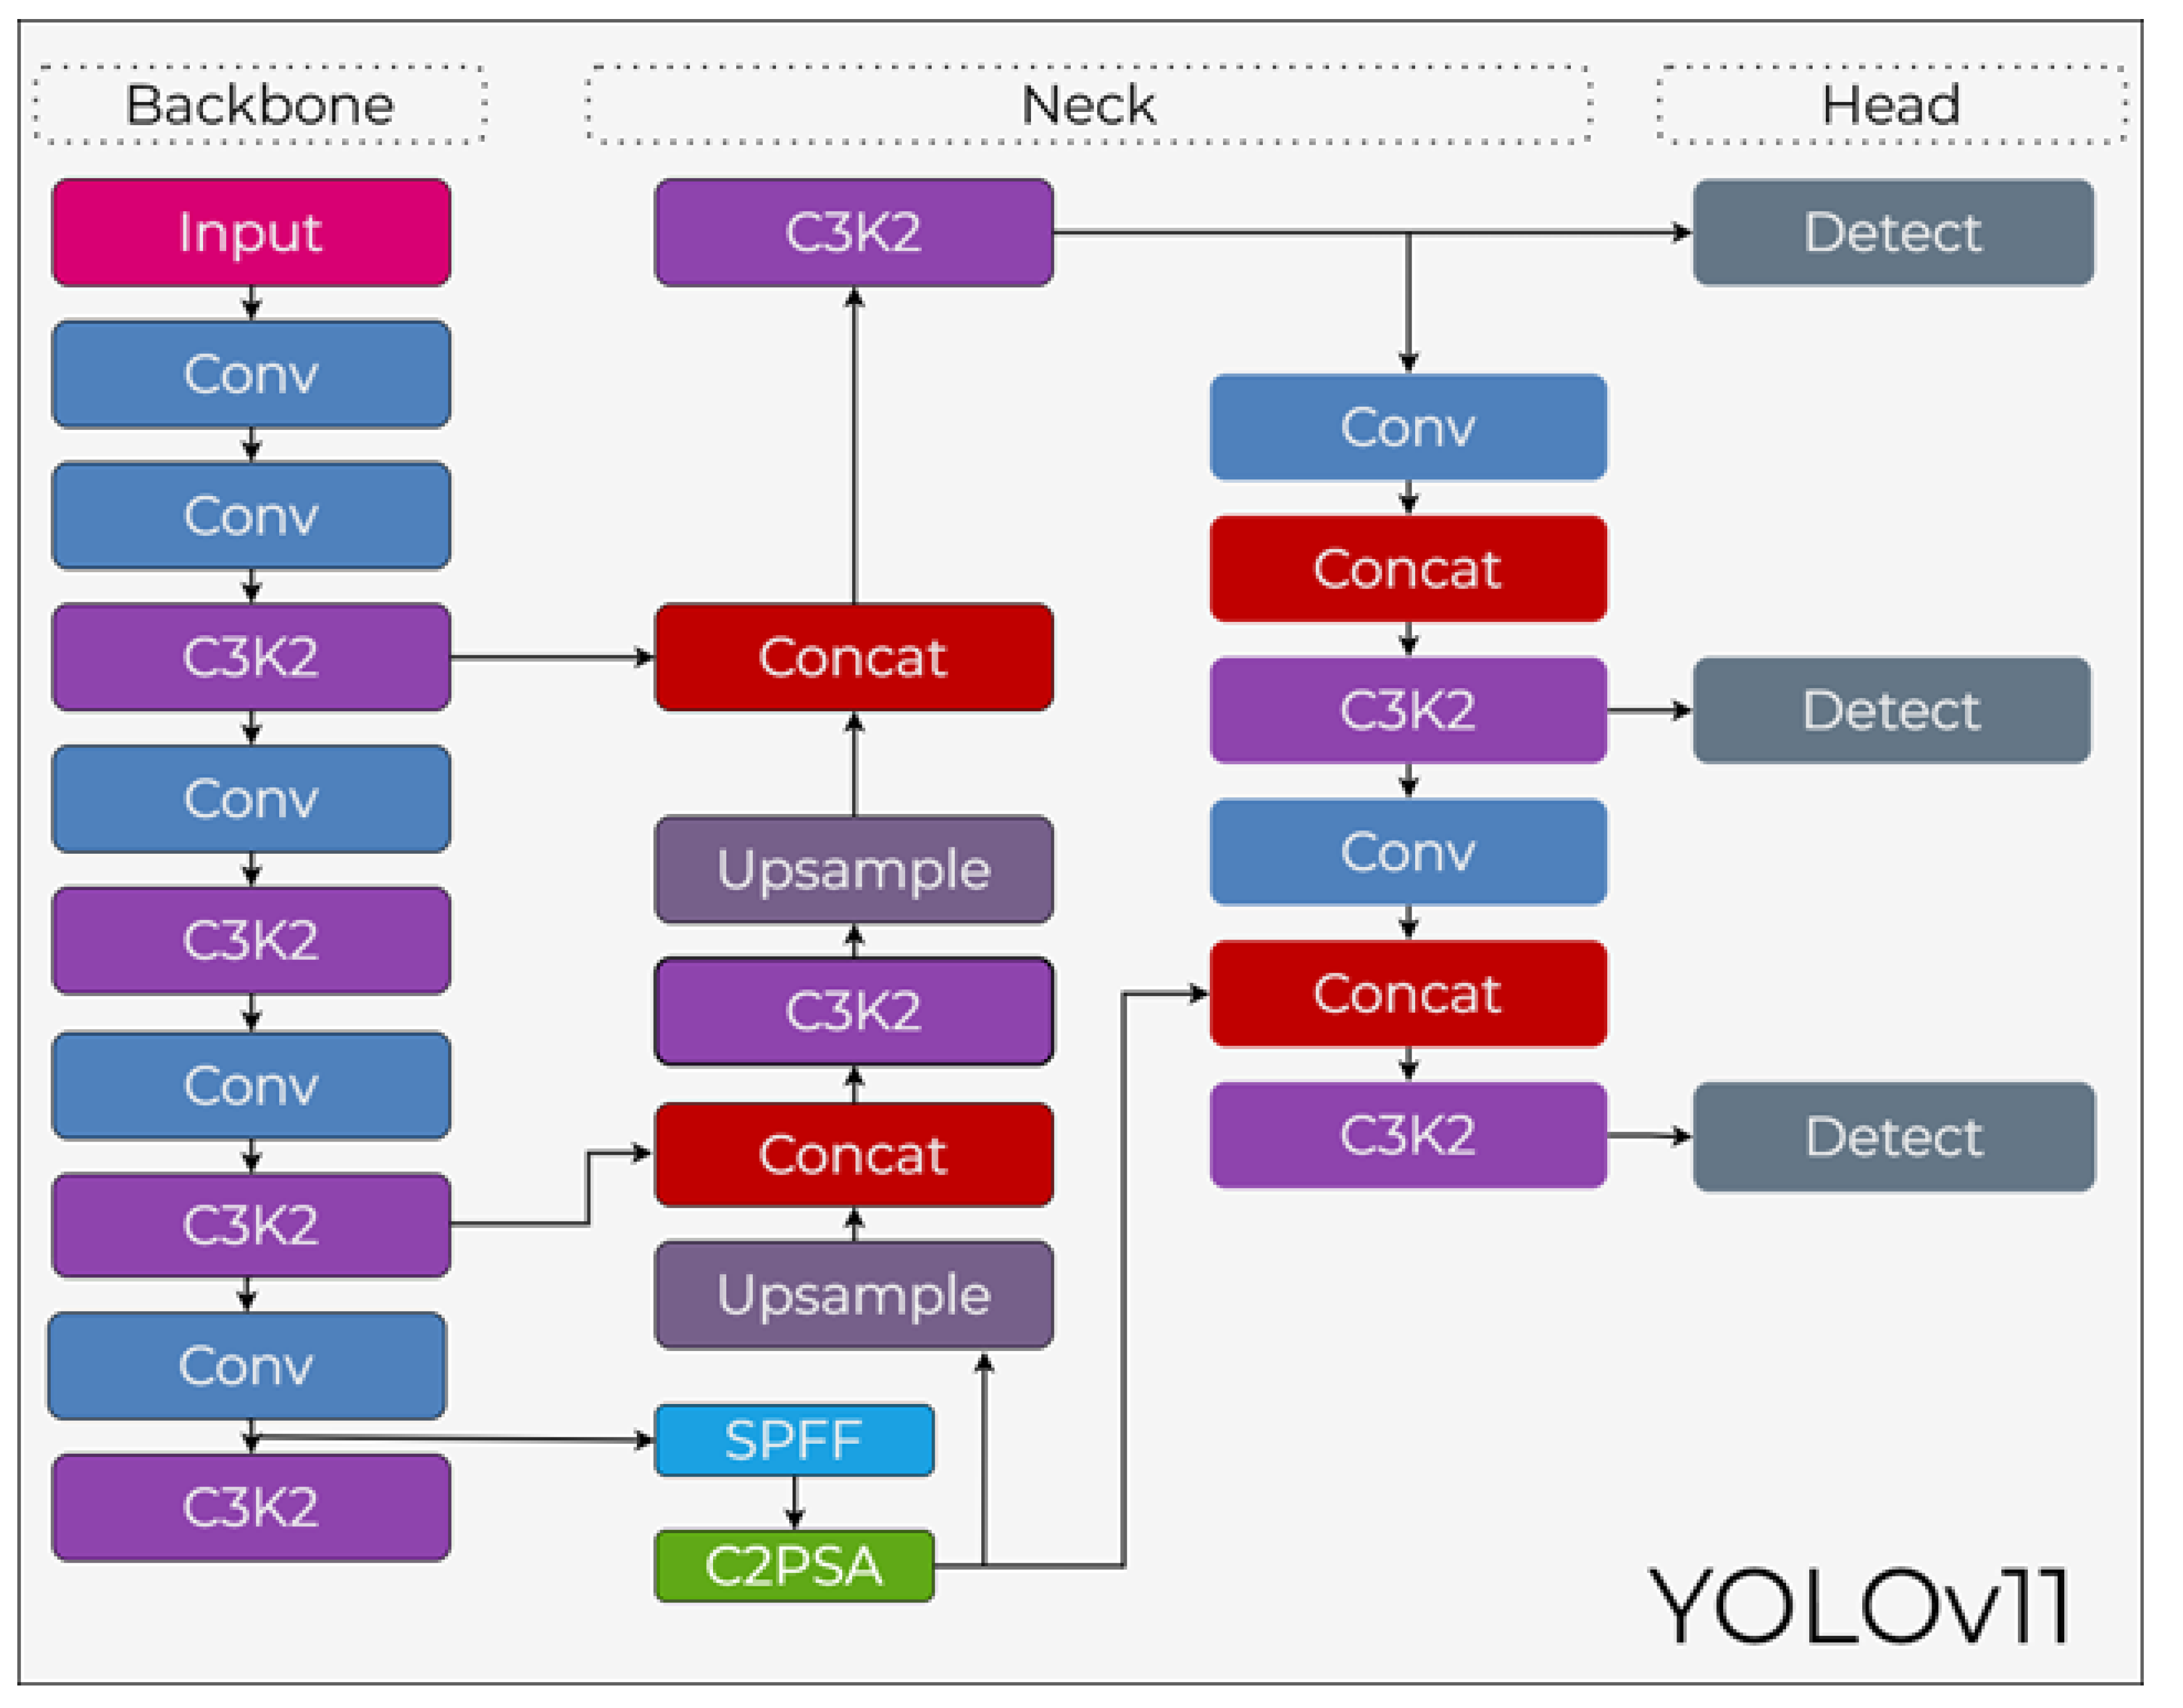
Figure 18.
Schematic diagram of the YOLOv12 architecture
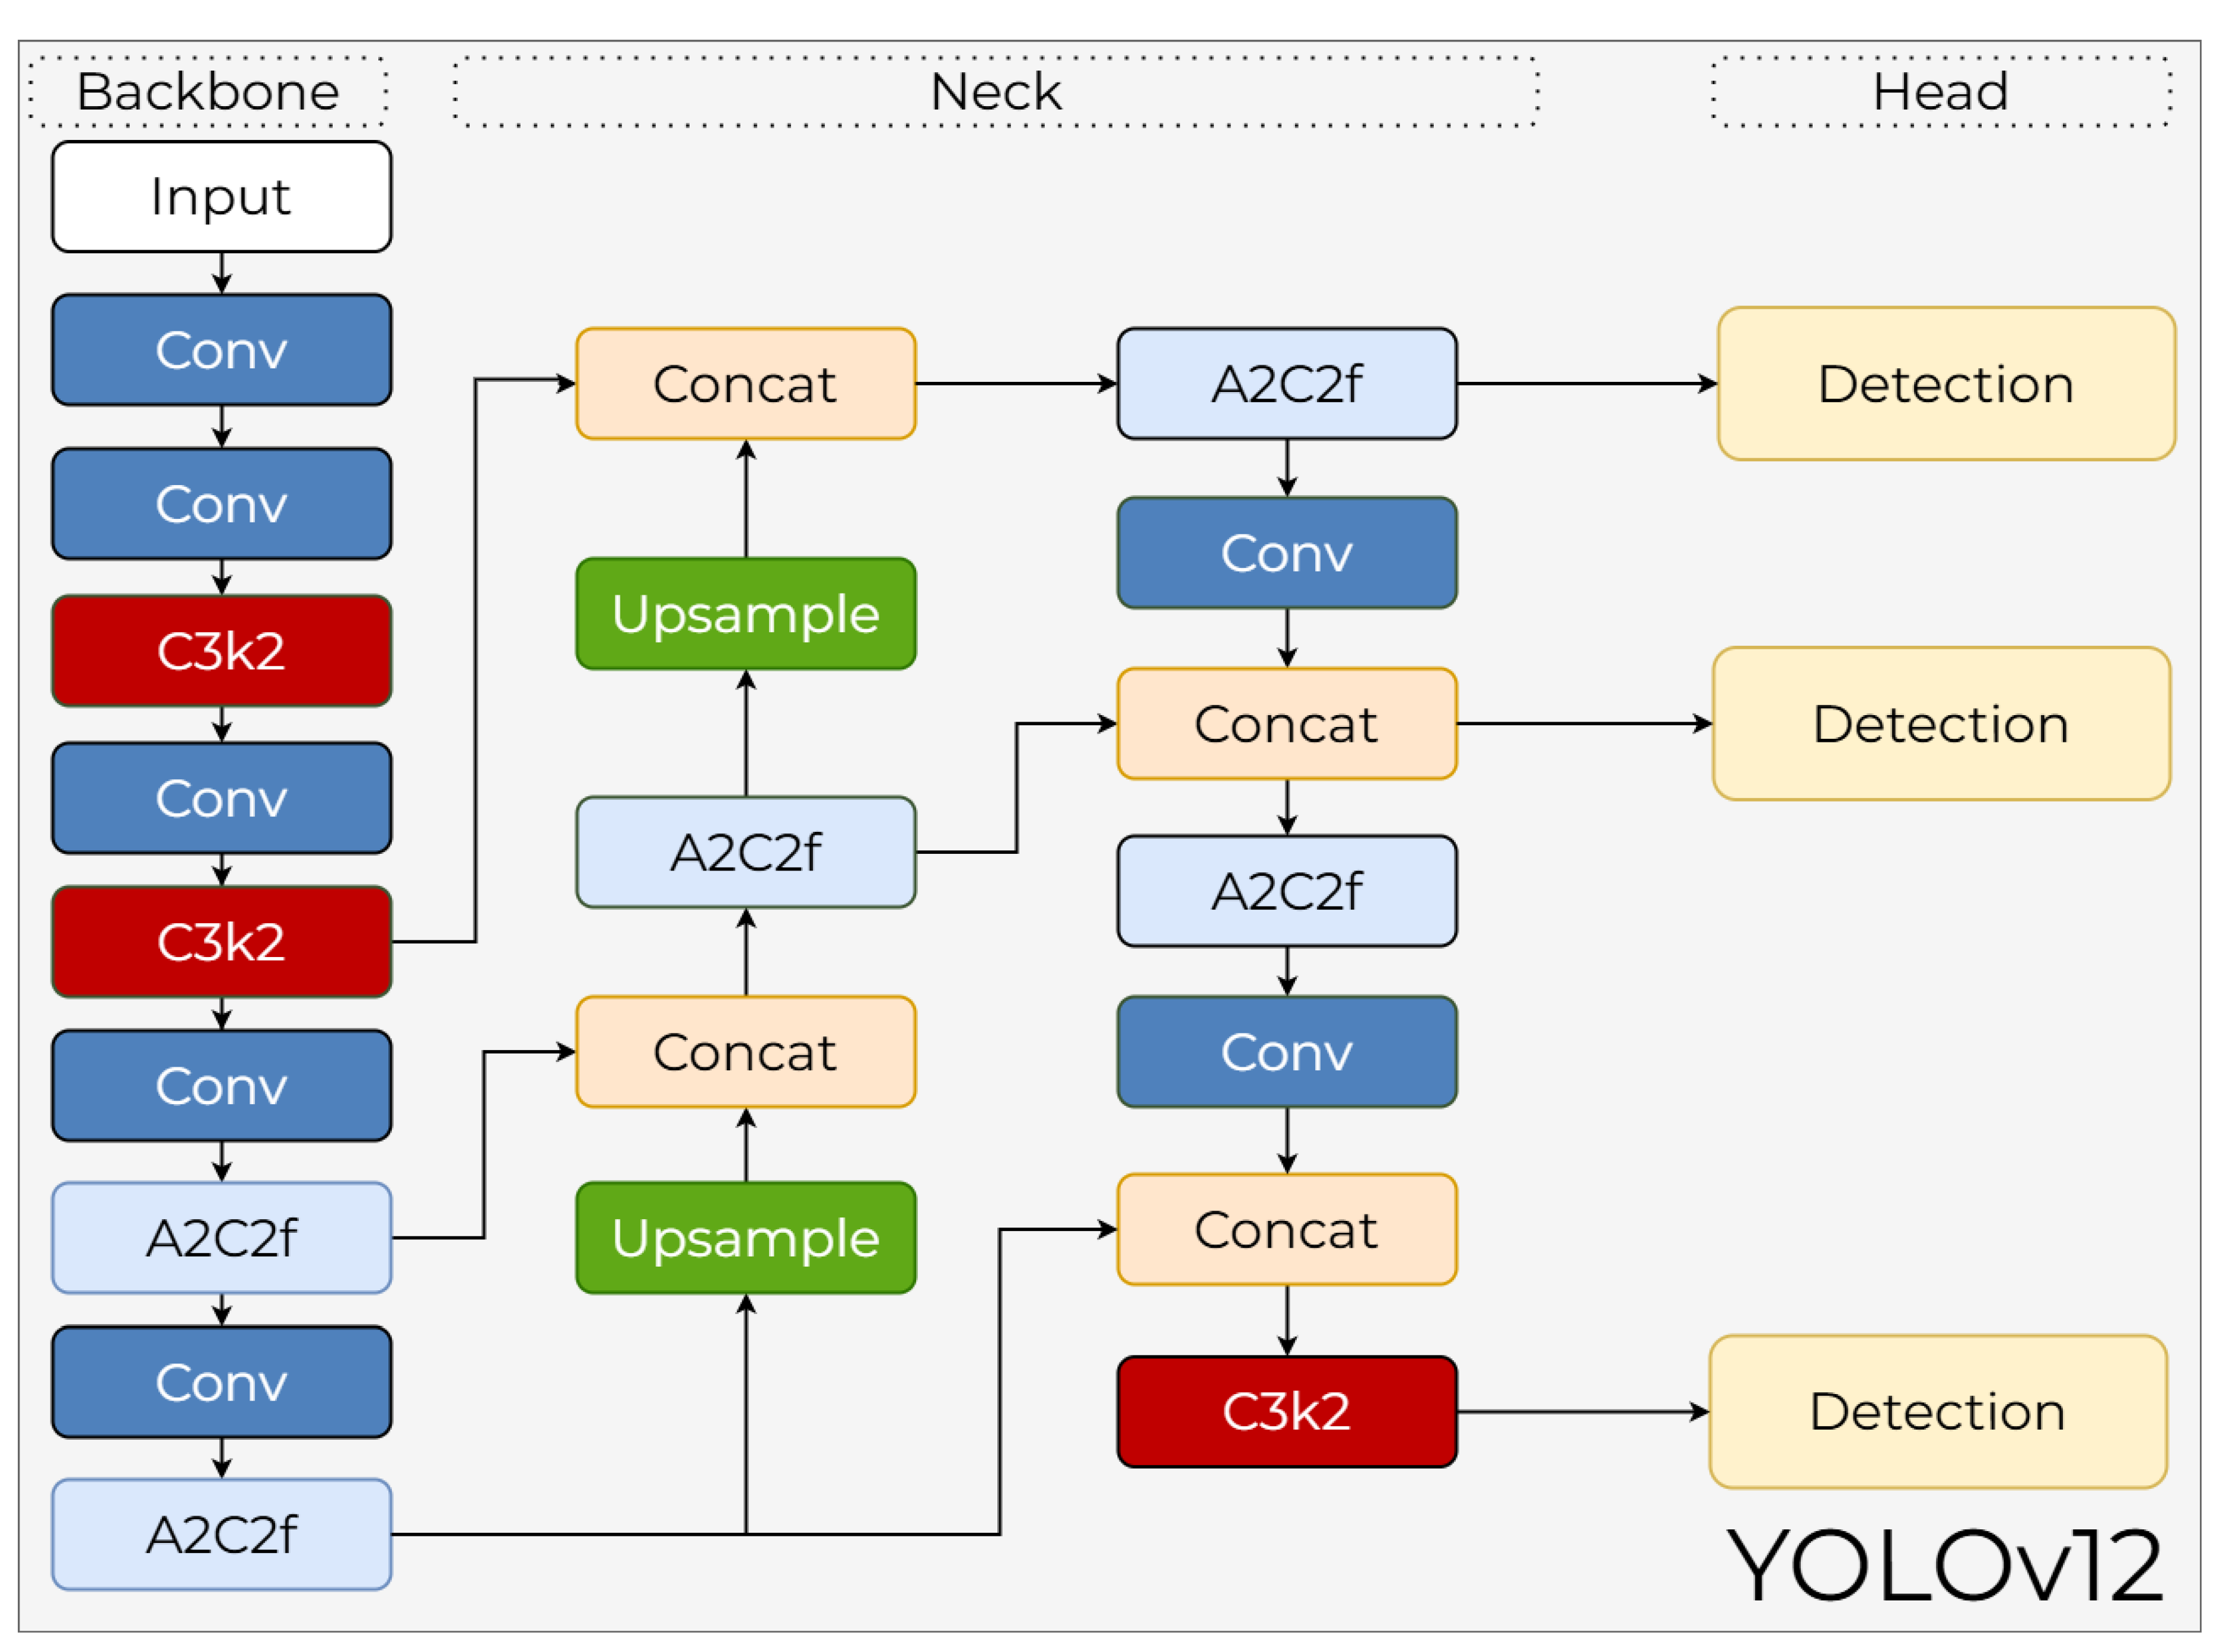
Figure 19.
Schematic diagram of the YOLO26 architecture.
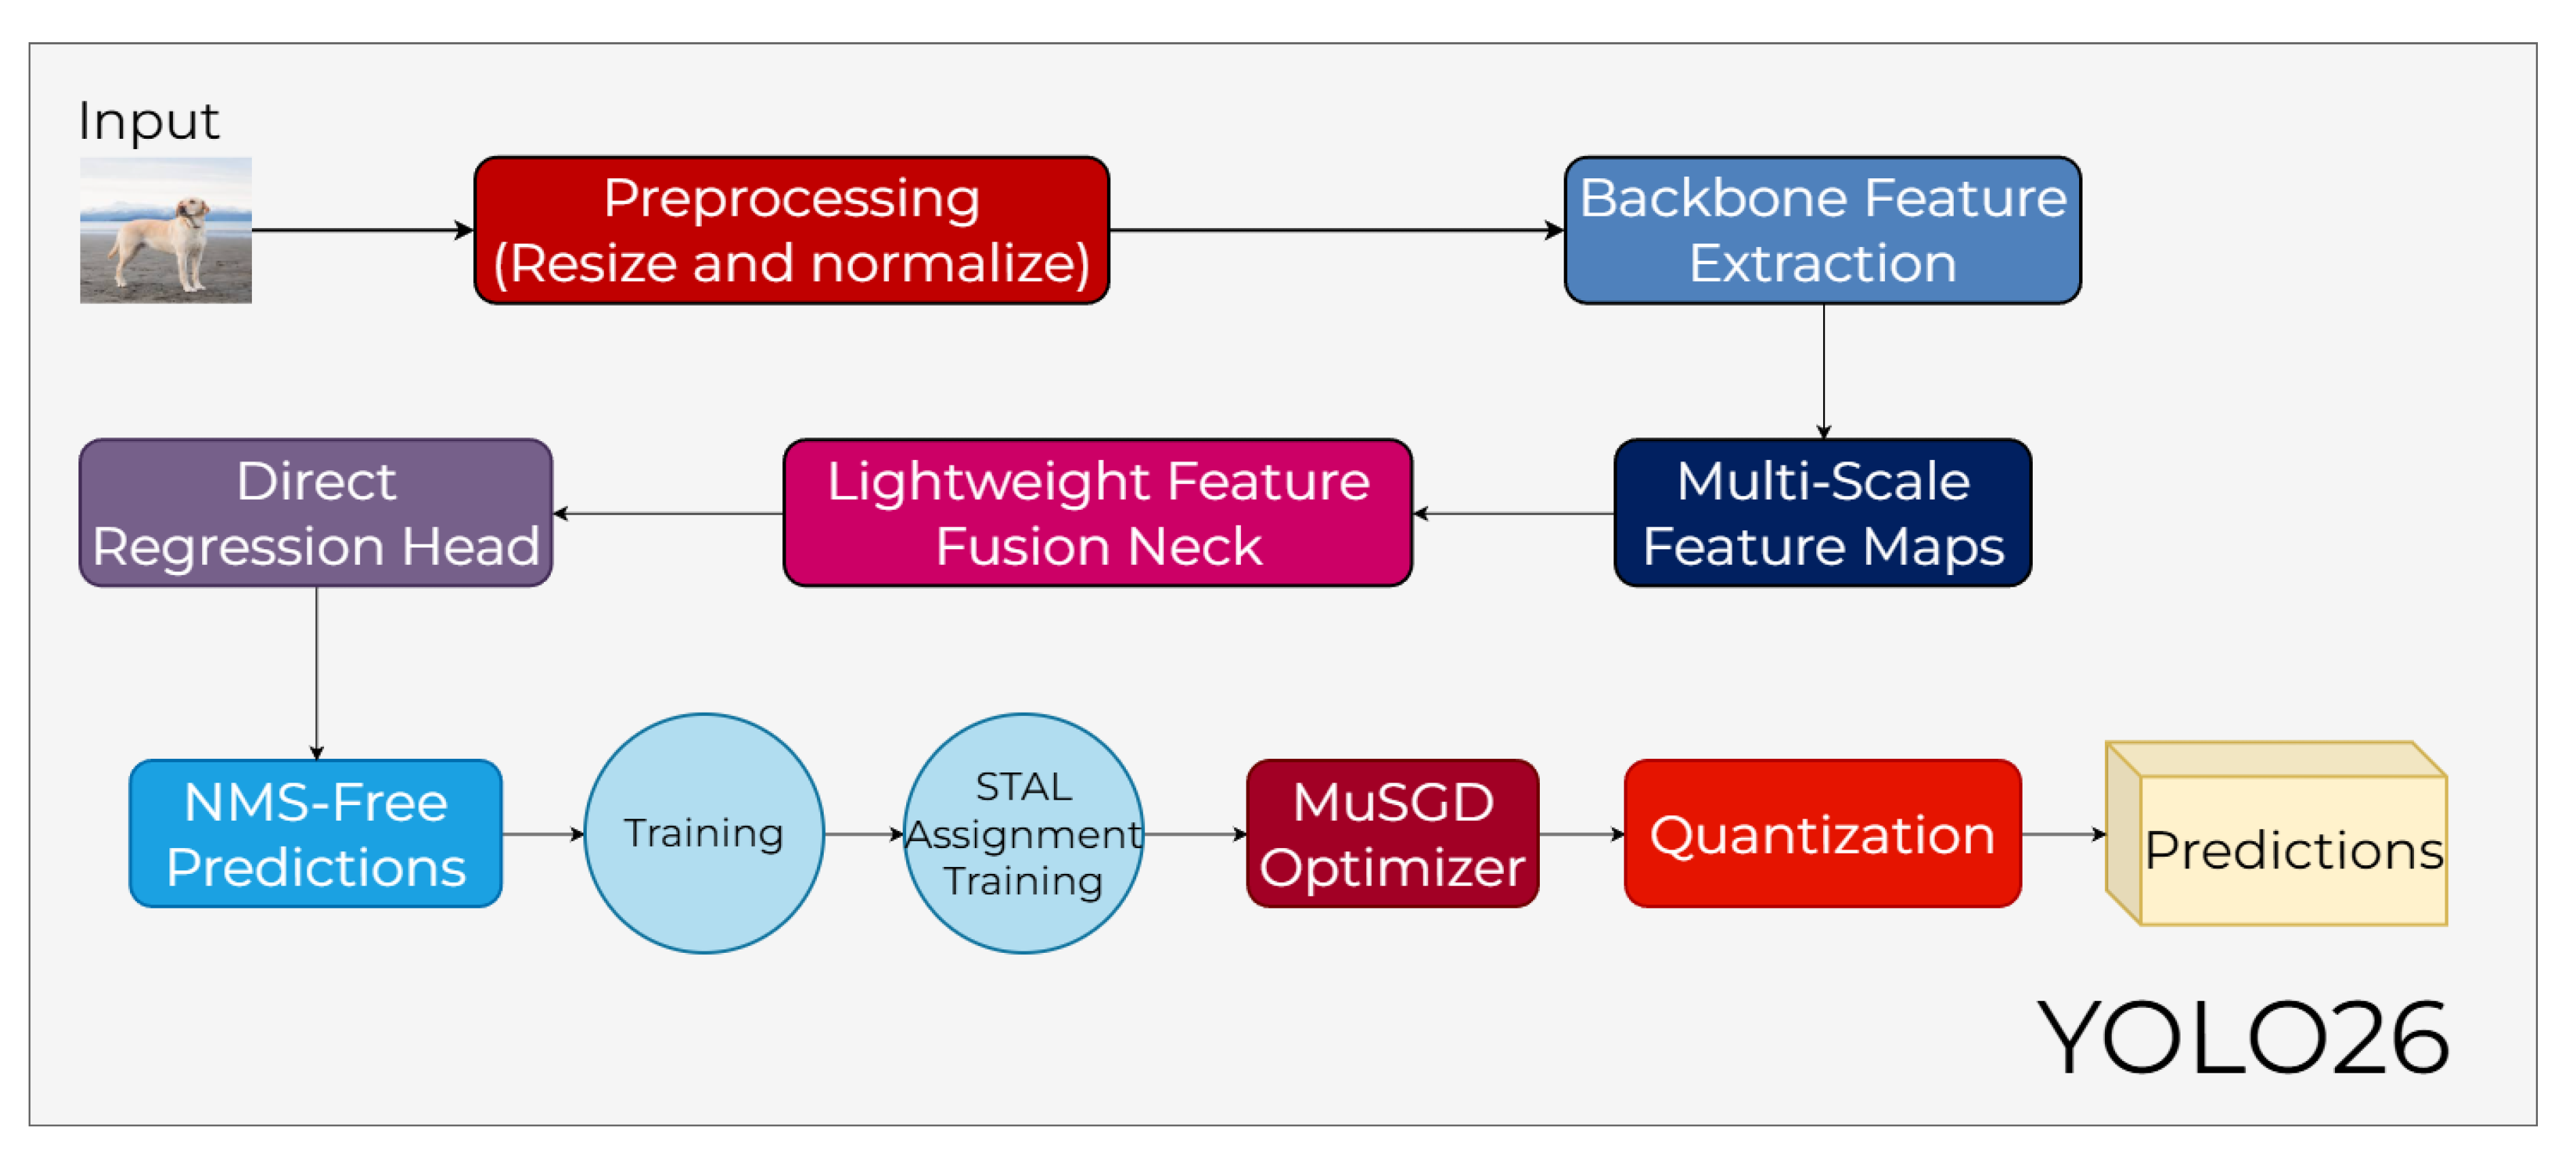

Table 1.
Commonly used data annotation platforms for YOLO-based object detection.
| Ref. | Annotation Platform | Specification / Key Features |
|---|---|---|
| [23] | LabelImg | Desktop-based, open-source tool. Lightweight and easy to use. Fast manual bounding-box annotation. |
| [24] | LabelMe | Web-based, desktop-supported. Supports polygon and bounding-box annotation. |
| [25] | CVAT | Web-based, enterprise-grade tool by Intel. Supports video annotation, interpolation, and auto-labeling. |
| [26] | Roboflow | Cloud-based platform. Strong auto-labeling, augmentation tools, and dataset versioning. |
| [27] | Label Studio | Web-based & code-integrated. Highly flexible with customizable templates for multi-modal datasets. |
| [28] | Supervisely | Industrial-scale platform. Advanced collaboration and project management for large teams. |
| [29] | VoTT | Desktop-based. Simple UI, good for quick bounding-box annotation in offline environments. |
Table 2.
Widely used benchmark datasets for YOLO-based object detection, categorized by domain.
| Category | Ref | Dataset | Description |
|---|---|---|---|
| General Object Detection |
[30] | PASCAL VOC | 20 classes, 10k images. Generic object categories captured in naturalistic scenes. |
| [31] | COCO | 91 classes, 328k+ labeled images. Complex natural scenes with dense, multi-instance object distributions. | |
| [32] | OID | 600+ classes, 9.2M images. Broad range of object categories spanning natural, man-made, and contextual elements. | |
| [33] | Objects365 | 365 classes, 600k+ images. Large-scale general-purpose objects captured in diverse environments. | |
| Autonomous Driving |
[34] | BDD100K | 10 classes, 100k images. Driving scenes under varied environmental, temporal, and geographical conditions. |
| Aerial | [35] | VisDrone | 10 classes, 10k+ images. Drone-captured urban and suburban scenes containing small and densely packed objects. |
| [36] | UAVDT | 14 kinds of attributes, 80k+ video frames. UAV-based monitoring sequences focused on vehicles and traffic scenarios. | |
| Human- centric |
[37] | CrowdHuman | 1 class (person), 15k images. Highly crowded pedestrian scenes with extensive occlusion. |
| [38] | WIDER FACE | 1 class (face), 32k images / 393k faces. Faces with significant variability in scale, pose, and occlusion. | |
| Medical | [39] | DeepLesion | 1 class (lesion regions), 32k+ CT slices. Clinically collected CT scans containing multi-organ lesions. |
Table 3.
Detailed structure of the backbone CNN used in YOLOv1 model.
| Repeat | Type | Filters | Size/Stride | Output |
|---|---|---|---|---|
| - | Conv | 64 | 7×7 / 2 | 224×224 |
| - | Max Pool | - | 2×2 / 2 | 112×112 |
| - | Conv | 192 | 3×3 / 1 | 112×112 |
| - | Max Pool | - | 2×2 / 2 | 56×56 |
| 1× | Conv | 128 | 1×1 / 1 | 56×56 |
| Conv | 256 | 3×3 / 1 | 56×56 | |
| Conv | 256 | 1×1 / 1 | 56×56 | |
| Conv | 512 | 3×3 / 1 | 56×56 | |
| - | Max Pool | - | 2×2 / 2 | 28×28 |
| 4× | Conv | 256 | 1×1 / 1 | 28×28 |
| Conv | 512 | 3×3 / 1 | 28×28 | |
| - | Conv | 512 | 1×1 / 1 | 28×28 |
| - | Conv | 1024 | 3×3 / 1 | 28×28 |
| - | Max Pool | - | 2×2 / 2 | 14×14 |
| 2× | Conv | 512 | 1×1 / 1 | 14×14 |
| Conv | 1024 | 3×3 / 1 | 14×14 | |
| - | Conv | 1024 | 3×3 / 1 | 14×14 |
| - | Conv | 1024 | 3×3 / 2 | 7×7 |
| - | Conv | 1024 | 3×3 / 1 | 7×7 |
| - | Conv | 1024 | 3×3 / 1 | 7×7 |
| - | FC | - | 4096 | 4096 |
| - | Dropout(0.5) | - | - | 4096 |
| - | FC | - | 7×7×30 | 1470 (7×7×30) |
Table 4.
Detailed structure of the Darknet-19 backbone used in YOLOv2.
| Type | Filters | Size/Stride | Output |
|---|---|---|---|
| Conv/BN | 32 | 3×3 / 1 | 416×416×32 |
| MaxPool | – | 2×2 / 2 | 208×208×32 |
| Conv/BN | 64 | 3×3 / 1 | 208×208×64 |
| MaxPool | – | 2×2 / 2 | 104×104×64 |
| Conv/BN | 128 | 3×3 / 1 | 104×104×128 |
| Conv/BN | 64 | 1×1 / 1 | 104×104×64 |
| Conv/BN | 128 | 3×3 / 1 | 104×104×128 |
| MaxPool | – | 2×2 / 2 | 52×52×128 |
| Conv/BN | 256 | 3×3 / 1 | 52×52×256 |
| Conv/BN | 128 | 1×1 / 1 | 52×52×128 |
| Conv/BN | 256 | 3×3 / 1 | 52×52×256 |
| MaxPool | – | 2×2 / 2 | 26×26×256 |
| Conv/BN | 512 | 3×3 / 1 | 26×26×512 |
| Conv/BN | 256 | 1×1 / 1 | 26×26×256 |
| Conv/BN | 512 | 3×3 / 1 | 26×26×512 |
| Conv/BN | 256 | 1×1 / 1 | 26×26×256 |
| Conv/BN | 512 | 3×3 / 1 | 26×26×512 |
| MaxPool | – | 2×2 / 2 | 13×13×512 |
| Conv/BN | 1024 | 3×3 / 1 | 13×13×1024 |
| Conv/BN | 512 | 1×1 / 1 | 13×13×512 |
| Conv/BN | 1024 | 3×3 / 1 | 13×13×1024 |
| Conv/BN | 512 | 1×1 / 1 | 13×13×512 |
| Conv/BN | 1024 | 3×3 / 1 | 13×13×1024 |
| Conv/BN | 1024 | 3×3 / 1 | 13×13×1024 |
| Conv/BN | 1024 | 3×3 / 1 | 13×13×1024 |
| Reorg (layer 17) | – | – | 13×13×2048 |
| Concat | – | – | 13×13×3072 |
| Conv/BN | 1024 | 3×3 / 1 | 13×13×1024 |
| Conv | 125 | 1×1 / 1 | 13×13×125 |
Table 5.
Detailed structure of the Darknet-53 backbone used in YOLOv3.
| Repeat | Type | Filters | Size/Stride | Output |
|---|---|---|---|---|
| - | Conv | 32 | 3×3 | 416×416 |
| - | Conv | 64 | 3×3 / 2 | 208×208 |
| 1× | Conv | 32 | 1×1 | - |
| Conv | 64 | 3×3 | - | |
| Residual | - | - | 208×208 | |
| - | Conv | 128 | 3×3 / 2 | - |
| 2× | Conv | 64 | 1×1 | - |
| Conv | 128 | 3×3 | - | |
| Residual | - | - | 104×104 | |
| - | Conv | 256 | 3×3 / 2 | 52×52 |
| 8× | Conv | 128 | 1×1 | - |
| Conv | 256 | 3×3 | - | |
| Residual | - | - | 52×52 | |
| - | Conv | 512 | 3×3 / 2 | 26×26 |
| 8× | Conv | 256 | 1×1 | - |
| Conv | 512 | 3×3 | - | |
| Residual | - | - | 26×26 | |
| - | Conv | 1024 | 3×3 / 2 | 13×13 |
| 4× | Conv | 512 | 1×1 | - |
| Conv | 1024 | 3×3 | - | |
| Residual | - | - | 13×13 | |
| - | Avg Pool | 1000 | - | - |
| - | Softmax | - | - | - |
Table 6.
Annual distribution of YOLO-related publications indexed in ACM, IEEE Xplore, Scopus, and Web of Science from 2015 to 2025.
Table 6.
Annual distribution of YOLO-related publications indexed in ACM, IEEE Xplore, Scopus, and Web of Science from 2015 to 2025.
| Database | 2015 | 2016 | 2017 | 2018 | 2019 | 2020 | 2021 | 2022 | 2023 | 2024 | 2025 | Total |
|---|---|---|---|---|---|---|---|---|---|---|---|---|
| ACM | 1 | 9 | 43 | 101 | 163 | 219 | 324 | 349 | 619 | 949 | 1120 | 3,897 |
| IEEE Xplore | 9 | 20 | 73 | 245 | 539 | 722 | 1,152 | 1,592 | 3,086 | 5,380 | 5,480 | 17,577 |
| Scopus | 341 | 415 | 976 | 1,992 | 4,048 | 5,805 | 8,666 | 13,015 | 18,636 | 26,995 | 41,006 | 121,895 |
| WoS | 13 | 22 | 67 | 210 | 454 | 673 | 965 | 1,591 | 1,979 | 3,886 | 6,973 | 16,833 |
Table 7.
Categorization of YOLO applications across major domains, including sub-tasks and example studies from the literature.
Table 7.
Categorization of YOLO applications across major domains, including sub-tasks and example studies from the literature.
| Main Category | Sub-category / Specific Task | Representative Studies |
|---|---|---|
| Agriculture & Smart Farming | Fruit/vegetable detection | [51,52,53,54,55,56,57] |
| Disease & pest detection | [58,59,60,61,62,63] | |
| Aerial, UAV & Satellite Imaging | Small-object detection | [64,65] |
| Maritime surveillance | [66,67] | |
| Disaster monitoring | [68,69] | |
| Autonomous Driving & IT | Vehicle detection | [70,71,72,73,74,75] |
| Pedestrian detection | [76,77,78] | |
| Traffic sign & signal detection | [79,80,81,82,83] | |
| Lane & object detection | [84,85] | |
| Environmental Monitoring | Wildlife detection | [86,87] |
| Pollution detection | [88,89] | |
| Healthcare & Medical Imaging | Lesion/tumor localization | [90,91,92,93] |
| Surgical tool tracking | [94,95,96] | |
| Cell & microscope image detection | [97,98,99,100,101] | |
| Industry & Manufacturing | Defect detection | [102,103] |
| Workplace safety | [104,105] | |
| Robotics & Automation | Object localization | [106,107] |
| Tool detection | [108,109] | |
| Security & Public Safety | Intrusion detection | [110,111] |
| Suspicious item detection | [112,113] | |
| Crowd analysis | [114,115] | |
| Sports Analytics | Player detection | [116,117] |
| Action recognition support | [116,117,118] | |
| Transportation | Ship detection | [119,120,121] |
| Rail-track obstacle detection | [121,122] | |
| Underwater & Subsea Imaging | Fish species detecting | [123,124] |
| Underwater debris detection | [125,126] | |
| X-ray & Radiographic Analysis | Foreign object detection | [127,128] |
| Structural crack detection | [129,130] | |
| Zoology & Animal Sciences | Animal behavior tracking | [131,132] |
| Animal species detection | [133,134] |
Table 8.
Evolution of Technical Innovations Across YOLO Versions.
| Version | Backbone | Core Innovation | Anchor | NMS | Technical Contribution |
|---|---|---|---|---|---|
| YOLOv1 | Darknet-24 | Grid-based regression | ✗ | ✓ | Real-time end-to-end detection |
| YOLOv2 | Darknet-19 | Batch Norm, Passthrough | ✓ | ✓ | High-resolution classification |
| YOLOv3 | Darknet-53 | FPN, Residual blocks | ✓ | ✓ | Multi-scale object detection |
| YOLOv4 | CSPDarknet53 | Mosaic, CSP, Mish | ✓ | ✓ | Speed-accuracy optimization |
| YOLOv5 | CSPDarknet | AutoAnchor, Focus | ✓ | ✓ | Flexible PyTorch-based architecture |
| YOLOv6 | EfficientRep | RepVGG, Decoupled Head | ✗ | ✓ | Anchor-free industrial inference |
| YOLOv7 | E-ELAN | Model Scaling, Aux. Head | ✓ | ✓ | Trainable "bag-of-freebies" methods |
| YOLOv8 | CSPDarknet(C2f) | Task Aligned Assignment | ✗ | ✓ | Unified architecture and dynamic assignment |
| YOLOv9 | GELAN | PGI (Gradient Info) | ✗ | ✓ | Information bottleneck resolution |
| YOLOv10 | CSPDarknet(CIB) | Dual Label Assignment | ✗ | ✗ | NMS-free end-to-end inference |
| YOLO11 | CSPDarknet(C3k2) | C3k2, C2PSA (Attention) | ✗ | ✓ | Feature extraction and attention mechanisms |
| YOLOv12 | Attention-Net | R-ELAN | ✗ | ✓ | Attention-driven computational efficiency |
| YOLO26 | Edge-Optimized | ProgLoss, STAL | ✗ | ✗ | NMS-free optimization for edge devices |
Table 9.
Detailed performance metrics of YOLO versions.
| Version | Date | Dataset | Input Size | mAP (%) | FPS | Param (M) | FLOPs (G) |
|---|---|---|---|---|---|---|---|
| YOLOv1 | 2015 | VOC 2007 | 448 | 63.4 | 45 | 65.0 | 45.0 |
| YOLOv2 | 2016 | VOC 2007 | 416 | 76.8 | 67 | 62.9 | 29.4 |
| YOLOv3 | 2018 | COCO | 416 | 31.0 | 45 | 61.9 | 65.9 |
| YOLOv4 | 2020 | COCO | 416 | 41.2 | 55 | 64.4 | 60.1 |
| YOLOv5 | 2020 | COCO | 640 | 45.4 | 82 | 21.2 | 48.0 |
| YOLOv6 | 2022 | COCO | 640 | 49.5 | 123 | 34.9 | 82.7 |
| YOLOv7 | 2022 | COCO | 640 | 51.2 | 161 | 36.9 | 104.7 |
| YOLOv8 | 2023 | COCO | 640 | 50.2 | 183 | 25.9 | 78.7 |
| YOLOv9 | 2024 | COCO | 640 | 51.4 | 117 | 25.3 | 102.0 |
| YOLOv10 | 2024 | COCO | 640 | 52.5 | 174 | 20.4 | 46.0 |
| YOLO11 | 2024 | COCO | 640 | 51.5 | 190 | 20.1 | 68.0 |
| YOLOv12 | 2025 | COCO | 640 | 52.5 | 206 | 20.2 | 67.5 |
| YOLO26 | 2025 | COCO | 640 | 53.1 | 212 | 20.4 | 68.2 |
Disclaimer/Publisher’s Note: The statements, opinions and data contained in all publications are solely those of the individual author(s) and contributor(s) and not of MDPI and/or the editor(s). MDPI and/or the editor(s) disclaim responsibility for any injury to people or property resulting from any ideas, methods, instructions or products referred to in the content. |
© 2026 by the authors. Licensee MDPI, Basel, Switzerland. This article is an open access article distributed under the terms and conditions of the Creative Commons Attribution (CC BY) license.
Copyright: This open access article is published under a Creative Commons CC BY 4.0 license, which permit the free download, distribution, and reuse, provided that the author and preprint are cited in any reuse.


