
Submitted:
25 February 2026
Posted:
26 February 2026
You are already at the latest version
Abstract
This study evaluates the financial profitability and carbon sequestration in mixed native forests of the Roble–Raulí–Coigüe and evergreen types in the southern macrozone of Chile, integrating both ecosystem services into forest management decision-making. The Faustmann model and dynamic programming were applied to determine the optimal rotation periods and Land Expectation Value (LEV) under two scenarios: exclusive timber production and combined timber and carbon production. The results indicate that mixed forests consistently outperform monocultures in terms of profitability, especially in 25%-75% mix configurations and moderate densities (2000 trees/ha). The inclusion of the economic value of carbon increased the LEV and extended the optimal rotation periods, confirming the relevance of integrating ecosystem services into forest planning. These findings suggest that mixed native forests represent a competitive and sustainable alternative to monocultures, contributing to climate change mitigation and income diversification for forest owners.
Keywords:
forest management
; native forests
; carbon sequestration
; profitability
; Faustmann model
1. Introduction
The increase in the concentration of carbon dioxide (CO2) in the atmosphere in recent decades and its consequences for the environment are a constant concern worldwide [1]. The high concentration of CO2 in the atmosphereincreases the greenhouse effect and, consequently, contributes to global warming [2,3]. In response to concerns about global climate change and its effects, the vast majority of countries have set targets and signed commitments linking actions that seek to mitigate and reduce environmental problems [4] . In particular, in 2020 Chile updated itsNationally Determined Contribution (NDC) commitments, highlighting its commitment to the sustainable management and recovery of 200,000 hectares of native forests, representing GHG removals of around 100,000 hectares by 2030, increasing its 2015 commitment by 100,000 hectares. In this scenario, forests play an important role in mitigating these environmental problems [5,6] . In Chile, areas of secondary growth forests, especially those distributed in southern Chile, contribute significantly to carbon reserves [7,8].
Although forest plantations cover only 3% of the world's forest area [9], they contribute significantly to global roundwood production, accounting for around 33% [10]. Despite their high profitability and relatively simple management, most plantations are managed as pure monocultures, which makes them vulnerable to insect pests and forest fires, resulting in low levels of biodiversity and a reduction in the diversity of ecosystem services [11,12]. For this reason, the study of Chilean native forests is crucial to improving forest sustainability. These forests are estimated to be more productive in terms of wood quality and soil care, better at mitigating natural risks, promoting biodiversity, and offeringawider range of ecosystemservices compared to monocultures [13,14]. In addition, mixed forests have emerged as a promising alternative for improving carbon sequestration rates, surpassing those of monocultures [15,16].
Mixed forests are more heterogeneous than monoculture plantations due to the interdependence between tree species. In Chile, these woodlands are owned by small forest owners.
Our study focused on the southern zone of Chile, specifically the Araucanía and Lake regions, as these regions have second-growth forests that are suitable for forest management activities. In the Araucanía region, there’s an area of 1,045,619 hectares, representing 33% of the region's total, with Roble, Raulí and Coigüe being the dominant forest types, and in the Los Lagos region, there is an area of 2,791,762 hectares, representing 58% of the region's total. Most of the legally harvested timber production in this area is used for wood energy (firewood), products for construction and high-value furniture, and a smaller proportion for export [17]. The importance of these forests lies in the quality of their wood, their tremendous capacity for ecosystem services, and their great potential as carbon sinks. The area of nativeforest in Chile covers 14.73 million hectares (14,737,486 ha), so the implementation of research projects that enable scientific advances in estimating and determining profitability, taking into account timber production and carbon sequestration, allows us to provide efficient tools for estimating the stock of this type of forest.These tools will provide greater certainty and clarity regarding the profitability and carbon fixation and sequestration levels of forests, which is now highly essential [6,18] .
There are different models that allow us to estimate carbon capture in native forests in Chile [19,20,21,22], based mainly on species growth models (but few have sought to clearly demonstrate the profitability of harvesting native timber in Chile and the maximum benefit of its ecosystem services, especially carbon sequestration [7] . In this regard, one approach that allows for the integration of multiple criteria and constraints is dynamic programming, a tool that has been used in forest management for several decades for the optimal schedulingof silvicultural treatments at equal ages, including the definition of intermediate treatments and optimal forest rotations, in addition to the expected value of the land [23].
The main objective of this research is to determine the optimal rotation cycles and evaluate the financial profitability expressed through the Land Expectation Value (LEV) of the Roble-Raulí-Coigüe and Evergreen forest types in the southern macro zone of Chile, integrating timber production and the ecosystem service of carbon capture. The hypothesis is that the inclusion of economic benefits derived from the voluntary carbon market, under the Faustmann model, allows the management of mixed second-growth forests to achieve higher land values than those obtained through traditional forest management, positioning them as a competitive and sustainable alternative to other land uses.
2. Methodology
Land value (LV) values were calculated for mixed roble-raulí and coigüe forests, as well as for evergreen forests, considering both timber production alone and the combined production of timber and carbon sequestration. We applied Faustmann models [22] to determine the optimal forest management strategies for both forest types.
2.1. Data on Roble-Raulí-Coihue and Evergreen Forests.
The data were recorded between 2001 and 2020 and correspond firstly to an oak-raulí-coihue forest in the Malleco National Reserve, located in the Araucanía region, and secondly to an evergreen forest in Tagua Tagua Park, located in the Los Lagos region of Chile (Figure 1).
Figure 1.
Study area.
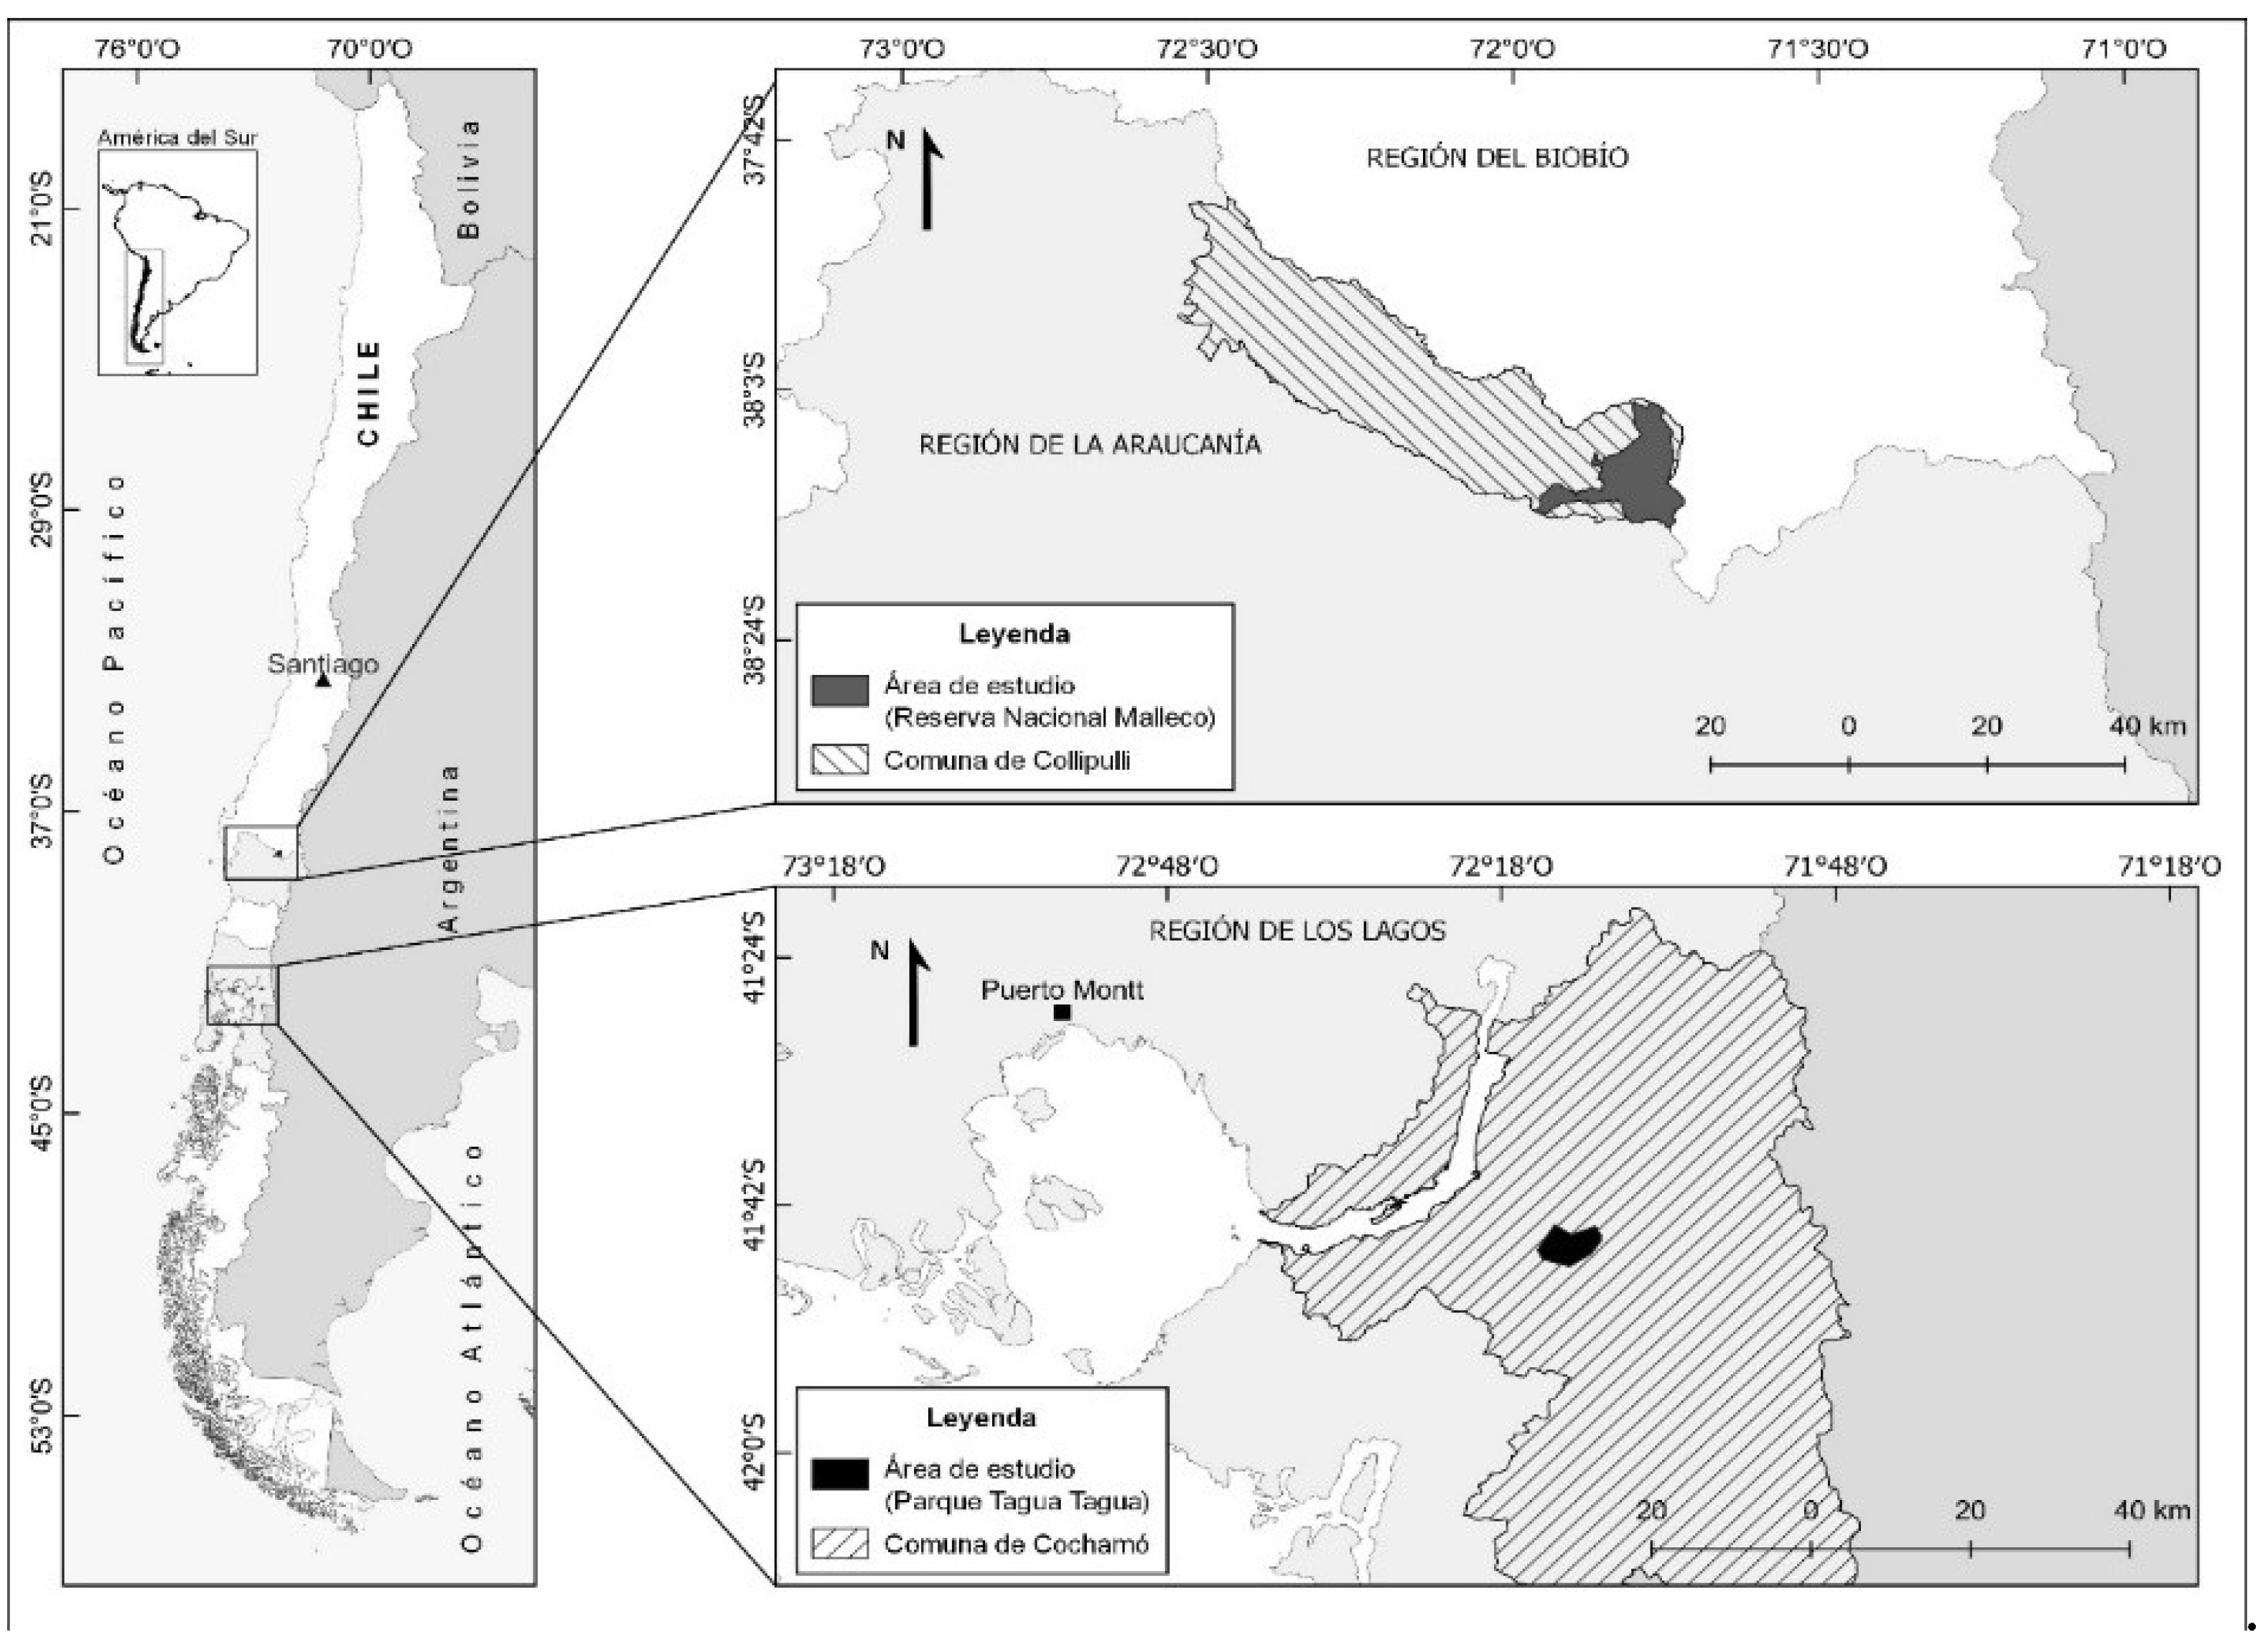
In both study areas, the data correspond to nine permanent sampling plots (PSPs) per study area, each measuring 35 x 35 metres, which allow for the measurement of actual growth over time (dynamic analysis).
The selection of areas for the establishment of permanent plots was based on a stratified systematic sampling design, covering variations in land productivity (site). This ensures that the biomass and carbon data obtained are statistically representative of the total area, minimising sampling error and allowing cash flow projections for the calculation of the LEV with a 95% confidence level.
The forest growth model was obtained through dynamic programming. This model was defined as distance-independent, i.e., it does not consider the spacing between individual trees or their relative positions within a forested area. The programmed model uses individual stands as the basic projection unit. As they are self-calibrating, they coincide with the growth rates measured for each species under study, according to the input database. As a result, a model with these characteristics has the ability to adapt to species and local conditions [21].
The temperate forests of South America (especially in Chile and Argentina) are considered "sleeping giants" in the fight against climate change. Although they cover a smaller area than the Amazon, their storage capacity per hectare is, in many cases, higher. Recent studies have revealed surprising data about these forests in comparison with tropical forests [24].
The Roble, Raulí and Coigüe (Nothofagus) forests, dominated by species of the Nothofagus genus, are emblematic of south-central Chile and southwestern Argentina. Their ecological and economic importance lies in their rapid growth (especially the young forests) that produce high-quality wood and in their ability to provide critical ecosystem services such as water regulation in mountainous areas and habitat for unique species. As they are relatively fast-growing species in their early stages (young forests), they have a very high annual carbon capture rate of between 290 and 480 tonnes/ha.
Evergreen forests are more complex and biodiverse, characteristic of areas with high rainfall (Valdivian rainforest). They include species such as tepa, olivillo, ulmo and arrayán. Their importance lies in their multi-layered structure (several layers of vegetation), which allows for a higher density of biomass per square metre. Unlike deciduous forests, its carbon potential stands out because it maintains its photosynthetic capacity (and therefore its capture capacity) throughout most of the year due to lower temperature variations and the persistence of its foliage.
When assessing profitability, the aim is to determine whether the sustainable management of these two forest types is a financially viable option and potentially more attractive than conventional practices.
2.2. The Economic Model.
The expected value of land (LEV) was calculated to measure profitability. To model timber production alone, we expanded the well-known Faustmann model [27] described by Moeller et al [25], which allows for the inclusion of mixed or native Chilean second-growth forests of the same age, incorporating the relationships between tree species in the mixed stand. This equation defines the optimal rotation as the useful life of the forest for which the present value of the underlying investment achieves a maximum value, taking into account the land rentand subsequent reforestation. Samuelson [26] proposes that this land rent can be introduced in two different ways: by assuming the existence of an infinite series of rotation cycles, or by explicitly introducing land rent into the correspondingequation. Following the first approach, and including thevalue of carbon sequestration (carbon stored in the stem and above-ground biomass), the optimal rotation is the age at which the expected value of the land (LEV) reaches a maximum. LEV is calculated as follows:
Therefore:
where tk is the harvest age in each rotation z, NPVz is the net present value in each silvicultural management activity and the income generated from the sale of timber and carbon credits (see Eq. (2)). The number of selective cuts before a new coppice cycle (z) begins can vary between 1 and 2.
The possible rotation ages considered (tk ) are different for the Ro-Ra-Co forest type (40-60 years) and the evergreen forest type (35-70 years). REz is the sum of r discounted carbon sequestered in biomass and released afterwards. Finally, T is the optimal forest cycle (sum of the different rotations until the removal of old trees via selective cutting and cutting of standing dead trees). The following expressions detail the elements of the equation:
where I(tk ) corresponds to the total income obtained in year tk as a result of the timber harvested in each selective cut, K represents the cutting costs, G represents the annual general management costs, and Yj is the sum of the silvicultural treatments. The last term, Ic(tj), reflects the income discounted for carbon sequestration. This income is the sum of the annual growth of above-ground biomass ( V bj) multiplied by the price of carbon (Pc). Biomass is calculated as the product of annual production. The growth in wood volume ( V(tj)) and three parameters: wood density (r), carbon content (Cc), and biomass expansion factor (f). The discount rate is represented by i and is expressed in the equation to obtain wood and carbon benefits. Finally, modifications to some terms in equation (2) were introduced depending on the growth period.
The carbon released during harvesting is calculated (Eq. (3)) for each year after harvesting (REi ): biomass carbon (BCr) is multiplied by the carbon price (Pc) and by a parameter p, which varies according to the amount of carbon released and is a function of three possibilities (x): carbon stored in products, carbon re-emitted when biomass is burned, and carbon re-emitted in the 50 years following harvest. Finally, REz is the present value of the annual carbon released and discounted in the future.
The expected value of the land was determined using the Van Kooten et al. [28] model,which includes carbon benefits. This model determines the impact of carbon prices on optimal forest management, assuming that the owner receives a subsidy for the amount of carbon sequestered by trees as the forest mass continues to grow,in addition to considering taxes collected at the time of harvest and due to the decomposition of forest products, which represent the cost of releasing carbon into the atmosphere. Therefore:
Here, Pcis the price of carbon and ΔQcis the change in the amount of carbon at a given moment between two periods; taxcis a penalty for carbon released into the atmosphere due to the decomposition of forest products; α is a conversion factor that converts m³ of wood volume into milligrams of stored carbon; β is a factor representing the proportion of wood that does not decompose but sequesters carbon in the long term in long-lasting wood products [28]. Since our analysis included both net timber revenues and payments for carbon sequestration, the final model used in this study is represented by equation (5), an extension of Hartman's model [29].
While price fluctuations within the EU Emissions Trading Scheme are not new, the current 31-month low of just over €50 per tonne was used as the average value for this study. Since January 2024, prices have experienced a sharp decline, from approximately €84 per tonne to as low as €52 [30].
According to Hillier and Libiermann [31],dynamic programming problems can be solved using a backward recursive method, a procedure that starts at the penultimate stage and searches for the best decision, the one that leads to the best value of the objective function at the last stage. Next, through an iterative procedure, the process can be repeated from the current stage once more until the initial state is reached with all the partial solutions chained together pointing to the best overall solution. Using the notation introduced above, for a stage z, the expected value of the terrain can be represented as:
whereis the expected value of the land corresponding to stage z, while LEV*refers to the optimal expected value of the land at stage z + 1, i is the discount rate, and tk represents the length of time between stages.
2.3. Simulation Scenarios, Economic Data and Carbon Management Specifications
This study was based on two Chilean forest types with characteristics typical of native South American forests, namely roble, raulí and coigüe (RoRaCo) forests and evergreen forests.
Simulations were carried out using three different planting densities: 1600, 2000 and 3000 trees per hectare. This approach allowed us to facilitate a comprehensive comparison covering low, medium and high planting density scenarios. It should be noted that these chosen planting densities coincide with those documented in the literature [32].
In order to ensure natural regeneration dynamics and represent all possible scenarios for this type of forest using this model, three planting mix ratios were proposed according to the dominant species of each forest type under study, based on the methodology proposed by Moeller et al [25].Thus, for the RoRaCo (roble-raulí-coigüe)forest type,the proportions were:100% roble,75% roble (Ro) – 25% others (O),50% roble (Ro) – 50% (others).Thus, in the case ofthe Evergreen forest type, wehave:100% Tepa (Te);75% Tepa (Te)– 25% Others (O);50% Tepa (Te)– 50% Others (O).
Volume estimates for regrowth rotations in both forest types were based on the production of native Chilean species and considering fixed percentage discounts, regardless of site quality. These discounts are 15% less for both regenerations.
Three scenarios were simulated with the FVS for both forest types. All scenarios involved stands established on soil with second-growth forests, i.e. areas available after fires and natural regeneration, and areas with scrub susceptible to manual clearing, and were modelled over a period of 100 years. All simulated scenarios generated results that included timber production (sawlogs and pulpwood) and carbon sequestration at the forest stand level.
The prices of native wood of the roble-raulí and coigüe forest types used in the calculations were €239/m³ ( ) for sawlogs, €480/m³ for sawn wood and €422/m³ for dimensioned wood, while the prices for evergreen forest types were €197/m³ for logs for sawing, €461/m³ for sawn timber and €396/m³ for dimensioned timber [33].
The costs of establishing stands were €970/ha for land preparation and €0.61/seedling for planting [34]. Given that sequestered carbon can be sold through various programmes, each with different prices, this study used the average price ranging from €48 to €87 per metric tonne [35]. It is assumed that carbon prices are net of certificationor other costs associated with carbon management.
For the calculation of carbon taxes presented in equation (3), the amount of carbon in 1 m³ of wood, denoted as α, is 0.2865 (tonnes/m³). It is also assumed that the percentages of carbon released back into the atmosphere through the decomposition of forest products, denoted as β, are 20% in logs for sawing, 90% in sawn timber and 100% in dimension timber [36]. Furthermore, we assume that carbon is not permanently stored in other carbon sinks, such as soil or undergrowth vegetation.
The total carbon captured annually was calculated considering a basic wood density of 0.52% for the RoRaCo forest type (roble-raulí-coigüe) [37]. The density varies between 0.55 and 12% for nativeforests in southern Chile [38], and for the Evergreen forest type, an averageof 0.44% was used. To calculate the carbon content of each species, models adjusted by Moreno et al [22] were used. Only above-ground carbon (carbon at the trunk or stem level and above-ground biomass) was calculated. To calculate the carbonassociated with the biomass surface area, the volume of the trunk or stem is first estimated and then this value is multiplied by a biomass expansion factor. The biomass factors are set at 1.37 for RoRaCo forest types and 1.27 for evergreen forest types [39].
3. Results
3.1. Wood Production
Pure stands of Nothofagus obliqua (Roble) and Laureliopsis philippiana (Tepa) had a significantly lower wood volume compared to mixed stands (p < 0.05; Figure 2). This behaviour was observed in both the Roble-Raulí-Coigüe and Evergreen forest types during the initial evaluation period. However, after 60 years, growth stabilised in all stand types, maintaining a constant increase with no statistically significant differences between the different species compositions.
The highest growth and volume productivity rates were recorded in mixtures with 25% of the main species (N. obliqua for the Roble-Raulí-Coigüe type and L. philippiana for the Evergreen type). In comparative terms, the Roble-Raulí-Coigüe forest type exhibited slightly higher productivity than the Evergreen type. In terms of stand density, stands with 2000 trees per hectare had the highest growth rates. At densities of 3000 trees per hectare, optimal growth was achieved between 40 and 45 years, while stands with lower densities (1600 trees per hectare) required a longer period, between 50 and 55 years, to match the timber volume of denser plantations.
3.2. Carbon Sequestration
The quantification of carbon sequestered for both forest types and their respective planting densities is presented in Figure 3. When comparing the values derived from species-specific functions against the universal standard function [7], it was observed that the productivity of mixed stands was lower than the projections of the adjusted models. This difference indicates that species substitution and the densities evaluated had a negative effect on the actual carbon capture capacity of the forest stand, which did not reach the initially estimated potential productivity levels.
Mixed stands outperformed monocultures in carbon sequestration rates in all scenarios evaluated, suggesting a complementary interaction between species. Specifically, the 25%-75% mixture configuration recorded the highest carbon capture levels per hectare in both forest types, despite having a lower total wood volume compared to other structures. In terms of density, a direct relationship with carbon capture was observed: stands with 1600 trees per hectare showed a significantly lower sequestration capacity than those with higher densities. Finally, the Roble-Raulí-Coigüe forest type demonstrated a higher carbon capture capacity than the Evergreen type under the same simulation conditions.
The Land Expectation Value (LEV) analysis based exclusively on timber production revealed significant differences between forest types and stand configurations. In general terms, the Roble-Raulí-Coigüe (RoRaCo) forest type showed consistent economic superiority over the Evergreen type at all discount rates evaluated.
For both forest types, the configuration that maximised capital yield, was a mixture of 25% main species and 75% secondary species, associated with a density of 2000 trees per hectare. In the RoRaCo type, this configuration allowed financial maturity to be reached in shorter rotation periods (between 44 and 57 years) compared to monocultures, which required periods of more than 50 years to maximise their individual volume.
3.3. Profitability of Timber Production
The inclusion of the carbon capture ecosystem service using the Hartman model generated a generalised increase in maximum LEV values (Table 1). Under this combined production scheme:
A shift in financial maturity was observed, extending the optimal harvest cycles compared to the timber-only scenario.
Although timber income remains the main determinant of total economic value, the increase in the price of carbon had a more pronounced impact on the LEV of roble and tepa monocultures than on mixed stands. However, mixed stands remained more profitable at all interest rate levels.
The results show that rotation time is a determining factor in final profitability. At higher discount rates (8% and 12%), the productive advantage of certain monocultures—which generate higher total volumes but require an additional 8 to 12 years of growth—was offset by the financial cost of time.
In contrast, mixed stands proved to be more resilient to interest rate variations, maintaining positive and competitive NPV values. The higher carbon fixation rates observed at densities of 2000 trees/ha allowed for earlier generation of marketable income compared to lower population density stands.
The results indicate that the roble component outperformed tepa in terms of carbon sequestration capacity, a difference that was more pronounced than that observed in wood volume (Figure 2).
3.4. Profitability of Combined Timber Production and Carbon Sequestration
The integration of carbon sequestration into the economic valuation increased the maximum LEV values and extended the optimal rotation periods compared to the scenario of exclusive timber production (Table 2).
The integration of ecosystem services using the Hartman model [40] resulted in an overall increase in economic and operational indicators compared to the exclusive timber production scenario. Specifically, the maximum LEV values, the duration of the optimal rotation periods and the optimal planting densities were higher under the combined production scheme of timber and carbon.
Under this combined production scheme, mixed stands maintained higher profitability than monocultures at all interest rate levels evaluated. For both forest types, the inclusion of carbon credits shifted the optimal harvest time to later ages, maximising total economic value. As in the simple production analysis, the most economically efficient configuration was a 25%-75% mix with a density of 2000 trees per hectare.
In this scenario, mixed stands remained more profitable than monocultures. The application of incentives for carbon sequestration and taxes on carbon release shifted financial maturity, extending rotation cycles to maximise the total economic benefit derived from both products.
4. Discussion
4.1. Profitability of Timber Production
The economic superiority of mixed stands over monocultures observed in this study suggests that niche complementarity and facilitation between species optimise resource use, resulting in greater financial profitability (LEV). This finding is consistent for both forest types (Nothofagus and Evergreen), where the 25%-75% mixture configuration demonstrated greater economic resilience to variations in discount rates (4%, 8% and 12%).
From a forest management perspective, these results challenge the traditional preference for forest simplification schemes. The higher productivity of mixtures not only favours marketable volume, but also mitigates the impact of high interest rates, offering higher returns than those of monocultures of dominant species. This reinforces the hypothesis that structural and specific diversity in the forests of southern Chile act as a driver of productive and financial efficiency.
Pinnschmidt et al. [41] argue that mixed species plantations, specifically in Costa Rica, offer a competitive alternative to monocultures, outperforming them incosts from as much as €3036 to €14573 when considering both wood and carbon.
Contrary to the findings of Manuschevich [42], who attributes the low profitability of native forests to logistical constraints, deficiencies in wood quality and land fragmentation, the results of this study show that, under optimal mixing schemes, native forests have competitive economic potential. However, when compared to fast-growing plantations, a significant gap remains: while rotation periods of more than 50 years were estimated for the Roble-Raulí-Coigüe type, simulations of Pinus radiata and Eucalyptus spp. monocultures achieve higher LEV values in significantly shorter cycles (30 years) at a rate of 8% [43].
A fundamental explanation for the disparity in LEV values lies in the chronological lag in the production of high-value wood. Unlike fast-growing exotic species plantations, which reach sawlog dimensions in rotations of approximately 30 years, the mixed stands of native species evaluated in this study require longer periods to produce wood of similar commercial quality. This difference in productive precocity gives traditional monocultures a comparative economic advantage under short-term financial valuation criteria [44].
However, this time gap suggests that the competitiveness of mixed stands of roble or tepa should not be measured under the same rotation standards as pioneer or introduced species. The profitability observed in the 50- to 60-year scenarios indicates that, although the return is delayed, the mixed structure optimises biomass accumulation and long-term stem quality, which could compensate for the lower initial growth rate by providing higher value-added products or additional ecosystem services.
The results obtained only confirm that Chile's mixed native forests are more profitable than establishing monocultures with native species appropriate to each forest site. For example, if we compare our results, we see that the simulation of monocultures for the RoRaCo forest type has lower profitability values than the simulations of monocultures for the evergreen forest type.
It can be seen that at an interest rate of 4%, the maximum LEV for an evergreen forest monoculture plantation with a density of 2,000 plants/ha was €5,547/ha, with an optimal rotation of 61 years. In contrast, the maximum LEV for a monoculture plantation of the RoRaCo forest type with 2000 plants/ha was €4632/ha, with an optimal rotation of 67 years. However, the maximum LEV optimum is achieved for a mixed plantation simulation of the RoRaCo forest type, with a density of 2000 plants/ha, a 25%-75% mix, which was €9857/ha, with an optimal rotation of 53 years.
Conversely, the transition to a mixed scheme (500 plants per hectare of roble and 1,500 of other species) optimises economic performance, raising the LEV from €4,387/ha to €5,211/ha. This improvement suggests that a lower density of the target species, complemented by accompanying species, reduces direct competition and favours the production of larger individuals.
In this sense, mass diversification not only meets ecological objectives but also functions as a management strategy to maximise the volume of high-value sawn timber, overcoming the production limitations observed in dense monocultures.
Similar results regarding the higher productivity levels of tropical mixed plantations compared to monocultures were also reported in studies by Ameray et al. [45], Nolte et al. [46] and Pinnschmidt et al. [41]. This finding is consistent with that documented by Deegen et al. [47], who observed that the integration of Betula pendula did not affect the productivity of medium-density Picea abies monocultures but, on the contrary, increased their potential land use value (LEV).
4.2. Profitability of Combined Timber Production and Carbon Sequestration
The influence of ecosystem services on forest planning is evident when observing the lengthening of harvest cycles. Our results coincide with those proposed by Moreno et al. [7], reaffirming that the inclusion of economic values for carbon capture acts as an incentive to postpone final felling, allowing the stand to continue to function as a reservoir for longer.
It was observed that the optimal rotation length increased more frequently in mixed stands when carbon was valued at €50/t, with an average increase of 5 years. This phenomenon is explained by the ability of mixed stands (especially those of the Roble-Raulí-Coigüe type) to maintain sustained growth rates over time, where the marginal income from carbon sequestration offsets the opportunity cost of not harvesting the wood. In the case of monocultures intended for log wood, sensitivity to high carbon prices was even more pronounced. In various scenarios, the value of carbon increased optimal rotation lengths by more than 5 years.
Price and Willis [48] observed an apparent difference between lower and higher carbon values, as the upper limit of their carbon pricing led to rotation extensions of more than 30 years. It is important to note that Price and Willis adopted much higher carbon prices than ours. They used a range of £80–200 per tonne (€91–113 per tonne). This comparison indicated that the inclusion of carbon values only lengthens rotations when these are sufficiently high.
We should note that the model by van Kooten et al. [28], used in our analysis, is a theoretical framework that seeks to assess the impact of carbon markets on the optimal forest management of forest lands. Consequently, it may not be perfectly compatible with existing carbon market mechanisms, such as the voluntary carbon market programme. Our model starts from the assumption of unexploited land and attempts to mimic the concept of additionality. However, it does not consider certain assumptions, such as certification costs (e.g., management, monitoring, and compliance), which are essential for improving the effectiveness of environmental policies [49]. These costs can hinder the development of carbon projects [50]. Integrating these costs into our analysis would likely produce variations in profitability and optimal harvestage.
In our study, we simulated selective cutting or thinning operations. Thinning can mitigate density-related effects on forest stand development by reducing density and competition.
Although Willis et al. [51] empirically investigated the impacts of thinning on mixed forest stands in the southeastern United States, their findings did not allow for a generalisable statement. In mixed forest stands, the complexity of forest management is further intensified. In these cases, forest managers must decide not only on the basic aspects ofplanting, but also on the optimal mix and composition of tree species, which can vary depending on combinations of trees, rows, or groups. In addition, the greater heterogeneity of mixed stands leads to more ambiguous qualitative analytical results [52]. Ourapproach allowed us to isolate the effect of mixture proportions and rotation lengths. Furthermore, our main objective was to provide information on the impact of mixture proportions on the profitability of forest stands.
5. Conclusions
This study demonstrates that the management of secondary forests of the Roble-Raulí-Coigüe and Evergreen forest types is an economically viable and competitive alternative in southern Chile.
The simulations show that mixed plantations of native species (Roble–Raulí–Coigüe and Evergreen) have significantly higher land expectancy values (LEV) than monocultures, especially under 25%-75% mixture schemes and moderate densities (2000 trees/ha). This confirms that structural diversity optimises resource use and improves economic efficiency.
The integration of payments for carbon ecosystem services acts as a financial catalyst, not only increasing final profitability but also extending optimal rotation periods. This allows forest owners to produce higher quality and larger timber without sacrificing economic viability.
The heterogeneity in the results obtained through the various scenarios analysed underscores the urgency of adopting a comprehensive forest management paradigm. The data suggests that the economic viability of native forests should not be limited to conventional timber yields; on the contrary, it requires a diversified income matrix that incorporates non-timber forest products (NTFPs), ecosystem services through carbon credits, and restoration subsidies. In this context, land use planning and the formation of productive clusters emerge as critical mechanisms for mitigating the competitiveness gap observed in relation to monocultures of exotic species.
We conclude that dynamic programming is an effective tool for decision-making in complex ecosystems, allowing the identification of management strategies that simultaneously maximise economic benefit and climate change mitigation.
Our findings validate the potential of young forests to meet Chile's NDC 2030 targets. Providing estimation tools that integrate carbon and timber provides the legal and financial security necessary for small and medium-sized landowners to transition from degraded forest use (mainly wood energy) to high-value forest management.
References
- Crowther, T.; Glick, H.; Covey, K. Mapping tree density at a global scale. Nature 2015, 525, 201–205. [Google Scholar] [CrossRef]
- Achard, F; Beuchle, R; Mayaux, P; Stibig, HJ; Bodart, C; Brink, A; Carboni, S; Desclée, B; Donnay, F; Eva, HD; Lupi, A; Raši, R; Seliger, R; Simonetti, D. Determination of tropical deforestation rates and related carbon losses from 1990 to 2010. Glob Chang Biol. 2014, 20(8), 2540–54. [Google Scholar] [CrossRef] [PubMed] [PubMed Central]
- Coomes, D A; Dalponte, M; Jucker, T; Asner, G P; Banin, L F; Burslem, D F R P; Lewis, S L; Nilus, R; Phillips, O L; Phua, M-H; Qie, L 2017. Area-based vs tree-centric approaches to mapping forest carbon in Southeast Asian forests from airborne laser scanning data'. Remote Sensing of Environment vol. 194, 77–88. [CrossRef]
- Borelli, S.; Conigliaro, M.; Di Cagno, F. Urban forests: a global perspective; FAO: Rome, 2023. [Google Scholar] [CrossRef]
- Cansino, JM; Moreno, R. ¿Importan los bosques en relación con los compromisos internacionales de reducción de CO₂ de Chile ? Un enfoque de descomposición multinivel. Carbon Management 2018, 9(1), 9–24. [Google Scholar] [CrossRef]
- Ruiz-Peinado, R.; Bravo-Oviedo, A.; López-Senespleda, E.; Bravo, F.; Del Río, M. Gestión forestal y secuestro de carbono en la región mediterránea: Una revisión. Forest Systems 2017, 26(2), eR04S. [Google Scholar] [CrossRef]
- Moreno, N.; Moreno, R.; Molina, J.R. Optimal harvest cycle on Nothofagus forests including carbon storage in Southern America: An application to Chilean subsidies in temperate forests. Land Use Policy 2019, Volume 81, 705–713. [Google Scholar] [CrossRef]
- Biodiversidad y cambio climático en Chile: Evidencia científica para la toma de decisiones. In Informe de la mesa de Biodiversidad; Marquet, P.A., Altamirano, A., Arroyo, M. T. K., Fernández, M., Gelcich, S., Górski, K., Habit, E., Lara, A., Maass, A., Pauchard, A., Pliscoff, P., Samaniego, H., Smith-Ramírez, C., Eds.; Comité Científico COP25: Santiago; Ministerio de Ciencia, Tecnología, Conocimiento e Innovación, 2019. [Google Scholar]
- FAO Global Forest Resources Assessment. Main report; 2020. [Google Scholar] [CrossRef]
- Jürgensen, C.; Kollert, W.; Lebedys, A. Assessment of industrial roundwood production from planted forests. FAO Working Paper No. 48. Rome. Available at. 2014. Available online: https://www.fao.org/3/i3384e/i3384e.pdf (accessed on 03 February 2026).
- Bowyer, J. Forest plantations — threatening or saving natural forests? Arborvitæ 2006, 31, 8–9. [Google Scholar]
- Horak, J.; Brestovanska, T.; Mladenovic, S.; Kout, J.; Bogusch, P.; Halda, J.; Zasadil, P. Green desert?: biodiversity patterns in forest plantations. For. Ecol. Manag. 2019, 433, 343–348. [Google Scholar] [CrossRef]
- Ching, Lui C.; Kuchma, O.; Krutovsky, K. Mixed-species versus monocultures in plantation forestry: development, benefits, ecosystem services and perspectives for the future. Glob Ecol. Conserv. 2018, 15, e00419. [Google Scholar]
- Willis, J.; Blazier, M. Competition intensity varies with hardwood species identity and constrains stand-level productivity in southeastern pine–hardwood mixtures compared to loblolly pine monocultures. Can. J. For. Res. 2022, 52, 1439–1458. [Google Scholar] [CrossRef]
- Richards, A.; Forrester, D.; Bauhus, J.; Scherer-Lorenzen, M. The influence of mixed tree plantations on the nutrition of individual species: a review. Tree Physiol. 2010, 30, 1192–1208. [Google Scholar] [CrossRef]
- Chomel, M.; desRochers, A.; Baldy, V.; Larcheveque, M.; Gauquelin, T. Nonadditive effects of mixing hybrid poplar and white spruce on aboveground and soil carbon storage in boreal plantations. for. Ecol. Mang 2014, 328, 292–299. [Google Scholar] [CrossRef]
- Altamirano, A.; Schlegel, B.; Thiers, Ó.; Miranda, A.; Pilquinao, B.; Orrego, R.; Rocha, C. Disponibilidad y potencial energético de la biomasa del bosque nativo para el desarrollo de la dendroenergía en el centro-sur de Chile. Bosque (Valdivia) 2015, 36(2), 223–237. [Google Scholar] [CrossRef]
- Quintero-Méndez, M.A.; Jerez-Rico, M. Optimizing thinnings for timber production and carbon sequestration in planted teak (Tectona grandis L.f.) stands. For. Syst. 2019, 28, 1–14. [Google Scholar] [CrossRef]
- Cruz, P.; Bascuñan, A.; Velozo, J.; Rodríguez, M. Funciones alométricas de contenido de carbono para quillay, peumo, espino y litre. Bosque 2015, 36, 375–381. [Google Scholar] [CrossRef]
- Díaz, B.D.; Velásquez, L.F. Análisis de captura de carbono en seis especies forestales nativas (3 esciofitas-3 heliofitas) plantadas con fines de restauración en el Parque Ecológi- co La Poma (PEP) -sabana de Bogotá – Colombia. Rev. Mutis 2015, 5, 46–54. [Google Scholar] [CrossRef]
- Crookston, N.; Dixon, G. The forest vegetation simulator: a review of its structure, content, and applications. Comput. Electron. Agric. 2005, 49, 60–80. [Google Scholar] [CrossRef]
- Moreno-García, N.; Herrera, M.A.; Caraciolo, L.R. Modelo para Calculo Estimación del Carbono en Tipo Forestal Roble-Raulí-Coigüe en la Reserva Nacional Malleco - Chile. Árvore 2011, 35, 1299–1306. [Google Scholar] [CrossRef]
- García, M.E. Integración de la conservación de la biodiversidad en la gestión forestal mediante el empleo de técnicas basadas en la programación matemática. Una aplicación en el sistema central. Doctoral dissertation, Universidad Politécnica de Madrid, 2019. [Google Scholar]
- Ledesma, S.G.; Sione, S.M.J.; Ozsust, J.D.; Rosenberger, L.J. Estimación del contenido y captura potencial de carbono en la biomasa arbórea de bosques nativos del Espinal (Entre Ríos, Argentina). Fave. Sección ciencias agrarias 2021, 20(1), 331–345. [Google Scholar] [CrossRef]
- Moeller, J.C.; Susaeta, A.; Deegen, P.; Sharma, A. Profitability analysis of southern plantations through timber alone or timber and carbon integration in pine-sweetgum mixes. Forest Policy and Economics 2024, 161, 103163. [Google Scholar] [CrossRef]
- Samuelson, P. : Economics of forestry in a evolving society. In Economic Inquiry; 1976; Volume 14, pp. 466–492. [Google Scholar]
- Faustmann, M. Berechnung des werthes welchen waldboden sowie noch nicht haubare holzbestande für die waldwirtschaft besitzen. Allgemeine Forst Und Jagdzeitung 1849, 25, 441–455. [Google Scholar]
- Van Kooten, G.; Binkley, C.; Delcourt, G. Effect of carbon taxes and subsidies on optimal forest rotation age and supply of carbon services. Am. J. Agric. Econ. 1995, 77, 365–374. [Google Scholar] [CrossRef]
- Hartman, R. The harvesting decision when a standing forest has value. Econ. Inq. 1976, 14, 52–55. [Google Scholar] [CrossRef]
- Tamellini, Lidia; Marullaz, Jeanne. Carbon pricing done right. Carbon Market Watch 2025, 20p. [Google Scholar]
- Hillier, F.S.; Liebermann, G.J. Operations Research: Einführung; Walter de Gruyter GmbH & Co KG, 2014. [Google Scholar]
- Donoso, P.J.; Promis, A.; Loguercio, G.A.; Attis Beltrán, H.; Caselli, M.; Chauchard, L.M.; Cruz, G.; González Peñalba, M.; Martínez Pastur, G.; Navarro, C.; Núñez, P.; Salas-Eljatib, C.; Soto, D.P.; Vásquez-Grandón, A. Silviculture of South American temperate native forests. New Zealand Journal of Forestry Science 2022, 52. [Google Scholar] [CrossRef]
- Pardo Velásquez, Evaristo. Precios Forestales. Instituto Forestal, Chile. Boletín N° 189. 34p. 2024. [Google Scholar]
- Donoso, P; Navarro, C; D Soto, VGerding.; O Thiers, JPinares.; Escobar, B; Sanhueza, MJ. Manual de plantaciones de raulí (Nothofagus alpina) y coihue (Nothofagus dombeyi) en Chile; Universidad Austral de Chile - Universidad Católica de Temuco: Temuco, Chile, 2015; ISBN 978-956-9412-23-3. [Google Scholar]
- Forest Trends Ecosystem Marketplace, 2021. Market in motion, State of Voluntary Carbon Markets 2021 (Instalment 1). Available online: https://www.forest-trends.org/ (accessed on 03 February 2026).
- Ruiz-Gozalvo, F.; Martin-Fernandez, S.; Garfias-Salinas, R. Characterization of Small Forest Landowners as a Basis for Sustainable Forestry Management in the Libertador General Bernardo O’Higgins Region, Chile. Sustainability 2019, 11(24), 7215. [Google Scholar] [CrossRef]
- Martin, Marjorie; Büchner; Carlos; Sagardia, Rodrigo; Bahamóndez, Carlos; Rojas, Yasna; Guzmán; Felipe; Barrientos, Marco; Barrales; Luis; Guiñez, Rodrigo. Disponibilidad de Madera Nativa en Renovales de Roble – Raulí – Coihue, Regiones de Ñuble a Los Ríos. Instituto Forestal, Chile. Informe Técnico N° 237. P. 74. 2020. [Google Scholar]
- Navarro Cárcamo, Celso; Herrera, Miguel Angel; Drake Aranda, Fernando; Donoso, Pablo J. Diagrama de manejo de densidad y su aplicación a raleo en bosques de segundo crecimiento de Drimys winteri en el sur de Chile. Bosque (Valdivia) 2011, 32(2), 175–186. [Google Scholar] [CrossRef]
- Meneses Retamal, L. Estimación del balance de Carbono de los ecosistemas naturales de Chile continental en el siglo XXI; 2020. [Google Scholar]
- Amacher, G.; Ollikainen, M.; Koskela, E. Economics of Forest Resources; MIT Press: London, England, 2009; p. 397 p. [Google Scholar]
- Pinnschmidt, A.; Yousefpour, R.; Nolte, A.; Hanewinkel, M. Tropical mixedspecies plantations can outperform monocultures in terms of carbon sequestration and economic return. Ecol. Econ. 2023, 211. [Google Scholar] [CrossRef]
- Manuschevich, D. Inversión estatal en investigación y desarrollo forestal frente a la COP-25:¿ Libres de elegir entre bosques nativos y plantaciones exóticas?¿ Libres de elegir entre bosques nativos y plantaciones exóticas? Investigaciones Geográficas: Una mirada desde el sur 2019, (58), 104–118. [Google Scholar] [CrossRef]
- Guerra-Bugueño, E.; Célis-Mosqueira, F.; Moreno-García, N. Efecto de la densidad de plantación en la rentabilidad de plantaciones de Eucalyptus globulus. Revista Chapingo. Serie ciencias forestales y del ambiente 2014, 20(1), 21–31. [Google Scholar] [CrossRef]
- Huerta, J.A.A. Alternativas al manejo productivo agropecuario tradicional. 2021. [Google Scholar]
- Ameray, A.; Bergeron, Y.; Valeria, O.; Montoro Girona, M.; Cavard, X. Forest carbon management: a review of tropical practices and management strategies across boreal, temperate and tropical forests. Curr. For. Rep. 2021, 7, 245–266. [Google Scholar] [CrossRef]
- Nolte, A.; Yousefpour, R.; Cifuentes-Jara, M.; Piotto, D.; Murillo, O.; Zúniga, P.; Hanewinkel, M. Broad-scale and long-term forest growth predictions and management for native, mixed species plantations and teak in Costa Rica and Panama. For. Ecol. Manag. 2022, 520, 120386. [Google Scholar] [CrossRef]
- Deegen, P.; Hung, B.; Mixdorf, U. Economic modelling for different tree species under uncertain temperature trends. Forstarchiv 1997, 68, 194–205. [Google Scholar]
- Price, C.; Willis, R. The multiple effects of carbon values on optimal rotation. J. For. Econ. 2011, 17, 298–306. [Google Scholar] [CrossRef]
- McCann, L.; Colby, B.; Easter, K.; Kasterine, A.; Kuperan, K. Transaction cost measurement for evaluating environmental policies. Ecol. Econ. 2005, 52, 527–542. [Google Scholar] [CrossRef]
- Cacho, O.; Lipper, L.; Moss, J. Transaction costs of carbon offset projects: a comparative study. Ecol. Econ. 88, 232–243. [CrossRef]
- Willis, J.; Gordon, J.; Tanger, S.; Blazier, M.; Self, A.; Brodbeck, A. Managing mixed stands: reassessing a forgotten stand type in the southeastern United States. Forests 2019, 10, 751. [Google Scholar] [CrossRef]
- Coordes, R. Thinnings as unequal harvest ages in even-aged forest stands. For. Sci. 2014, 60, 677–690. [Google Scholar] [CrossRef]
Figure 2.
Volume of wood in forests of the RoRaCo (Ro) forest type - Others (O) and evergreen forest type (Te) - Others (O).
Figure 2.
Volume of wood in forests of the RoRaCo (Ro) forest type - Others (O) and evergreen forest type (Te) - Others (O).
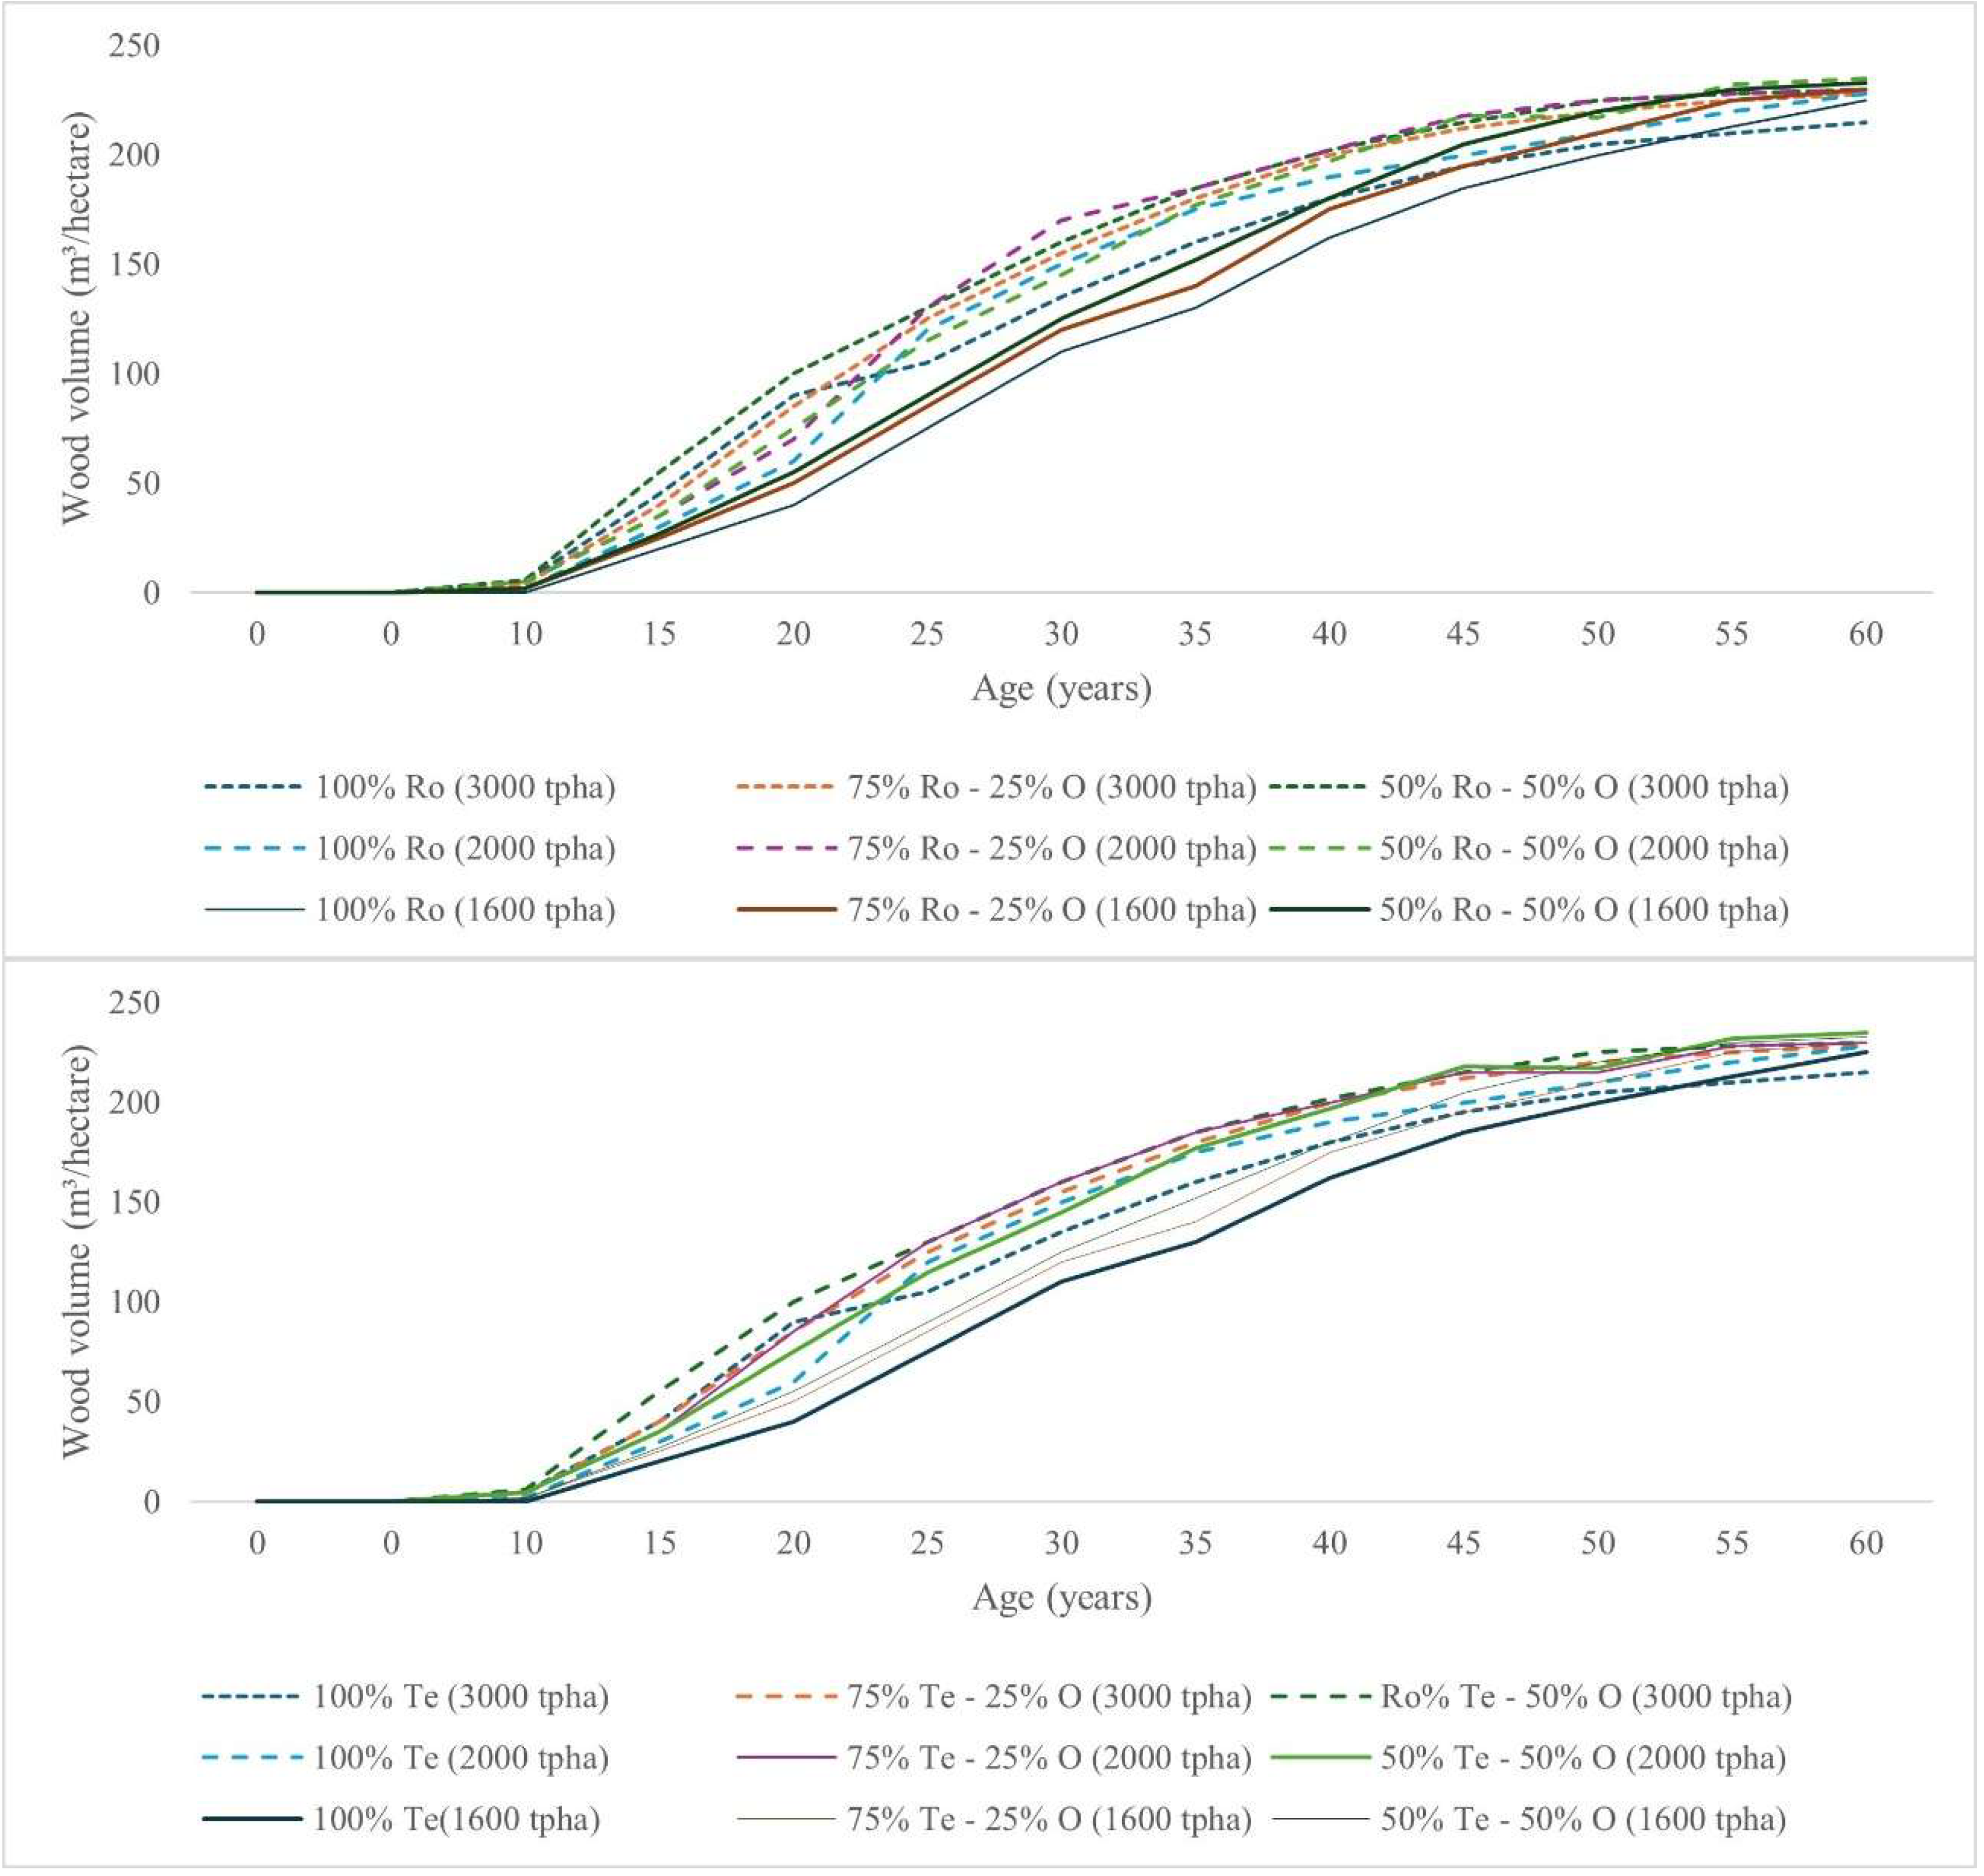
Figure 3.
Analysis of carbon capture capacity among the mixtures and densities proposed for the RoRaCo forest type and the evergreen forest type.
Figure 3.
Analysis of carbon capture capacity among the mixtures and densities proposed for the RoRaCo forest type and the evergreen forest type.
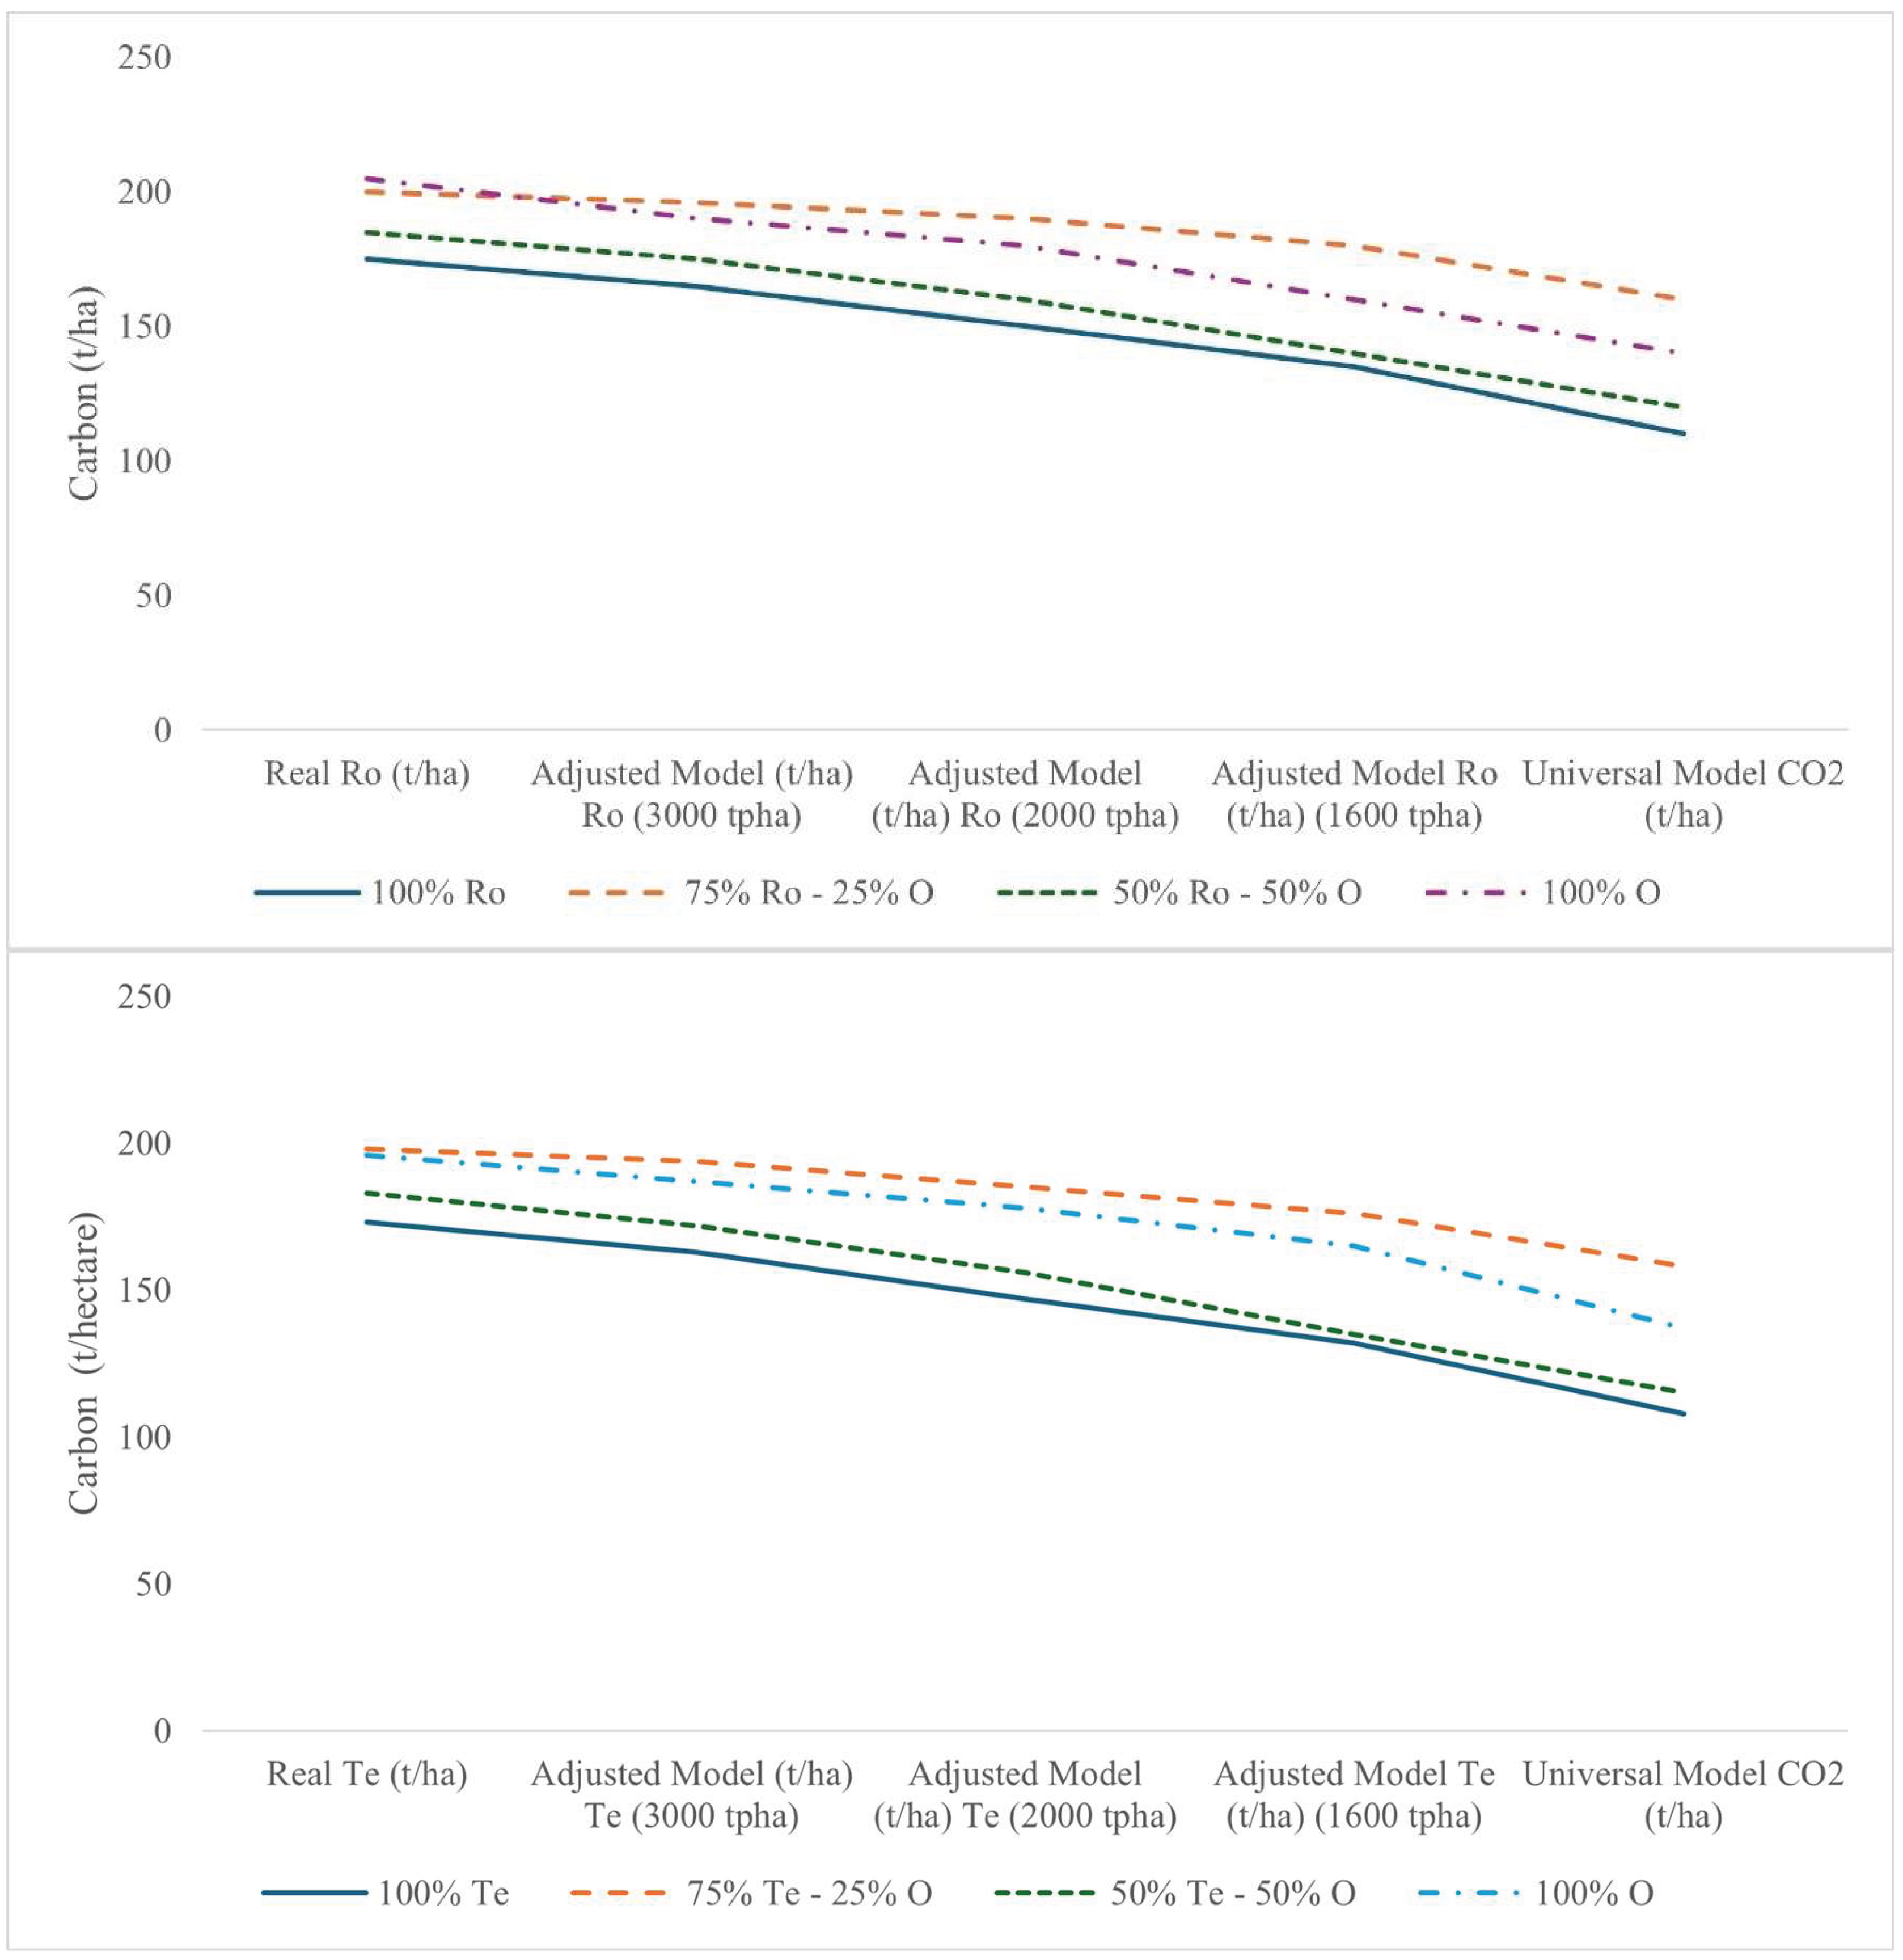

Table 1.
Maximum LEV ($/ha) and optimal rotation duration (years) for different mixtures of RoRaCo forest type and evergreen forest type at interest rates of 4%, 8% and 12% (wood production only).
Table 1.
Maximum LEV ($/ha) and optimal rotation duration (years) for different mixtures of RoRaCo forest type and evergreen forest type at interest rates of 4%, 8% and 12% (wood production only).
| Forest Type Roble-Raulí-Coigüe (RoRaCo) | ||||||||
|---|---|---|---|---|---|---|---|---|
| Rate 4% | ||||||||
| 1600 trees/ha | 2000 trees/ha | 3000 trees/ha | ||||||
| Mixture (trees/ha) | LEV (€/ha) | Optimal rotation (years) | Mixture (trees/ha) | LEV (€/ha) | Optimal rotation (years) | Mixture (trees/ha) | LEV (€/ha) | Optimal rotation (years) |
| 1600 (Ro) | 4563 | 67 | 1600 (Ro) | 4632 | 67 | 1600 (Ro) | 4788 | 68 |
| 400 (Ro); 1200 (O) | 4378 | 52 | 400 (Ro); 1200 (O) | 5012 | 53 | 400 (Ro); 1200 (O) | 5136 | 57 |
| 800 (Ro); 800 (O) | 5149 | 56 | 800 (Ro); 800 (O) | 5179 | 61 | 800 (Ro); 800 (O) | 5201 | 61 |
| Rate 8% | ||||||||
| 1600 trees/ha | 2000 trees/ha | 3000 trees/ha | ||||||
| Mixture (trees/ha) | LEV (€/ha) | Optimal rotation (years) | Mixture (trees/ha) | LEV (€/ha) | Optimal rotation (years) | Mixture (trees/ha) | LEV (€/ha) | Optimal rotation (years) |
| 1600 (Ro) | 5789 | 57 | 1600 (Ro) | 7445 | 58 | 1600 (Ro) | 6488 | 48 |
| 400 (Ro); 1200 (O) | 5379 | 53 | 400 (Ro); 1200 (O) | 9857 | 55 | 400 (Ro); 1200 (O) | 8203 | 47 |
| 800 (Ro); 800 (O) | 4678 | 57 | 800 (Ro); 800 (O) | 7895 | 58 | 800 (Ro); 800 (O) | 6721 | 48 |
| Rate 12% | ||||||||
| 1600 trees/ha | 2000 trees/ha | 3000 trees/ha | ||||||
| Mixture (trees/ha) | LEV (€/ha) | Optimal rotation (years) | Mixture (trees/ha) | LEV (€/ha) | Optimal rotation (years) | Mixture (trees/ha) | LEV (€/ha) | Optimal rotation (years) |
| 1600 (Ro) | 4352 | 41 | 1600 (Ro) | 5612 | 48 | 1600 (Ro) | 4974 | 44 |
| 400 (Ro); 1200 (O) | 4974 | 44 | 400 (Ro); 1200 (O) | 6488 | 48 | 400 (Ro); 1200 (O) | 5947 | 47 |
| 800 (Ro); 800 (O) | 5947 | 47 | 800 (Ro); 800 (O) | 7902 | 51 | 800 (Ro); 800 (O) | 6721 | 48 |
| Evergreen Forest Type | ||||||||
| Rate 4% | ||||||||
| 1600 trees/ha | 2000 trees/ha | 3000 trees/ha | ||||||
| Mixture (trees/ha) | LEV (€/ha) | Optimal rotation (years) | Mixture (trees/ha) | LEV (€/ha) | Optimal rotation (years) | Mixture (trees/ha) | LEV (€/ha) | Optimal rotation (years) |
| 1600 (Ro) | 4785 | 44 | 1600 (Ro) | 5547 | 61 | 1600 (Ro) | 5721 | 46 |
| 400 (Ro); 1200 (O) | 4996 | 45 | 400 (Ro); 1200 (O) | 5964 | 56 | 400 (Ro); 1200 (O) | 5941 | 45 |
| 800 (Ro); 800 (O) | 5474 | 48 | 800 (Ro); 800 (O) | 6643 | 56 | 800 (Ro); 800 (O) | 6582 | 46 |
| Rate 8% | ||||||||
| 1600 trees/ha | 2000 trees/ha | 3000 trees/ha | ||||||
| Mixture (trees/ha) | LEV (€/ha) | Optimal rotation (years) | Mixture (trees/ha) | LEV (€/ha) | Optimal rotation (years) | Mixture (trees/ha) | LEV (€/ha) | Optimal rotation (years) |
| 1600 (Ro) | 4632 | 52 | 1600 (Ro) | 7892 | 51 | 1600 (Ro) | 5941 | 54 |
| 400 (Ro); 1200 (O) | 4378 | 52 | 400 (Ro); 1200 (O) | 8634 | 54 | 400 (Ro); 1200 (O) | 6582 | 56 |
| 800 (Ro); 800 (O) | 5149 | 50 | 800 (Ro); 800 (O) | 7012 | 51 | 800 (Ro); 800 (O) | 7441 | 57 |
| Rate 12% | ||||||||
| 1600 trees/ha | 2000 trees/ha | 3000 trees/ha | ||||||
| Mixture (trees/ha) | LEV (€/ha) | Optimal rotation (years) | Mixture (trees/ha) | LEV (€/ha) | Optimal rotation (years) | Mixture (trees/ha) | LEV (€/ha) | Optimal rotation (years) |
| 1600 (Ro) | 5947 | 47 | 1600 (Ro) | 6154 | 45 | 1600 (Ro) | 5612 | 43 |
| 400 (Ro); 1200 (O) | 6721 | 48 | 400 (Ro); 1200 (O) | 6658 | 46 | 400 (Ro); 1200 (O) | 6488 | 48 |
| 800 (Ro); 800 (O) | 5567 | 44 | 800 (Ro); 800 (O) | 6201 | 48 | 800 (Ro); 800 (O) | 7203 | 47 |
Table 2.
Maximum LEV (€/ha) and optimal rotation length (years) for different mixtures of roble, raulí and coigüe forest types and evergreen forest types with interest rates of 4%, 8% and 12% (wood and carbon).
Table 2.
Maximum LEV (€/ha) and optimal rotation length (years) for different mixtures of roble, raulí and coigüe forest types and evergreen forest types with interest rates of 4%, 8% and 12% (wood and carbon).
| Forest Type Roble-Raulí-Coigüe (RoRaCo) | ||||||||
|---|---|---|---|---|---|---|---|---|
| Rate 4% | ||||||||
| 1600 trees/ha | 2000 trees/ha | 3000 trees/ha | ||||||
| Mixture (trees/ha) | LEV (€/ha) | Optimal rotation (years) | Mixture (trees/ha) | LEV (€/ha) | Optimal rotation (years) | Mixture (trees/ha) | LEV (€/ha) | Optimal rotation (years) |
| 1600 (Ro) | 4632 | 65 | 1600 (Ro) | 4387 | 65 | 1600 (Ro) | 5102 | 66 |
| 400 (Ro); 1200 (O) | 4753 | 50 | 400 (Ro); 1200 (O) | 5211 | 55 | 400 (Ro); 1200 (O) | 5301 | 52 |
| 800 (Ro); 800 (O) | 5345 | 50 | 800 (Ro); 800 (O) | 5362 | 57 | 800 (Ro); 800 (O) | 5500 | 58 |
| Rate 8% | ||||||||
| 1600 trees/ha | 2000 trees/ha | 3000 trees/ha | ||||||
| Mixture (trees/ha) | LEV (€/ha) | Optimal rotation (years) | Mixture (trees/ha) | LEV (€/ha) | Optimal rotation (years) | Mixture (trees/ha) | LEV (€/ha) | Optimal rotation (years) |
| 1600 (Ro) | 5122 | 56 | 1600 (Ro) | 7652 | 54 | 1600 (Ro) | 6647 | 45 |
| 400 (Ro); 1200 (O) | 5741 | 55 | 400 (Ro); 1200 (O) | 10069 | 60 | 400 (Ro); 1200 (O) | 8424 | 44 |
| 800 (Ro); 800 (O) | 4963 | 55 | 800 (Ro); 800 (O) | 8259 | 58 | 800 (Ro); 800 (O) | 6922 | 45 |
| Rate 12% | ||||||||
| 1600 trees/ha | 2000 trees/ha | 3000 trees/ha | ||||||
| Mixture (trees/ha) | LEV (€/ha) | Optimal rotation (years) | Mixture (trees/ha) | LEV (€/ha) | Optimal rotation (years) | Mixture (trees/ha) | LEV (€/ha) | Optimal rotation (years) |
| 1600 (Ro) | 4587 | 40 | 1600 (Ro) | 5887 | 46 | 1600 (Ro) | 5196 | 43 |
| 400 (Ro); 1200 (O) | 5129 | 42 | 400 (Ro); 1200 (O) | 6659 | 47 | 400 (Ro); 1200 (O) | 6247 | 45 |
| 800 (Ro); 800 (O) | 5233 | 40 | 800 (Ro); 800 (O) | 8124 | 47 | 800 (Ro); 800 (O) | 7024 | 45 |
| Evergreen Forest Type | ||||||||
| Rate 4% | ||||||||
| 1600 trees/ha | 2000 trees/ha | 3000 trees/ha | ||||||
| Mixture (trees/ha) | LEV (€/ha) | Optimal rotation (years) | Mixture (trees/ha) | LEV (€/ha) | Optimal rotation (years) | Mixture (trees/ha) | LEV (€/ha) | Optimal rotation (years) |
| 1600 (Ro) | 5002 | 42 | 1600 (Ro) | 5749 | 40 | 1600 (Ro) | 5923 | 44 |
| 400 (Ro); 1200 (O) | 5269 | 41 | 400 (Ro); 1200 (O) | 6189 | 57 | 400 (Ro); 1200 (O) | 6185 | 42 |
| 800 (Ro); 800 (O) | 5642 | 43 | 800 (Ro); 800 (O) | 6897 | 47 | 800 (Ro); 800 (O) | 6842 | 43 |
| Rate 8% | ||||||||
| 1600 trees/ha | 2000 trees/ha | 3000 trees/ha | ||||||
| Mixture (trees/ha) | LEV (€/ha) | Optimal rotation (years) | Mixture (trees/ha) | LEV (€/ha) | Optimal rotation (years) | Mixture (trees/ha) | LEV (€/ha) | Optimal rotation (years) |
| 1600 (Ro) | 4830 | 50 | 1600 (Ro) | 8078 | 51 | 1600 (Ro) | 6128 | 52 |
| 400 (Ro); 1200 (O) | 4758 | 48 | 400 (Ro); 1200 (O) | 8863 | 53 | 400 (Ro); 1200 (O) | 6774 | 54 |
| 800 (Ro); 800 (O) | 5362 | 52 | 800 (Ro); 800 (O) | 7204 | 56 | 800 (Ro); 800 (O) | 7856 | 53 |
| Rate 12% | ||||||||
| 1600 trees/ha | 2000 trees/ha | 3000 trees/ha | ||||||
| Mixture (trees/ha) | LEV (€/ha) | Optimal rotation (years) | Mixture (trees/ha) | LEV (€/ha) | Optimal rotation (years) | Mixture (trees/ha) | LEV (€/ha) | Optimal rotation (years) |
| 1600 (Ro) | 6187 | 45 | 1600 (Ro) | 6178 | 43 | 1600 (Ro) | 5843 | 41 |
| 400 (Ro); 1200 (O) | 6952 | 42 | 400 (Ro); 1200 (O) | 6852 | 47 | 400 (Ro); 1200 (O) | 6687 | 45 |
| 800 (Ro); 800 (O) | 5763 | 41 | 800 (Ro); 800 (O) | 7859 | 46 | 800 (Ro); 800 (O) | 7514 | 45 |
Disclaimer/Publisher’s Note: The statements, opinions and data contained in all publications are solely those of the individual author(s) and contributor(s) and not of MDPI and/or the editor(s). MDPI and/or the editor(s) disclaim responsibility for any injury to people or property resulting from any ideas, methods, instructions or products referred to in the content. |
© 2026 by the authors. Licensee MDPI, Basel, Switzerland. This article is an open access article distributed under the terms and conditions of the Creative Commons Attribution (CC BY) license (http://creativecommons.org/licenses/by/4.0/).
Copyright: This open access article is published under a Creative Commons CC BY 4.0 license, which permit the free download, distribution, and reuse, provided that the author and preprint are cited in any reuse.


