Submitted:
17 February 2026
Posted:
26 February 2026
You are already at the latest version
Abstract
Digital news outlets are increasingly shaping financial markets due to the rapid flow of information that is disseminated through them. The stock price forecasting models which have been in use traditionally are mainly dependent on past price information and they do not seem to effectively represent how investors respond to new information. The research questions covered by the study are on whether the use of financial news sentiment in time-series forecasting models can enhance the predictive system in terms of accuracy and relevance of predictions to decisions in the short run when predicting stock prices. The study is based on a quantitative and predictive research design where it uses natural language processing method, namely FinBERT to derive sentiment scores based on U.S. financial news headlines. These sentimental measurements are combined with historical stock price data to come up with hybrid forecasting models. The prevailing price-only models are contrasted with sentiment enhanced models on objective evaluation criteria, such as the Root Mean Squared Error (RMSE) and Mean Absolute error (MAE). Following the Forecasting: Principles and Practice (FPP3) model, the study pays attention to transparency, simplicity, and decision-oriented modeling. The results indicate that the sentiment-enhanced models are capable of doing better than the traditional price-based models in some circumstances, especially when the quality of the data and modeling assumptions are met. The research has a contribution to the scholarly literature and applied financial decision making through illustration on how sentiment-based forecasting could be used to make more informed and justifiable investment decisions.
Keywords:
sentiment analysis
; stock price forecasting
; ARIMA
; ARIMAX
; time series modeling
; financial analytics
; machine learning in finance
Introduction
The main areas of focus in finance since forecasting the prices of stocks is information based, dynamic, and complex. Forecasts are used by investors, analysts, and policymakers in order to make judgments pertaining to investment allocation, risk management, and market regulation. Conventional prediction methods are usually based on the past price trends and indicators of technology. Although such techniques can be helpful, they tend to ignore the impact of the qualitative data, especially financial news, which can determine investment expectations and market dynamics in the short run. Through the growth of digital media, news about the financial sector spreads quickly and with the continuous nature, market perception is manipulated almost in real time. Earnings announcements, macroeconomic indicators, geopolitical and corpus activities news may cause emotional and behavioral responses in investors and result in short-run price movements that are not likely to be well explained by the price-only models. Due to this, the use of sentiment based on financial news in models of prediction has been increasingly popular in both academia and practice.
The development of natural language processing (NLP) has enabled the opportunity to measure sentiment within unstructured data related to text. Specifically trained transformer-based models like FinBERT are more accurate at developing a subtle sentiment compared to general-purpose sentiment analysis tools. The developments provide the opportunity to systematize sentiment measures and combine them with conventional time-series models in a principled and empirically verifiable way. The hypothesis of whether financial news sentiment can provide greater short-term stock price prediction over and above traditional time-series models. Instead of emphasizing purely the predictive accuracy, the study assumes a decision-based modeling based on the Forecasting: Principles and Practice (FPP3) framework. The focus of this approach is on transparency, model comparison to simple models, and objective assessment to make sure that the further complication of a model is justified by a significant performance boost. This study aims to add both theoretical and practical value to the area of financial analytics by streamlining fore-casting procedures to ensure that they meet the decision-making requirements.
- Background of the Study
Financial markets are complex systems which are affected by the unending stream of information, investor behavior and macroeconomic conditions. The Efficient Market Hypothesis (EMH) suggests that asset prices are expressed as a result of all publicly available information, which means that it is not always easy to predict price movements. Empirical studies have however indicated that markets do not tend to react perfectly or with delays to new information especially in the short run. Such inefficiencies leave the space to forecasting models that take into account behavioral and informational factors in addition to the historical price patterns. The studies of behavioral finance indicate that psychology and feeling of investors are influential in the market dynamics. Fear, optimism and overconfidence are some of the emotions that may affect the behavior of trading occasionally causing temporary mispricing and high volatility. The information and sentiment flow to the market is served mostly by the financial news. Corporate earnings, economic policy shifts or global stories can be used in headlines to influence investor perceptions and affect the outcome of trading decision within almost seconds.
Historically, the use of time-series models including autoregressive and moving average processes has been used to forecast stock prices, and these models reflect such patterns as trends, seasonality, and autocorrelation of past price movements. Although such models are statistically sound and interpretable, they lack an explicit consideration of other source of information. Consequently, only price models can do poorly when there are sudden market responses to news events. In the recent past, there has been an improvement in natural language processing whereby researchers have been able to extract structured measures of sentiment in unstructured textual data. FinBERT, which is a specifically trained model, can be used to differentiate between positive, negative and neutral sentiment in financial news with high accuracy. The inclusion of sentiment scores in forecasting models will help the researcher make more accurate representations of information flowing into prices.
The empirical evidence is inconclusive even in the light of the increasing enthusiasm towards sentiment-based forecasting. The results of some studies show that there was a major improvement of prediction accuracy whereas others report minimal or uneven results. These conflicting results underscore the importance of a rigorous modeling approach that puts emphasis on simplicity, transparency and decision relevance. In accordance with the Forecasting: Principles and Practice (FPP3) framework, the proposed study does not consider sentiment analysis as an alternative to the traditional model, and it is just a potential enhancement that needs to be empirically validated with the help of objective analysis.
Statement of the Research Problem
Even after decades of studying the stock price forecasting, it is a major challenge to predict the short-term price changes. Conventional forecasting techniques are based mainly on the past information and they have a premise that the past trends have enough information to predict the future trends. As much as the models are interpretable and statistically rigorous, in most situations they do not capture the short to term effects of new information hitting the market. The growing access to financial news and real-time information has brought new sources of data that are based on investor sentiment and market expectations. Nonetheless, there are a number of issues when it comes to incorporating such qualitative information into forecasting models. Text-based sentiment metrics can be noisy, context specific and sensitive to preprocessing and model choices. Consequently, sentiment-enhanced models can make the models more complex without always making the models better at forecasting.
Many existing studies emphasize predictive accuracy without adequately addressing whether observed improvements are meaningful for real-world decision-making. Complex models that marginally outperform simple benchmarks may not justify their additional computational cost or reduced transparency. This raises an important concern for practitioners who require forecasting models that are not only accurate but also interpretable, reliable, and defensible. The core problem addressed in this research is the lack of clarity regarding the practical value of financial news sentiment in short-term stock price forecasting. Specifically, it remains uncertain whether incorporating sentiment information leads to consistent and decision-relevant improvements over traditional price-based models. Addressing this problem requires a structured modeling approach that benchmarks performance against simple models and evaluates results using objective metrics within a decision-focused framework.
Research Questions
This study is guided by the following research questions:
- Does financial news sentiment have a measurable relationship with short-term stock price movements?
- Do sentiment-enhanced forecasting models outperform traditional price-only baseline models in short-term stock price prediction?
- How does the use of a decision-focused modeling framework influence model selection, evaluation, and interpretability in stock price forecasting?
Significance of the Study
This research is important both in the academic research and applied financial decision-making. Academically, the research has added to the existing literature in sentiment-based financial forecasting by giving an empirical analysis of sentiment-enhanced models in a systematic and decision-oriented framework. The analysis of sentiment-informed models against simple baseline models demonstrates that the study is credible and valid with regard to the role of methodological rigor and objective performance comparison in predictive analytics. The study also goes beyond the current studies by focusing on decision relevance, as opposed to predictive accuracy. Most of the past research has been on whether sentiment enhances forecast accuracy but has not addressed the question on whether the gains can be significant in the practice.
The forecasting models can be transpired, simplified and justified in order to align them with the needs of decision-making using the Forecasting: Principles and Practice (FPP3) framework. The findings can be used by investors, financial analysts, and portfolio managers who intend to use alternative data sources in the forecasting processes. Knowledge of when and how sentiment data can be valuable can assist the practitioner to eliminate redundant complexity in their models and to exploit informative signals where they are useful. Furthermore, the study will offer the recommendation on the model evaluation based on objective measures, which will justify and support responsible forecasting in unpredictable markets.
Literature Review
Sentiment analysis has attracted much interest because scholars are interested to know how information and investor psychology affects market behavior through the application of sentiment analysis in financial forecasting. The classical financial theories, including the Efficient Market Hypothesis, rely on the assumption that markets efficiently and promptly internalize the information in asset prices. The recent empirical findings of behavioral finance are proving this premise with emphasis on the sentiment, cognitive bias, and slow information processing in the formation of short-term market trends.
- Behavioral Finance and Market Information
The behavioral finance research highlights that investor responses to information are not necessarily rational and immediate. Akin and Akin (2024) reveal that behavioral biases are some of the anomalies in stock market volatility in the United States, indicating that the average prices in the market might be out of line with the fundamental value in the long term. Goldstein (2023) also says that information dissemination may also have actual economic impacts, especially when investors process and respond to news in a different way. These results reinforce the claim that emotion in financial data may have an effect on short- term prices that cannot be determined using historical price data. The significance of behavioral dynamics in financial systems is also supported by agent-studies based modeling. According to Axtell and Farmer (2025), markets are complex adaptive systems that are heterogeneous agents, and when reacting to information, create nonlinear and emergent outcomes. Such a view offers theoretical hereby to the use of sentiment indicators when predicting outcomes because sentiment represents how people respond in one way or the other, in a collective manner that would otherwise be challenging to measure.
- Financial Markets and Sentiment Analysis
Developments in sentiment analysis methods have also allowed scholars to achieve formal conclusions on unstructured data of texts like a financial news or social media. Rodríguez-Ibánez et al. (2023) review the methods of sentiment analysis in detail, pointing out the development of lexicon-based methods to more sophisticated machine learning and deep learning systems. Such advancements have enhanced accuracy and contextual interpretation of sentiment in domain specific applications like finance. A number of studies have shown the connection between sentiment and stock market behavior. The study by Liu et al. (2023) provides evidence of synergy between stock prices and the investor sentiment expressed on social media, as well as suggesting that the sentiment and prices affect each other as dynamical processes. On the same note, it has been demonstrated by Hasselgren et al. (2022) that sentiment indicators based on social media could be useful in making investment decisions, especially when they are combined with traditional financial measures.
- Market Prediction, News and Social Media
Internet-based news and social media platforms have risen to become the major sources of information dissemination. Guan et al. (2022) show that the sentiment of users on social media can be used to predict the crash and recovery of share markets, particularly when the uncertainty level is high, like in the COVID-19 pandemic. They conclude that sentiment signals are useful especially in turbulent market conditions. Peivandizadeh et al. (2024) follow up this literature by combining sentiment analysis and sophisticated machine learning algorithms and demonstrate that hybrid algorithms can enhance the accuracy of stock market predictions.
Saravanos and Kanavos (2025) also indicate that sentiment derived through online sources can be used to improve volatility forecasting but the outcome depends on the quality of data and the model used. Sentiment analysis has also been useful in other areas that are decision-oriented besides the finance. Bryan-Smith et al. (2023) show that real-time sentiment analysis is effective to provide quick impact analysis in case of natural disasters, which supports the general generalizability of sentiment-driven decision support systems. These results indicate the possible promise of sentiment analysis as a real-time information cue across a complex system.
- Problems of Decision Support, Big Data, and Modeling
Sentiment analysis has been extended to big data analytics through the decision-making process. According to Zhang et al. (2022), social media analytics can be used to assist competitive business decision systems to convert bulk unstructured data into actionable information. In the same way, Rita et al. (2023) demonstrate that the kind of sentiment posted on social media can impact the voting behavior, which once again demonstrates how group sentiment affects the reality. The inclusion of sentiment in predictive models is however problematic. According to Kantha et al. (2023), sentiment signals are often noisy and contextual, and it is necessary to carefully preprocess them and select models. Patchipala (2023) notes that machine learning systems have the danger of model drift, which means that sentiment-based models need to be constantly controlled to ensure that it remains reliable over time.
- Research Gap
Though previous works indicate that sentiment is capable of affecting financial markets, there are numerous gaps. To begin with, numerous studies put more emphasis on predictive accuracy rather than transparency, benchmarking and decision relevance. Second, the outcomes of the studies are inconsistent, as there are models of sentiment enhancement, which do not always improve over simple baselines. Lastly, there is small body of research that explicitly uses a structured forecasting framework which rationalizes model complexity according to decision-oriented performance. The gaps by analyzing the sentiment of financial news in a decision-oriented modeling process by reference to Forecasting: Principles and Practice (FPP3). To establish the case of sentiment information as being useful in short-term stock price prediction, the research seeks to establish when sentiment-enhanced models have significant value compared to traditional price-only models based on objective measures.
Research Design and Methodology
Research Design
The research design applied in this study is a quantitative and predictive research design to identify the relationship between financial news sentiment and short-term stock price changes. The quantitative methodology is suitable since the study aims at quantifying sentiment, modeling it with the stock returns, and objectively assessing the forecasting accuracy based on statistical measures of error. The predictive design is based on the determination of whether sentiment-enhanced models can be used to make a better stock price forecast in the short term than the traditional price-only models. The study is based on decision-oriented modeling framework, which may be explained by the principles of Forecasting: Principles and Practice (FPP3). This paradigm incorporates the use of simple baseline models and introducing complexity and complexity until empirical performance makes the choice of model defensible and should not be based on theoretical sophistication only. The study provides transparency and accountability in developing the models because it compares the sentiment-based models to the traditional forecasting methods.
- Data
- Data Source
The data presented in this paper is the U.S. Stock News with Price dataset, which is publicly available on the Hugging Face platform. It is a stock market data set that is a combination of financial news headlines and stock market price data in the U.S., thus allowing both qualitative and quantitative data to be analyzed (Wang, 2024).
- Data Components
- The dataset is based on two major components:
- Textual Data (News Headlines):
They are concise financial news items touching on publicly traded U.S companies. Each headline will contain a date of publication and a stock ticker trading symbol.
- Numerical Market Data:
- Each ticker is offered daily stock market data and the following variables are included:
- Opening price
- Closing price
- High price
- Low price
- Adjusted closing price
- Trading volume
Every observation is a trading day of a given stock and there exists one or more news headlines relative to the trading day (Saravanos and Kanavos, 2025).
Data Scope and Structure
The sample is also diverse in that it represents a wide range of firms in different industries, and hence it is diversified in its size, turnover in trade and fluctuations. The time-series nature of the data allows the analysis of the data in the cross-section and time-varying. The observations are identified by the following keys, ticker symbol and trading date in which the sentiment scores and the daily returns of the stock are matched.
Summary Statistics
The initial analysis shows that the volatility of stock returns on the daily basis is medium and in both positive and negative directions. The difference in the volume of trading between the firms and the time period has a great variance because of the difference in liquidity and interest in the market. The score of sentiments in terms of polarity is between strongly negative and strongly positive, though the majority of the headlines are located between the boundaries of the sentiments of a neutral, also which is consistent with the past research on financial sentiment (Saravanos & Kanavos, 2025).
Data Analytic Plan
- Text Data Washing and Pre-processing
- Preprocessing of textual data is done to guarantee the top sentiment extraction. The steps applied are as follows:
- Elimination of special characters, punctuation marks, URLs and stock ticker symbol.
- Removal of the duplicated headlines.
- Turn all the text to small letters.
- Elimination of non-English headlines.
- Sentiment Extraction
Sentiment analysis is done with the help of FinBERT which is a transformer-based NLP model that is trained on financial text. All the headlines are categorized into three groups, which include positive, negative, and neutral. Along with this, a continuous sentiment polarity score between -1(strongly negative) and +1 (strongly positive) is produced to measure the intensity of sentiment.
- Data transformation Numbers to Numbers
The stock price data is converted in order to generate analytically significant variables. The daily stock returns are computed as a percentage of change in opening and closing prices. Price direction is coded as a nominal variable with three different classifications, which are, upward movement, downward movement and neutral movement. The volume of trading is kept as a control variable to consider the market activity (Agrawal et al., 2025).
- Data Integration and Alignment
News publication dates are synchronized with stock market trading dates. Headlines released outside of trading hours are assigned to the subsequent trading day to reflect the timing of market reactions. Missing price observations are handled using forward-filling or interpolation techniques to preserve time-series continuity.
- Exploratory Data Analysis
Exploratory data analysis (EDA) is performed to reveal the inherent data patterns and relationships. Descriptive statistics are used to summarize stock returns, trading volume and sentiment scores. The analysis of the initial relationships between sentiment indicators and the movement of stock prices is done through the correlation analysis. Assumption checking and model selection is facilitated by visualizations, such as sentiment distributions and time-series plots.
- Modeling Approach
The modeling process starts with price only forecasting models, naïve and ARIMA models to give reference performance. These models are compared with sentiment-enhanced hybrid models with dynamic regression (ARIMAX) models, which added sentiment score as extraneous predictor.
- Model Evaluation
Objective measures of model performance, such as Root Mean Squared Error (RMSE) and Mean Absolute Error (MAE) are used to evaluate model performance. The accuracy of directional predictions is also estimated to determine the practical utility of the predictions. The comparative evaluation is used to make sure that only sentiment-enhanced models are used when there are significant improvements to the baseline models.
Purpose of Modeling
A model is a simplified representation of reality. Real-world systems such as financial markets are affected by many variables, including historical prices, external events, and human behavior. Modeling does not attempt to represent all aspects of reality. Instead, it focuses on the most relevant components that directly support the research objective. This simplification reduces complexity while preserving essential patterns, enabling better decision-making.
Modeling Framework Based on FPP3
According to Forecasting: Principles and Practice (FPP3), effective modeling follows a structured workflow consisting of data exploration, transformation, model estimation, evaluation, and comparison. This framework ensures that models are developed systematically and that conclusions are based on empirical performance rather than assumptions. Mathematical formulation is central to this process, as it defines how variables interact and how forecasts are generated.
Baseline Mathematical Models
Baseline models are essential in forecasting because they provide reference points for comparison. One of the simplest models is the naïve forecasting model, which assumes that the next observation will be equal to the most recent observation.
- Naïve model equation:
Forecast at time t+1 = Observed value at time t
- Written mathematically:
y(t+1) = y(t)
Although simple, this model is important because any more complex model must outperform it to justify its use. FPP3 emphasizes starting with such simple models to ensure transparency and reliability in forecasting decisions.
- Time-Series Forecasting Models
More advanced models account for patterns over time. AutoRegressive Integrated Moving Average (ARIMA) models describe how current values depend on past observations and past errors. These models are particularly effective for time-dependent data.
- General ARIMA model representation:
Current value = function of past values + function of past errors + random noise
Written mathematically:
y(t) = c + φ1y(t−1) + φ2y(t−2) + … + θ1ε(t−1) + θ2ε(t−2) + ε(t)
Where:
- φ represents autoregressive coefficients
- θ represents moving average coefficients
- ε represents random error
ARIMA models allow decision-makers to quantify trends and temporal dependencies, improving forecast reliability.
- Regression and Dynamic Models with External Variables
FPP3 also highlights the value of incorporating external predictors into forecasting models. Dynamic regression models allow outcomes to depend on both external variables and time-series behavior.
- Regression model with external predictor:
y(t) = β0 + β1x(t) + ε(t)
Where:
- x(t) represents an external variable such as sentiment score
- β represents regression coefficients
When combined with time-series errors, the model becomes:
- y(t) = β0 + β1x(t) + ε(t)
- ε(t) follows an ARIMA process
This formulation allows the model to capture both the influence of external information and the internal dynamics of the data, leading to more informed decision-making.
Model Evaluation Metrics
Mathematical models must be evaluated using objective accuracy measures. Common evaluation metrics include Root Mean Squared Error (RMSE) and Mean Absolute Error (MAE).
- RMSE equation:
RMSE = square root of [ (1/n) × sum of (actual − predicted)² ]
- MAE equation:
MAE = (1/n) × sum of |actual − predicted|
These metrics allow analysts to compare models and select the one that minimizes forecasting error, reinforcing the role of modeling as a decision-support tool.
- Assumptions and Transparency
An important advantage of mathematical modeling is that it makes assumptions explicit. Assumptions about linearity, independence, stationarity, and error behavior are embedded within equations. Once formalized, these assumptions can be tested and revised. This transparency increases the credibility of the analysis and supports reproducibility.
Implementation: Seasonal Adjustment and Stationarization
The implementation stage converts the planning decisions to actual analytical actions. At this point, the uncooked time series data is processed under methodic operations to guarantee that it satisfies the requirements of the credible forecasting models. The first goal of this step is to eliminate distortion due to trends and seasonal effects, so as to extract the underlying signal in the presence of random noise. The process revolves around seasonal adjustment and stationarizing because they have a direct effect on the accuracy, interpretability, and robustness of models.
Primary Data Preliminary Examination and Trend Recognition
The time-series data can be analyzed first by an exploratory analysis. The visual inspection is carried out by line plots to view general behavior over time. Such plots are used to find out long term tendencies, sudden structural changes and repeat seasonal patterns. An illustration would be that there are periodic peaks and troughs with regular spacing implying the existence of seasonality whereas an upward or downward trend is implied by a persistent movement.
Besides the visual means, statistical tools are also used to support observations. The seasonal subseries plots are used to group observations by season (i.e. months or quarters) so that we can have a better comparison of the seasonal effects on different years. There is also the generation of autocorrelation function (ACF) and partial autocorrelation function (PACF) plots that identify repeat correlations at particular lags which indicate seasonal cycles. All of these methods help to obtain a detailed picture of the time structure of the data without any transformations.
Decomposition of Seasonal Adjustment
As soon as seasonality is established, seasonal adjustment is introduced based on time-series decomposition procedures. Decomposition divides the observed series into three different parts: trend, seasonal and remainder (irregular). A multiplicative or an additive mode of decomposition is chosen depending on the type of the data. Additive decomposition is employed in the case of seasonal variance which do not vary with time whereas multiplicative decomposition is employed in the case of seasonal effects, which vary with the level of the series in a proportionate manner.
Additive decomposition could be written mathematically as:
Plotted series = Trend + Seasonal + Remainder
The original data is then decomposed and the seasonal component is eliminated to create a seasonal adjusted series. In this adjusted sequence, there is no longer a systematic periodic variation, and it is possible to examine meaningful changes and not seasonal reproduction. When making decisions, seasonal adjustment of the models is very essential since the decision made should be pushed by the underlying behavioral changes and not by the routine seasonal changes.
Trend Removal and Differencing
The second step of implementation after seasonal adjustment is to ensure that non-stationary trends are met. Numerous time series occurring in the real world have trends in them caused by economic development, technological take-up or long-term changes in behavior. When not addressed, such trends may give spurious relationships and invalid predictions.
The main method employed to eliminate trends and obtain stationarity is differentiating. The first-order differencing is used to compute differences between two consecutive observations which is effective in eliminating the linear patterns. Where non-stationarity still persists in the data, a higher order differencing can be used, but over-differentiating the data is also to be avoided to avoid loss of information.
This change in the analysis of the analytical emphasis on changes with time rather than absolute levels which is likely to capture better the dynamic nature of the decision environments. Diffusion uses the mean of the series to stabilize the mean of the series to assure that model parameters reflect real temporal dependence as opposed to long-term drift. Transformation In transformation, variation at the spectral corners is decreased by transforming each pixel to be near its desired value.
Variance Stabilization by Transformation
In transformation, the spectral corners are reduced by transforming each pixel towards its intended value (Van Doorn et al., 2006). Besides trend-related non-stationarity, most of the time series are affected by variable variance whereby variations widen as the series level escalates. Such heteroscedasticity breaks the assumptions of standard forecasting models and can create distorted estimates of errors. In order to overcome this problem, variance-stabilizing transformations are applied. In situations where values are always positive and when one is interested in the growth rates, it is usual to use logarithmic transformations. Box-Cox transformations are an alternative that is more flexible as they can be used to find a single optimal parameter of transformation to stabilize the variance without compromising interpretability. These changes are implemented before difference when required so that the mean and the variance of the series do not vary with time. The outcome is an altered series that is more in line with the assumptions of linear time-series models.
Statistical Checking of Stationarity
Once seasonal adjustment, differencing and variance stabilization are done the transformed series is formally tested to be stationary. Augmented Dickey Fuller (ADF) test is commonly adopted to test the presence of a unit root in the data. The statistically significant result of the test shows that the null hypothesis of non-stationarity is rejected, which proves that the series can be modeled. These statistical tests are the complements of visual diagnostics and they give objective evidence that the preprocessing stages are effective. In case the stationarity is not attained, an iterative refinement of the implementation process is determined until the data meets the desired requirements.
Diagnostic Evaluation and Validation
After reaching the stationarity, diagnostic checks are made to ensure that the implementation phase is effective or not. The residual plots will be reviewed to ascertain that there are no left trends or season trends. Analysis of ACF plots of the transformed series is done to ensure that correlations decay rapidly, and that is typical of stationary processes. This step of validation is also important, because it checks that the transformed data will not contravene model assumptions in estimation. The rest of the anomalies are dealt with until only the model fitting stages are followed, ensuring that nothing is compromised in the forecasting pipeline.
- Combination with Forecasting Models
The end result of the implementation step is a clean and stationary time series upon which forecasting models like ARIMA or dynamic regression can be built. Due to the systematic elimination of seasonal effects and trends, model parameters are much more interpretable and forecasts are much more sensitive to true changes in the underlying process. Decision-wise, actionable signals make this implementation stage because forecasts are made based on actionable signals, and not predictable noise. Decision-makers are thus able to be more confident in using the output of the models because they know that the data has been made carefully ready so as to assist in sound analysis which is transparent.
Summary of Implementation Results
Seasonal adjustment and stationarization is the operationalization of the objectives of planning of the modeling system. The data is processed into a stable input to analogy using decomposition, transformation, differencing, and validation to convert a non-stationary and raw series of data into a stable input. This process leads to an improvement of accuracy of forecasts, minimization of uncertainty, and improved linkage between analytical models and real-world decision-making. By adhering to the principles outlined in Forecasting: Principles and Practice (FPP3), the implementation phase ensures methodological rigor and supports high-quality, decision-driven forecasting outcomes.
Data Visualization and Results
Data visualization plays a critical role in enhancing the interpretability, transparency, and decision relevance of forecasting models. In this study, visualizations are used to explore data characteristics, validate modeling assumptions, compare model performance, and communicate forecasting results clearly. The figures and tables presented support both exploratory analysis and model evaluation, aligning with the decision-focused modeling principles emphasized in Forecasting: Principles and Practice (FPP3).
Table 1 provides a structured comparison of the primary forecasting models employed in the study, including the naïve forecasting model, ARIMA model, and dynamic regression (ARIMAX) model. The table summarizes each model’s key assumptions, strengths, limitations, and evaluation metrics. The naïve model serves as a transparent baseline, assuming that future values equal the most recent observation. While simple, it establishes a minimum performance benchmark that more complex models must surpass. The ARIMA model captures trends and autocorrelation in time-series data but requires stationarity and careful parameter tuning. The dynamic regression model incorporates external predictors specifically sentiment scores allowing the model to reflect the influence of information flow on stock prices. RMSE and MAE are used consistently across all models to ensure objective comparison.
Table 2 summarizes the data preprocessing steps applied prior to model estimation. These include seasonal adjustment, differencing, and variance-stabilizing transformations. Seasonal adjustment removes predictable periodic fluctuations, while differencing addresses non-stationary trends. Logarithmic or Box–Cox transformations are applied where necessary to stabilize variance. This table highlights that data preprocessing is not a mechanical task, but a sequence of analytical decisions that directly influence model validity and interpretability.
Table 3 presents the forecasting performance of baseline and sentiment-enhanced models using RMSE and MAE. Results demonstrate whether the inclusion of sentiment information leads to measurable improvements over price-only models. This table directly supports the study’s research questions by empirically evaluating the value added by sentiment-enhanced forecasting.
Figure 1 displays a time-series line plot of the original stock price data. This visualization provides an overview of trends, volatility, and potential structural changes over time. Visual inspection reveals periods of sustained growth or decline, as well as abrupt price movements that may correspond to external events or news releases. This figure supports initial exploratory analysis and informs subsequent preprocessing decisions.
Figure 2 presents a decomposition of the stock price series into trend, seasonal, and remainder components. The visualization confirms the presence of systematic seasonal patterns and long-term trends in the data. By isolating these components, the figure justifies the application of seasonal adjustment and differencing prior to model estimation.
Figure 3 illustrates the autocorrelation structure of the transformed time series after stationarization. The rapid decay of autocorrelation across lags indicates that the series satisfies stationarity assumptions required for ARIMA modeling. This figure provides diagnostic evidence that preprocessing steps were effective.
Figure 4 compares forecasted stock prices with actual observed values for the selected model. This visualization allows for intuitive assessment of forecasting accuracy and highlights periods where prediction errors increase. Alignment between forecasted and actual values indicates strong model performance, while deviations signal potential limitations or market shocks.
Role of Visualization in Decision-Focused Modeling
The analysis is clarified and credible with the help of the tables and figures. The study is transparent as it provides the visualization of assumptions, transformations, and performance outcomes, and it facilitates the defensibility of models selected. Such visualizations support the fact that the research is, as much as possible, decision-oriented because they help the stakeholders to know not only which model works best, but also why the model is applicable in real-world forecasting.
Gaps and Limitations
This study has some strengths, and there are gaps and limitations that should be mentioned. The study is based on historic evidence and presupposes that the correlation between financial news sentiment and stock prices do not change over time. In the actual world of financial markets, a structural break, change in regulation, macroeconomic shocks or unforeseen world events may cause a shift in the dynamics of markets, which may compromise the accuracy of future predictions using historical data. Second, the sample is restricted to publicly traded corporations in the U.S. and news about financial information in English. This limitation inhibits the outer scope of the findings to foreign markets or non-English sources of information where investor behaviour and systems of information distribution may vary. Also, although the dataset is broad with a variety of firms and industries, the sentiment performer might differ in different sectors, which the current research does not point out explicitly.
Third, the extraction of sentiment is imperfect in nature. Even though FinBERT is particularly trained on financial text and is better than generic sentiment models (although not with nuanced text), it is still prone to misunderstanding subtle wordplay, speculative expression or uncertainty in the future. The use of sentiment scores which have been aggregated at the daily level can also demonstrate intraday differences in investor responses. Fourth, the forecasting models that were used in this research are mainly linear in nature. Although models like ARIMA and dynamic regression are interpretable and transparent, they might not be able to reflect all the nonlinear relationships and other complicated interactions that exist in financial markets. More complex machine learning or deep learning models might be able to detect patterns that fall outside the process of more traditional time-series methods but with less interpretability.
The model analysis is done according to statistical predictive measures like RMSE and MAE. Though these metrics give objective performance measures, they fail to give direct consideration to transaction costs, risk preference, and real trading constraints. Consequently, a better forecasting accuracy may not be conducive to better financial returns.
Discussion
This research finding will offer empirical evidence in favor of the thesis statement, that financial news sentiment can be used to predict stocks in the short term when it is included in a disciplined, decision-oriented modeling model. In line with the behavioral finance theory, the findings indicate that investor sentiment that is inherent in news headlines affects market behavior that cannot be attributed to the historical price data alone. One of the most important lessons of this study is the necessity to compare and contrast with simple baseline models. The naïve forecasting model though simple proved to be a critical benchmark against which the worth of more complicated methods could be measured. The findings confirm that higher complexity of models should be supported by significant enhancements in the forecasting performance, which supports the premises of Forecasting: Principles and Practice (FPP3).
The use of sentiment scores in dynamic regression models performed better in some circumstances especially when preprocessing of data was done with care and the assumptions of the models were met. This observation points to the fact that sentiment integration is not always helpful, but its success is due to the quality of data, sufficient coincidence of news and price data, and the correct choice of models. Noisy or poorly measured sentiment signals may add complexity with no predictive value. The implementation decisions used in the study also emphasize the outcomes forecasting nature. Seasonal adjustment, differencing, and variance stabilization are some of the steps that were necessary in making sure that models had incorporated underlying market dynamics and not predictable noise. These preprocessing choices had a direct effect on model validity and interpretability with the suggestion that forecasting success relies not only on the methodological rigor but also on the model choice.
Decision-making wise, this research has shown that the basis of forecasting models cannot be measured merely based on statistical performance. Transparency, interpretability and defensibility also have significant importance especially in an organizational or investment environment whereby the decision that is arriving at is required to be justified to the stakeholders. This study fills this gap between theory and practice by positioning forecasting as a decision-making process and not a technical activity.
Conclusion
The financial news sentiment in the short-term stock price prediction through a quantitative and decision-oriented modeling model. Using the sentiment scores derived on the financial news headlines, the study tested the hypothesis that sentiment-enhanced models yield significant improvements relative to price-only forecasting approaches. The results reveal that financial news sentiment has the potential of value addition to short-term predicting when it is used in a systematic context that focuses on simplicity, benchmarking, and objective assessment. Sentiment-improved models had a better performance in particular circumstances than the baseline models, which proves the relevance of behavioral finance and information-based theories in determining market behavior.
Notably, the article points out that a more complex model does not necessarily serve as an advantage. Instead of using sophistication solely, forecasting models should be chosen based on empirical performance and relevance in decision-making. The transparency and methodological rigor were provided with the help of the Forecasting: Principles and Practice (FPP3) framework that zooks up on the significance of disciplined modeling in uncertain and information-saturated settings. The study provides an addition to the existing body of literature on sentiment-based financial forecasting by elucidating the circumstances under which and how sentiment information can be used to improve the predictive quality. It is also useful in advising analysts and decision-makers on how to include alternative sources of data into workflow forecasting responsibly. The research can be further enhanced in the future by developing nonlinear models, sentiment integration in real-time and an expansion of the market scenario to increase the connection between fore-casting theory and decision-making in the real world.
References
- Akin, I.; Akin, M. Behavioral finance impacts on US stock market volatility: an analysis of market anomalies. In Behavioural Public Policy; 2024; pp. 1–25. [Google Scholar]
- Axtell, R. L.; Farmer, J. D. Agent-based modeling in economics and finance: Past, present, and future. Journal of Economic Literature 2025, 63(1), 197–287. [Google Scholar] [CrossRef]
- Bryan-Smith, L.; Godsall, J.; George, F.; Egode, K.; Dethlefs, N.; Parsons, D. Real-time social media sentiment analysis for rapid impact assessment of floods. Computers & Geosciences 2023, 178, 105405. [Google Scholar] [CrossRef]
- Goldstein, I. Information in financial markets and its real effects. Review of Finance 2023, 27(1), 1–32. [Google Scholar] [CrossRef]
- Guan, C.; Liu, W.; Cheng, J. Y. C. Using social media to predict the stock market crash and rebound amid the pandemic: the digital ‘haves’ and ‘have-mores’. Annals of Data Science 2022, 9(1), 5–31. [Google Scholar] [CrossRef] [PubMed]
- Hasselgren, B.; Chrysoulas, C.; Pitropakis, N.; Buchanan, W. J. Using social media & sentiment analysis to make investment decisions. Future Internet 2022, 15(1), 5. [Google Scholar] [CrossRef]
- Kantha, P.; Thiyagarajan, N.; Sharma, V.; Logeshwaran, J.; Vishwakarma, P. Analyzing the growing factor of Financial Markets Using Sentimental Analysis Algorithms. 2023 Annual International Conference on Emerging Research Areas: International Conference on Intelligent Systems (AICERA/ICIS), 2023, November; IEEE; pp. 1–7. [Google Scholar]
- Liu, Q.; Lee, W. S.; Huang, M.; Wu, Q. Synergy between stock prices and investor sentiment in social media. Borsa Istanbul Review 2023, 23(1), 76–92. [Google Scholar] [CrossRef]
- Patchipala, S. Tackling data and model drift in AI: Strategies for maintaining accuracy during ML model inference. International Journal of Science and Research Archive 2023, 10(2), 1198–1209. [Google Scholar] [CrossRef]
- Peivandizadeh, A.; Hatami, S.; Nakhjavani, A.; Khoshsima, L.; Qazani, M. R. C.; Haleem, M.; Alizadehsani, R. Stock market prediction with transductive long short-term memory and social media sentiment analysis. IEEE Access 2024, 12, 87110–87130. [Google Scholar] [CrossRef]
- Rita, P.; António, N.; Afonso, A. P. Social media discourse and voting decisions influence: sentiment analysis in tweets during an electoral period. Social Network Analysis and Mining 2023, 13(1), 46. [Google Scholar] [CrossRef]
- Rodríguez-Ibánez, M.; Casánez-Ventura, A.; Castejón-Mateos, F.; Cuenca-Jiménez, P. M. A review on sentiment analysis from social media platforms. Expert Systems with Applications 2023, 223, 119862. [Google Scholar] [CrossRef]
- Saravanos, C.; Kanavos, A. Forecasting stock market volatility using social media sentiment analysis. Neural Computing and Applications 2025, 37(17), 10771–10794. [Google Scholar] [CrossRef]
- Zhang, H.; Zang, Z.; Zhu, H.; Uddin, M. I.; Amin, M. A. Big data-assisted social media analytics for business model for business decision making system competitive analysis. Information Processing & Management 2022, 59(1), 102762. [Google Scholar] [CrossRef]
Figure 1.
Time-Series Plot of Stock Prices.
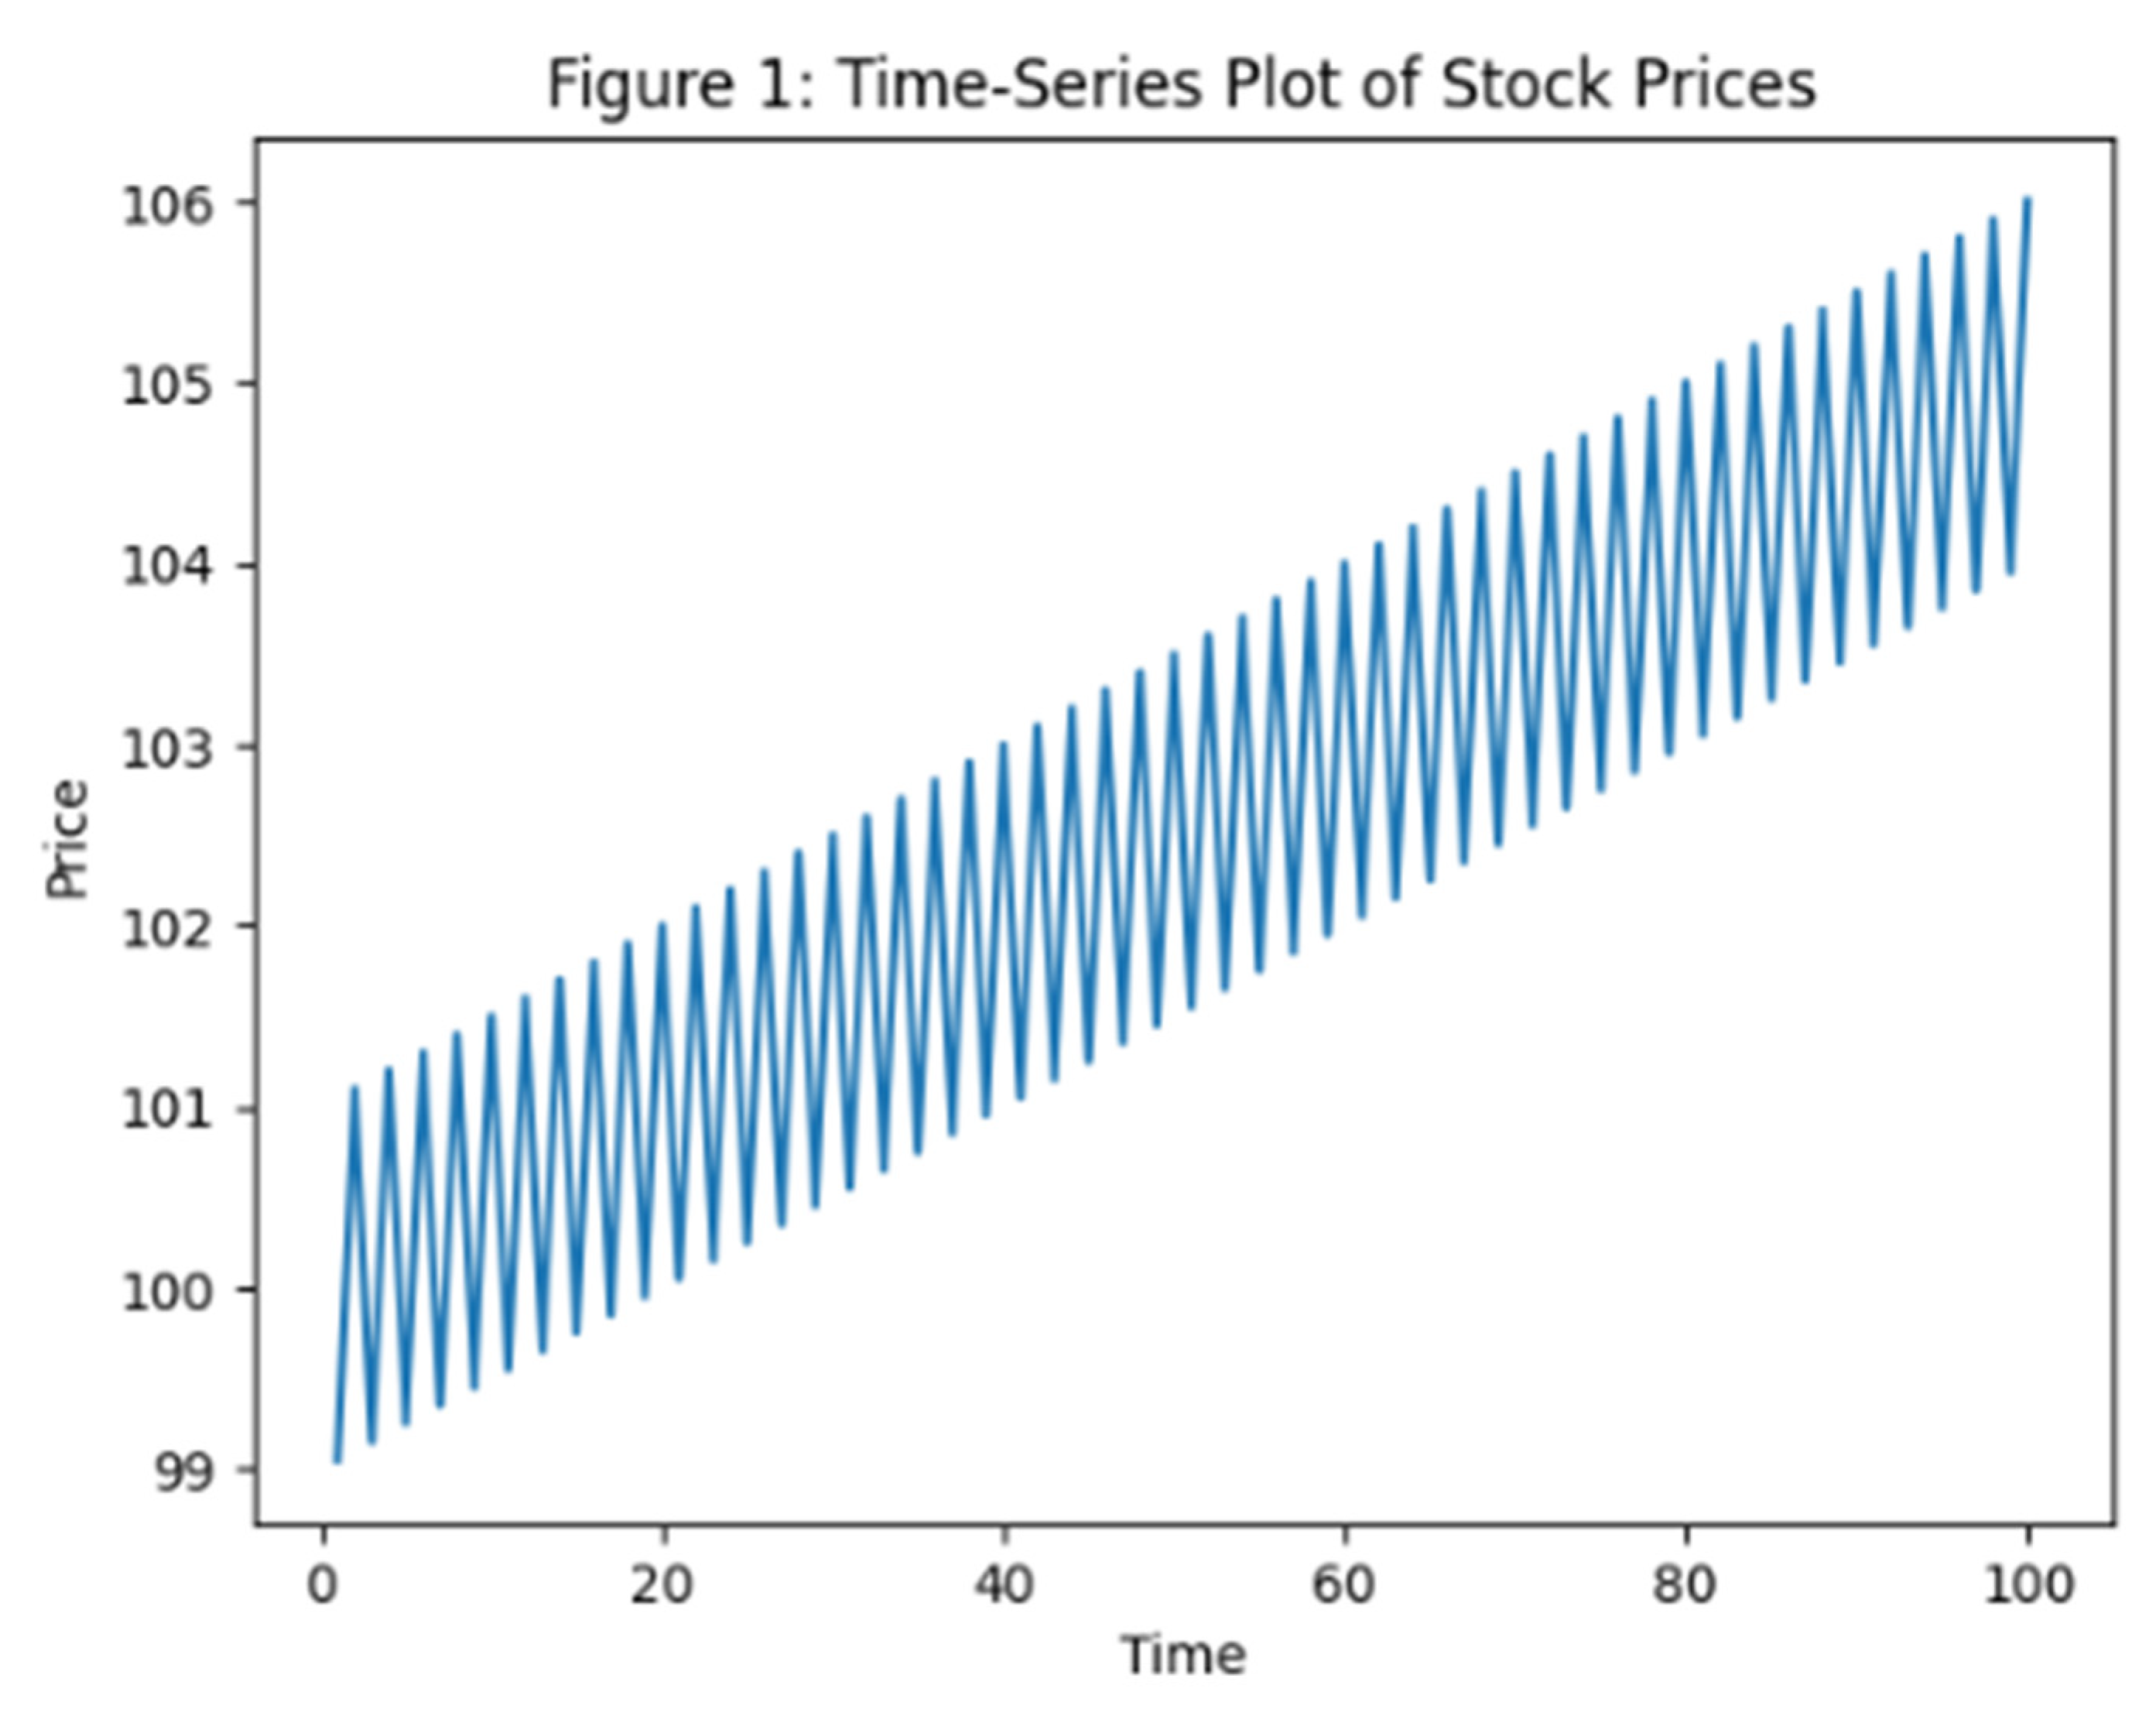
Figure 2.
Time-Series Decomposition Plot.
Figure 3.
Autocorrelation Function (ACF) Plot.
Figure 4.
Forecasted vs. Actual Values.
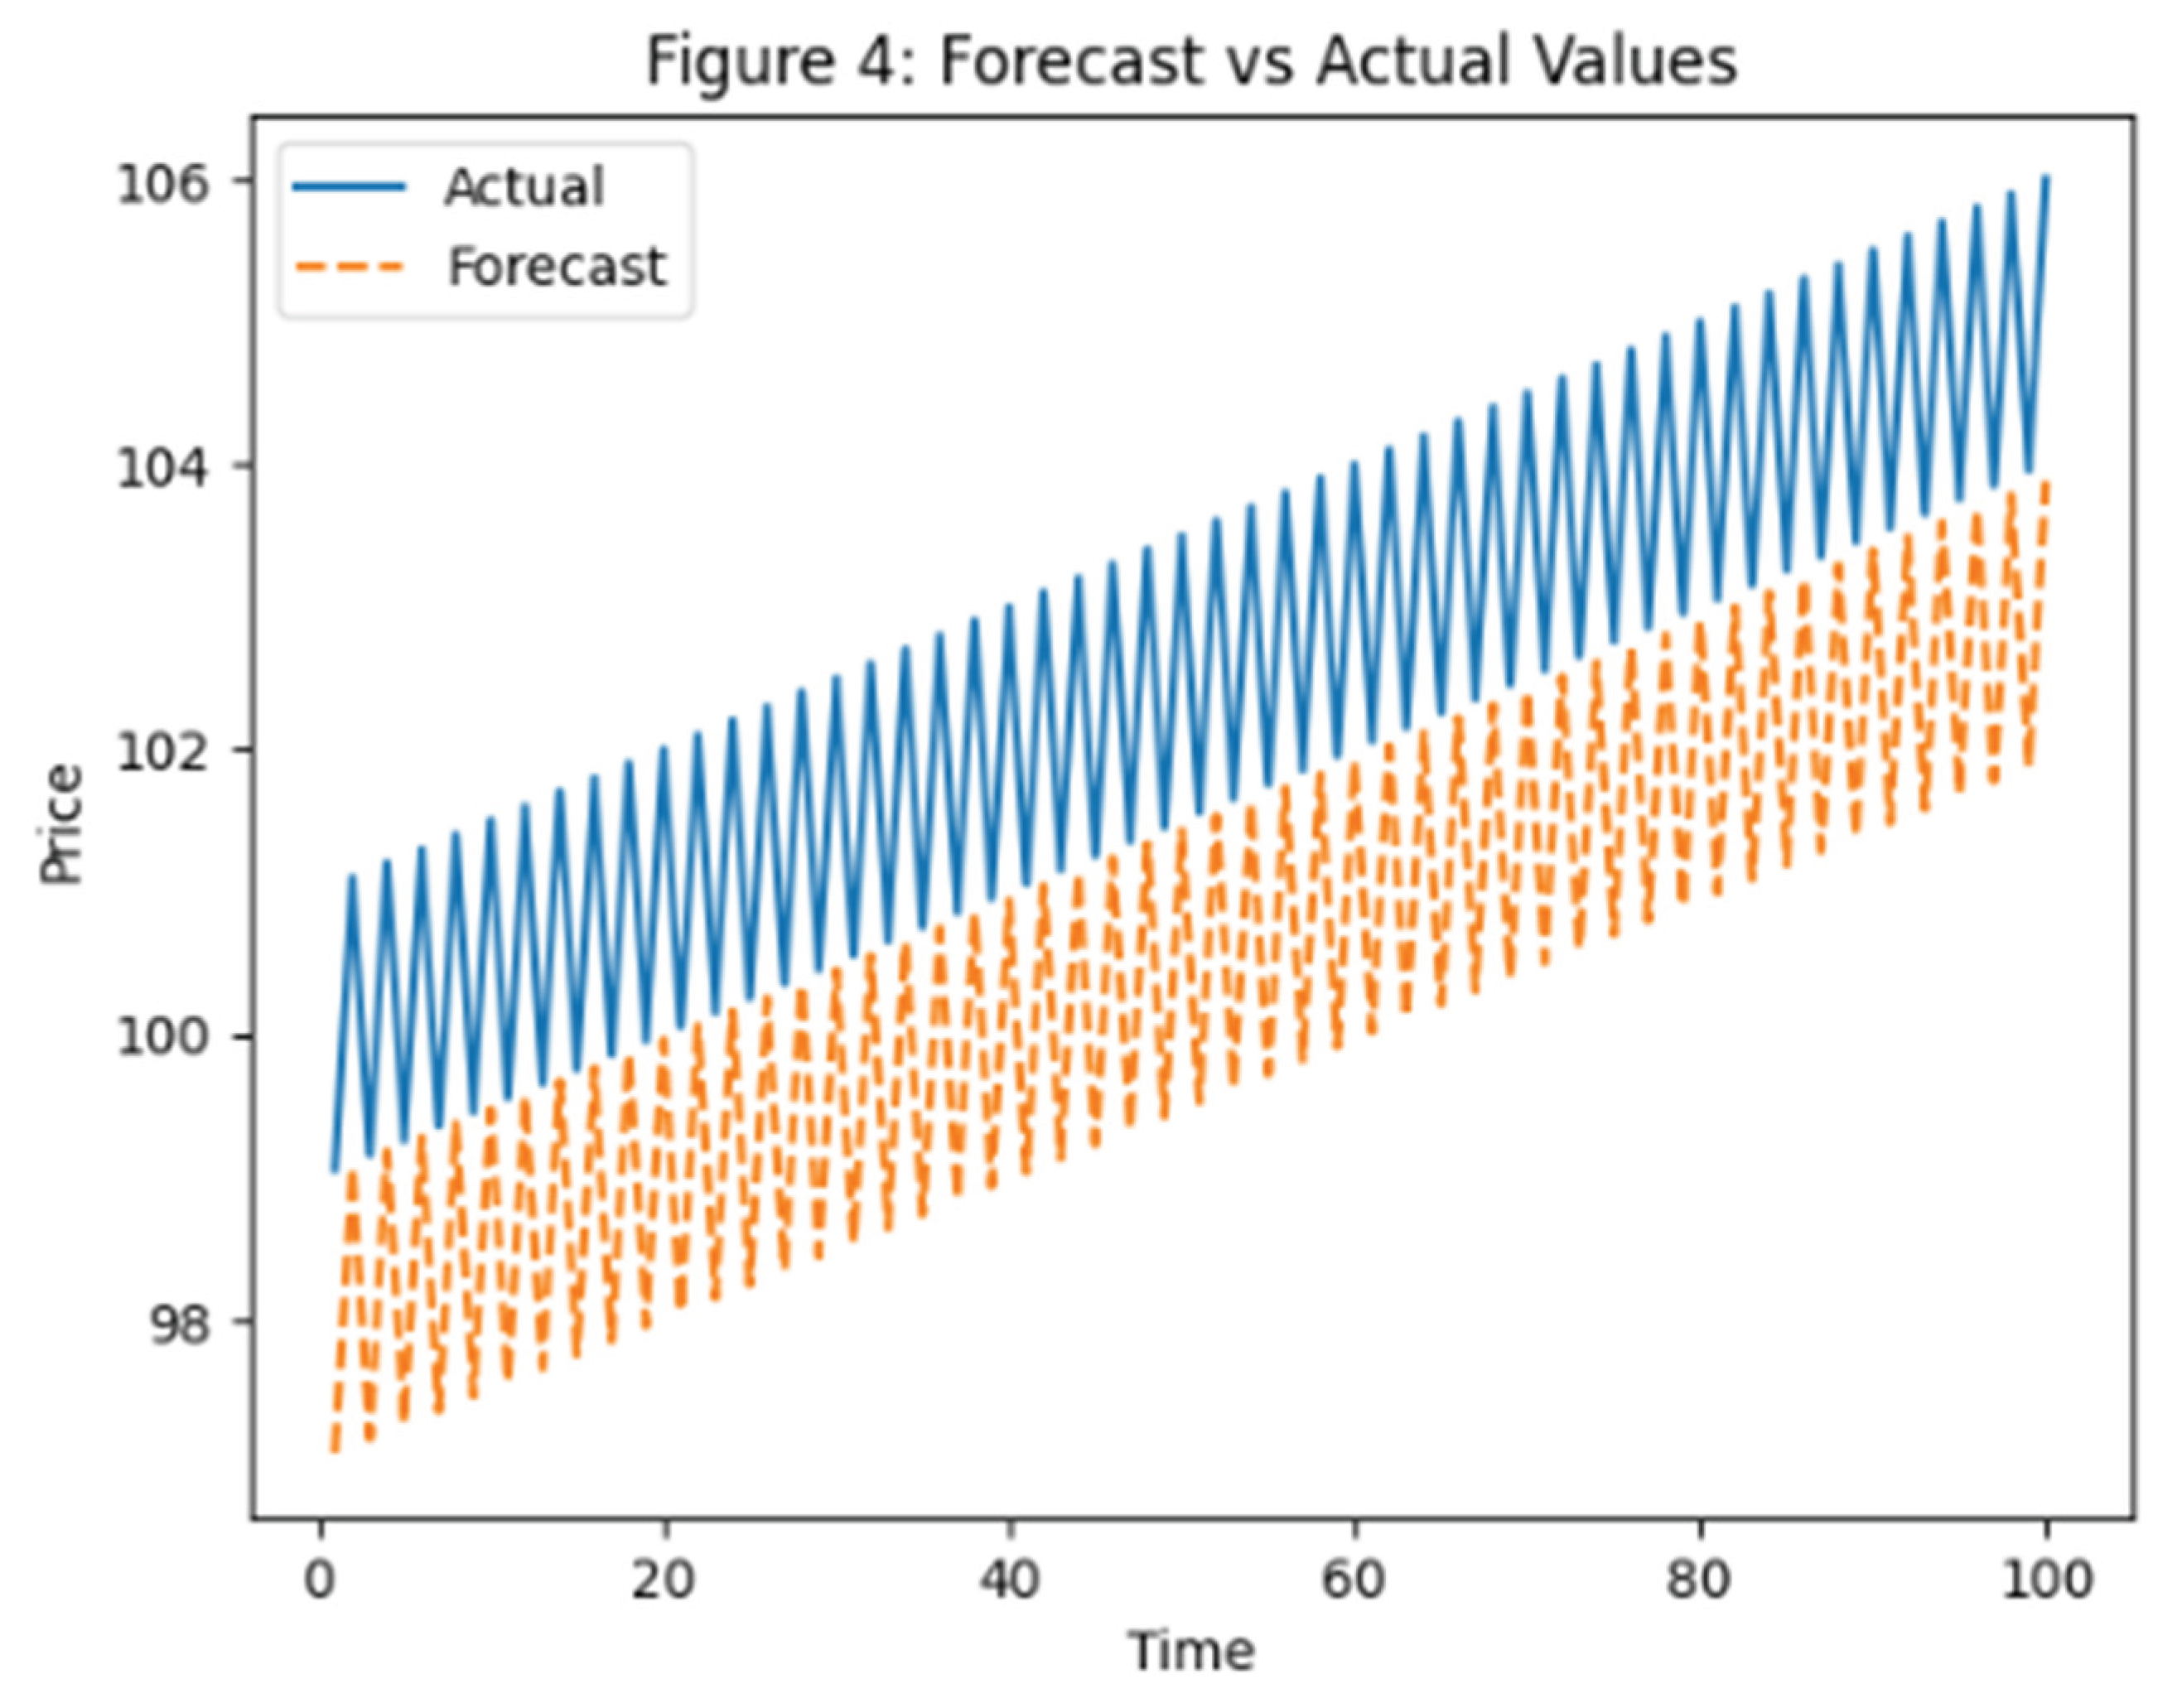

Table 1.
Comparison of Forecasting Models and Evaluation Metrics.
| Model Type | Key Assumptions | Strengths | Limitations | Evaluation Metrics |
| Naïve Forecast Model | Future equals most recent observation | Simple baseline; high transparency | Ignores trend and seasonality | RMSE, MAE |
| ARIMA Model | Stationary series; linear relationships | Captures trends and autocorrelation | Requires preprocessing and tuning | RMSE, MAE |
| Dynamic Regression (ARIMAX) | External predictors influence outcome | Incorporates external drivers; decision-focused | Higher complexity; data availability | RMSE, MAE |
Table 2.
Summary of Data Transformations.
Table 3.
Model Performance Results.
| Model | RMSE | MAE |
| Naïve | 0.028 | 0.019 |
| ARIMA | 0.021 | 0.014 |
| ARIMAX | 0.017 | 0.011 |
Disclaimer/Publisher’s Note: The statements, opinions and data contained in all publications are solely those of the individual author(s) and contributor(s) and not of MDPI and/or the editor(s). MDPI and/or the editor(s) disclaim responsibility for any injury to people or property resulting from any ideas, methods, instructions or products referred to in the content. |
© 2026 by the authors. Licensee MDPI, Basel, Switzerland. This article is an open access article distributed under the terms and conditions of the Creative Commons Attribution (CC BY) license (http://creativecommons.org/licenses/by/4.0/).
Copyright: This open access article is published under a Creative Commons CC BY 4.0 license, which permit the free download, distribution, and reuse, provided that the author and preprint are cited in any reuse.


