Submitted:
24 February 2026
Posted:
26 February 2026
You are already at the latest version
Abstract
Indoor Environmental Quality (IEQ) is a key driver of employee well-being and performance, yet most studies examine isolated factors or private-sector settings. Evidence remains limited on how integrated IEQ conditions affect employee experience in public-sector workplaces, where diverse staff and aging infrastructure create distinct challenges. This study examined how a municipal utility’s flexible, technology-enabled WorkHub enhanced employee collaboration, satisfaction, and engagement, aiming to generate evidence-based insights for adaptive, health-supportive workplace design. A mixed-methods approach combined quantitative and qualitative data. Ninety-eight employees completed the Workplace Environment Satisfaction and Performance Questionnaire, evaluating 18 IEQ dimensions and five outcome categories. Open-ended responses and a think tank session with 24 employees were thematically analyzed to identify strengths, challenges, and opportunities. Quantitative results showed significantly higher satisfaction in 15 of 18 IEQ dimensions, including layout, air quality, and coworker interaction, along with improved collaboration and job satisfaction. Qualitative insights reinforced these gains, highlighting technology integration, natural light, and supportive culture, while noting needs for better acoustics and privacy. Overall, the study underscores how integrating IEQ strategies with human-centered design enhances wellbeing and organizational effectiveness.
Keywords:
environmental design
; architecture
; indoor environmental quality
; office design
; evidence-based design
1. Introduction
Workplace design and indoor environmental quality (IEQ) are central to employee well-being, productivity, and organizational effectiveness. As hybrid and activity-based work models proliferate, the physical environment has become a key mediator of social interaction, cognitive performance, and mental health. Studies increasingly demonstrate that lighting, air quality, acoustics, thermal comfort, biophilic design, layout, cleanliness, and user control are not merely physical conditions but integral components of a psychosocial ecosystem shaping collaboration, engagement, and connectivity [1,2,3].
Yet most research still examines IEQ factors in isolation, offering limited insight into how their combined effects shape cognitive and social outcomes. As hybrid work becomes the new norm, understanding how integrated environmental conditions foster social cohesion, creativity, and engagement is increasingly urgent. Globally, organizations face growing challenges of disconnection and stress that affect mental health and productivity [4]. Emerging frameworks such as “Brain Capital” highlight how cognitive resilience and social connectedness depend on supportive work environments [5,6].
In alignment with these ideas, a public-sector organization in Southern California implemented a flexible, technology-enabled workspace designed to enhance both individual focus and team engagement. This environment integrates open zones, quiet rooms, ergonomic furnishings, and collaborative lounges to promote connectivity, creativity, and productivity. While the conceptual foundations of such hybrid-ready environments are well established, empirical evidence of their real-world impact, particularly in publicly governed institutions, remains limited. To address this gap, this study investigates how integrated environmental quality affects collaboration, engagement, and connectivity. Drawing on environmental psychology, organizational behavior, and architectural design, the study examines multiple IEQ factors, including lighting, biophilic design, air quality, acoustics, thermal comfort, cleanliness, layout, furniture, user control, and access to views, as interdependent systems influencing cognitive, social, and emotional experiences. Using environmental assessment, behavioral observation, and employee surveys, the project advances understanding of how workplace environments function as adaptive ecosystems that shape human behavior. Ultimately, this research contributes to evidence-based workplace design by exploring how human-centered, hybrid-ready environments can strengthen connectivity, collaboration, and engagement, core dimensions of organizational health in an era defined by flexibility, complexity, and cognitive demand.
1.1. Theoretical Framework: IEQ and the Human Workplace Experience
The quality of the physical work environment has long been recognized as a critical determinant of organizational performance and human well-being [7,8]. Building on this foundation, the present theoretical framework positions IEQ as a multidimensional construct that shapes both the physical and psychosocial dimensions of the employee experience. Grounded in theories from environmental psychology, organizational behavior, and architectural design, the framework conceptualizes IEQ as an integrated system that influences collaboration, engagement, connectivity, productivity, and job satisfaction [9,10]. (Figure 1)
A literature review across major databases synthesized interdisciplinary studies on environmental psychology, ergonomics, and workplace design to inform the conceptual framework. The literature revealed consistent associations between IEQ dimensions and positive employee outcomes such as well-being, cognitive function, and interpersonal effectiveness [1,10,11]. However, it also identified a persistent gap in integrative, multivariable analyses of environmental quality—particularly within public sector settings where diverse workforce needs and aging infrastructure affect design performance [7,9]. These insights informed the framework’s development, positioning IEQ factors as interrelated variables that operate alongside personal attributes such as preference, health, demographics, and tenure to predict employee experience. The resulting model advances a human-centered, systems-oriented understanding of workplace design, emphasizing that cognitive, social, and emotional dimensions of work are intrinsically shaped by environmental quality [8].
1.2. Dimensions of IEQ
Building on the literature review and theoretical framework, each dimension of IEQ was examined for its individual and collective influence on employee experience within the WorkHub. These dimensions, including lighting, air quality, acoustics, thermal comfort, biophilic design, layout and furniture, cleanliness and maintenance, control, and view, represent the physical and perceptual factors shaping a human-centered performance environment. IEQ factors collectively shape employees’ physical comfort, focus, and social interaction. Sensory comfort elements—such as lighting, acoustics, and thermal balance—directly influence concentration, well-being, and satisfaction. Biophilic and spatial design features, including daylight, natural elements, and adaptable layouts, foster engagement and creativity. Finally, user control over environmental conditions enhances autonomy and motivation, reinforcing the link between supportive environments and positive organizational outcomes. Collectively, these findings affirm that the integration of diverse IEQ factors, rather than their isolated optimization, most effectively supports well-being, collaboration, and organizational vitality within hybrid work environments.
1.3. Summary of Studies
The conceptual framework defines employee experience through five interrelated outcomes: collaboration, engagement, connectivity, productivity, and job satisfaction. These variables, derived from a systematic literature review, represent the most frequently studied and interconnected indicators of workplace performance and well-being [1,3,12]. Together, they capture both the social and cognitive dimensions of work, integrating insights from environmental psychology, organizational behavior, and workplace design [7,13]. Collaboration reflects the ability to share knowledge and coordinate effectively within environments that foster trust and communication [14,15]. Engagement represents motivation and emotional investment, which are influenced by comfort, autonomy, and psychological connection to place [16,17,18]. Connectivity captures belonging and social cohesion, particularly important in hybrid workplaces [18,19,20]. Productivity relates to concentration and efficiency shaped by environmental comfort and user control [21,22,23]. Job satisfaction reflects employees’ holistic evaluation of their environment and fulfillment at work [7,24,25,26].
Grounded in this framework, the study conceptualizes IEQ as a multidimensional system influencing both physical and psychosocial aspects of experience. Existing literature demonstrates strong associations between IEQ, satisfaction, and productivity, but limited understanding of how environmental conditions shape collaboration, engagement, and connectivity in public-sector hybrid workplaces [7,9]. This research addresses these gaps by evaluating the effectiveness of a flexible, technology-enabled workplace designed to enhance both individual and collective performance. Using a mixed-methods design that integrates participatory think-tank sessions and the Workplace Environment Satisfaction and Performance Questionnaire (WESP-Q™), the study provides an evidence-based evaluation of how environmental quality affects well-being, performance, and social interaction in a large, diverse public organization. This study aims to address the following questions:
How effective is the WorkHub in enhancing collaboration, connectivity, engagement, productivity, and satisfaction?
How do specific IEQ dimensions—lighting, air quality, acoustics, and thermal comfort—influence employee well-being and performance?
What design and operational strategies can inform scalable, hybrid-ready workplace models that support well-being and organizational effectiveness in the public sector?
2. Materials and Methods
This study employed a mixed-methods, cross-sectional design to examine how IEQ influences employee experience within the WorkHub. Quantitative and qualitative data were collected through a self-reported survey (WESP-Q™) and a participatory think-tank session. The survey captured employees’ perceptions of environmental and spatial conditions, satisfaction, and key outcomes, including collaboration, engagement, connectivity, productivity, and job satisfaction across both WorkHub and conventional office settings. Complementary qualitative insights from the think-tank session enriched the analysis by exploring employees’ perceptions, challenges, and design recommendations for improving hybrid workplace environments. Together, these methods provided a comprehensive understanding of how adaptive environmental factors shape well-being and organizational performance in a large public-sector context.
2.1. Partcipants
Ninety-eight employees from the organization’s administrative sites completed the survey, of which 93 responses were valid for analysis. The sample represented a diverse demographic profile across age, gender, and education. The largest age group was 25–34 years (32%), followed by 45–54 years (26%) and 35–44 years (25%), indicating balanced participation across career stages. Participants were highly educated, with 64% holding a bachelor’s degree and 30% a graduate or professional qualification. Gender distribution comprised 57% male, 42% female, and 1% preferring not to disclose.
2.2. Procedures and Data Collection
This research was conducted at one of the largest municipal utilities in the United States, with offices distributed across several locations. The primary site, the John Ferraro Building (JFB), houses most administrative operations, while additional offices include the Pacific Stock Exchange (PSE) and Sepulveda Office Building. These conventional settings feature fixed workstations and enclosed offices that provide privacy but limited flexibility for hybrid work. The WorkHub, located on the 6th floor of the JFB, was introduced as a flexible, technology-enabled workspace integrating ergonomic furniture, collaborative zones, enclosed meeting rooms, and hybrid communication tools such as dual monitors and video conferencing systems. This contrast between conventional and adaptive environments provided an ideal context for examining how spatial flexibility and environmental quality affect employee experience and performance (Figure 2)
The Workplace Environment Satisfaction and Performance Questionnaire (WESP-Q™) was developed in Qualtrics by integrating validated instruments, including the Center for the Built Environment (CBE) Occupant Survey [27,28], the Utrecht Work Engagement Scale (UWES) [29], the Occupant Self-Assessment of Productivity (OSAP) [30], and the Job Satisfaction Survey (JSS) [31], supplemented with organization-specific items. The survey comprised five sections: demographics, satisfaction with 18 IEQ dimensions, open-ended evaluations of workspace features, importance ratings of environmental factors, and self-reported outcomes for collaboration, engagement, connectivity, productivity, and job satisfaction. Items used a 7-point Likert scale from 1 (Very Dissatisfied/Strongly Disagree) to 7 (Very Satisfied/Strongly Agree). The survey was distributed electronically and promoted through internal communication materials, ensuring voluntary, confidential participation in accordance with institutional ethics. Complementing the survey, a 90-minute virtual think-tank session with 24 employees used structured Miro-based activities to identify key environmental challenges and design priorities.
2.3. Data Analysis
Quantitative data were analyzed using a combination of multivariate and non-parametric statistical tests. A series of Multivariate Analyses of Variance (MANOVA) were conducted to assess the effects of demographic characteristics (age, gender, education) and workspace use patterns (tenure, weekly hours in workspace, office building, space type) on satisfaction across IEQ dimensions. Given violations of normality in group distributions, Mann–Whitney U tests were employed to compare satisfaction and outcome ratings between WorkHub users and non-users. The analysis identified significant differences across 15 of 18 IEQ dimensions and multiple outcome categories, including collaboration access, work transition, productivity, and job satisfaction. Qualitative responses from open-ended survey items were analyzed using inductive thematic coding. Themes were categorized into major workplace challenges (e.g., acoustic disruption, thermal discomfort, lighting quality, cleanliness, and privacy) and strengths (e.g., technology infrastructure, natural light, supportive staff).
3. Results
The following presents the findings of the study based on the collected data.
3.1. Self-Reported Survey (WESP-Q™)
This section presents the quantitative and qualitative findings from the Self-Reported Survey (WESP-Q™), administered to employees working at both WorkHub and non-WorkHub locations. The analysis examines the relationships between IEQ variables and key employee outcomes, including collaboration, engagement, connectivity, productivity, and job satisfaction, and compares differences between user groups based on their level of WorkHub exposure.
3.1.1. Participant Demographics
A total of 98 employees aged 18 to over 65 years completed the survey, with 93 valid responses included in the analysis. Among respondents, 57.0% identified as male, 41.9% as female, and 1.1% preferred not to say. The largest age group was 25–34 years (32%), followed by 45–54 (26%) and 35–44 (25%), representing a balanced distribution across early-, mid-, and late-career stages. Most participants held a bachelor’s (64%) or graduate/professional degree (30%), indicating a highly educated sample (Figure 3).
A multivariate analysis of variance (MANOVA) examined the effects of age, gender, education, and their interactions on satisfaction with 18 workspace dimensions using a 7-point Likert scale. Age emerged as a significant predictor across several domains, including overall workspace (p = .026), personal space (p = .039), layout (p = .021), sound privacy (p < .001), acoustic quality (p < .001), thermal comfort (p = .004), cleanliness (p = .006), and coworker interaction (p = .002). Older employees consistently reported higher satisfaction, particularly regarding environmental comfort, acoustics, and interpersonal engagement, underscoring the need for age-responsive design strategies. Gender showed no significant effects, though marginal trends appeared for acoustic quality (p = .055) and personal space (p = .079). Education alone did not influence satisfaction, though minor patterns were observed in visual privacy and daylight. However, the three-way interaction of age, gender, and education was significant for overall satisfaction (p < .001), layout (p < .001), thermal comfort (p = .001), and air quality (p = .038), suggesting that satisfaction is shaped by intersecting demographic characteristics. Levene’s Test indicated heterogeneity of variances across several domains, reinforcing the need for user-centered design strategies that account for diverse employee experiences (Table 1).
3.1.2. Workplace Use Patterns
A Participants reported their workspace tenure, weekly usage hours, and primary office location. As shown in Figure 4, most employees worked in the John Ferraro Building and spent between 10 and 40 hours per week in their workspace, reflecting varied occupancy patterns consistent with hybrid work models across office types.
A multivariate analysis of variance (MANOVA) examined the effects of Time in Space, Hours per Week, Office Building, Space Type, and their interactions on satisfaction with 18 dimensions of the physical workspace, rated on a seven-point Likert scale. Workspace tenure did not significantly influence satisfaction across any dimension (all p > .05), indicating that longer occupancy or employment duration did not necessarily correspond to higher satisfaction. In contrast, Hours per Week emerged as a consistent predictor, significantly affecting perceptions of personal space (p = .002), visual privacy (p = .013), electric lighting (p = .023), cleanliness (p = .011), and maintenance quality (p = .020). Employees who spent more time in their workspace also reported greater satisfaction with coworker interaction (p = .009) and overall building experience (p = .044), suggesting greater engagement and environmental sensitivity. Office Building significantly affected overall workspace satisfaction (p = .043) and showed a marginal effect for cleanliness (p = .058). Space Type, however, did not significantly predict satisfaction in any domain, suggesting that office configuration alone had limited influence on perceived comfort or performance (Table 2).
3.1.2. Workhub Access and Utilizations
Among the 93 employees who participated in the survey, 73.1% (n = 68) reported having current access to the WorkHub, 6.5% (n = 6) indicated they did not have access, and 20.4% (n = 19) were uncertain about their access status. Regarding actual usage, 58.1% (n = 54) of respondents reported prior experience working in the WorkHub, whereas 41.9% (n = 39) indicated they had not utilized the space. Among the 54 participants who reported using the WorkHub, 5.6% (n = 3) indicated they had used it only once, 9.3% (n = 5) reported rare use (2–3 times total), and 40.7% (n = 22) reported occasional use. In contrast, 24.1% (n = 13) stated they used the WorkHub often as part of their routine, and 20.4% (n = 11) reported using it very frequently, describing it as their primary workspace or a place they use most weeks (Figure 5).
3.2. Self-Reported Satisfaction and Work Environment
The following section presents the results on self-reported satisfaction with the workplace environment.
3.2.1. Descriptive Analysis of Satisfaction Ratings
To evaluate key employee outcomes, participants rated 15 items across five categories: collaboration, connectivity, engagement, productivity, and job satisfaction, using a seven-point Likert scale ranging from 1 (Strongly Disagree) to 7 (Strongly Agree). As shown in Figure 6, the highest satisfaction levels were reported for electric lighting, visual privacy, and personal space (over 60% satisfied), reflecting strengths in illumination and spatial configurations that support comfort and control. In contrast, thermal comfort, sound privacy, and acoustic quality were the most dissatisfying aspects, with more than 40% of respondents dissatisfied, pointing to persistent challenges in managing thermal and acoustic conditions. Mid-ranked features such as furnishing comfort, layout, overall workspace quality, and cleanliness showed more mixed responses, suggesting variability linked to departmental context and personal preferences.
3.2.2. Effects of WorkHub Use on Workspace Satisfaction
To evaluate key employee outcomes, participants rated 15 items across five categories: collaboration, connectivity, engagement, productivity, and job satisfaction, using a seven-point Likert scale ranging from 1 (Strongly Disagree) to 7 (Strongly Agree). As shown in Figure 6, the highest satisfaction levels were reported for electric lighting, visual privacy, and personal space (over 60% satisfied), reflecting strengths in illumination and spatial configurations that support comfort and control. In contrast, thermal comfort, sound privacy, and acoustic quality were the most dissatisfying aspects, with more than 40% of respondents dissatisfied, pointing to persistent challenges in managing thermal and acoustic conditions. Mid-ranked features such as furnishing comfort, layout, overall workspace quality, and cleanliness showed more mixed responses, suggesting variability linked to departmental context and personal preferences.
To assess the impact of WorkHub utilization on occupants’ satisfaction across 18 workspace attributes, tests of normality confirmed non-normal distributions for both groups, so non-parametric Mann–Whitney U tests were used for comparison. Results showed that participants who had used the WorkHub reported significantly higher satisfaction across most factors compared with non-users. Significant differences were observed for overall workspace satisfaction, layout, thermal comfort, air quality, lighting, cleanliness, furnishings, coworker interaction, and overall building experience (Table 3). These findings suggest that WorkHub users generally perceived their environment more favorably, though no differences were found in visual privacy, sound privacy, or electric lighting, indicating areas for further design refinement.
Figure 7 illustrates the median satisfaction scores across 18 workspace aspects, comparing employees who had used the WorkHub versus those who had not. Across nearly all categories, WorkHub users reported consistently higher satisfaction levels. These visual trends align with the results of the Mann–Whitney U test, which identified statistically significant differences favoring WorkHub users in 15 of the 18 domains.
3.3. Self-Reported Employee Outcomes
The following section presents the findings related to self-reported employee outcomes.
3.3.1. Descriptive Analysis of Self-Reported Employee Outcomes
Figure 7 illustrates the median satisfaction scores across 18 workspace aspects, comparing employees who had used the WorkHub versus those who had not. Across nearly all categories, WorkHub users reported consistently higher satisfaction levels. These visual trends align with the results of the Mann–Whitney U test, which identified statistically significant differences favoring WorkHub users in 15 of the 18 domains. To assess employee outcomes, participants rated 15 statements across five categories: collaboration, connectivity, engagement, productivity, and job satisfaction, using a 7-point Likert scale. Figure 8 shows the distribution of responses, with red hues indicating disagreement, light tones neutrality, and green shades agreement. Collaboration items assessed employees’ ability to work with colleagues (Collaboration Access), shift between group and solo tasks (Work Transition), and whether the workspace supported collaboration (Workspace & Collaboration). Connectivity items measured team connection, informal interaction, and how the layout facilitated social interaction. Engagement items included emotional energy, pride in work, and cognitive immersion, while productivity items assessed focus support, efficiency, and spatial support for productivity. Job satisfaction items measured overall satisfaction, motivational support, and the influence of the physical workspace. Overall, responses indicated a favorable perception of the workplace, with most ratings in the agreement range. Job Satisfaction, Informal Interaction, and Team Connection received the highest scores, suggesting employees feel positive about their roles, social ties, and workplace connections. However, some items, particularly those tied to collaboration (Collaboration Access, Work Transition, Workspace & Collaboration), as well as Pride in Work and Workspace & Engagement, showed greater variability, indicating opportunities to strengthen collaboration infrastructure, reinforce pride, and optimize conditions for productivity.
3.3.2. Effects of WorkHub Use on Employees’ Outcomes
To determine whether WorkHub utilization was associated with differences in employee outcomes, tests of normality using the Kolmogorov–Smirnov and Shapiro–Wilk methods were performed for each variable. The results indicated significant deviations from normality across both user groups (p < .001), prompting the use of a non-parametric analysis. The Mann–Whitney U test compared outcomes between WorkHub users and non-users, with all items measured on a 7-point Likert scale. Findings revealed statistically significant differences across many outcomes, with WorkHub users reporting more favorable experiences overall.
As shown in Table 4, significant differences emerged for Collaboration Access (p < .001), Work Transition (p = .009), Workspace & Collaboration (p = .016), Pride in Work (p = .001), Focus Support (p = .006), Work Efficiency (p = .003), Workspace & Productivity (p = .023), and Job Satisfaction (p = .010). These results suggest that the WorkHub positively influenced collaboration, engagement, productivity, and overall satisfaction. By contrast, no significant differences were observed for Emotional Engagement (p = .854), Workspace & Engagement (p = .236), Team Connection (p = .309), Informal Interaction (p = .355), Workspace & Connectivity (p = .092), Motivation Support (p = .471), or Workspace & Job Satisfaction (p = .495). These findings indicate that some outcomes were consistent across both groups and may require further study or targeted design improvements to ensure equity in user experience.
Figure 9 compares employees’ outcome scores between those who use the WorkHub and those who do not, across 15 different dimensions. Overall, WorkHub users consistently report higher median scores in key areas such as collaboration access, work transition, workplace collaboration, workspace connectivity, focus support, and job satisfaction. Statistically significant differences are marked, with several outcomes (e.g., collaboration access, work transition, focus support, and work efficiency) showing strong significance (p < .01) and others showing moderate significance (p < .05). These results suggest that using the WorkHub is associated with more positive employee experiences related to collaboration, engagement, efficiency, and satisfaction.
3.4. Importance of Environmental Factors in Workplace Satisfaction and Performance
In the final section of the WESP-Q™ survey, employees rated the importance of environmental factors for workplace satisfaction and performance on a 7-point Likert scale. The highest-rated factors were Access to telecommunication and collaboration tools (M = 6.20), Technology (M = 6.05), Privacy (M = 5.95), and Environmental control (M = 5.79), all near or above 6. In contrast, Personalization (M = 5.29) and Design aesthetics (M = 5.46) received lower ratings. These results suggest that employees value functional and operational features, particularly communication, technology, and environmental control, more than visual appeal or personalization. To examine whether there were significant differences in the importance ratings of environmental factors between employees who have used the WorkHub and those who have not, the non-parametric Mann-Whitney U test was conducted. This approach was selected based on the results of the Shapiro-Wilk tests of normality, which indicated significant deviations from normality for all six environmental features across both user and non-user groups (p < .05), thus violating the assumptions required for parametric testing. The Mann–Whitney U tests revealed statistically significant differences between WorkHub users and non-users in their importance ratings for two environmental features. Specifically, employees who have have worked in the workhub previously rated Technology (U = 467.000, p < .001) and Aesthetics (U = 452.500, p < .001) as significantly more important to their satisfaction and performance in the workspace than people who have never experienced working in the workhub. No significant differences were observed between the groups for Environmental Control, Privacy, Personalization, or Collaboration Tools, suggesting similar perceptions of their importance across both user types. These findings highlight that the WorkHub experience may heighten sensitivity to certain functional and visual elements of the work environment. As illustrated in Figure 10, the box plots visually reinforce the statistically significant differences identified in the Mann–Whitney U tests. WorkHub users rated Technology significantly higher in importance compared to non-users, indicating a stronger emphasis on technological resources among those engaged with the WorkHub environment. In contrast, non-WorkHub users placed greater importance on Aesthetics, suggesting heightened sensitivity to or unmet needs regarding the visual quality of their current workspace. For the remaining environmental factors, including Control, Privacy, Personalization, and Collaboration Tools, the median scores and overall distributions were comparable between groups, supporting the finding that these aspects are valued similarly regardless of WorkHub use.
4. Discussion
This mixed-methods study demonstrates that a purpose-built, technology-enabled workspace enhanced employees’ perceptions of environmental quality and work experience. WorkHub users reported higher satisfaction across most IEQ dimensions and stronger outcomes for collaboration, focus, and job satisfaction. Qualitative findings supported these results, emphasizing strengths in technology integration, daylight, and staff support, while highlighting ongoing challenges with acoustics, thermal comfort, and privacy. These findings align with prior research linking IEQ elements such as lighting, air quality, and furnishings with performance and well-being (Frontczak & Wargocki, 2011; Al Horr et al., 2016; Deng et al., 2024). Persistent challenges with acoustic and visual privacy highlight the well-known trade-off between openness and concentration (Kim & de Dear, 2013; Bernstein & Turban, 2018).
From a psychosocial standpoint, results reflect the Job Demands–Resources (JD-R) model: environments that enhance resources, comfort, choice, and control promote engagement and related outcomes (Kahn, 1990; Schaufeli & Bakker, 2004; Bakker & Demerouti, 2007). Elevated focus and efficiency ratings likely reflect this resource pathway, where physical affordances (adjustable furniture, spatial variety, reliable technology) reduce demands and support self-regulation. However, non-significant differences in emotional engagement and team connection suggest that environmental improvements alone may not fully shift socioemotional states; managerial and social factors likely moderate these effects.
The mixed results for privacy (no significant differences in visual or sound privacy) echo the well-documented privacy–communication trade-off in open and hybrid offices (Kim & de Dear, 2013; Bernstein & Turban, 2018). Qualitative themes—noise spillover, thin partitions, and difficulty holding confidential conversations—underscore the need for targeted acoustic strategies. Similarly, thermal discomfort despite higher overall satisfaction highlights the sensitivity of thermal conditions to perceived control and micro-zoning [32,33]. The strong emphasis WorkHub users placed on technology suggests that once employees experience reliable digital tools integrated with spatial design, expectations rise and technology becomes essential for effective hybrid work, aligning with the growing centrality of digitally supported, activity-based workplaces [34].
Evidence on integrated IEQ interventions in public agencies remains limited. This study demonstrates that even within aging facilities and complex operations, a user-centered retrofit can improve perceived environmental quality, collaboration readiness, efficiency, and satisfaction. The results extend IEQ research beyond private-sector and laboratory contexts to a real-world public utility with diverse staff and legacy infrastructure, addressing a key gap in integrated, multivariable evaluations.
A key strength of this study lies in its convergent mixed-methods design, which integrated statistical analysis with qualitative insights to capture both measurable outcomes and experiential perspectives. The focus on a large, public-sector organization contributes novel evidence to an underexplored context in workplace research. Several limitations should be acknowledged. The cross-sectional design and potential self-selection into WorkHub use limit causal inference. The reliance on self-reported measures may introduce perceptual bias; future studies should incorporate objective environmental and behavioral data, such as CO₂ concentration, noise levels, illuminance, and occupancy analytics. Although demographic effects were examined, the sample size constrained subgroup analysis. Further research should explore issues of equity, accessibility, and long-term organizational impact. Finally, generalizability may be limited to similar urban public-sector environments with comparable workforce diversity and infrastructure.
Future research should adopt quasi-experimental or longitudinal designs to establish stronger causal links between environmental interventions and employee outcomes. Pre- and post-occupancy studies or stepped-wedge designs would enable evaluation of how adaptive workspace features influence behavior and well-being over time. Integrating objective environmental data such as air quality, illuminance, temperature, and acoustic levels with behavioral indicators like space utilization and meeting patterns would clarify the mechanisms through which IEQ affects collaboration, focus, and productivity. Given the mixed results for socioemotional outcomes such as team connection, future studies should also examine how leadership practices, workplace culture, and hybrid work policies interact with physical settings to shape engagement and connectivity. Economic evaluations that account for life-cycle costs of maintenance and technology would further inform the scalability of adaptive design strategies in resource-constrained public agencies. The findings from this study highlight the potential of a user-centered, integrated approach to workplace design in enhancing environmental quality and employee experience within the public sector. The WorkHub demonstrates that improvements in layout, air quality, cleanliness, furnishings, and coworker interaction can meaningfully enhance collaboration, productivity, and satisfaction. Persistent challenges in acoustics, thermal comfort, and privacy indicate areas for continued refinement. Overall, the results affirm a systems perspective in which environmental quality, technology, and user control function as interdependent resources that reinforce engagement and organizational performance. For public organizations adapting to hybrid work models, investing in these integrated environmental and psychosocial factors provides a clear pathway to fostering connectivity, well-being, and institutional resilience.
Author Contributions
Conceptualization, N. G and H. G; methodology, N. G and H. G; formal analysis, N. G and H. G; data curation, N. G and H. G; writing—original draft preparation, N. G and H. G; writing—review and editing, N. G and H. G; visualization, N. G and H. G; All authors read and agreed to the published version of the manuscript.
Funding
This research received no external funding.
Institutional Review Board Statement
This study involving human participants was reviewed and approved by the Institutional Review Board (IRB) at California State University, Northridge (CSUN) prior to data collection. The study was determined to meet federal and institutional requirements for the protection of human subjects. Approval was granted under protocol number IRB-FY22-284 on 16 January 2025. All participants provided informed consent prior to participation, and appropriate measures were taken to ensure confidentiality and the ethical handling of data throughout the research process.
Informed Consent Statement
Informed consent was obtained from all subjects involved in the study. Prior to participation, individuals were provided with detailed information regarding the purpose of the research, study procedures, potential risks and benefits, voluntary participation, and measures taken to ensure confidentiality. Participants were informed of their right to withdraw from the study at any time without penalty. No personally identifiable information is reported in this manuscript.
Data Availability Statement
The original contributions presented in this study are included in the article. Further inquiries can be directed to the corresponding author(s).
Acknowledgments
The authors gratefully acknowledge the Los Angeles Department of Water and Power (LADWP) for its collaboration and in-kind support, which contributed to the successful completion of this research. The authors also thank the ARCS Center at California State University, Northridge (CSUN) for its administrative and research support throughout the development of this study.
Conflicts of Interest
The authors declare no conflict of interest.
References
- Author Al Horr, Y.; Arif, M.; Kaushik, A.; Mazroei, A.; Katafygiotou, M.; Elsarrag, E. Occupant productivity and office indoor environment quality: A review of the literature. Build. Environ. 2016, 105, 369–389. [CrossRef]
- Fissore, V.I.; Fasano, S.; Puglisi, G.E.; Shtrepi, L.; Astolfi, A. Indoor environmental quality and comfort in offices: A review. Buildings 2023, 13, 2490. [CrossRef]
- Felgueiras, F.; Mourão, Z.; Moreira, A.; Gabriel, M.F. Indoor environmental quality in offices and risk of health and productivity complaints at work: A literature review. J. Hazard. Mater. Adv. 2023, 10, 100314. [CrossRef]
- World Health Organization. Mental Health and Work: Impact, Issues and Good Practices. Available online: https://www.who.int/news/item/17-06-2022-mental-health-and-work (accessed on 16 February 2026).
- Occhipinti, J.A.; Hynes, W.; Geli, P.; Eyre, H.A.; Song, Y.; Prodan, A.; Hickie, I.B. Building systemic resilience, productivity and well-being: A mental wealth perspective. BMJ Glob. Health 2023, 8, e012942. [CrossRef]
- Farina, F.R.; Booi, L.; Occhipinti, J.A.; Quoidbach, V.; Destrebecq, F.; Muniz-Terrera, G.; Eyre, H.A. Young adult brain capital: A new opportunity for dementia prevention. J. Alzheimers Dis. 2023, 94, 415–423. [CrossRef]
- Vischer, J.C. The concept of workplace performance and its value to managers. Calif. Manag. Rev. 2007, 49, 62–79. [CrossRef]
- Kim, J.; de Dear, R. Workspace satisfaction: The privacy–communication trade-off in open-plan offices. J. Environ. Psychol. 2013, 36, 18–26. [CrossRef]
- Becker, F. Offices at Work: Uncommon Workspace Strategies That Add Value and Improve Performance; Jossey-Bass: San Francisco, CA, USA, 2004.
- Frontczak, M.; Wargocki, P. Literature survey on how different factors influence human comfort in indoor environments. Build. Environ. 2011, 46, 922–937. [CrossRef]
- Appel-Meulenbroek, R.; Voordt, T.V.D.; Aussems, R.; Arentze, T.; Le Blanc, P. Impact of activity-based workplaces on burnout and engagement dimensions. J. Corp. Real Estate 2020, 22, 279–296. [CrossRef]
- Arif, M.; Katafygiotou, M.; Mazroei, A.; Kaushik, A.; Elsarrag, E. Impact of indoor environmental quality on occupant well-being and comfort: A review of the literature. Int. J. Sustain. Built Environ. 2016, 5, 1–11. [CrossRef]
- Heerwagen, J. Green buildings, organizational success and occupant productivity. Build. Res. Inf. 2000, 28, 353–367. [CrossRef]
- Manca, C.; Grijalvo, M.; Palacios, M.; Kaulio, M. Collaborative workplaces for innovation in service companies: Barriers and enablers for supporting new ways of working. Serv. Bus. 2018, 12, 525–550. [CrossRef]
- Bernstein, E.S.; Turban, S. The impact of the “open” workspace on human collaboration. Philos. Trans. R. Soc. B 2018, 373, 20170239. [CrossRef]
- Kahn, W.A. Psychological conditions of personal engagement and disengagement at work. Acad. Manag. J. 1990, 33, 692–724. [CrossRef]
- Schaufeli, W.B.; Bakker, A.B. Job demands, job resources, and their relationship with burnout and engagement: A multi-sample study. J. Organ. Behav. 2004, 25, 293–315. [CrossRef]
- Bakker, A.B.; Demerouti, E. The job demands–resources model: State of the art. J. Manag. Psychol. 2007, 22, 309–328. [CrossRef]
- Oldham, G.R.; Fried, Y. Job design research and theory: Past, present and future. Organ. Behav. Hum. Decis. Process. 2016, 136, 20–35. [CrossRef]
- Sailer, K.; McCulloh, I. Social networks and spatial configuration—How office layouts drive social interaction. Soc. Netw. 2012, 34, 47–58. [CrossRef]
- Haynes, B.P. Impact of workplace connectivity on office productivity. J. Corp. Real Estate 2008, 10, 286–302. [CrossRef]
- De Been, I.; Beijer, M. The influence of office type on satisfaction and perceived productivity support. J. Facil. Manag. 2014, 12, 142–157. [CrossRef]
- Deng, Z.; Dong, B.; Guo, X.; Zhang, J. Impact of indoor air quality and multi-domain factors on human productivity and physiological responses: A comprehensive review. Indoor Air 2024, 34, 5584960. [CrossRef]
- Locke, E.A. The nature and causes of job satisfaction. In Handbook of Industrial and Organizational Psychology; Dunnette, M.D., Ed.; Rand McNally: Chicago, IL, USA, 1976; pp. 1297–1349.
- Herzberg, F.I. Work and the Nature of Man; World Publishing Company: Cleveland, OH, USA, 1966.
- Judge, T.A.; Klinger, R. Job satisfaction: Subjective well-being at work. In The Science of Subjective Well-Being; Eid, M., Larsen, R.J., Eds.; Guilford Press: New York, NY, USA, 2008; pp. 393–413.
- Zagreus, L.; Huizenga, C.; Arens, E.; Lehrer, D. Listening to the occupants: A web-based indoor environmental quality survey. Indoor Air 2004, 14, 65–74. [CrossRef]
- Graham, L.T.; Parkinson, T.; Schiavon, S. Lessons learned from 20 years of CBE’s occupant surveys. Build. Cities 2021, 2, 1–20. [CrossRef]
- Schaufeli, W.B.; Bakker, A.B.; Salanova, M. Utrecht work engagement scale-9. Educ. Psychol. Meas. 2003, 63, 701–716. [CrossRef]
- Leaman, A.; Bordass, B. Productivity in buildings: The ‘killer’ variables. In Creating the Productive Workplace; Cooper, C.L., Ed.; Taylor & Francis: London, UK, 2006; pp. 181–208.
- Spector, P.E. Measurement of human service staff satisfaction: Development of the job satisfaction survey. Am. J. Community Psychol. 1985, 13, 693–713. [CrossRef]
- Hwang, T.; Kim, J.T. Effects of indoor environmental quality on occupant satisfaction in green buildings. Indoor Built Environ. 2013, 22, 139–156. [CrossRef]
- Lee, G.B.; Lee, S.M.; Lee, S.E.; Jeong, J.W.; Lee, J.W. A comparative field study of indoor environment quality and work productivity between job types in a research institute in Korea. Int. J. Environ. Res. Public Health 2022, 19, 14332. [CrossRef]
- Bergefurt, L.; van den Boogert, P.F.; Appel-Meulenbroek, R.; Kemperman, A. The interplay of workplace satisfaction, activity support, and productivity support in the hybrid work context. Build. Environ. 2024, 261, 111729. [CrossRef]
Figure 1.
Conceptual framework of the study showing how indoor environmental quality factors and co-variables interact to influence employee outcomes.
Figure 1.
Conceptual framework of the study showing how indoor environmental quality factors and co-variables interact to influence employee outcomes.
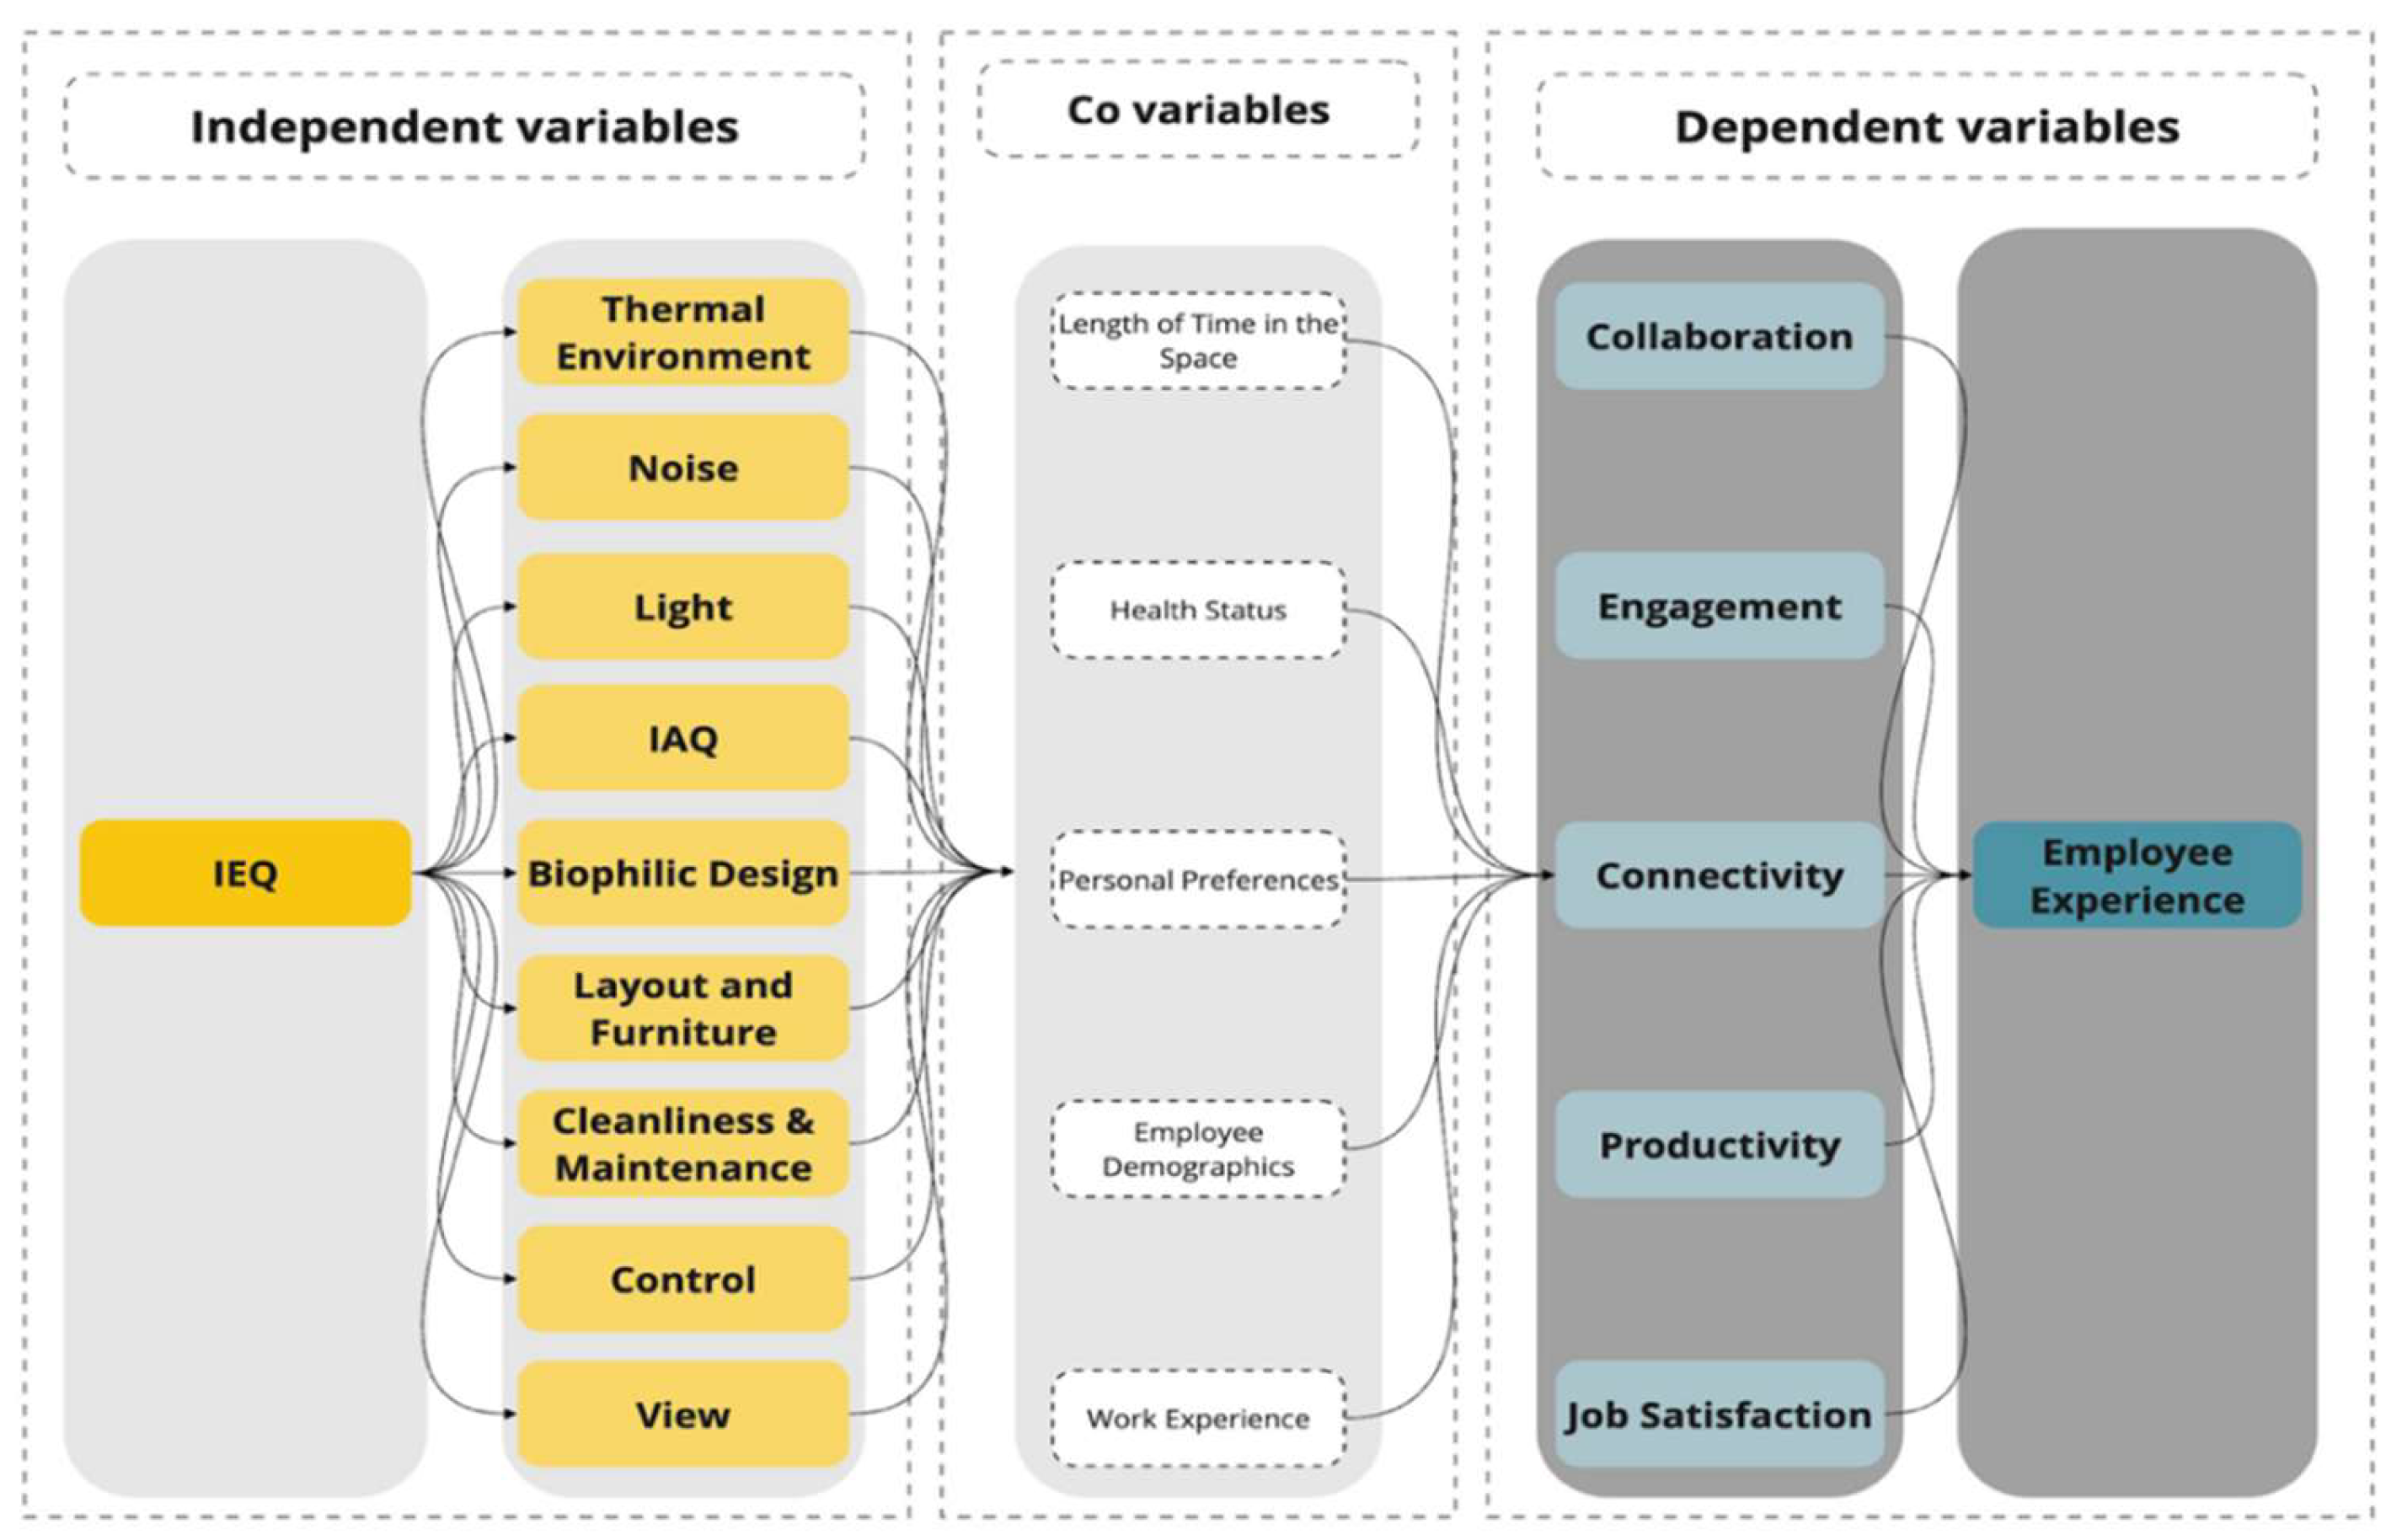
Figure 2.
WorkHub on the 6th floor of the John Ferraro Building (left) and conventional offices within the facilities (right).
Figure 2.
WorkHub on the 6th floor of the John Ferraro Building (left) and conventional offices within the facilities (right).
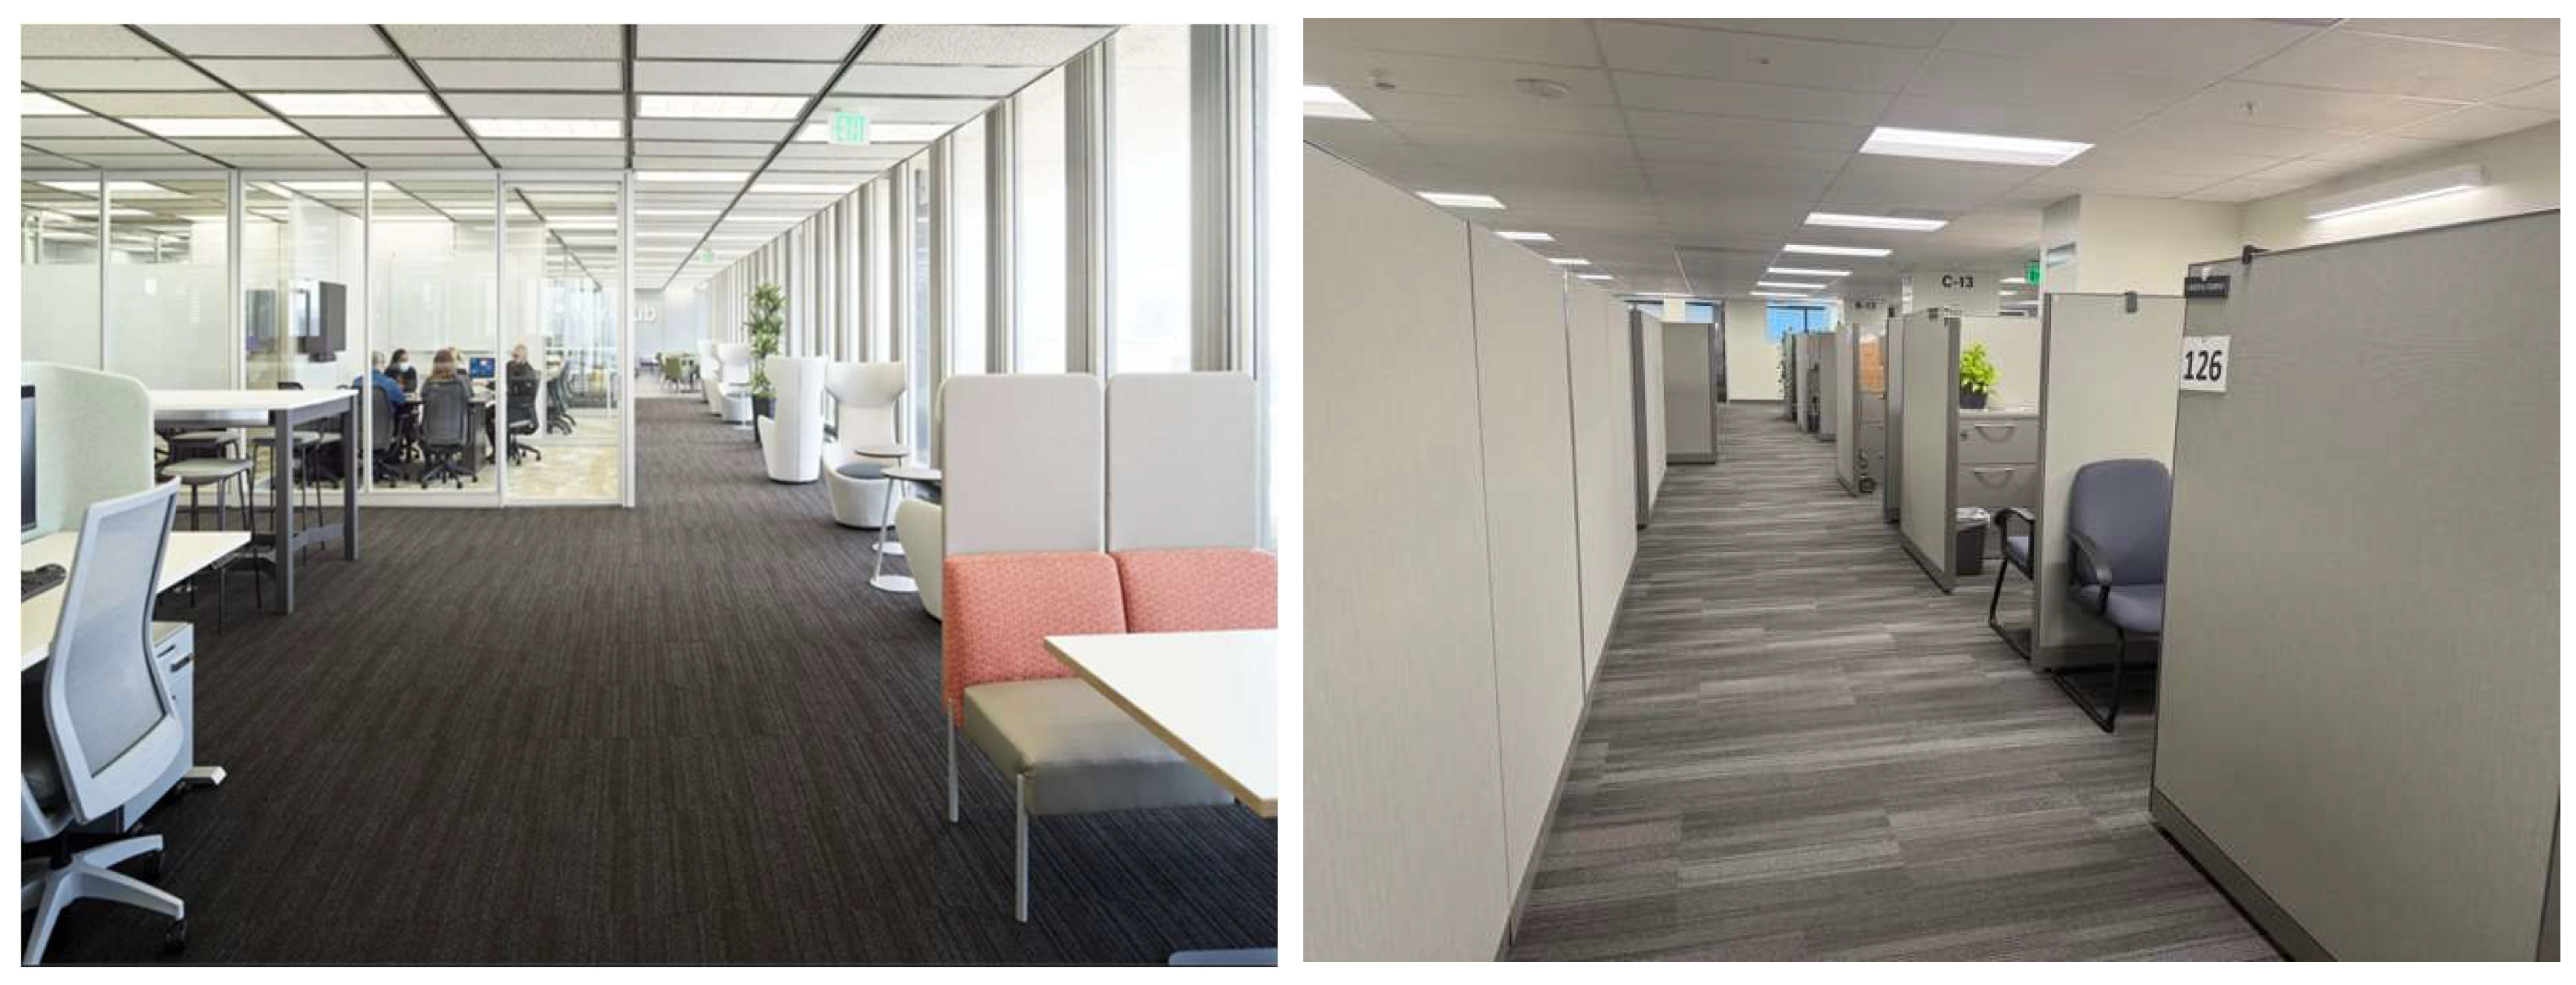
Figure 3.
Gender, age, and education level distribution of survey participants.
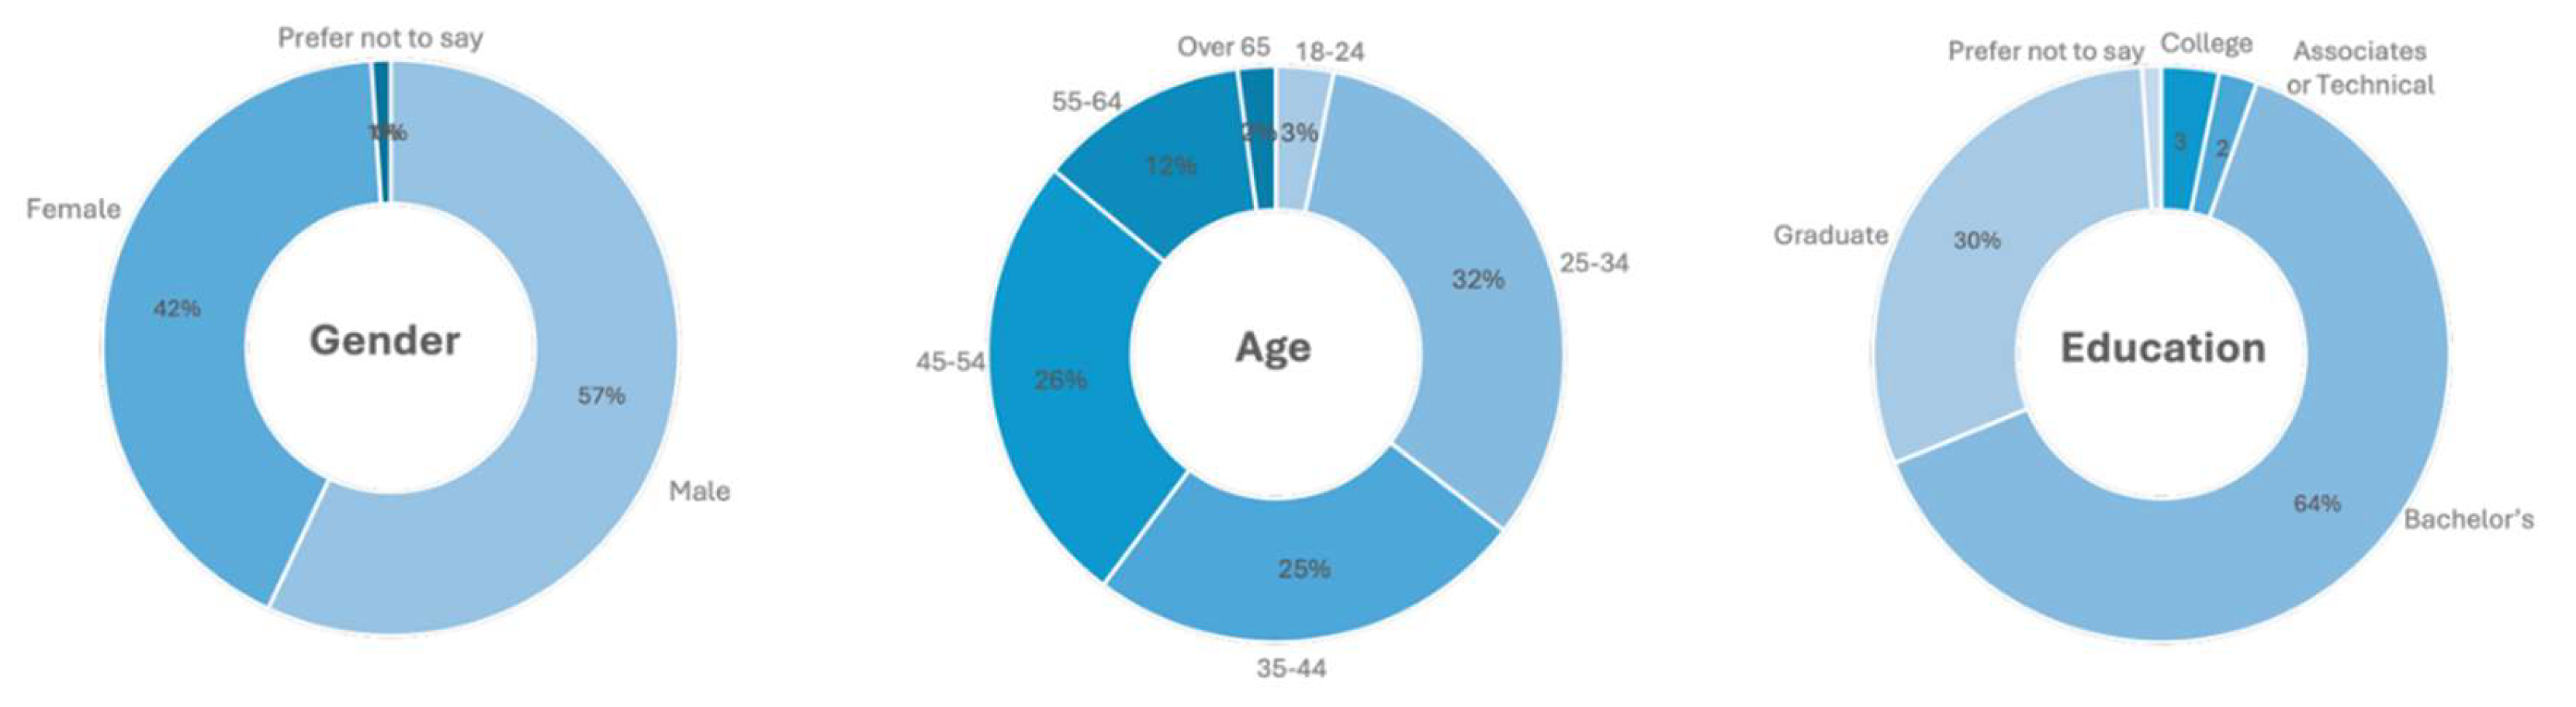
Figure 4.
Distribution of participants by workspace tenure, weekly usage hours, office location, and workspace type.
Figure 4.
Distribution of participants by workspace tenure, weekly usage hours, office location, and workspace type.
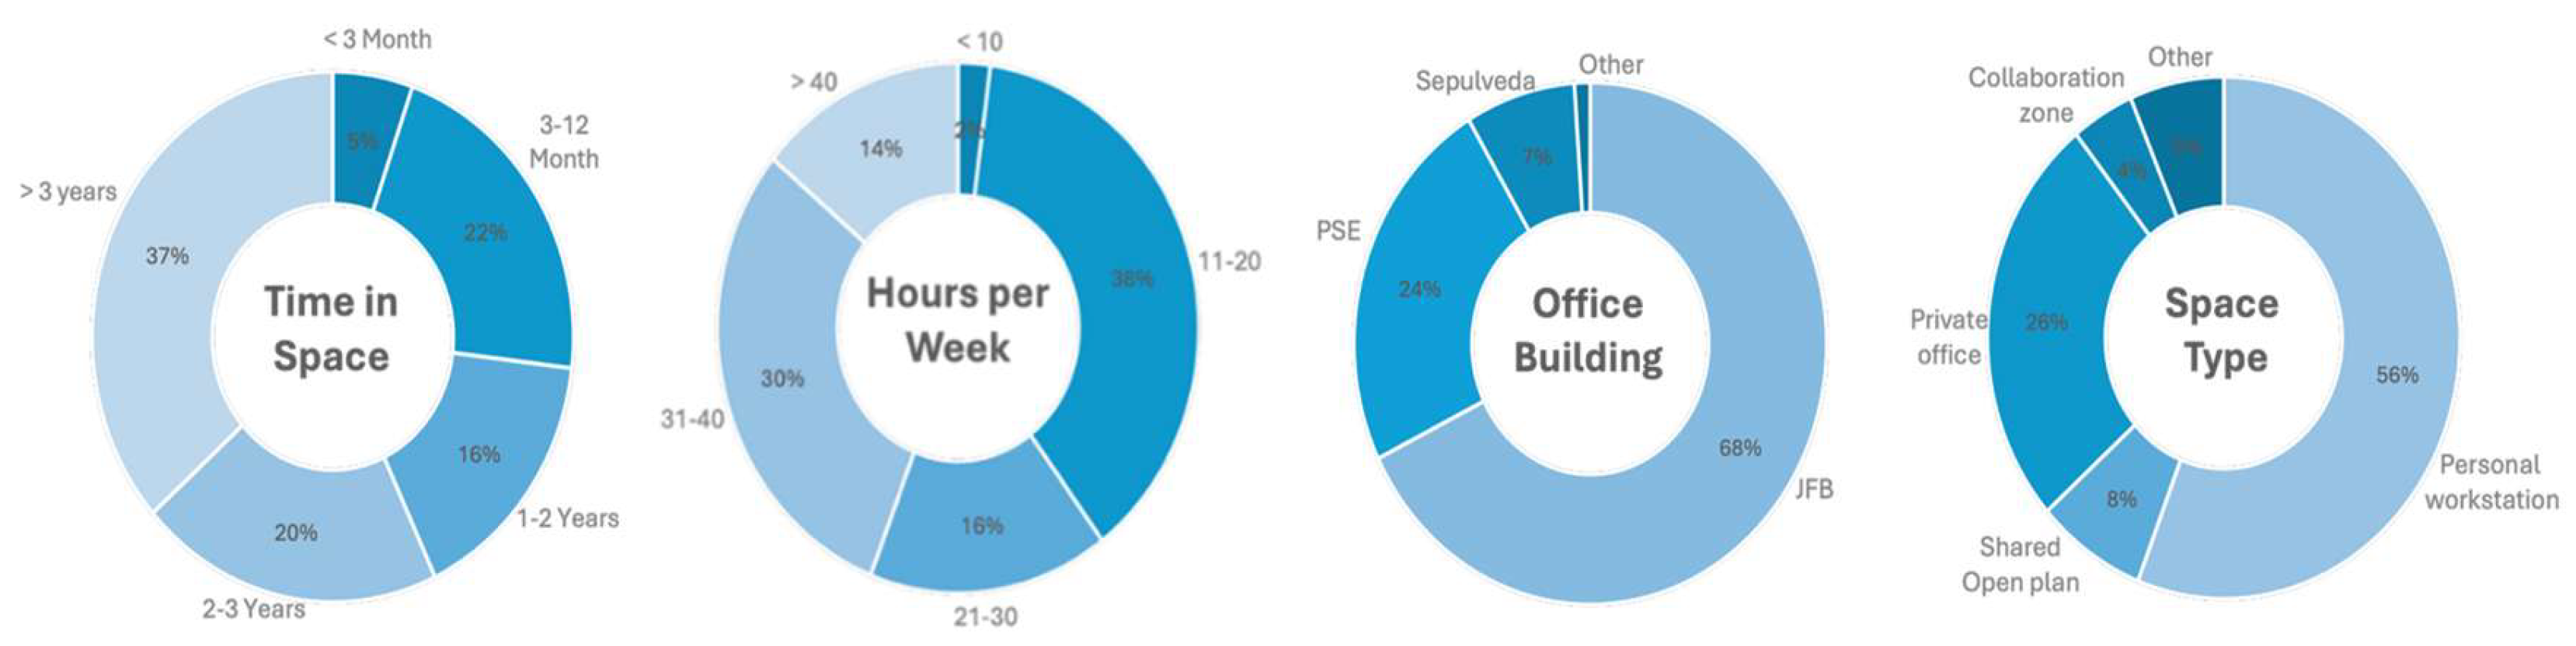
Figure 5.
WorkHub Access, Use, and Frequency of Use Among Survey Respondents.
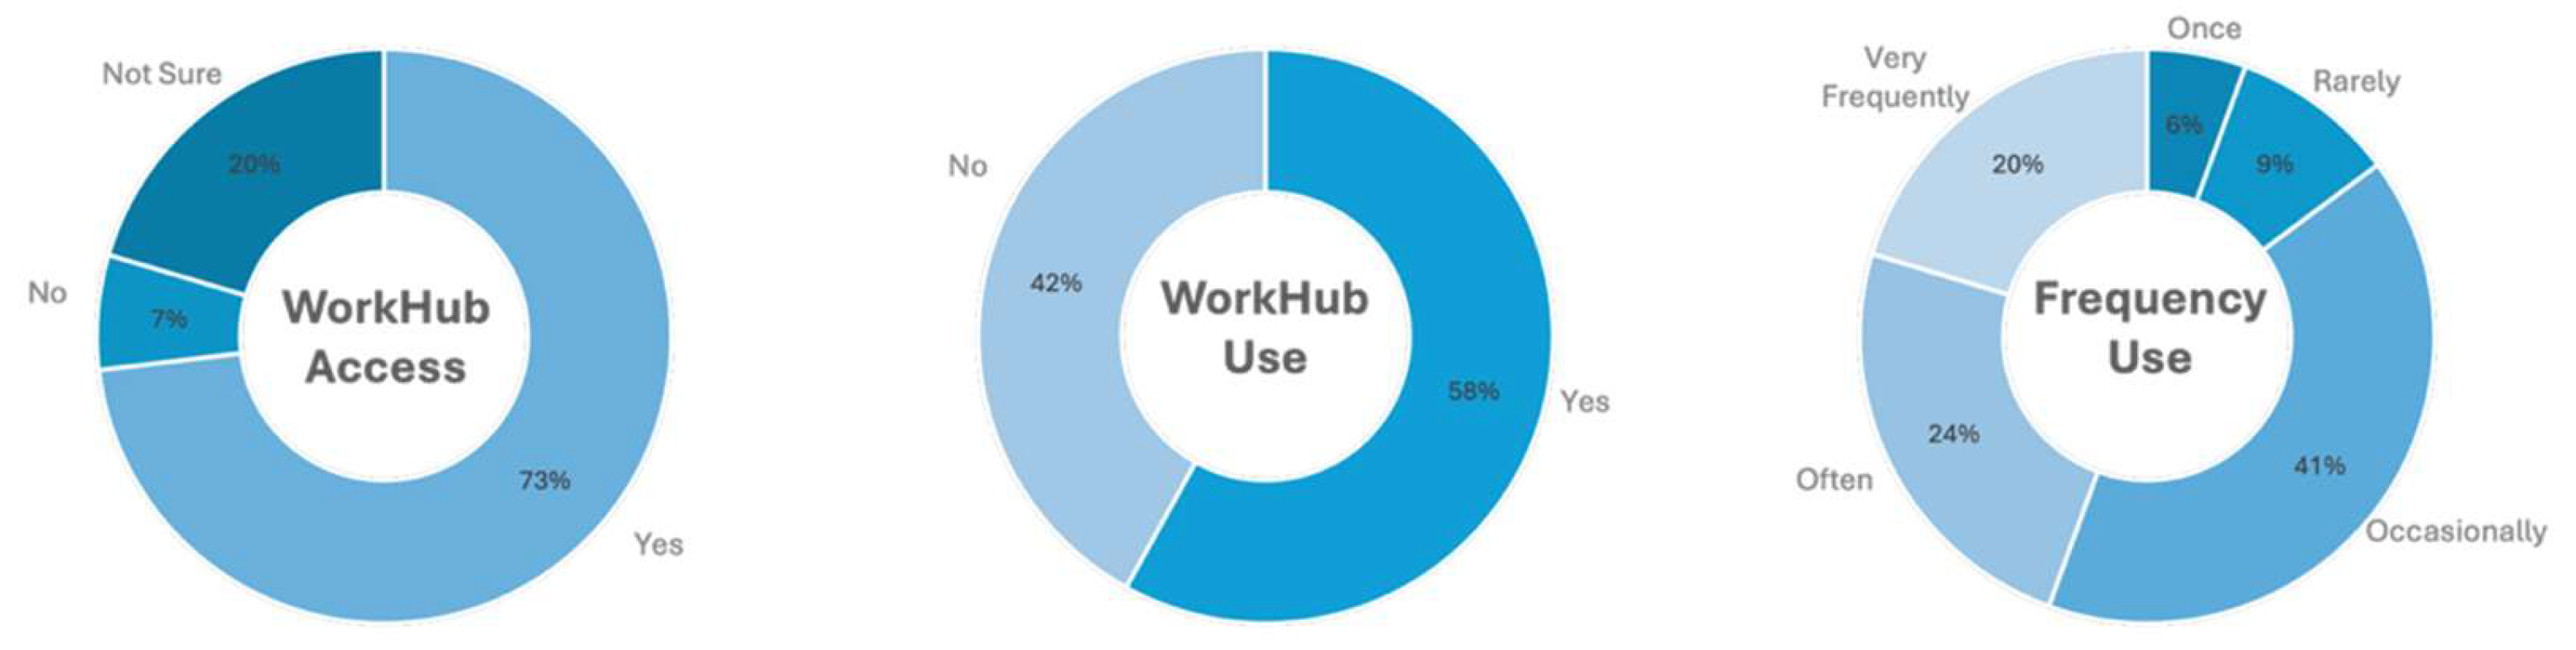
Figure 6.
Self-Reported Satisfaction with Workplace Environmental and Spatial Features.
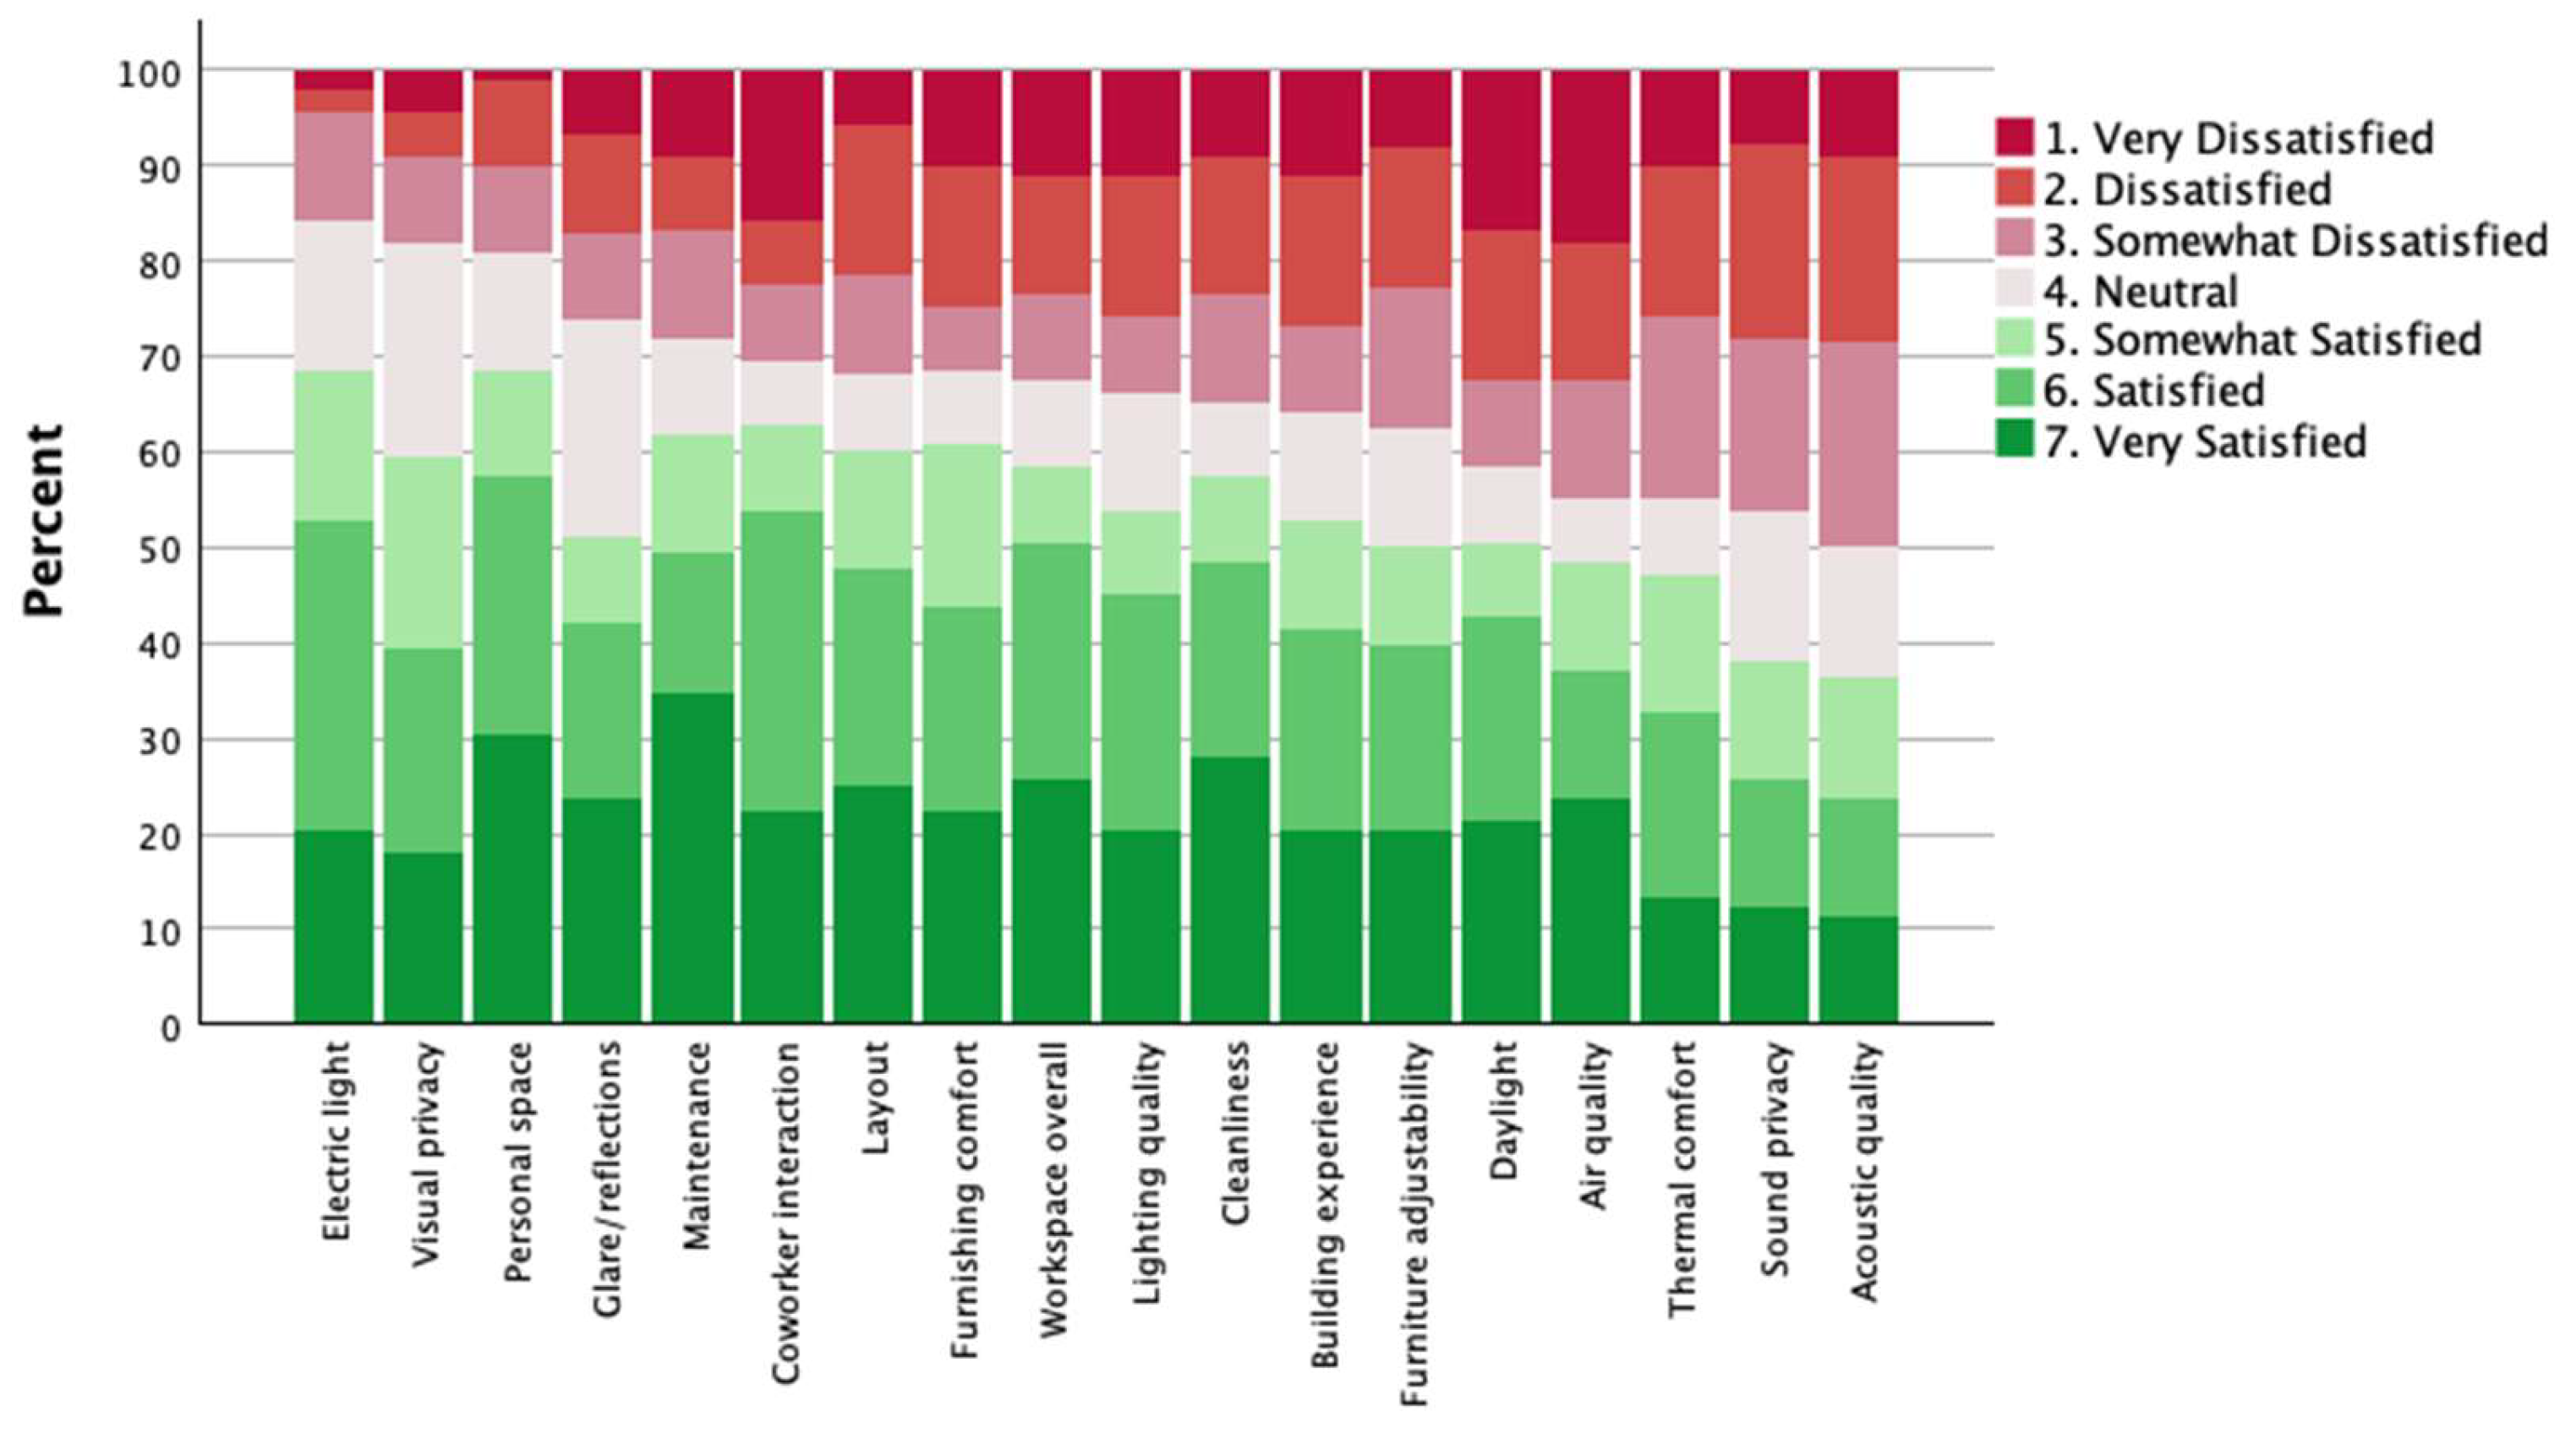
Figure 7.
Self-Reported Satisfaction with Workplace Environmental and Spatial Features.
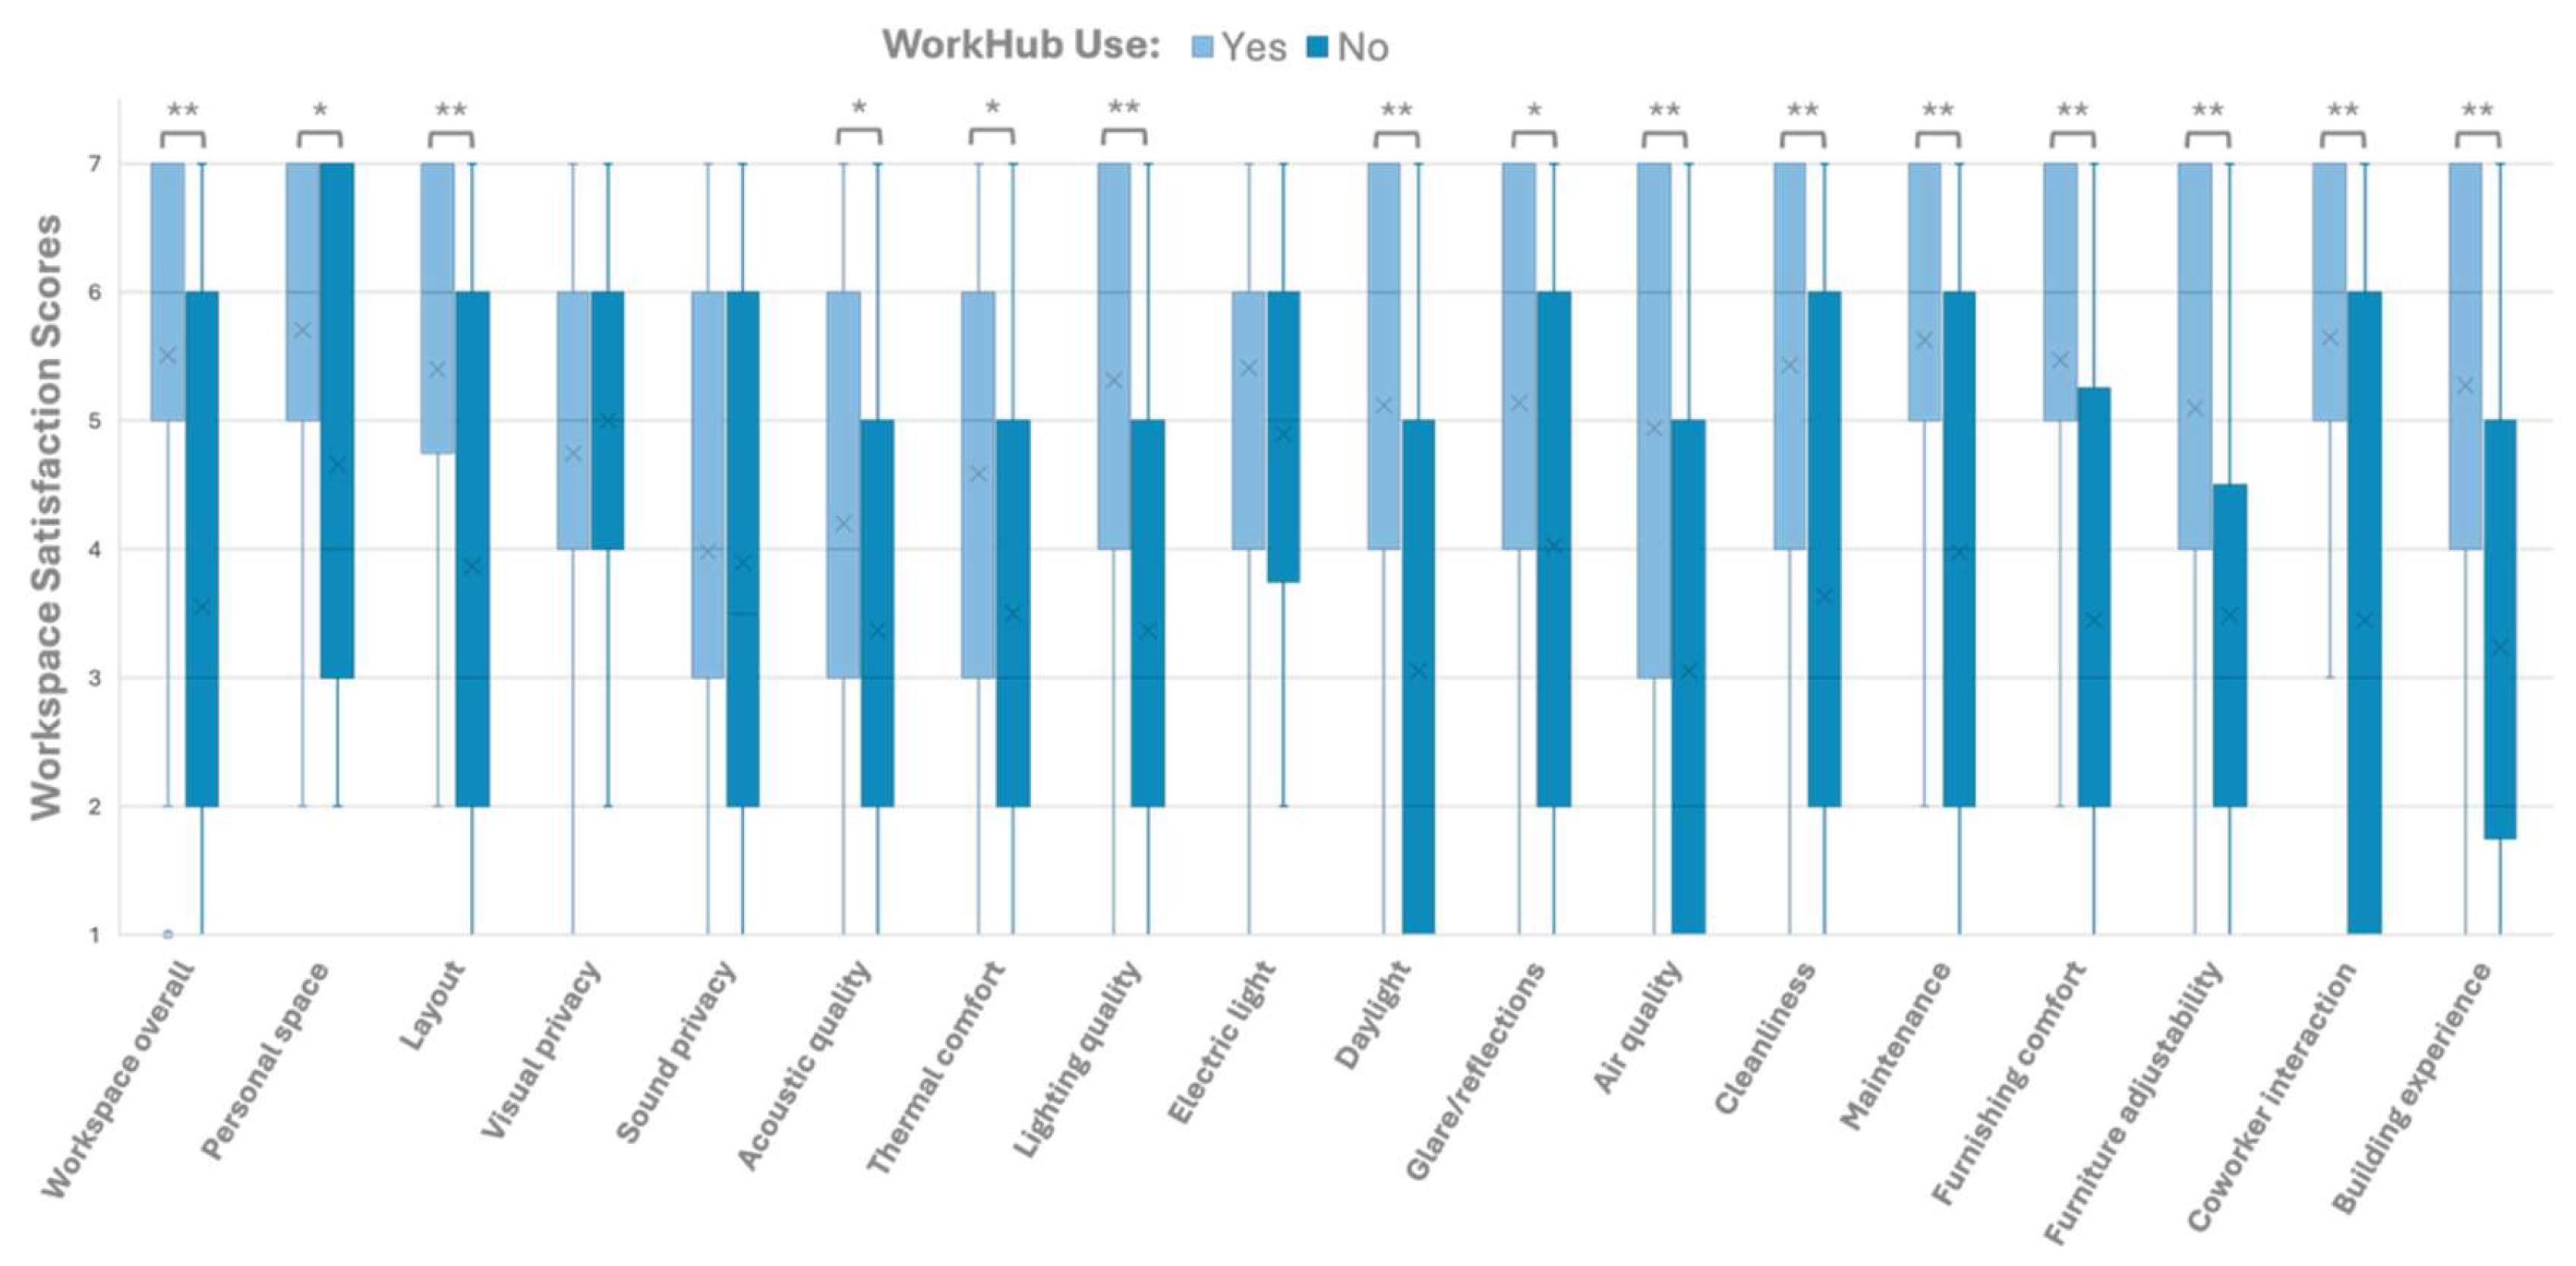
Figure 8.
Self-Reported Employee Outcomes in Workplace Environmental.
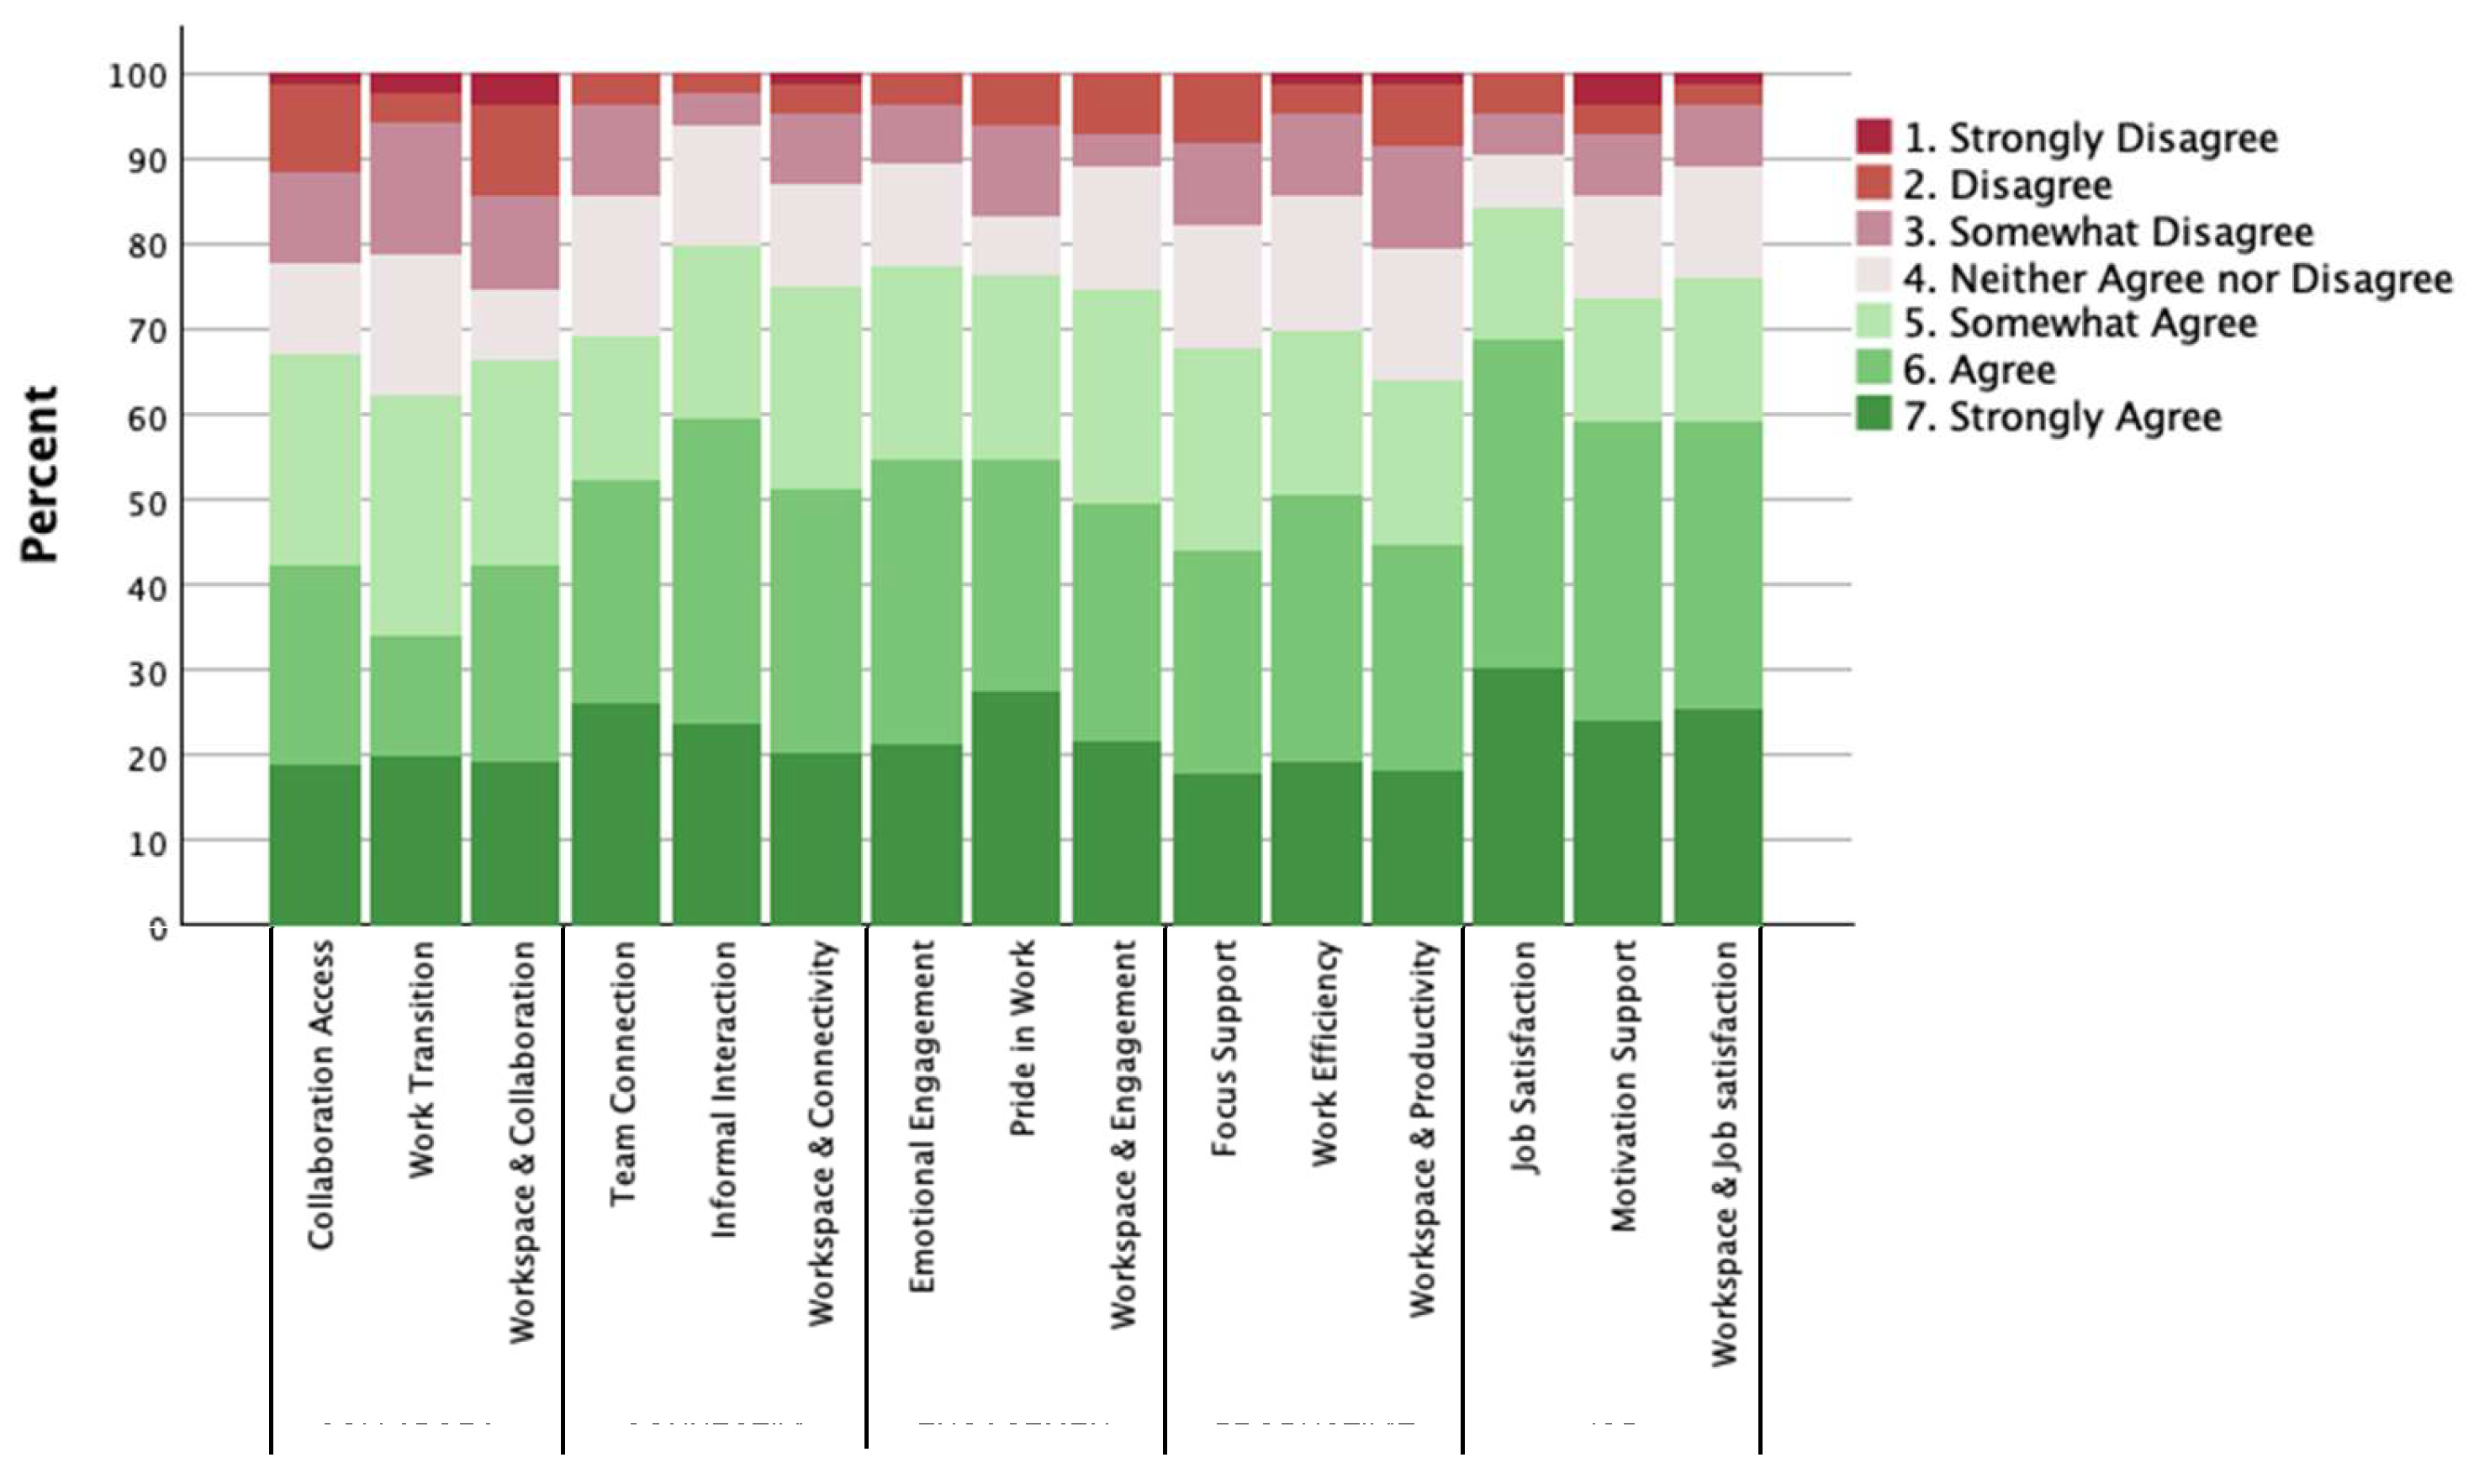
Figure 9.
Comparison of Employees’ Outcome Ratings Between WorkHub Users and Non-Users.
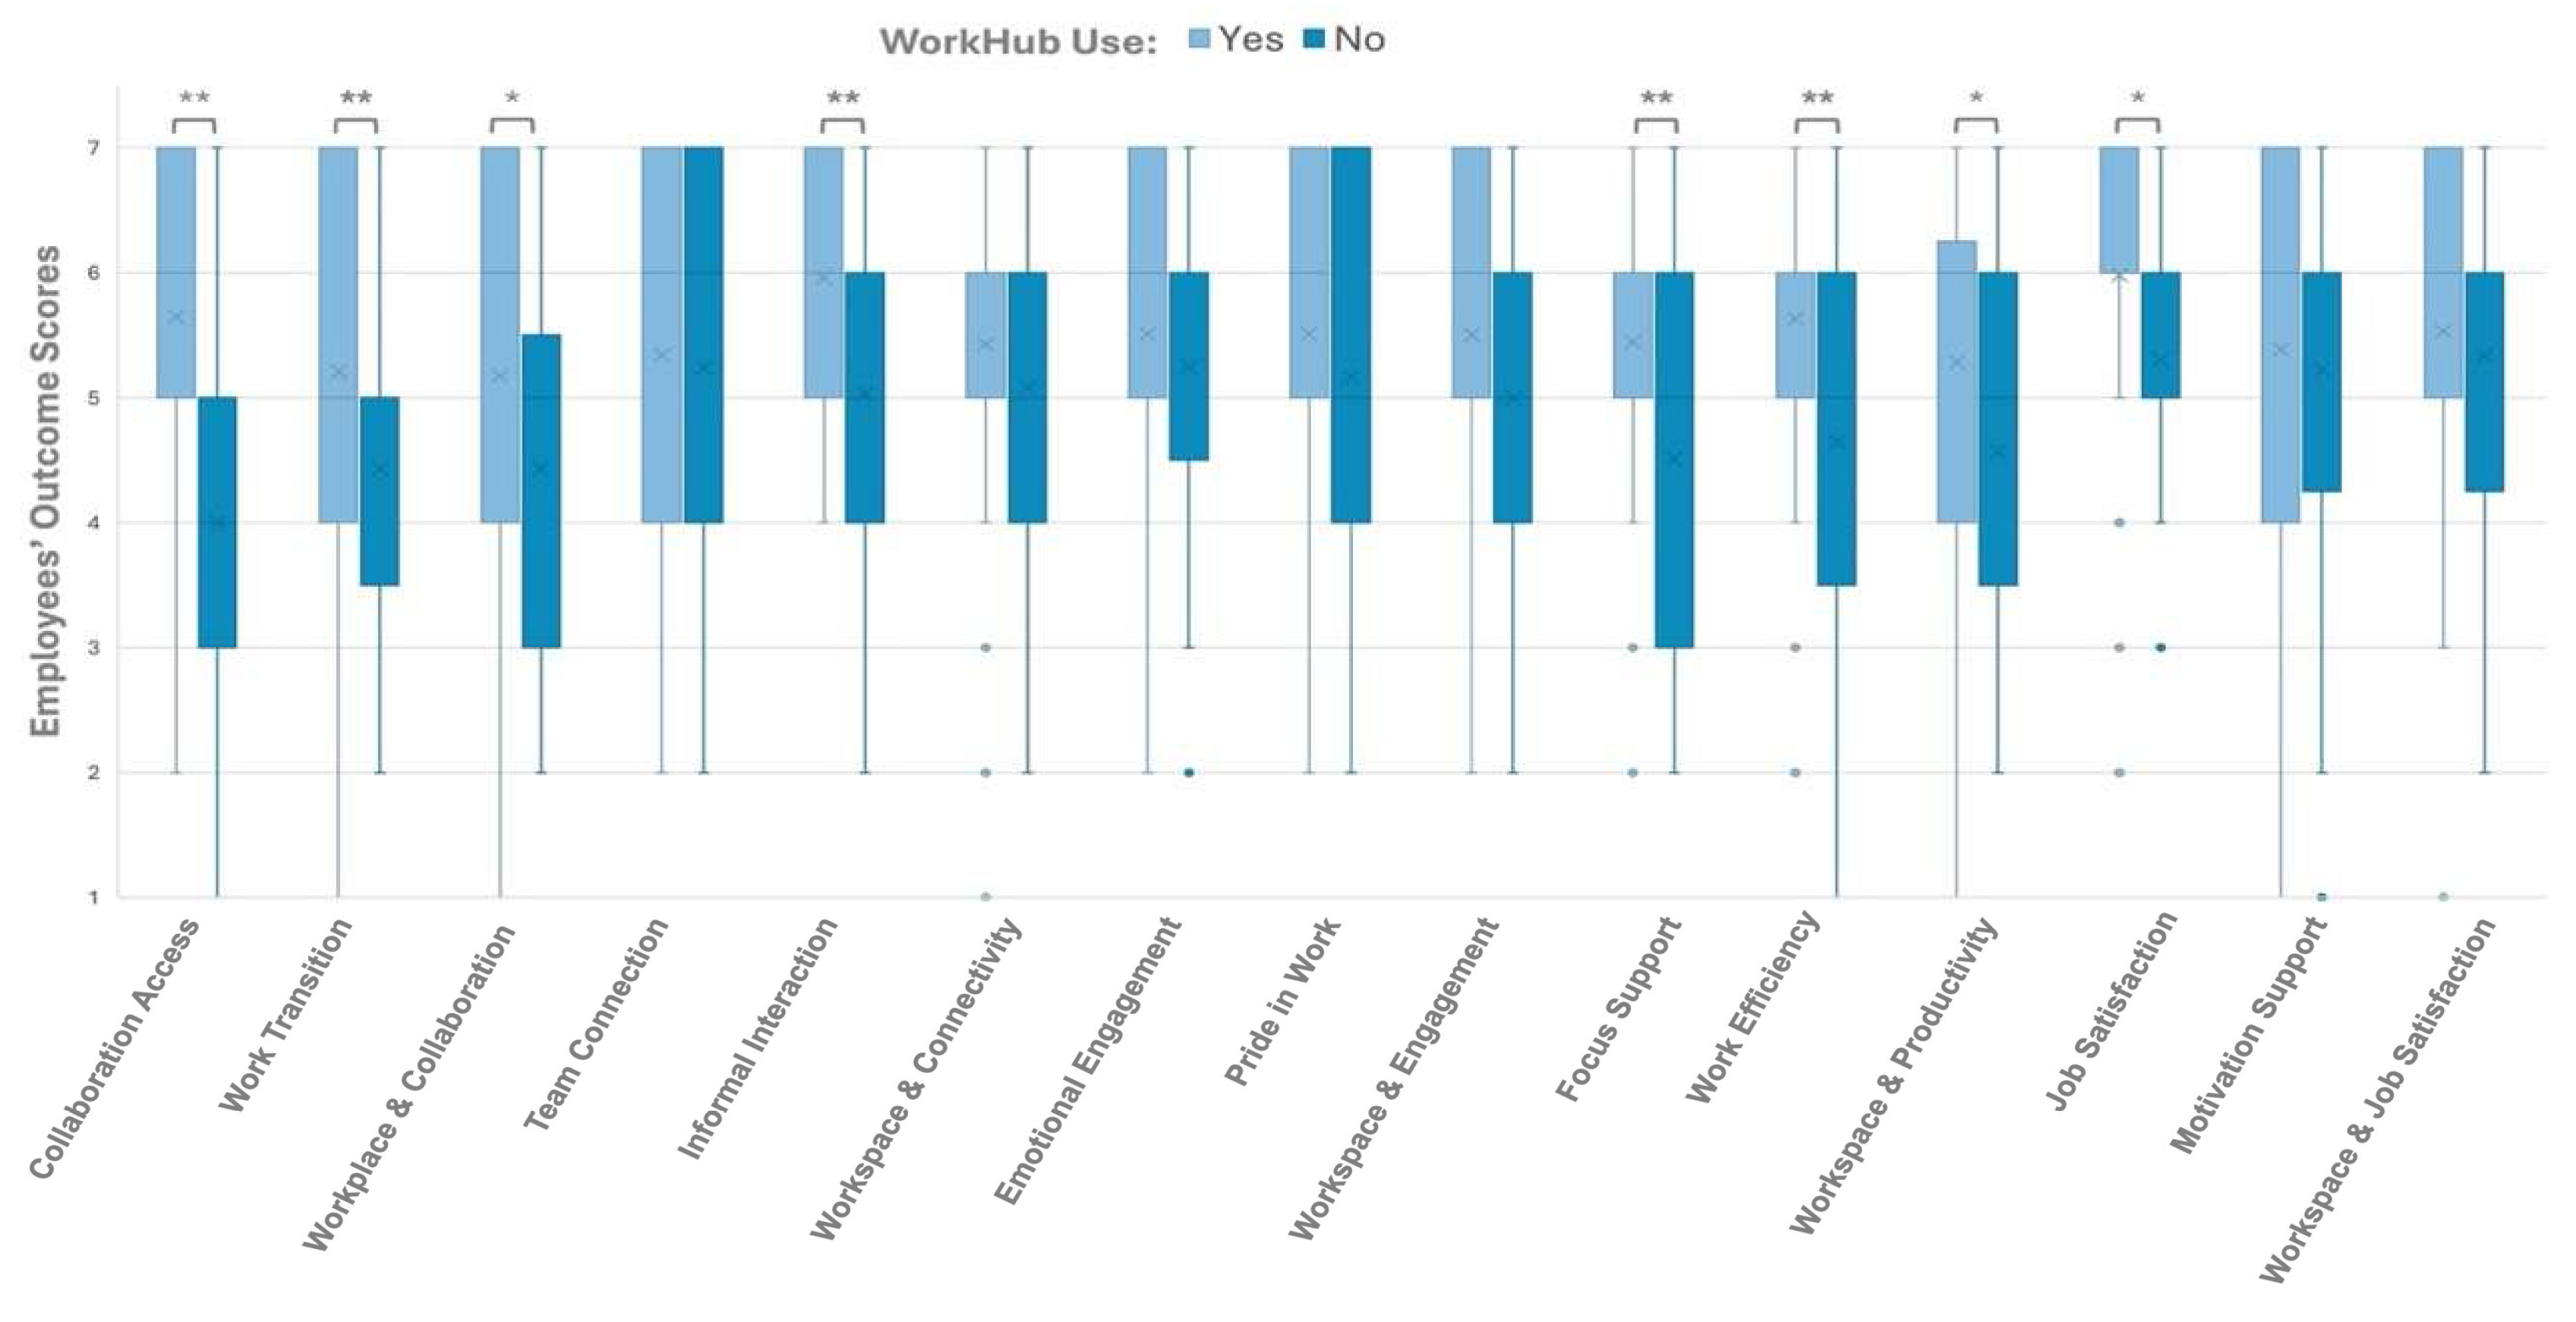
Figure 10.
Comparison of Importance Ratings Between WorkHub Users and Non-Users Across Six Environmental Factors.
Figure 10.
Comparison of Importance Ratings Between WorkHub Users and Non-Users Across Six Environmental Factors.
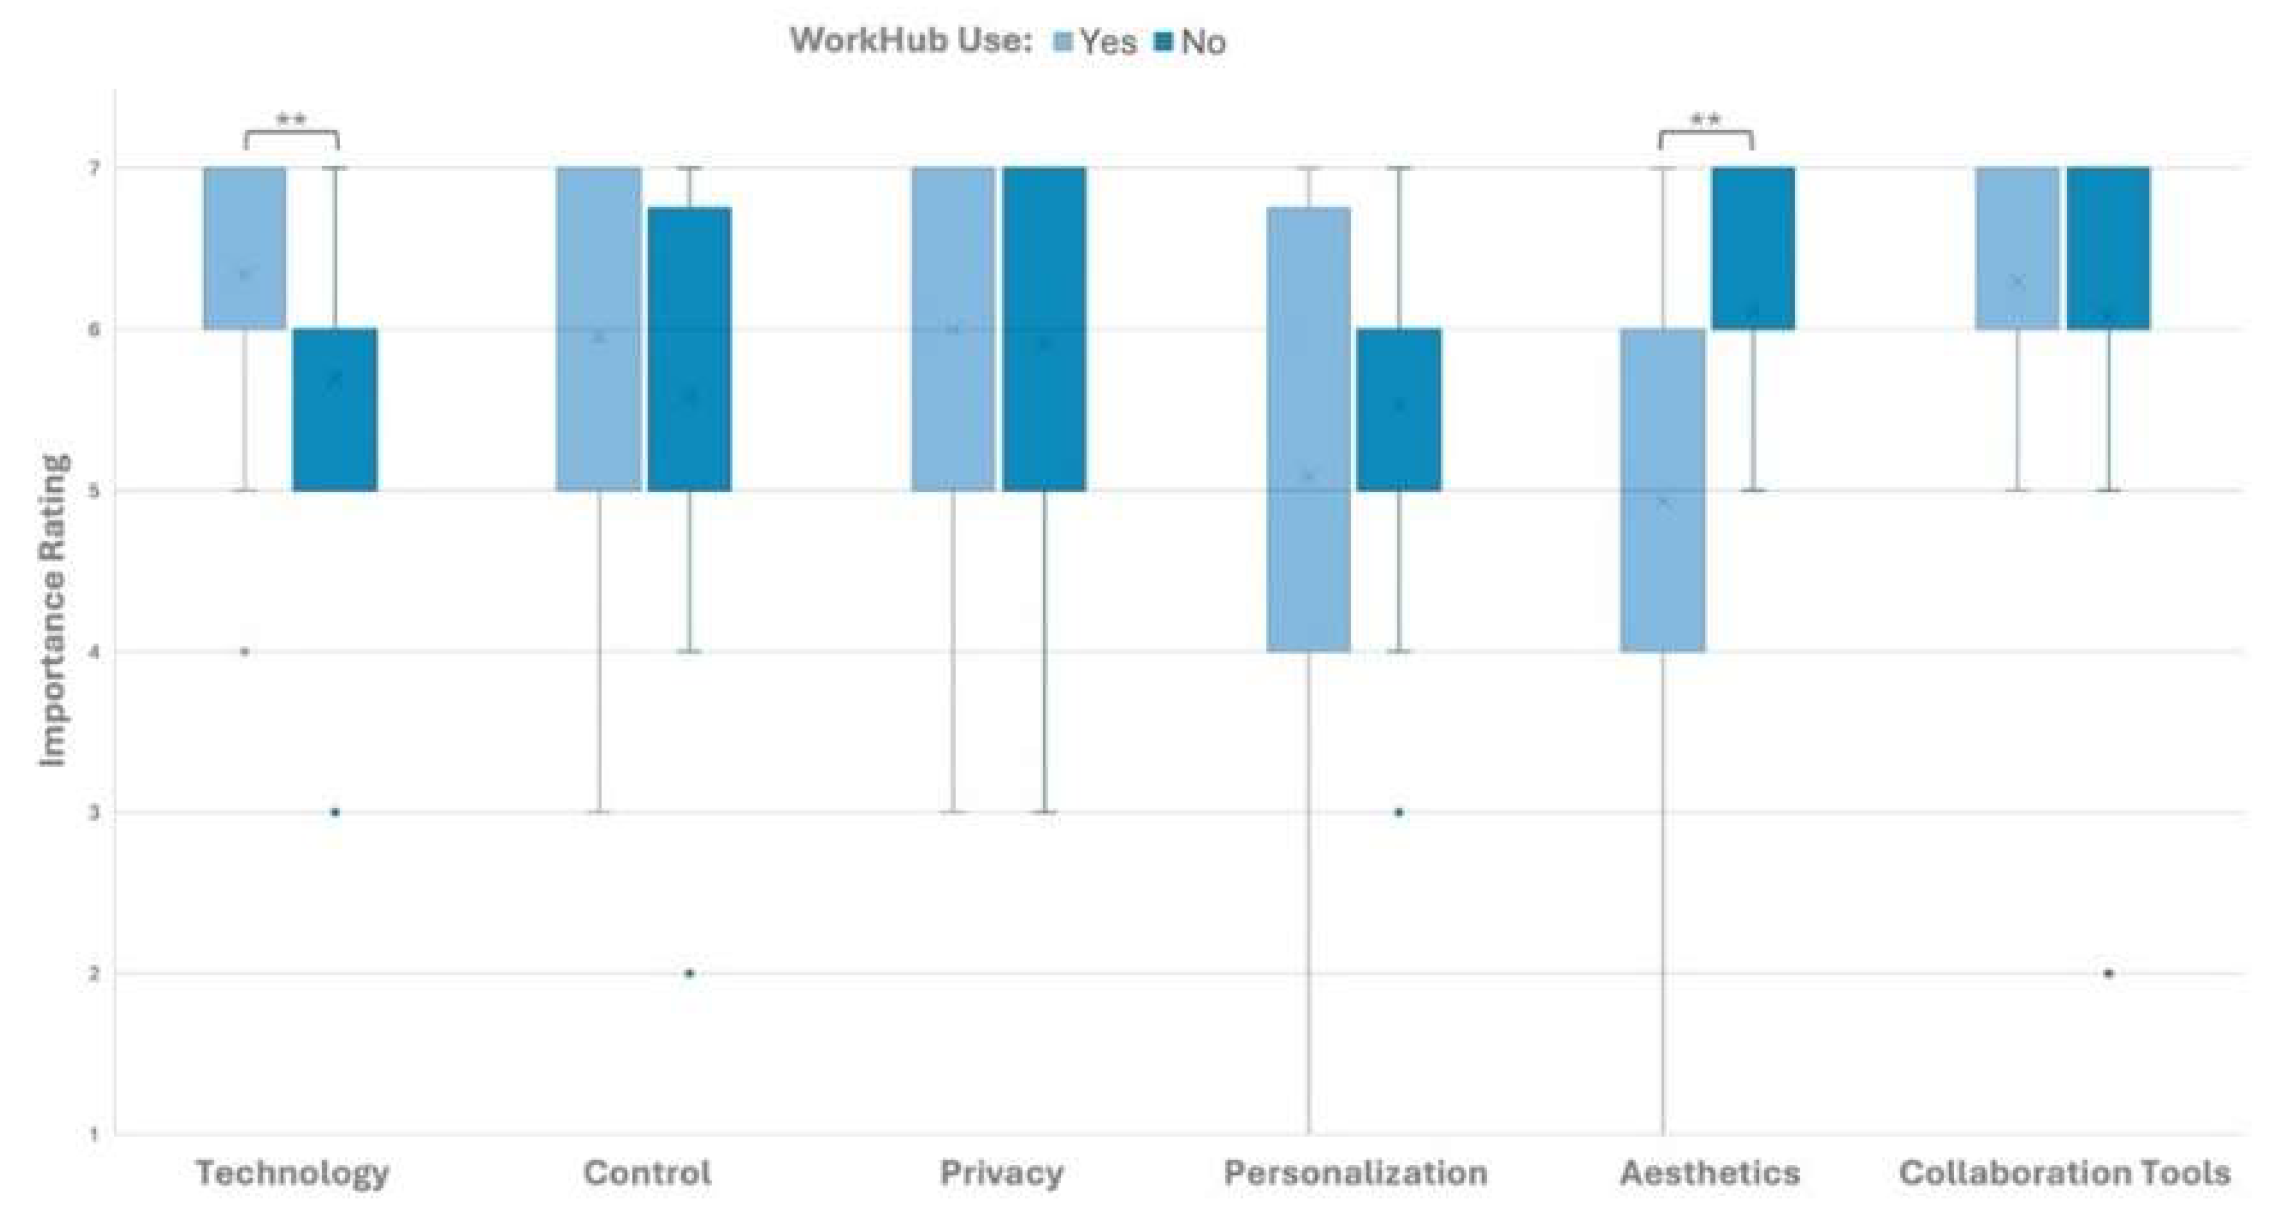

Table 1.
Summary of Significant Effects of Demographic Variables on Workspace Satisfaction Ratings.
| Satisfaction Aspect | p-value (Age) | p-value (Gender) | p-value (Education) |
p-value (Age. Gender. Edu) |
| Workspace overall | 0.026* | 0.402 | 0.220 | <.001** |
| Personal space | 0.039* | 0.079 | 0.144 | 0.011* |
| Layout | 0.021* | 0.742 | 0.314 | <.001** |
| Visual privacy | 0.074 | 0.704 | 0.644 | 0.018* |
| Sound privacy | <.001** | 0.244 | 0.320 | 0.058 |
| Acoustic quality | <.001** | 0.055 | 0.246 | 0.061 |
| Thermal comfort | 0.004** | 0.364 | 0.561 | 0.001** |
| Lighting quality | 0.109 | 0.514 | 0.337 | 0.039* |
| Electric light | 0.073 | 0.438 | 0.443 | 0.019* |
| Daylight | 0.359 | 0.381 | 0.156 | 0.012* |
| Glare/reflections | 0.015* | 0.723 | 0.273 | 0.013* |
| Air quality | 0.026* | 0.219 | 0.242 | 0.038* |
| Cleanliness | 0.006** | 0.271 | 0.338 | 0.002** |
| Maintenance | 0.005** | 0.362 | 0.423 | 0.013* |
| Furnishing comfort | 0.014* | 0.304 | 0.323 | 0.015* |
| Furniture adjustability | 0.023* | 0.328 | 0.706 | 0.012* |
| Coworker interaction | 0.002** | 0.250 | 0.149 | 0.016* |
| Overall building | 0.014* | 0.173 | 0.415 | 0.005** |
(* represents p<0.05, ** represents p<0.01).
Table 2.
Summary of Significant Effects of Workspace Use Variables on Workspace Satisfaction Ratings.
Table 2.
Summary of Significant Effects of Workspace Use Variables on Workspace Satisfaction Ratings.
| Satisfaction Aspect | p-value (Time in Space) | p-value (Hours per Week) | p-value (Office Building) | p-value (Space Type) |
|---|---|---|---|---|
| Workspace overall | 0.900 | 0.061 | 0.043* | 0.942 |
| Personal space | 0.928 | 0.002** | 0.209 | 0.410 |
| Layout | 0.872 | 0.384 | 0.165 | 0.688 |
| Visual privacy | 0.488 | 0.013* | 0.141 | 0.886 |
| Sound privacy | 0.976 | 0.547 | 0.883 | 0.952 |
| Acoustic quality | 0.722 | 0.488 | 0.911 | 0.957 |
| Thermal comfort | 0.869 | 0.509 | 0.119 | 0.792 |
| Lighting quality | 0.553 | 0.135 | 0.190 | 0.951 |
| Electric light | 0.757 | 0.023* | 0.160 | 0.983 |
| Daylight | 0.355 | 0.190 | 0.476 | 0.617 |
| Glare/reflections | 0.900 | 0.148 | 0.188 | 0.630 |
| Air quality | 0.973 | 0.057 | 0.259 | 0.665 |
| Cleanliness | 0.810 | 0.011* | 0.058 | 0.750 |
| Maintenance | 0.957 | 0.020* | 0.100 | 0.716 |
| Furnishing comfort | 0.797 | 0.140 | 0.154 | 1.000 |
| Furniture adjustability | 0.910 | 0.642 | 0.330 | 0.956 |
| Coworker interaction | 0.642 | 0.009** | 0.105 | 0.974 |
| Building experience (overall) | 0.766 | 0.044* | 0.159 | 0.995 |
(* represents p<0.05, ** represents p<0.01).
Table 3.
Mann–Whitney U Test Results Comparing Workspace Satisfaction by WorkHub Use.
| Satisfaction Aspect | Mann–Whitney U | Z | p-value (2-tailed) |
|---|---|---|---|
| Workspace overall | 495.000 | -4.007 | < .001** |
| Personal space | 677.500 | -2.484 | .013* |
| Layout | 545.500 | -3.469 | < .001** |
| Visual privacy | 915.000 | -0.456 | .648 |
| Sound privacy | 931.000 | -0.319 | .750 |
| Acoustic quality | 685.000 | -2.262 | .024* |
| Thermal comfort | 667.000 | -2.537 | .011* |
| Lighting quality | 467.500 | -4.225 | < .001** |
| Electric light | 747.500 | -1.887 | .059 |
| Daylight | 471.500 | -4.189 | < .001** |
| Glare/reflections | 642.000 | -2.593 | .010* |
| Air quality | 502.500 | -3.925 | < .001** |
| Cleanliness | 519.000 | -3.803 | < .001** |
| Maintenance | 551.000 | -3.559 | < .001** |
| Furnishing comfort | 458.000 | -4.305 | < .001** |
| Furniture adjustability | 522.500 | -3.605 | < .001** |
| Coworker interaction | 472.000 | -4.225 | < .001** |
| Building experience (overall) | 447.000 | -4.389 | < .001** |
(* represents p<0.05, ** represents p<0.01).
Table 4.
Mann–Whitney U Test Results Comparing Employees’ Outcome by WorkHub Use.
| Employees’ Outcome | Mann–Whitney U | Z | p-value (2-tailed) |
|---|---|---|---|
| Collaboration Access | 374.5 | -4.641 | < .001** |
| Work Transition | 601.0 | -2.598 | .009** |
| Workspace & Collaboration | 592.5 | -2.412 | .016* |
| Emotional Engagement | 849.5 | -0.185 | .854 |
| Pride in Work | 527.5 | -3.196 | .001** |
| Workspace & Engagement | 741.5 | -1.186 | .236 |
| Team Connection | 760.0 | -1.018 | .309 |
| Informal Interaction | 769.5 | -0.926 | .355 |
| Workspace & Connectivity | 672.0 | -1.683 | .092 |
| Focus Support | 570.0 | -2.756 | .006** |
| Work Efficiency | 534.0 | -2.979 | .003** |
| Workspace & Productivity | 608.0 | -2.269 | .023* |
| Job Satisfaction | 577.5 | -2.585 | .010* |
| Motivation Support | 770.0 | -0.721 | .471 |
| Workspace & Job Satisfaction | 774.0 | -0.683 | .495 |
(* represents p<0.05, ** represents p<0.01).
Disclaimer/Publisher’s Note: The statements, opinions and data contained in all publications are solely those of the individual author(s) and contributor(s) and not of MDPI and/or the editor(s). MDPI and/or the editor(s) disclaim responsibility for any injury to people or property resulting from any ideas, methods, instructions or products referred to in the content. |
© 2026 by the authors. Licensee MDPI, Basel, Switzerland. This article is an open access article distributed under the terms and conditions of the Creative Commons Attribution (CC BY) license (http://creativecommons.org/licenses/by/4.0/).
Copyright: This open access article is published under a Creative Commons CC BY 4.0 license, which permit the free download, distribution, and reuse, provided that the author and preprint are cited in any reuse.


