
Submitted:
24 February 2026
Posted:
26 February 2026
You are already at the latest version
Preprints on COVID-19 and SARS-CoV-2
Abstract
The SARS-CoV-2 pandemic has caused a global health crisis, highlighting the central role of hospitals and healthcare facilities in controlling and mitigating infectious disease outbreaks. Beyond their function as centers for patient care, hospitals act as strategic hubs for epidemic containment through early detection, patient isolation, treatment, workforce protection, and coordination with public health authorities. Building on our previous modeling and empirical investigations, this study integrates deterministic and stochastic approaches to provide a comprehensive hospital-centered framework for pandemic response. While earlier work offered important yet fragmented insights into specific aspects of disease dynamics, the present manuscript synthesizes these results into actionable lessons and system-level strategies for healthcare resilience. Using validated epidemiological models and comparative analyses across multiple countries, we demonstrate how hospital organization, operational capacity, and systemic integration influence outbreak trajectories and service continuity. The proposed framework highlights the ability of healthcare institutions to actively shape epidemic dynamics and prevent internal amplification of contagion. Importantly, the mathematical formalism is highly flexible and adaptable to other viral epidemics and pandemics. Overall, this work provides a unified and clinically relevant
Keywords:
COVID-19
; SARS-CoV-2
; hospital resilience
; healthcare systems
; pandemic preparedness
; infection control
1. Introduction
Towards the end of 2019, severe acute respiratory syndrome coronavirus 2 (SARS-CoV-2), the etiological agent of coronavirus disease 2019 (COVID-19), was identified in Wuhan. Early epidemiological and clinical investigations published in Nature and The New England Journal of Medicine provided the first comprehensive descriptions of viral transmission dynamics, clinical severity, and risk factors for disease progression [1,2,3,4]. These foundational studies established the scientific basis for global surveillance systems and hospital preparedness strategies. SARS-CoV-2 is a member of the coronavirus family and possesses a 30-kb single-stranded, positive-sense RNA genome, making it one of the largest known RNA viruses. Its structural proteins include the Spike (S) glycoprotein, which mediates host cell entry via receptor binding and membrane fusion; the Envelope (E) protein, involved in viral assembly and release; the Membrane (M) protein, which determines virion shape; and the Nucleocapsid (N) protein, responsible for RNA binding and stabilization. High-resolution structural studies published in Nature clarified the conformational architecture of the Spike protein and its interaction with host receptors, identifying key targets for vaccines and therapeutic interventions [5,6]. Transmission occurs primarily through respiratory droplets emitted during speaking, coughing, or sneezing, with additional spread through aerosols, particularly in poorly ventilated indoor environments. Indirect transmission via contaminated surfaces, although less common, may further contribute to infection risk. Large-scale clinical investigations published in The New England Journal of Medicine demonstrated that asymptomatic and presymptomatic individuals substantially contribute to community transmission [7,8], complicating detection, isolation, and infection control efforts. Subsequent epidemiological and modeling studies further characterized transmission mechanisms, reproduction numbers, and intervention effects [9,10,11,12,13,14,15]. The rapid global spread of SARS-CoV-2 prompted the World Health Organization to declare COVID-19 a pandemic on March 11, 2020. The unprecedented scale of transmission was driven by high viral contagiousness, absence of pre-existing population immunity, global mobility, and the subsequent emergence of variants of concern, including Alpha (B.1.1.7), Beta (B.1.351), Gamma (P.1), Delta (B.1.617.2), and Omicron (B.1.1.529 and its sublineages). Hospitals and healthcare facilities rapidly became the frontline of the crisis. Seminal reports in The New England Journal of Medicine documented hospital overload, mortality patterns, and the critical importance of intensive care capacity during epidemic peaks [16,17]. These studies clearly demonstrated that hospital organization, staffing levels, and resource availability directly influenced patient outcomes. Surges in critically ill patients, shortages of personal protective equipment, limited ICU beds, and high infection rates among healthcare workers exposed structural and operational vulnerabilities within healthcare systems. At the same time, the pandemic underscored the strategic role of hospitals not merely as passive recipients of patients, but as active agents capable of influencing epidemic trajectories. Early diagnosis, rapid isolation, infection prevention protocols, and coordinated public health integration can significantly reduce secondary transmission and mitigate system overload. Modeling studies published in Nature and Science emphasized how healthcare capacity constraints and intervention timing critically shape epidemic outcomes [18,19]. These findings suggest that hospital resilience, defined as the capacity to absorb shocks, adapt operationally, and maintain essential services, constitutes a central determinant of pandemic response effectiveness. Building upon this evidence, the present work positions hospitals at the core of epidemic containment strategies. We propose a hospital-centered analytical framework that integrates operational management, workforce protection, and systemic coordination within a unified modeling perspective. Hospitals are conceptualized not only as treatment facilities, but as dynamic components of the broader public health network capable of modulating transmission dynamics and healthcare system stability. The framework is informed by empirical data and published evidence from healthcare systems in the United States, Germany, France, Italy, and Belgium, including indicators of ICU utilization, workforce availability, and infection control practices. Three interrelated dimensions are considered. First, operational strategies address patient flow optimization, ICU surge capacity, and allocation of critical resources. Second, workforce protection measures encompass standardized infection control protocols, staff rotation schemes, and early detection systems for healthcare personnel. Third, systemic integration emphasizes coordination with public health authorities, real-time data sharing, and adaptive feedback mechanisms designed to prevent hospitals from becoming amplifiers of contagion. Comparative and scenario-based analyses are employed to assess how these interventions influence hospital overload, internal transmission, and continuity of care. By integrating structural, organizational, and systemic elements into a coherent analytical framework, this study aims to identify critical vulnerabilities and propose strategies to enhance healthcare resilience during large-scale health emergencies.
The manuscript is organized as follows. Section 2 examines why hospitals constitute the first line of defense during pandemics. Subsequent sections present the principal modeling approaches used to analyze hospital dynamics and compare model predictions with epidemiological data from multiple countries. Organizational restructuring and healthcare facility management are discussed in Section 3, while workforce protection strategies are analyzed in Section 4. The role of hospitals within the broader public health network and strategies to prevent healthcare-associated amplification of contagion are examined in Section 5 and Section 6, respectively. Lessons learned, and future perspectives are presented in Section 7, followed by a comprehensive discussion and concluding remarks in Section 7.1 and Section 8.
2. Hospitals as Frontline Barriers Against SARS-CoV-2A: A Modeling Study
Hospitals represent the first line of defense in a pandemic. They are the primary locations where infected individuals are identified, diagnosed, and treated. According to our analysis, the hospital environment can either function as a barrier that limits viral transmission or, if inadequately organized, as a hub that accelerates contagion. Key elements that determine this role include:
- Rapid triage and early diagnosis of suspected cases;
- Physical separation of COVID-19 and non-COVID-19 pathways;
- Availability of isolation rooms and intensive care units;
- Strict infection prevention and control (IPC) protocols.
When these measures are properly implemented, hospitals significantly reduce the risk of intra-hospital transmission and protect both patients and healthcare workers. In [20], we modeled the dynamics of infected, recovered, and deceased individuals in a population subject to lockdown and quarantine measures imposed by governments. We showed that the combined effects of restrictive policies and actions by hospitals and healthcare institutions can contain and even suppress the spread of the SARS-CoV-2 epidemic. The dynamics of the entire process were derived by incorporating established theoretical results from the literature [21,22,23] and by adopting a kinetic-type reaction approach [20,24]. Within this framework, the dynamics of healthcare institutions were modeled by drawing inspiration from the Michaelis-Menten enzyme-substrate reaction scheme (the so-called MM reaction [25,26,27]). In this analogy, the enzyme corresponds to the available hospital beds, the substrate to the infected individuals, and the product to the recovered individuals. In other words, hospital beds effectively act as catalysts in the recovery process [24]. In addition, time delays associated with recovery and death processes are explicitly taken into account. The population is divided into compartments labeled S, I, R, D, and others. More specifically, our model consists of 13 compartments:
S = Number of susceptible people. This number refers to individuals not yet infected with the disease at time t but susceptible to it in the population.
= Number of susceptible people subject to the lockdown measures;
= Number of people in quarantine. This number concerns individuals who may have the virus after being in close contact with an infected person.
= Number of hospitalized infected people;
I = Number of people who have been infected and can spread the disease to those in the susceptible category (in this compartment, and are not accounted).
= Cumulative recovered people previously hospitalized.
R = Cumulative number of recovered people (by excluding people previously hospitalized), meaning specifically individuals having survived the disease and now immune. Those in this category are not able to be infected again or to transmit the infection to others.
= number of available hospital beds.
= Cumulative number of people previously hospitalized and dead for COVID-19.
D = Cumulative number of deceased individuals (by excluding the compartment ), for COVID-19.
L = Number of inhibitor sites mimicking lockdown measures.
Q = Number of inhibitor sites mimicking quarantine measures.
= Number of total cases.
In what follows, we specify the meanings of the symbols used throughout the next subsections:
→ denotes a direct reaction.
⇌ denotes direct and inverse reactions.
⇒ denotes a delayed reaction analogous to enzyme degradation processes, for example.
The overscripts , , , , , , , , , , and denote the direct chemical reaction rate, i.e., the speed at which a compartment is converted into another compartment. The subscript denotes the inverse chemical reaction rate. Quantities , , , , and represent the average time delays associated with the reaction.
The temporal evolution of these compartments is typically described by deterministic ordinary differential equations (ODEs), although a more realistic representation would involve stochastic differential equations (SDEs) [28]. In [20], we derived the deterministic ODEs governing the compartmental dynamics by incorporating recent theoretical developments reported in the literature [22,24], while explicitly accounting for time delays in the reaction processes. In the following subsections, we outline the main steps leading to the derivation of the ODEs that characterize the dynamics of our model.
2.1. Modelling the Departments’ Dynamics - Deterministic Case
When a susceptible individual comes into contact with an infected individual, transmission may occur, resulting in the susceptible individual becoming infected. Accordingly, the interaction can be represented by the following scheme:
Here, denotes the speed at which compartments is converted into twice comartment I. Lockdown measures are primarily based on the isolation of susceptible individuals, possibly accompanied by the removal of infected individuals through hospitalization, and, more generally, on limiting interactions involving susceptible individuals.
•Modelling the Restrictive Measures
We model lockdown and quarantine measures as inhibitor-type reactions, in which susceptible and infected individuals can be temporarily trapped in inactive states and , respectively. Denoting by L and Q the inhibitor sites that mimic lockdown and quarantine measures, respectively, we obtain:
Here, denotes the average time delay associated with the reaction , and . Therefore, when , nearly perfect lockdown measures can completely suppress virus transmission by inhibiting all susceptible individuals S and infected individuals I. In contrast, less effective lockdown measures leave a fraction of infected individuals free to spread the virus. The number of inhibitor sites may thus represent a fraction of the infected population. Figure 1 illustrates the behavior of the lockdown efficiency parameter adopted in our model. For simplicity, we assume this parameter to be constant, , within the time interval , and to vanish outside this interval. The inverse lockdown efficiency parameter is defined as , which equals outside the interval and vanishes within .
•Modelling the Recovered Individuals
To first approximation, the total number of recovered individuals R (that is, the total number of people who have survived the disease) can be straightforwardly determined by considering the following kinetic scheme:
that is, the rate of change of R is approximately proportional to the number of infected individuals I at time t1.
•Modelling the Infected Individuals
The number of infected individuals can be modeled by the following kinetic scheme:
with representing the number of available hospital beds. Scheme (4) is based on the following considerations:
- a)
- When a susceptible individual encounters an infected individual, transmission occurs, and the susceptible individual becomes infected;
- b)
- Infected individuals can either survive and recover following an average time delay , or succumb to the disease after an average time delay ;
- c)
•Modelling deaths
With respect to fatalities, we assume that the death rate is proportional to the infected population, in accordance with scheme (4). Hence:
2.1.1. Modelling the Role of the Hospitals
The recovery dynamics within hospitals are modeled by focusing exclusively on individuals associated with hospitalized infected patients. Accordingly, we propose the following model:
with those occupying a hospital bed, the recovered hospital patients, and the number of people deceased in the hospital. Of course,
The kinetic schemes above yield the full system of differential equations describing the dynamics of infected individuals, hospitalized recoveries, and deaths, with lockdown and quarantine measures included. We do not present these ordinary differential equations (ODEs) here2, but we note that they satisfy the conservation law:
The total population, , is defined as:
When lockdown and quarantine measures are not in place, the evolution of the infectious class depends on the following ratio:
with denoting the basic reproduction number. This parameter represents the expected number of new infections generated by a single infected individual in a fully susceptible population [13,14]. An epidemic can only take off if ; otherwise, the disease dies out from the outset. In [20], it is shown that our model can produce predictions not only for the first wave but also for the second and even the third waves of SARS-CoV-2 infections. The theoretical predictions closely match official case numbers with minimal parameter fitting. We discussed the strengths and limitations of the proposed model regarding long-term predictions, particularly in estimating the necessary duration of lockdown and quarantine measures to minimize the intensity of subsequent SARS-CoV-2 waves. This analysis incorporates recent theoretical results from the literature [28] and explicitly accounts for delays in the reaction steps. Our model has been successfully applied to both small countries, such as Belgium, and larger countries, including France and Germany [29,30,31,32].
2.2. Modelling the Departments’ Dynamics - Stochastic Case
To simplify the system of ODEs stemming from the above kinetic schemes without compromising the validity of our model, we adopt several reasonable assumptions. First, we assume that . Second, we neglect time delays. We also incorporate the current Belgian hospital protocol: “Only seriously ill individuals are hospitalized; the remaining infectious individuals are sent home and must undergo quarantine measures.” Consequently, , and the total number of recovered individuals, R, is much larger than the number of previously hospitalized recovered individuals, (i.e. ). Under these assumptions, the model simplifies to [28]:
Here,
in which denotes the time when the lockdown measures are applied. We also have with denoting the total hospital’s capacity. Hence, under these assumptions, after hospitalization, individuals will be removed from the disease, either due to immunization (e.g., due to vaccination or special health care received) or due to death. In the absence of the lockdown measures, we have the following scenarios:
In words:
• In case ), a proper epidemic outbreak occurs, characterized by an increase in the number of infectious individuals;
• In case ), Independent of the initial susceptible population, the disease is incapable of causing a substantial epidemic outbreak.
This finding emphasizes the essential role played by hospitals and healthcare institutions: If the hospital capacity exceeds a certain critical threshold, the spread of the Coronavirus tends to decline over time, and the stable solution corresponds to zero infectious individuals. Figure 2 and Figure 3 illustrate this scenario. Note that, for the parameter values reported in the corresponding figure captions, the critical hospital capacity is . This figure is compared to the observed data for Italy [34].
If the dynamics are subject to white noise, they are governed by stochastic differential equations. Without delving into the detailed mathematical derivation3, we directly present in Figure 4 the three correlation functions, , , and . These are the solutions of the stochastic differential equations governing the dynamics of our model, obtained under the assumption that the system is subject to white noise with intensities satisfying the laws of statistical mechanics [28]:
2.3. Comparison with Experimental Data
In the following subsubsection, we present several comparisons between the theoretical predictions of our models, Section 2.1 and Section 2.2, and experimental data.
2.3.1. Comparisons with the Predictions of the Kinetic-Type Reaction Model in Subsection 2.1.
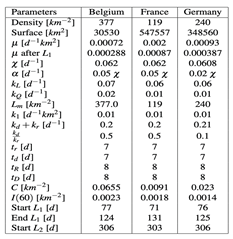
Below, we present a comparison between the theoretical predictions of models 2, 3, 4, 5, and 6 and the experimental data for three countries: Belgium, France, and Germany. The corresponding parameter values are listed in Table 1.
•Belgian Case.
Figure 5 and Figure 6 present a comparison between the theoretical predictions for the infected people I and mortality and the corresponding real data for Belgium, as reported by the Sciensano database. In particular, Figure 5 illustrates the model’s prediction of the second wave of SARS-CoV-2 infections.
•French Case.
Figure 7 and Figure 8 present a comparison between the theoretical predictions for and mortality and the corresponding real data for France, as reported by the Santé Publique France database. In particular, Figure 7 highlights the model’s prediction of the second wave of SARS-CoV-2 infections.
•German Case.
Figure 9 and Figure 10 present a comparison between the theoretical predictions for and mortality and the corresponding real data for Germany, as reported by the Robert Koch Institute and the World Bank database. In particular, Figure 9 highlights the model’s prediction of the second wave of SARS-CoV-2 infections.
2.3.2. Comparisons with the Predictions of the Kinetic-Type Reaction Model in SubSection 2.2.
Figure 11 shows the simulation of 200 trajectories of the stochastic equations generated using model (Section 2.2) for Italy. The thick black curve represents the numerical solution of the corresponding deterministic model (i.e., obtained by setting the noise intensity to zero). The noise intensity is , and the values of the other parameters are provided in the caption of Figure 11.
Figure 12 presents a comparison between the theoretical predictions (blue line) and the real data (black dots) for the USA, while Figure 13 shows the corresponding comparison for France. The parameter values used for both cases are provided in the respective figure captions.
Figure 14 illustrates the comparison between the theoretical predictions (blue lines) and the real data (black dots) for France, corresponding to the first and second waves of SARS-CoV-2. The noise intensity was estimated using statistical mechanics [28]. Overall, the predictions of our model show good agreement with the observed data.
Let us now consider the case of the USA, which experienced a second (and even a third) wave of Coronavirus infections. Due to the heterogeneity and vastness of the territory, the system variables (i.e., S, I, R, and D) must depend on both time and space. Accordingly, the evolution of the compartments is governed by Stochastic Partial Differential Equations (SPDEs). Figure 15 illustrates the solution of the stochastic differential equation for the USA, using values representative of the entire country.
3. Organizational and Structural Reorganization of Healthcare Facilities
One of the central points highlighted in our work is the necessity for rapid reorganization of hospitals during a pandemic. Traditional hospital structures, optimized for routine care, are often ill-suited for large-scale infectious outbreaks. Reorganization strategies include:
- Creation of dedicated COVID-19 wards and intensive care units;
- Suspension or rescheduling of non-urgent medical procedures;
- Reallocation of human resources, with multidisciplinary teams trained for emergency care;
- Flexible use of hospital spaces to increase surge capacity.
Such adaptive reconfiguration allows healthcare facilities to respond dynamically to the evolving epidemiological situation while maintaining essential services.
4. Protection of Healthcare Workers
Healthcare workers are among the most exposed groups during a pandemic. We stressed that protecting medical and paramedical staff is not only an ethical obligation but also a fundamental requirement for epidemic containment. Effective protection strategies involve:
- Adequate and continuous supply of personal protective equipment (PPE);
- Clear protocols for donning and doffing PPE;
- Regular testing and health monitoring of staff;
- Psychological support to mitigate stress and burnout.
Failure to protect healthcare workers can lead to staff shortages, increased transmission within hospitals, and reduced quality of care.
5. Hospitals as Nodes in a Broader Public Health Network
Hospitals do not operate in isolation. Our perspective emphasizes their integration within a broader healthcare and public health network that includes primary care, laboratories, emergency medical services, and public health authorities. This integration is essential for:
- Timely reporting of cases and epidemiological data;
- Coordination of testing and contact tracing;
- Efficient patient referral and discharge planning;
- Implementation of coherent regional and national containment policies.
Hospitals thus act as critical hubs for information flow and decision-making during health emergencies.
6. Avoiding Hospitals as Amplifiers of Contagion
Historical and contemporary evidence show that hospitals can become hotspots for infection if preventive measures fail. We warned that overcrowding, lack of resources, and delayed decision-making can transform healthcare facilities into amplifiers of viral spread. To avoid this risk, it is crucial to:
- Limit unnecessary hospital access;
- Strengthen outpatient and home-care services;
- Use telemedicine to reduce in-person consultations;
- Ensure continuous training and updating of staff on evolving guidelines.
These measures reduce the burden on hospitals and minimize the risk of nosocomial transmission.
7. Lessons Learned and Future Perspectives
The COVID-19 pandemic offers valuable lessons for future health crises. Drawing from our contributions, it becomes clear that hospital preparedness, flexibility, and integration are decisive factors in epidemic containment. Future strategies should focus on:
- Long-term investment in healthcare infrastructure;
- Development of pandemic preparedness plans;
- Strengthening cooperation between hospitals and public health institutions;
- Promoting research on healthcare system resilience.
Such efforts will enhance hospitals’ capacity to respond effectively to future outbreaks.
7.1. Discussion
The present study demonstrates that hospitals and healthcare facilities played a pivotal role in limiting SARS-CoV-2 transmission and maintaining healthcare system functionality during the COVID-19 pandemic. Beyond their primary responsibility for diagnosis and treatment, healthcare institutions served as central nodes for epidemiological surveillance, data interpretation, and coordinated response. Healthcare personnel, including physicians, nurses, and support staff, contributed to early detection of infections, contact tracing, risk assessment, and identification of emerging clinical patterns. These activities were essential for timely intervention and mitigation of uncontrolled transmission. In parallel, hospitals organized large-scale vaccination campaigns, disseminated public health information, and collected clinical and epidemiological data critical for disease prevention and control. Rigorous infection control measures, including patient isolation, systematic use of personal protective equipment, and environmental sanitization, significantly reduced the risk of intra-hospital transmission. These practices not only protected vulnerable patients and staff but also prevented healthcare facilities from becoming amplifiers of contagion during epidemic peaks. By integrating empirical evidence with stochastic and deterministic modeling, this study provides a coherent interpretation of how hospital organization, workforce management, and systemic coordination influence outbreak trajectories. The synthesis of previously fragmented findings allows identification of structural vulnerabilities and effective intervention strategies that may not be apparent from isolated analyses. The experiences documented during the SARS-CoV-2 pandemic highlight the importance of sustained investment in hospital preparedness, workforce protection, and interoperable data systems. These elements are central to healthcare system resilience and remain critical for responding to future infectious disease threats. The flexible framework proposed here offers a transferable foundation for adapting hospital-centered strategies to other epidemics and pandemics.
8. Conclusions
Transmissible infections may occur during hospital stays or following medical procedures, highlighting the importance of comprehensive prevention strategies that include hygiene practices, vaccination programs, routine health monitoring, and institutional safety measures. The SARS-CoV-2 pandemic has demonstrated that hospitals and healthcare facilities play a central role in protecting patients, staff, and communities during large-scale health emergencies. This study shows that healthcare institutions are not merely sites of patient care but function as active agents in epidemic containment. Through effective organizational structures, workforce protection, and integration within public health networks, hospitals can substantially reduce transmission and mitigate the systemic impact of pandemics. By synthesizing previously fragmented empirical and modeling results, the present work provides a comprehensive understanding of hospital- and system-centered responses and translates these findings into actionable lessons and emerging strategies. The proposed kinetic-type reaction framework, based on both standard SIS and extended models, highlights the critical influence of healthcare institutions on outbreak dynamics. Treating epidemiological compartments as chemically active species and incorporating stochastic effects allows a realistic representation of uncertainty and variability in disease spread. Validation against real-world data from the United States and France confirms that even relatively simple models can capture essential mechanisms of epidemic control. Importantly, the mathematical formalism developed in this study is modular and adaptable. Additional compartments accounting for temporary immunity, quarantine measures, age-specific outcomes, or emerging variants can be incorporated as required, enabling application to future epidemics and pandemics. This flexibility supports both analytical investigation and data-driven policy planning. Overall, our findings underscore that robust, hospital-centered strategies are indispensable for reducing transmission, safeguarding healthcare workers, and strengthening healthcare system resilience. Sustained investment in preparedness, workforce protection, and integrated data systems is essential for improving responses to future infectious disease threats. By providing a unified and transferable framework, this study contributes to advancing evidence-based strategies for pandemic preparedness and healthcare system sustainability.
Acknowledgments
GS is sincerely grateful to Prof. Pasquale Nardone and Dr. Philippe Peeters of the Universitè Libre de Bruxelles (ULB) for their valuable suggestions and insightful discussions.
References
- Wu, F. A new coronavirus associated with human respiratory disease in China 2020, 579(7798), 265–269.
- Zhou, P. A pneumonia outbreak associated with a new coronavirus of probable bat origin 2020, 579(7798), 270–273.
- Zhu, N. A novel coronavirus from patients with pneumonia in China 2019, 382(8), 727–733.
- Guan, W.-J. Clinical characteristics of coronavirus disease 2019 in China 2020, 382(18), 1708–1720.
- Wrapp, D. Cryo-EM structure of the 2019-nCoV spike in the prefusion conformation 2020, 367(6483), 1260–1263.
- Walls, A. C. Structure, function, and antigenicity of the SARS-CoV-2 spike glycoprotein 2020, 581(7807), 221–227.
- Bai, Y. Presumed asymptomatic carrier transmission of COVID-19 2020, 382(13), 1199–1207.
- He, X. Temporal dynamics in viral shedding and transmissibility of COVID-19 2020, 26(5), 672–675.
- Conti, P.; Ronconi, G.; Caraffa, AL; Gallenga, CE; Ross, R.; Frydas, I.; Kritas, SK. Induction of pro-inflammatory cytokines (IL-1 and IL-6) and lung inflammation by Coronavirus-19 (COVI-19 or SARS-CoV-2): anti-inflammatory strategies . J Biol Regul Homeost Agents 2020, 34(2), 327–331. [Google Scholar] [PubMed]
- Sonnino, G. The COVID-19 - The Infectious Disease Caused by the Latest Discovered Coronavirus (SARS-CoV-2) . European Commission, Directorate "DG.EAC.B ("Youth, Education, and Erasmus +"), Reg. number: ARES(2020)1530456. Save number: eac.b.adv01(2020)1743451. Reg. on: 12/03/2020. Available online: https://europa.eu/european-union/contact/write-to-us_en (accessed on March 2020).
- Mathur, N.; Shaw, G. An empirical model on the dynamics of Covid-19 spread in human population; Department of Theoretical Physics, Tata Institute of Fundamental Research, Mumbai (India) 2020 -; Available online: https://arxiv.org/pdf/2008.06346.pdf.
- Cacciapaglia, G.; Cot, C.; Sannino, F. Second wave COVID-19 pandemics in Europe: a temporal playbook . Scientific Reports 2020, 10, Article number, 15514. [Google Scholar] [CrossRef] [PubMed]
- Bailey, Norman T. J., (1975), The mathematical theory of infectious diseases and its applications (2nd ed.). London: Griffin; ISBN 0-85264-231-8.
- Sonia, A.; Nunn, C. Infectious diseases in primates: behavior, ecology and evolution . In Oxford Series in Ecology and Evolution; Oxford University Press: Oxford [Oxfordshire], 2006; ISBN 0-19-856585-2. [Google Scholar]
- Vynnycky, E.; White, R. G. An Introduction to Infectious Disease Modelling; Oxford University Press, 2010; ISBN 978-0-19-856576-5. (eds. 2010). [Google Scholar]
- Richardson, S. Presenting characteristics, comorbidities, and outcomes among 5700 patients hospitalized with COVID-19 in the New York City area 2020, 382(21), 2052–2059.
- Grasselli, G. Baseline characteristics and outcomes of 1591 patients infected with SARS-CoV-2 admitted to ICUs of the Lombardy region, Italy 2020, 382(16), 1574–1581.
- Moghadas, S. M. The implications of silent transmission for the control of COVID-19 outbreaks 2020, 117(30), 17513–17515.
- Chinazzi, M. The effect of travel restrictions on the spread of the 2019 novel coronavirus (COVID-19) outbreak 2020, 368(6489), 395–400.
- Sonnino, G.; Peeters, P.; Nardone, P. Modelling the Spreading of the SARS-CoV-2 in Presence of the Lockdown and Quarantine Measures by a Kinetic-Type Reactions Approach . In Mathematical Medicine and Biology: A Journal of the IMA; Oxford University Press, 2022; Volume 39, 2, pp. 105–125. [Google Scholar]
- Sonnino, G. Mathematical Modeling as a Tool for Policy Decision – Application to the Spread of the SARS-CoV-2 Infection . European Commission, Directorate DG.EAC.B ("Youth, Education, and Erasmus +"), Reg. number: ARES(2023)8875824. Save number: eac.b.adv01(2023)13096983. Reg. on: 26/12/2023. Available online: https://europa.eu/european-union/contact/write-to-us_en (accessed on December 2023).
- Sonnino, G.; Nardone, P. Dynamics of the COVID-19 - Comparison between the Theoretical Predictions and the Real Data, and Predictions about Returning to Normal Life . Annals of Clinical and Medical Case Reports 2020, 4(Issue 9), 1–21. [Google Scholar] [CrossRef]
- Sonnino, G.; Peeters, P.; Nardone, P. Modelling the Spread of SARS-CoV2 and its variants. Comparison with Real Data. Relations that have to be Satisfied to achieve the Total Regression of the SARS-CoV2 Infection . European Society of Medicine (ESMED) 2022, 10(7). [Google Scholar] [CrossRef]
- Sonnino G., Peeters P., and Nardone P., Modelling the Coronavirus Second Wave in Presence of the Lockdown and Quarantine Measures, Conference on Complex Systems 2020 COMPLEX2020, Abstract in . [CrossRef]
- Michaelis, L. Menten M.L., Die Kinetik der Invertinwirkung. Biochem Z 1913, 49, 333–369. [Google Scholar]
- Srinivasan, Bharath (2020-10-08), Explicit treatment of non-Michaelis-Menten and atypical kinetics in early drug discovery. ChemMedChem. Retrieved 2020-11-09 . [CrossRef]
- Srinivasan, Bharath (2020-09-27), Words of advice: teaching enzyme kinetics. The FEBS Journal. [CrossRef] [PubMed]
- Sonnino, G.; Mora, F.; Nardone, P. A Stochastic Kinetic Type Reactions Model for COVID-19 . Mathematics 2021, 9(11), 1221. [Google Scholar] [CrossRef]
- Sciensano. Available online: https://www.sciensano.be/en/covid-19-data.
- Santé Publique France. Available online: https://www.santepubliquefrance.fr/.
- Koch Institute. Available online: https://dc-covid.site.ined.fr/en/data/germany/.
- Our World in Data. Available online: https://ourworldindata.org/covid-models.
- https://en.wikipedia.org/wiki/Compartmental_models_(epidemiology).
- https://www.agi.it/fact-checking/news/2020-03-06/coronavirus-posti-letto-ospedali-7343251/.
| 1 | |
| 2 | |
| 3 | The full formulation can be found in [28] |
Figure 1.
Lockdown Efficiency Parameter. For simplicity, we model the lockdown efficiency parameter as a step function. Specifically, it takes a constant nonzero value, , over the interval , and vanishes outside this range.
Figure 1.
Lockdown Efficiency Parameter. For simplicity, we model the lockdown efficiency parameter as a step function. Specifically, it takes a constant nonzero value, , over the interval , and vanishes outside this range.
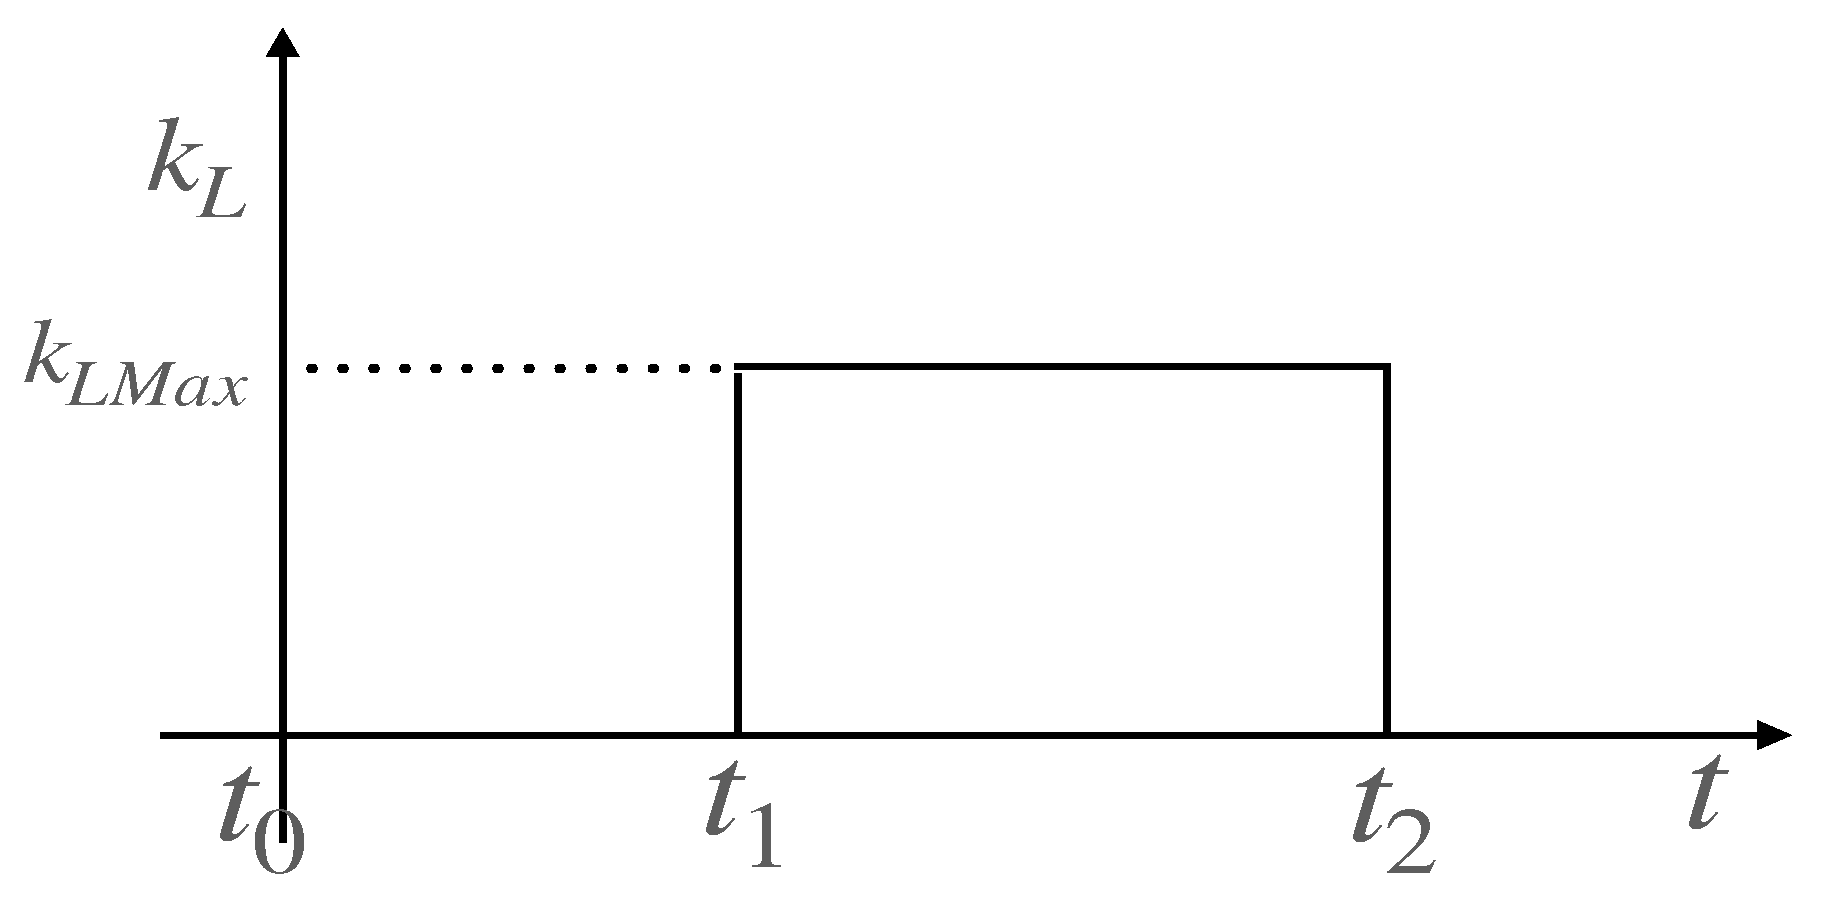
Figure 2.
Time evolution of infectious and hospitalized infectious individuals - . Here, the epidemic outbreak leads to an increase in the number of infectious individuals. The parameters are given by: , , , , and .
Figure 2.
Time evolution of infectious and hospitalized infectious individuals - . Here, the epidemic outbreak leads to an increase in the number of infectious individuals. The parameters are given by: , , , , and .
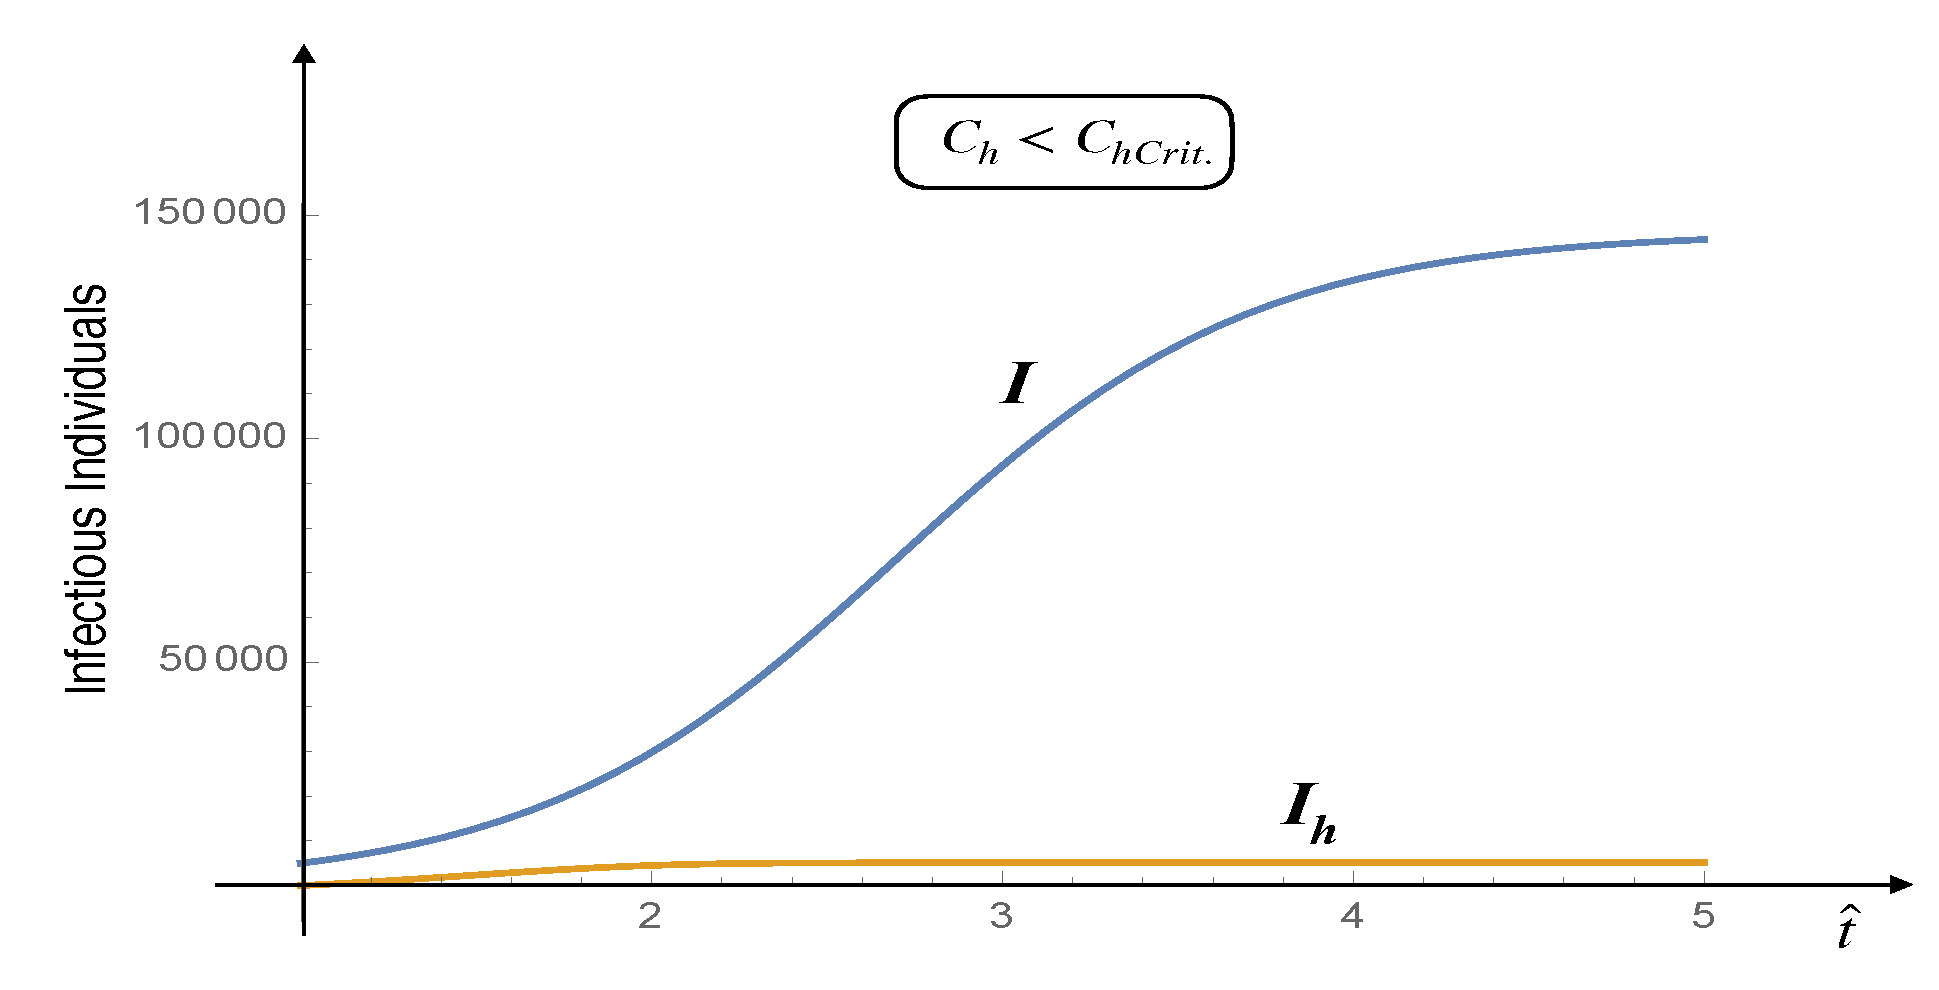
Figure 3.
Infectious people and Infectious hospitalised people vs time - . Independent of the initial size of the susceptible population, the disease can never cause a proper epidemic outbreak. The values of the parameters are: , , , , and .
Figure 3.
Infectious people and Infectious hospitalised people vs time - . Independent of the initial size of the susceptible population, the disease can never cause a proper epidemic outbreak. The values of the parameters are: , , , , and .
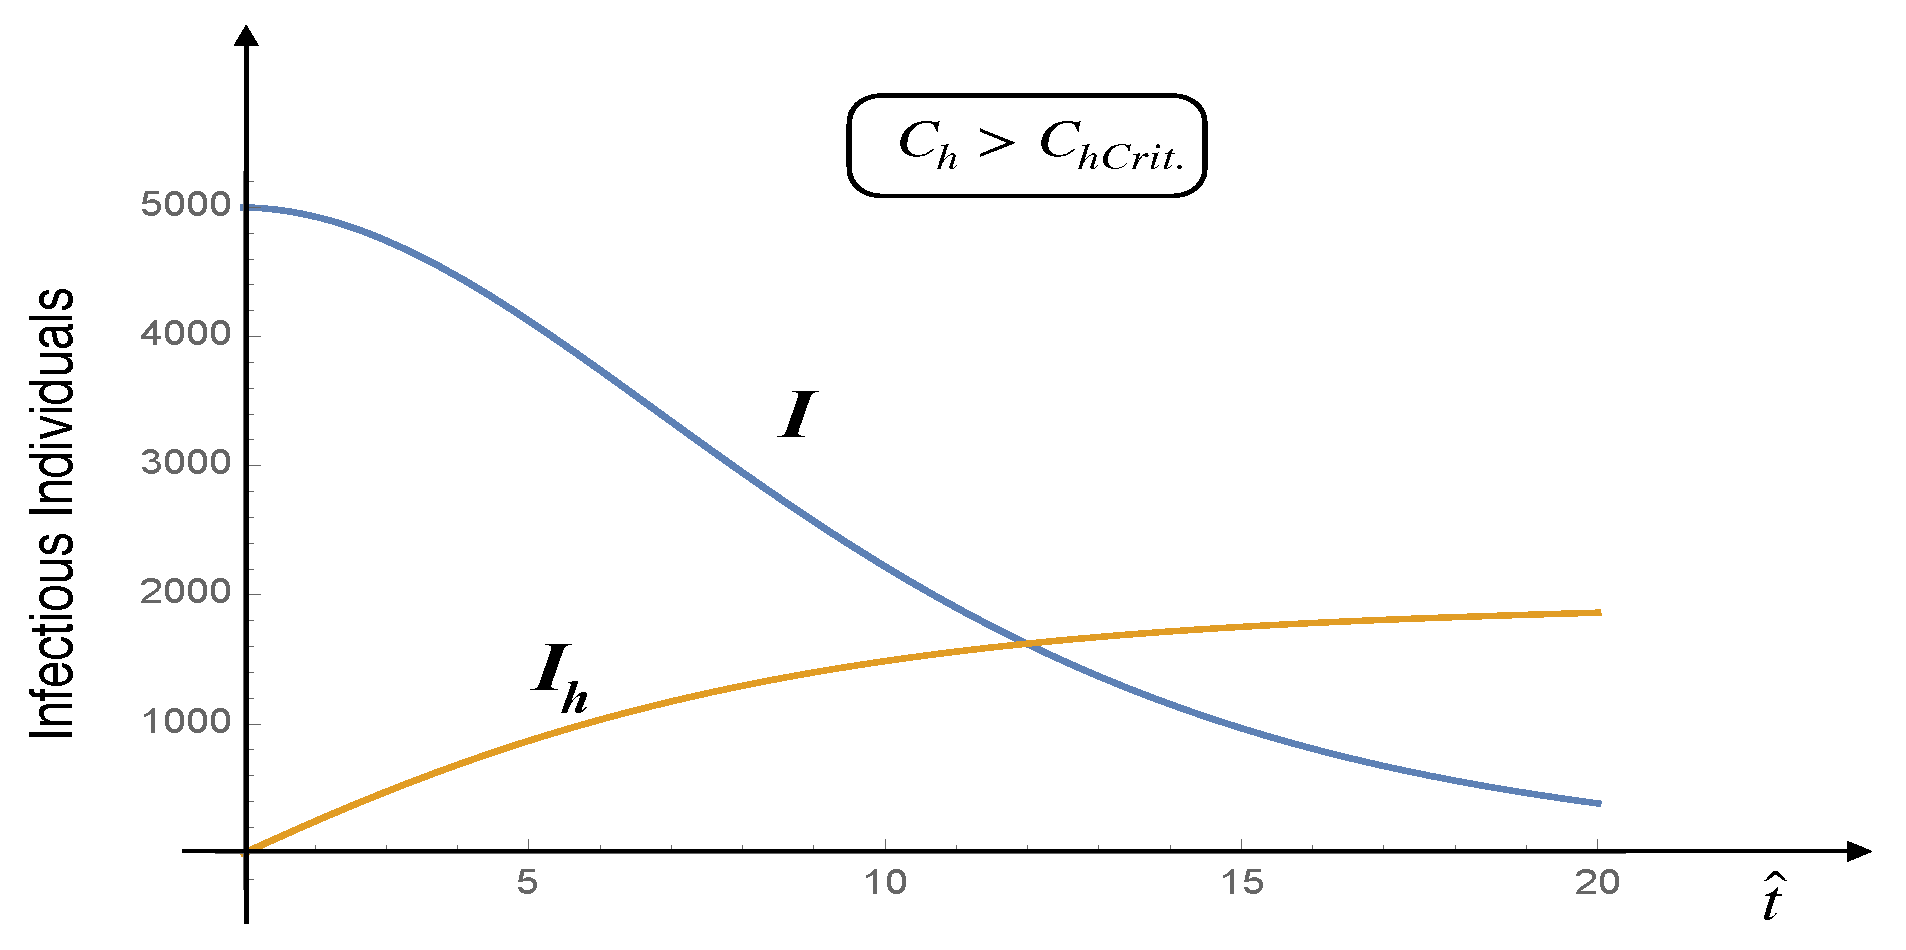
Figure 4.
Correlation functions
, , and . These correlation functions were computed by numerically solving the stochastic differential equations stemming from the kinetic schemes (11), under the assumption that the system is subject to white noise with intensities satisfying the laws of statistical mechanics.
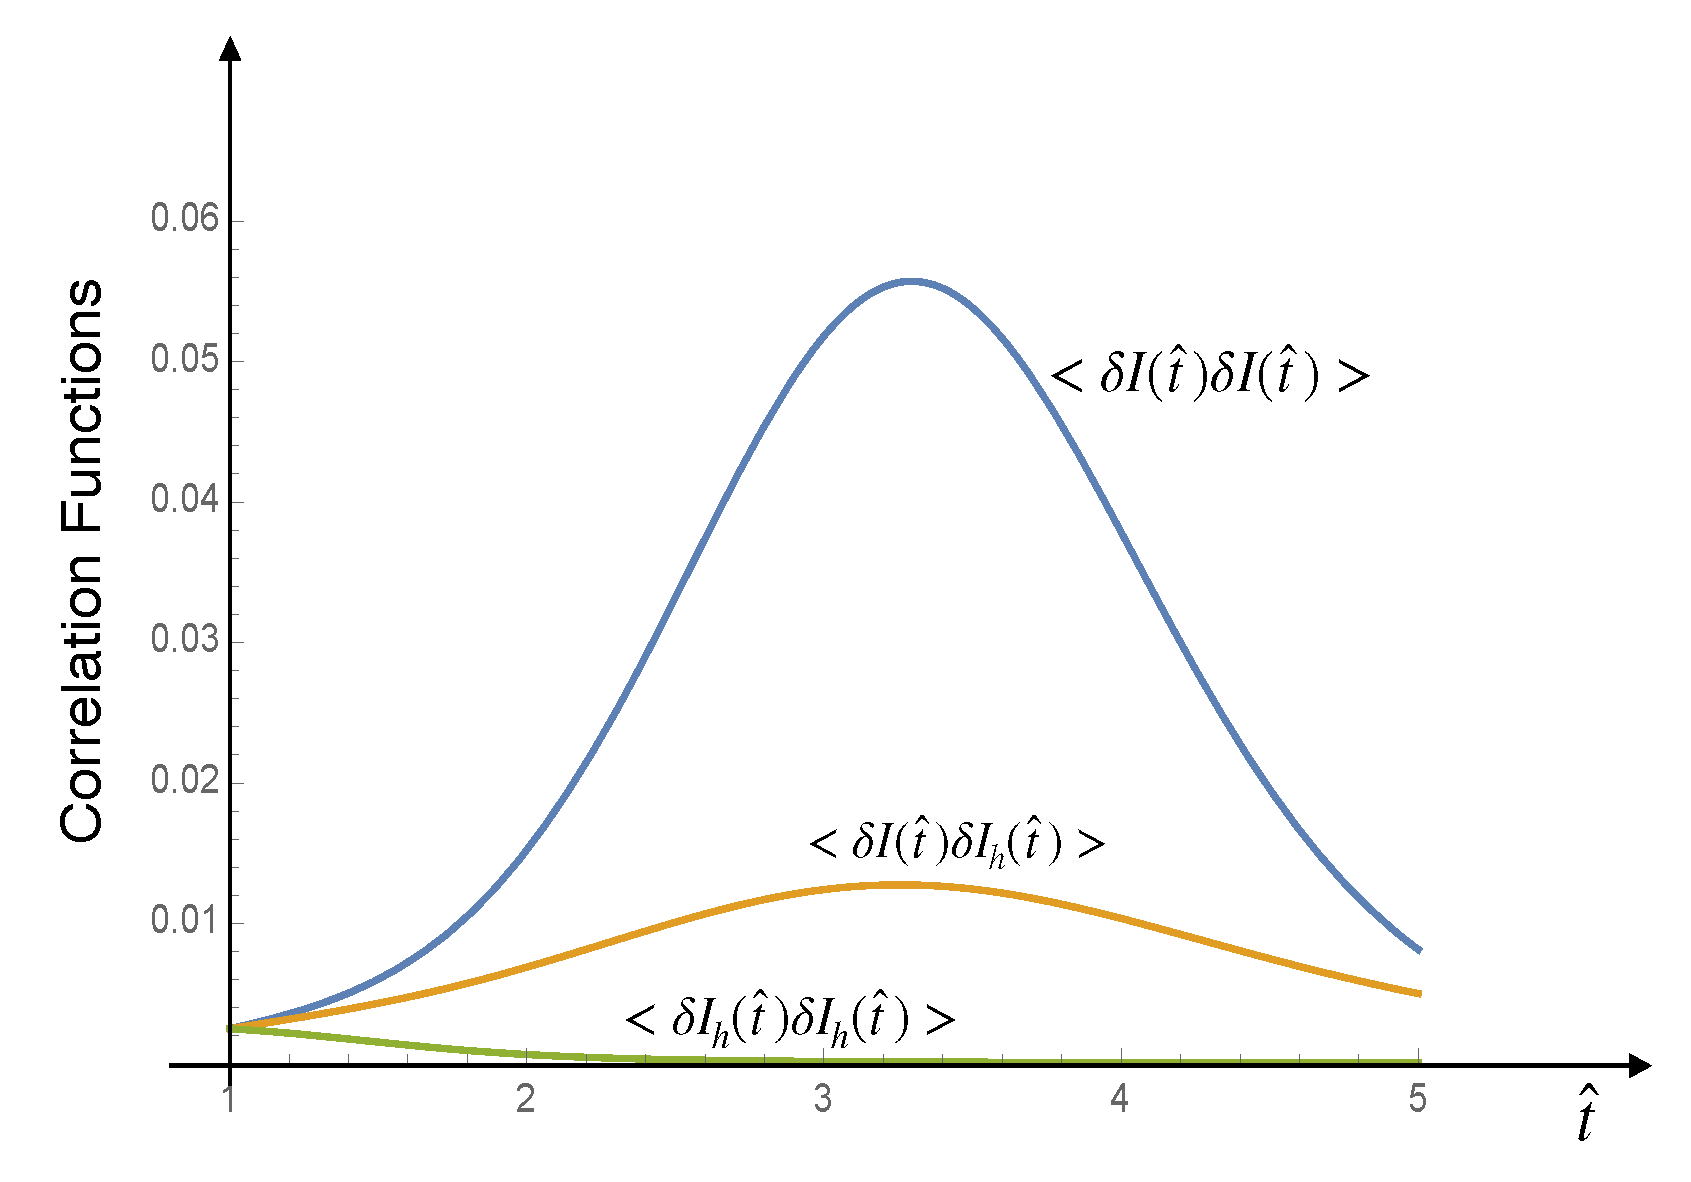
Figure 5.
Comparison between the theoretical predictions for the number of infected individuals, I, and the corresponding real data for Belgium, as provided by the Sciensano database.
Figure 5.
Comparison between the theoretical predictions for the number of infected individuals, I, and the corresponding real data for Belgium, as provided by the Sciensano database.
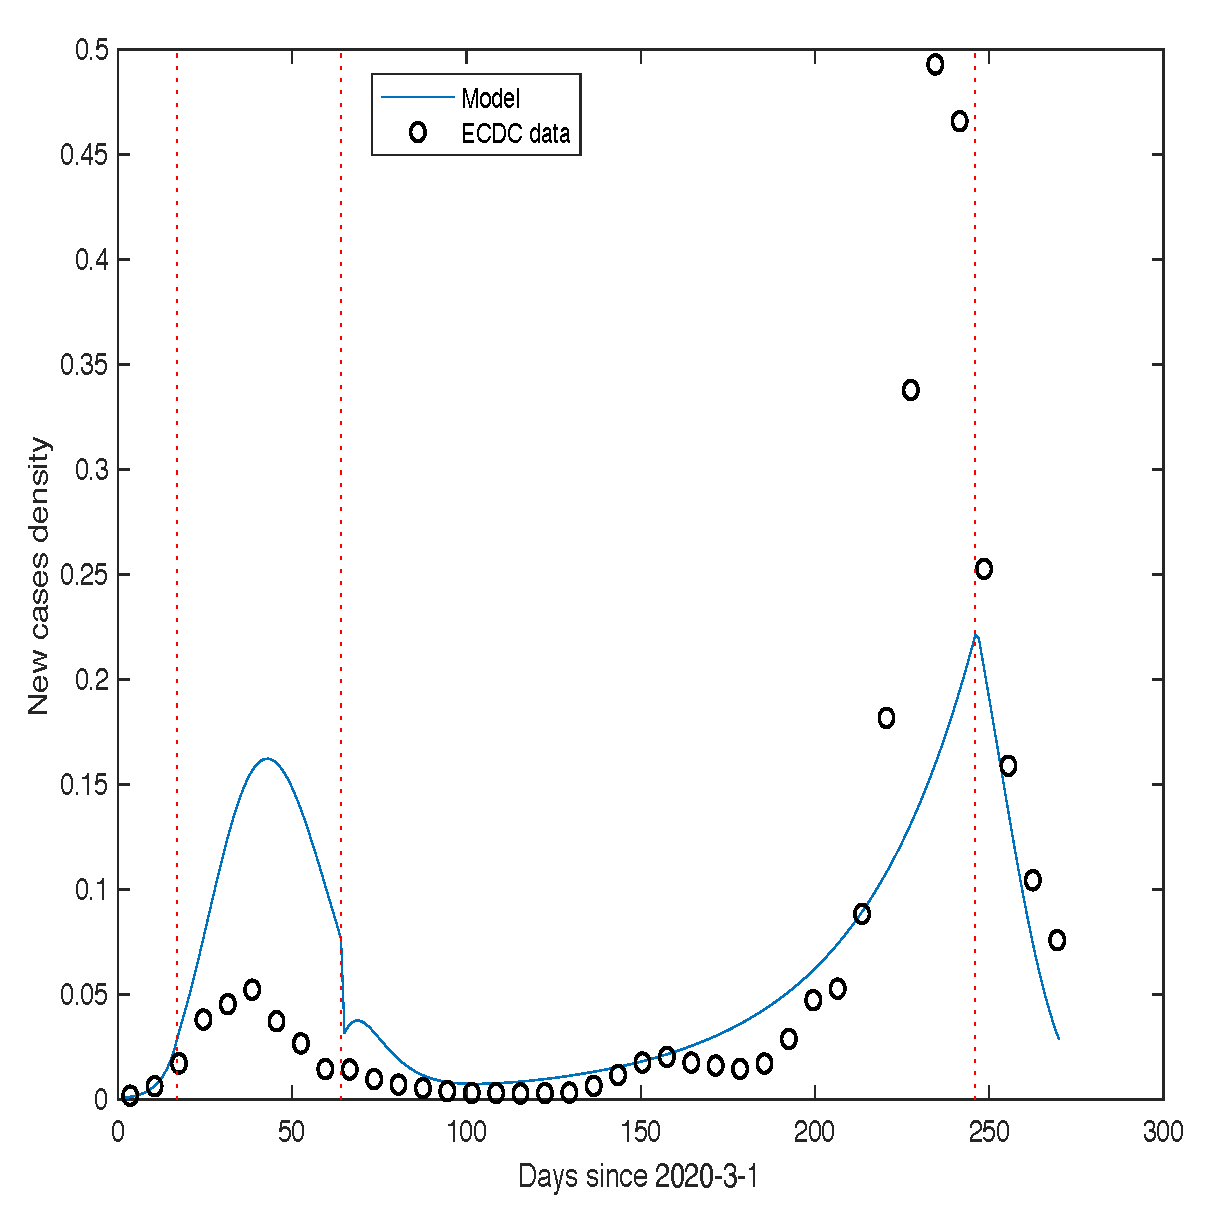
Figure 6.
“Comparison between the theoretical predictions of our model for mortality and the corresponding real data for Belgium, as provided by the Sciensano database.
Figure 6.
“Comparison between the theoretical predictions of our model for mortality and the corresponding real data for Belgium, as provided by the Sciensano database.
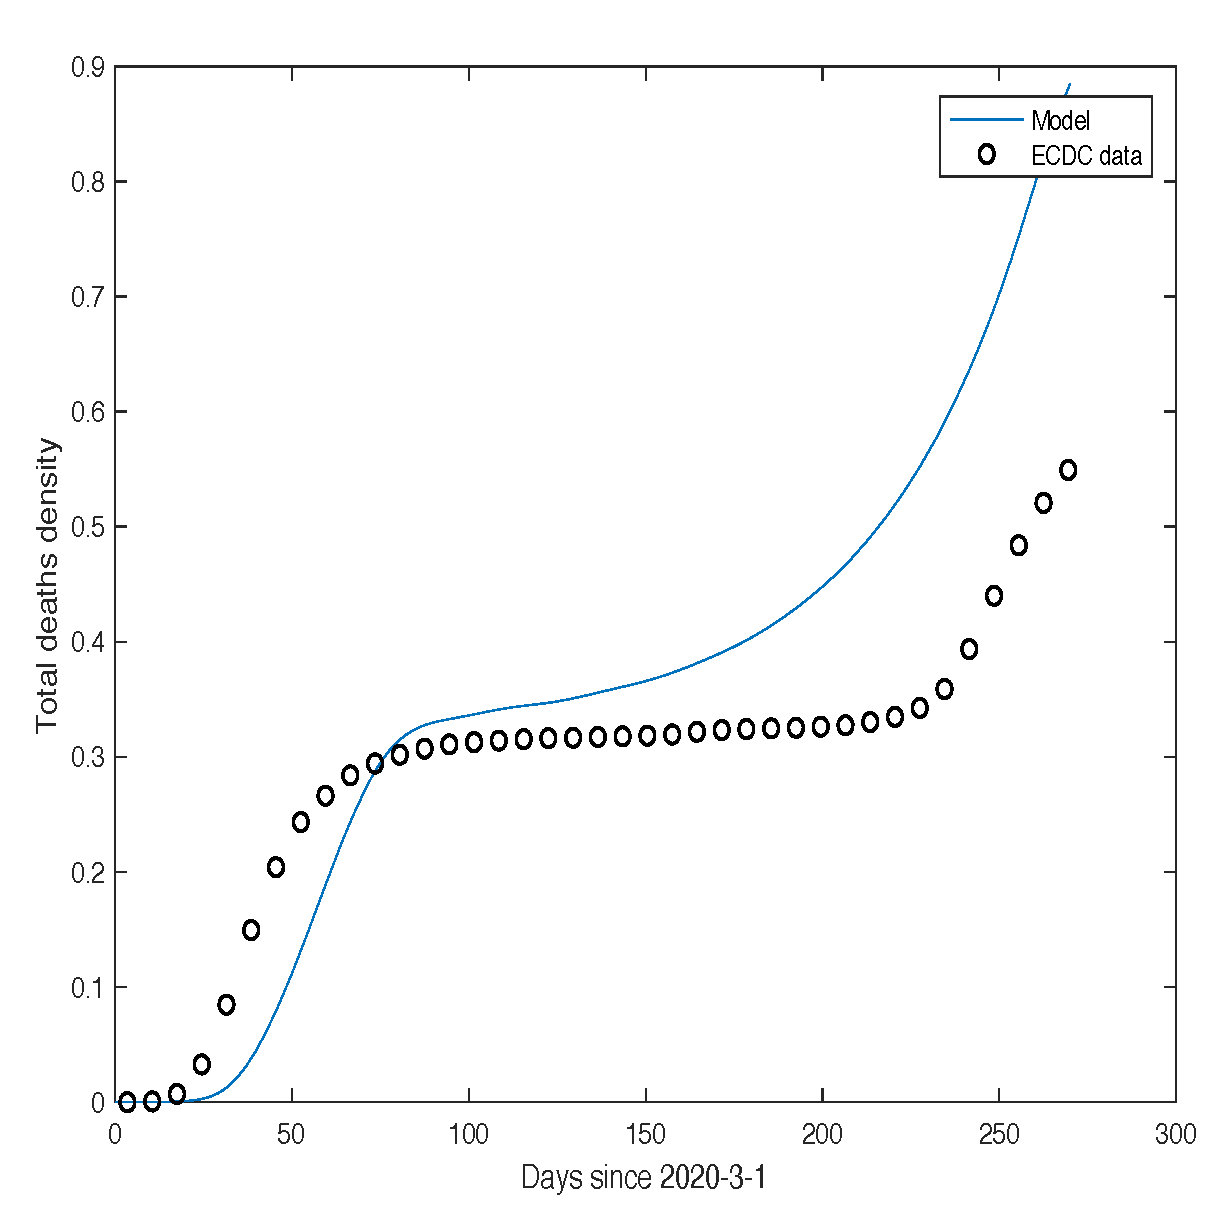
Figure 7.
Comparison between the theoretical predictions for I and the corresponding real data for France, as provided by the Santé Publique France database.
Figure 7.
Comparison between the theoretical predictions for I and the corresponding real data for France, as provided by the Santé Publique France database.
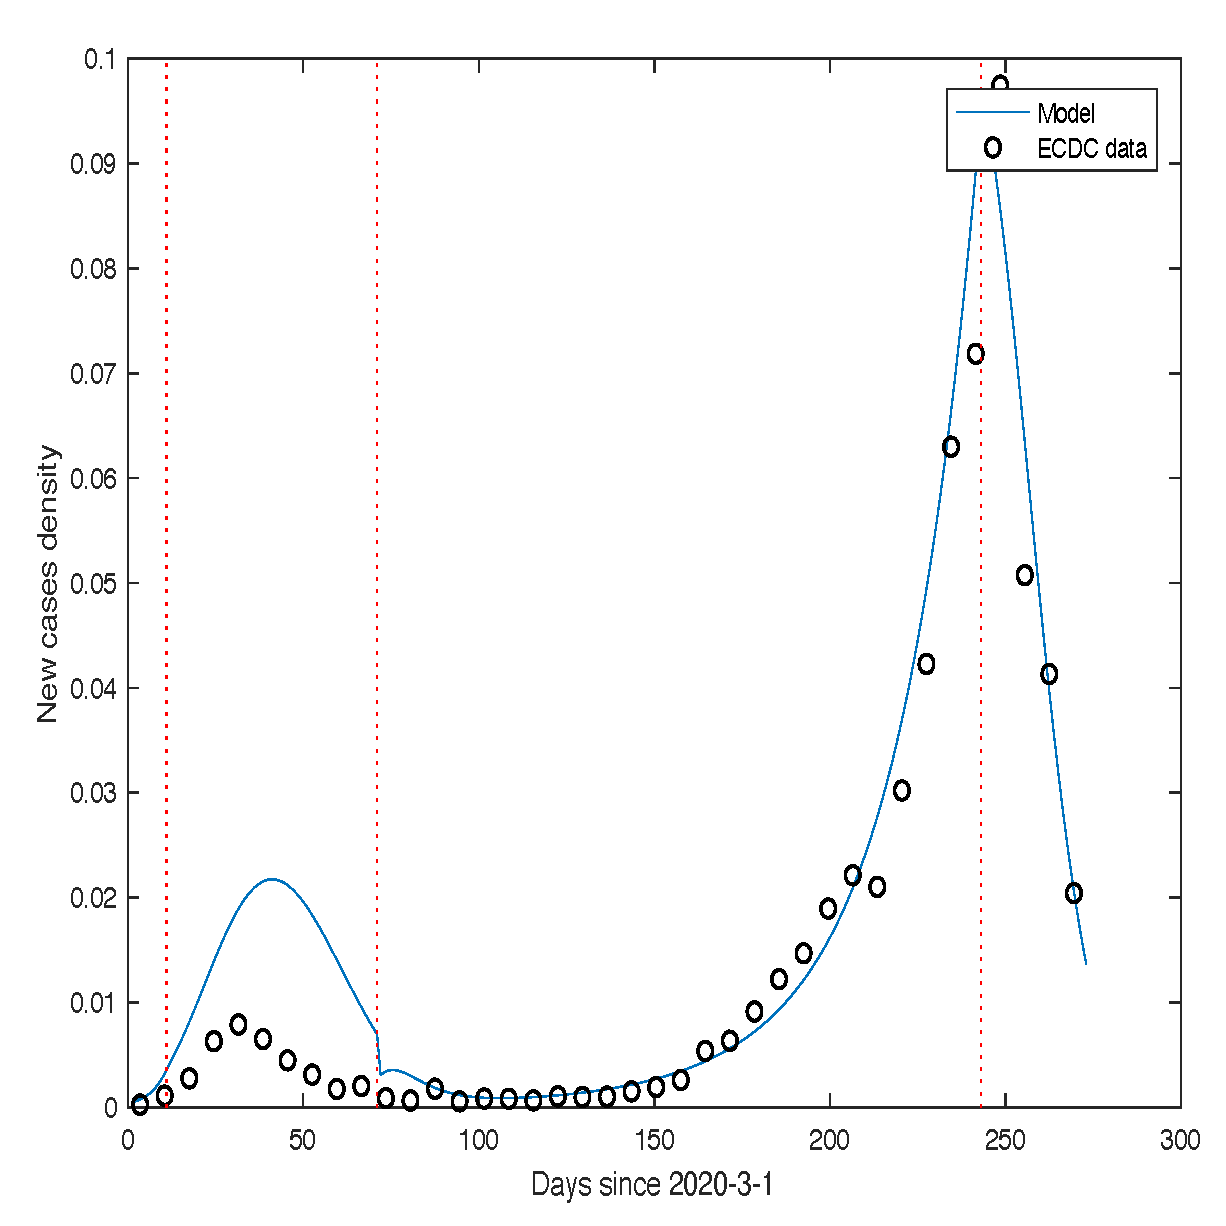
Figure 8.
Comparison between the theoretical predictions of our model for mortality and the corresponding real data for France, as provided by the Santé Publique France database.
Figure 8.
Comparison between the theoretical predictions of our model for mortality and the corresponding real data for France, as provided by the Santé Publique France database.
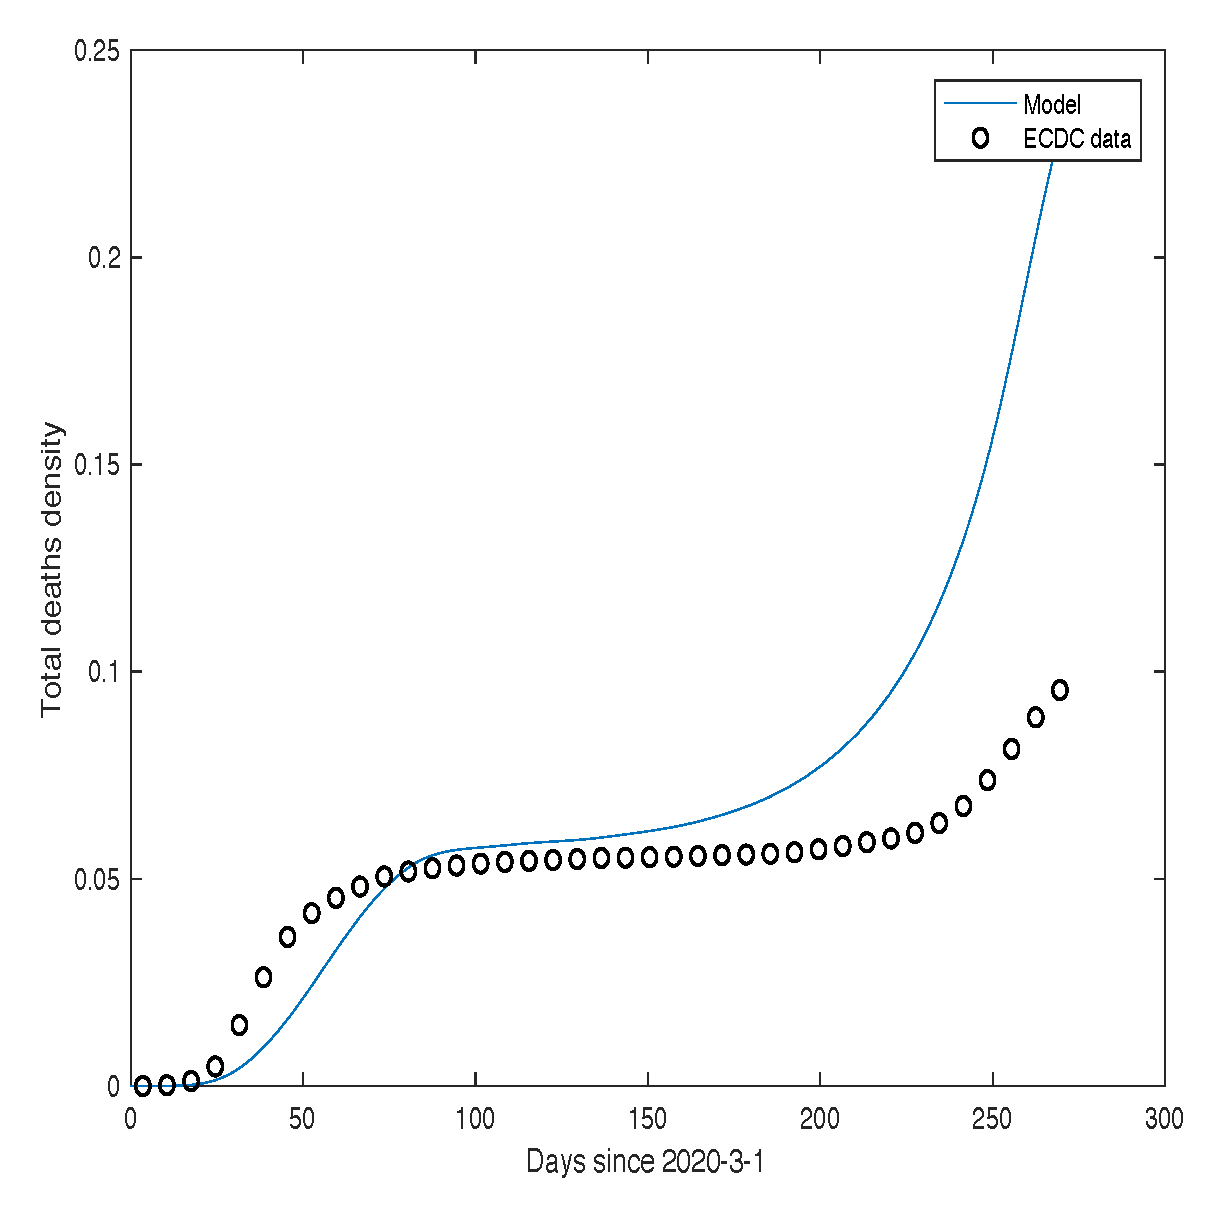
Figure 9.
“Comparison between the theoretical predictions for I and the corresponding real data for Germany, as provided by the Robert Koch Institute and the World Bank database.
Figure 9.
“Comparison between the theoretical predictions for I and the corresponding real data for Germany, as provided by the Robert Koch Institute and the World Bank database.
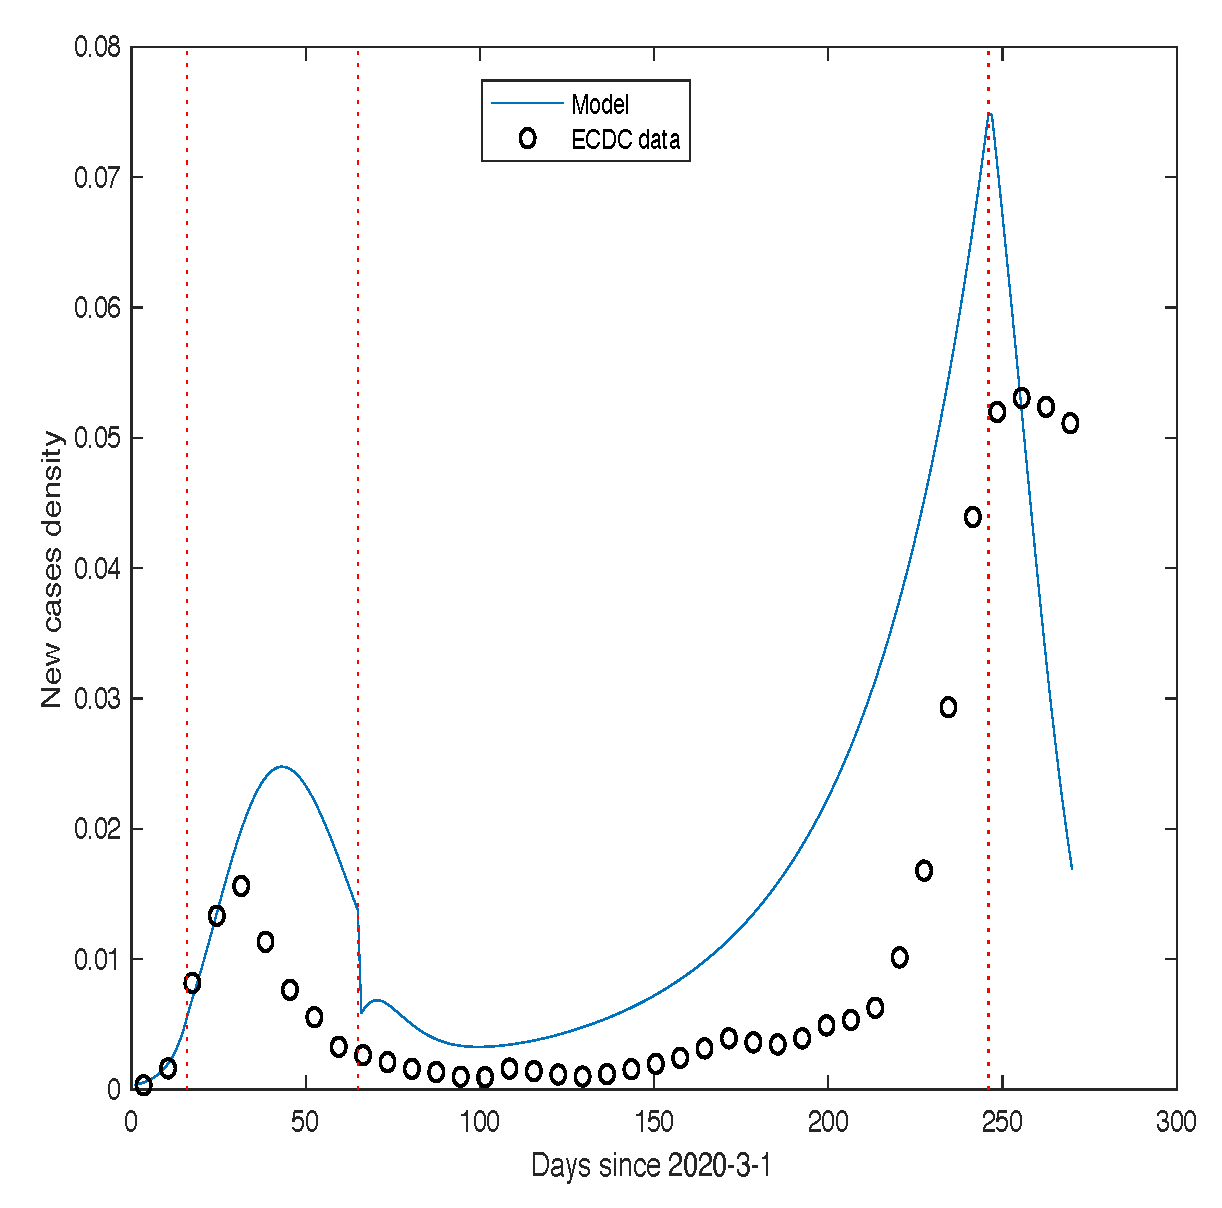
Figure 10.
Comparison between the theoretical predictions of our model for mortality and the corresponding real data for Germany, as reported by the Robert Koch Institute and the World Bank database.
Figure 10.
Comparison between the theoretical predictions of our model for mortality and the corresponding real data for Germany, as reported by the Robert Koch Institute and the World Bank database.
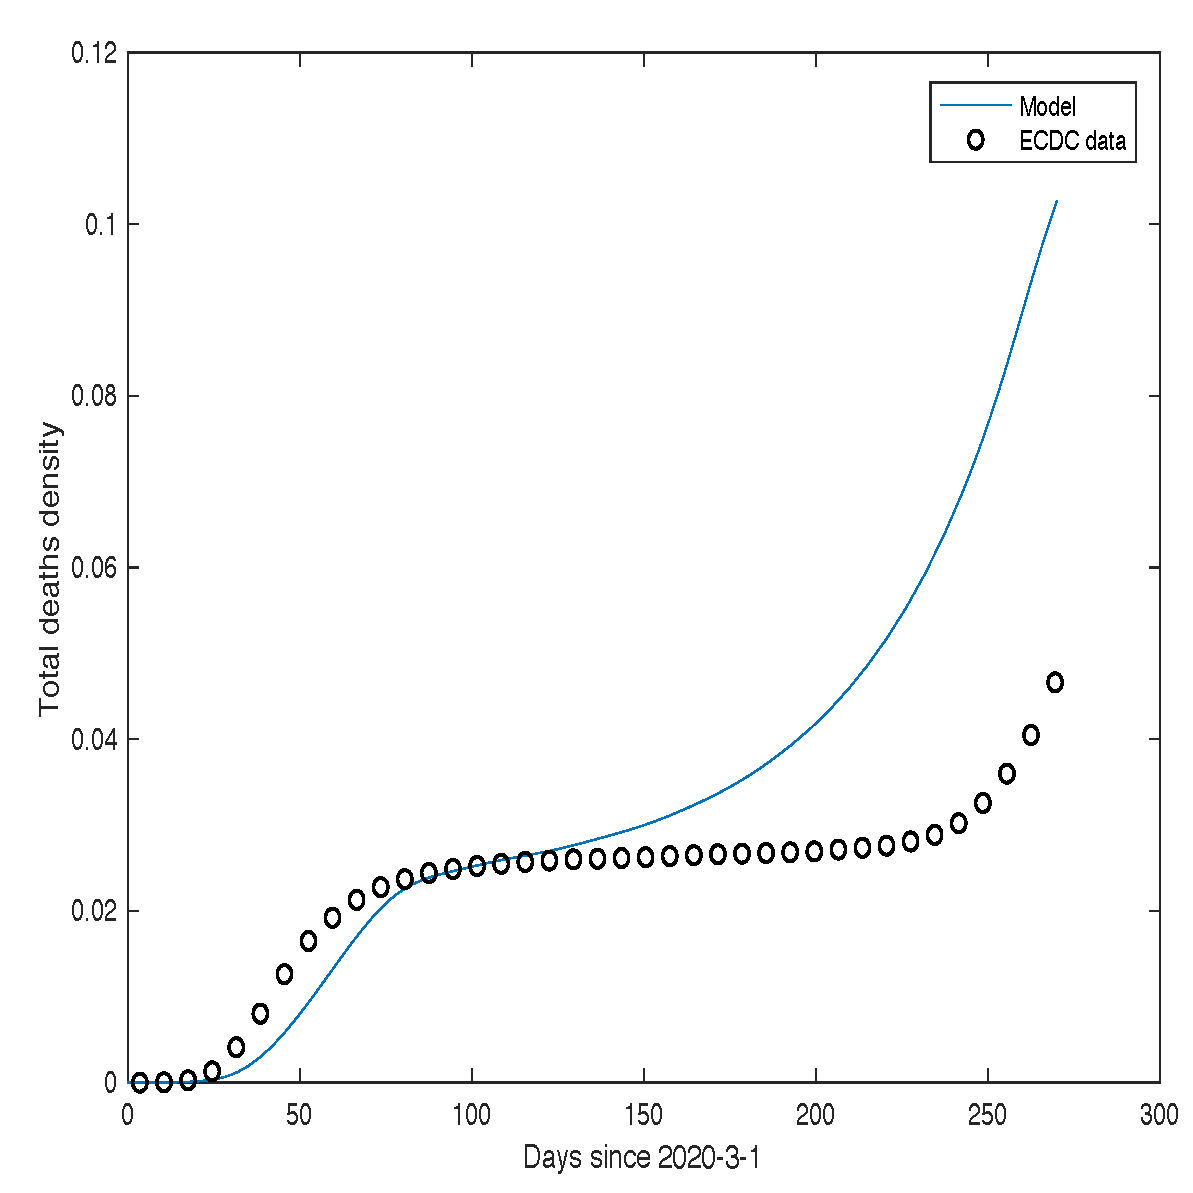
Figure 11.
Solution of the stochastic equation for Italy. This behavior corresponds to the first wave of SARS-CoV-2 infections, with a noise intensity of and 200 realizations. The other parameter values are , , , and . The thick black curve represents the numerical solution of the deterministic equations governing model (2.2).
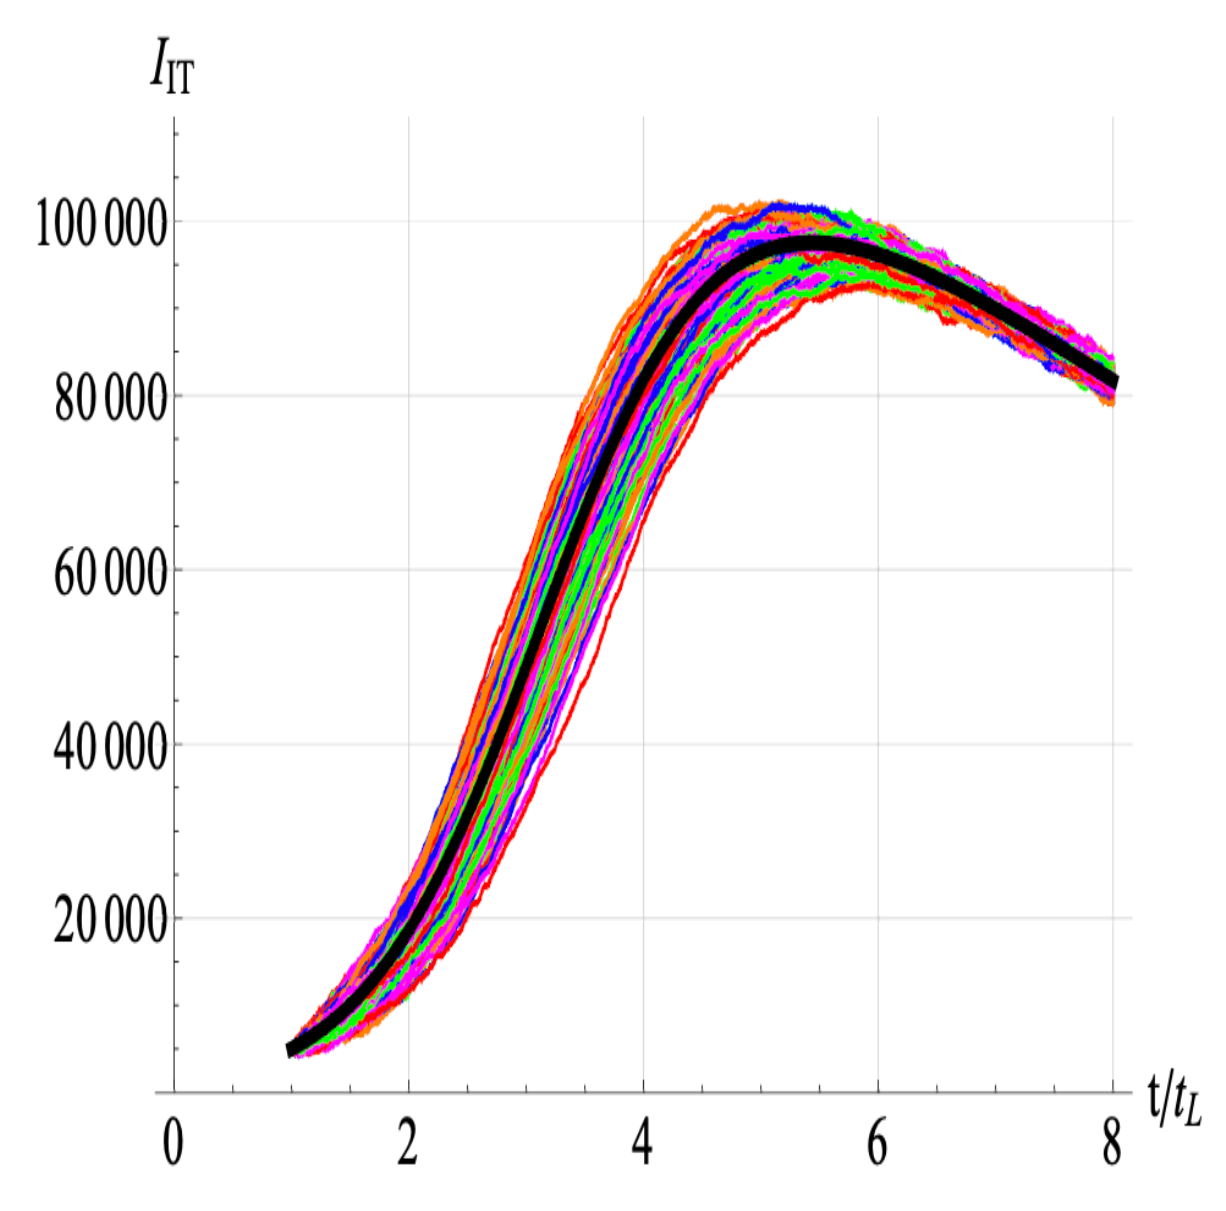
Figure 12.
Number of individuals infected with SARS-CoV-2 in the USA.
The black dots represent the experimental data, while the thick blue curve corresponds to the numerical solution obtained using model (2.2).
Figure 12.
Number of individuals infected with SARS-CoV-2 in the USA.
The black dots represent the experimental data, while the thick blue curve corresponds to the numerical solution obtained using model (2.2).
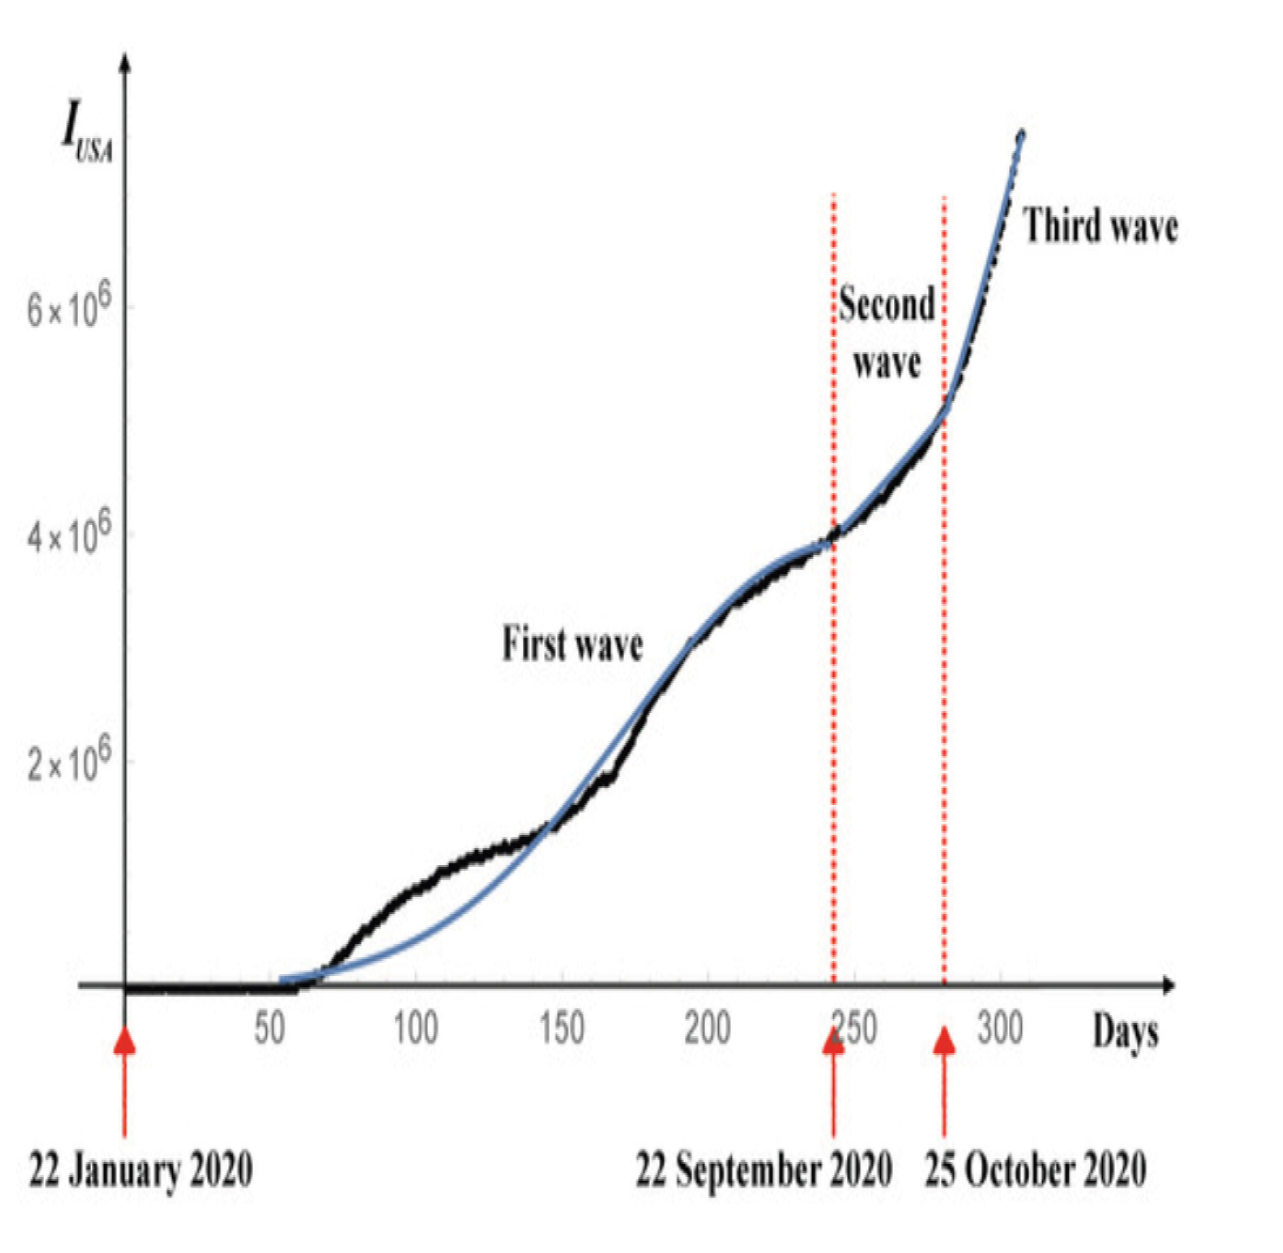
Figure 13.
Number of individuals infected with SARS-CoV-2 in France. The black dots represent the experimental data, while the thick blue curve corresponds to the numerical solution obtained using model (Section 2.2).
Figure 13.
Number of individuals infected with SARS-CoV-2 in France. The black dots represent the experimental data, while the thick blue curve corresponds to the numerical solution obtained using model (Section 2.2).
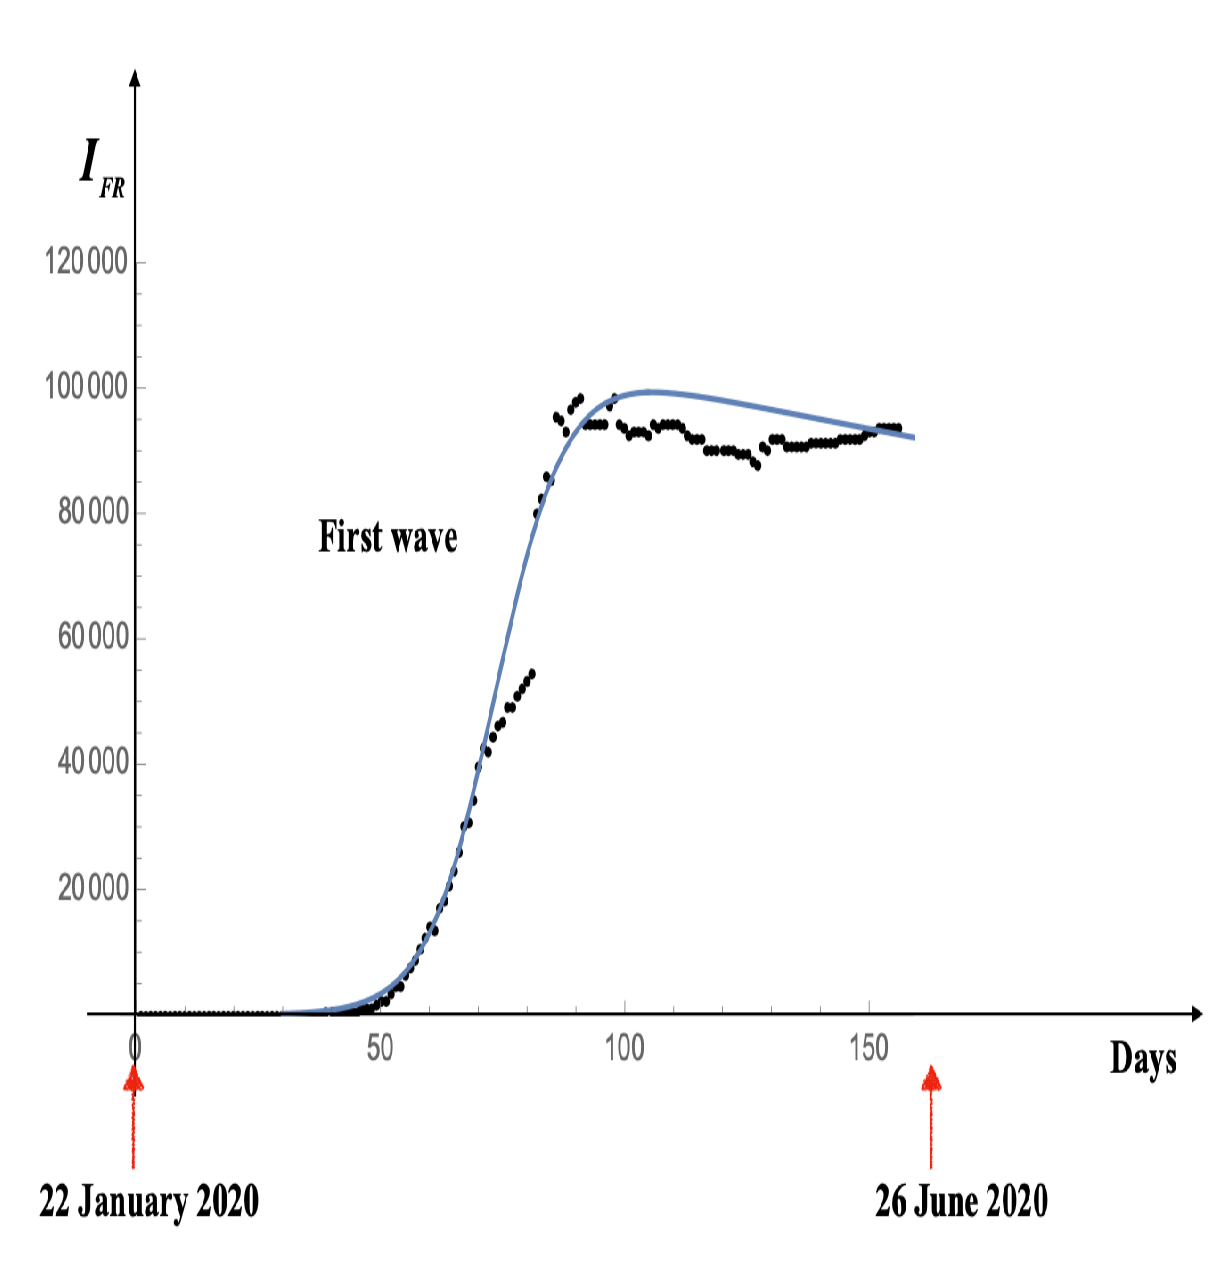
Figure 14.
Solutions (200 realizations) of the stochastic differential equation for France - First wave.
Parameter values are as reported in Figure 13, with a noise intensity of , determined from statistical mechanics. The black curve shows the solution of the corresponding deterministic equation.
Figure 14.
Solutions (200 realizations) of the stochastic differential equation for France - First wave.
Parameter values are as reported in Figure 13, with a noise intensity of , determined from statistical mechanics. The black curve shows the solution of the corresponding deterministic equation.
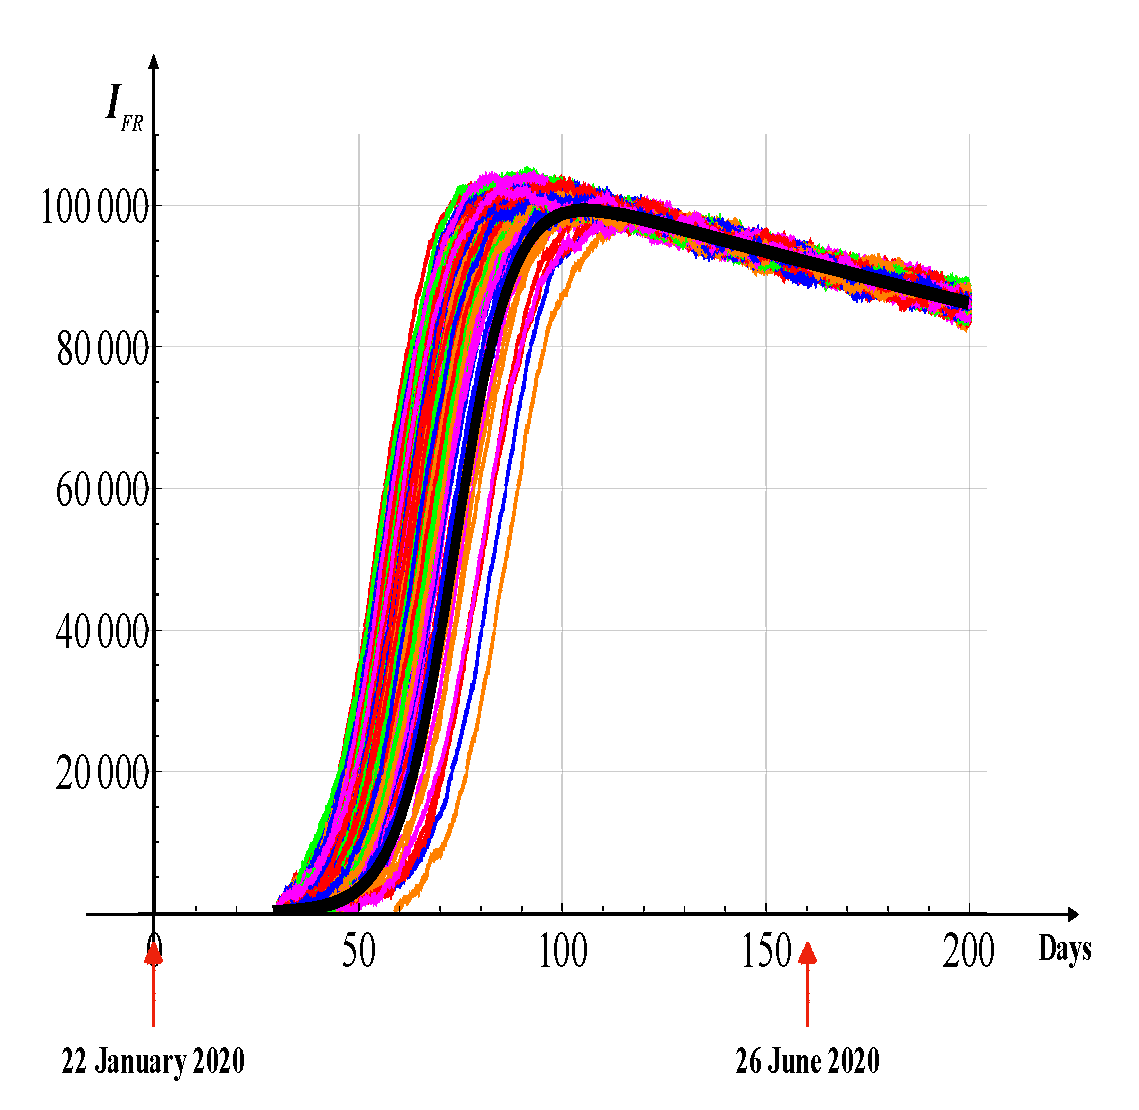
Figure 15.
Stochastic solutions (200 realizations) of the differential equation for the USA following three waves of infection.
Parameters are as reported in Figure 12, with a noise intensity of , derived from statistical mechanics. The black curve denotes the deterministic solution, providing a reference against which the variability induced by stochastic fluctuations can be observed.
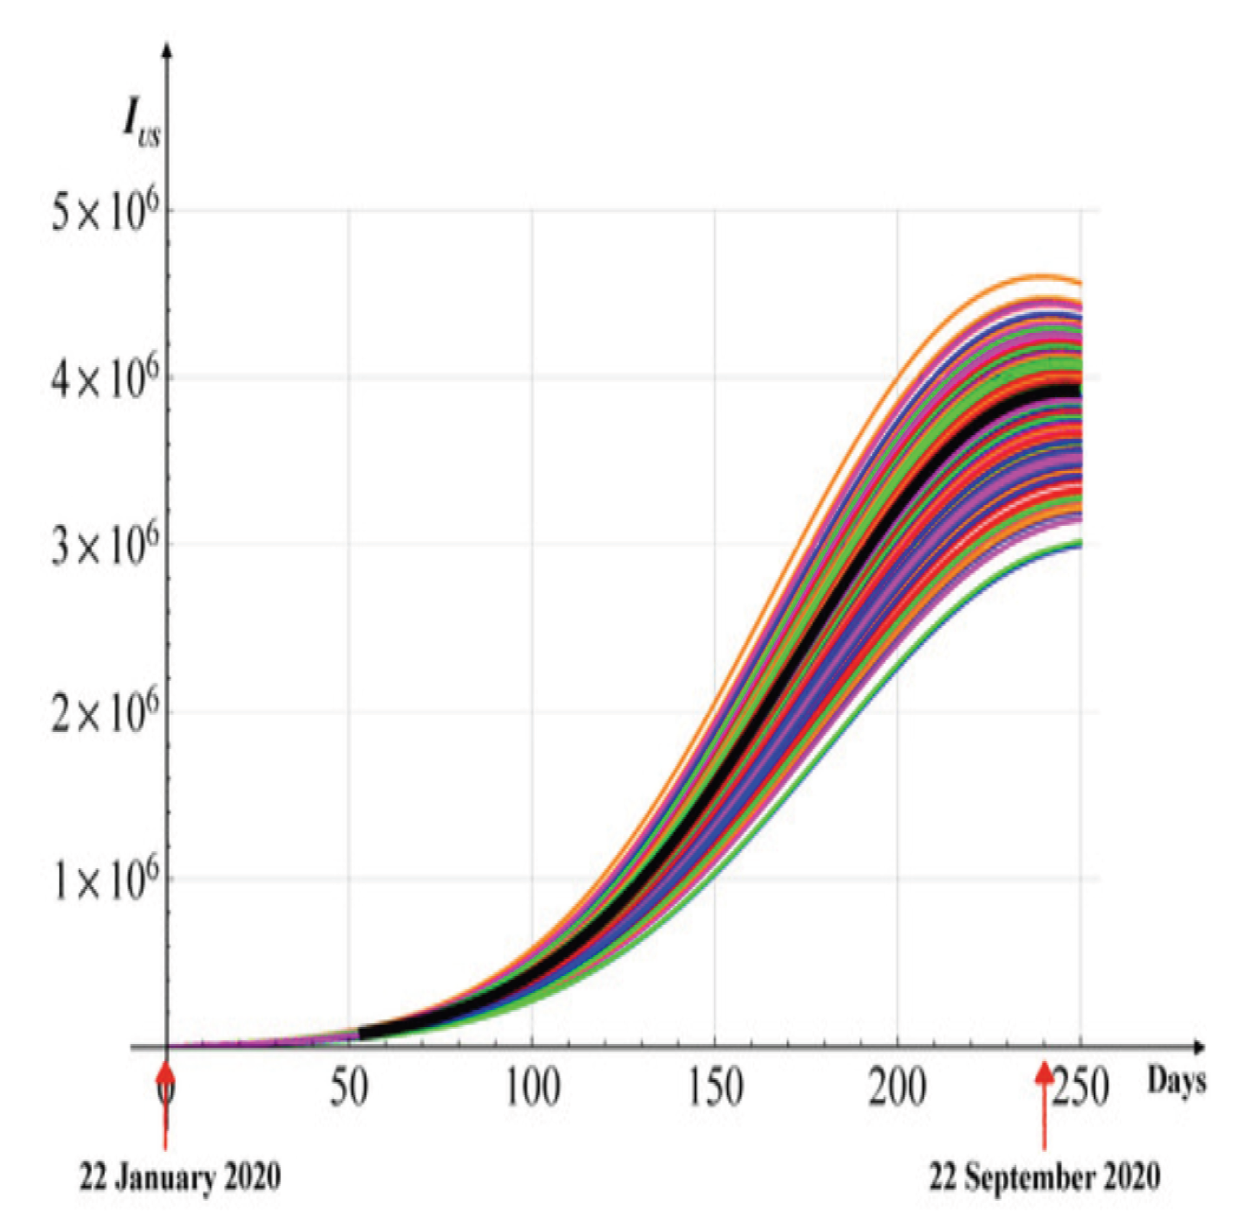

Table 1.
List of the Parameters.
 |
Disclaimer/Publisher’s Note: The statements, opinions and data contained in all publications are solely those of the individual author(s) and contributor(s) and not of MDPI and/or the editor(s). MDPI and/or the editor(s) disclaim responsibility for any injury to people or property resulting from any ideas, methods, instructions or products referred to in the content. |
© 2026 by the authors. Licensee MDPI, Basel, Switzerland. This article is an open access article distributed under the terms and conditions of the Creative Commons Attribution (CC BY) license.
Copyright: This open access article is published under a Creative Commons CC BY 4.0 license, which permit the free download, distribution, and reuse, provided that the author and preprint are cited in any reuse.


