Submitted:
23 February 2026
Posted:
25 February 2026
You are already at the latest version
Abstract
This paper translates a GIS-based multi-criteria evaluation (GIS–MCE) developed for the Food and Agriculture Organization (FAO) Hand-in-Hand Initiative (HiH), into a scien-tific manuscript on aquaculture zoning and site suitability in the Republic of Benin. We integrate sub-models on market accessibility, demand (population and asset wealth in-dex), biophysical conditions (water balance, soils, slope), and input availability (crop and livestock systems) to produce suitability indices for three fish farming systems: (i) ex-tensive to semi-intensive small-scale and integrated ponds; (ii) peri-urban intensive closed systems (tanks, ponds, RAS); and (iii) intensive open tilapia cages in waterbodies. A marked south–north gradient emerges, with southern and central communes showing highest suitability for non intensive systems. Priority communes include Bassila, Bantè, Ouessè, Savè, Kétou, Djidja, Agbangnizoun, Zangnanado, Ouinhi, Lalo, Bonou, and Ad-johoun. Intensive closed systems concentrate around Abomey-Calavi, Cotonou, and Porto-Novo due to superior market access. For open cage farming, southern permanent waterbodies—particularly Lakes Ahémé and Nokoué and selected reservoirs such as Zagnanando, Azili, and Ilauko—appear promising, though environmental risks (eu-trophication, pollution) warrant caution. We discuss methodological assumptions, data constraints, and limitations (e.g., absence of formal MCDA methods), and conclude with policy recommendations emphasizing environmental safeguards, support to traditional systems (e.g., whédo), improved feed and seed access, and strengthened biosecurity and monitoring frameworks for sustainable aquaculture expansion.
Keywords:
GIS–MCE
; aquaculture zoning
; Benin
; tilapia
; integrated aquaculture–agriculture
; site suitability
; accessibility
1. Introduction
Global demand for aquatic foods is rising even as capture fisheries face constraints from overfishing, climate variability, and environmental degradation, positioning aquaculture as a critical pathway to improve food security, nutrition, and livelihoods in low- and middle-income countries [1,2]. In Sub-Saharan Africa, aquaculture growth has outpaced the global average but still accounts for a modest share of supply, with production concentrated in a few countries and hindered by persistent bottlenecks in inputs, finance, and governance [3,4]. Within this context, spatially explicit, evidence-based planning is needed to guide public investment and de-risk private capital while aligning aquaculture development with social and environmental objectives.
Geographical Information Systems–Multicriteria Evaluation (GIS-MCE) provides a rigorous, transparent framework for integrating heterogeneous criteria and stakeholder preferences into reproducible suitability surfaces for land- and water-use planning [5,6,7,8,9]. Foundational continental analyses have shown how biophysical and market factors can be combined via sub-models and decision rules to identify promising aquaculture zones in Africa, offering a transferable template for national-scale assessments [10]. Yet, key debates persist: results are sensitive to data quality, criteria selection, and weights; different, defensible specifications can yield different priorities; and claims about environmental and social impacts are unevenly evidenced across contexts. In parallel, policy and investment narratives often privilege intensive commercial models (e.g., cages or recirculating systems) over smallholder, integrated systems that may deliver broader nutrition and poverty-reduction benefits but face structural barriers to inputs, finance, and services [11,12,13].
Benin exemplifies these challenges and opportunities. The fisheries and aquaculture sector contributes to GDP and agricultural employment, yet domestic supply remains insufficient and imports are rising amid stagnating capture production [14,15]. Despite growing policy support—particularly for cage culture in southern hydrographic systems—producers commonly report constraints including the cost and availability of quality fry and feed, limited access to credit, and weak cold-chain and electricity infrastructure [15,16]. At the same time, culturally embedded systems such as the seasonal Whédo ponds illustrate the potential of locally adapted practices to support diverse species and household income, yet it remains under-recognized in policy discourse [17,18,19].
Purpose and Significance
This study develops and applies a system-specific GIS-MCE framework to delineate aquaculture suitability in Benin across complementary development objectives. We (i) identify districts and departments where extensive to semi-intensive, small-scale integrated freshwater systems are most likely to contribute to poverty alleviation, improved nutrition, and food security; and (ii) locate high-return opportunity areas for intensive commercial closed (recirculating/flow-through/pond) and open cage fish farming systems. Building on established approaches, we update criteria, weights, and constraints to reflect current sector realities, spanning biophysical conditions (water balance and seasonality, soils, terrain, wind/temperature–yield), supply (crop by-products for feed; livestock densities), demand (population density, metropolitan markets, asset wealth), and infrastructure/accessibility via raster-based travel-time modelling [20,21]. For closed intensive systems, we additionally incorporate proximity to major roads, access to finance, and mobile broadband coverage as operational prerequisites.
Main aim and Principal Conclusions
Our aim is to generate transparent, reproducible, decision-ready suitability maps that distinguish where different fish farming systems are most likely to succeed under prevailing constraints. More broadly, results are sensitive to data quality, criteria selection, and weighting; alternative, defensible specifications can yield different spatial priorities [6,7,22,23]. A reflexive stance is warranted because data and modelling choices are not neutral [24,25]. Evidence on environmental and social impacts varies by system and context. Collectively, these contributions provide a structured basis for aquaculture zoning in Benin and a portable template for similar assessments across Sub-Saharan Africa [5,10].
2. Materials and Methods
Study Area and Scope
We mapped aquaculture suitability for Benin, with separate models for (i) small-scale extensive to semi-intensive pond and integrated systems, (ii) peri-urban intensive closed (semi-closed) systems (ponds, tanks, RAS, flow-through/recirculation), and (iii) intensive tilapia cage systems in open waterbodies. Analyses focused on African catfish and Nile tilapia and targeted both poverty-alleviating smallholder systems and high-ROI commercial operations.
Overall Modelling Framework
We adapted a raster-based multi-criteria evaluation (MCE) framework that integrates constraints (exclusive criteria), biophysical factors (water, soils, slope), inputs (crops, livestock), market access (population density, accessibility, asset wealth), and—where relevant—potential yield. We revised sub-models, criteria, weights, and constraints to reflect current data availability, contemporary production systems, and higher-resolution disaggregation.
Data and Sources
We compiled, harmonized, and processed all layers in a single projected, meter-based CRS. Each dataset was clipped to Benin’s national boundary prior to analysis. Publicly accessible datasets include:
- Legacy FAO aquaculture layers (soil suitability and potential yields).
- WaPOR v4 (2018–2023) precipitation (PCP) and reference evapotranspiration (RET).
- JRC Global Surface Water (Seasonality & Extent, 1984–2021).
- IFPRI MAPSPAM 2017 (Global Spatially-Disaggregated Crop Production Statistics).
- GLW4—Gridded Livestock of the World (goats, sheep, pigs, cattle, chickens, ducks).
- OpenStreetMap (OSM) roads/railways/places/POIs (Geofabrik Africa extracts).
Restricted-access datasets include: AtlasAI (population density and Asset Wealth Index) and GSMA Collins Bartholomew Mobile Coverage Explorer (broadband cellular coverage). Access requires institutional or commercial agreements; redistribution is restricted.
Pre-processing and Database Construction
All vector layers were selected/edited by location and attribute and stored in a country-level GeoPackage. OSM features were filtered into function-specific layers using the fclass attribute, including major_roads (primary, primary_link, trunk, trunk_link), secondary_roads (secondary), tertiary_roads (tertiary), local_roads (residential, unclassified), tracks (track, service, track_grade3/4/5), and walk (pedestrian, footway, path, living_street, steps). Railways were selected by location; bank agencies were extracted from OSM POIs where fclass = bank. Urban places were selected from OSM places with fclass in {city, town, national_capital}.
All transportation network and hydrographic vectors, plus land and water surfaces, were rasterized to a common grid for cost-distance modelling. All criteria rasters were min–max normalized to [0,100]; unless stated otherwise, 0 indicates least suitable (or highest travel cost) and 100 indicates most suitable (or lowest cost).
Accessibility Modelling (Travel Time/Cost Surfaces)
Assumptions: (i) Major urban areas are contiguous ≥25 km² with population density >1,500 persons/km², to which accessibility is computed; (ii) water surfaces are polygonal; (iii) transport networks are linear; (iv) road network conditions are poor; (v) lakes/rivers are treated as navigable surfaces (small–medium cargo craft) without explicit port infrastructure. Navigable waterways derive from OSM water/waterway layers.
Assumed speeds for the multimodal cost surface are listed in Table 1.
We overlaid all mode-specific grids to create a friction surface by propagating the minimum cell time (i.e., maximum effective speed). Cumulative cost-distance (minutes) to major urban places (Bohicon, Cotonou, Porto-Novo, Parakou) was computed and then min–max scaled to [0,100].
Market/Demand Sub-Model — Population-Weighted AWI Accessibility
This subsection refines the weighted-accessibility-to-urban-areas method by explicitly defining the population–wealth weighting, and implementation details for multi-city accumulation and normalization. It is consistent with the GIS–MCE framework applied across agrifood systems and with the accessibility sub-model built from raster-based cost surfaces.
Data Inputs
- Urban polygons: delineated from population density > 1,500 persons·km⁻² and contiguous area ≥ 25 km² (thresholds may be tuned to country and value-chain context). Urban places (targets) are OSM places with fclass ∈ {city, town, national_capital} intersecting urban polygons.
- Population: AtlasAI population density raster aggregated by urban polygons using zonal statistics (sum of people per polygon).
- Asset Wealth Index (AWI): AtlasAI AWI raster summarized by urban polygons (mean), then normalized to positive values prior to weighting.
- Accessibility rasters: cumulative travel time/cost surfaces computed to each target urban place using the multimodal friction surface (roads, rail, waterways, land/walk; speeds as per Table 1 of Methods).
Method Steps
- 1)
- Zonal statistics — population totals: For each urban polygon i, compute POP_i = Σ(population raster) within i.
- 2)
- AWI normalization: Compute AWI_i from zonal mean and rescale to AWI_i⁺ ∈ [0,1] (strictly positive). If AWI contains negatives/zeros, apply a shift to ensure positivity before min–max scaling.
- 3)
- Market share weights: Define market pull weights as
w_i = (POP_i × AWI_i⁺) / Σ_j (POP_j × AWI_j⁺).
- 4)
- Per-city accessibility: Build per-target accessibility rasters A_i(x) (scaled to [0,100], where higher is better).
- 5)
- Composite demand surface: Combine per-city rasters with weights using a weighted sum D(x) = Σ_i [ w_i × A_i(x) ].
- 6)
- Standardization: If needed, re-normalize D(x) to [0,100] to integrate with other criteria in the MCDA.
Optional Variants and Extensions
- Regional demand and trade: Augment targets with cross-border regional capitals; compute weights as above and include their per-city accessibility rasters to capture export or import-substitution strategies.
- Port accessibility: For tradable commodities/systems sensitive to import/export logistics, include maritime ports as additional targets with their own accessibility rasters and, if desired, weights based on throughput proxies.
- Threshold tuning: Adjust the 1,500 persons·km⁻² and ≥25 km² thresholds to reflect national urban hierarchy and the scale of the production/processing system.
- Sensitivity analysis: Evaluate robustness by perturbing thresholds and re-weighting AWI vs. population to inspect the effect on D(x) percentiles and short lists of priority sites.
Implementation Notes (QGIS/GRASS/GDAL)
- Perform zonal statistics (population sum; AWI mean) on the urban polygons; compute weights externally (field calculator) or via attribute joins.
- Generate A_i(x) per target using cumulative cost-distance on the multimodal friction surface; rescale to [0,100].
- Create D(x) by stacking A_i(x) and applying the weights with GRASS r.series (weighted sum) or raster calculator.
- Document the exact list of targets used (city names/IDs) and the final weights w_i to ensure reproducibility.
Edge Cases and Data Quality
- Where multiple contiguous urban polygons represent a single metropolitan area, dissolve prior to zonal statistics to avoid double counting.
- If AWI variance is small within urban polygons, consider smoothing or quantile normalization prior to weighting.
- For cities with limited or no road/rail connectivity (isolation), ensure water/land walking modes are present so A_i(x) is defined nationwide.
Biophysical Sub-Models
Water
We modelled water via annual water balance and surface water persistence. Water balance used WaPOR v4 PCP and RET (2018–2023): clip → r.series mean → resample to common grid → (PCP × 1.1) − (RET × 1.3) → scale to [0,100]. GSW Seasonality = 12 polygons represented permanent water (criterion for cage farming), and GSW Extent polygons defined flood-prone masks for non-intensive ponds.
Soils and Terrain (Pond Construction)
FAO soil suitability variables (acid sulfate, organics, lime requirement, clay, water-table depth, salinity/alkalinity, gypsum, soil depth) were clipped and scaled to [0,100]. Slope (degrees) from a 30″ DEM was masked to <8° and inverse-normalized so that 0 = 8° (unsuitable) and 100 = 0° (flat/optimal). Soils and slope were combined for ponds as SoilSlope = (1.5 × norm_soils + SlopeSuit) / 2.5. Intensive closed systems use slope separately.
Input Sub-Models
Crops
Aggregate crop production (MAPSPAM 2017) was clipped to Benin and scaled to [0,100]; it proxies local availability of feed ingredients and crop by-products.
Livestock
Two inputs were built: (1) non-intensive/integrated systems—chicken + duck densities aggregated (sum) and scaled to [0,100]; (2) intensive systems—weighted sum by average live weight: 0.089×goat + 0.089×sheep + 0.626×cattle + 0.188×pig + 0.007×(chicken + duck), then scaled to [0,100].
Suitability Modelling and Constraints
(A) Small-Scale Extensive to Semi-Intensive & Integrated Ponds
Assumption: water availability is generally adequate; therefore, water is down-weighted relative to market-proximal factors. Criteria (all scaled to [0,100]): WaterBalance; SoilSlope; By-products (1.5×ChickenDuck + CropAgg); FarmGateSales.
Suitability index: 0.50×WaterBalance + 0.25×SoilSlope + 0.125×ByProducts + 0.125×FarmGateSales. Commune-level zonal statistics yielded mean suitability and a priority index defined as (normalized, population-weighted mean AWI − mean suitability) to emphasize low-wealth/high-suitability areas.
(B) Peri-Urban Intensive Closed (Semi-Closed) Systems
Rationale and assumptions: closed systems (ponds/tanks/RAS/flow-through) are less constrained by soils and climate, require limited water through reuse/recirculation, and are primarily market-driven. Criteria: WeightedAccessibility(Major Urban Areas), WaterBalance, Crops, Livestock, Slope.
Index formula: 0.50×WeightedAccessibility + 0.20×WaterBalance + 0.10×Crops + 0.10×Livestock + 0.10×Slope. Constraints: exclude dense urban areas (>1,500 persons·km⁻² and >25 km²), permanent waters, and flood-prone areas. Exclusive siting rules: within 2 km of major roads, within 20 km of bank agencies, and with mobile broadband coverage. Final selection: retain pixels in the top 70th percentile (dense urban cores excluded).
(C) Intensive Open Tilapia Cages in Waterbodies
Criteria: presence of permanent waterbodies (Seasonality = 12), WeightedAccessibility(Major Urban Areas), Crops, and Livestock; potential yield (temperature) was non-differentiating and omitted. Suitability: 0.50×WeightedAccessibility + 0.25×Crops + 0.25×Livestock.
Constraints & site selection: buffer permanent water polygons by 2 km, clip suitability by this mask, compute per-polygon maximum suitability (zonal statistics), and display/select ≥70th percentile values to indicate priority waterbodies. Contextual environmental constraints (eutrophication/pollution) should be assessed at feasibility stage.

Table 2.
summarizes criterion weights by production system.
| System | Criterion | Weight |
|---|---|---|
| Extensive/semi-intensive & integrated ponds | WaterBalance | 0.50 |
| SoilSlope | 0.25 | |
| ByProducts | 0.125 | |
| FarmGateSales | 0.125 | |
| Intensive closed (semi-closed) | WeightedAccessibility | 0.50 |
| WaterBalance | 0.20 | |
| Crops | 0.10 | |
| Livestock | 0.10 | |
| Slope | 0.10 | |
| Open tilapia cages | WeightedAccessibility | 0.50 |
| Crops | 0.25 | |
| Livestock | 0.25 |
Key thresholds and buffers used in the analysis are summarized in Table 3.
Software, Parameters, and Reproducibility: All geospatial processing, sub-model construction, and suitability/index calculations were executed through a reproducible, script-based workflow developed in the QGIS Python Console and the integrated code editor. The scripts orchestrate data ingestion (when feasible), preprocessing (clipping, reprojection, resampling, rasterization), normalization, application of constraints/masks, and weighted combinations used to generate the suitability indices and zonal statistics.
QGIS 3.40.12 (“Bratislava”) served as the primary execution environment. The QGIS Processing framework was used both to run core algorithms and to accelerate script development by capturing model steps via the Processing History/log, which was then translated into Python workflows and complemented with additional Python packages. Raster operations relied on GDAL 3.11.5 (“Eganville”) (e.g., slope derivation), and GRASS GIS 8.4.1 was invoked via the QGIS GRASS provider for selected raster analyses (e.g., r.series).
Where applicable, source layers were acquired programmatically (including automated extraction of WaPOR layers via web/API-based download mechanisms) and then harmonized into a single projected, meter-based CRS. Vector-to-raster conversion and raster processing were performed on a common grid (cell size: 1 km) to ensure alignment. Continuous criteria were normalized to [0,100] after clipping to national boundaries. Thresholds, buffers, and exclusion masks (urban extent, flood-prone areas, permanent water, slope limits) followed the values reported in Table 1, Table 2 and Table 3.
Final cartographic products (map layouts and figure exports) were produced manually in QGIS Layout Manager from the scripted outputs to ensure consistent symbology, labeling, and publication-quality formatting.
Environment summary: QGIS: 3.40.12 “Bratislava”; GDAL / osgeo: 3.11.5 “Eganville”; Key Python packages: numpy 1.26.4, rasterio 1.4.3, fiona 1.10.1, shapely 2.0.6, requests 2.32.4, PyQt5 5.15.11, bs4 4.12.3.
Code, Data, and Materials Availability: Processing code/scripts are not publicly available due to organizational intellectual property policies. The analysis was implemented as a set of QGIS/Python scripts (Python Console + code editor) that automate data ingestion (including programmatic downloads for selected layers), preprocessing, sub-model generation, and suitability/index calculations using QGIS Processing, GDAL and GRASS providers. To facilitate replication, we provide complete algorithmic descriptions, parameter values, thresholds, weights, data sources, and step-by-step workflows in this section and Table 1, Table 2 and Table 3. Derived outputs (suitability rasters, zoning layers, and administrative-unit summary tables) are publicly available via the FAO AgroInformatics Platform and the FAO Data Catalogue under CC BY 4.0 unless otherwise indicated in the dataset metadata (see Data Availability Statement).
Ethical Approval: This study involves no human or animal interventions and did not require ethics approval.
Use of Generative AI: Use of Generative AI: Microsoft Copilot (M365 Copilot) was used to improve clarity and consistency of the manuscript, including restructuring and standardizing pre-existing technical reports into a journal-compliant Materials and Methods section, and to support scripting, troubleshooting, and debugging during development of the QGIS/Python processing workflow. No new analyses, datasets, or figures were generated by AI; all scientific content (datasets, parameters, workflows, weights, and formulas) originates from the author and cited sources. The author reviewed, validated, and edited all AI-assisted outputs and takes full responsibility for the final content.
3. Results
This section reports the spatial suitability outputs and priority areas for three aquaculture system types—(i) extensive/semi-intensive (including integrated systems), (ii) peri-urban intensive closed (semi-closed) systems, and (iii) open intensive tilapia cage systems—followed by concise interpretations and actionable conclusions for site selection.
3.1. Extensive/Semi-Intensive Systems
3.1.1. Suitability Index
The suitability index exhibits a clear north–south gradient. Most of the southern regions are highly suitable, whereas the extreme north and northwest tend to be less suitable; only a few southern areas fall into mid-range suitability. Commune-level averages confirm broad national suitability with exceptions in a handful of communes in the far north and northwest (see Figure 1, Figure 2 and Figure 3).
At the Commune level, the average suitability index also indicates that most of the country is suitable to very suitable, except for a few Communes in the extreme north and northwest, where the mean suitability index falls within the mid-range.
Communes with the highest average suitability include:
- Zou Province: Agbangnizoun, Abomey, Bohicon, Za-Kpota
- Atlantique: Zé, Allada, Tori-Bossito, Kpomassè
- Ouémé: Adjohoun
- Plateau: Sakété
In the central region, most areas fall in the 68.5–74 class, notably Collines and Donga provinces and Tchaourou (southern Borgou).
3.1.2. Priority Mapping for Interventions
A Commune Priority Index (difference between normalized AWI and mean suitability) highlights where high suitability coincides with lower wealth indicators. Higher values indicate Communes where interventions have greater potential impact on poverty reduction, food security, and malnutrition.
Highest-priority communes (central/southern):
- Donga: Bassila
- Collines: Bantè, Ouessè, Savè
- Plateau: Kétou
- Zou: Djidja, Agbangnizoun, Zangnanado/Ouinhi
- Couffo: Lalo
- Ouémé: Bonou, Adjohoun
Lowest-priority communes (urbanized/higher wealth):
- Parakou (Borgou); Abomey and Bohicon (Zou); Ouidah and Abomey-Calavi (Atlantique); Sèmè-Podji, Porto-Novo, Adjarra, Avrankou, Akpro-Missérété (Ouémé); and some far northern/northwestern communes such as Malanville (Alibori) and Tanguiéta (Atacora).
3.2. Peri-Urban Intensive Closed (Semi-Closed) Systems
3.2.1. Suitability Index
For intensive closed systems (ponds, tanks, RAS, flow-through), market accessibility is the dominant factor (50% weight). High suitability clusters around major urban centres with stronger purchasing power and better infrastructure; the southern corridor concentrates the top index values (see Figure 4).
3.2.2. Recommended Locations
Applying exclusive criteria (road and banking proximity, ICT coverage) and constraints (flood-prone and dense urban areas) yields peri-urban belts as the best candidates. The Abomey-Calavi–Cotonou–Porto-Novo metropolitan region shows the most consistent concentration of suitable sites (see Figure 5). Site-level screening remains essential to avoid local conflicts and overly dense settings.
3.3. Open Intensive Tilapia Cage Systems
3.3.1. Suitability Index
Cage-system suitability is driven primarily by demand/access to markets, with highest values north of the Abomey-Calavi–Cotonou–Porto-Novo axis and along the corridor toward Aplahoué–Bohicon (see Figure 6). Central and northern provinces are generally limited by market access; Parakou is a notable exception.
3.3.2. Recommended Locations and Constraints
Final mapping (2 km buffer of permanent water; top 70th percentile of suitability) identifies southern lakes—particularly Ahémé and Nokoué—as potential sites; Lake Nokoué requires brackish-water considerations. Additional opportunities include Zagnanado and Azili Lakes and the Ilauko Reservoir (see Figure 7, Figure 8 and Figure 9). However, anthropogenic pressures (eutrophication, pollution, fecal contamination) reported for key waterbodies necessitate rigorous water-quality due diligence before deployment.
3.4. Key Takeaways (All Systems)
- Demand proximity matters most for intensive systems; peri-urban southern corridors are consistently favored.
- Extensive/semi-intensive opportunities are widely distributed, with central–southern areas offering the strongest cluster of high suitability.
- Open cage systems show promise in major southern lakes, contingent on environmental safeguards and brackish-water accommodation where relevant.
4. Discussion
This study mapped suitability and priority areas for three fish farming systems types across the Republic of Benin and examined how the resulting patterns can be interpreted considering our working assumptions and prior evidence. For extensive/semi-intensive systems, the north–south gradient—with broader suitability in the south and central belt and lower suitability toward the extreme north/northwest—reflects the dependence of small-scale operations on natural and geographic factors (water balance, soils/slope) and locally accessible inputs from crops and livestock by-products. The priority index further indicates where high suitability coincides with lower wealth indicators, suggesting where interventions may yield outsized benefits in terms of poverty reduction, food security, and nutrition.
For peri-urban intensive closed systems (ponds, tanks, flow-through and RAS), the dominance of market accessibility in the suitability index underscores the commercial nature of these systems: where infrastructure, services and purchasing power concentrate, so do viable peri-urban sites. At the same time, operational reliability hinges on energy access; the growing use of solar/PV to power pumps, aeration and recirculation partially mitigates grid limitations but requires up-front capital and technical capacity [26,27].
Open tilapia cage systems show highest potential around major southern lakes (e.g., Ahémé and Nokoué) and peri-urban corridors with strong demand. However, environmental exchanges inherent to open cages—waste discharge, pathogen transfer, fish escape—require proactive safeguards, especially in waterbodies already affected by eutrophication and pollution. Prior studies in Lake Nokoué and the Lower Ouémé Valley document organic and bacteriological contamination (e.g., total and thermotolerant coliforms, E. coli) linked to wastewater, runoff and household activities [28,29]. In Lake Nokoué, brackish conditions also necessitate appropriate strain/management choices and post-harvest handling adapted to the cold-chain constraints of tilapia distribution [30,31].
Methodologically, the results validate a pragmatic, multi-criteria approach using normalized grids and explicit constraints/eligibility masks. For permanent water masks, the Global Surface Water seasonality layer (seasonality = 12) is an appropriate source; demand-side accessibility can be complemented by mobile broadband coverage as a proxy for ICT access [32,33,34].
Policy and investment implications follow from these patterns. For extensive/semi-intensive systems, extension services and micro-finance should target the central–southern cluster and the high-priority communes identified by the index. For intensive closed systems, peri-urban belts around Abomey-Calavi–Cotonou–Porto-Novo merit enterprise development support that couples market access with reliable energy solutions (including PV) and business services. For open cages, any promotion around Ahémé, Nokoué, Zagnanado/Azili and Ilauko must be conditional on water-quality baselines, continuous monitoring, stakeholder consultation, and enforceable rules that minimize conflicts with other users and protect aquatic ecosystems [28,29].
Future research should (i) integrate seasonal hydrology and groundwater into the water balance; (ii) assess climate-sensitive risks (flood, temperature extremes) and their interaction with energy reliability for closed systems; (iii) compile high-resolution market and logistics layers (e.g., ice plants, cold rooms, feeder roads) to refine demand accessibility; (iv) evaluate brackish tilapia production options for Nokoué under different salinity regimes; and (v) perform participatory ground-truthing to calibrate thresholds and to quantify economic viability under realistic input/output price scenarios [26,30].
5. Conclusions
- Extensive/semi-intensive systems suitability is widely distributed but strongest across the central–southern belt; prioritizing communes where high suitability overlaps lower wealth can amplify impacts on poverty, food security and nutrition.
- Across systems, near-term priorities are site-specific ground-truthing, environmental due diligence, and producer-centred extension; medium-term priorities include building market/logistics data layers and integrating seasonal/climate risks into the suitability framework. [36]
Funding
Funding: This work was carried out as part of the author’s official duties at the Food and Agriculture Organization of the United Nations (FAO) and received no external funding.
Data Availability Statement
Data Availability Statement: All FAO-hosted input datasets used in this study, as well as the study outputs (derived suitability rasters, final location zoning layers, and administrative-unit summary tables), are available via the FAO AgroInformatics Platform and the FAO Data Catalogue and are released under the Creative Commons Attribution 4.0 International (CC BY 4.0) license, unless otherwise stated in the dataset metadata. OpenStreetMap (OSM) vector layers (e.g., roads, railways, places and points of interest) were sourced from Geofabrik OpenStreetMap extracts for Africa. Surface-water persistence and extent layers are available from the JRC Global Surface Water Explorer. Restricted-access inputs (AtlasAI population density and Asset Wealth Index; GSMA/Collins Bartholomew Mobile Coverage Explorer) are subject to third-party licensing and cannot be redistributed; access must be requested directly from the respective providers.
Acknowledgments
The author thanks Maximo Torero and Panagiotis Karfakis (FAO) for early guidance; Zhongxin Chen and Karl Morteo (FAO CSI) for supervisory support; John S. Latham and Chris Hill (University of Southampton) for early review (2022); Marc Taconet (FAO NFI) for early contributions; and colleagues in FAO CSI’s AgroInformatics Team for support.
Conflicts of Interest
The author declares no competing interests. The author is a consultant working with FAO. The views expressed in this article are those of the author and do not necessarily represent the views or policies of FAO.
Role of the Funder/Sponsor
FAO provided institutional support (staff time and technical infrastructure) consistent with its mandate. FAO had no role in the decision to publish. The analyses, interpretation, and manuscript preparation were conducted by the author, who take full responsibility for the content.
Abbreviations
The following abbreviations are used in this manuscript:
| Abbreviation | Definition |
| AI | Artificial intelligence |
| AWI | Asset Wealth Index |
| COVID-19 | Coronavirus disease 2019 |
| CRS | Coordinate reference system |
| CSI | Digital FAO and Agro-Informatics Division (FAO) |
| DEM | Digital elevation model |
| ESA | Economic and Social Development Stream (FAO) |
| FAO | Food and Agriculture Organization of the United Nations |
| GDAL | Geospatial Data Abstraction Library |
| GDP | Gross domestic product |
| GIS | Geographic information system |
| GLW4 | Gridded Livestock of the World, version 4 |
| GRASS | Geographic Resources Analysis Support System |
| GSMA | GSM Association |
| GSW | Global Surface Water |
| ICT | Information and communication technology |
| IFPRI | International Food Policy Research Institute |
| JRC | Joint Research Centre (European Commission) |
| MAPSPAM | MapSPAM—Global Spatially-Disaggregated Crop Production Statistics |
| MCDA | Multi-criteria decision analysis |
| MCE | Multi-criteria evaluation |
| MDPI | Multidisciplinary Digital Publishing Institute |
| NFI | Fisheries and Aquaculture Division (FAO) |
| NSA | Animal Production and Health Division (FAO) |
| OSM | OpenStreetMap |
| PCP | Precipitation |
| POI | Point of interest |
| PV | Photovoltaic |
| QGIS | QGIS Geographic Information System |
| RAS | Recirculating aquaculture system |
| RET | Reference evapotranspiration |
| ROI | Return on investment |
| WaPOR | FAO Water Productivity through Open access of Remotely sensed derived data |
References
- OECD and FAO, “OECD-FAO Agricultural Outlook 2021-2030 - 8 Fish,” in OECD-FAO Agricultural Outlook. , Rome: OECD, 2021, pp. 190–201. [CrossRef]
- b Mapfumo, “Regional review on status and trends in aquaculture developement in sub-Saharan Africa - 2020,” 2022, Rome. [CrossRef]
- A. Menezes, C. Ligeon, P. Murekezi, and C. M. Jolly, “Diagnosis of aquaculture employment governance in selected African countries,” 2024, Food and Agriculture Organization of the United Nations, Rome.
- B. P. Satia, “Regional review on status and trends in aquaculture development in sub-Saharan Africa,” Rome, 2017.
- J. C. AscoughII et al., “Multicriteria Spatial Decision Support Systems: Overview, Applications, and Future Research Directions,” Systems Research, vol. 3, no. 3, pp. 175–180, Jan. 2002. [CrossRef]
- S. Boroushaki and J. Malczewski, “Measuring consensus for collaborative decision-making: A GIS-based approach,” Comput. Environ. Urban Syst., vol. 34, no. 4, pp. 322–332, 2010. [CrossRef]
- J. Malczewski, “GIS-based multicriteria decision analysis: A survey of the literature,” International Journal of Geographical Information Science, vol. 20, no. 7, pp. 703–726, 2006. [CrossRef]
- N. Ribeiro, “Geospatial analysis for decision support, suitability assessment for value chain infrastructure interventions,” in 202412th International Conference on Agro-Geoinformatics, IEEE, Ed., Novi Sad: Institute of Electrical and Electronics Engineers (IEEE), Sep. 2024, pp. 1–6. [CrossRef]
- N. R. R. Filho, “Decision Support Geospatial Analysis: Multi-Criteria Evaluation Suitability Assessments for Agrifood Systems Interventions,” in Technologies and Innovations in Agriculture, G. Gebresenbet and T. Bosona, Eds., London: IntechOpen, 2025, ch. 2. [CrossRef]
- J. Aguilar-Manjarrez and S. S. Narh, A strategic reassessment of fish farming potential in Africa, vol. 32. Rome: Food and Agriculture Organization of the United Nations, 1998. [Online]. Available: http://www.fao.org/docrep/w8522e/W8522E00.htm.
- A. Avadí, S. M. Cole, F. Kruijssen, M. H. Dabat, and C. M. Mungule, “How to enhance the sustainability and inclusiveness of smallholder aquaculture production systems in Zambia?,” Aquaculture, vol. 547, Jan. 2022. [CrossRef]
- Fao, “World Aquaculture Society-European Aquaculture Society’s International Conference AQUA 2018 - SPECIAL SESSION ON ADVANCING INTEGRATED AGRICULTURE-AQUACULTURE THROUGH AGROECOLOGY,” L. Dabbadie, A. Stankus, X. Yuan, and M. Halwart, Eds., Montpellier: Food and Agriculture Organization of the United Nations, Aug. 2018.
- A. M. Kaminski et al., “Smallholder aquaculture diversifies livelihoods and diets thus improving food security status: evidence from northern Zambia,” Agric. Food Secur., vol. 13, no. 1, Dec. 2024. [CrossRef]
- V. Codjo et al., “Socio-economic analysis of the contribution of fishermen to the implementation of fish farming in floating cages on Lake Toho in Southern-Bénin,” Bulletin de la Recherche Agronomique du Bénin (BRAB), vol. 33, no. 2, pp. 76–84, Mar. 2023, [Online]. Available: http://www.inrab.org.
- A. Nougbognon Tossou, B. Koessi Lié Zokpodo, and N. Melody Dahou, “Analysis of Factors Influencing the Use of Extruder for Fish Feed Manufacturing in Benin,” Journal of Agronomy, Technology and Engineering Management (JATEM), vol. 8, no. 1, pp. 1394–1404, Feb. 2025. [CrossRef]
- A. Y. Mélisse, B. L. Nadine, A. Youssoufou, G. Moussa, F. Bernard, and S. Koudzo, “Enjeux et contraintes du développement de la pisciculture dans la Commune de Ouidah au Bénin,” Revue Internationale de la Recherche Scientifique (Revue-IRS), vol. 3, no. 1, pp. 224–237, Jan. 2025. [CrossRef]
- M. Dagoudo et al., “Traditional Fish Hole Aquaculture System in Benin: Status, Challenges, and Research Prospects for Sustainable Development in Climate Change Mitigation,” Sustainability 2024, Vol. 16, Page 10499, vol. 16, no. 23, p. 10499, Nov. 2024. [CrossRef]
- I. Toko, E. D. Fiogbe, B. Koukpode, and P. Kestemont, “Rearing of African catfish (Clarias gariepinus) and vundu catfish (Heterobranchus longifilis) in traditional fish ponds (whedos): Effect of stocking density on growth, production and body composition,” Aquaculture, vol. 262, no. 1, pp. 65–72, Feb. 2007. [CrossRef]
- I. Toko, S. Bachabi, A. Houndji, E. Fiogbe, and P. Kestemont, “Water quality and productivity of the traditional aquaculture system (whedos) in Oueme delta (Benin),” Int. J. Biol. Chem. Sci., vol. 7, no. 3, p. 1298, Oct. 2013. [CrossRef]
- T. Mulrooney, K. Beratan, C. McGinn, and B. Branch, “A comparison of raster-based travel time surfaces against vector-based network calculations as applied in the study of rural food deserts,” Applied Geography, vol. 78, pp. 12–21, 2017. [CrossRef]
- D. J. Weiss et al., “A global map of travel time to cities to assess inequalities in accessibility in 2015,” Nature, vol. 553, pp. 333–336, Jan. 2018.
- J. Malczewski and C. Rinner, Multicriteria Decision Analysis in Geographic Information Science. in Advances in Geographic Information Science. Berlin, Heidelberg: Springer, 2015. [CrossRef]
- D. Geneletti, Multicriteria Analysis for Environmental Decision-Making. London: Anthem Press, 2019.
- R. Kitchin, “Big Data, new epistemologies and paradigm shifts,” Big Data Soc., vol. 1, no. 1, p. 205395171452848, 2014. [CrossRef]
- R. Kitchin, The Data Revolution: BIG data, open data, data infrastructures & their consequences. London: SAGE, 2014.
- M. Badiola, D. Mendiola, and J. Bostock, “Recirculating Aquaculture Systems (RAS) analysis: main issues on management and future challenges,” Aquac. Eng., vol. 51, pp. 26–35, 2012. [CrossRef]
- C. I. M. Martins et al., “New developments in recirculating aquaculture systems in Europe: a perspective on environmental sustainability,” Aquac. Eng., vol. 43, no. 3, pp. 83–93, 2010. [CrossRef]
- F. Dovonou, M. Aina, M. Boukari, and A. Alassane, “Pollution physico-chimique et bactériologique d’un écosystème aquatique et ses risques écotoxicologiques: Cas du lac Nokoue au Sud Benin,” Int. J. Biol. Chem. Sci., vol. 5, no. 4, May 2012. [CrossRef]
- A. Adjagodo, M. Tchibozo, Djikpo Agassounon, N.C. Kelomè, E.W. Vissin, and E. Agbossou, “Pollution Physique Et Bactériologique De L’eau Du Fleuve Dans La Basse Vallée De L’ouémé Pendant Les Périodes De Basses Et Hautes Eaux Au Bénin,” European Scientific Journal, ESJ, vol. 13, no. 33, p. 167, Nov. 2017. [CrossRef]
- O. V. Okpeitcha et al., “Modeling seasonal salinity variations in a large West African lagoon (Nokoue, Benin): major drivers and mechanisms,” Reg. Stud. Mar. Sci., vol. 69, p. 103330, 2024. [CrossRef]
- A. S. Mcginty and J. E. Rakocy, “Cage Culture Of Tilapia.” Accessed: Aug. 16, 2023. [Online]. Available: https://freshwater-aquaculture.extension.org/wp-content/uploads/2019/08/Cage_culture_of_Tilapia.pdf.
- J. F. Pekel, A. Cottam, N. Gorelick, and A. S. Belward, “High-resolution mapping of global surface water and its long-term changes,” Nature, vol. 540, no. 7633, pp. 418–422, Dec. 2016. [CrossRef]
- GSMA Intelligence, “Mobile Connectivity Index (country data and indicators),” 2025. [Online]. Available: https://www.mobileconnectivityindex.com/.
- GSMA and ARCEP Benin, “Benin: 94 percent mobile internet coverage, but usage gap remains,” 2025. [Online]. Available: https://www.agenceecofin.com/actualites/1702-125864-benin-94-de-couverture-internet-mobile-mais-un-usage-reel-qui-peut-progresser-gsma.
- P. Agbohessi et al., “Changes in blood tissue of estuarine tilapia Sarotherodon melanotheron captured in polluted Lake Nokoue (Benin, West Africa),” Research Journal of Animal, Veterinary and Fishery Sciences, vol. 11, no. 1, pp. 1–13, 2023, [Online]. Available: https://www.isca.me/AVFS/Archive/v11/i1/1.ISCA-RJAVFS-2022-002.pdf.
- FAO Fisheries and A. Division, “FAO Fisheries and Aquaculture Statistical Query Panel,” 2025. [Online]. Available: https://www.fao.org/fishery/statistics-query/en/home.
Figure 1.
Non-intensive and integrated systems suitability index.
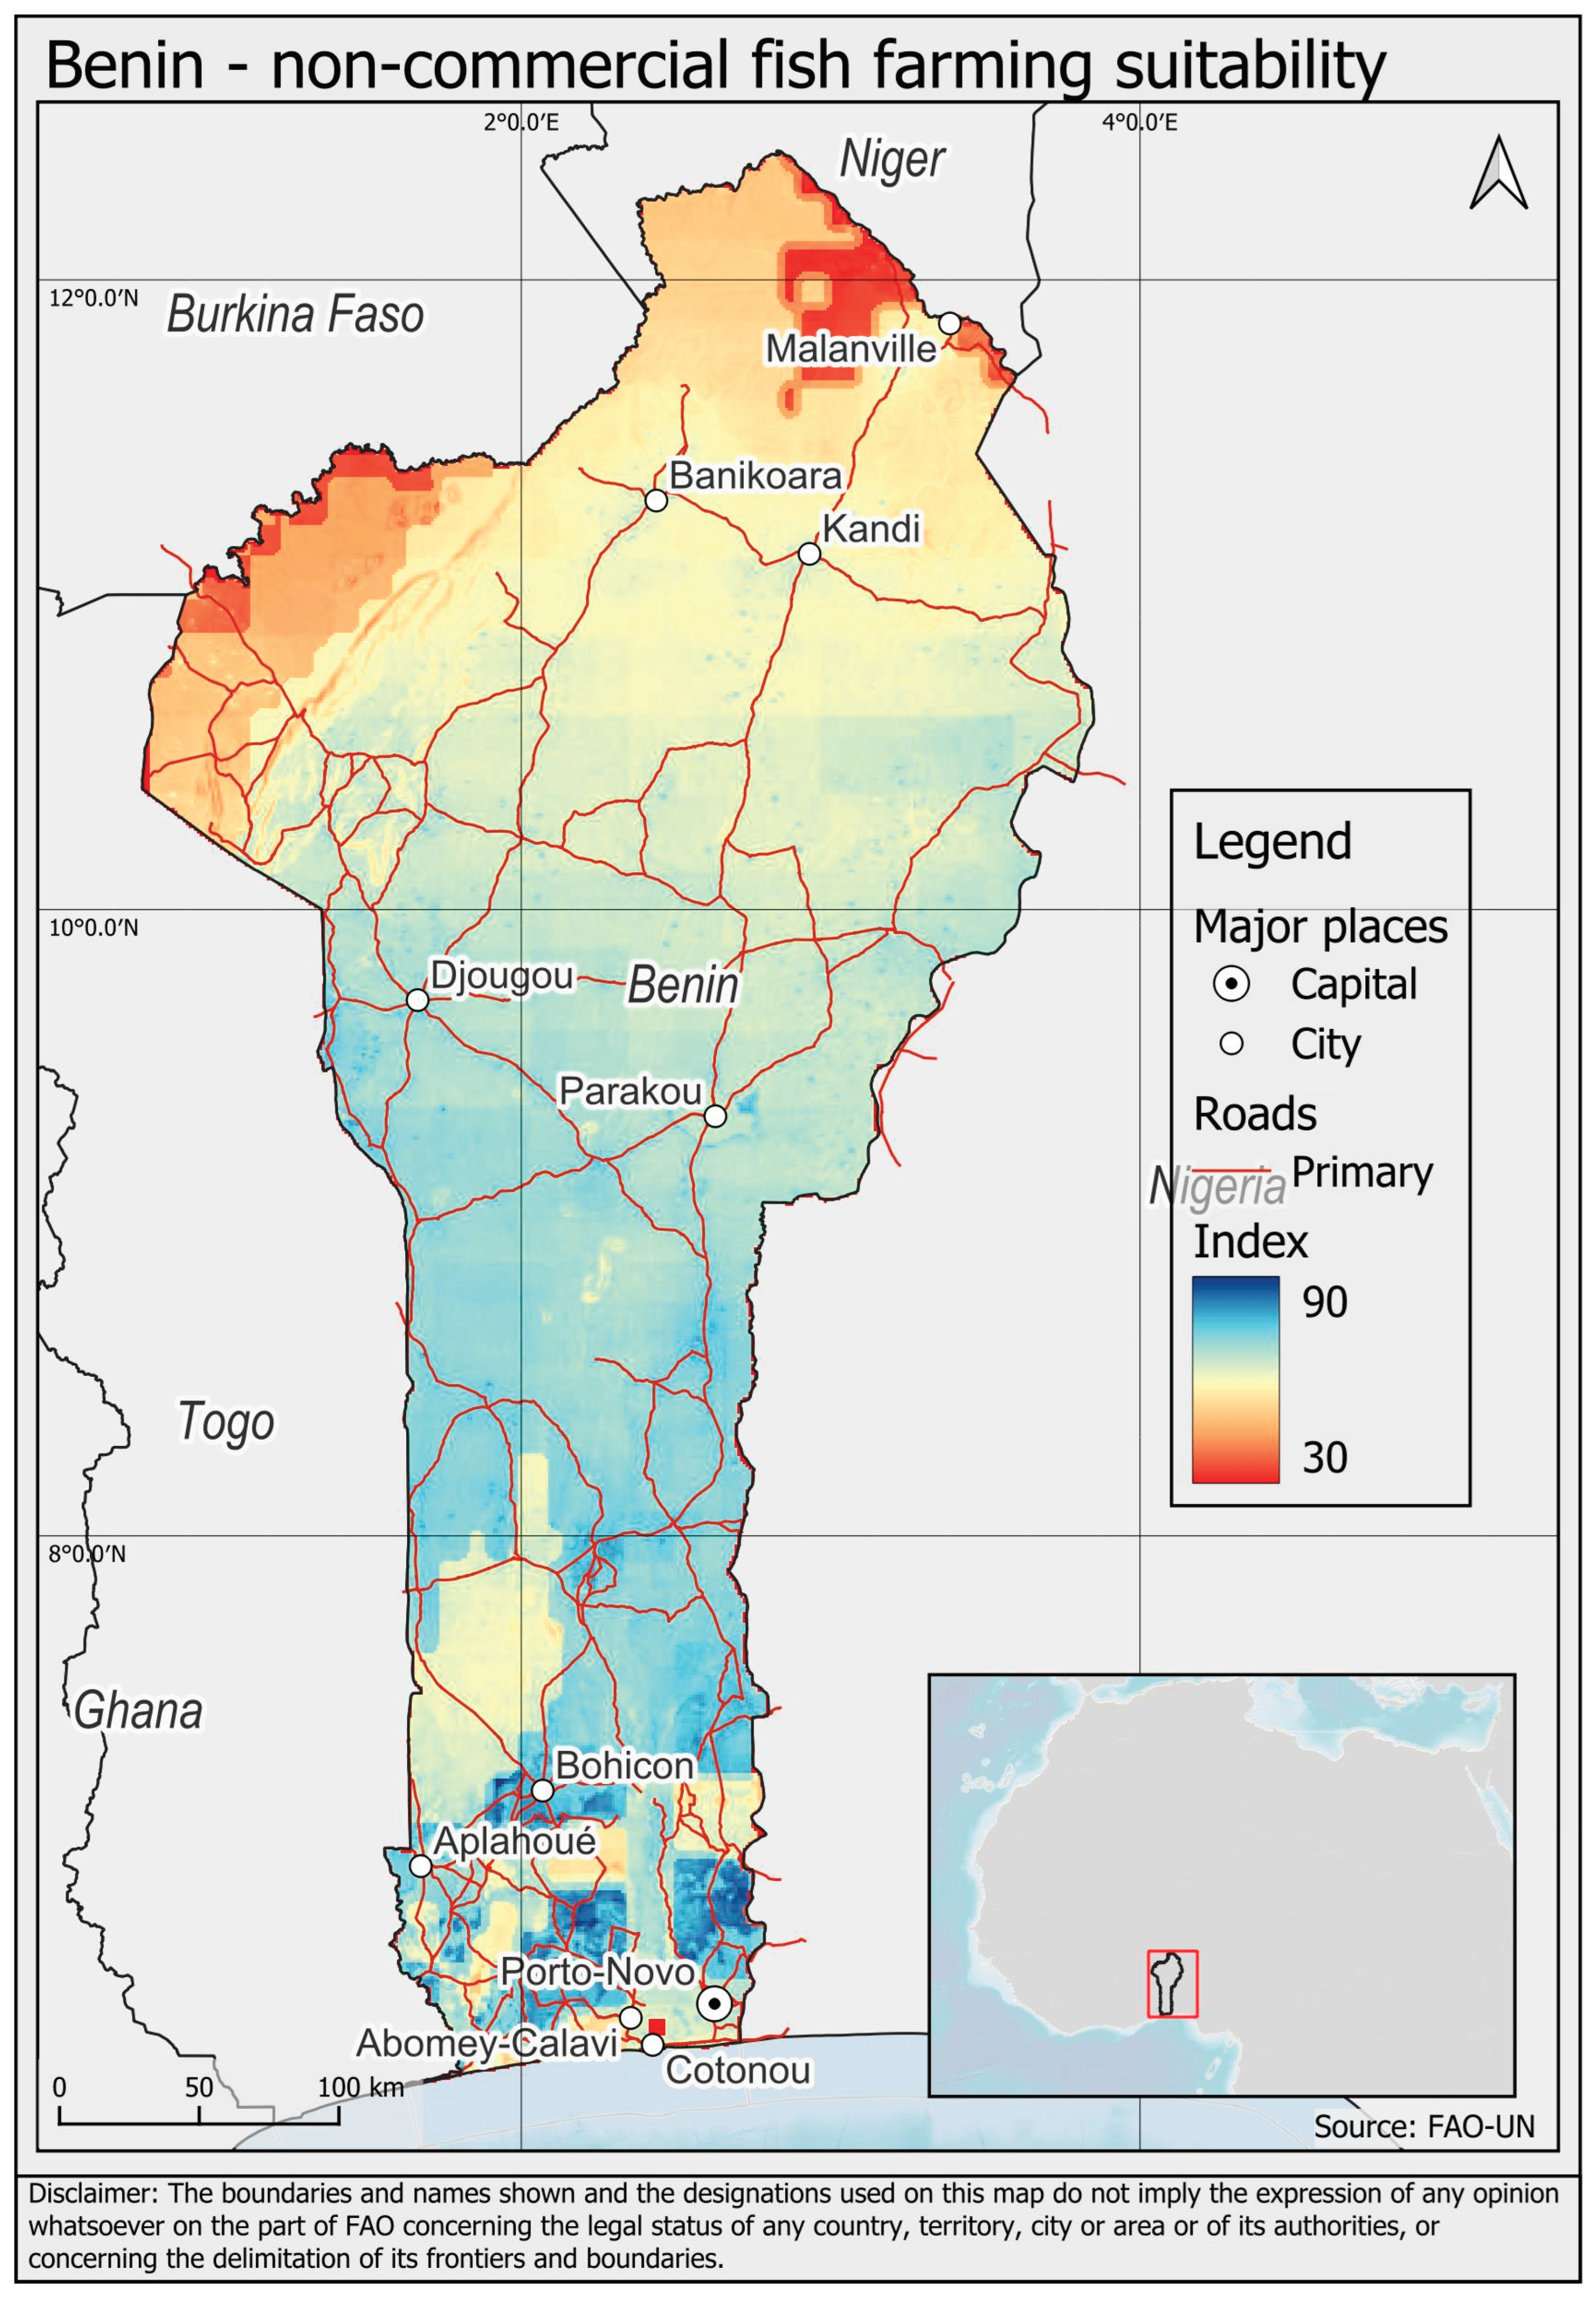
Figure 2.
District average non-intensive systems suitability index.
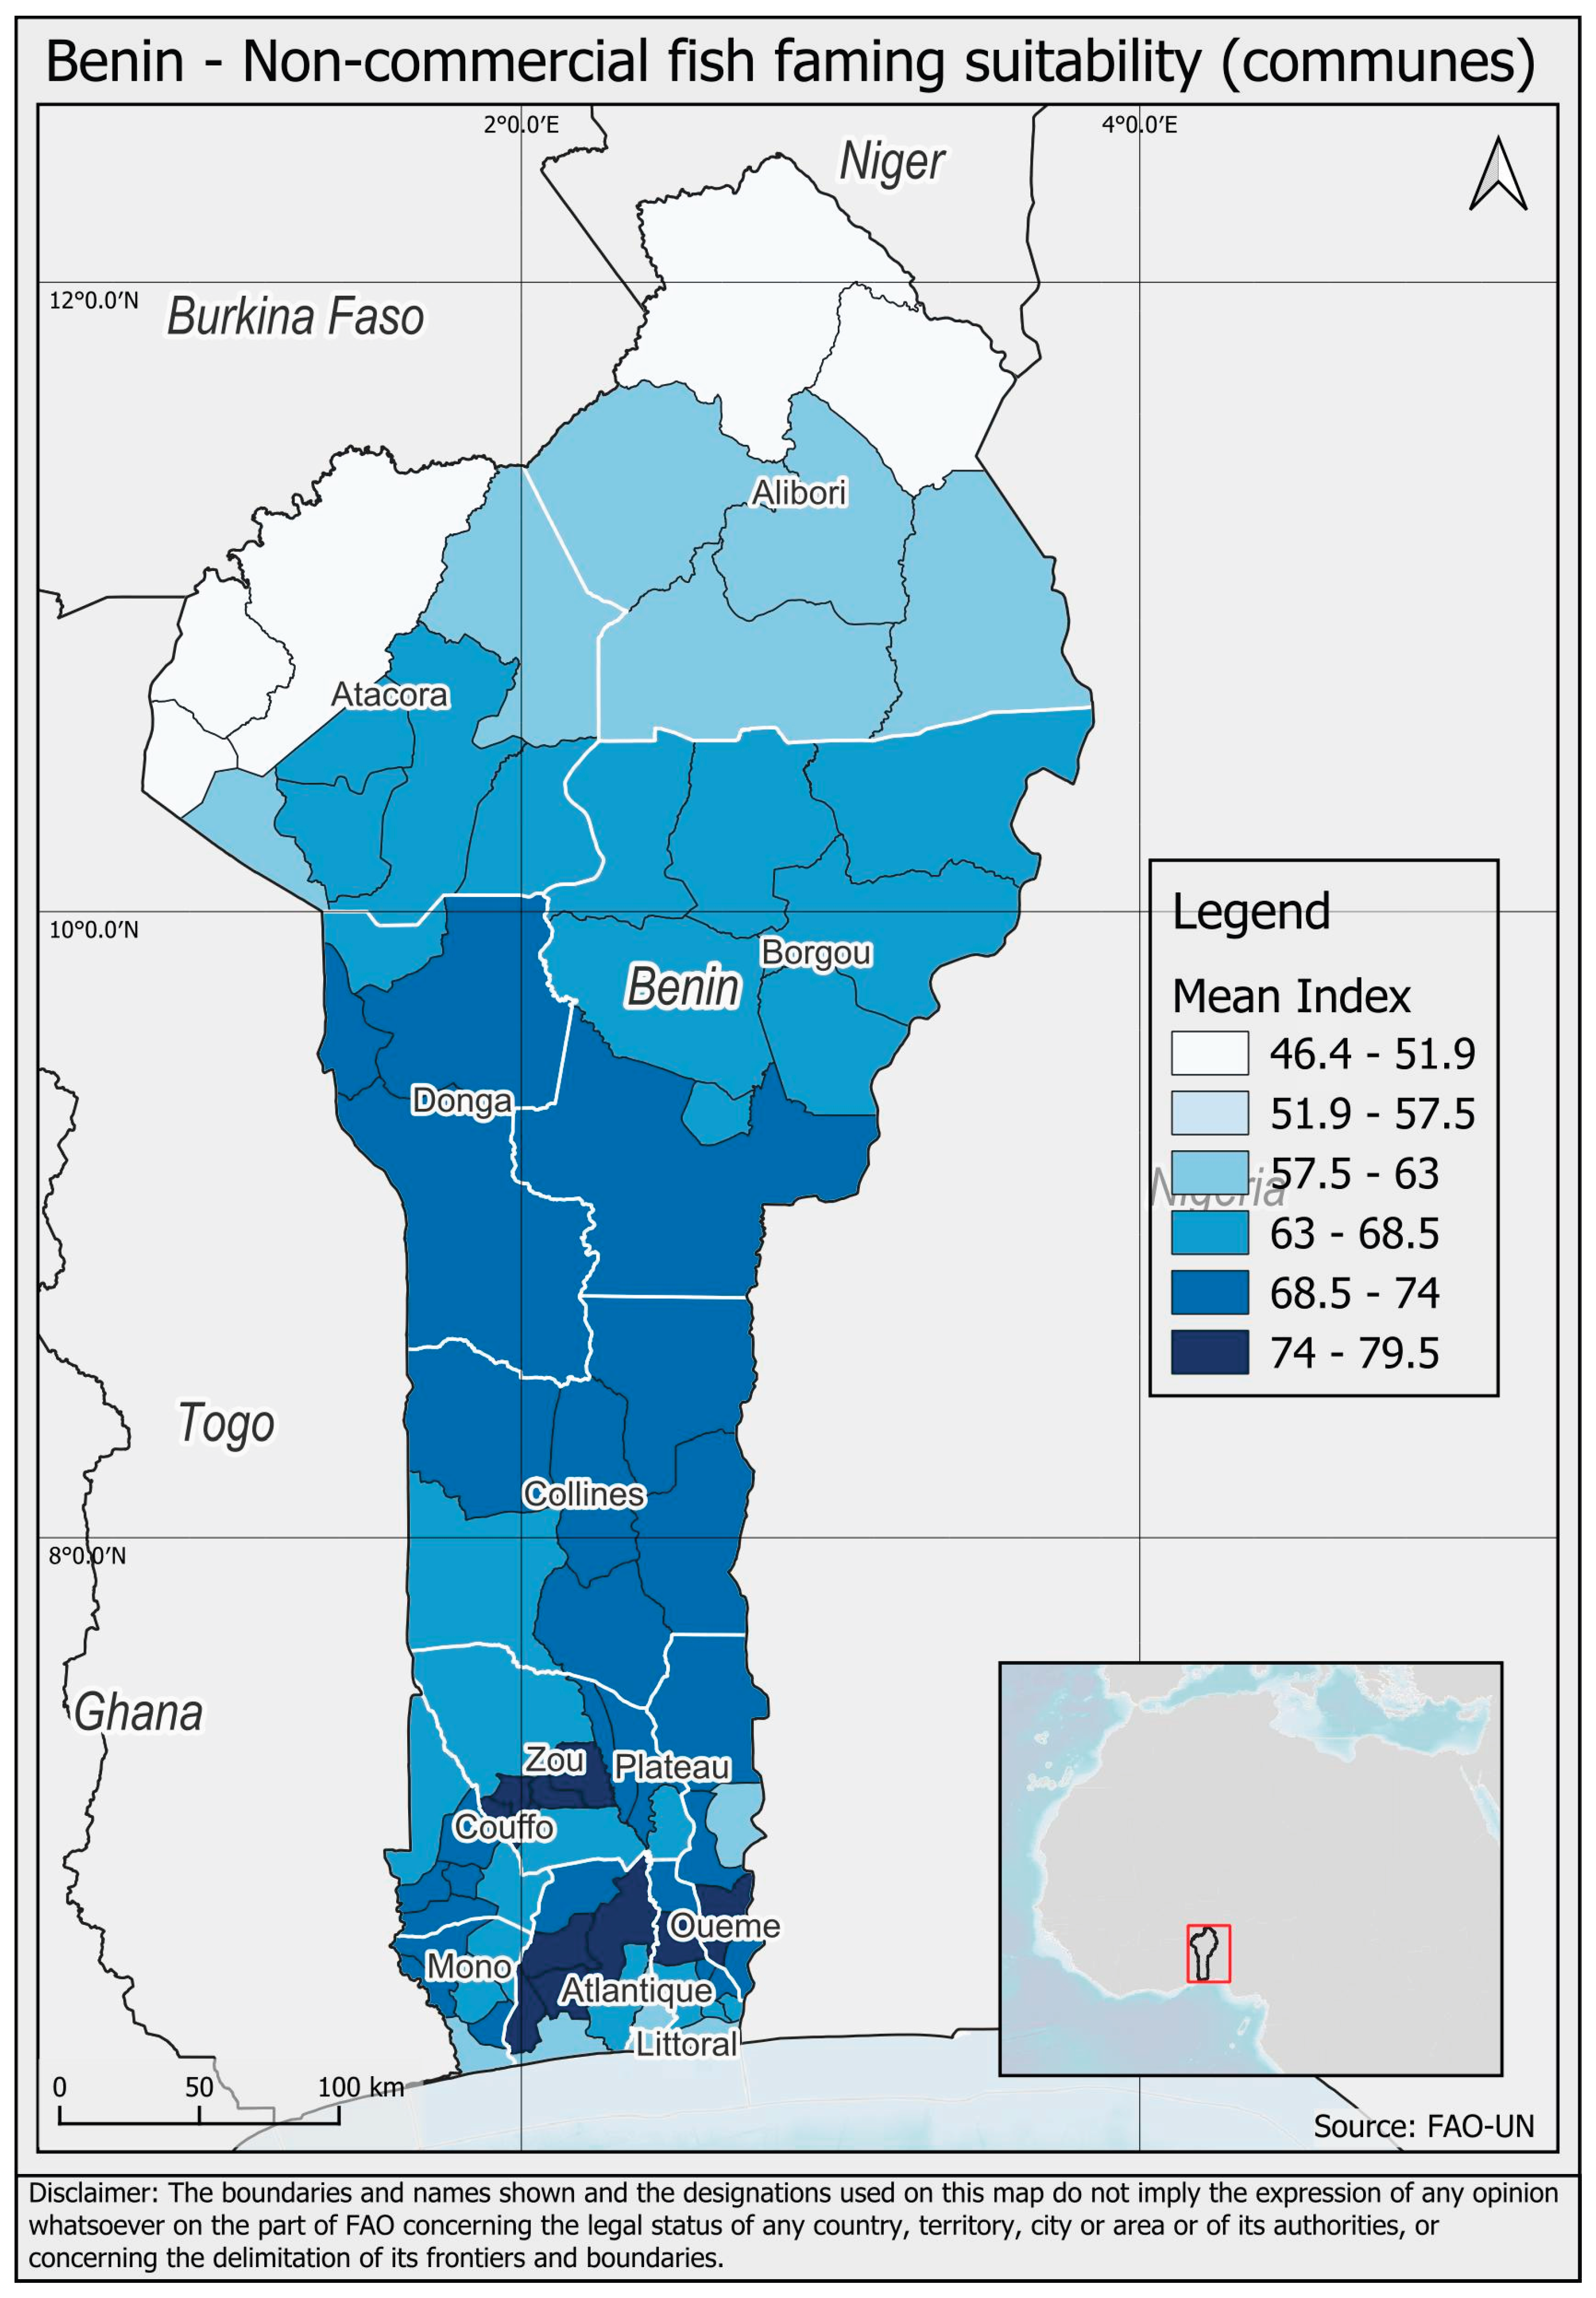
Figure 3.
Commune priority—non-intensive systems.
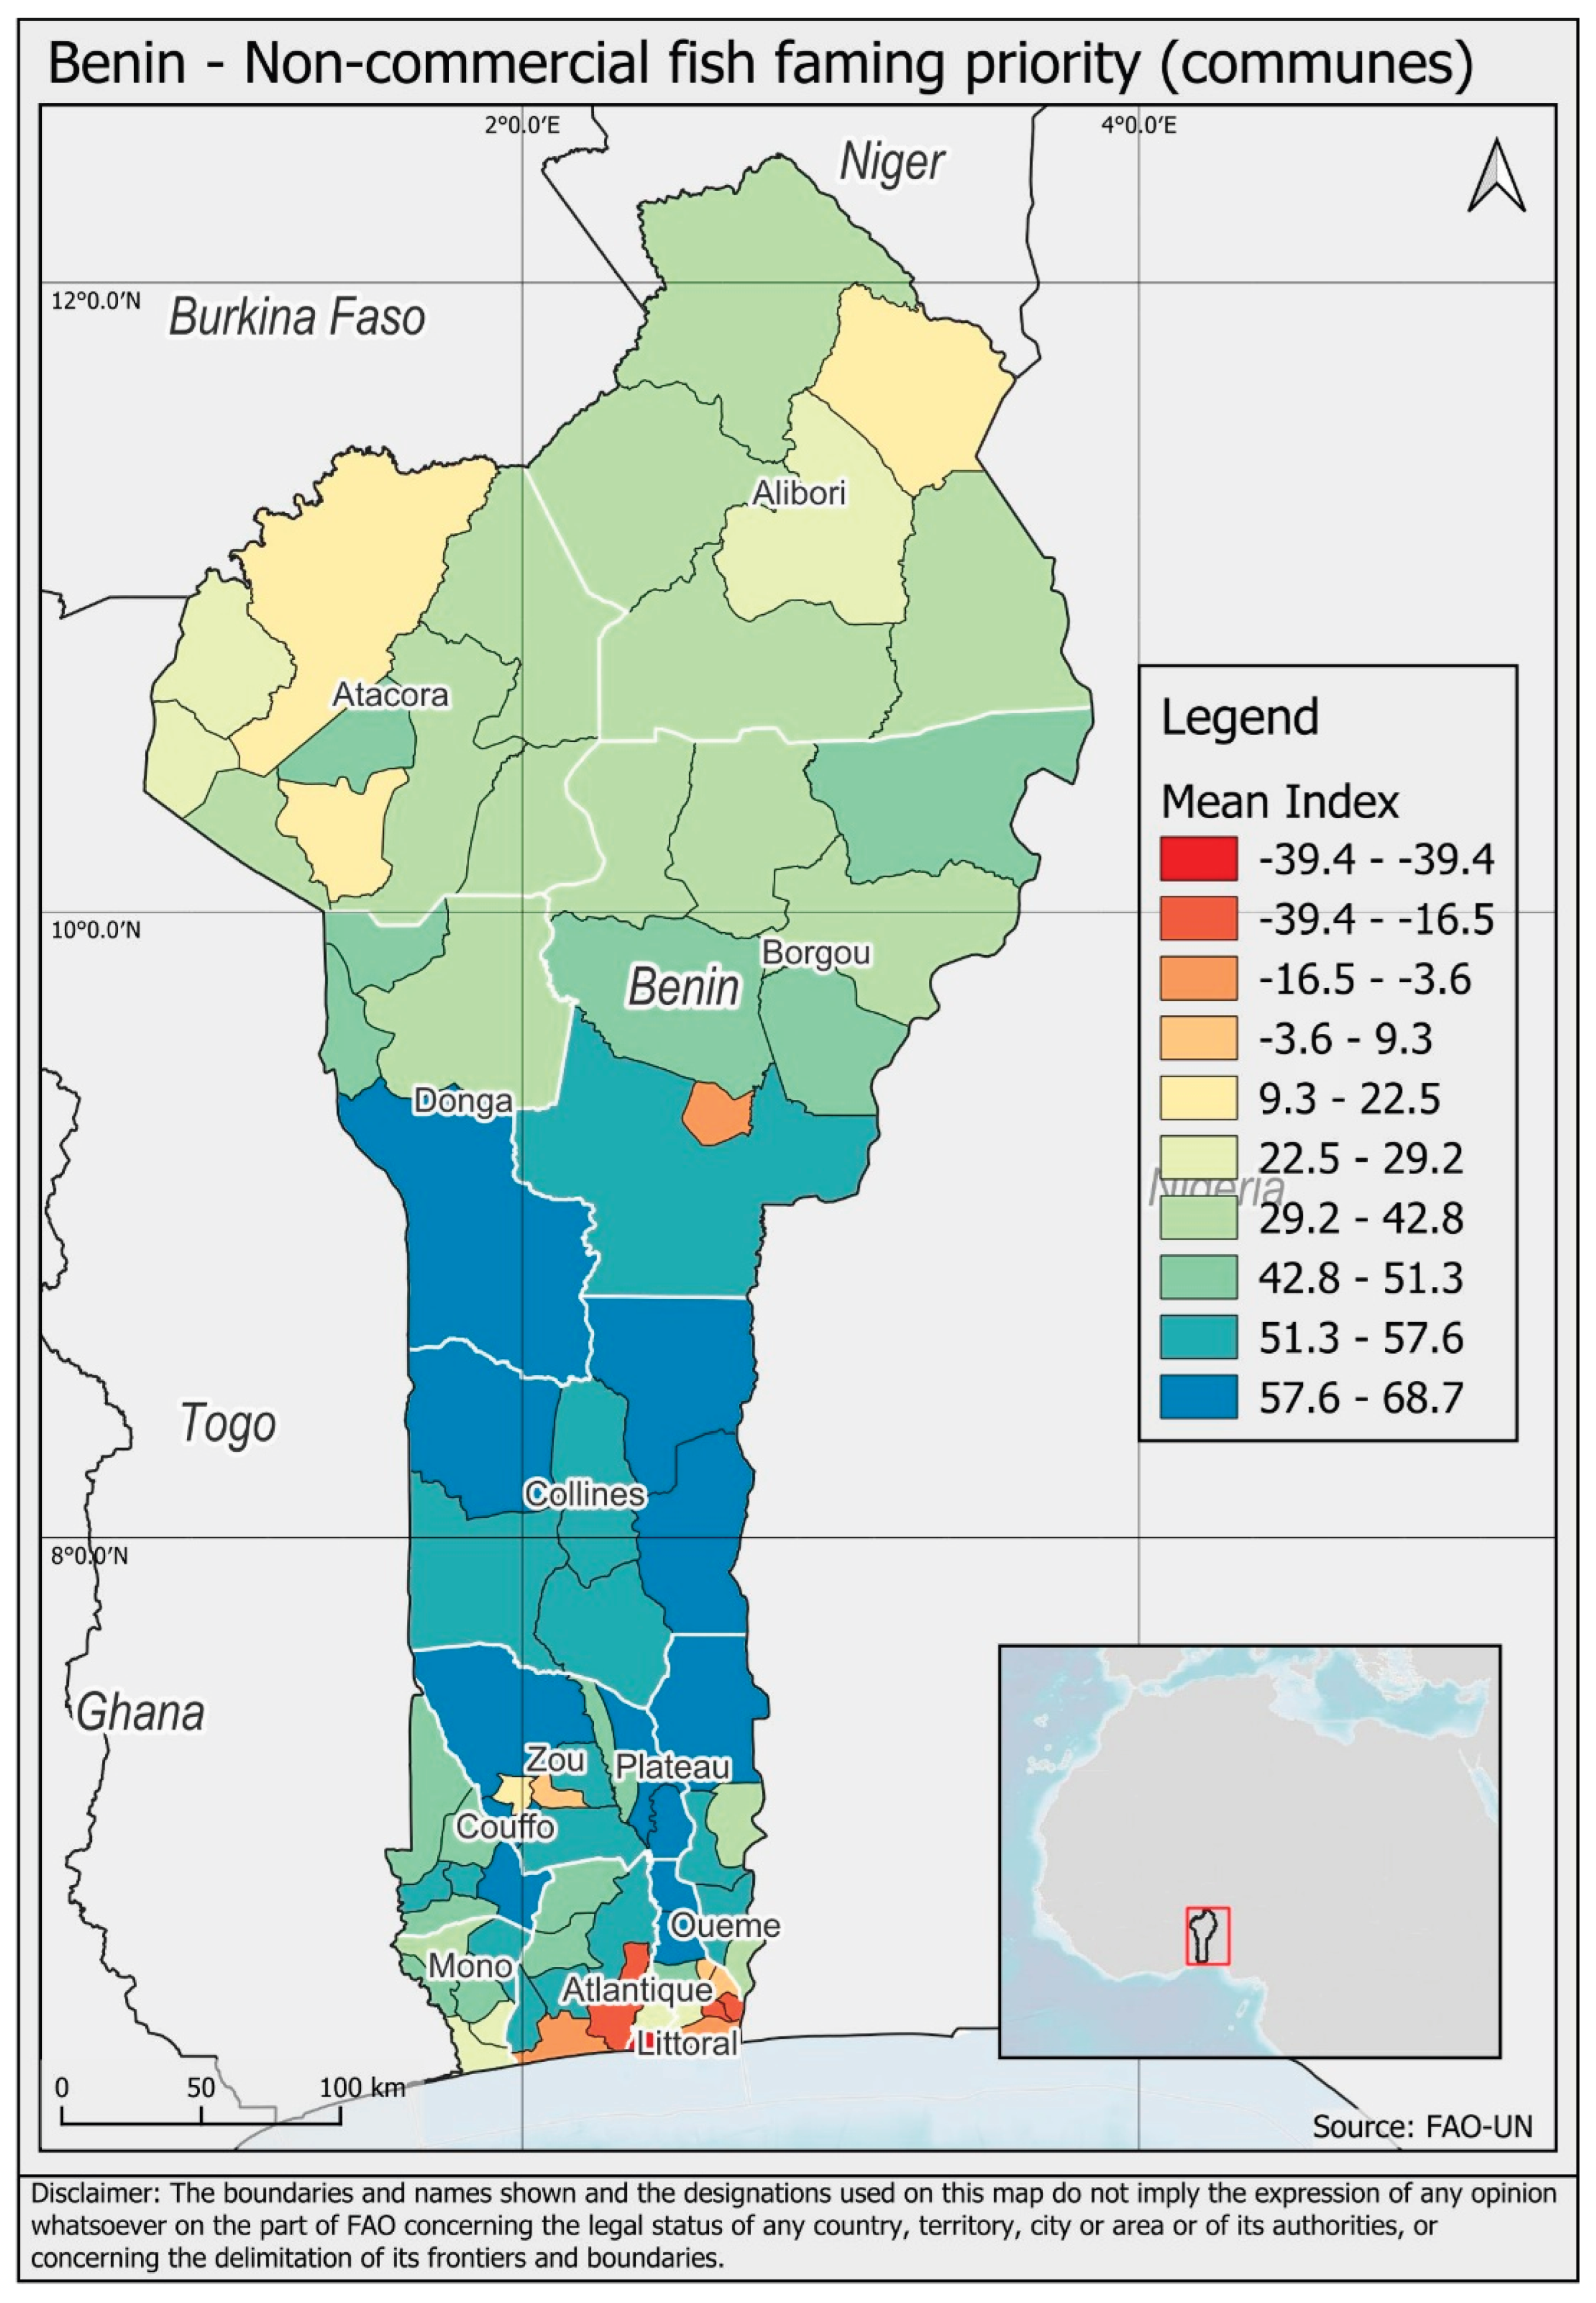
Figure 4.
Intensive closed systems suitability index.
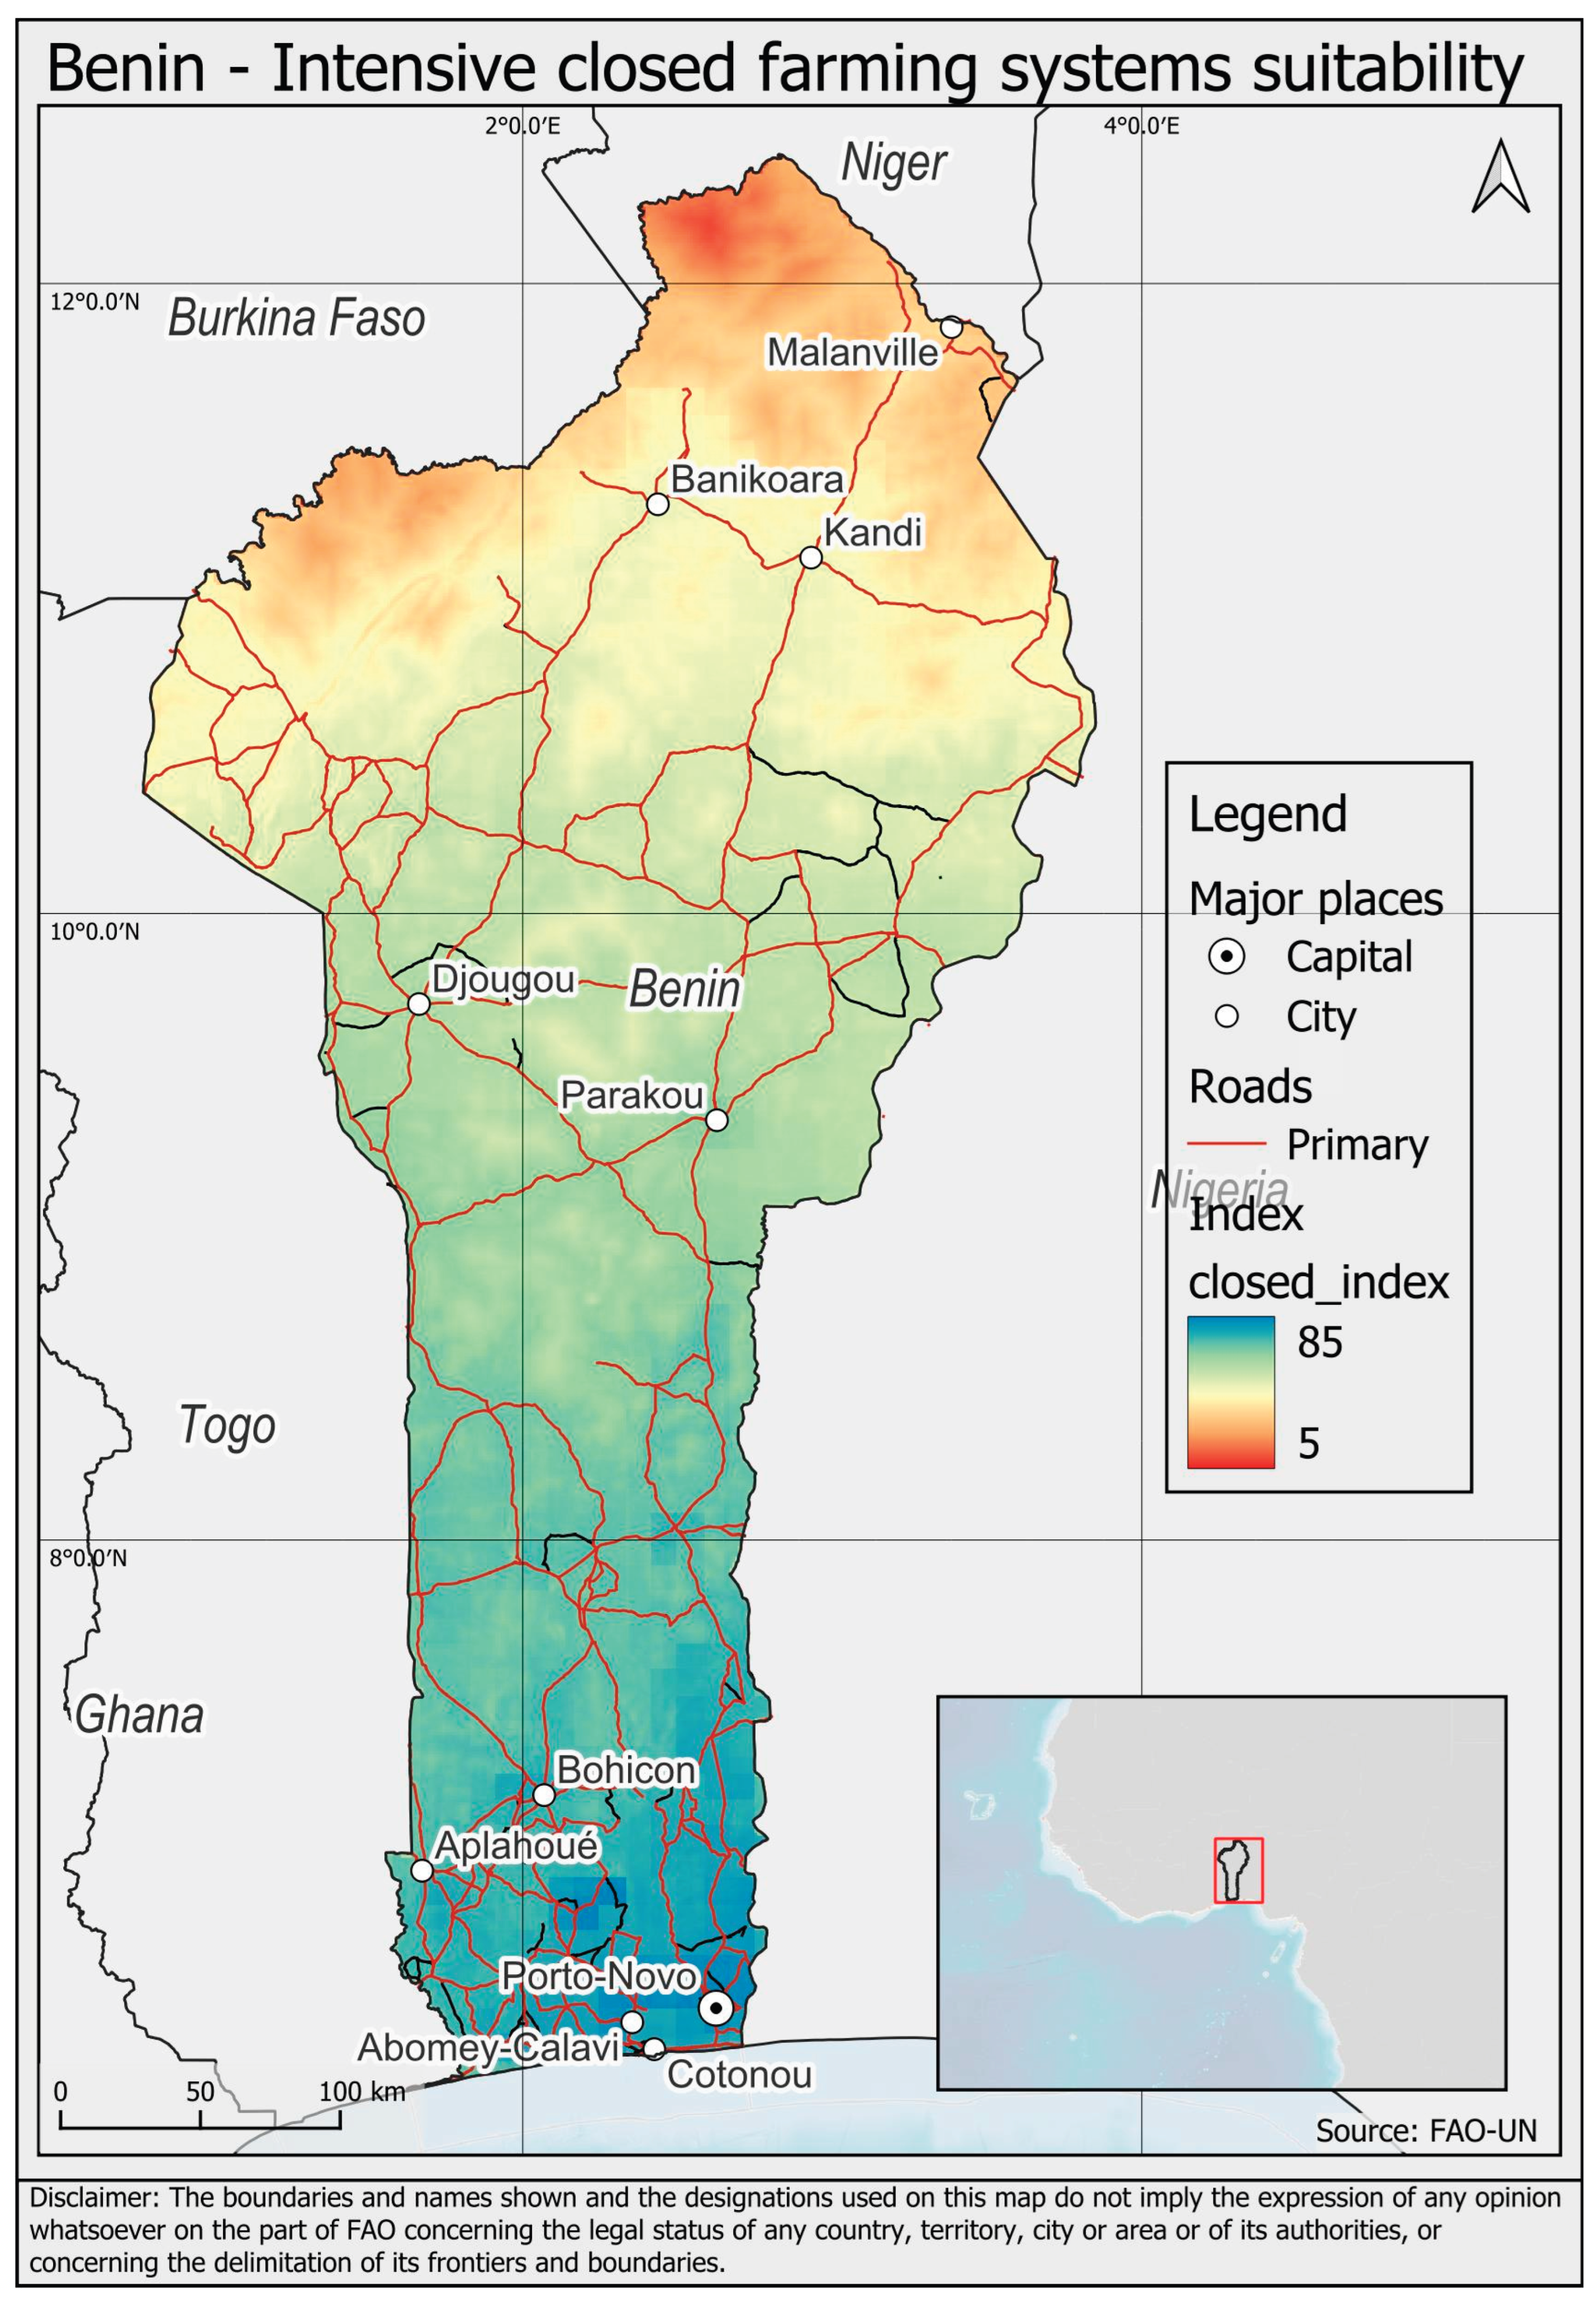
Figure 5.
Intensive closed systems—final suitability map.
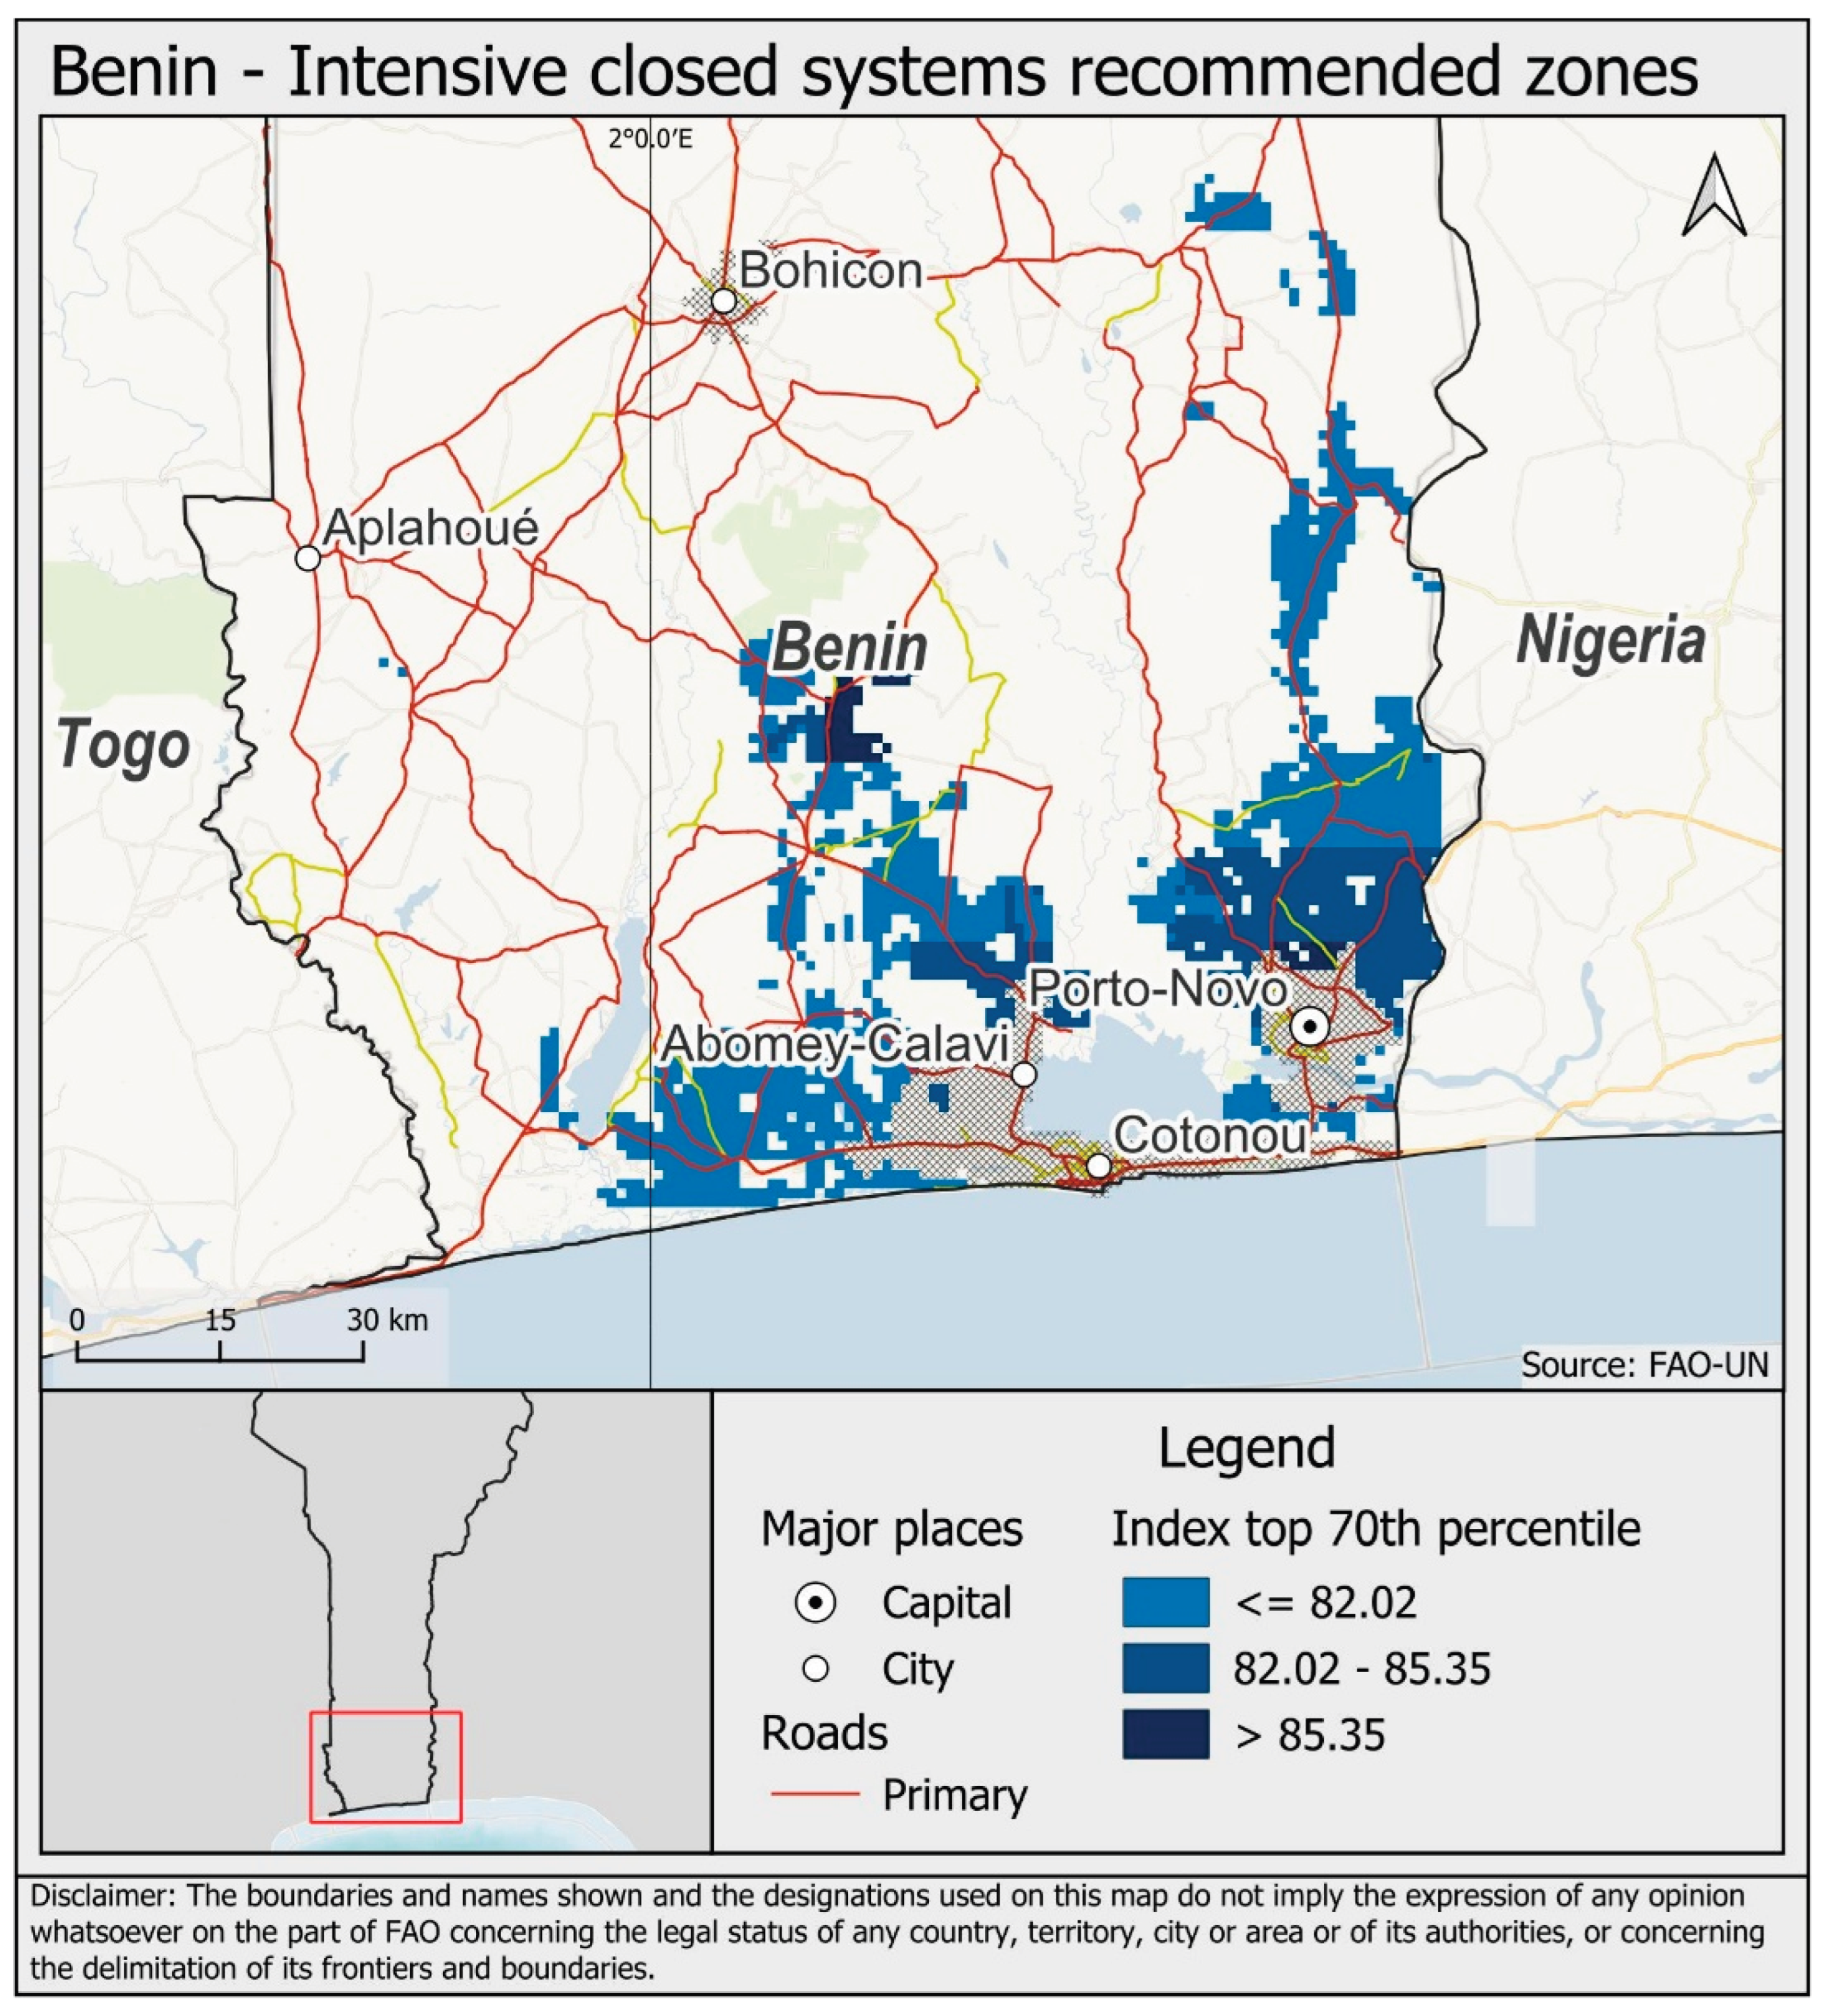
Figure 6.
Open cage systems suitability index.
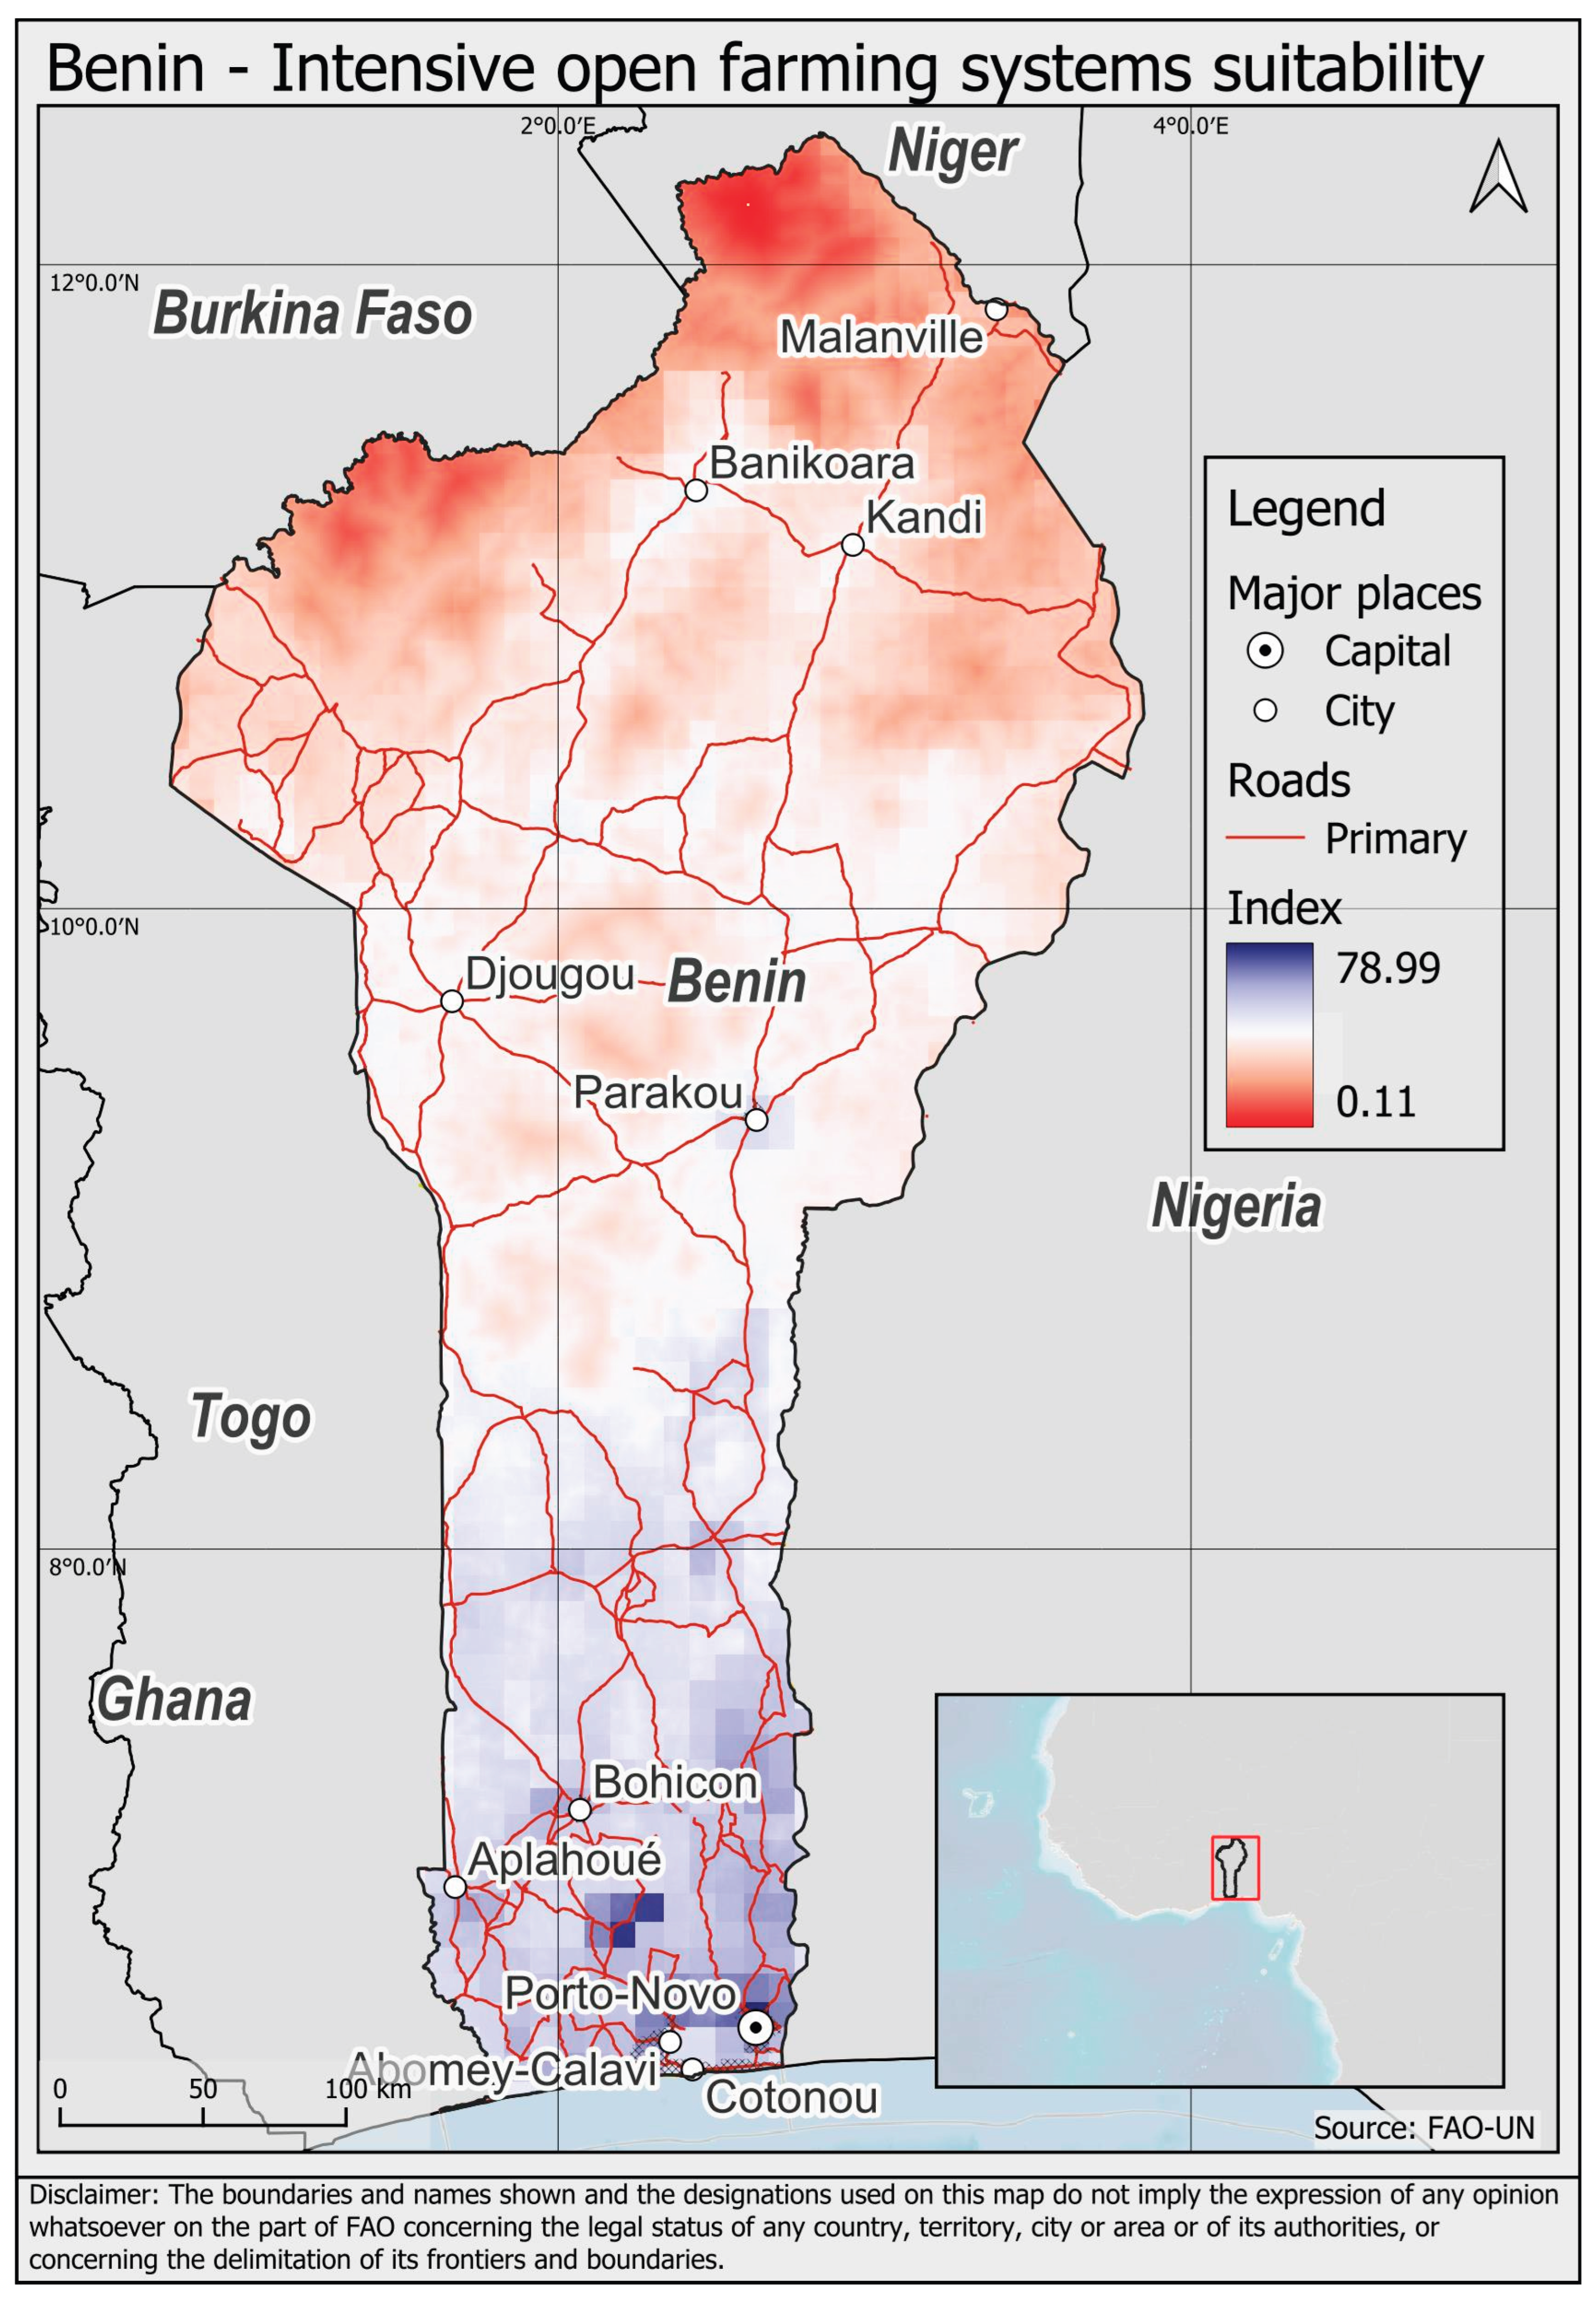
Figure 7.
Potential sites for intensive tilapia cage farming systems (Cotonou).
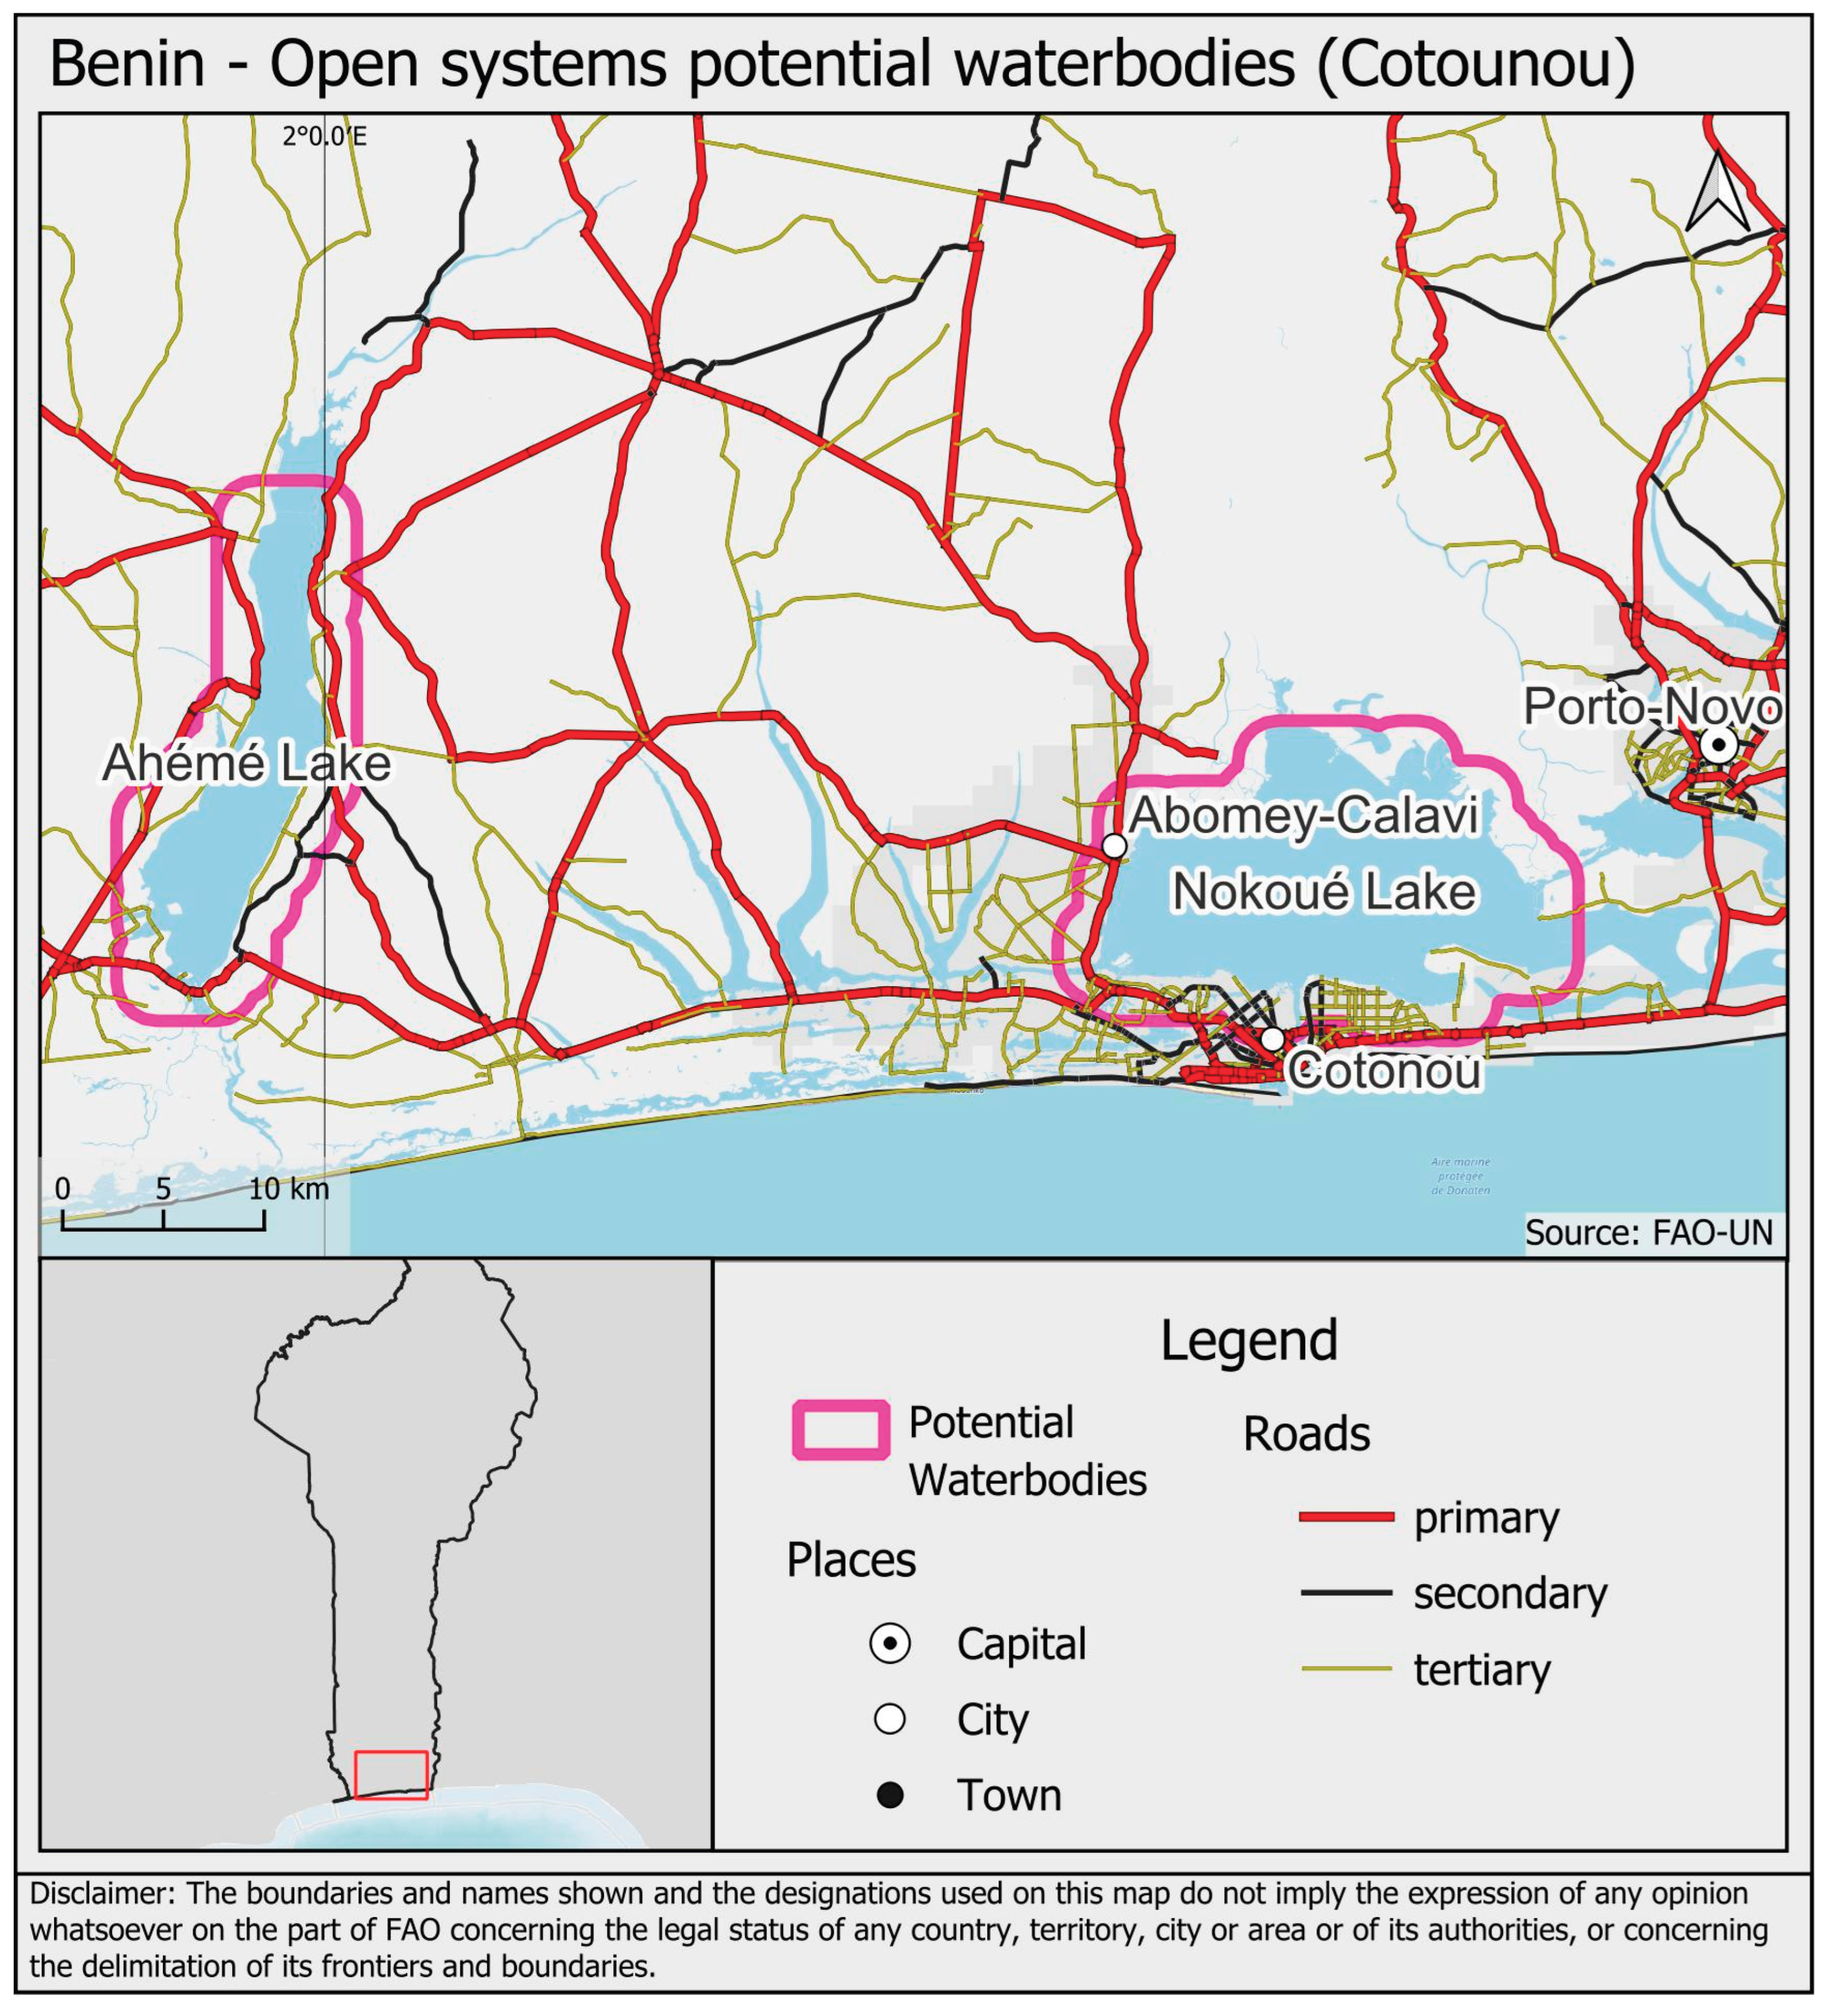
Figure 8.
Potential sites for intensive tilapia cage farming systems (Zagnanado).
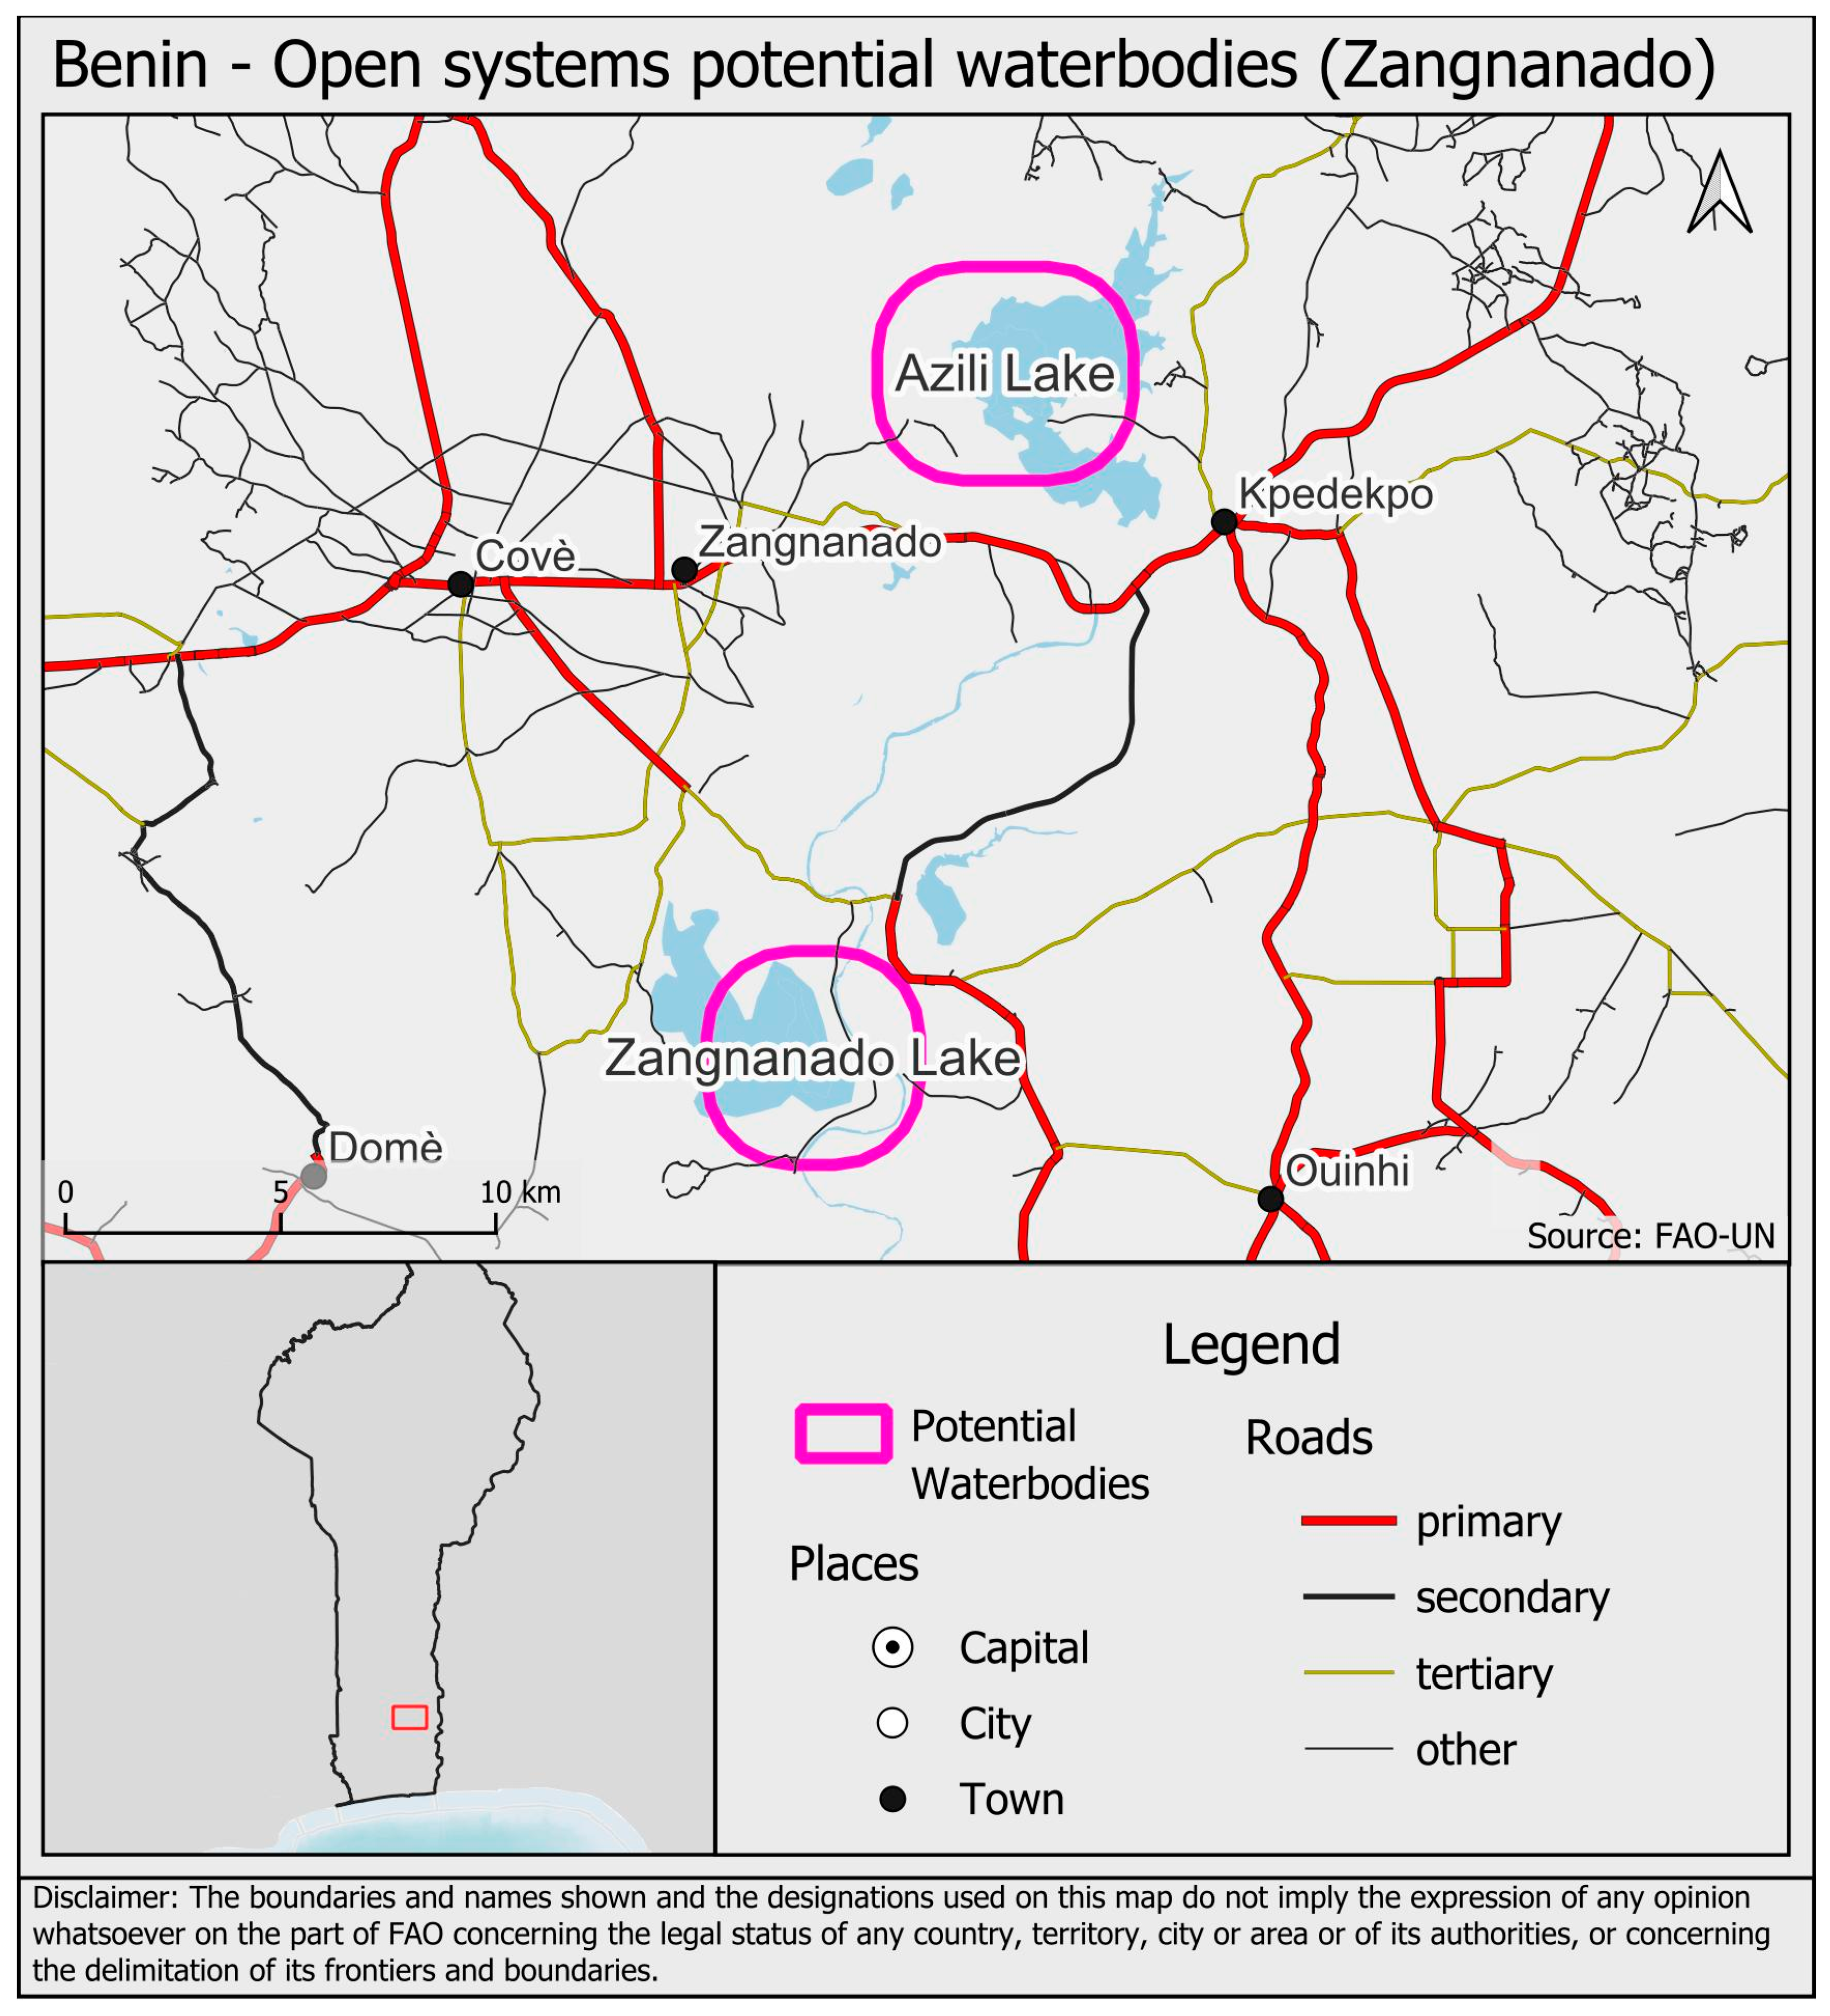
Figure 9.
Potential sites for intensive tilapia cage farming systems (Ilauko).
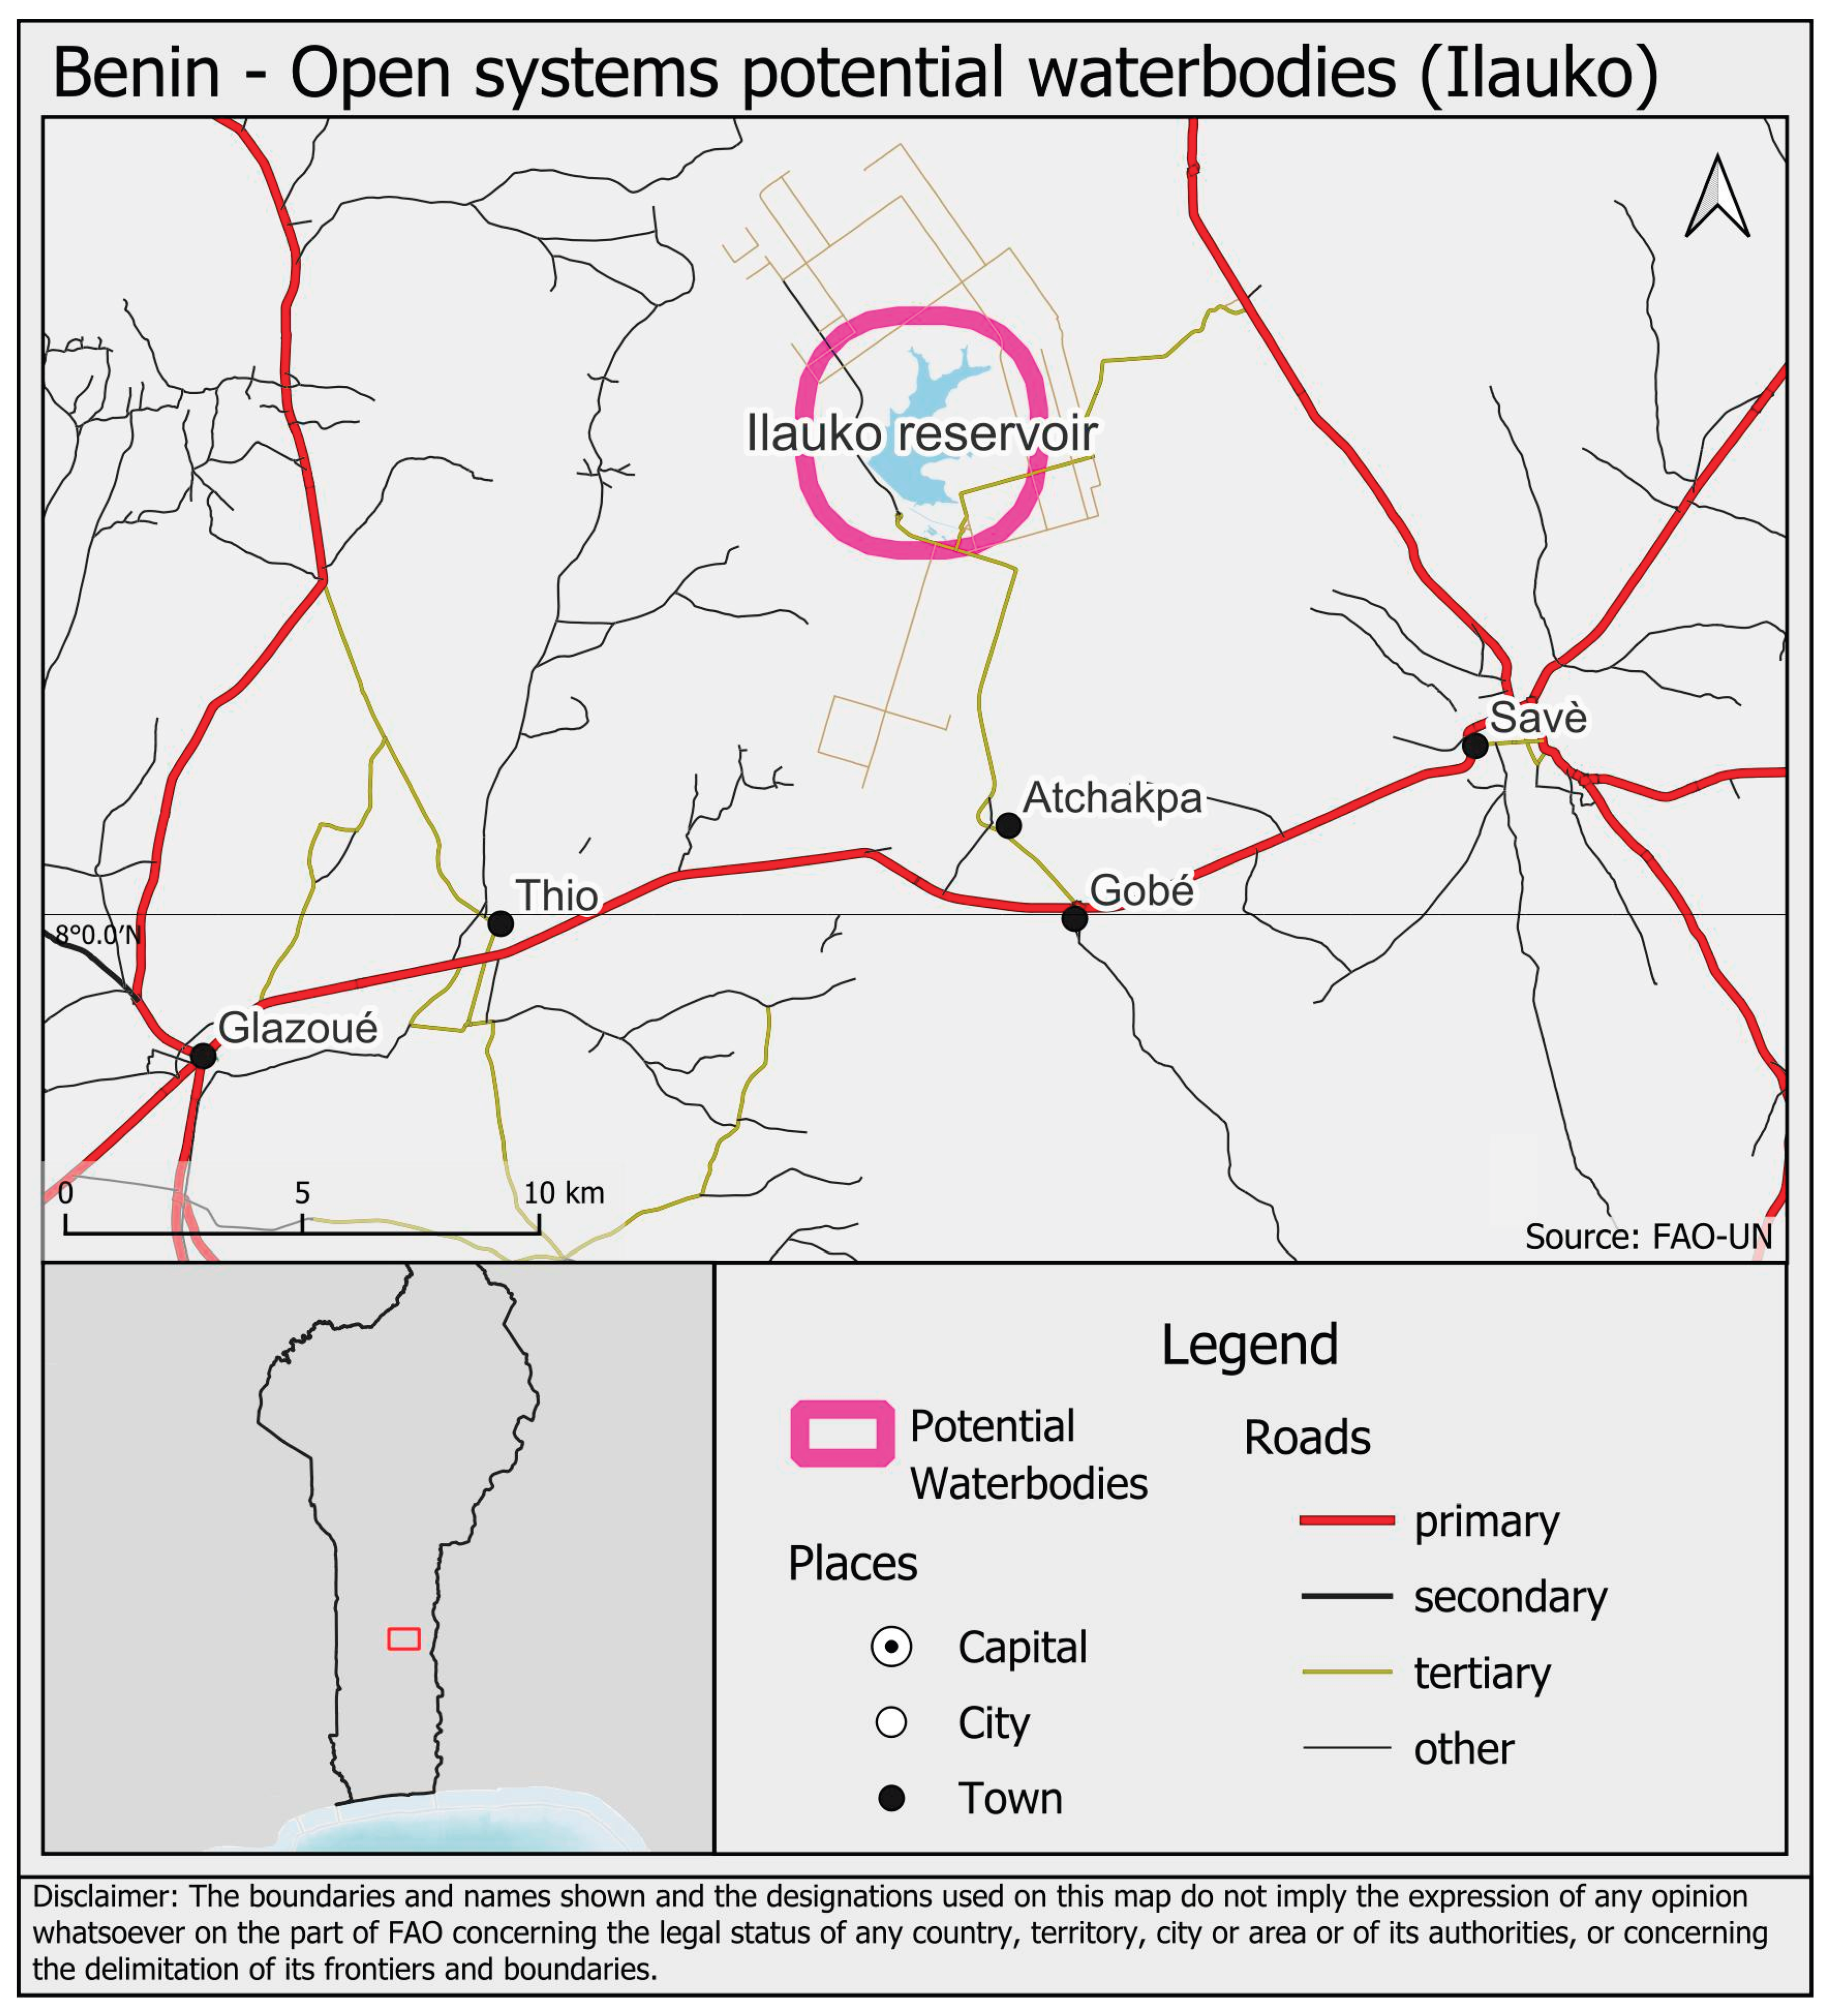
Table 1.
.
| Network class | Assumed speed (km·h⁻¹) |
|---|---|
| Primary roads | 50 |
| Secondary roads | 40 |
| Tertiary roads | 35.3 |
| Local roads | 25 |
| Tracks | 10 |
| Walk | 5 |
| Off-network land | 3 |
| Waterways | 10 |
| Railways | 60 |
| Open water | 20 |
Table 3.
.
| Parameter | Value/Rule |
|---|---|
| Urban density threshold | Population density > 1,500 persons·km⁻² AND area ≥ 25 km² |
| Slope feasibility for ponds | < 8° (inverse-normalized; 0 = 8°, 100 = 0°) |
| Road proximity (intensive closed) | ≤ 2 km from major roads |
| Bank proximity (intensive closed) | ≤ 20 km from bank agencies |
| Waterbody buffer (open cages) | 2 km buffer around permanent waters (Seasonality = 12) |
| Normalization | Min–max to [0,100] for all continuous criteria |
Disclaimer/Publisher’s Note: The statements, opinions and data contained in all publications are solely those of the individual author(s) and contributor(s) and not of MDPI and/or the editor(s). MDPI and/or the editor(s) disclaim responsibility for any injury to people or property resulting from any ideas, methods, instructions or products referred to in the content. |
© 2026 by the authors. Licensee MDPI, Basel, Switzerland. This article is an open access article distributed under the terms and conditions of the Creative Commons Attribution (CC BY) license (http://creativecommons.org/licenses/by/4.0/).
Copyright: This open access article is published under a Creative Commons CC BY 4.0 license, which permit the free download, distribution, and reuse, provided that the author and preprint are cited in any reuse.


