
Submitted:
18 February 2026
Posted:
27 February 2026
You are already at the latest version
Abstract
The aim of this study was to evaluate the effect of experimentally induced drought on the physical and chemical properties of soils under a mature Norway spruce monoculture on a nutrient‑rich site at lower elevations. Since 2010, a 41‑year‑old stand has been monitored on two plots: (i) one with the soil surface covered by PE foil, eliminating 60% of rainfall (treated plot), and (ii) a control plot with an unaltered rainfall regime. On both plots, soil samples were regularly collected for chemical analyses, climatic and soil data were recorded, and biometric parameters of the aboveground parts of spruce trees were measured. The impact of drought differed between the organic O_H horizon and the upper mineral A horizon. In the O_H horizon, lower concentrations of available magnesium (Mg) and calcium (Ca) were found under the treated plot compared to the control plot (Mg: 150.53 ± 6.81 vs. 171.46 ± 12.48 mg kg⁻¹; difference −20.93; 95% CI: −40.00 to −1.85; p = 0.03; Ca: 571.94 ± 49.47 vs. 752.92 ± 75.04 mg kg⁻¹; difference −180.98; 95% CI: −301.80 to −60.10; p < 0.001). In the A horizon, lower concen-trations of aluminium and higher concentrations of magnesium were observed under the treated plot compared to the control plot (Al: 84.76 ± 3.24 vs. 94.08 ± 1.77 mmol kg⁻¹; difference −9.32; 95% CI: −17.51 to −1.13; p = 0.02; Mg: 96.18 ± 6.44 vs. 77.99 ± 5.14 mg kg⁻¹; difference +18.19; 95% CI: 7.26 to 29.12; p < 0.001). The reduction in rainfall did not affect overall height or diameter growth of spruce trees and did not cause a significant decrease in nutrient concentrations in spruce needles. Drought induced minor, but statistically significant, changes in the soil environment, indicating a lower intensity of leaching from the soil sorption complex.
Keywords:
rainfall reduction
; growth response
; chemical soil properties
; leaf nutrient content
; Picea abies
1. Introduction
Drought is among the most acute manifestations of ongoing climate change and has evolved into a gradually intensifying phenomenon affecting extensive parts of Europe, including the Czech Republic. Prolonged periods of elevated air temperature coupled with uneven or markedly reduced rainfall during the growing season are key drivers of severe drought episodes. Such climatic anomalies disrupt core physiological processes in trees, compromise overall vitality, and heighten susceptibility to fungal pathogens and insect pests. In conceptual terms, drought can be defined as an extreme climatic event primarily caused by rainfall deficits or an imbalance in the hydrological budget over the period of interest [1]. In Central Europe, recurrent rainfall shortfalls and irregular rainfall patterns have become persistent features of the regional climate regime [2]. Soil water availability is fundamental to forest ecosystem functioning and resilience, as it regulates biological, chemical, and physical processes within and across soil horizons [3]. These processes are closely coupled to soil moisture–atmosphere interactions and can be substantially altered under sustained drying [4]. Within this context, artificially established Norway spruce monocultures at lower elevations on ecologically suboptimal sites are particularly vulnerable. Owing to high canopy interception—and unlike in mountain environments where horizontal rainfall can partially offset interception losses—these stands have a limited capacity to redistribute and retain water throughout the soil profile and tend to deplete winter water reserves rapidly [5]. Consistent with this pattern, Nihlgård [6] reported that soils beneath spruce stands are generally drier than those beneath beech forests, largely due to the high interception capacity of spruce crowns and the species’ extended assimilation activity outside the beech growing season. Seasonal measurements by Schume [7] further indicate that spruce monocultures reach their lowest soil water content in summer, with values averaging around ~40% volumetric moisture. Reduced soil moisture can markedly constrain microbial decomposition of litter, thereby altering humification pathways and nutrient cycling [8]. More broadly, soil properties emerge from dynamic interactions between vegetation and the environment rather than being determined solely by parent material [9]. Because physical and biological processes in soil are tightly interconnected, optimal soil functioning depends on the diversity and activity of soil micro- and macroorganisms [9]. Fungal communities typically tolerate water stress better than bacteria or soil fauna, and some soil organisms survive drought by forming resistant cysts or spores [10]. Notably, Borken et al. [11] showed—based on CO₂ flux measurements—that microbial communities respond to shifts in water availability within seconds, underscoring the sensitivity of near-surface soil layers to repeated drying–rewetting cycles. As stand age increases, nutrients accumulate in living and undecomposed biomass [9], which may progressively constrain nutrient availability for specific soil organisms. Phosphorus is a key determinant of Norway spruce growth and vitality, and 30–40-year-old stands can store approximately 70–90 kg ha⁻¹ of P [12]. Nevertheless, many European forest ecosystems exhibit declining soil P pools, frequently linked to enhanced atmospheric N deposition [12]. Plant-available P diminishes primarily because of its propensity to form poorly soluble compounds and stable complexes with metal cations (e.g., Al, Fe, or Ca), with the balance governed by soil pH [13]. Base cations are central to buffering soil acidity and maintaining chemical equilibrium. Under 30–40-year-old spruce stands, typical soil pools are on the order of ~80 kg ha⁻¹ K, 230–370 kg ha⁻¹ Ca, and 80–160 kg ha⁻¹ Mg [14]. While these cations neutralize acidic inputs from atmospheric deposition, they are concurrently susceptible to irreversible leaching to deeper horizons, groundwater, and surface waters [15]. Despite ongoing Ca depletion in forest soils, Jandl et al. [16] observed no immediate stress responses in trees, suggesting that spruce can access deeper Ca sources when upper-soil supplies become insufficient. Given these considerations, this study investigates how experimental rainfall reduction modifies soil chemical properties and affects basic morphological traits and growth of Norway spruce in a monoculture established on a nutrient-rich site at lower elevations.
The primary objective was to quantify the extent to which reduced rainfall alters key soil chemical characteristics. The secondary objective was to evaluate the response of aboveground biometric parameters in Norway spruce (Picea abies (L.) Karst.). We tested the following hypotheses: (H1) relative to the control plot, the treated plot exhibits higher concentrations of plant-available P, base cations (Ca, Mg, K), and higher pH in the upper soil layer; (H2) the treated plot shows lower concentrations of exchangeable Al in the upper soil layer; and (H3) the treated plot displays reduced heigh and diameter increment of spruce and lower Ca and K concentrations in current-year needles.
2. Materials and Methods
2.1. Study Site
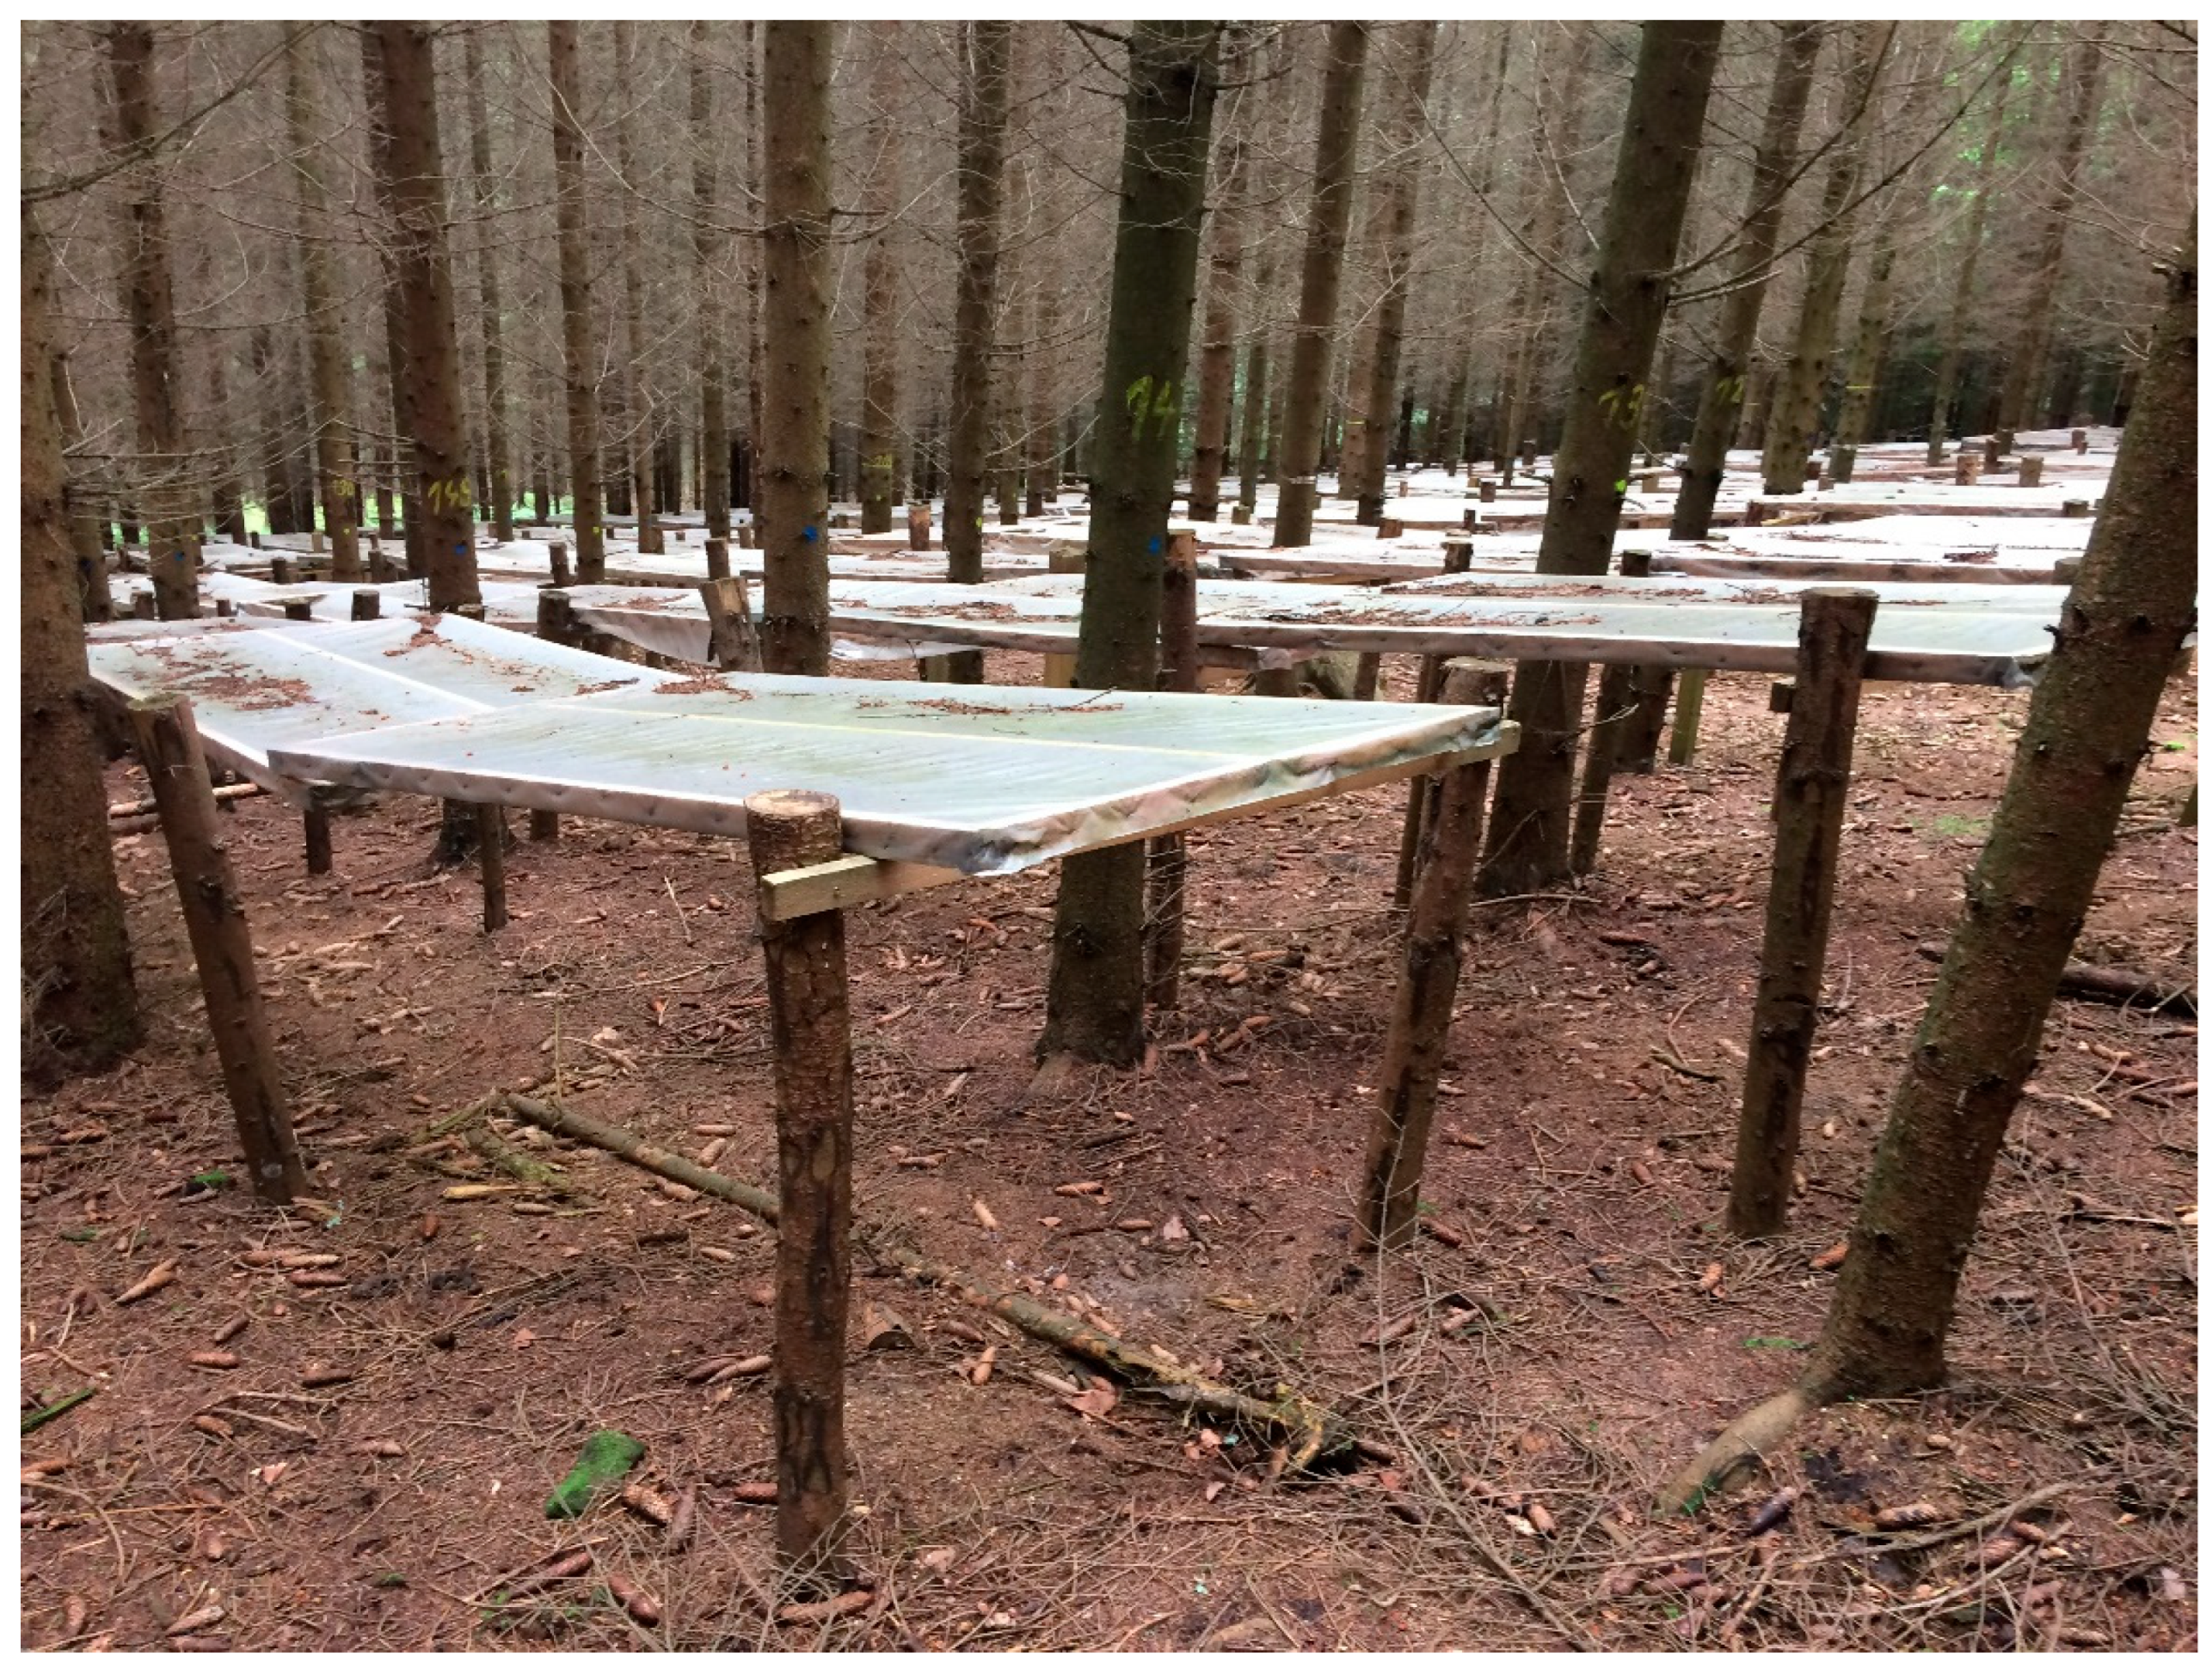
For the purposes of this study (2010–2020), a 41-year-old Norway spruce monoculture was selected (GPS 49.6110631N, 16.5248364E, Czech Republic) at an elevation of 440 m a.s.l. The site conditions are characterized by forest type 4B1 (rich Galium odoratum beech forest on plateaus and slopes) and soil type Cambisol [17]. The stand was divided into two treatments: (1) the treated plot, where 60% of the soil surface was covered with PE foil to simulate a rainfall reduction, and (2) the control plot, representing a section of the forest with an unaltered rainfall regime.
Figure 1.
Figure 1. The treated plot where 60% of the soil surface was covered with PE foil.
2.2. Monitoring of Microclimatic Parameters
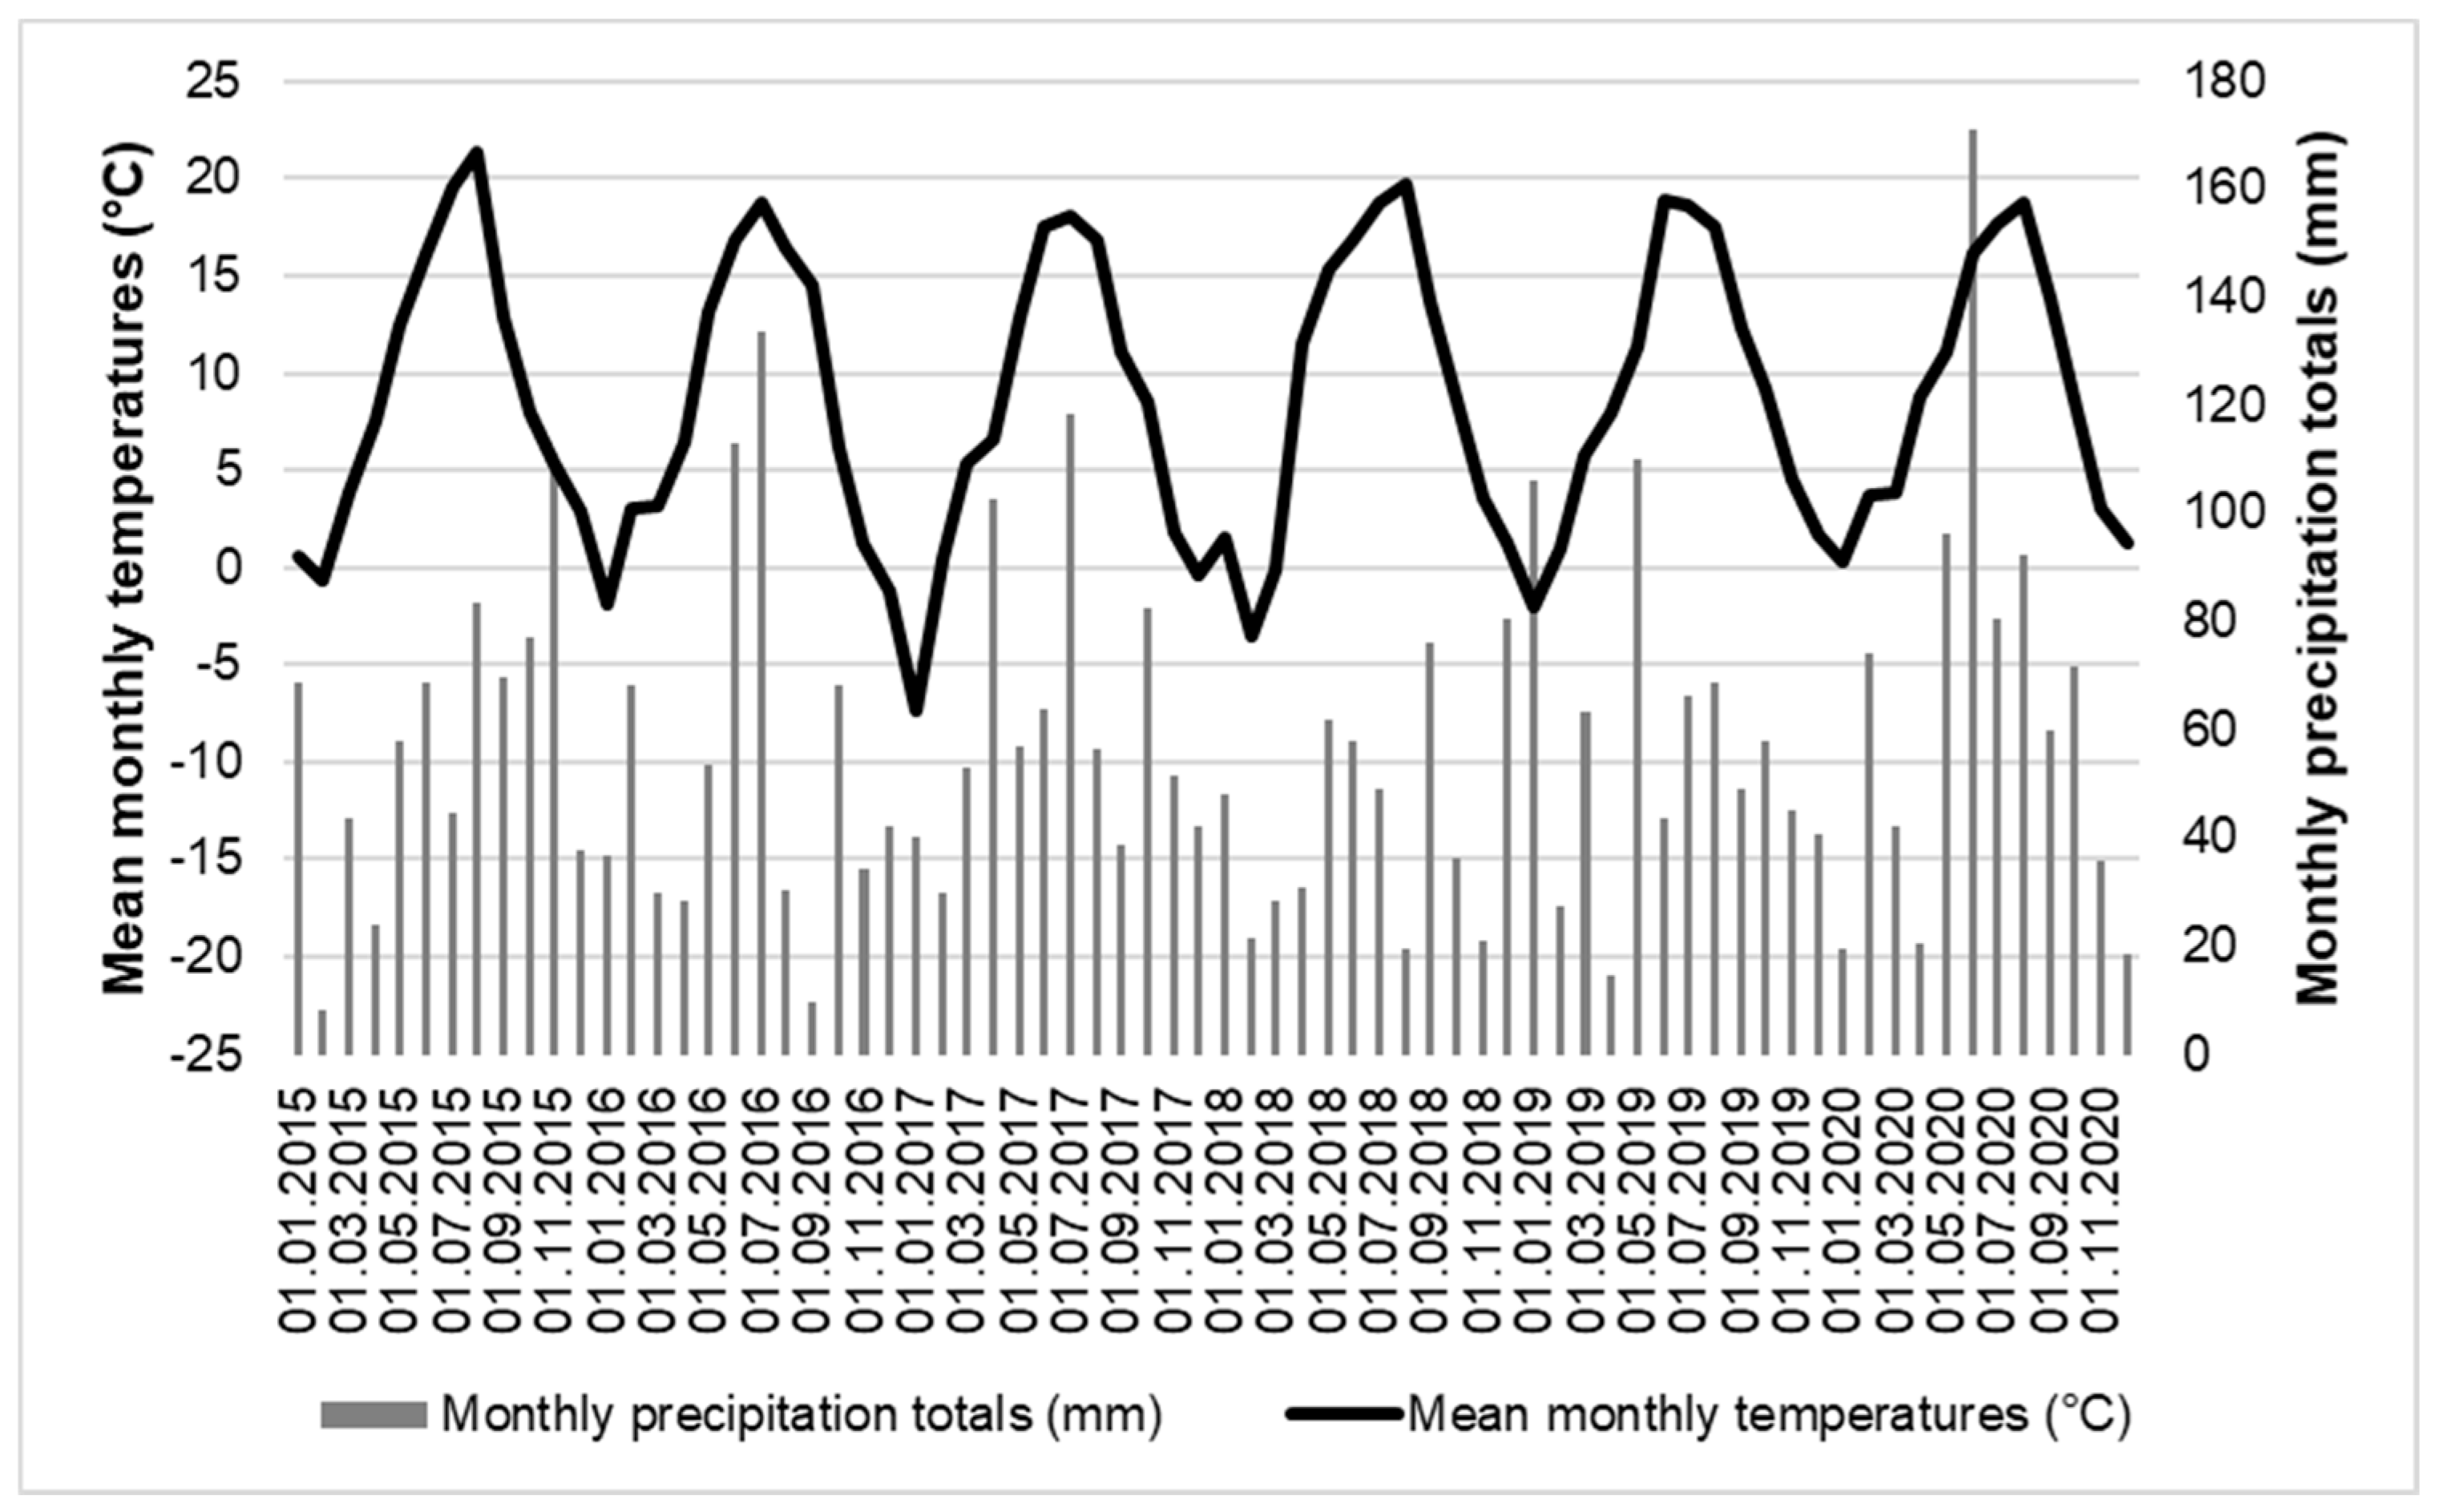
The meteorological station at Březová nad Svitavou located approximately 3.5km north of the experimental plot provided data on temperatures and precipitation. The meteorological data (Fig. 2) reveals a pronounced annual cycle, with summer temperature peaks reaching approximately 18–22 °C. During the investigated period, a total of 505 frost days were recorded, indicating a persistently cold climate regime with frequent occurrences of minimum daily temperatures falling below 0 °C. The lowest temperatures occurring during the winters of 2016/2017 and 2017/2018. The warmest and simultaneously driest periods were observed in the summers of 2015 and particularly 2018–2019, when high temperatures coincided with low monthly rainfall totals (short bars during May–August). In contrast, several months exhibit exceptionally high rainfall, most notably in autumn 2020 (a single month approaching 160–170 mm), along with sporadic peaks in 2016 and 2019. Overall, the series illustrates recurring dry summers with heat episodes and episodic, predominantly autumnal rainfall events, which may temporarily alleviate but do not fully compensate for the summer water deficit.
Figure 2.
Average monthly temperatures and precipitation measured at the Březová nad Svitavou meteorological station during the period 2015–2020 (Brněnské vodárny a kanalizace, a.s., Czech Republic).
Figure 2.
Average monthly temperatures and precipitation measured at the Březová nad Svitavou meteorological station during the period 2015–2020 (Brněnské vodárny a kanalizace, a.s., Czech Republic).
Since 2012, volumetric soil water contenthas been monitored on both plots using Virrib sensors (AMET company, Czech Republic) at three depths: 15 cm, 50 cm, and 80 cm.
2.3. Soil Sampling and Analysis
For determining chemical properties of the soil environment, soil samples were collected separately for each plot from five randomly selected (shifting) plots of 60 × 60 cm. Samples from the plots were collected using the so-called surface preparation method. A clean vertical slice approximately 2–3 cm thick was cut from the profile wall to remove any disturbed material. From the freshly exposed surface, soil was collected uniformly across the full width of the horizon. Approximately 0.5–1.0 kg of air-dry soil was obtained, depending on laboratory requirements. One composite sample was taken from the O_H horizon and one from the A horizon on each plot, in quantities quantity sufficient to obtain at least 0.5–0.7 kg of fine earth for analysis.
Soil analyses focused on determining basic chemical properties (Table 1). The measured properties included soil reaction (pH), available phosphorus (P), exchangeable base cations (Ca, Mg, and K) and aluminium (Al), and the concentrations of major macronutrients such as carbon (C) and nitrogen (N), together with the C:N ratio. P, Mg, Ca, and K contents were determined from soil extracts using the Göhler [18] and Mehlich II [19] methods. Al was determined using the Sokolov method [20]. Soil organic carbon (C) was analysed using the Walkley–Black method [21]. Total nitrogen (N) was determined using the Kjeldahl method [22]. Soil pH in water (pH_H2O) and in 1 M KCl (pH_KCl) was measured using a pH meter in a 1:5 (v:v) suspension of soil in water or 1 M KCl, following ISO 10390.

Table 1.
Overview table of soil parameters and analytical methods.
| Soil Parameter | Symbol | Analytical Method |
|---|---|---|
| pH in water extract | pHwater | 1:5 soil to solute; pH meter (ISO 10390) |
| pH in potassium chloride | pHKCl | |
| Total carbon | C (%) | Walkley-Black [21] |
| Total nitrogen | N | Kjeldahl [22] |
| Phosphorus content | P (mg/kg) | Göhler [18] (O horizon) Mehlich II [19] (A horizon) |
| Magnesium content | Mg (mg/kg) | |
| Calcium content | Ca (mg/kg) | |
| Potassium content | K (mg/kg) | |
| Aluminum content | Al (mg/kg) | Sokolov [20] |
Chemical parameters were monitored annually from 2010 to 2020, excluding the years 2011, 2018, and 2019. The collected soil samples were analysed in an accredited laboratory (Laboratoř MORAVA, s.r.o., Czech Republic).
2.4. Leaf Analysis and Tree Biometric Parameters
In the years 2010–2012, 2015–2016, and 2020, samples of the spruce assimilation apparatus were collected for foliar analysis. Needles were sampled from five standing spruce individuals in each treatment (the treated plot and the control plot). From each tree, all needles were taken from three branches of the fifth whorl. The samples were transported to the laboratory, dried, and ground. The prepared samples were analysed for macronutrient content in needles (using ICP-OES for P, K, Ca, Mg, and S, and an elemental analyser for N).
To assess the impact of rainfall reduction on biometric parameters of the aboveground parts of Norway spruce, measurements of tree height (m) and diameter at breast height (cm) were conducted annually at the end of the growing season on the research plots.
1. Statistical Analysis
Statistical evaluation was performed using Statistica™ 12.0. Data normality was verified using the Shapiro–Wilk test, and homogeneity of variances was assessed with Bartlett’s test. For comparison of normally distributed data sets, a one-way ANOVA was used. When the data were not of a normal distribution, the non-parametric Kruskal-Walli’s test was used instead. The lowest significance threshold P<0.05 was applied for all statistical analyses.
1. Results
1.1. Soil Moisture
During the monitored period, changes in soil moisture occurred primarily in the upper soil layer (15 cm depth; Figure 3). This upper layer exhibited the greatest drying during the growing season (lowest volumetric soil water content), whereas a pronounced increase in moisture (peaks, i.e., highest volumetric soil water content) was observed in the winter months. In deeper soil layers (50 and 80 cm), volumetric soil water content was relatively more stable and decreased with depth. The treated plot showed lower soil moisture than the control plot. The largest differences were recorded in the top layer of soil (15 cm), where the volumetric water content ranged between 5 and 15% in the treated plot and between 10 and 30% in the control plot.
1.1. Chemical Soil Properties
In the OH horizon, available Ca and Mg contents were significantly lower in the treated plot as compared to the control (Table 2). In the A horizon, exchangeable Mg contents were higher in treated plot (96.18 ± 6.44) than in the control (77.99 ± 5.14). Conversely, exchangeable Al in the A horizon was lower in treated plot (84.76 ± 3.24) than in the control (94.08 ± 1.77). No significant differences between treated and control plot were found for the C and N contents, the C/N ratio, nor for exchangeable K and available P contents.
Table 2.
Comparison of soil reaction (pHwater and pHKCl) and contents of total carbon (C), nitrogen (N), available nutrients (P, Mg, Ca, K), and exchangeable aluminium (Al) (arithmetic means ± standard error “SE”, and the absolute difference estimate with the 95% confidence interval) in OH and A horizons on the treated plot using PE foil and on uncovered control plot . Statistically significant P-values are in bold. See Table 1 for analytical methods.
| Parameter | Horizon | Treated plot | Control plot | Difference | P | |||
|---|---|---|---|---|---|---|---|---|
| Mean | SE | Mean | SE | Mean | Lower / Upper | |||
| pHwater | OH | 4.00 | ±0.04 | 4.07 | ±0.05 | -0.06 | -0.15 / 0.02 | 0.170 |
| A | 3.68 | ±0.04 | 3.66 | ±0.02 | 0.02 | -0.05 / 0.10 | 0.500 | |
| pHKCl | OH | 3.38 | ±0.04 | 3.47 | ±0.06 | -0.09 | -0.21/ 0.01 | 0.090 |
| A | 3.10 | ±0.03 | 3.08 | ±0.02 | 0.02 | -0.04 / 0.08 | 0.420 | |
| C (%) | OH | 3.43 | ±0.20 | 3.61 | ±0.10 | -0.18 | -0.53 / 0.17 | 0.290 |
| A | 1.81 | ±0.18 | 1.84 | ±0.18 | -0.03 | -0.30 / 0.24 | 0.810 | |
| C:N | OH | 20.26 | ±0.69 | 21.58 | ±0.50 | -1.31 | -0.10 / 0.12 | 0.160 |
| A | 21.25 | ±0.86 | 21.93 | ±0.98 | -0.68 | -3.19 / 1.83 | 0.570 | |
| P (mg/kg) | OH | 13.51 | ±1.47 | 16.40 | ±2.13 | -2.88 | -6.39 / 0.62 | 0.100 |
| A | 19.42 | ±0.27 | 15.20 | ±0.12 | -1.31 | -0.10 / 0.12 | 0.160 | |
| Al (mmol/kg) | OH | |||||||
| A | 84.76 | ±3.24 | 94.08 | ±1.77 | -9.32 | -17.51 / -1.13 | 0.020 | |
|
Mg (mg/kg) |
OH | 150.53 | ±6.81 | 171.46 | ±12.48 | -20.93 | -40.00 / -1.85 | 0.030 |
| A | 96.18 | ±6.44 | 77.99 | ±5.14 | 18.19 | 7.26 / 29.12 | 0.000 | |
| Ca (mg/kg) | OH | 571.94 | ±49.47 | 752.92 | ±75.04 | -180.97 | -301.80 / -60.10 | 0.000 |
| A | 408.51 | ±38.49 | 353.27 | ±28.63 | 55.24 | -32.01 / 142.49 | 0.200 | |
|
K (mg/kg) |
OH | 181.74 | ±19.22 | 185.25 | ±20.65 | -3.51 | -29.84 / 22.81 | 0.780 |
| A | 108.17 | ±10.86 | 94.59 | ±6.41 | 13.57 | -6.08 / 33.23 | 0.160 | |
3.2. Concentrations of in Norway Spruce Needles
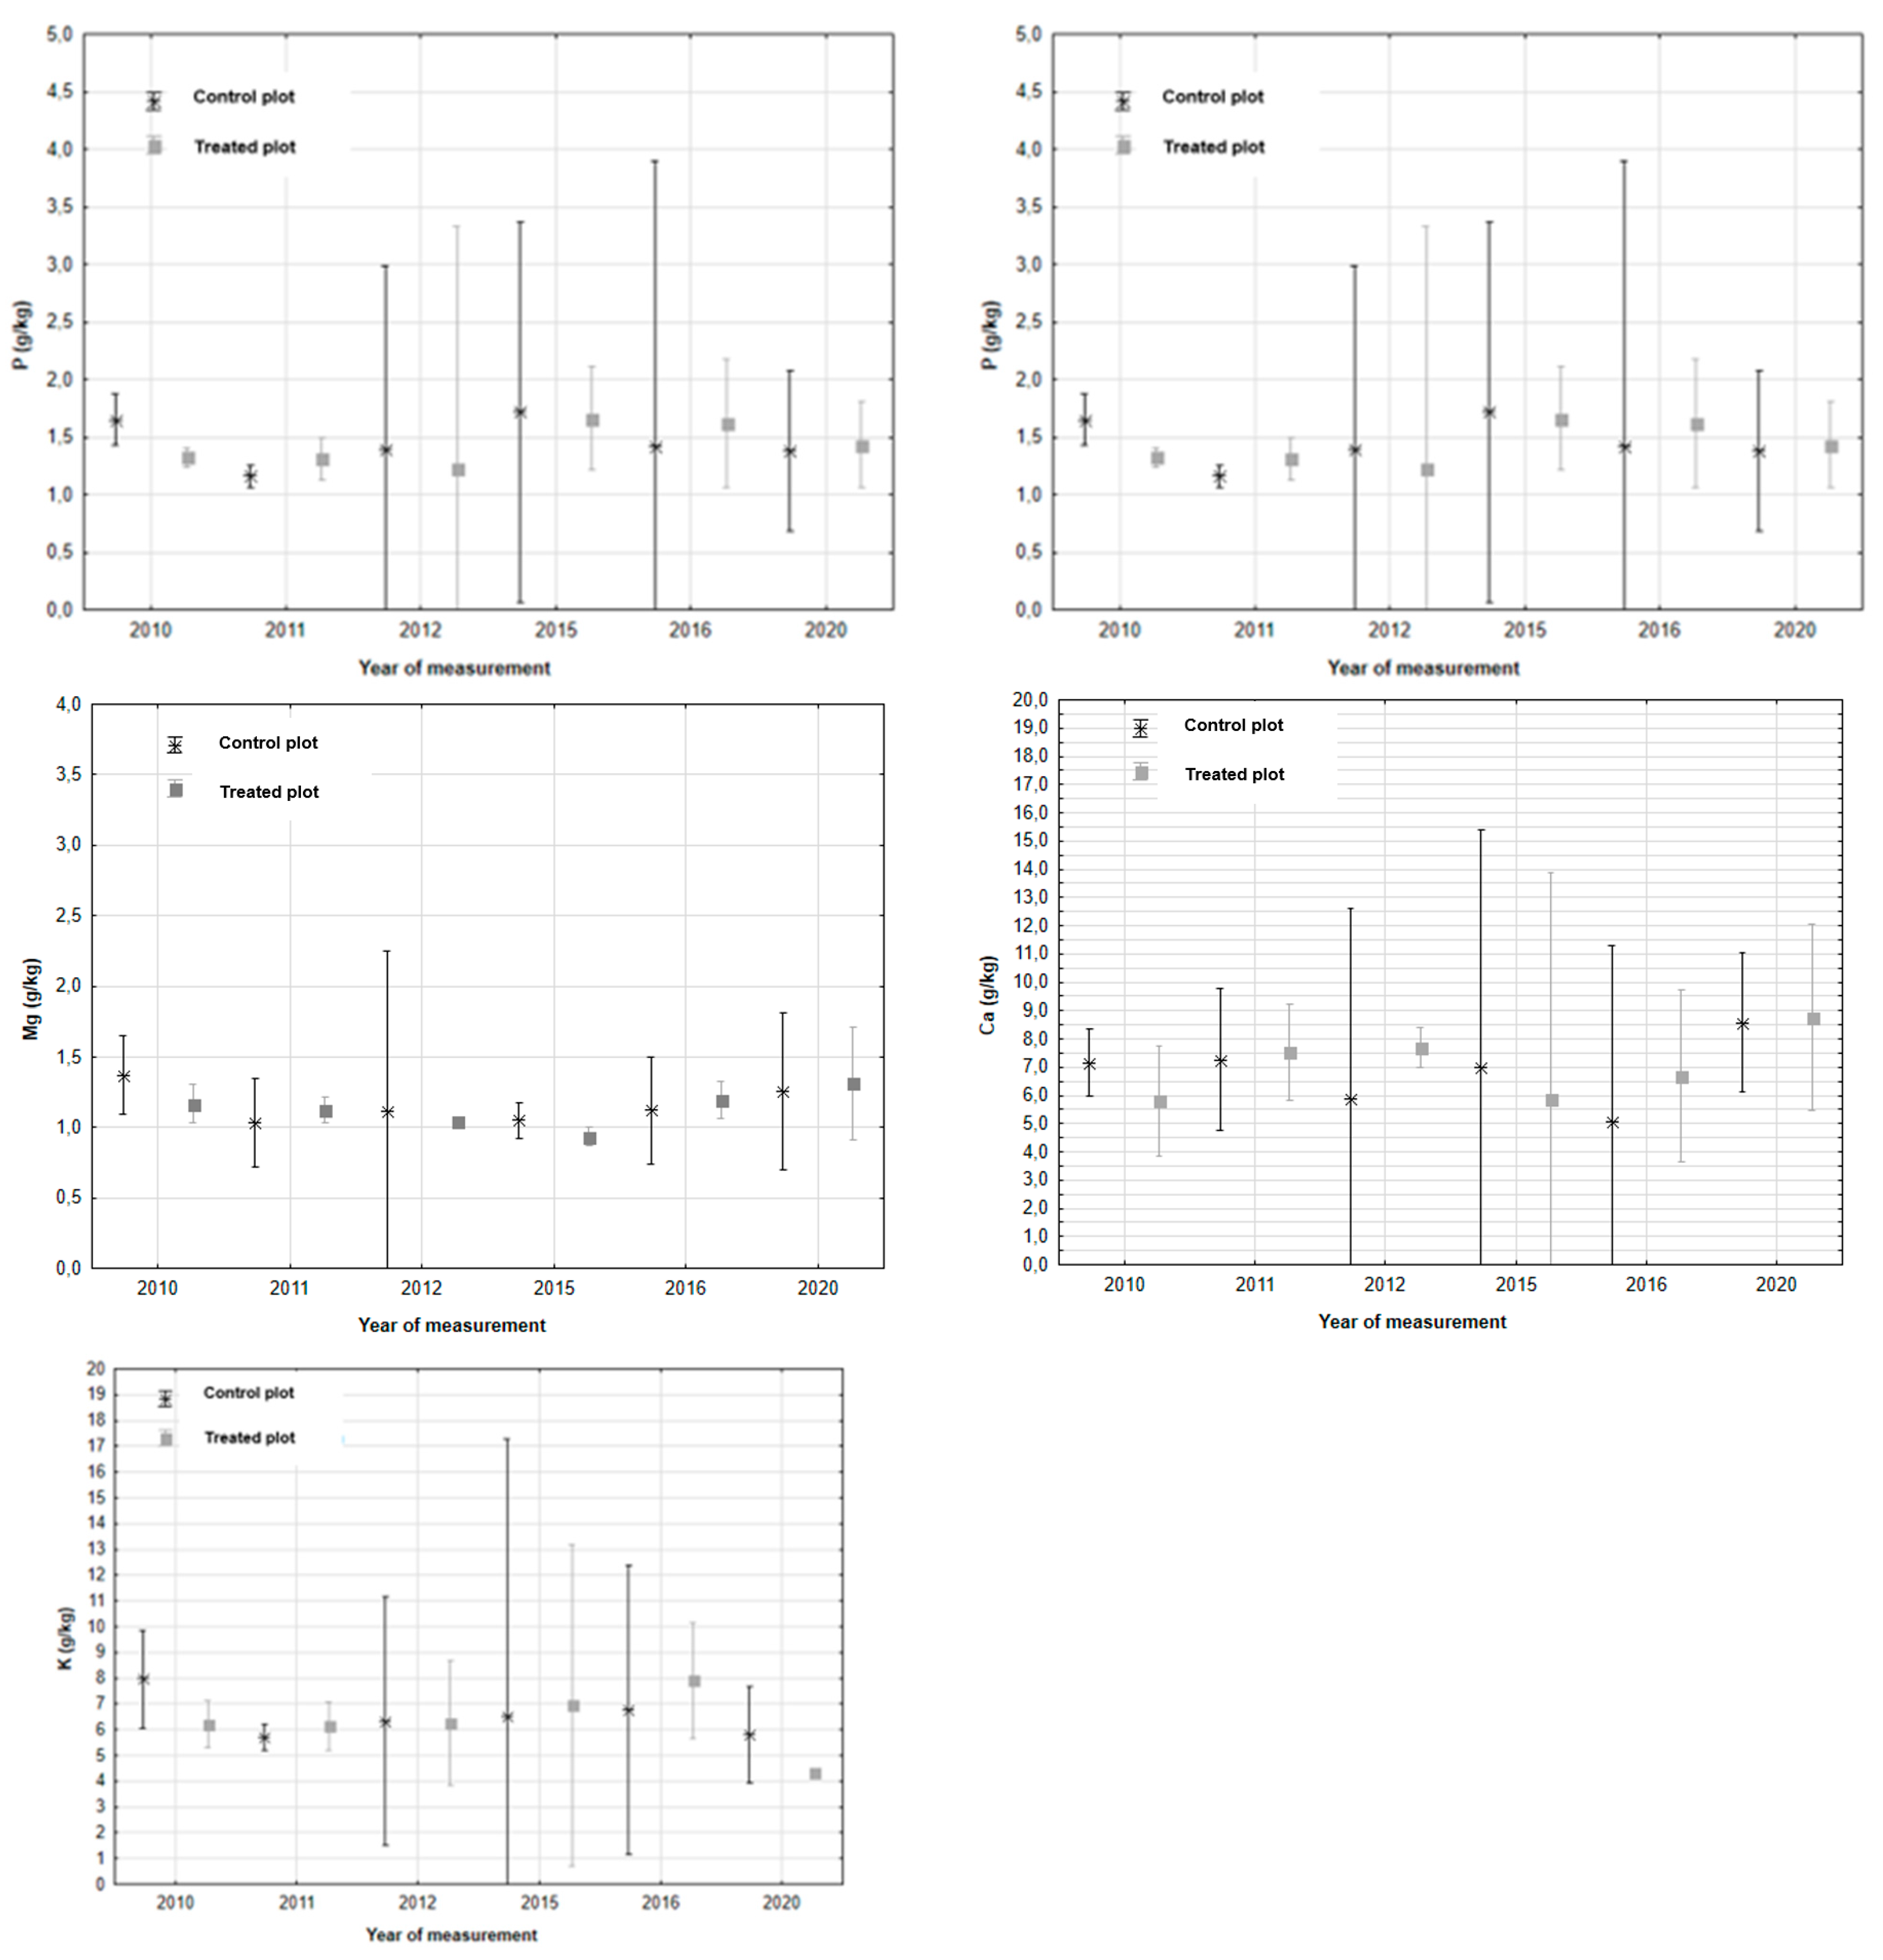
No statistically significant differences were found between the treated plot and the control plot in the concentrations of individual elements in the assimilation apparatus (Figure 3). Leaf nitrogen contents ranged between 1–1.5%. The average phosphorus content was 1.44 g·kg⁻¹; potassium contents ranged in between 6.0–6.5 g·kg⁻¹. Calcium averaged 7.5 g·kg⁻¹ Magnesium was present at an average of up to 1.3 g·kg⁻¹ and sulphur up to 0.9 g·kg⁻¹. The values indicate particularly high variability in the leaf nutrient contents during years 2012, 2015, and 2016.
Figure 4.
Concentrations of essential nutrients in Norway spruce needles in individual measurement years (2010–2012, 2015–2016, and 2020), expressed in the International System of Units (SI).
Figure 4.
Concentrations of essential nutrients in Norway spruce needles in individual measurement years (2010–2012, 2015–2016, and 2020), expressed in the International System of Units (SI).
3.3. Tree Biometric Parameters
Tree height on both plots increased continuously, but differences between treatments were not statistically significant (Table 3). As shown in Figure 5, the height increment in the control plot increased from 0.5 m to 1.0 m until 2015. In 2015, it dropped to 0.2 m, but in subsequent years it rose again and stabilized at around 0.6 m. In the treated plot, a higher increment was recorded in 2011 compared to the control plot (0.7 m); however, it remained constant until 2015 and then increased in 2016 to 1.4 m, after which it declined and stabilized at a lower value (0.5 m) than in the control plot.
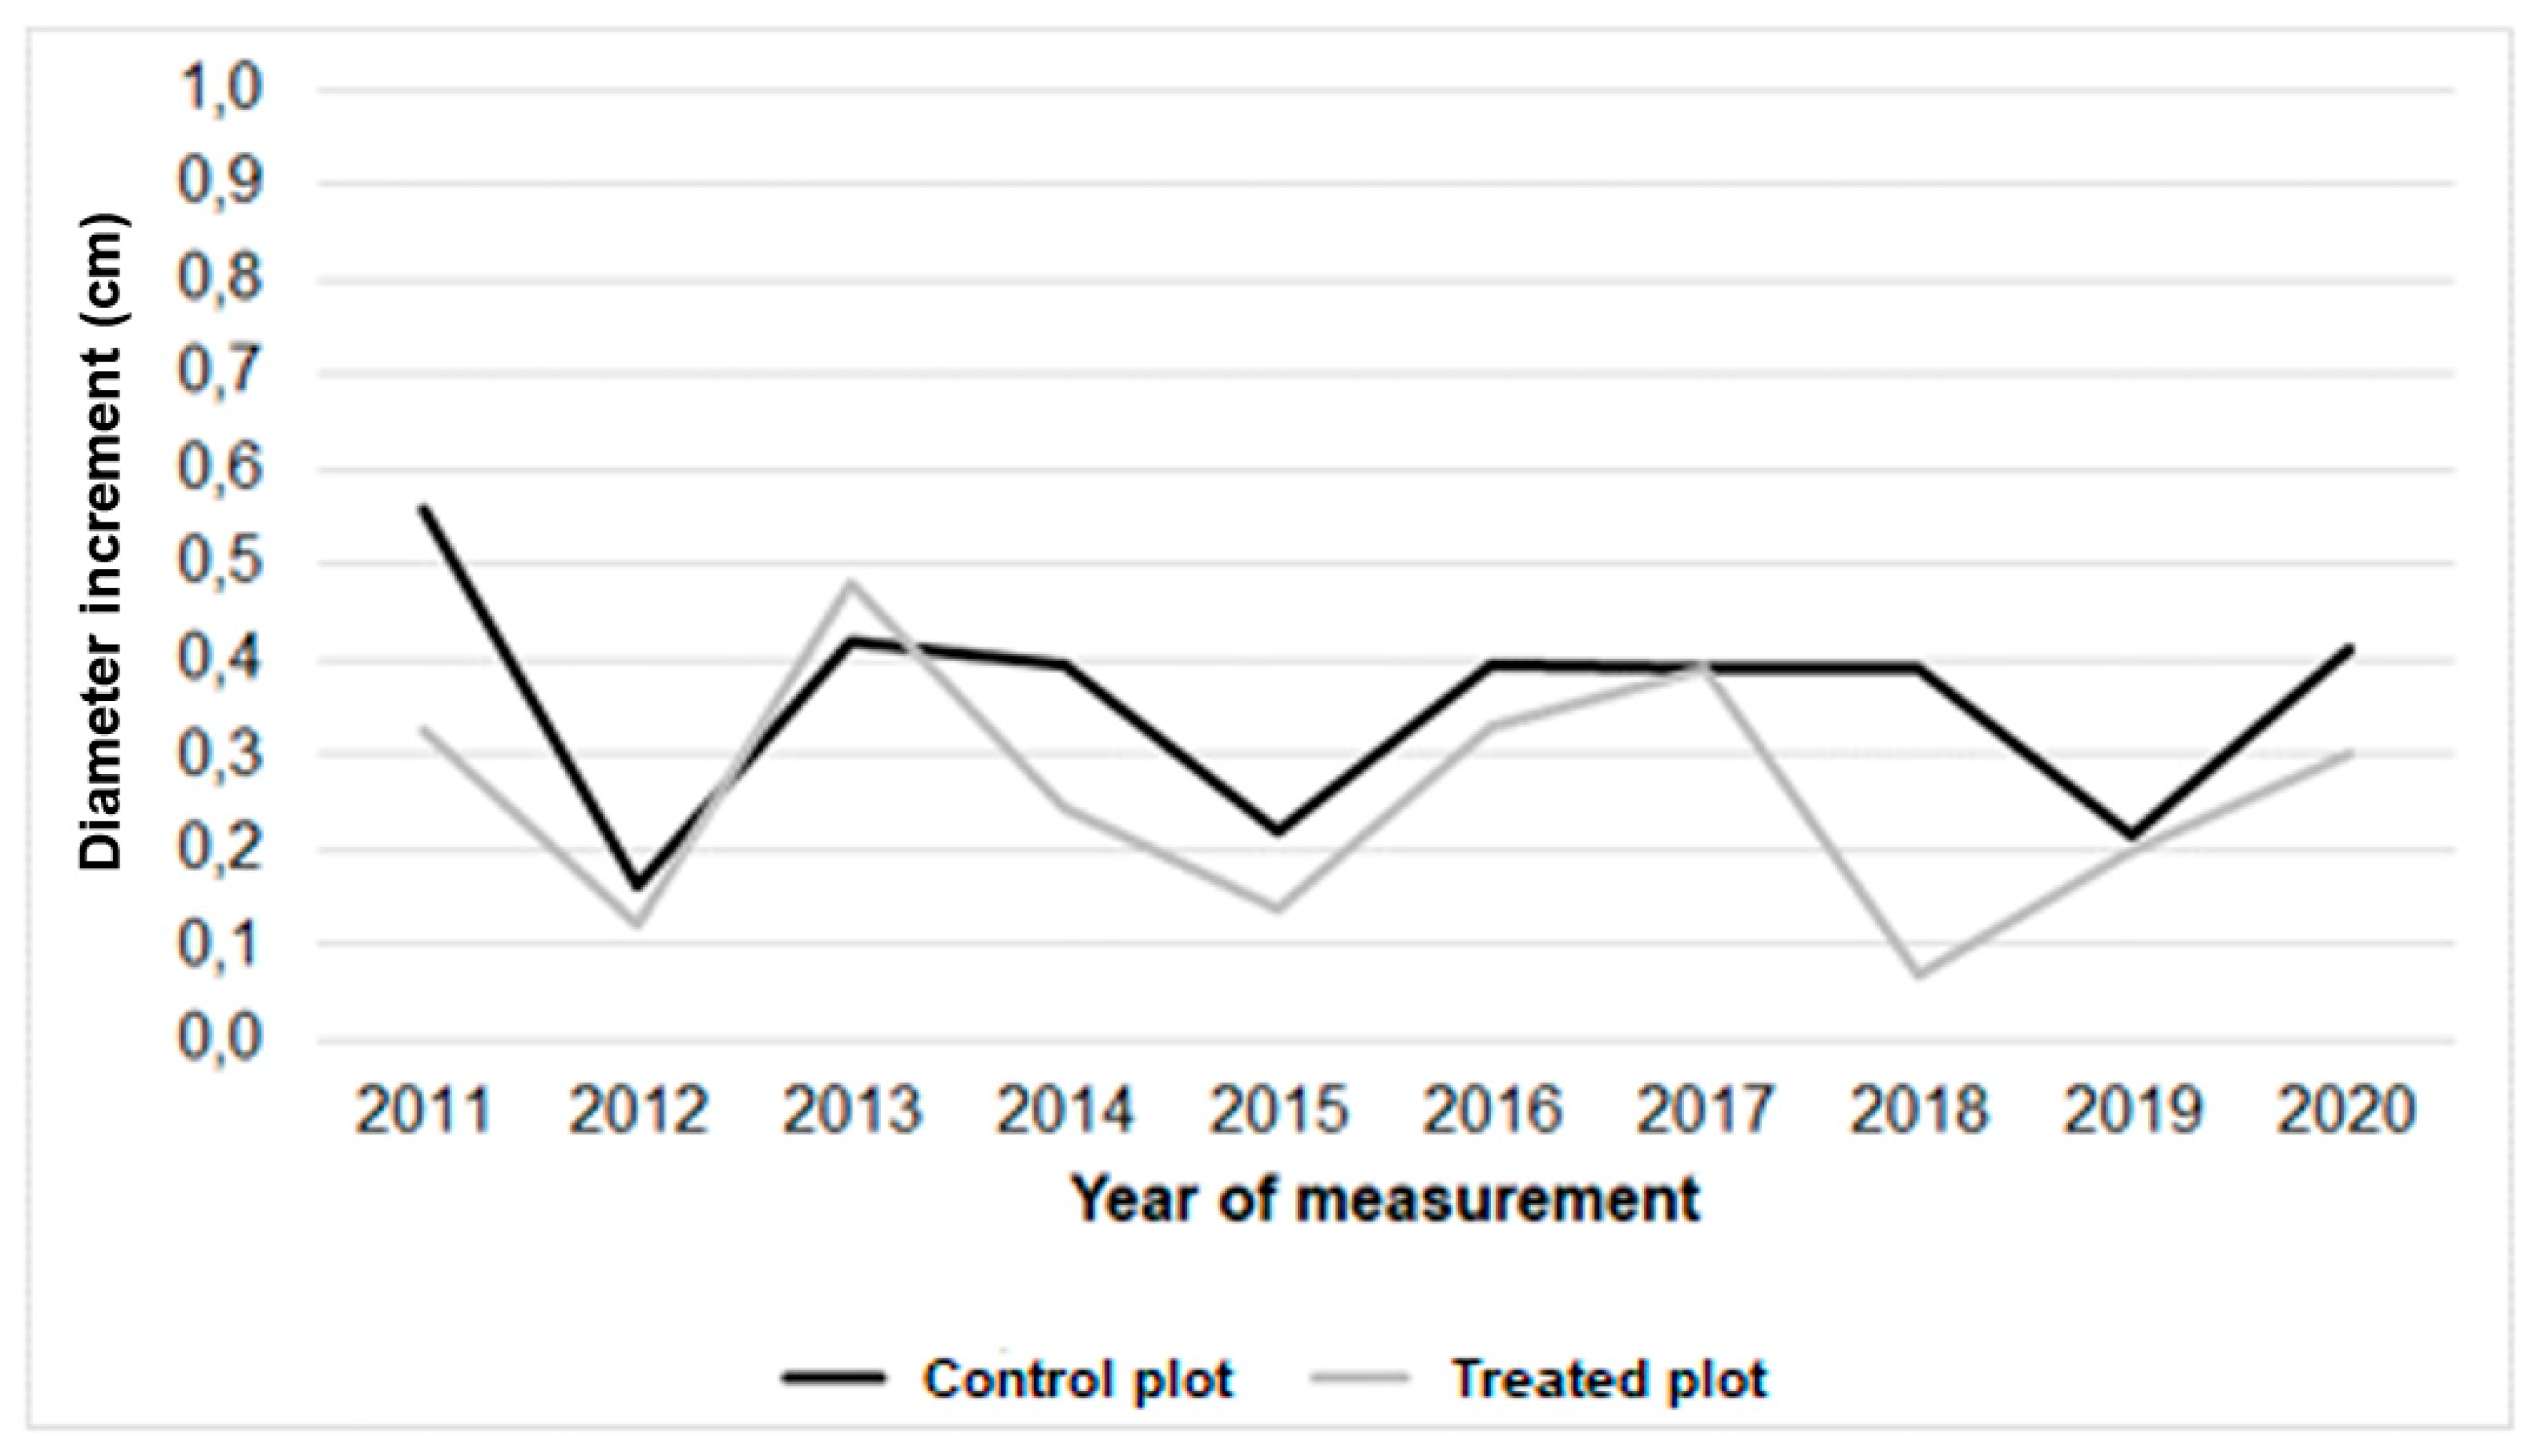
Tree diameter increased throughout the monitored period (Table 4), but no statistically significant differences were found between treatments (p > 0.05). Annual diameter increment (Fig. 6) showed clear inter-annual variability in both plots, with largely synchronous fluctuations over the 2011–2020 period. Markedly lower diameter increments were recorded in 2012, 2015, and 2018 compared to other years. The control plot generally maintained slightly higher or comparable increments relative to the treated plot, while the most notable divergence occurred in 2018, when the treated plot exhibited a pronounced reduction in radial growth. The reduction in diameter increment gain in the control area only became apparent later (in 2019) and was not as large. By 2020, increments in both plots converged again, indicating that treatment-related differences were minor compared to overarching year-to-year environmental variation.
Figure 6.
Annual diameter increment of Norway spruce in individual measurement years.
4. Discussion
The present study set out to evaluate how experimentally reduced rainfall influences both the chemical properties of soil and growth responses of Norway spruce within a monoculture established on a nutrient-rich site at lower elevations. In line with these objectives, we examined whether decreased rainfall would alter key soil parameters, particularly plant-available phosphorus, base cations (Ca, Mg, K), soil pH, and exchangeable Al concentrations in the upper soil layer. Furthermore, we assessed the extent to which rainfall reduction affects aboveground tree performance, including stem increment and needle nutrient status.
Our rainfall-reduction experiment produced clear shifts in several soil chemical properties, while effects on foliar nutrition and growth were comparatively muted. Despite the lack of treatment effects on the C/N ratio and plant-available P, the contrasting responses of base cations across horizons indicate a redistribution of nutrients under reduced soil moisture. Such drought-driven reorganization of nutrient mobility, surface desorption, and cation retention has been reported in coniferous systems exposed to prolonged water deficits, where altered soil solution chemistry and biological cycling reshape cation profiles over time [23].
Magnesium exemplified this vertical decoupling: available Mg declined in the O_H horizon of the treated plot but increased in the A horizon. Comparable patterns have been observed in drought-stressed spruce stands, where limited mineral dissolution and reduced plant uptake during dry spells shift nutrient maxima downward or generate transient accumulations at depth [23]. Calcium responses were similarly layered. Ca was significantly lower in the O_H horizon under rainfall reduction, consistent with the sensitivity of Ca to drought-enhanced leaching and curtailed biological recycling in nutrient-demanding spruce ecosystems. By contrast, the non-significant Ca differences in the A horizon suggest partial buffering from deeper supplies during moisture limitation—an effect also documented in declining spruce stands that tap sub-surface pools when topsoil stocks are insufficient [24].
A central outcome supporting H2 is the reduction of exchangeable Al in the upper soil layer of the treated plot. Although drying–rewetting sequences can momentarily acidify the soil solution and mobilize Al, multiple observations indicate that sustained drought tends to suppress mineral dissolution and thereby lowers Al availability in surface horizons. Our results fit this mechanism and imply that moisture limitation can transiently decrease Al mobility near the surface; however, longer monitoring is needed to determine whether this attenuation persists across multi-year drought cycles [25].
In contrast to the soil chemistry, foliar concentrations of N, P, K, Ca, Mg and S showed no treatment effect and remained within typical ranges for Norway spruce. This apparent stability of the assimilation apparatus under variable soil moisture is not unusual; the literature [26,27] shows that spruce often maintains foliar stoichiometry within species-specific bounds even as climate sensitivity of growth intensifies on dry sites and during hot summers. The pronounced year-to-year variability in 2012, 2015 and 2016 aligns with region-wide drought signals in Central Europe, when spruce growth becomes particularly sensitive to soil moisture deficits and elevated temperatures, suggesting that uptake and allocation dynamics likely fluctuated even if needle concentrations did not.
Soil moisture profiles corroborate that drought impacts were concentrated in the shallow layer (15 cm), where the treated plot frequently fell below 10% volumetric water content. Similar depth-dependent drying has been reported for spruce–fir forests, with strong depletions in near-surface horizons and comparatively stable moisture at 50–80 cm [28]. Species-specific canopy interception can further aggravate topsoil drying in evergreen stands by limiting winter recharge and accelerating spring depletion, a mechanism highlighted for Central European sites dominated by spruce [29]. These hydrologic constraints likely contributed to the cation shifts observed in the upper horizons [30].
Growth responses (height and diameter) did not differ statistically between treatments, although 2012, 2015 and 2018 showed clear reductions in increment. Such troughs coincide with well-documented drought intensification in Europe and with evidence that spruce growth responds strongly to warm, dry summers, particularly on drier soils [31]. Long-term manipulation studies also indicate that structural and physiological acclimation (e.g., stomatal regulation, photosynthetic adjustment) can buffer short-term growth penalties but may not fully offset repeated moisture stress, especially after cessation or reduction of watering [31]. Consequently, the absence of a simple treatment signal in our growth series likely reflects (i) the dominance of inter-annual climatic variability relative to the experimental reduction, and (ii) compensatory strategies such as deeper water extraction or root system plasticity.
Taken together, our results show that reduced rainfall measurably altered soil nutrient dynamics—most notably Mg, Ca, and exchangeable Al—while leaving foliar chemistry and growth largely unchanged at the time scale observed. This divergence underscores the need to integrate soil chemical indicators with tree-level physiological metrics when diagnosing drought effects in spruce monocultures, as drought responses emerge from coupled hydrological, chemical, and biological processes within the soil–plant continuum [32]. Moreover, the demonstrated role of site fertility—particularly base-cation status and vertical nutrient stratification—in modulating drought sensitivity supports calls to jointly evaluate climate and soil properties when projecting species performance under continued aridification. Sustained monitoring will be crucial to determine whether the observed reductions in exchangeable Al and the horizon-specific patterns of Ca and Mg persist, amplify, or reverse under recurrent moisture deficits.
5. Conclusions
Our experiment indicates that reduced rainfall primarily reorganizes near-surface soil chemistry in Norway spruce monocultures, while short-term effects on foliar nutrition and stand-level growth remain limited. The points below synthesize the main implications for ecosystem functioning and management under recurrent drought:
- Soil chemistry responded, trees less so: Reduced rainfall produced clear shifts in soil chemistry (Mg, Ca, exchangeable Al), whereas needle chemistry and growth showed only modest short-term responses.
- Vertical nutrient reshuffling: A horizon-specific redistribution of base cations was evident (declining Ca in the O_H horizon; contrasting Mg trends in O_H vs. A), highlighting the sensitivity of near-surface layers to drying.
- Lower exchangeable Al (H2 supported): Exchangeable Al decreased in the upper soil layer, suggesting a temporary reduction in Al mobility under moisture limitation.
- Foliar stoichiometry buffered: Needle nutrient concentrations did not differ significantly between treatments; interannual growth variability tracked regional dry years rather than the manipulation itself.
- Hydrologic driver near surface: The strongest drying occurred at 0–15 cm, with deeper layers more stable; surface desiccation is exacerbated by high spruce canopy interception.
- Management implications: Prioritize routine monitoring of Ca and Mg in the O_H and A horizons; combine soil chemical indicators with tree-level physiological metrics when diagnosing drought impacts.
- Future work: Extend monitoring of exchangeable Al and vertical Ca/Mg stratification, couple soil-solution chemistry with root distribution and hydraulics, and test responses across site fertilities and species mixtures.
Author Contributions
P.P., field data harvesting, data analysis and writing—original draft preparation; ;K.H., field data harvesting, writing; M.V., data analysis and writing; J.B., writing. All authors have read and agreed to the published version of the manuscript.
Funding
This work was funded from the IGA Grant No. LDF_VP_2021002–financial support by the Czech Republic Ministry of Education Youth and Sports.
Acknowledgments
We would like to thank to professor Mauer Oldřich for the long-term research and to pedologist Vavříček Dušan for conducting the soil sampling
Conflicts of Interest
The authors declare no conflict of interest.
References
- Tate, E.L.; Gustard, A. Drought Definition: A Hydrological Perspective. In Drought and Drought Mitigation in Europe; Advances in Natural and Technological Hazards Research; Vogt, J.V., Somma, F., Eds.; Springer: Dordrecht, The Netherlands, 2000; Vol. 14, pp. 23–48. [Google Scholar] [CrossRef]
- Ionita, M.; Nagavciuc, V.; Kumar, R.; Rakovec, O. On the curious case of the recent decade, mid-spring precipitation deficit in Central Europe. npj Climate and Atmospheric Science 2020, 3, 49. [Google Scholar] [CrossRef]
- O’Geen, A.T. Soil Water Dynamics. Nature Education Knowledge 2013, 4(5), 9. [Google Scholar]
- Hsu, H.; Dirmeyer, P.A. Soil moisture–evaporation coupling shifts into new gears under increasing CO₂. Nature Communications 2023, 14, 1398. [Google Scholar] [CrossRef]
- Vinš, B.; et al. Dopady možné změny klimatu na lesy v České republice: Územní studie změny klimatu pro Českou republiku. In Element 2; Český hydrometeorologický ústav: Praha, Czech Republic, 1996. [Google Scholar]
- Nihlgård, B. Plant Biomass, Primary Production and Distribution of Chemical Elements in a Beech and a Planted Spruce Forest in South Sweden. Oikos 1972, 23, 68–91. [Google Scholar] [CrossRef]
- Jost, G.; Schume, H.; Hager, H. Factors controlling soil water-recharge in a mixed European beech (Fagus sylvatica L.)–Norway spruce (Picea abies (L.) Karst.) stand. European Journal of Forest Research 2004, 123, 93–104. [Google Scholar] [CrossRef]
- García-Palacios, P.; Prieto, I.; Ourcival, J.M.; Hättenschwiler, S. Disentangling the litter quality and soil microbial contribution to leaf and fine root litter decomposition responses to reduced rainfall. Ecosystems 2016, 19, 490–503. [Google Scholar] [CrossRef]
- De Deyn, G.B.; Kooistra, L. The role of soils in habitat creation, maintenance and restoration. Philosophical Transactions of the Royal Society B 2021, 376(1834), 20200170. [Google Scholar] [CrossRef] [PubMed]
- Yang, B.; Yang, Z.; He, K.; Zhou, W.; Feng, W. Soil Fungal Community Diversity, Co-Occurrence Networks, and Assembly Processes under Diverse Forest Ecosystems. Microorganisms 2024, 12, 1915. [Google Scholar] [CrossRef] [PubMed]
- Borken, W.; Davidson, E.A.; Savage, K.; Gaudinski, J.; Trumbore, S.E. Drying and wetting effects on carbon dioxide release from organic horizons. Soil Science Society of America Journal 2003, 67, 1888–1896. [Google Scholar] [CrossRef]
- Manghabati, H.; Weis, W.; Göttlein, A. Importance of soil extractable phosphorus distribution for mature Norway spruce nutrition and productivity. European Journal of Forest Research 2018, 137, 631–642. [Google Scholar] [CrossRef]
- Niederberger, J.; Kohler, M.; Bauhus, J. Distribution of phosphorus fractions with different plant availability in German forest soils and their relationship with common soil properties and foliar P contents. SOIL 2019, 5, 189–204. [Google Scholar] [CrossRef]
- Novák, J.; Slodičák, M.; Dušek, D. Akumulace humusu a živin pod mladými porosty smrku ztepilého v ochranném pásmu vodních zdrojů v Krušných horách. Zprávy lesnického výzkumu (Reports of Forestry Research) 2009, 54(Special), 37–42. [Google Scholar]
- Hofmeister, J.; Oulehle, F.; Krám, P.; et al. Loss of nutrients due to litter raking compared to the effect of acidic deposition in two spruce stands, Czech Republic. Biogeochemistry 2008, 88, 139–151. [Google Scholar] [CrossRef]
- Jandl, R.; Alewell, C.; Prietzel, J. Calcium loss in Central European forest soils. Soil Science Society of America Journal 2004, 68(2), 588–595. [Google Scholar] [CrossRef]
- IUSS Working Group WRB. World Reference Base for Soil Resources. In ternational Soil Classification System for Naming Soils and Creating Legends for Soil Maps, 4th ed.; International Union of Soil Sciences (IUSS): Vienna, Austria, 2022; ISBN 979-8-9862451-1-9. [Google Scholar]
- Göhler, F. Arbeitsanleitung für die chemische Schnelluntersuchung und die Ergänzung von Nährlösungen der erdelosen Kultur im Produktionsbetrieb; 1960; Volume Band 8, Heft 6, p. 419. [Google Scholar] [CrossRef]
- Mehlich, A. New extractant for soil test evaluation of phosphorus, potassium, magnesium, calcium, sodium, manganese and zinc. Communications in Soil Science and Plant Analysis 1978, 9(6), 477–492. [Google Scholar] [CrossRef]
- Agrokhimicheskie metody issledovaniya pochv [Agrochemical Methods of Soil Research]; Sokolov, A.V., Askinazi, D.L., Eds.; Nauka: Moscow, Russia, 1965. [Google Scholar]
- Walkley, A.; Black, I.A. An examination of the Degtjareff method for determining soil organic matter and a proposed modification of the chromic acid titration method. Soil Science 1934, 37(1), 29–38. [Google Scholar] [CrossRef]
- Kjeldahl, J. Neue Methode zur Bestimmung des Stickstoffs in organischen Körpern. Zeitschrift für Analytische Chemie 1883, 22, 366–382. [Google Scholar] [CrossRef]
- Griesbauer, H.; DeLong, S.C.; Rogers, B.; Foord, V. Growth sensitivity to climate varies with soil moisture regime in spruce–fir forests in central British Columbia. Trees 2021, 35, 649–669. [Google Scholar] [CrossRef]
- Jamnická, G.; Fleischer, P., Jr.; Konôpková, A.; Pšidová, E.; Kučerová, J.; Kurjak, D.; Živčák, M.; Ditmarová, Ľ. Norway Spruce (Picea abies L.) Provenances Use Different Physiological Strategies to Cope with Water Deficit. Forests 2019, 10, 651. [Google Scholar] [CrossRef]
- Ogaya, R.; Peñuelas, J. Climate Change Effects in a Mediterranean Forest Following 21 Consecutive Years of Experimental Drought. Forests 2021, 12, 306. [Google Scholar] [CrossRef]
- Jevšenak, J.; Tychkov, I.; Gričar, J.; Levanič, T.; Tumajer, J.; Prislan, P.; Arnič, D.; Popkova, M.; Shishov, V.V. Growth-limiting factors and climate response variability in Norway spruce (Picea abies L.) along an elevation and precipitation gradients in Slovenia. International Journal of Biometeorology 2021, 65, 311–324. [Google Scholar] [CrossRef]
- Qin, H.; Jiao, L.; Zhou, Y.; Wu, J.; Che, X. Elevation affects the ecological stoichiometry of Qinghai spruce in the Qilian Mountains of northwest China. Frontiers in Plant Science 2022, 13, 917755. [Google Scholar] [CrossRef]
- Kiil, A.D. Distribution of Moisture in Spruce–Fir Duff and Its Relevance to Fire Danger Rating; Internal Report No. A-34; Forest Research Laboratory, Canadian Forestry Service: Edmonton, AB, Canada, 1970. [Google Scholar]
- Jančo, M.; Mezei, P.; Kvas, A.; Danko, M.; Sleziak, P.; Minďáš, J.; Škvarenina, J. Effect of mature spruce forest on canopy interception in subalpine conditions during three growing seasons. Journal of Hydrology and Hydromechanics 2021, 69, 1–14. [Google Scholar] [CrossRef]
- Sun, G.; Domec, J.-C.; Amatya, D.M. Forest evapotranspiration: Measurement and modelling at multiple scales. In Forest Evapotranspiration: Measurement and Modelling at Multiple Scales; USDA Forest Service, 2011; pp. 31–70. [Google Scholar]
- Rukh, S.; Poschenrieder, W.; Heym, M.; Pretzsch, H. Drought Resistance of Norway Spruce (Picea abies [L.] Karst) and European Beech (Fagus sylvatica [L.]) in Mixed vs. Monospecific Stands and on Dry vs. Wet Sites. From Evidence at the Tree Level to Relevance at the Stand Level. Forests 2020, 11, 639. [Google Scholar] [CrossRef]
- Kuželková, M.; Jačka, L.; Kovář, M.; Hradilek, V.; Máca, P. Tree trait–mediated differences in soil moisture regimes: A comparative study of beech, spruce, and larch in a drought-prone area of Central Europe. Research Square (preprint) 2023. [Google Scholar] [CrossRef]
Figure 3.
Volumetric soil water content in the control plot (grey) and in the treated plot (black) during the monitored period 2011–2020.
Figure 3.
Volumetric soil water content in the control plot (grey) and in the treated plot (black) during the monitored period 2011–2020.
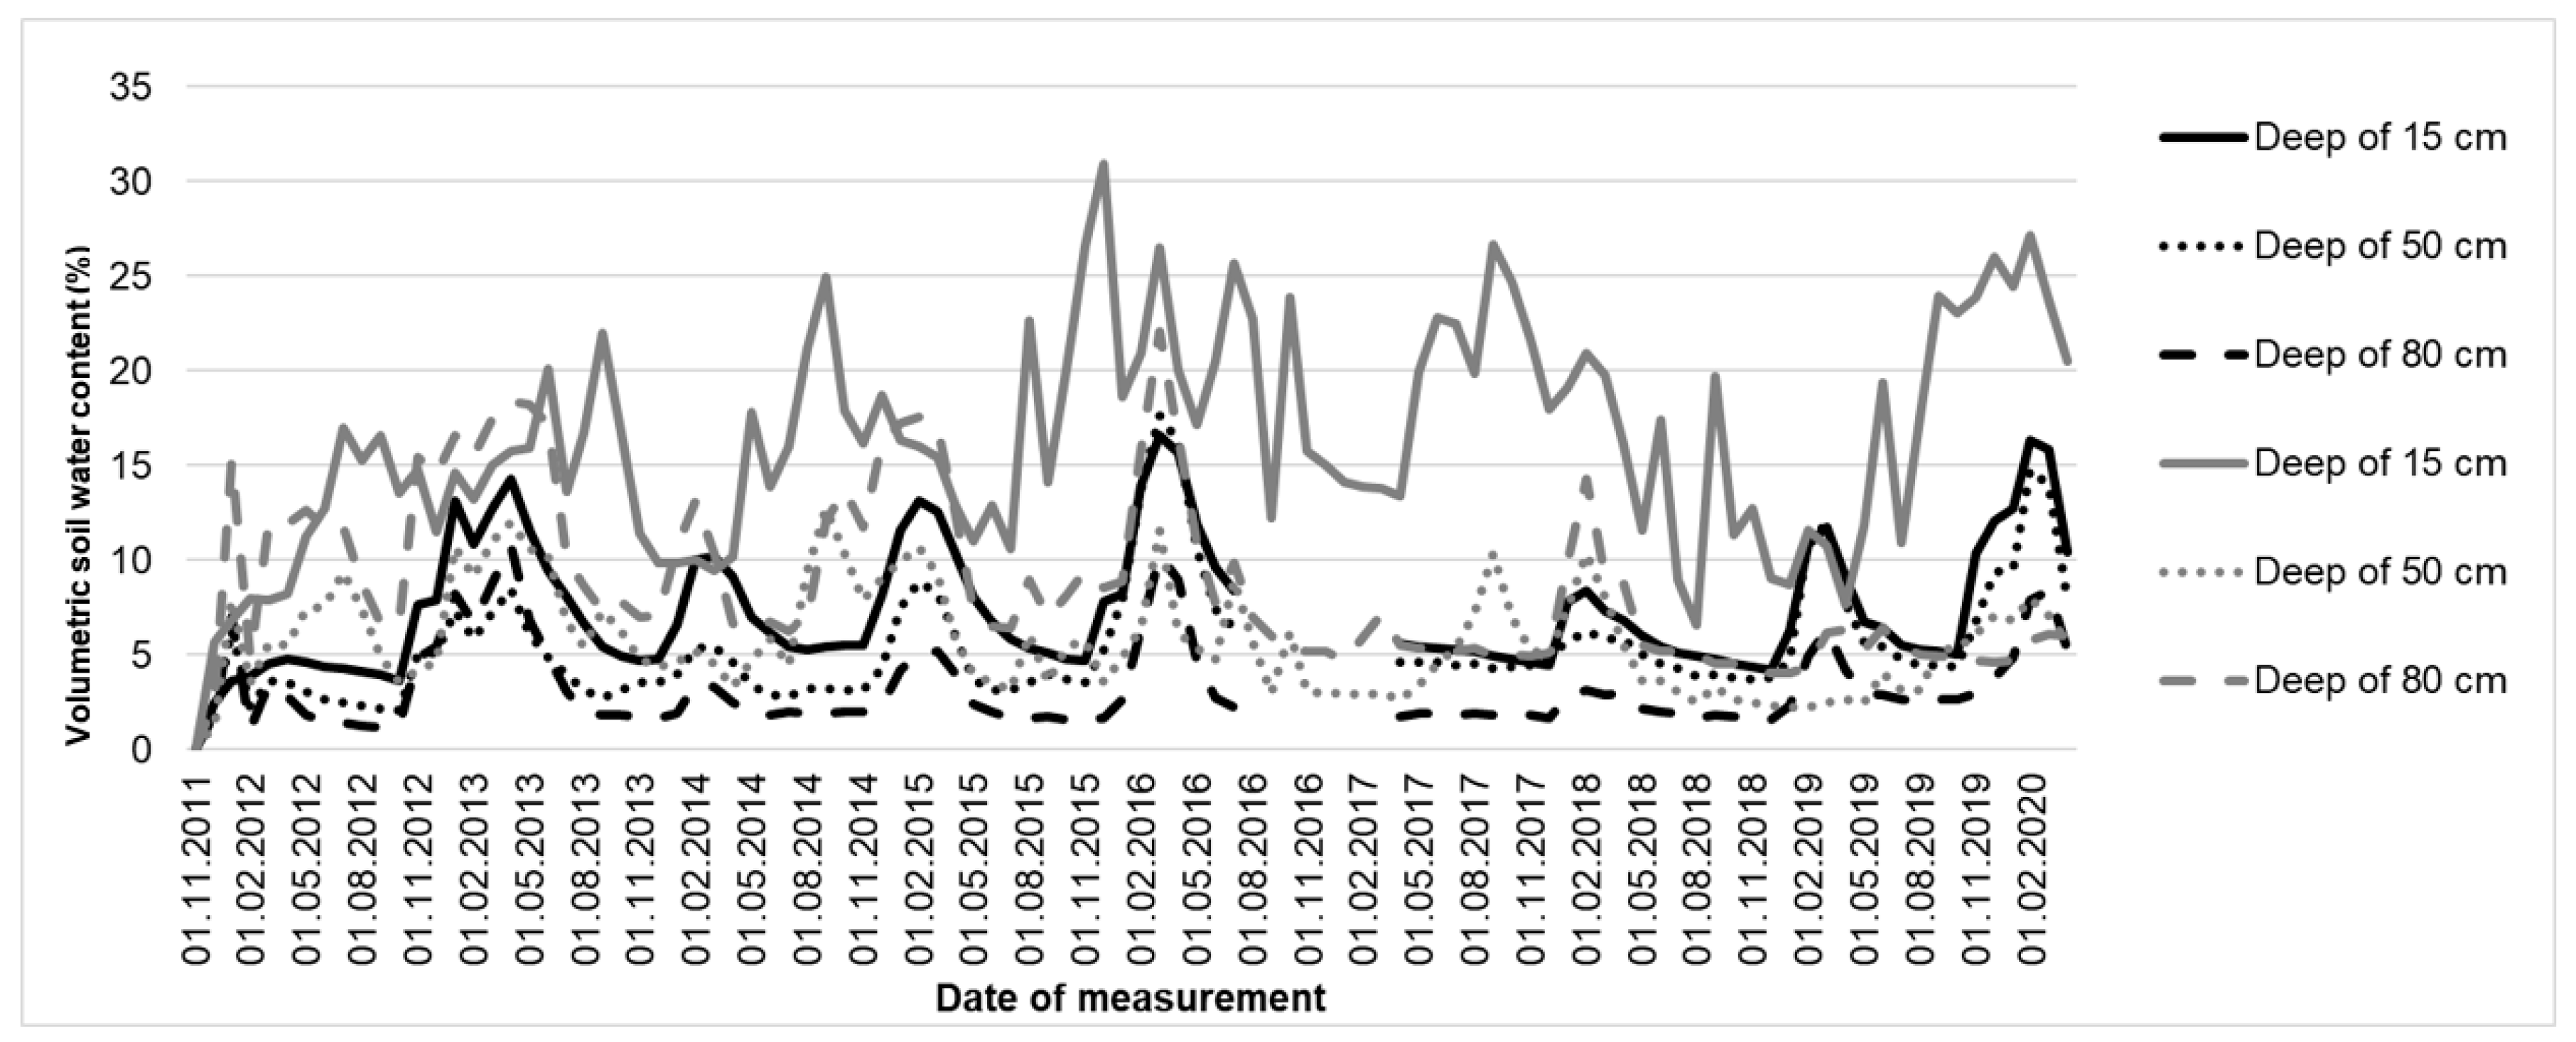
Figure 5.
Annual height increment of Norway spruce in individual measurement years.
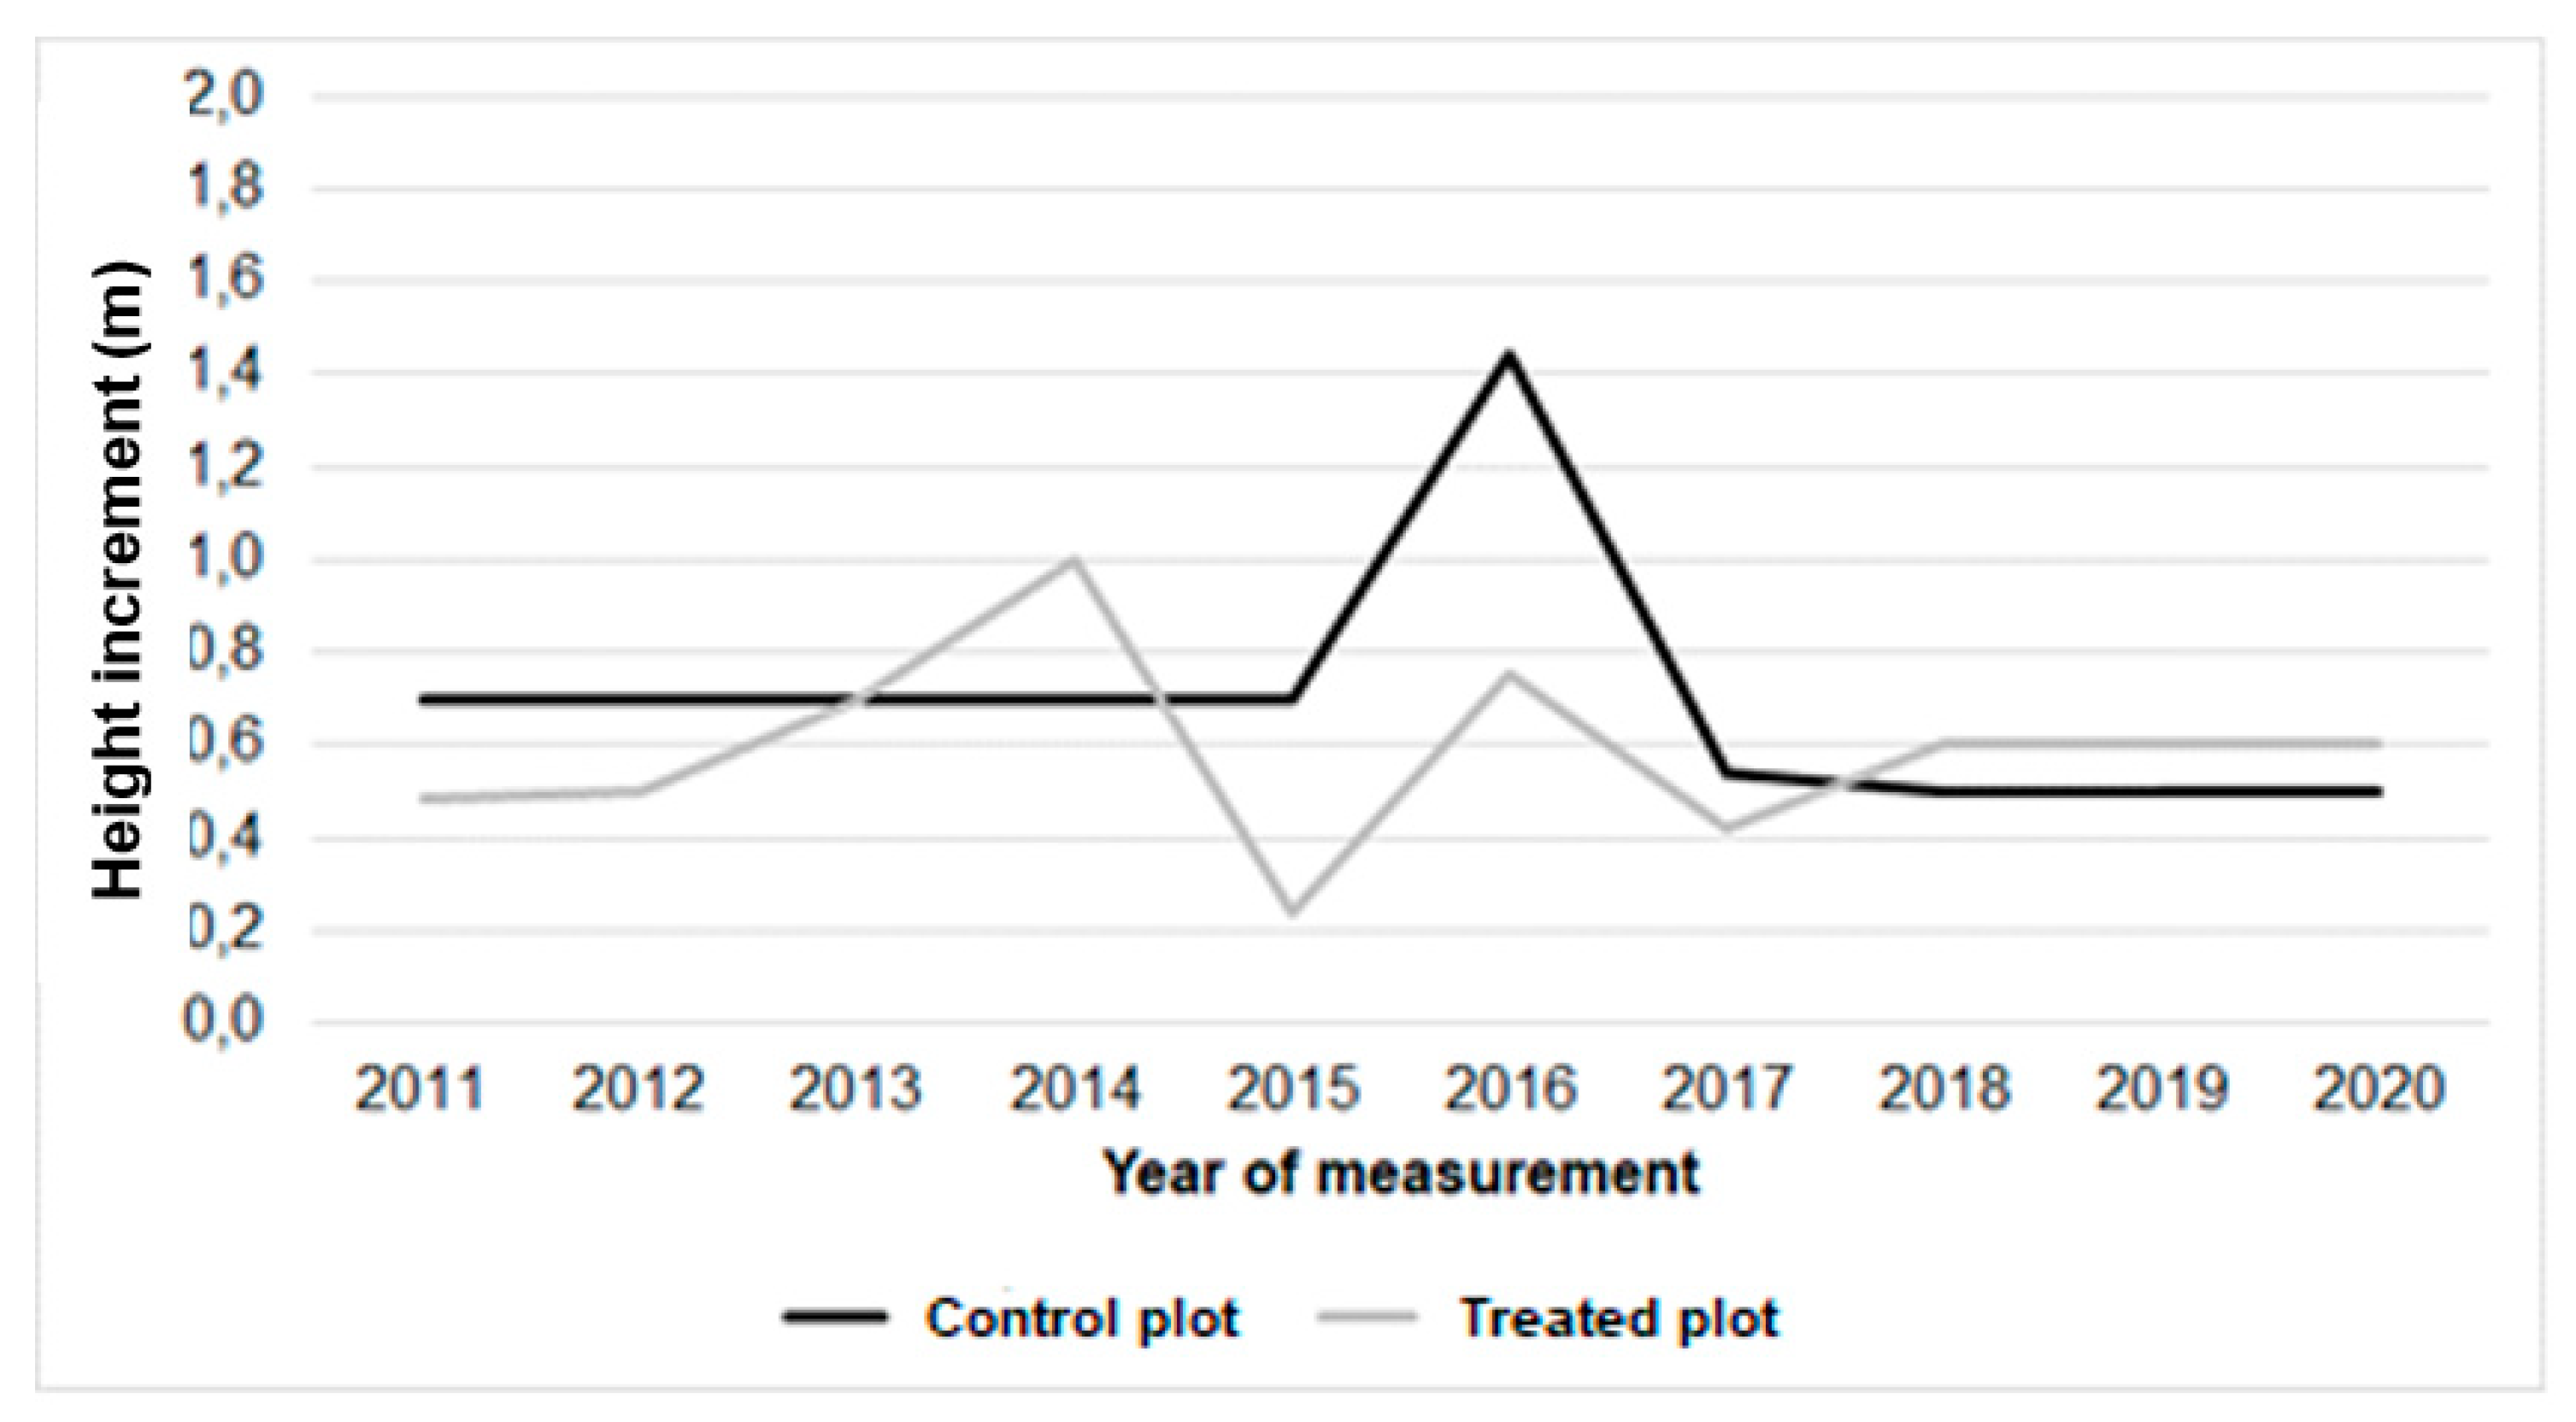
Table 3.
Average heights of the aboveground parts of Norway spruce in individual measurement years (± standard deviation).
Table 3.
Average heights of the aboveground parts of Norway spruce in individual measurement years (± standard deviation).
| Height of above ground part (m) in | |||||||||||
|---|---|---|---|---|---|---|---|---|---|---|---|
| Variant/ year | 2010 | 2011 | 2012 | 2013 | 2014 | 2015 | 2016 | 2017 | 2018 | 2019 | 2020 |
| Control plot | 13,97±2,5 | 14,67±3,5 | 15,37±2,5 | 16,07±2,1 | 16,77±2,3 | 17,47±2,4 | 18,91±3,2 | 19,45±1,2 | 19,95±3,2 | 20,45±3,4 | 20,95±2,7 |
| Treated plot | 15,05±2,7 | 15,53±4,6 | 16,03±3,2 | 16,73±2,7 | 17,73±2,7 | 17,97±2,7 | 18,72±2,1 | 19,14±2,4 | 19,74±4,1 | 20,34±2,7 | 20,94±2,3 |
Table 4.
Average diameters of Norway spruce in individual measurement years (± standard deviation).
| Diameter (cm) in | |||||||||||
| Variant/ year | 2010 | 2011 | 2012 | 2013 | 2014 | 2015 | 2016 | 2017 | 2018 | 2019 | 2020 |
| Control plot | 13,63±3,3 | 13,75±3,4 | 14,47±3,8 | 14,89±3,7 | 15,32±3,8 | 15,51±3,9 | 15,95±4,1 | 16,29±3,7 | 16,68±3,2 | 16,90±3,5 | 17,70±3,2 |
| Treated plot | 14,30±3,6 | 14,33±3,6 | 14,78±4,3 | 15,26±3,9 | 15,52±4,1 | 15,62±4,1 | 16,03±4,3 | 16,37±4,1 | 16,30±3,9 | 16,50±3,7 | 16,80±4,2 |
Disclaimer/Publisher’s Note: The statements, opinions and data contained in all publications are solely those of the individual author(s) and contributor(s) and not of MDPI and/or the editor(s). MDPI and/or the editor(s) disclaim responsibility for any injury to people or property resulting from any ideas, methods, instructions or products referred to in the content. |
© 2026 by the authors. Licensee MDPI, Basel, Switzerland. This article is an open access article distributed under the terms and conditions of the Creative Commons Attribution (CC BY) license (http://creativecommons.org/licenses/by/4.0/).
Copyright: This open access article is published under a Creative Commons CC BY 4.0 license, which permit the free download, distribution, and reuse, provided that the author and preprint are cited in any reuse.


