Submitted:
24 February 2026
Posted:
26 February 2026
You are already at the latest version
Abstract
X-ray imaging of dense breasts and breast implants often suffers from reduced lesion visibility due to strong attenuation, while conventional rhodium (Rh) K-edge filtering typically suppresses high-energy photons. This study presents a Monte Carlo-based simulation and optimization framework for spectroscopic mammography using a voxelated Cadmium Telluride (CdTe) sensor, enabling quantitative evaluation of energy-dependent image quality. The system accurately simulates sensor fluorescence and inter-voxel energy redistribution, enabling direct comparability with real-world performance. Energy-resolved simulations in the 10-50 keV range were used to compute spectroscopic contrast-to-noise ratio (CNR) curves and identify optimal spectral regions and filter configurations. Replacing the standard Rh filter with aluminum (Al) filtration increased CNR by more than 23% with only a ~5% increase in entrance surface dose (ESD), significantly improving the visibility of hydroxyapatite microcalcifications, even behind dense tissue or implants. The shown work demonstrates practical guidelines and analysis for energy-resolved imaging optimizations obtained from simulations. The results imply that spectroscopic photon-counting detectors and methods can enhance dense-breast mammography image quality while maintaining low patient dose.
Keywords:
Monte Carlo
; mammography
; spectroscopic X-ray imaging
; photon-counting detector
; Cadmium Telluride
; implants
; spectrum optimization
; contrast-to-noise ratio
1. Introduction
The goal of mammography is the early detection of breast cancer precursors by screening for microscopic calcifications (named here as specks) composed of Calcium Hydroxyapatite (HA) [1,2]. X-ray mammography has demonstrated strong clinical performance for identifying early-stage breast cancer over the past decades [3]. However, the high X-ray absorption due to heterogeneously distributed dense tissue morphologies, or the presence of breast implants, limits image quality and reduces lesion visibility, leading to decreased detection sensitivity. This ultimately leads to both false positives and false negatives in diagnosis, and limits the diagnostic performance for women with breast implants [4] or with highly dense breasts [5].
Imaging of dense breasts remain particularly challenging despite technological achievements. This limitation is clinically relevant because women with dense breasts have an elevated cancer risk, and more than 50% of women under 50 years old exhibit high mammographic density [6,7,8,9]. Increased attenuation reduces contrast between lesions and surrounding tissues, often requiring higher radiation exposure to maintain image quality. Alternative modalities, such as digital breast tomosynthesis, MRI, ultrasound, and molecular breast imaging, have been proposed; however, these approaches involve higher costs, longer acquisition times, or limited accessibility [10]. Consequently, ultrasound is often used as an adjunct to mammography to improve detection rates [11,12].
Breast augmentation surgery has also become increasingly common. It is estimated that 35 million women worldwide have breast implants [13], and recent reports indicate a continued growth in cosmetic breast procedures [14]. Implants significantly attenuate X-rays due to their high silicon content, obscuring between 22% and 83% of the glandular tissue. Although specialized displacement techniques exist to improve visualization [15], these procedures are technically challenging, increase radiation exposure, and may elevate the risk of implant damage [16]. As a result, screening mammography may miss a substantially higher proportion of cancers in women with implants compared to women without augmentation [17].
Given the large population of patients with dense or augmented breasts, optimizing mammographic imaging for these conditions is of practical importance. Simply increasing the dose is not desirable due to radiation risk. Therefore, alternative detector technologies and spectrum optimization strategies are required to enhance contrast while maintaining low dose.
From a technological perspective, conventional mammography systems employ charge-integrating flat-panel detectors and K-edge filtering to tailor the emitted spectrum to detector characteristics. However, the high-energy spectral tail can degrade image quality in charge-integrating systems because higher-energy photons contribute disproportionately to the collected charge, reducing dynamic range and lesion contrast. Photon-counting detectors (PCDs) mitigate this challenge by assigning equal weight to each detected photon, independent of energy. When combined with high-efficiency sensor materials, PCDs can exploit higher-energy photons to improve visibility through dense tissue and implants [18]. Spectroscopic photon-counting detectors (SPCDs), such as Timepix3 [19], additionally measure photon energy, enabling energy-resolved imaging and spectral optimization.
Previous studies have demonstrated that CdTe-based photon-counting detectors can improve image quality and potentially reduce radiation dose in mammography [20,21,22,23]. Earlier implementations using strip detectors and scanning geometries also indicated dose reductions [24], while simulation studies suggested further improvements through energy-resolved imaging and material decomposition [25]. These results highlight the potential of energy-resolved photon-counting technology for enhancing mammographic performance and have motivated ongoing industrial development of next-generation systems [26,27,28,29].
The present work investigates the feasibility of X-ray spectrum optimization using a CdTe spectroscopic photon-counting detector to increase mammographic contrast while maintaining patient dose. The study simulates and confirms radiation-matter interactions in its influence on imaging quality, and experimentally verifies simulation results in a challenging implant imaging scenario. Detailed Monte Carlo simulations of a standard mammographic setup were performed in the 10-50 keV range using clinically relevant spectra with aluminum (Al) and rhodium (Rh) filtration. Image quality was assessed using energy-resolved CNR calculations. Dense breast phantoms containing microcalcifications ranging from 49.5 μm to 445.5 μm were designed for imaging, emulating designs of accreditation phantoms such as CIRS015 [30]. Finally, preliminary experimental results with modified spectra are presented to evaluate the benefit of preserving the high-energy spectral tail. The objective is to demonstrate that imaging tasks exploiting the energy-dependent nature of all aspects of X-ray imaging, can improve visibility of high-density structures while maintaining low radiation dose.
2. Materials and Methods
2.1. Contrast-to-Noise Ratio (CNR) - Definition and Analytical Model
The CNR was selected as the figure of merit for image quality evaluation, as it incorporates both HA contrast, governed by material attenuation properties, and the statistical noise associated with background photon detection. A reduction in CNR directly corresponds to a decreased speck visibility. CNR is defined in terms of the normalized contrast (), and the coefficient of variation ():
where and are the mean pixel intensities in the signal and background regions, respectively, and is the standard deviation of background pixel intensities.
An analytical model for CNR was constructed as a theoretical reference for validating Monte Carlo results. The model expresses and using the Beer-Lambert Law [31], and assumes Poisson statistics for photon detection with an ideal noiseless detector. For an intensity, measured in incident number of photons over the sample entrance surface, the expected number of photons detectable behind the sample’s background region is:
where is the breast tissue thickness and is the corresponding linear attenuation coefficient. For a region containing an HA inclusion of thickness and attenuation coefficient , the expected number of detectable photons in the signal region becomes:
Assuming Poisson-limited noise, and . Combining these expressions leads to an energy-dependent CNR in the monoenergetic limit:
Here "spectroscopic" means that the CNR is a function of the incident photon energy, and detection (and imaging) can be deconstructed into energy bins that discretize the detected continuous polychromatic spectrum. Material attenuation coefficients were computed using homogeneous compound mixing based on mass-attenuation coefficients and densities from the NIST X-ray attenuation database [32].
The model does not include readout electronics and assumes that quantum noise dominates, which is a reasonable approximation for photon counting detectors that operate with energy thresholds that substantially suppress electronic noise [22]. In addition, flat-field corrections compensate for fixed-pattern and structural gain variations between pixels [35], so quantum (Poisson) noise becomes the dominant noise source. Accordingly, the mathematical model assumes for the background counts.
When applied to a pixelated detection system, the final value of CNR as defined in Equation (4) will be proportional to the ratio of areas between sample and background, as each region detects only a fraction of the total amount of photons . This consideration also becomes important when estimating the minimum required number of simulated photons to achieve high-quality results.
2.2. Mammography X-Ray Spectra
Four theoretical spectra were calculated and used for the main simulation in this study (Figure 1). These input spectra cover relevant energy ranges for mammography imaging, and were recreated using the tool SpekPy [33,34] A tungsten (W) anode X-ray source was taken as the reference, and two different tube voltage and filter settings were then applied:
- Standard mammography spectrum (): 28 kVp tube voltage, 50 µm Rh filter;
- Filter-modified spectrum (): with 1 mm Al filter instead;
- Voltage-modified spectrum (): 50 kVp tube voltage instead;
- Filter-Voltage-modified spectrum (): 50 kVp tube voltage, 1 mm Al filter.
All input spectra were normalized to their maximum value. Supplementary Monte-Carlo simulations were executed for validation of the SpekPy spectra, with virtually identical results. These simulations can be found in Appendix B.
2.3. Mammography Simulations and Analysis
All simulations were performed using GATE (Geant4 Application for Tomographic Emission), a Monte Carlo framework designed to simulate physical processes in medical imaging modalities, including X-ray imaging, PET, and CT [36,37]. GATE provides a command interpreter that enables straightforward system configuration through manual command entry or batch scripts that define the simulation geometry and execution sequence. The standard emstandard_opt4 electromagnetic physics list was used for all simulations. No charge transport or carrier collection was modeled, and all results are based only on the physics of radiation-matter interactions and their respective energy depositions on a voxel-based sensor matrix. For a detailed profile of the simulation stack, please refer to Appendix A.
Figure 2 shows the simulation setup schematic in three sections: the imaging geometry, the X-ray source definition, and the sample geometry and segmentation scheme.
2.3.1. Imaging Geometry
The simulated imaging configuration was replicated from the geometrical parameters used in the Selenia Dimensions AWS5000 digital mammography system [38]. The detector was modeled as a sensor voxel array with dimensions based on the physical characteristics of the SPCD Timepix3: a 1 mm thick CdTe semiconductor array with 55 µm pixel pitch. Each simulated voxel corresponds to one detector pixel. This sensor thickness is sufficient to achieve close to total photon absorption efficiency at mammographic X-ray energies [23]. It also matches the sensor thickness used in previous experimental studies by this research group [20].
To optimize simulation time, a small 61×61 voxel matrix was defined, enough to confirm the feasibility of the proposed methods and the underlying working principles. The center of the detector’s front surface was located at the position (0,0,70) cm, as shown in Figure 2a.
2.3.2. X-Ray Source
The geometry of the source is shown in Figure 2b. For ease of analysis, the X-ray source was modeled as an ideal divergent cone-beam point source with uniform intensity, allowing the decoupling of all source-related effects from the detected intensity, such as penumbra [39]. It was located at the world origin, with opening angle and radius , enough to cover the entire detector area and optimize simulation time by avoiding computations for wide-angle photons not reaching the detector.
2.3.3. Phantom
Breast density depends on the proportion of fibroglandular to adipose tissue, with denser breasts having a higher fibroglandular-to-adipose tissue ratio. The Breast Imaging Reporting and Data System (BI-RADS) [40,41] is a widely used framework that reduces variability in diagnostic imaging reports among radiologists. Breast composition is classified in four categories based on visual assessment of fibroglandular content: A, almost entirely fatty breasts; B, scattered areas of fibroglandular density; C, heterogeneously dense breasts, which may obscure small masses; and D, extremely dense breasts, while foregoing quantitative classification. Previous editions classified images based on fibroglandular content percentages, respectively from A to D categories as: ; ; ; 75.
To simulate a dense breast, a block measuring 3.5 mm × 3.5 mm × 5 cm was defined, composed of 85% fibroglandular tissue and 15% adipose tissue (BI-RADS category D, 4th Edition). Its center was positioned at (0, 0, 63) cm, resulting in a geometric magnification of . The 5 cm thickness was selected based on values reported in mammographic studies of dense breasts [42]. Length and width were chosen to be large enough for the projected image to completely cover the detector area.
The phantom contains 13 cubic HA specks embedded in the center of the tissue block to emulate malignant lesions within the breast. They were arranged laterally in a spaced checkerboard pattern (Figure 2c), with sufficient separation to observe each speck’s edge behavior. This number of specks showed a good compromise between achieving sufficient statistical sampling of the attenuation signal and maintaining a reasonably fast simulation time.
The speck side length was defined such that the projected shadows aligned with the voxels’ entrance surface, avoiding intensity drops caused by partial voxel coverage. μm was selected, projecting a shadow of 385 μm (7 voxels). This speck size is in the mid-range of those found in accreditation phantoms such as the CIRS011A [43] and CIRS015 [30], represents a small feature size, and should be readily detectable by mammography systems.
Materials were defined using the same compound homogeneous material mixing method [32] employed in the analytical CNR(E) model. GATE handles the calculations internally, requiring the user to only specify the constituent elements and their weight fractions. Both adipose and glandular tissues were defined as indicated in Table 1.
2.3.4. Simulation Statistics
According to the Rose criterion, developed to evaluate the detectability of a signal in a noisy image, a CNR of 5 allows a signal to be detected with less than one part-per-million uncertainty [44,45]. To this end, Equation (4) can be inverted to calculate the number of detected photons required to achieve a target CNR at a specific energy for a defined set of materials and morphology:
Using Equation (5), the minimum photon intensity required to satisfy the Rose criterion can be estimated, using 15 keV as guide for a photon-starved low-energy bin, yielding . For the defined detector (3721 voxels), the minimum number of photons required is . Thus, emitted photons were simulated per energy bin to ensure high-statistics results with negligible quantum noise.
Equal simulation statistics were applied to flat-field calibration images. Flat-field calibration is a well-known, easily implemented, and standard procedure used in X-ray imaging with digital detectors [35]. It is applied in the standard manner: . The operator denotes Hadamard (matrix element-wise) division. It can be mathematically proven that the final expression for Equation (4) remains invariant under a flat-field correction, provided the correction images have high statistics.
In physical detectors, flat-field images map variations in detector electronics between pixels and sensor defects, appearing as image inhomogeneities and visual artifacts. Although the simulated detector contains no defects, this standard procedure was retained for completeness of X-ray imaging procedures, allowing methodological comparisons with experimental X-ray imaging pipelines.
2.3.5. Spectroscopic Analysis
The main polychromatic X-ray mammography simulation results were derived from a set of individual high-statistics mono-energetic simulations, performed at discrete energies , over the range 10 keV to 50 keV in 0.5 keV increments, resulting in a batch of 81 spectral flat-field-corrected images . The polychromatic mammography spectra were then introduced post-simulation by weighting the intensity of each mono-energetic image with the corresponding spectrum’s mono-energetic intensity at each energy step, . The final polychromatic images were obtained by summing all weighted mono-energetic images, forming the integrated-spectrum image (Equation (6)), which correspond to the type of images recorded with a simple PCD without spectroscopic information:
The CNR values for the simulated IS images were calculated by applying Equation (1), with signal and background voxel regions as depicted in Figure 2c, namely . Spectroscopic CNR plots were generated both, analytically and from the mono-energetic simulation results. The analytical results were obtained by applying Equation 4, using the mammography spectra, the material thickness, and NIST attenuation data. All curves were normalized to allow for a direct shape comparison, revealing energy ranges of importance.
2.4. Monte Carlo Validation Tests
In real-life detectors, energy deposited by a single incident photon may be shared between multiple pixels. During detection, partial energy absorption occurs at the primary interaction site, while secondary photons and electrons are generated through scattering processes within the sensor material. If the range of these particles extends beyond the primary pixel pitch, a fraction of the deposited energy will be recorded in neighboring pixels, and manifests in imaging as multi-pixel clusters of false low-energy photons, reducing contrast and blurring edges. This effect is called charge-sharing. The extent of charge-sharing depends on both the incident photon energy, the proximity to the primary interaction site to pixel boundaries, and the pixel size.
Sensor X-ray fluorescence is a particular case of charge-sharing, relevant for high-Z sensor materials such as CdTe, as it preferentially absorbs photons at K-edge energies (26.7 keV for Cd, 31.8 keV for Te). Subsequent fluorescence photon emission occurs all through the energy range between 22 keV and 32 keV, with both , and other emission lines from both materials appearing as sensor ionization relaxation mechanisms [46], with an expected fluorescence yield above 80% [47]. With a mean-free path around 100 µm in CdTe, they have a chance of traveling beyond the primary pixel boundary for pixels below this size.
It is important to confirm that sensor fluorescence is properly simulated with the defined sensor geometry, and its potential impact on the results, in a manner analogous to charge-sharing in real detectors, where it has been shown to degrade spatial resolution and spectral fidelity if not properly accounted for [23,48]. Although no charge-transport dynamics are simulated, lateral energy redistribution through secondary particle generation in the sensor is expected, due to the high-aspect-ratio detector elements, and the mean free path of Cd K fluorescence photons in CdTe.
The first validation simulation consisted of a 5 mm thick Pb slab with a squared, 5-voxel-wide pinhole aperture that collimated an ideal point source, thereby limiting primary photon lateral spread. The collimator was positioned a few mm away from the sensor surface. The sensor was voxelated and sized the same as for the main mono-energetic simulation set. Two simulations were performed using the unfiltered polychromatic W emission spectra at 28 kVp () and 50 kVp (), obtained from supplementary Monte Carlo simulations (See Annex B, Figure B1).
The second verification test was conducted using the same imaging setup as the main mono-energetic simulation set. It was performed to investigate intense halo artifacts appearing around specks and detector edges. Two separate mono-energetic simulations were executed at 26 keV and 28 keV, surrounding the Cd K-edge energy. Detected events were classified according to their creation vertex as either primary interactions within the initial voxel, or secondary particles escaping to neighboring voxels.
2.5. Experimental Validation - Breast Implant X-Ray Imaging
In order to experimentally test the hypothesis of this study, and the suggested results from the simulations, the extreme case of breast implant mammography imaging was chosen. The recorded sample was a CIRS015 mammography accreditation phantom [30] with a 250 cm3 silicone implant partially covering the region of interest (Alumina specks, diameter 540 µm). The X-ray setup was configured for mammography imaging at the Uniandes High Energy Physics Laboratory [20]. The detector used was a Medipix3RX [21], bump-bonded to a 1 mm thick CdTe sensor. This imaging geometry replicates that of the Selenia Dimensions AWS5000 digital mammography system [38], in the same fashion as the mammography simulations (Figure 2), but using a Hamamatsu µFocus polychromatic X-ray source. This imaging system had been previously dose-calibrated for a spectrum, to allow for direct comparisons with commercial mammography systems.
Three experimental images were taken, applying two different spectra. The reference image was taken in the Selenia system, using the spectrum, delivering a standard Entrance Surface Dose (ESD) of 1.5 mGy to the sample. The second image was taken in the lab, applying 5× the standard ESD, attempting to increase speck visibility. The third image was taken also in the lab, using the spectrum and the same exposure time to achieve one standard ESD with the spectrum. This allows for dose comparability between all images without incurring in the practical difficulties of system re-calibration.
For the vendor system, the default clinical protocol for CC view was used, without implant displacement and without access to vendor-proprietary post-processing; for the lab system, only a flat-field correction was applied.
3. Results
3.1. Monte Carlo Validation Tests
Figure 3 shows the results of the spectrum-level simulation tests. Figure 3a illustrates the theoretical interaction of CdTe with X-rays, its K-edges and fluorescence emission peaks, and includes an inset of the simulation setup. Figure 3b and Figure 3c present the detected spectra for both setups, along with the corresponding intensity images. Fluorescence is confirmed, as the detected spectrum from the simulation shows Cd and Te fluorescence peaks, absent in case. There is also a notable increase in low-energy hits, as energy is redistributed spatially.
The image inset in Figure 3c shows detected events in voxels located well beyond the collimator pinhole, on the order of seven voxels, with intensities close to 10% of the primary beam intensity, progressively decreasing toward zero. Notably, the image inset in Figure 3b also shows a few detections along the collimator edge, 2-3 voxels away, with less than 1% of the intensity measured at pinhole. This indicates slight activation of Cd fluorescence, caused by the small fraction of photons in the spectrum above 26.7 keV.
Figure 4 shows the results of the two monochromatic simulation tests. The top and bottom rows correspond to the 26 keV and 28 keV monochromatic simulations, respectively. The left column images were generated by counting all detected hits, while the right column images exclude secondary interactions. The halo artifacts were completely absent in the 26 keV photon images but clearly appeared in the 28 keV photon images, around the specks, as well as on voxels near the sensor edge (Figure 4c). They disappear when secondary interactions are filtered out (Figure 4d).
Figure 4e shows the deposited energy histogram for the 28 keV photon simulation test. Interactions are separated according to their creation vertex location: blue for the primary voxel, red for secondary voxels. The histogram exhibits primary photon energy redistribution among several discrete values, specifically 2 keV, 5 keV and 28 keV for the primary voxel, and below 1 keV, 23 keV, and 26 keV for secondary voxel deposition.
The energy histogram in Figure 4e shows the reason for the halo artifacts and confirms sensor fluorescence as the cause. In approximately 42% of the cases, the primary photon deposits all its energy in the primary voxel. Nearly 58% of the time, a fluorescence interaction occurs and the energy is redistributed spatially within the sensor, through low-energy processes such as Auger electrons, and photoelectric effect. This is also visible as an increase in recorded hits in Figure 4c, compared to Figure 4a and Figure 4b. Fluorescence photons also escape the sensor volume, as seen in the reduced hit counts in edge voxels in Figure 4c, closer to the number of primary hits in Figure 4d.
3.2. Mammography Simulations
Figure 5a shows two datasets: continuous analytical spectroscopic CNR curves and simulation-based spectroscopic CNR data points. The CNR(E) plots exhibit peaks at different energies. The and curves peak at 22 keV and display nearly identical shapes up to the Rh K-edge energy of 23.3 keV, beyond which the curve drops sharply due to a lack of photons. The curve peaks at the filter’s K-edge (23.2 keV), with a secondary peak at around 31 keV. The curve peaks at 24 keV and maintains a continuous shape up to the maximum photon energy of the input spectrum. Figure 5b shows the IS images resulting from the mammography simulations. The scale limits were defined by the minimum (zero) and maximum (one) intensity values across all images, thereby allowing direct visual comparison. The top-row images exhibit high contrast, but also show a fluctuating background. Conversely, the bottom-row images display lower contrast and a flatter background. Image yields the highest CNR value, 23.11% higher than the standard . The CNR values obtained for images and were below the one obtained from the standard, being 1.60% and 4.92% lower, respectively.
3.3. Experimental Validation – Breast Implant Imaging
Figure 6a shows a flat, gray region without discernible speck presence, even after adjusting the brightness and contrast parameters. An equivalent result was initially obtained the lab, with a subsequent 5× standard ESD image (Figure 6b) showing no improvements behind the implant.
Figure 6c was acquired using the spectrum. At a dose near 1× ESD, the specks were clearly visible behind the implant, without the need for post-processing, beyond the standard flat-field correction.
4. Discussion
4.1. Modified Mammography X-Ray Spectra
By analyzing the relative intensities of the recorded spectra, the energy ranges contributing most significantly to image formation can be identified. As a practical guideline, high-quality images generally require photon counts on the order of several thousand per energy bin. Energy intervals in which the contrast-to-noise ratio (CNR) falls below approximately 30% of its maximum value can therefore be considered negligible, as only a minimal number of photons are detected in these regions. In all the cases presented, photon energies below 14 keV and contribute negligibly to image formation.
In the case of K-edge filtered spectra, photons with energies above the filter’s K-edge can also be neglected, as any visual structure that could be recorded from detecting these photons is effectively lost. This has direct consequences for dense-breast and implant mammography, as confirmed by both simulated and experimental results: increased CNR on simulated dense-breast and increased microcalcification detectability through the implant. In both cases, the effect is driven by transmitted high-energy photons. Supplementary simulations confirm that the attenuation of 2 cm silicone closely matches that of 5 cm dense breast tissue, supporting transferability of the results (see Appendix B, Figure B1).
4.2. Mammography Simulations
As seen in Figure 5a, CNR is a spectrally resolved quantity. CNR(E) simulated results are in close agreement with the analytical model (Equation (4)), confirming that the simulation behaves as expected and serves as a reliable tool for spectral analysis in the high-statistics limit, despite a lack of charge-dynamics calculations.
The residual differences are dominated by photon scattering, K-shell fluorescence emission with partial escape of characteristic X-rays, and inter-voxel energy redistribution caused by secondary particle generation and reabsorption. Although scattering has a low yield in the energy range used in this study, fluorescence has been shown to play an important role, and is therefore the primary source of the discrepancy. The halo artifacts persist in all monochromatic images above the Cd K-edge energy. By carefully segmenting the sample and leaving edge margins, this effect was largely mitigated on the spectroscopic results; however, its impact on spatial resolution remains evident, as object edges appear blurred.
The highest CNR value image was . Although the standard image exhibits the highest contrast, the background noise is also the highest. This is a direct consequence of removing the high-energy tail of the spectrum, between 23.2 keV and 28 keV.
CNR curves show an interplay between image noise, contrast, and material attenuation. While for example, the standard spectrum produces images with higher contrast and also comparatively higher noise, spectrum yields lower contrast images due to an increased transparency of the HA specks at high energies, together with reduced background noise resulting from greater breast tissue transparency. This means that noise reduction does not translate directly to improved object visibility, as the CNR for images was anyways lower than the standard, due to the HA transparency.
4.3. Experimental Validation – Breast Implant X-Ray Imaging
According to dose estimations obtained using SpekPy, the dose rate imparted by sources with the standard spectrum, and the modified spectrum differ by 5%. This is reflected in the corresponding spectra plots (Figure 1, Figure B1), where the high-energy tail of the represents a relatively small area under the curve, while the remainder of both spectra closely overlap.
An important consequence of this result is that changing the filtration to 1 mm Al produces measurable image quality gains with only a small increase in detected dose, transitioning from no visibility to clear speck visibility, while also validating the simulation results and analysis, indicating the spectrum as the best-suited for dense-breast and implant X-ray imaging, of the four spectra studied.
Figure 6b also confirms that the most important factor for visibility behind dense objects in the breast is the emitted spectrum, as even a fivefold increase in emitted fluence using the standard spectrum was insufficient to achieve speck visibility with a Medipix3RX 1 mm CdTe PCD. It should also be noted that, in principle, a substantial fraction of the 5% dose increase is not absorbed by the breast tissue or implant, owing to their low attenuation at the higher energies.
5. Conclusions
A Monte Carlo simulation framework for detailed spectroscopic analysis in mammography imaging, replicating the most relevant physical phenomena by constructing a voxelated detector matrix, was successfully implemented. The virtual setup simulates a standard mammography system, and allows the application of any energy spectrum of interest, with a flexibility that is difficult to achieve in a real clinical setting.
This flexibility enabled investigating the spectroscopic nature of the CNR, and what additional information it can provide for image quality enhancements. These curves serve an additional purpose, as they can be used in combination with post-processing imaging techniques in real systems with spectroscopic capabilities, to further enhance object contrast and detectability without increasing radiation exposure. Techniques such as energy-weighting and material decomposition have been demonstrated to be effective analytically, in simulations, and experimentally [22,25,48,49,50].
The simulated physics processes allowed confirmation of CdTe sensor fluorescence with photons above 26.72 keV generating clusters of lower-energy hits. Confirming sensor fluorescence explained the most notable discrepancies between the analytical and simulation results. In real measurements, photon clustering techniques combined with SPCDs such as Timepix3 or HEXITEC MHz allow recovery of the undistorted energy spectrum [50], a basic post-processing step required when implementing spectroscopic techniques.
The obtained results show that simulated spectral optimization and analysis is a promising approach to improving image quality in X-ray dense-breast mammography. By using an Al filter instead of the standard Rh filter used for imaging, the CNR for HA speck detection increased by 23.1%, which is directly attributed to the presence of high-energy photons. Simulation-informed spectral optimizations under laboratory conditions resulted in promising qualitative improvements in implant X-ray imaging. Further work is needed to determine whether the optimization of the X-ray spectrum can enhance image quality without increasing the dose. This includes systematic exploration of tube potentials from 20 kVp to 50 kVp, and filtration using materials with K-edges in the 30-50 keV range.
The new capabilities of SPCDs open additional possibilities for X-ray imaging optimization by aiding in the study of appropriate filter/spectrum combinations and post-processing algorithms that leverage the available spectroscopic information, potentially increasing image quality and/or reducing radiation dose. Furthermore, SPCDs will be crucial for continued developments and refinements in medical X-ray imaging, as spectroscopic information becomes increasingly available in clinical settings.
Author Contributions
Conceptualization, G.R, S.P, C.A and M.L.P.-L.; methodology, M.L.P.-L. and G.R.; software, G.R. and M.L.P.-L.; validation, G.R., M.L.P.-L., J.D.B, J.S.U.P. and S.C.; formal analysis, G.R., M.L.P.-L., S.C., J.D.B. and C.A.; investigation, M.L.P.-L., S.C., G.R., S.P. and C.A.; resources, C.A., S.P. and M.F.; data curation, G.R., M.L.P-.L., S.C., C.A., J.S.U.P., J.D.B., S.P. and M.K.S; writing—original draft preparation, G.R.; writing—review and editing, G.R., M.L.P.-L., S.C., C.A., S.P., J.S.U.P., J.D.B., M.K.S. and M.F.; visualization, G.R., S.C., M.L.P.-L. and J.S.U.P; supervision, C.A., S.P and M.F.; project administration, C.A, S.P. and G.R.; funding acquisition, C.A., S.P. and G.R. All authors have read and agreed to the published version of the manuscript.
Funding
This work was supported by the following entities: BMBF, Germany [project number 01DN21005]; MINCIENCIAS, Colombia [project number 873-2020]; Universidad de los Andes, Faculty of Science, Colombia [project number INV-2025-213-3462].
Institutional Review Board Statement
Not applicable.
Informed Consent Statement
Not applicable.
Data Availability Statement
The raw data supporting the conclusions of this article will be made available by the authors on request.
Conflicts of Interest
The authors declare no conflicts of interest.
Abbreviations
The following abbreviations are used in this manuscript:
| CNR | Contrast-to-Noise Ratio |
| Rh | Rhodium |
| CdTe | Cadmium Telluride |
| Al | Aluminum |
| ESD | Entrance Surface Dose |
| HA | Calcium Hydroxyapatite |
| MRI | Magnetic Resonance Imaging |
| PCD | Photon-Counting Detector |
| SPCD | Spectroscopic Photon-Counting Detector |
| NIST | National Institute of Standards and Technology (USA) |
| W | Tungsten |
| GATE | Geant4 Application for Tomographic Emission |
| PET | Positron Emission Tomography |
| CT | Computer Tomography |
| BI-RADS | Breast Imaging Reporting and Data System |
Appendix A. Simulation Validation Table
The following is a list of items to be considered when carrying out studies using Monte Carlo methods. It is taken from the AAPM Task Group 268 report on simulation studies [51]. Specifically, we verified the geometry, event tallies, and physics lists by: reproducing transmission through reference slabs and comparing to Beer-Lambert law with NIST μ/ρ tables used elsewhere in the study; comparing the simulated tube spectra to analytical spectra generated using the tool SpekPy; confirming Cd/Te K-edge activation and escape-range-consistent halos in CdTe above 26.7/31.8 keV, which tie directly to the results seen in Figure 3 and Figure 4. Items not in the table are described explicitly in the text.

Table A1.
ASPM TG 268 recommended checklist for verification of simulation results using Monte Carlo methods.
Table A1.
ASPM TG 268 recommended checklist for verification of simulation results using Monte Carlo methods.
| Monte Carlo Software Used | GATE. Version 9.2. Based on GEANT4, v11.0.3 |
| Simulation Times |
|
| Hardware |
|
| Physics and Transport | emstandard_opt4 physics list |
| Travel Cut-offs | Gamma, Electrons:
|
| Digitizer Energy Threshold | 3 keV |
| Number of primaries, all simulations | 1010 primary photons per energy bin. 1.62 x 10¹² total photons generated |
Appendix B. Monte Carlo Mammography Spectra
An unfiltered W Anode X-ray spectrum was obtained from a detailed GEANT4 simulation of the Hamamatsu µFocus X-ray source model L10101, with an energy step of 0.1 keV. The simulation was configured to replicate real-life properties of the X-ray tube, including the 150 µm Beryllium (Be) window, the 3D model of the housing, an approximation of the W anode size, and the 41° emission angle. For reference, an unfiltered spectrum is shown, using the X-ray tube bias voltage at 28 kVp, labeled . The unfiltered spectrum was also simulated (not shown).
Figure B1.
Transmission spectra for dense breast and breast-implant mammography imaging. The red curves show the simulated unfiltered spectrum . Subsequent curves were obtained from NIST tables. Dashed plots represent sample materials present in mammography: 85% glandular tissue breast, Silicone, and the combination of both. (a) 50 um Rh filtering. (b) 1 mm Al filtering.
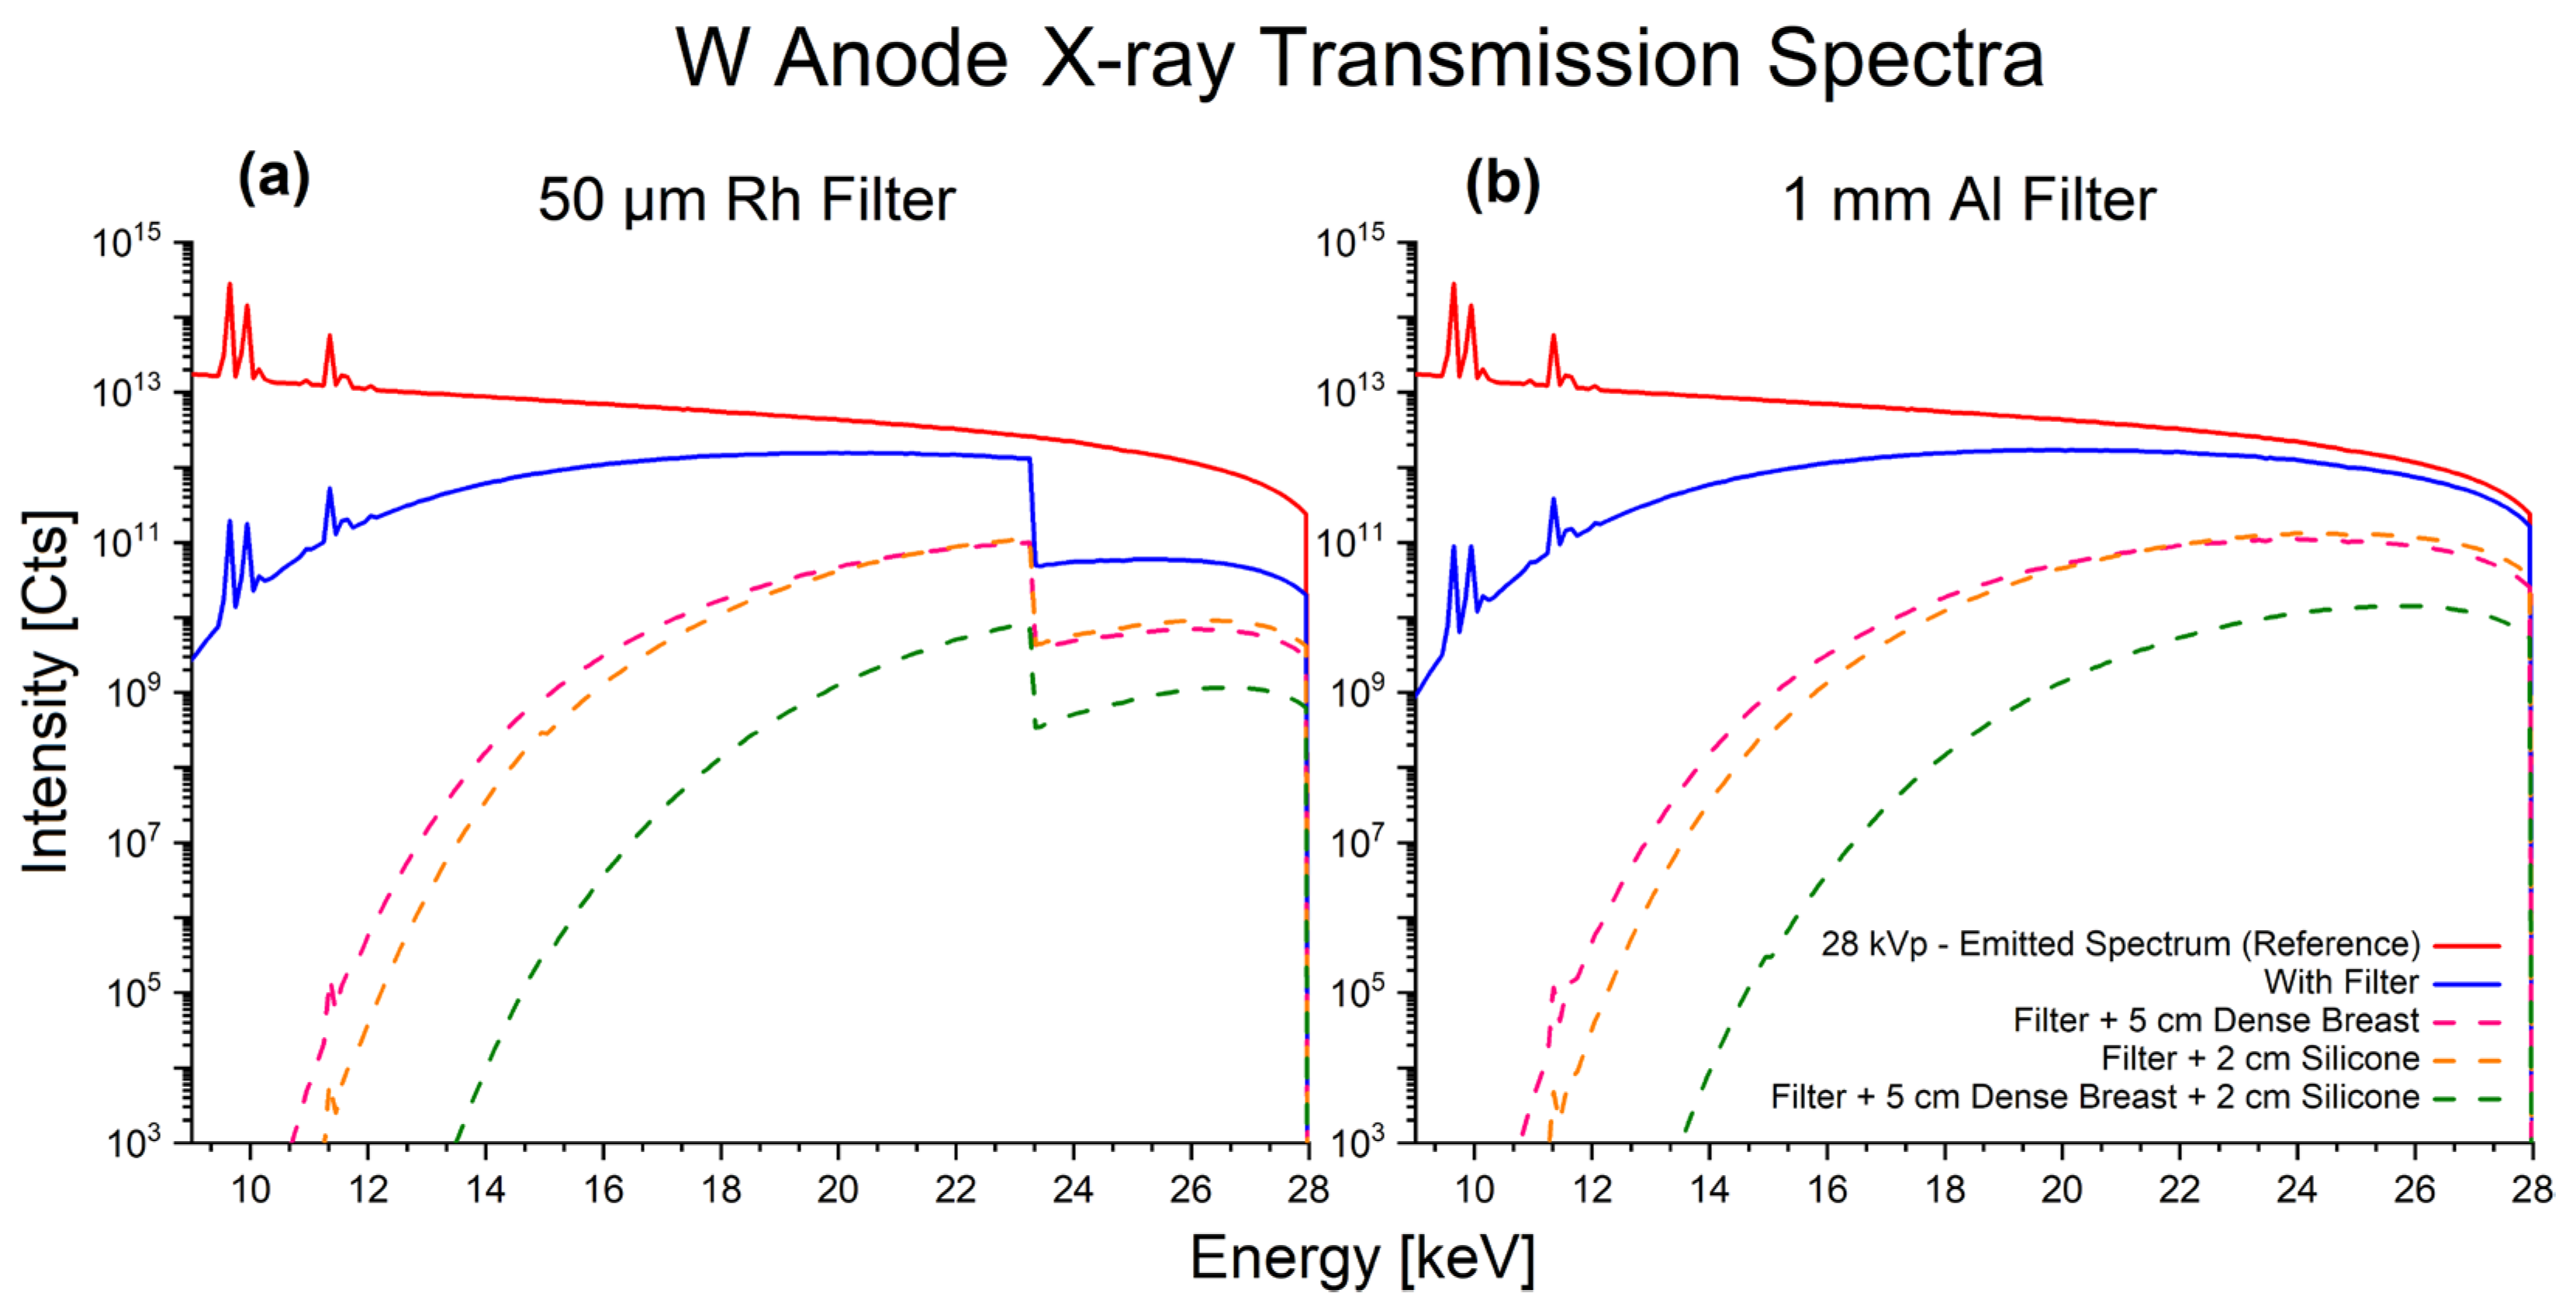
Subsequent photon transmission spectra were calculated using the Beer–Lambert law, combined with mass attenuation coefficients obtained from NIST tables [32]. To achieve a finer energy step size than that provided by the tabulated attenuation data, the coefficients were interpolated between existing points while accounting for the presence of K-edges.
The transmission through the sample materials shows that photons below 10 keV are negligible. The Rh-filtered spectra have the expected K-edge jump. 5 cm of dense breast has similar attenuation to 2 cm of silicone above 16 keV, which makes results comparable between materials.
References
- Li, X.; Weaver, O.; Desouki, M.M.; Dabbs, D.; Shyum, S.; et al. Microcalcification Is an Important Factor in the Management of Breast Intraductal Papillomas Diagnosed on Core Biopsy. Am J Clin Pathol 2012, 138, 789–95. [Google Scholar] [CrossRef] [PubMed]
- Wilkinson, L.; Thomas, V.; Sharma, N. Microcalcification on Mammography: Approaches to Interpretation and Biopsy. Brit J Radiol 2016, 90. [Google Scholar] [CrossRef]
- Dance, D.R.; Christofides, S.; Maidment, A.D.A.; McLean, I.D.; Ng, K.H. Diagnostic Radiology Physics – A Handbook for Teachers and students; International Atomic Energy Agency: Vienna, 2014; ISBN 978-92-0-131010-1. [Google Scholar]
- Bantick, G.; Taggart, I. Mammography and Breast Implants. Brit J Plast Surg 1995, 48, 49–52. [Google Scholar] [CrossRef]
- Siu, A. Screening for Breast Cancer: U.S. Preventive Services Task Force Recommendation Statement. Ann Intern Med 2016, 164, 279–96. [Google Scholar] [CrossRef]
- McCormack, V.A.; dos Santos Silva, I. Breast Density and Parenchymal Patterns as Markers of Breast Cancer Risk: A Meta-analysis. Cancer Epidem Biomar 2006, 15, 1159–1169. [Google Scholar] [CrossRef] [PubMed]
- Boyd, N.; Martin, L.; Bronskill, M.; Yaffe, M.; Duric, N.; Minkin, S. Breast Tissue Composition and Susceptibility to Breast Cancer. JNCI-J Natl Cancer I 2010, 102, 1224–1237. [Google Scholar] [CrossRef]
- Vachon, C.M.; Van Gils, C.H.; Sellers, T.A.; Ghosh, K.; Pruthi, S.; et al. Mammographic Density, Breast Cancer Risk and Risk Prediction. Breast Cancer Res 2007, 9, 1–9. [Google Scholar] [CrossRef]
- Sprague, B.L.; Gangnon, R.E.; Burt, V.; Trentham-Dietz, A.; Hampton, J.M.; et al. Prevalence of Mammographically Dense Breasts in the United States. JNCI-J Natl Cancer I 2014, 106. [Google Scholar] [CrossRef]
- Jackson, V.P.; Hendrick, R.E.; Feig, S.A.; Kopans, D.B. Imaging of the Radiographically Dense Breast. Radiology 1993, 188, 297–301. [Google Scholar] [CrossRef] [PubMed]
- Scheel, J.R.; Lee, J.M.; Sprague, B.L.; Lee, C.I.; Lehman, C.D. Screening Ultrasound as an Adjunct to Mammography in Women with Mammographically Dense Breasts. Am J Obstet Gynecol 2015, 212, 9–17. [Google Scholar] [CrossRef]
- Rebolj, M.; Assi, V.; Brentnall, A.; Parmar, D.; Duffy, S.W. Addition of Ultrasound to Mammography in the Case of Dense Breast Tissue: Systematic Review and Meta-analysis. Brit J Cancer 2018, p118, 1559–1570. [Google Scholar] [CrossRef]
- Sieber, D.A.; Adams, J.; William, P. What’s Your Micromort? A Patient-Oriented Analysis of Breast Implant-Associated Anaplastic Large Cell Lymphoma (BIA-ALCL). Aesthet Surg J 2017, 37, 887–891. [Google Scholar] [CrossRef]
- Kalaaji, A. ISAPS International Survey on Aesthetic/Cosmetic Procedures Performed in 2024. International Society of Aesthetic Plastic Surgery. 2025. Available online: https://www.isaps.org/media/oogpzodr/isaps-global-survey_2024.pdf (accessed on 18 February 2026).
- Eklund, G.; Busby, R.; Miller, S.; Job, J. Improved Imaging of the Augmented Breast. Am J Roentengol 1988, 151, 469–473. [Google Scholar] [CrossRef]
- Smalley, S.M. Breast Implants and Breast Cancer Screening. J Midwifery Wom Heal 2003, 48, 329–337. [Google Scholar] [CrossRef]
- Miglioretti, D.L.; Rutter, C.M.; Geller, B.M.; Cutter, G.; Barlow, W.E.; et al. Effect of Breast Augmentation on the Accuracy of Mammography and Cancer Characteristics. JAMA-J Am Med Assoc 2004, 291, 442–450. [Google Scholar] [CrossRef] [PubMed]
- Berger, N.; Marcon, M.; Saltybaeva, N.; Kalender, W.A.; Alkadhi, H.; Frauenfelder, T.; Boss. Dedicated Breast Computed Tomography with a Photon-Counting Detector: Initial Results of Clinical In Vivo Imaging. Invest Radiol 2019, 7. [Google Scholar] [CrossRef]
- Poikela, T.; Plosila, J.; Westerlund, T.; Campbell, M.; De Gaspari, M.; et al. Timepix3: a 65K Channel Hybrid Pixel Readout Chip with Simultaneous ToA/ToT and Sparse Readout. J Inst 2014, 9. [Google Scholar] [CrossRef]
- Roque, G.; Avila, C.; Pérez-Lara, M.L.; Mendoza, L.; Procz, S. Study of Contrast-to-Noise Ratio Performance of a Medipix3RX CdTe Detector for Low Dose Mammography Imaging. Nucl Instrum Meth A 2021, 992. [Google Scholar] [CrossRef]
- Ballabriga, R.; Alozy, J.; Blaj, G.; Campbell, M.; Fiederle, M.; et al. The Medipix3RX: a High Resolution, Zero Dead-time Pixel Detector Readout Chip Allowing Spectroscopic Imaging. J Inst 2014, 8. [Google Scholar] [CrossRef]
- Ballabriga, R.; Alozy, J.; Campbell, M.; Frojdh, E.; Heijne, E.H.M.; et al. Review of Hybrid Pixel Detector Readout ASICs for Spectroscopic X-ray Imaging. J Inst 2016, 11. [Google Scholar] [CrossRef]
- Procz, S.; Roque, G.; Avila, C.; Racedo, J.; Rueda, R.; et al. Investigation of CdTe, GaAs, Se and Si as Sensor Materials for Mammography. IEEE T Med Imaging 2020, 39, 3766–3777. [Google Scholar] [CrossRef]
- Hemdal, B.; Hernsdorf, L.; Andersson, I.; Bengtsson, G.; Heddson, B.; Olsson, M. Average Glandular Dose in Routine Mammography Screening using a Sectra Microdose Mammography Unit. Radiat Prot Dosim 2005, 114, 436–443. [Google Scholar] [CrossRef]
- Ghammraoui, B.; Glick, J. Investigating the Feasibility of Classifying Breast Pixel Using Photon-counting Spectral Mammography: A Simulation Study. Med Phys 2017, 44, 1–9. [Google Scholar] [CrossRef]
- Siemens Healthineers AG. Photon-counting CT - A quantum leap in computed tomography 2025. Available online: https://www.siemens-healthineers.com/computed-tomography/ct-technologies-and-innovations/photon-counting-ct (accessed on 18 February 2026).
- Canon Medical Systems Corporation. Photon Counting CT - A new era in computed tomography 2025. Available online: https://global.medical.canon/products/computed-tomography/pcct (accessed on 18 February 2026).
- Zhan, X.; Zhang, R.; Niu, X.; Hein, I.; Budden, B.; et al. Comprehensive Evaluations of a Prototype Full Field-of-view Photon Counting CT System through Phantom Studies. Phys Med Biol 2023, 68. [Google Scholar] [CrossRef] [PubMed]
- Koninklijke Philips, N.V. See beyond the conventional to the next generation of multi-energy CT. Available online: https://www.philips.com.my/healthcare/sites/spectral-ct-learning-center (accessed on 18 February 2026).
- CIRS, Inc.Mammographic Accreditation Phantom - Model 015. Computerized Imaging Reference Systems – CIRS, 2013.
- Swinehart, D.F. The Beer-Lambert Law. J Chem Educ 1962, 39. [Google Scholar] [CrossRef]
- Hubbell, J.; Seltzer, S. Tables of X-Ray Mass Attenuation Coefficients and Mass Energy-Absorption Coefficients 1 keV to 20 MeV for Elements Z = 1 to 92 and 48 Additional Substances of Dosimetric Interest; NIST: USA, 2008. [Google Scholar] [CrossRef]
- Poludniowski, G.; Omar, A.; Bujila, R.; Andreo, P. Technical Note: SpekPy v2.0—A Software Toolkit for Modeling X-ray Tube Spectra. Med Phys 2021, 48, 3630–3637. [Google Scholar] [CrossRef] [PubMed]
- Vorbau, R.; Poludniowski, G. Technical Note: SpekPy Web—Online X-ray Spectrum Calculations using an Interface to the SpekPy Toolkit. J Appl Clin Med Phys 2024, 25, 1–5. [Google Scholar] [CrossRef]
- Jakubek, J. Data Processing and Image Reconstruction Methods for Pixel Detectors. Nucl Instrum Meth A 2007, 576, 223–234. [Google Scholar] [CrossRef]
- Sarrut, D.; Arbor, N.; Baudier, T.; Borys, D.; Etxebeste, A.; et al. The OpenGATE Ecosystem for Monte Carlo Simulation in Medical Physics. Phys Med Biol 2022, 67. [Google Scholar] [CrossRef]
- Allison, J.; Amako, K.; Apostolakis, J.; Arce, P.; Asai, M.; et al. Recent Developments in Geant4. Nucl Instrum Meth A 2016, 835. [Google Scholar] [CrossRef]
- Hologic, Inc. Selenia Dimensions with Acquisition Workstation 5000; Hologic, Inc., 2011. [Google Scholar]
- Harms, A.A.; Zeilinger, A. A New Formulation of Total Unsharpness in Radiography. Phys Med Biol 1977, 22, 70–80. [Google Scholar] [CrossRef]
- Spak, D.A.; Plaxco, J.S.; Santiago, L.; Dryen, M.J.; Dogan, B.E. BI-RADS® fifth edition: A summary of changes. Diagn Interv Imag 2017, 98, 179–190. [Google Scholar] [CrossRef]
- Destounis, S.V.; Friedewald, S.M.; Grimm, L.J.; Poplack, S.P.; Sung, J.S. Mammography. In ACR BI-RADS® v2025 Manual; Newell, M.S., Destounis, S.V, Eds.; American College of Radiology: Reston, VA (USA), 2025. [Google Scholar]
- Oliveira, A.; Meguerian, B.A.; Mesquita, C.T. Influence of Breast Characteristics in Myocardial Scintigraphy through the Monte Carlo Method. Arq Bras Cardiol 2011, 96. [Google Scholar] [CrossRef]
- CIRS, INC.Tissue-Equivalent Phantom for Mammography - Model 011A. Computerized Imaging Reference Systems - CIRS, 2013 .
- Rose, A. Vision - Human and Electronic, 1st ed.; Springer: New York, USA, 1973; ISBN 978-1-4684-2039-5. [Google Scholar] [CrossRef]
- Burgess, A.E. The Rose Model, Revisited. J Opt Soc Am A 1999, 16. [Google Scholar] [CrossRef]
- Bearden, J.A. X-Ray Wavelengths. Rev Mod Phys 1967, 39, 78–124. [Google Scholar] [CrossRef]
- Krause, M.O. Atomic Radiative and Radiationless Yields for K and L Shells. J Phys Chem Ref Data 1979, 8, 307–327. [Google Scholar] [CrossRef]
- Anton, G.; Durst, J.; Firsching, M.; Giersch, J.; Korn, A.; et al. Imaging Theory for X-ray Pixel Detectors. Nucl Instrum Meth A 2006, 563, 116–123. [Google Scholar] [CrossRef]
- Giersch, J.; Niederlöhner, D.; Anton, G. The Influence of Energy Weighting on X-ray Imaging Quality. Nucl Instrum Meth A 2004, 531, 68–74. [Google Scholar] [CrossRef]
- Roque, G.; Schütz, M.K.; Fey, J.; Useche Parra, J.S.; Fiederle, M.; Procz, S. Sub-pixel Energy-weighting Techniques for Metallic Contaminant Highlighting in a Pharmaceutical Hard Capsule using a Timepix3 CdZnTe Hybrid Pixel Detector. J Inst 2022, 17. [Google Scholar] [CrossRef]
- Schopoulos, I.; Rogers, D.W.O.; Bazalova-Carter, M.; Bolch, W.; Heath, E.; et al. RECORDS: improved Reporting of montE CarlO RaDiation transport Studies: Report of the AAPM Research Committee Task Group 268. Med Phys 2017, 45, 1–5. [Google Scholar] [CrossRef]
Figure 1.
Numerically-generated normalized input spectra for four distinct cases, used in combination with the main mammography Monte Carlo simulation, to calculate image quality for HA speck detection. Spectra generated with the tool SpekPy [33,34].
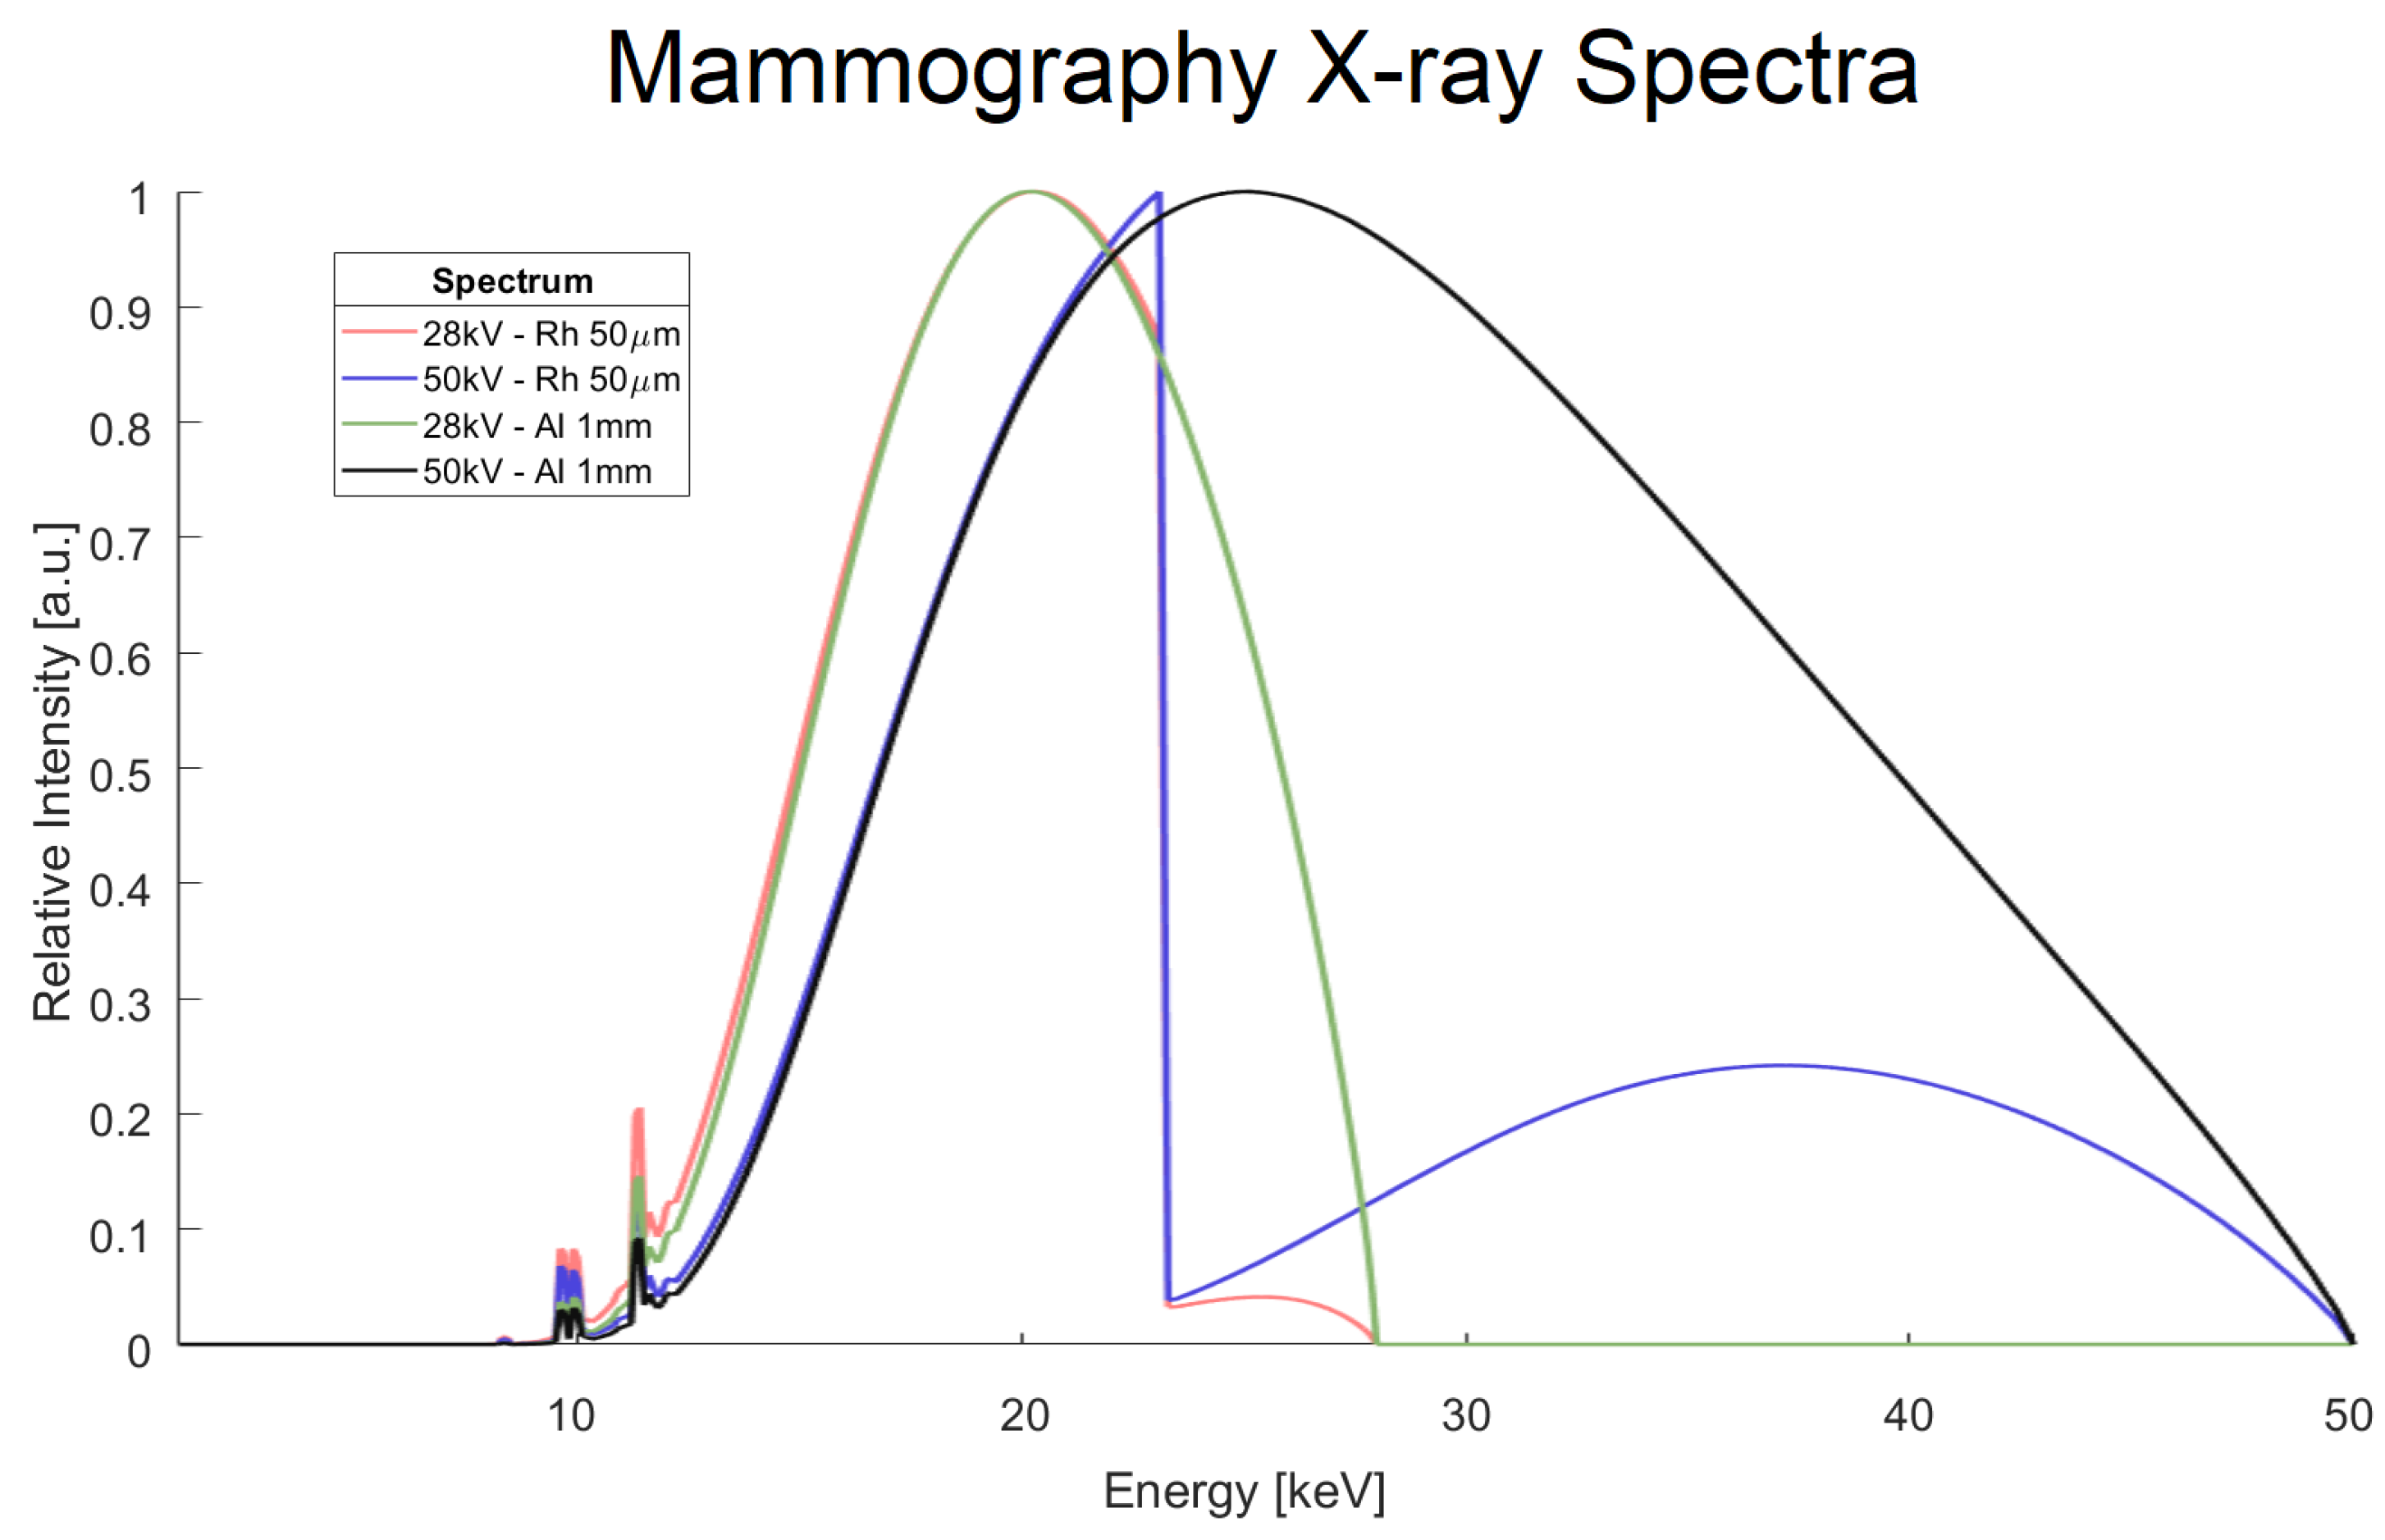
Figure 2.
Simulated imaging setup schematic. (a) Imaging geometry, replicating the Selenia Dimensions AWS5000 mammography system [38]. (b) Divergent point source geometry. (c) Phantom with cubic specks (gray), showing segmentation for calculations (blue: signal / red: background). A 2-voxel margin in all borders was ignored from all calculations.
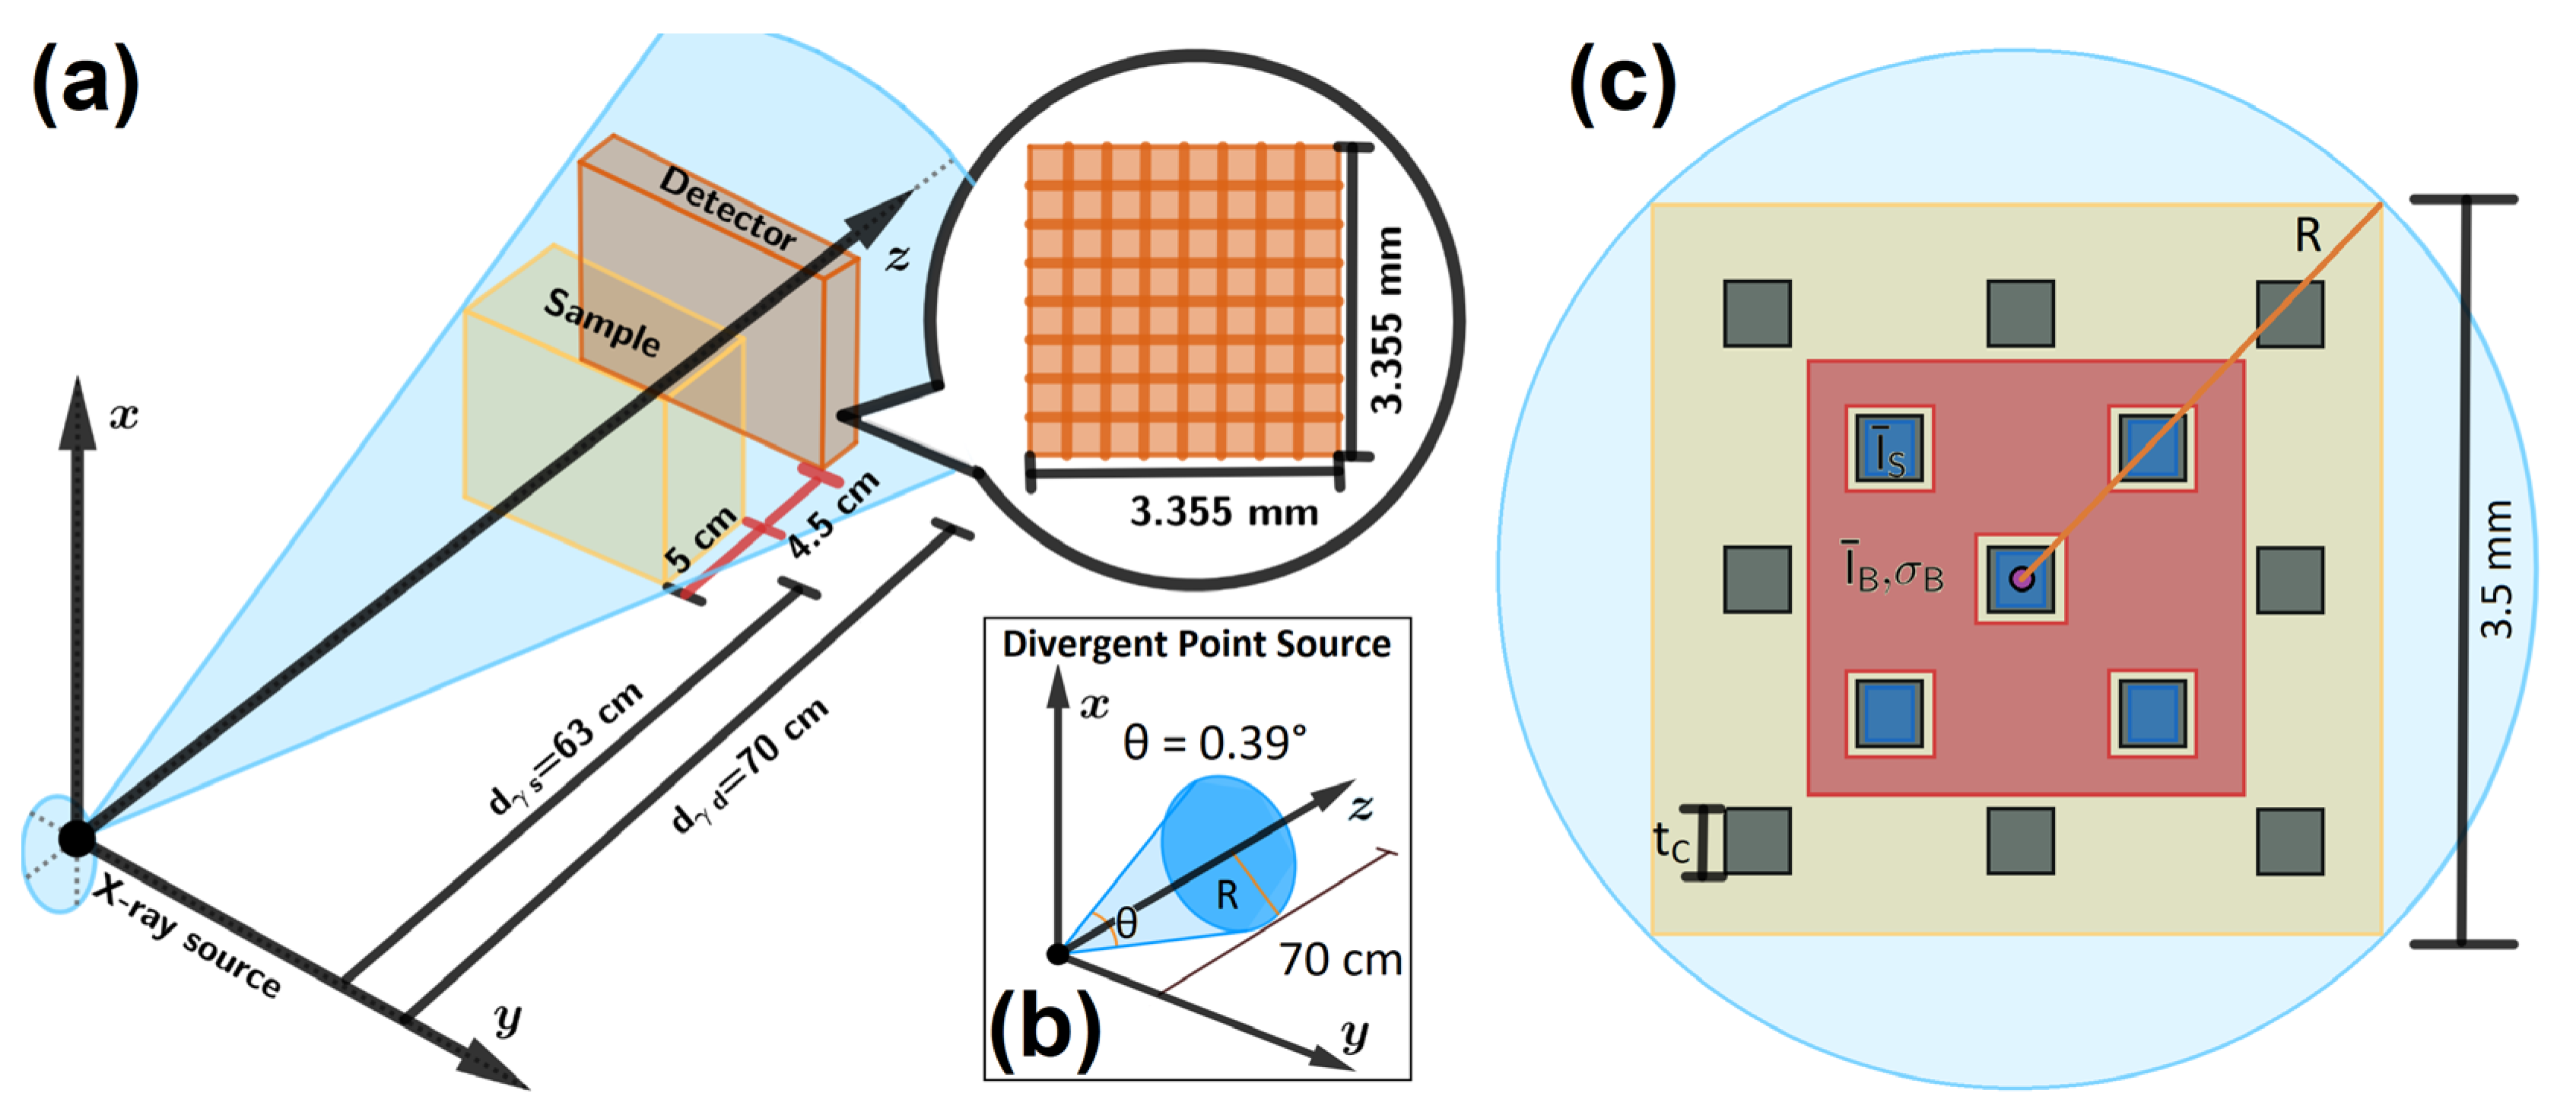
Figure 3.
Spectrum-level simulation tests. (a) CdTe material mass-attenuation coefficient and XRF peaks, with inset showing the simulation geometry. Simulated detector response for two polychromatic spectra: (b) ; (c) .
Figure 3.
Spectrum-level simulation tests. (a) CdTe material mass-attenuation coefficient and XRF peaks, with inset showing the simulation geometry. Simulated detector response for two polychromatic spectra: (b) ; (c) .
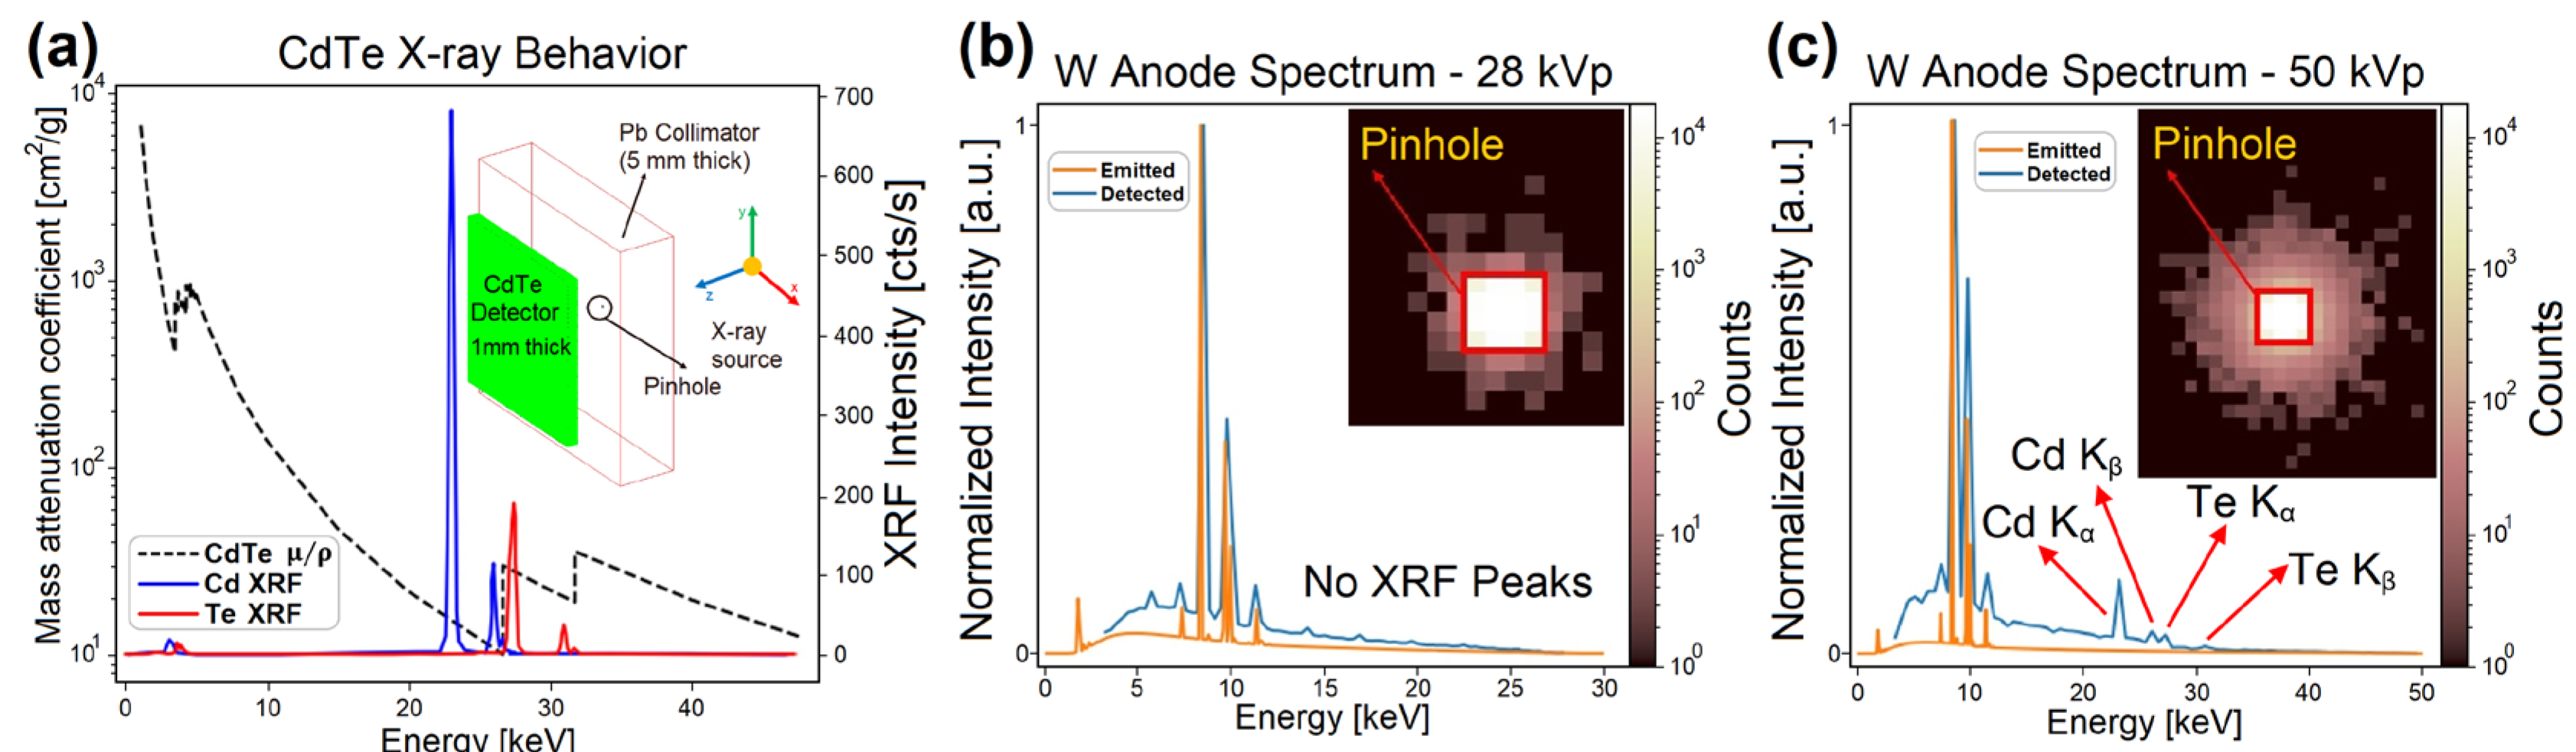
Figure 4.
Monochromatic simulation tests. (a) Image generated by 26 keV photons. (b) Image generated by removing secondary interactions in (a). (c) Image generated by 28 keV photons. (d) Image generated by removing secondary interactions in (c). (e) Deposited energy histogram for (c) and (d).
Figure 4.
Monochromatic simulation tests. (a) Image generated by 26 keV photons. (b) Image generated by removing secondary interactions in (a). (c) Image generated by 28 keV photons. (d) Image generated by removing secondary interactions in (c). (e) Deposited energy histogram for (c) and (d).
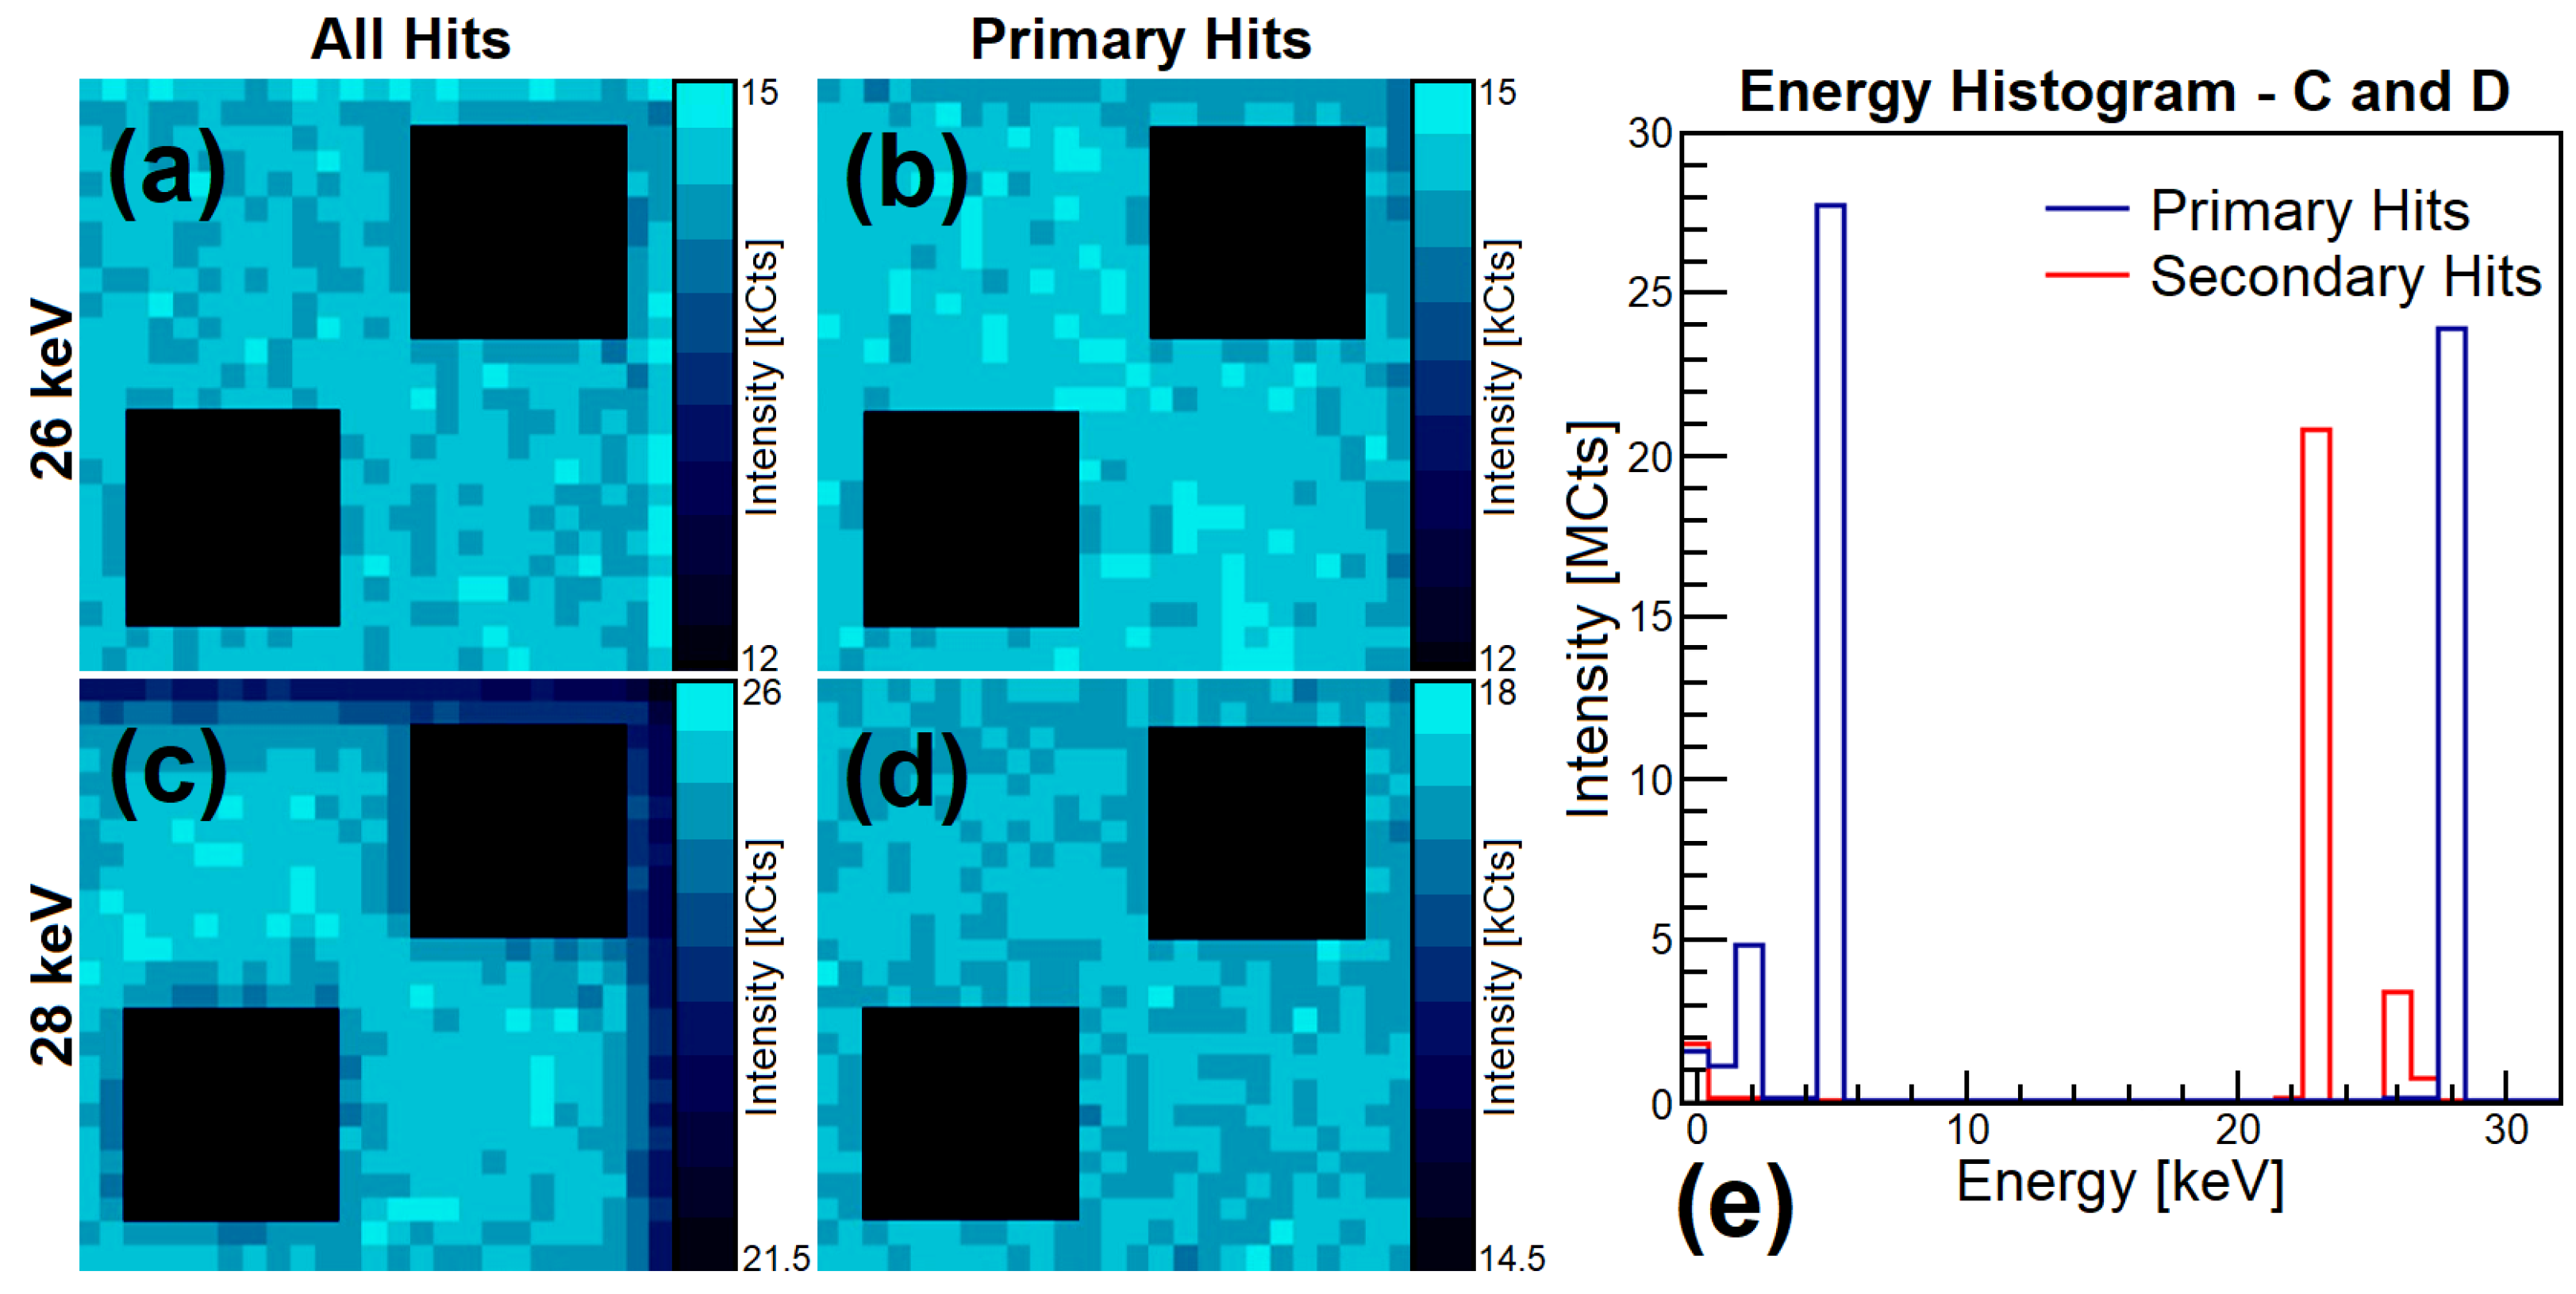
Figure 5.
CNR(E) and imaging results from the main mono-energetic simulation set. (a) CNR(E) analytical curves and simulated data points. (b) IS images for the four spectra, with corresponding CNR values.
Figure 5.
CNR(E) and imaging results from the main mono-energetic simulation set. (a) CNR(E) analytical curves and simulated data points. (b) IS images for the four spectra, with corresponding CNR values.
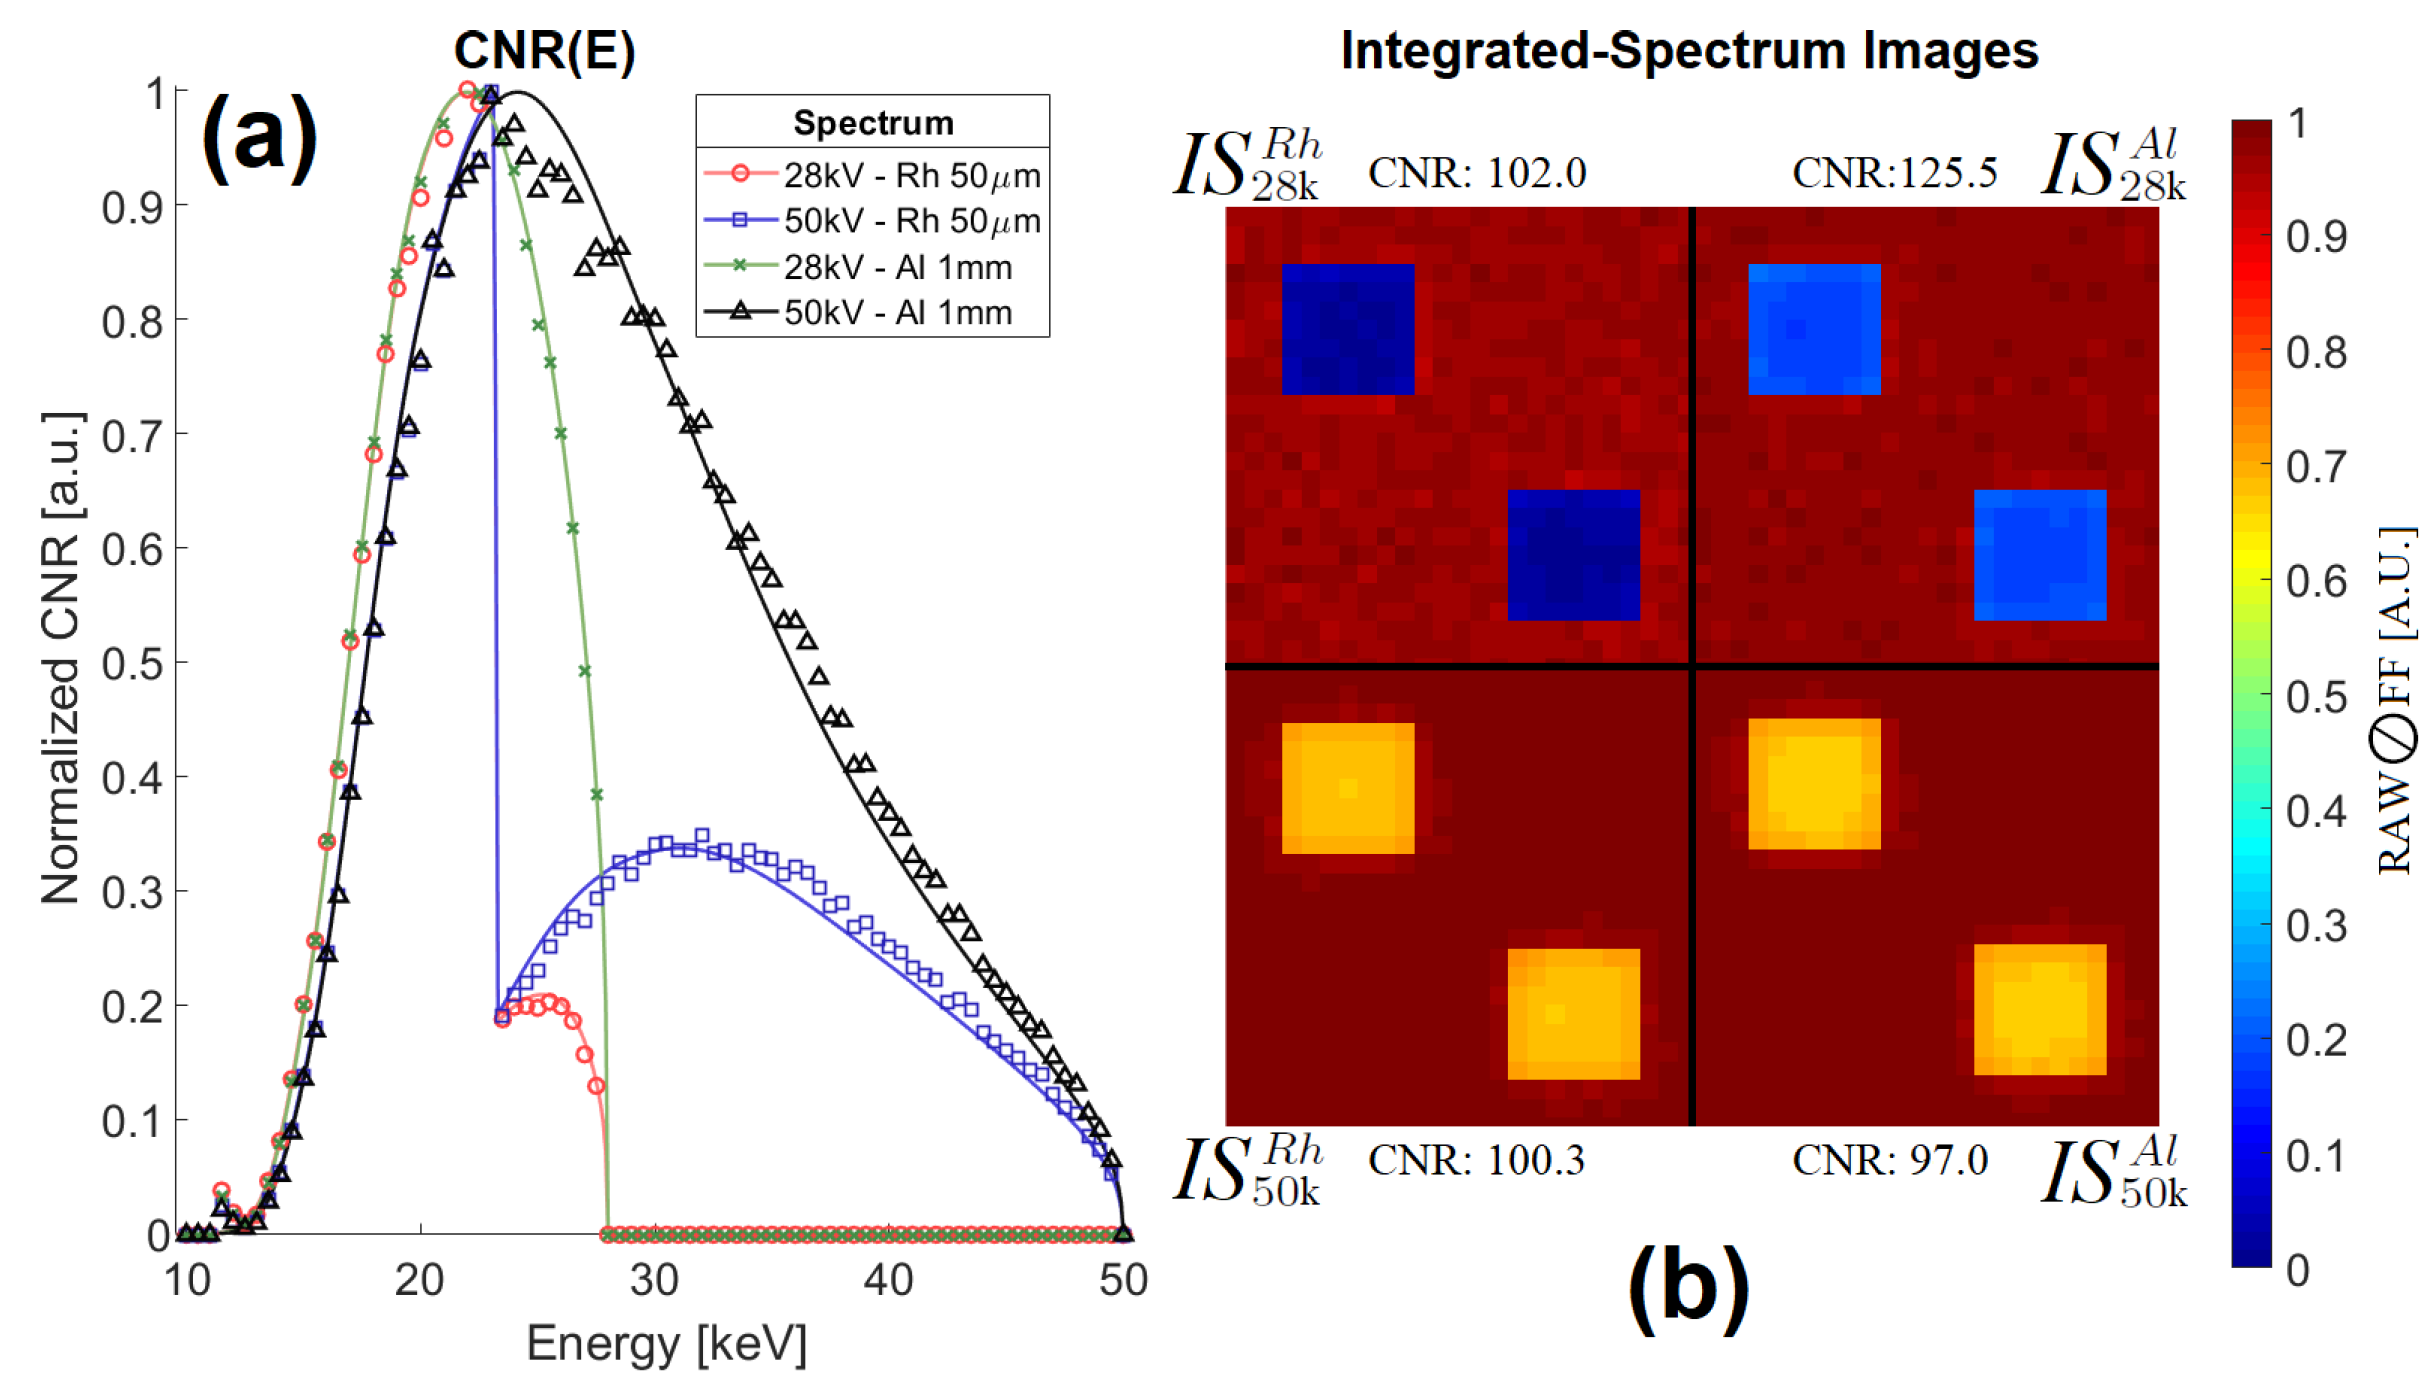
Figure 6.
CIRS015 phantom + 250 cm3 implant images. (a) Selenia Dimensions system, spectrum, 1× standard ESD. (b) Uniandes X-ray imaging setup, spectrum, 5× standard ESD (specks circled in red). (c) Uniandes X-ray imaging setup, spectrum, 1/5 the exposure time of image (b) (specks circled in black).
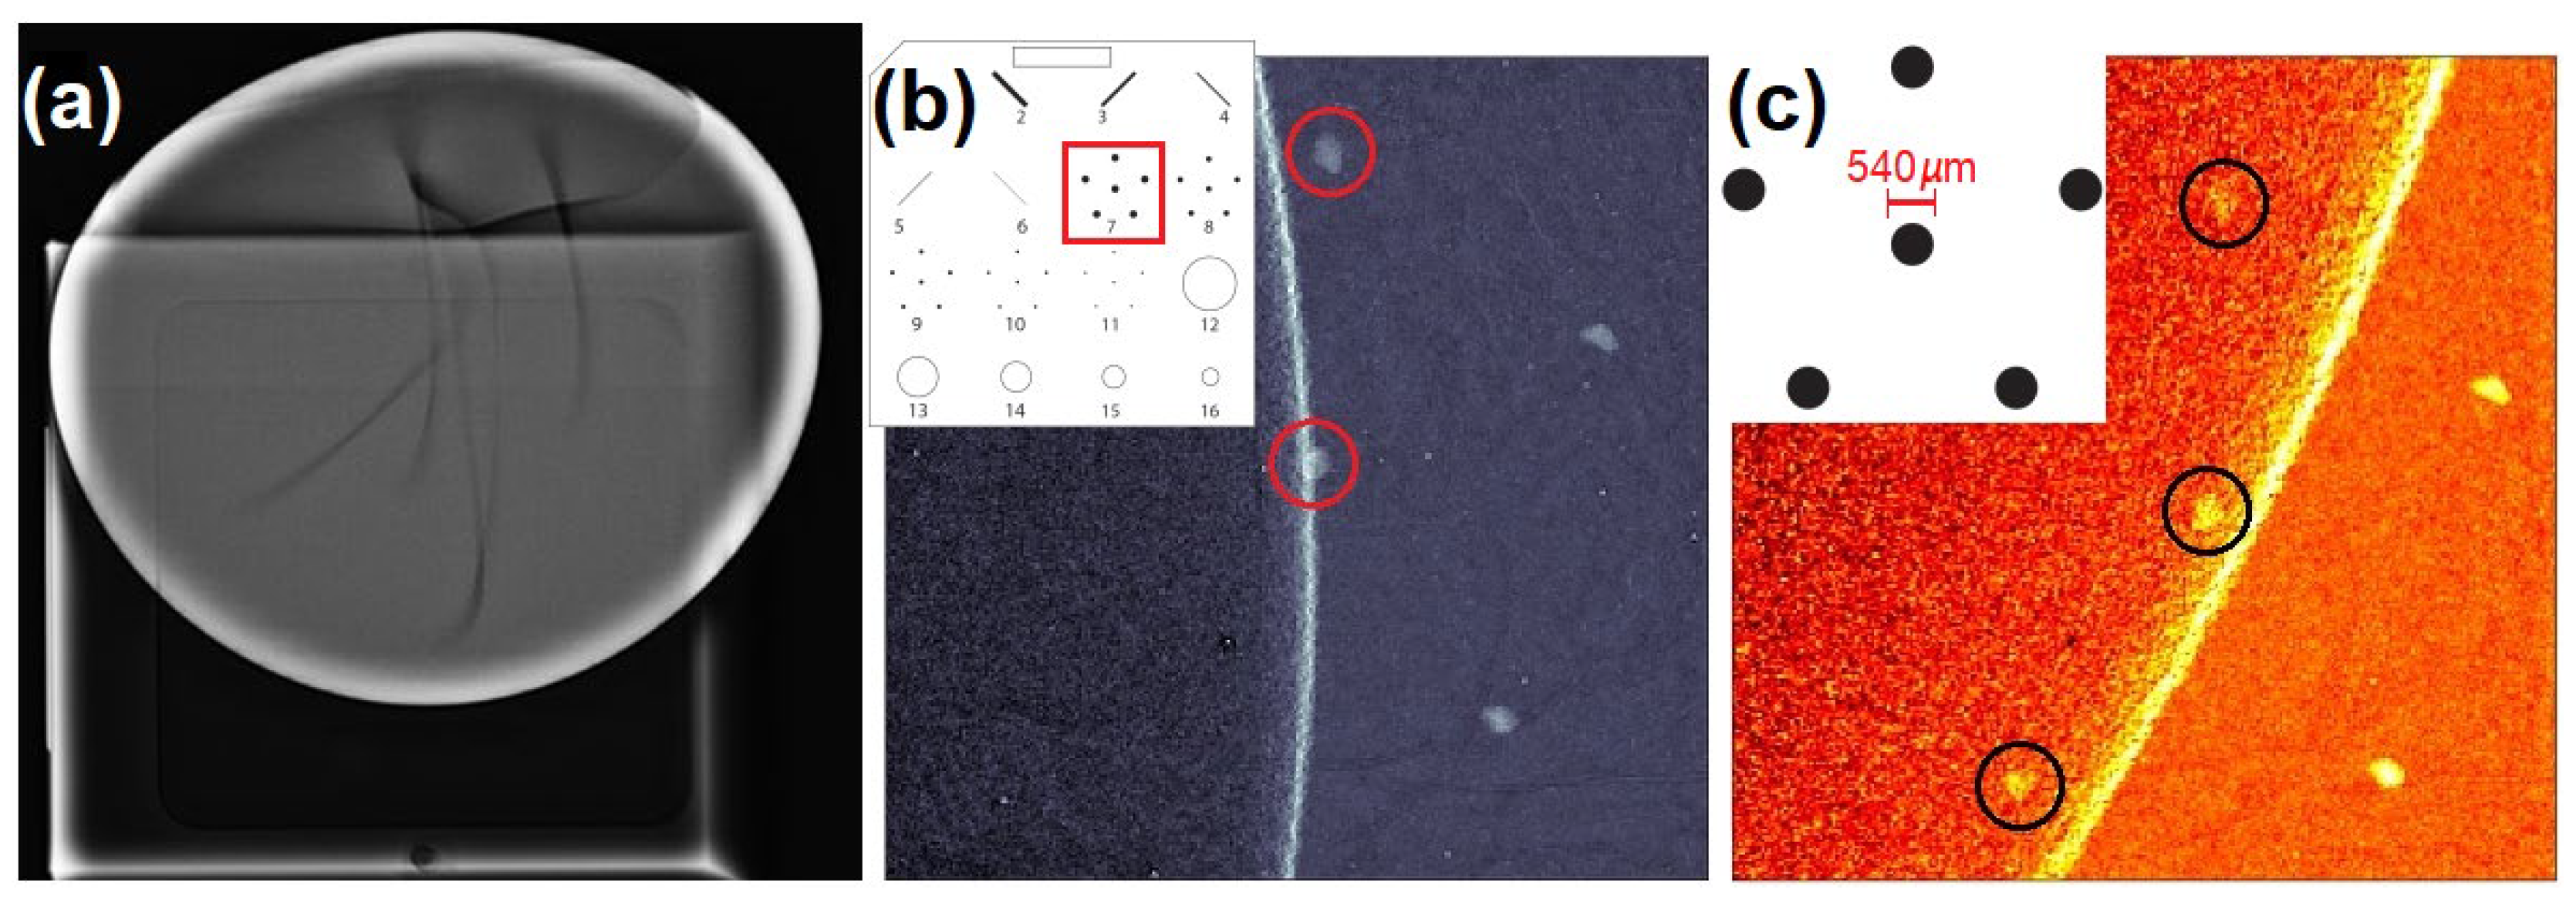
Table 1.
Material definitions for achieving a material with composition 85%/15% glandular-to-adipose ratio breast tissue in simulation.
Table 1.
Material definitions for achieving a material with composition 85%/15% glandular-to-adipose ratio breast tissue in simulation.
| Material | Adipose tissue | Glandular tissue |
|---|---|---|
| Density [] | 0.92 | 1.02 |
| Element | Weight Fraction | |
| Hydrogen | 0.120 | 0.106 |
| Carbon | 0.640 | 0.332 |
| Nitrogen | 0.008 | 0.030 |
| Oxygen | 0.229 | 0.527 |
| Sodium | 0 | 0.001 |
| Sulfur | 0 | 0.002 |
| Chlorine | 0 | 0.001 |
| Phosphor | 0.002 | 0.001 |
| Calcium | 0.001 | 0 |
Disclaimer/Publisher’s Note: The statements, opinions and data contained in all publications are solely those of the individual author(s) and contributor(s) and not of MDPI and/or the editor(s). MDPI and/or the editor(s) disclaim responsibility for any injury to people or property resulting from any ideas, methods, instructions or products referred to in the content. |
© 2026 by the authors. Licensee MDPI, Basel, Switzerland. This article is an open access article distributed under the terms and conditions of the Creative Commons Attribution (CC BY) license (http://creativecommons.org/licenses/by/4.0/).
Copyright: This open access article is published under a Creative Commons CC BY 4.0 license, which permit the free download, distribution, and reuse, provided that the author and preprint are cited in any reuse.


