
Submitted:
24 February 2026
Posted:
26 February 2026
You are already at the latest version
Abstract
Background and Objectives: Substance use disorders (SUDs) are associated with maladaptive neuroplasticity and chronic dysregulation of cortical arousal. EEG provides a non-invasive tool for quantifying these neurophysiological alterations through spectral power and reactivity indices. Prior research consistently reports elevated beta and diminished alpha activity in SUD, reflecting cortical hyperarousal and reduced inhibitory control. This study sought to identify EEG-based markers of dependence-related neurophysiological alterations by integrating rule-based and score-based models incorporating the theta/beta ratio (TBR), alpha and beta powers, hyperarousal index, and alpha-blocking measures. Materials and Methods: EEG recordings from 47 individuals with SUD were systematically analyzed, focusing on frontal and central cortical regions. Spectral parameters were derived using power spectral density estimation, and composite indices were computed via Python-based signal analysis. A rule-based Dependence Likelihood variable and a continuous Dependence Score (0–1 scale) classified cases as dependence-related (≥0.7), borderline (0.5–0.7), or normal (<0.5). Results: Low alpha power and elevated hyperarousal index (mean = 3.45) characterized most participants. Dependence-related EEG profiles were identified in 87.2% of cases (mean score = 0.86). Alpha blocking remained intact in 46.8%, whereas post-hyperventilation recovery was attenuated in 61.7%. Segmental analysis indicated sustained cortical activation with low TBR (0.37) and elevated beta across all conditions. Conclusions: Quantitative EEG analysis revealed consistent hyperarousal and inhibitory deficits in SUD. The combined Dependence Likelihood and Score framework provides an interpretable, reproducible approach for identifying dependence-related EEG signatures and holds promise as a biomarker in addiction neurophysiology.
Keywords:
electroencephalography
; substance use disorder
; cortical hyperarousal
; dependence likelihood
; dependence score
; addiction
1. Introduction
Substance use disorders (SUDs) represents a complex neurobehavioral disorder underpinned by maladaptive neural plasticity and dysregulation of cortical arousal systems. Electroencephalography (EEG) [1], with its high temporal resolution, provides a powerful non-invasive means of capturing these alterations in oscillatory brain dynamics. Over the past two decades, EEG studies have consistently demonstrated that individuals with SUDs exhibit characteristic deviations in resting-state and task-related spectral activity, particularly within the alpha, beta, and theta frequency bands [2,3,4].
Among the most replicated findings is a pattern of increased beta activity accompanied by reduced alpha power, reflecting cortical hyperarousal and impaired inhibitory control. Sokhadze et al. [2] observed that substance-dependent individuals display excessive beta synchronization and attenuated alpha rhythms, indicative of excitatory dominance within the cortical network. Similarly, Rangaswamy et al. [5] linked heightened beta power to relapse vulnerability and deficient self-regulation. Complementary results from Ceballos et al. [6] and Bel-Bahar et al. [7] further support that this imbalance persists even during resting conditions, suggesting that hyperarousal constitutes a stable neurophysiological trait rather than a transient withdrawal effect.
The theta-to-beta ratio (TBR) has emerged as an integrative marker of cortical activation and attentional regulation. Low TBR values (< 1.0) are typically associated with dominance of high-frequency beta oscillations over slower theta waves, a pattern linked to impulsivity and hypervigilance [8,9]. Conversely, normalization or elevation of TBR corresponds to improved inhibitory control and relaxed attentional states [10]. These findings outline a “hyperaroused–disinhibited” EEG phenotype frequently observed in chronic substance users.
Another sensitive marker of cortical regulation is alpha blocking, the suppression of alpha power upon eye opening [11]. In healthy adults, strong alpha blocking reflects adaptive sensory gating and intact cortical inhibition. In contrast, impaired or absent alpha suppression among dependent individuals points to weakened top-down inhibitory control and reduced cortical reactivity [7]. Supporting evidence from Fathi et al. [12] demonstrates that restoring alpha coherence and reducing excessive beta power through neurofeedback interventions can normalize cortical excitability and enhance abstinence outcomes.
Building upon this body of evidence, we implemented a rule-based quantitative EEG framework to identify dependence-related neurophysiological patterns. Each EEG record was evaluated across multiple spectral parameters, including Theta/Beta Ratio < 1.0, Alpha Relative Power < 0.30, Beta Relative Power > 0.25, Hyperarousal Index ≥ 2.0, and Alpha Blocking = Impaired. EEGs meeting all these criteria were classified as Dependence-Likely, representing the hyperaroused–disinhibited cortical state consistently described across prior studies. This standardized computational approach enables interpretable and reproducible detection of d fıstıkependence-linked EEG features and offers a promising neurophysiological framework for precision assessment and monitoring in addiction research.
2. Materials and Methods
2.1. Ethical Consideration
The study was conducted in accordance with the Declaration of Helsinki and was approved by the Institutional Review Board of {Blinded University} (protocol code: 24-177, date of approval: 2024-10-17).
2.2. Study Design and Participants
This retrospective study included EEG recordings and clinical data from 47 individuals diagnosed with SUDs who were admitted to the addiction treatment unit of Moodist Hospital between 2024-2025. EEG data from patients diagnosed with SUDs who presented to our psychiatry clinic were retrospectively included in the study if their records contained available EEG recordings. Patients with a history of epilepsy, neurodegenerative disorders, or other neurological or systemic conditions that could potentially affect EEG patterns were excluded. This approach ensured that the analyses specifically reflected electrophysiological alterations associated with substance use.
Demographic and clinical information was obtained from patient medical records and included age, gender, educational and marital status, employment and economic status, physical health, history of psychiatric treatment or medication use, history of suicide attempt, and type and frequency of substance use. Additional variables such as previous addiction treatment and family history of addiction were also recorded.
All participants were diagnosed with SUDs according to the Diagnostic and Statistical Manual of Mental Disorders, Fifth Edition (DSM-5) criteria [13]. Individuals with major neurological disorders, severe head trauma, or incomplete EEG data were excluded from the analysis.
2.3. EEG Recording Procedure
EEG recordings were obtained using a Neurosoft Neuro-NRS “Neuron-Spectrum” system (Neurosoft, Ivanovo, Russia) with 19 scalp electrodes placed according to the international 10–20 system. Data were stored in European Data Format (.edf) files [14]. All recordings were visually inspected for quality, and channels containing excessive noise or artifacts were excluded prior to analysis. EEG data preprocessing and quantitative analyses were performed using MNE-Python (v0.14) [15].
Each EEG session consisted of seven standardized segments: background activity, eyes open, eyes closed, hyperventilation, after hyperventilation, flash stimulation, and after flash stimulation [16]. Background, eyes open, and eyes closed segments were successfully obtained in all cases (100%). Hyperventilation and after-hyperventilation segments were present in 95.7% of recordings, while flash stimulation and after-flash stimulation segments were available in 91.5% and 61.7% of cases, respectively (shown in Table 1).
The mean durations of EEG segments were as follows: background activity – 149 s, eyes open – 73 s, eyes closed – 222 s, hyperventilation – 172 s, after hyperventilation – 277 s, flash stimulation – 333 s, and after flash stimulation – 473 s (shown in Figure 1). Segment boundaries were visually confirmed to ensure consistent epoching across participants. Participants were instructed to remain still, avoid blinking during stimulation, and maintain regular breathing to minimize artifacts throughout the recording.
2.4. Channel Selection and Signal Analysis
EEG recordings were obtained from 19 scalp electrodes following the international 10–20 system. For the present analysis, a subset of frontal and central electrodes (FZ–CZ, FP1–F3, FP1–F7, FP2–F4, FP2–F8, F3–C3, F4–C4, C3–P3, C4–P4, CZ–PZ) was selected [16]. This selection was based on prior evidence indicating that frontal regions are critically involved in executive control, attention, and inhibitory processing—functions frequently impaired in addiction—while central regions reflect sensorimotor and cortical arousal activity, providing complementary insights into brain regulation [17].
The raw EEG signals were preprocessed using MNE-Python. After filtering to remove artifacts and noise, power spectral density (PSD) was estimated using Welch’s method (Welch, 1967) as implemented in the MNE-Python library [18,19]. From the PSD, absolute and relative power values were extracted for the delta (1–4 Hz), theta (4–8 Hz), alpha (8–13 Hz), and beta (13–30 Hz) frequency bands. Additionally, the theta/beta power ratio (TBR) was calculated as an indicator of cortical arousal and attentional control.
To facilitate statistical analysis and reduce feature dimensionality, band powers from all frontal and central channels were averaged separately, resulting in mean frontal and central values for each frequency band and for the TBR metric (shown in Table 2). These aggregated measures were then exported to an Excel dataset for further group-level statistical comparisons. A schematic overview of the complete EEG data processing and feature extraction workflow is illustrated in Figure 2.
2.5. Derived EEG Feature Extraction
From the processed EEG data, a set of derived quantitative indices was calculated to capture individual differences in cortical reactivity, arousal balance, and dependence-related neurophysiological patterns. The most relevant measures included the Alpha Blocking Ratio (eyes-closed / eyes-open alpha power), the Theta/Beta Ratio (TBR) as an indicator of attentional control and cortical arousal, the Hyperarousal Index (beta / alpha power ratio), and the Cortical Reactivity Index (CRI) reflecting alpha modulation during stimulation and recovery periods.
In addition, composite variables such as the Dependence Likelihood and Homeostatic Recovery Score were derived to represent higher-order patterns related to physiological regulation and addiction-related EEG responses. A complete list of the derived EEG variables, their definitions, and calculation methods is provided in Table 3.
2.6. Dependence Likelihood Determination and Scoring Framework
To quantify addiction-related neurophysiological patterns, a composite measure termed Dependence Likelihood was established. This index integrates multiple EEG-derived parameters associated with cortical arousal, inhibitory control, and self-regulatory balance, domains frequently altered in SUDs.
The rule-based definition was as follows:
“Yes”: (TBR < 1.0) AND (Background Activity Alpha Relative Mean < 0.30) AND (Background Activity Beta Relative Mean > 0.25) AND (Hyperarousal Index ≥ 2.0) AND (Alpha Blocking Intact = No)
“No”: Otherwise
Each threshold reflects established physiological evidence: low theta/beta ratio and low alpha power indicate insufficient cortical inhibition; high beta power and elevated hyperarousal index indicate excessive excitatory drive; and absent alpha blocking denotes deficient cortical modulation. Collectively, these parameters represent a state of hyperarousal with impaired inhibitory regulation, characteristic of dependence-related EEG profiles.
In addition to the rule-based classification, a continuous Dependence Score was calculated to quantify the multidimensional contribution of EEG features on a normalized scale (0–1). Variable definitions and normalization approaches are presented in Table 4.
The composite score was computed as:
Dependence Score = 0.25 × (1 − TBR_norm) + 0.25 × Beta_norm + 0.25 × HRI_norm + 0.15 × (1 − Alpha_norm) + 0.10 × AlphaBlocking_def
This formulation weights inhibitory deficits (low TBR and low alpha) and excitatory dominance (high beta and hyperarousal) more heavily, while incorporating alpha blocking as a modulatory factor.
For interpretability, a combined decision rule was applied:
Dependence-related if Dependence Score ≥ 0.7 or Dependence Likelihood = “Yes”
Borderline if 0.5 ≤ Dependence Score < 0.7
Normal pattern if Dependence Score < 0.5
2.7. Statistical Analyses and Tools
All statistical analyses were performed using Wistats v3.0 (WisdomEra Corp., Istanbul, Turkey), an integrated Python-based platform for statistical evaluation and machine learning. The software incorporates key analytical libraries including SciPy, scikit-learn, and statsmodels, allowing seamless execution of both classical and data-driven analyses within the same computational environment.
Descriptive statistics were calculated for all demographic, clinical, and EEG-derived variables. Comparative analyses between groups or EEG-based categories were performed using appropriate parametric or non-parametric tests according to data distribution, as assessed by Shapiro–Wilk, skewness, and kurtosis tests. Chi-square or Fisher’s exact tests were used for categorical variables, while independent-samples t-test, Mann–Whitney U, or Kruskal–Wallis tests were applied for continuous variables. Correlation analyses were conducted using Spearman’s or Pearson’s coefficients as appropriate. Statistical significance was set at p < 0.05.
3. Results
3.1. Participant Characteristics
A total of 47 patients diagnosed with SUDs were included in the study. Case characteristics are presented in Table 6. The majority of participants were male (76.6%), with a mean age of 31.6 years. Most participants were single (59.6%), had completed university or high school education (53.2% and 27.7%, respectively), and reported medium-to-high economic status (93.6%). Approximately half of the sample were employed (53.2%) and living with their families (46.8%). A psychiatric treatment history was present in 83.0% of cases, and 72.3% reported previous psychiatric drug use. Suicide attempts were reported by 6.4%. Family history of addiction was found in 12.8% of participants. The most common addictive substances were alcohol (48.9%), cannabis (42.6%), and cocaine (23.4%); poly-substance use (≥2 substances) was observed in 42.5% of cases.
3.2. Derived EEG Variables
Quantitative EEG analysis revealed that all participants demonstrated low alpha power status (100%) and high hyperarousal index values (mean = 3.45). The dependence-related EEG pattern was observed in 87.2% of cases, while 8.5% exhibited borderline patterns and 4.3% showed normal findings. The mean dependence score was 0.86, indicating pronounced cortical arousal and imbalance between alpha and beta activity. (Figure 4)
Regarding specific EEG indices, 53.2% of patients showed a hyperaroused dependence pattern, whereas 46.8% were classified as balanced. The alpha blocking ratio averaged 1.60, and 46.8% of participants retained intact alpha blocking. After-hyperventilation alpha recovery was low in 61.7%, and after-flash alpha rebound was absent in 70.2%.
3.3. Segment-Based Spectral Power Analysis
PSD analyses calculated by Welch’s method from frontal and central electrodes demonstrated the following mean theta/beta ratios across conditions: background 0.63, eyes open 0.54, eyes closed 0.54, hyperventilation 0.37, after hyperventilation 0.55, flash stimulation 0.65, and after flash stimulation 0.53. Alpha relative power remained consistently low (0.07–0.09) across all conditions, while beta relative power was elevated (0.22–0.29), consistent with a hyperarousal profile. Gamma and delta relative powers were generally low (0.02–0.15). These findings reflect sustained cortical activation and reduced inhibitory regulation during both baseline and stimulation segments. (Figure 5)
Collectively, EEG findings in patients with SUDs indicate a predominant hyperarousal pattern, characterized by decreased alpha activity, elevated beta power, and low theta/beta ratios during hyperventilation. The quantitative indices support the presence of dependence-related cortical dysregulation, consistent with neurophysiological models of addictive behavior (shown in Table 5).
4. Discussion
The present study identified a consistent hyperaroused–disinhibited cortical profile among individuals with SUDs, characterized by low alpha power, elevated beta activity, and reduced theta/beta ratios across EEG segments. Quantitative indices revealed that 87.2% of participants exhibited dependence-related EEG patterns, while the mean Dependence Score (0.86) indicated pronounced cortical excitation and diminished inhibitory regulation. These findings align with the theoretical framework of addiction as a state of sustained cortical hyperarousal and impaired top-down control, supporting the potential of EEG-based biomarkers for objective assessment of dependence severity.
Prior EEG studies in addiction have consistently reported increased beta synchronization and reduced alpha rhythms, reflecting excessive cortical excitability and deficient inhibitory control [2,3,6]. Similarly, the TBR has emerged as a sensitive marker of attentional regulation and arousal balance, where low TBR values (<1.0) indicate impulsivity and hypervigilance [8,9]. The current findings replicate and extend these results by demonstrating that such spectral imbalances persist across multiple stimulation conditions, including hyperventilation and flash segments, suggesting a trait-like neurophysiological signature rather than a transient state effect.
The present findings regarding the theta/beta ratio (TBR) align with recent evidence emphasizing its role as a sensitive marker of cortical arousal and attentional regulation. A study titled “The EEG Theta/Beta Ratio: A Marker of Arousal or Cognitive Processing Capacity?” demonstrated that lower TBR values are associated with increased cortical excitation, impulsivity, and hypervigilance, reflecting a dominance of fast-frequency beta oscillations over slower theta rhythms [20]. This interpretation supports the current observation that participants exhibiting reduced TBR values also presented elevated beta power and diminished alpha activity, consistent with a hyperaroused–disinhibited cortical profile. Together, these findings reinforce the view that diminished TBR may represent a stable electrophysiological correlate of impaired inhibitory control in substance use disorders.
Unlike prior research that analyzed single spectral parameters or opaque multivariate models, this study introduces a transparent, mathematically defined composite score integrating inhibitory (TBR, alpha) and excitatory (beta, hyperarousal) features with a modulatory alpha-blocking term. The Dependence Score formula
(0.25×(1−TBR_norm) + 0.25×Beta_norm + 0.25×HRI_norm + 0.15×(1−Alpha_norm) + 0.10×AlphaBlocking_def)
enables interpretable quantification of cortical dysregulation on a 0–1 scale, with explicit thresholds for clinical interpretability. To our knowledge, comparable weighted and normalized scoring systems have not been explicitly described in addiction EEG literature [3,6].
The combined rule-based and continuous scoring approach offers multiple advantages:
Interpretability: Clear weighting and thresholding allow replication and clinical translation.
Granularity: Borderline scoring (0.5–0.7) captures intermediate regulation states often missed by binary classification.
Reproducibility: The explicit formula enables comparison across datasets and laboratories.
This framework thus bridges the gap between traditional spectral EEG analysis and clinically usable biomarkers, potentially supporting relapse risk assessment and personalized treatment monitoring.
While the weighting scheme was guided by empirical rationale, it remains heuristic and should be validated in larger, independent cohorts. The sample size was modest and restricted to patients with established SUD; future studies should examine whether the same scoring framework discriminates between active users, abstinent individuals, and healthy controls. Moreover, optimization of weights via machine-learning algorithms and evaluation of test–retest reliability would strengthen the robustness of this model.
5. Conclusions
In conclusion, this study provides empirical evidence that cortical hyperarousal and reduced inhibitory regulation dominate the EEG profile of individuals with SUD. The proposed Dependence Score and decision-rule system offers a novel, interpretable, and standardized method for quantifying these neurophysiological patterns. Future validation studies may establish its value as an EEG-based biomarker for clinical monitoring and treatment response in addiction research.
Author Contributions
Conceptualization: Merve Setenay Gürbüz, Kültegin Ögel; Methodology: Merve Setenay Gürbüz; Investigation: Eslem Fulya Ekşi; Resources: Eslem Fulya Ekşi; Data Curation: Merve Setenay Gürbüz; Visualization: Merve Setenay Gürbüz, Eslem Fulya Ekşi; Writing – Original Draft Preparation: Merve Setenay Gürbüz; Writing – Review & Editing: Merve Setenay Gürbüz, Özlem Gül, Kültegin Ögel; Supervision: Özlem Gül, Kültegin Ögel.
Funding
This research received no external funding.
Institutional Review Board Statement
The study was conducted in accordance with the Declaration of Helsinki, and approved by the Institutional Review Board of Istinye University (protocol code 24-177 and October 17, 2024).
Informed Consent Statement
Patient consent was waived because the study was designed as a retrospective analysis of anonymized medical records, involved no direct patient contact or intervention, and posed no foreseeable risk to participants. The Institutional Review Board approved the waiver of informed consent in accordance with national regulations and the Declaration of Helsinki.
Data Availability Statement
The data produced and examined in the present study are available through the Istinye University Dataset Sharing Platform. De-identified clinical datasets may be accessed via the following link: https://dataset.istinye.edu.tr/dataset?did=64. All records were anonymized in full compliance with applicable ethical standards. Data access is granted exclusively for research use within a controlled-access framework, in accordance with the platform’s established data-sharing and licensing policies. The shared dataset contains de-identified, processed variables suitable for analysis rather than raw clinical records to ensure compliance with ethical and data-protection standards.
Acknowledgments
We gratefully acknowledge the Artificial Intelligence Research and Application Center of Istinye University for their contribution to the technical evaluation of the manuscript, including the assessment of data integrity and pre-submission plagiarism checks. In addition, we thank the Ditako Data Analytics Team for their expert support in statistical analysis and software applications, which enhanced the methodological rigor and reliability of the study findings.
Conflicts of Interest
None of the authors has any potential financial conflict of interest related to this manuscript.
Abbreviations
The following abbreviations are used in this manuscript:
| Abbreviation | Definition |
| EEG | Electroencephalography |
| SUD | Substance Use Disorder |
| TBR | Theta/Beta Ratio |
| HRI | Hyperarousal Index |
| CRI | Cortical Reactivity Index |
| PSD | Power Spectral Density |
| DSM-5 | Diagnostic and Statistical Manual of Mental Disorders, Fifth Edition |
| MNE | Magnetoencephalography and Electroencephalography (MNE-Python analysis framework) |
| EDF | European Data Format |
| IFNC | International Federation of Clinical Neurophysiology |
| ADHD | Attention-Deficit/Hyperactivity Disorder |
References
- Tudor, M.; Tudor, L.; Tudor, K.I. [Hans Berger (1873-1941)--the history of electroencephalography]. Acta Medica Croat Cas Hravatske Akad Med Znan 2005, 59, 307–313. [Google Scholar]
- Sokhadze, T.M.; Cannon, R.L.; Trudeau, D.L. EEG biofeedback as a treatment for substance use disorders: review, rating of efficacy, and recommendations for further research. Appl Psychophysiol Biofeedback 2008, 33, 1–28. [Google Scholar] [CrossRef] [PubMed]
- Bel-Bahar, T.S.; Khan, A.A.; Shaik, R.B.; Parvaz, M.A. A scoping review of electroencephalographic (EEG) markers for tracking neurophysiological changes and predicting outcomes in substance use disorder treatment. Front Hum Neurosci 2022, 16, 995534. [Google Scholar] [CrossRef] [PubMed]
- Liu, Y.; Chen, Y.; Fraga-González, G.; Szpak, V.; Laverman, J.; Wiers, R.W.; et al. Resting-state EEG, Substance use and Abstinence After Chronic use: A Systematic Review. Clin EEG Neurosci 2022, 53, 344–366. [Google Scholar] [CrossRef] [PubMed]
- Rangaswamy, M.; Porjesz, B.; Chorlian, D.B.; Wang, K.; Jones, K.A.; Bauer, L.O.; et al. Beta power in the EEG of alcoholics. Biol Psychiatry 2002, 52, 831–842. [Google Scholar] [CrossRef] [PubMed]
- Ceballos, N.A.; Bauer, L.O.; Houston, R.J. Recent EEG and ERP Findings in Substance Abusers. Clin EEG Neurosci Off J EEG Clin Neurosci Soc ENCS 2009, 40, 122–128. [Google Scholar] [CrossRef] [PubMed]
- Bel-Bahar, T.S.; Khan, A.A.; Shaik, R.B.; Parvaz, M.A. A scoping review of electroencephalographic (EEG) markers for tracking neurophysiological changes and predicting outcomes in substance use disorder treatment. Front Hum Neurosci 2022, 16. [Google Scholar] [CrossRef] [PubMed]
- Azami, H.; Zrenner, C.; Brooks, H.; Zomorrodi, R.; Blumberger, D.M.; Fischer, C.E.; et al. Beta to theta power ratio in EEG periodic components as a potential biomarker in mild cognitive impairment and Alzheimer’s dementia. Alzheimers Res Ther 2023, 15, 133. [Google Scholar] [CrossRef] [PubMed]
- Angelidis, A.; Hagenaars, M.; van Son, D.; van der Does, W.; Putman, P. Do not look away! Spontaneous frontal EEG theta/beta ratio as a marker for cognitive control over attention to mild and high threat. Biol Psychol 2018, 135, 8–17. [Google Scholar] [CrossRef]
- Enriquez-Geppert, S.; Krc, J.; van Dijk, H.; deBeus, R.J.; Arnold, L.E.; Arns, M. Theta/Beta Ratio Neurofeedback Effects on Resting and Task-Related Theta Activity in Children with ADHD. Appl Psychophysiol Biofeedback 2024. [Google Scholar] [CrossRef] [PubMed]
- Barry, R.J.; Clarke, A.R.; Johnstone, S.J.; Magee, C.A.; Rushby, J.A. EEG differences between eyes-closed and eyes-open resting conditions. Clin Neurophysiol Off J Int Fed Clin Neurophysiol 2007, 118, 2765–2773. [Google Scholar] [CrossRef]
- Fathi, M.; Ebrahimi, M.N.; Banazadeh, M.; Shirvani, A.; Kamalahmadi, N.; Amiri, H.; et al. A systematic review on the role of EEG and fMRI-Neurofeedback training in the treatment of substance use disorders and behavioral addiction. Psychiatry Res 2025, 349, 116474. [Google Scholar] [CrossRef] [PubMed]
- First, M.B. Diagnostic and statistical manual of mental disorders, 5th edition, and clinical utility. J Nerv Ment Dis 2013, 201, 727–729. [Google Scholar] [CrossRef] [PubMed]
- Kemp, B.; Värri, A.; Rosa, A.C.; Nielsen, K.D.; Gade, J. A simple format for exchange of digitized polygraphic recordings. Electroencephalogr Clin Neurophysiol 1992, 82, 391–393. [Google Scholar] [CrossRef] [PubMed]
- Gramfort, A.; Luessi, M.; Larson, E.; Engemann, D.A.; Strohmeier, D.; Brodbeck, C.; et al. MEG and EEG data analysis with MNE-Python. Front Neurosci 2013, 7, 267. [Google Scholar] [CrossRef] [PubMed]
- Nuwer, M.R.; Comi, G.; Emerson, R.; Fuglsang-Frederiksen, A.; Guérit, J.-M.; Hinrichs, H.; et al. IFCN standards for digital recording of clinical EEG. Electroencephalogr Clin Neurophysiol 1998, 106, 259–261. [Google Scholar] [CrossRef] [PubMed]
- Goldstein, R.Z.; Volkow, N.D. Dysfunction of the prefrontal cortex in addiction: neuroimaging findings and clinical implications. Nat Rev Neurosci 2011, 12, 652–669. [Google Scholar] [CrossRef] [PubMed]
- Gramfort, A.; Luessi, M.; Larson, E.; Engemann, D.A.; Strohmeier, D.; Brodbeck, C.; et al. MEG and EEG data analysis with MNE-Python. Front Neurosci 2013, 7, 267. [Google Scholar] [CrossRef] [PubMed]
- Virtanen, P.; Gommers, R.; Oliphant, T.E.; Haberland, M.; Reddy, T.; Cournapeau, D.; et al. SciPy 1.0: fundamental algorithms for scientific computing in Python - Nature Methods. Nat Methods 2020, 17, 261–272. [Google Scholar] [CrossRef] [PubMed]
- Clarke, A.R.; Barry, R.J.; Karamacoska, D.; Johnstone, S.J. The EEG Theta/Beta Ratio: A marker of Arousal or Cognitive Processing Capacity? Appl Psychophysiol Biofeedback 2019, 44, 123–129. [Google Scholar] [CrossRef] [PubMed]
Figure 1.
Segment-based EEG recording protocol and mean durations. Segment timeline showing seven standardized EEG phases with bar lengths proportional to mean durations (s): 149, 73, 222, 172, 277, 333, and 473, respectively.
Figure 1.
Segment-based EEG recording protocol and mean durations. Segment timeline showing seven standardized EEG phases with bar lengths proportional to mean durations (s): 149, 73, 222, 172, 277, 333, and 473, respectively.
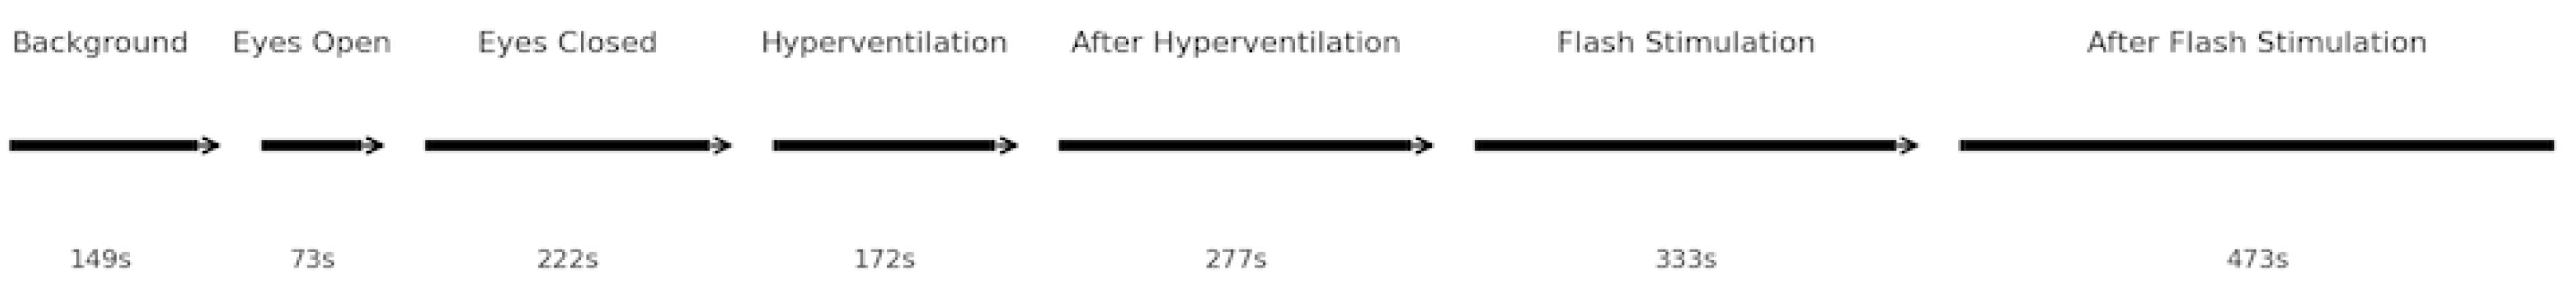
Figure 2.
EEG Data Processing and Feature Extraction Workflow. A schematic overview of the data processing pipeline. Raw EEG recordings were preprocessed using artifact rejection and band-pass filtering. Power spectral density (PSD) was computed via Welch’s method, followed by derivation of absolute and relative band powers (delta, theta, alpha, beta). Feature extraction included computation of the Theta/Beta Ratio (TBR), Hyperarousal Index (HRI), Alpha Blocking Ratio, and other derived indices used in the Dependence Likelihood and Dependence Score analyses.
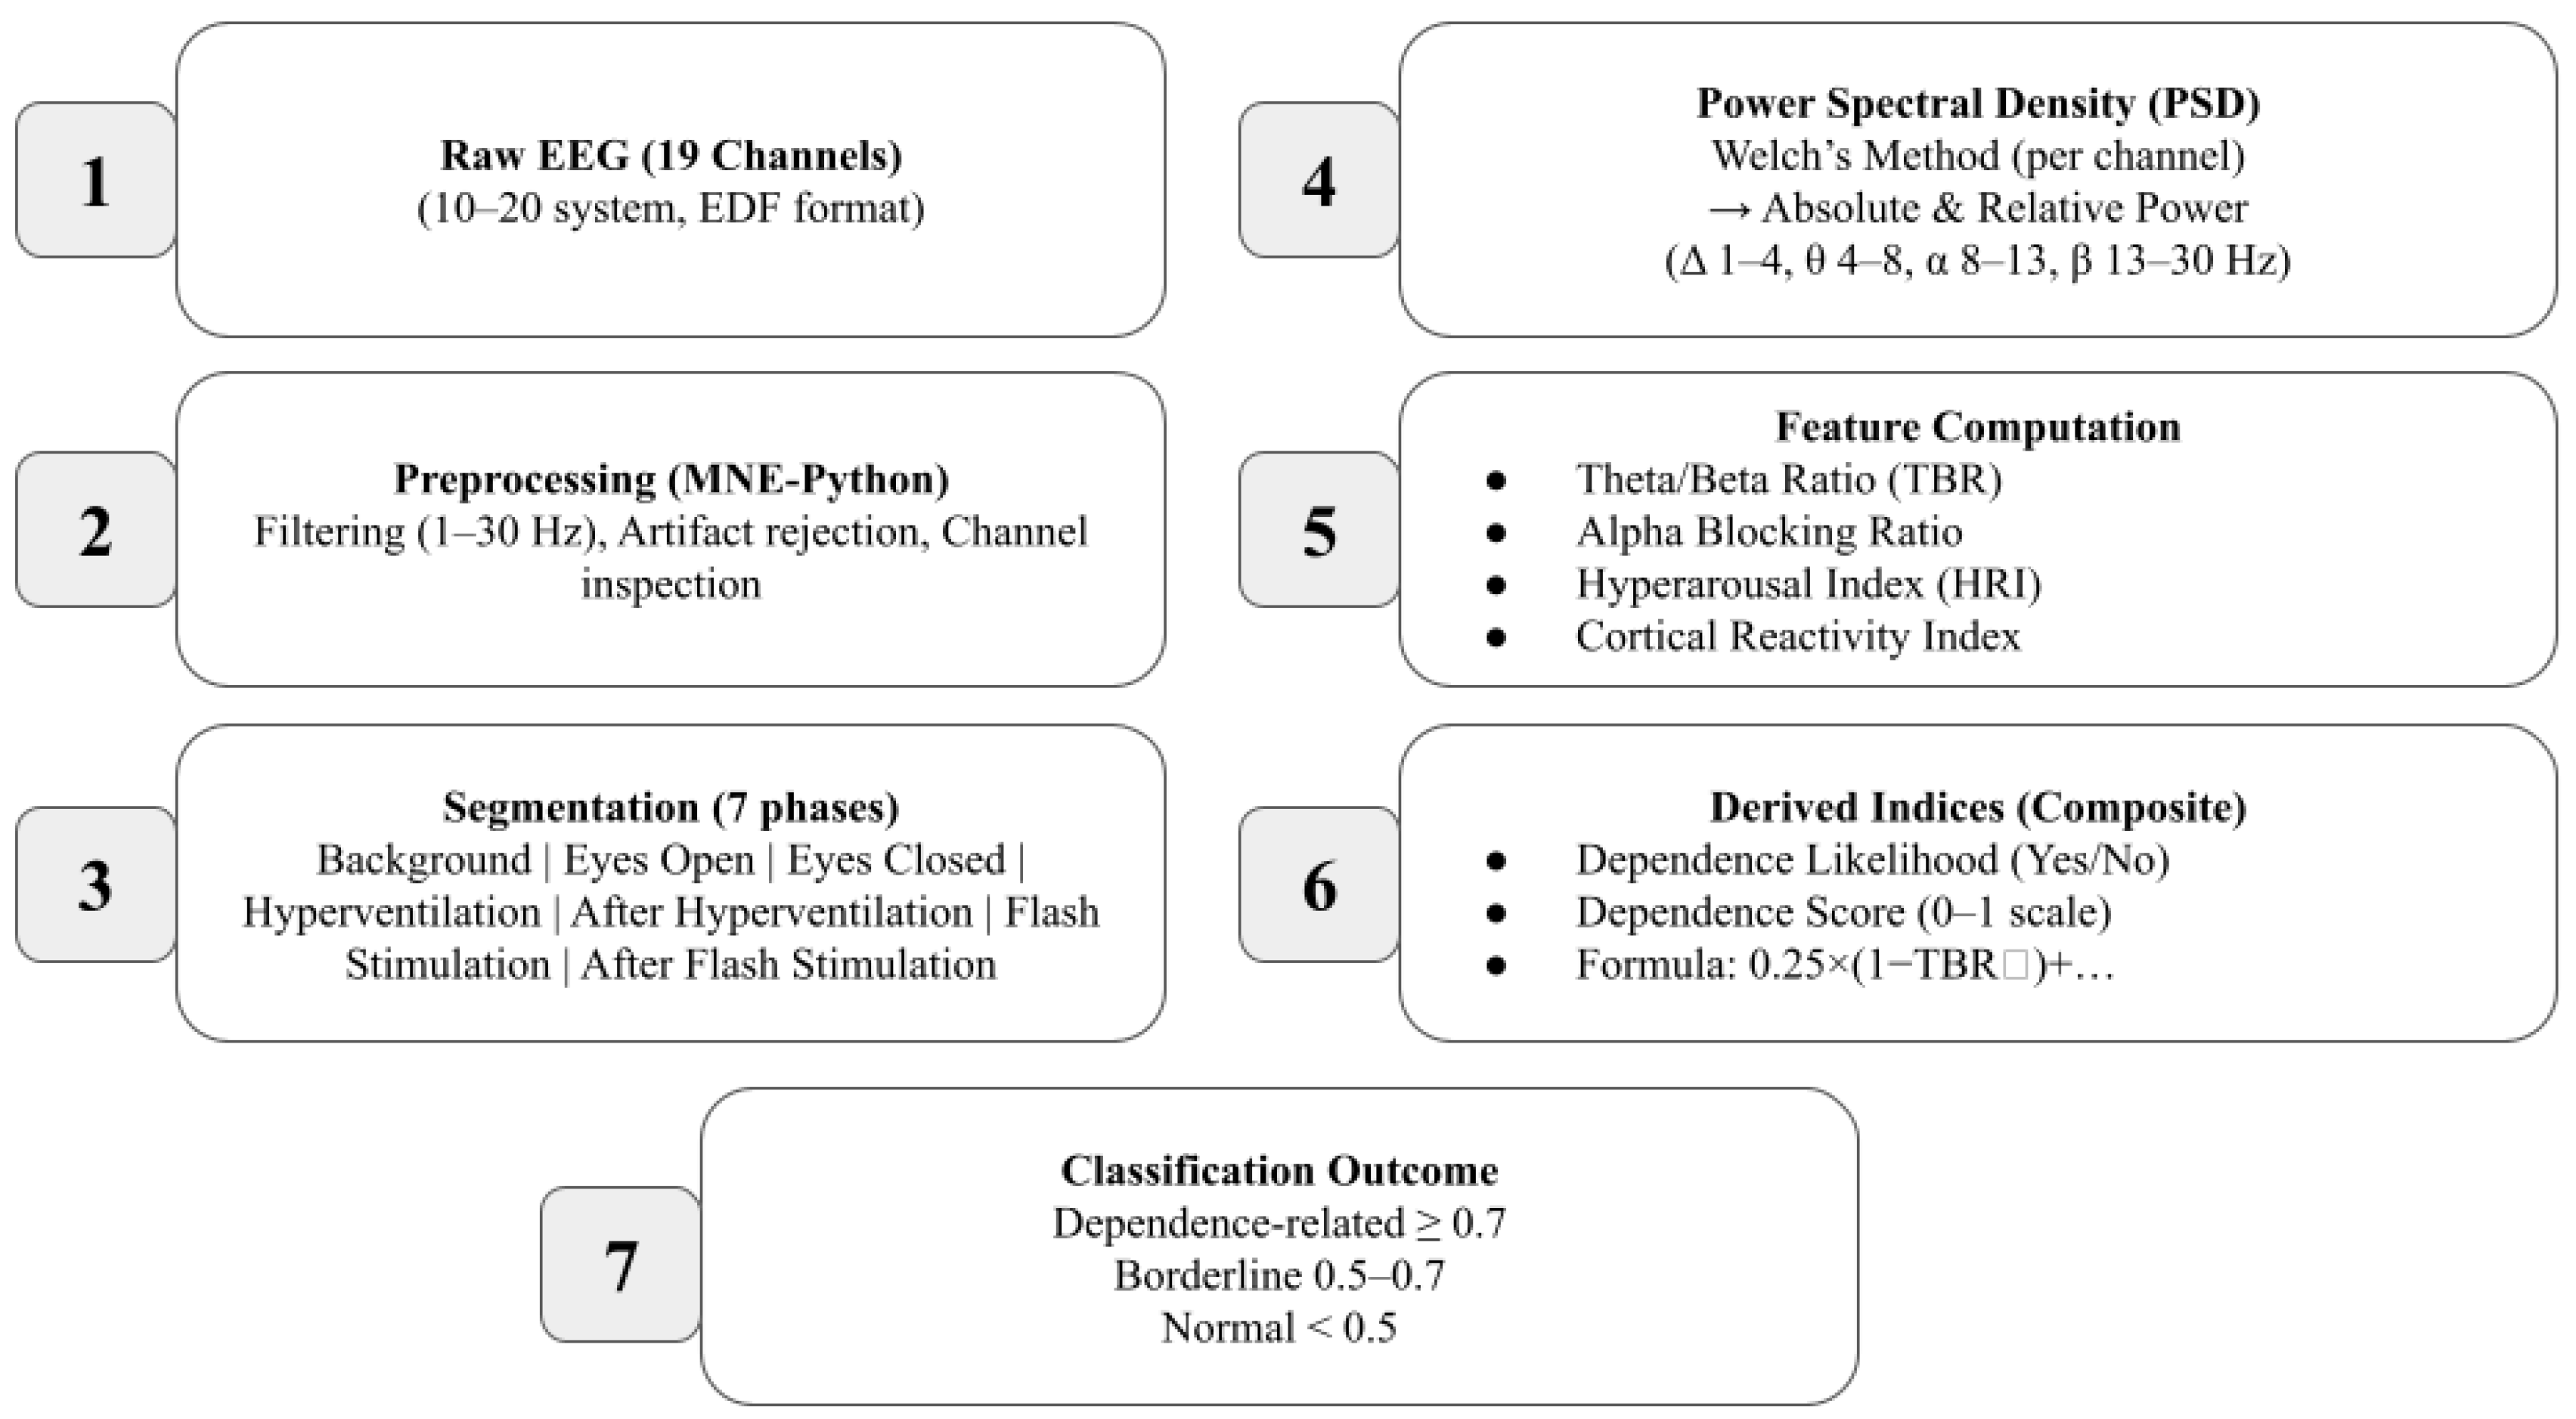
Figure 3.
Dependence Score Computation and Classification Thresholds. (A) Weighted contribution of individual EEG-derived features to the Dependence Score formula: 0.25·(1 − TBR_norm) + 0.25·Beta_norm + 0.25·HRI_norm + 0.15·(1 − Alpha_norm) + 0.10·AlphaBlocking_def. (B) Dependence Score classification thresholds: Normal (<0.5), Borderline (0.5–0.7), and Dependence-related (≥0.7). The model integrates inhibitory (alpha, TBR) and excitatory (beta, HRI) features with alpha blocking as a modulatory factor to quantify cortical dysregulation on a normalized 0–1 scale.
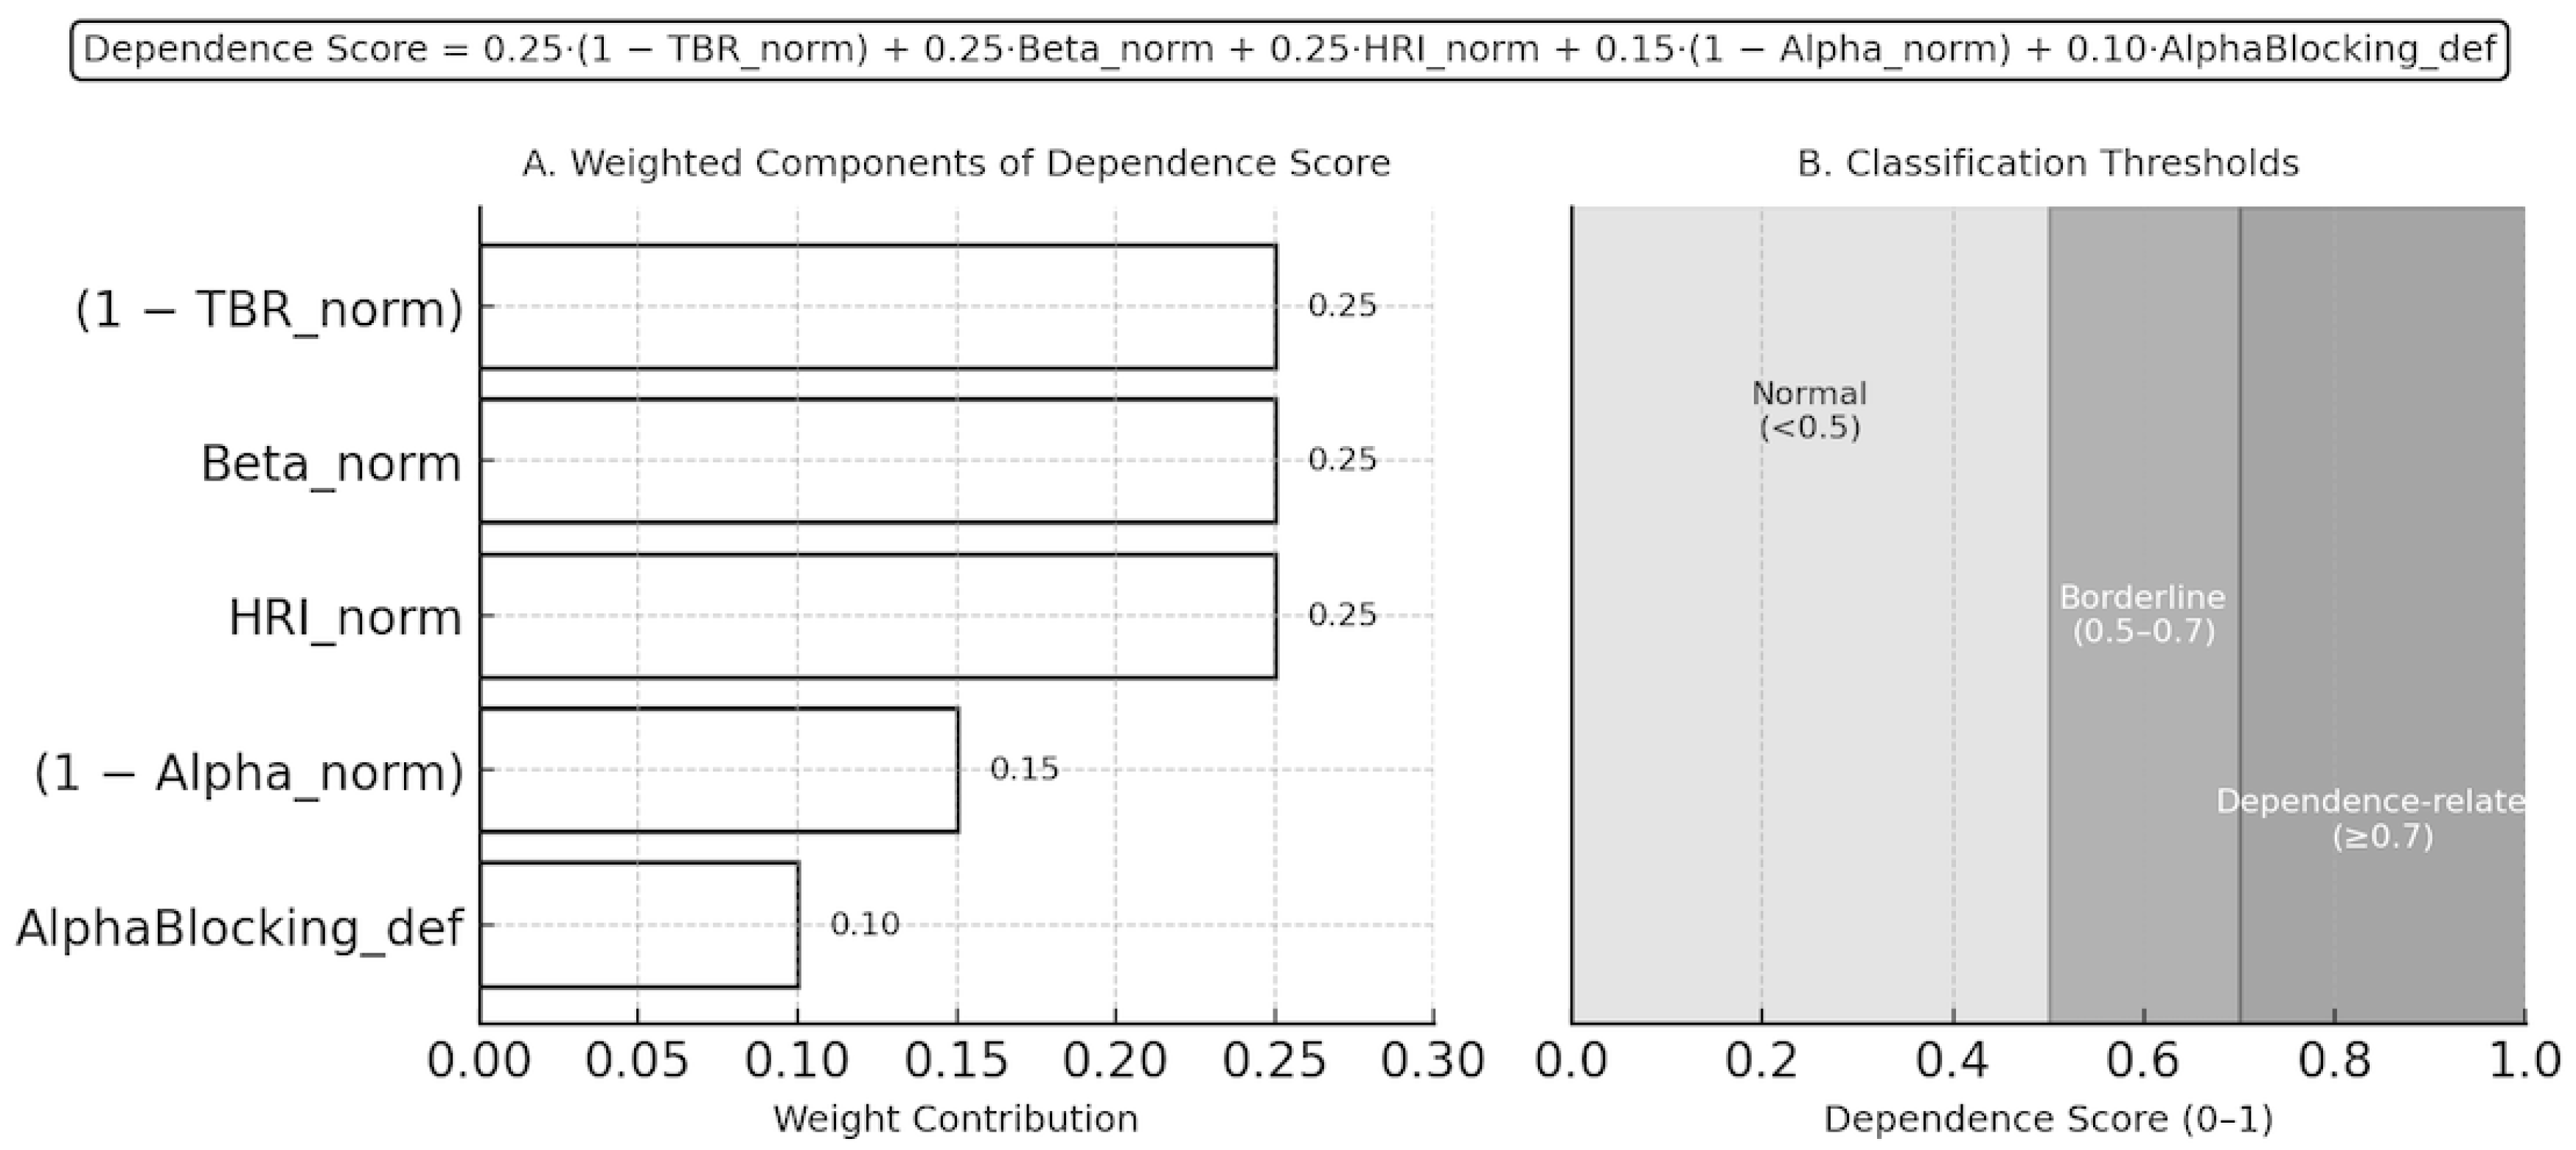
Figure 4.
Distribution and Correlation of Dependence Scores. (A) Histogram showing the distribution of Dependence Scores across all participants, with classification thresholds (Normal < 0.5, Borderline 0.5–0.7, Dependence-related ≥ 0.7) indicated by dashed lines. (B) Scatter plot illustrating the inverse relationship between Theta/Beta Ratio (TBR) and Dependence Score, reflecting the link between reduced inhibitory control and elevated cortical arousal in substance use disorder. The dashed line represents a schematic negative trend illustrating the inverse association between TBR and Dependence Score.
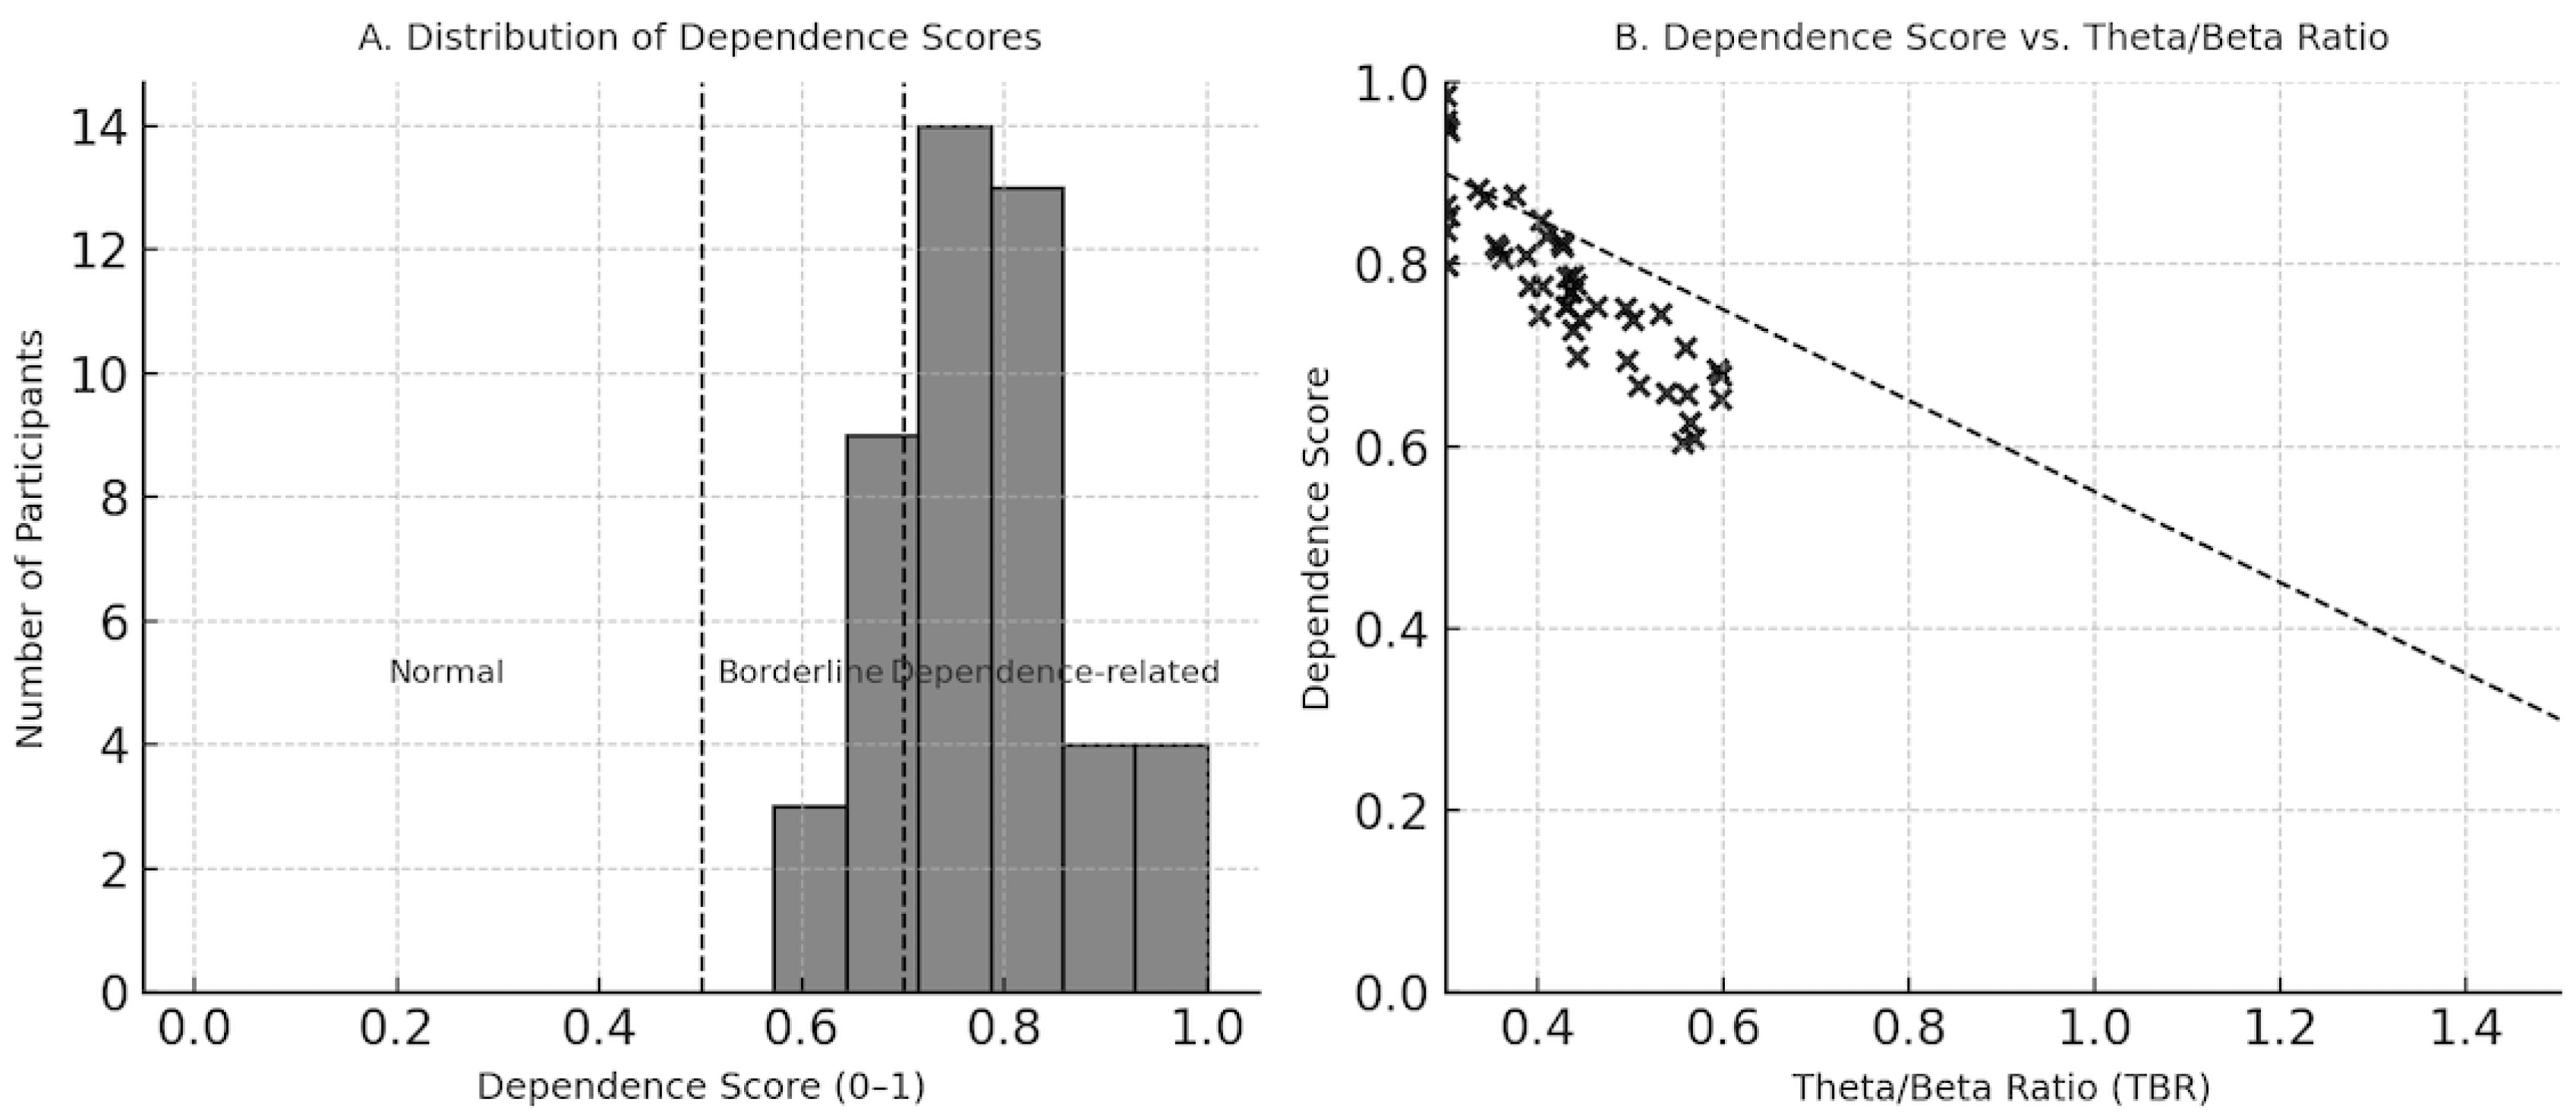
Figure 5.
Mean Spectral Power Distributions Across EEG Segments. Group-level mean values of the Theta/Beta Ratio, Alpha Relative Power, and Beta Relative Power across seven standardized EEG segments: background, eyes open, eyes closed, hyperventilation, after hyperventilation, flash, and after flash stimulation. The plot highlights persistently low alpha power and elevated beta activity across all conditions, indicating sustained cortical hyperarousal.
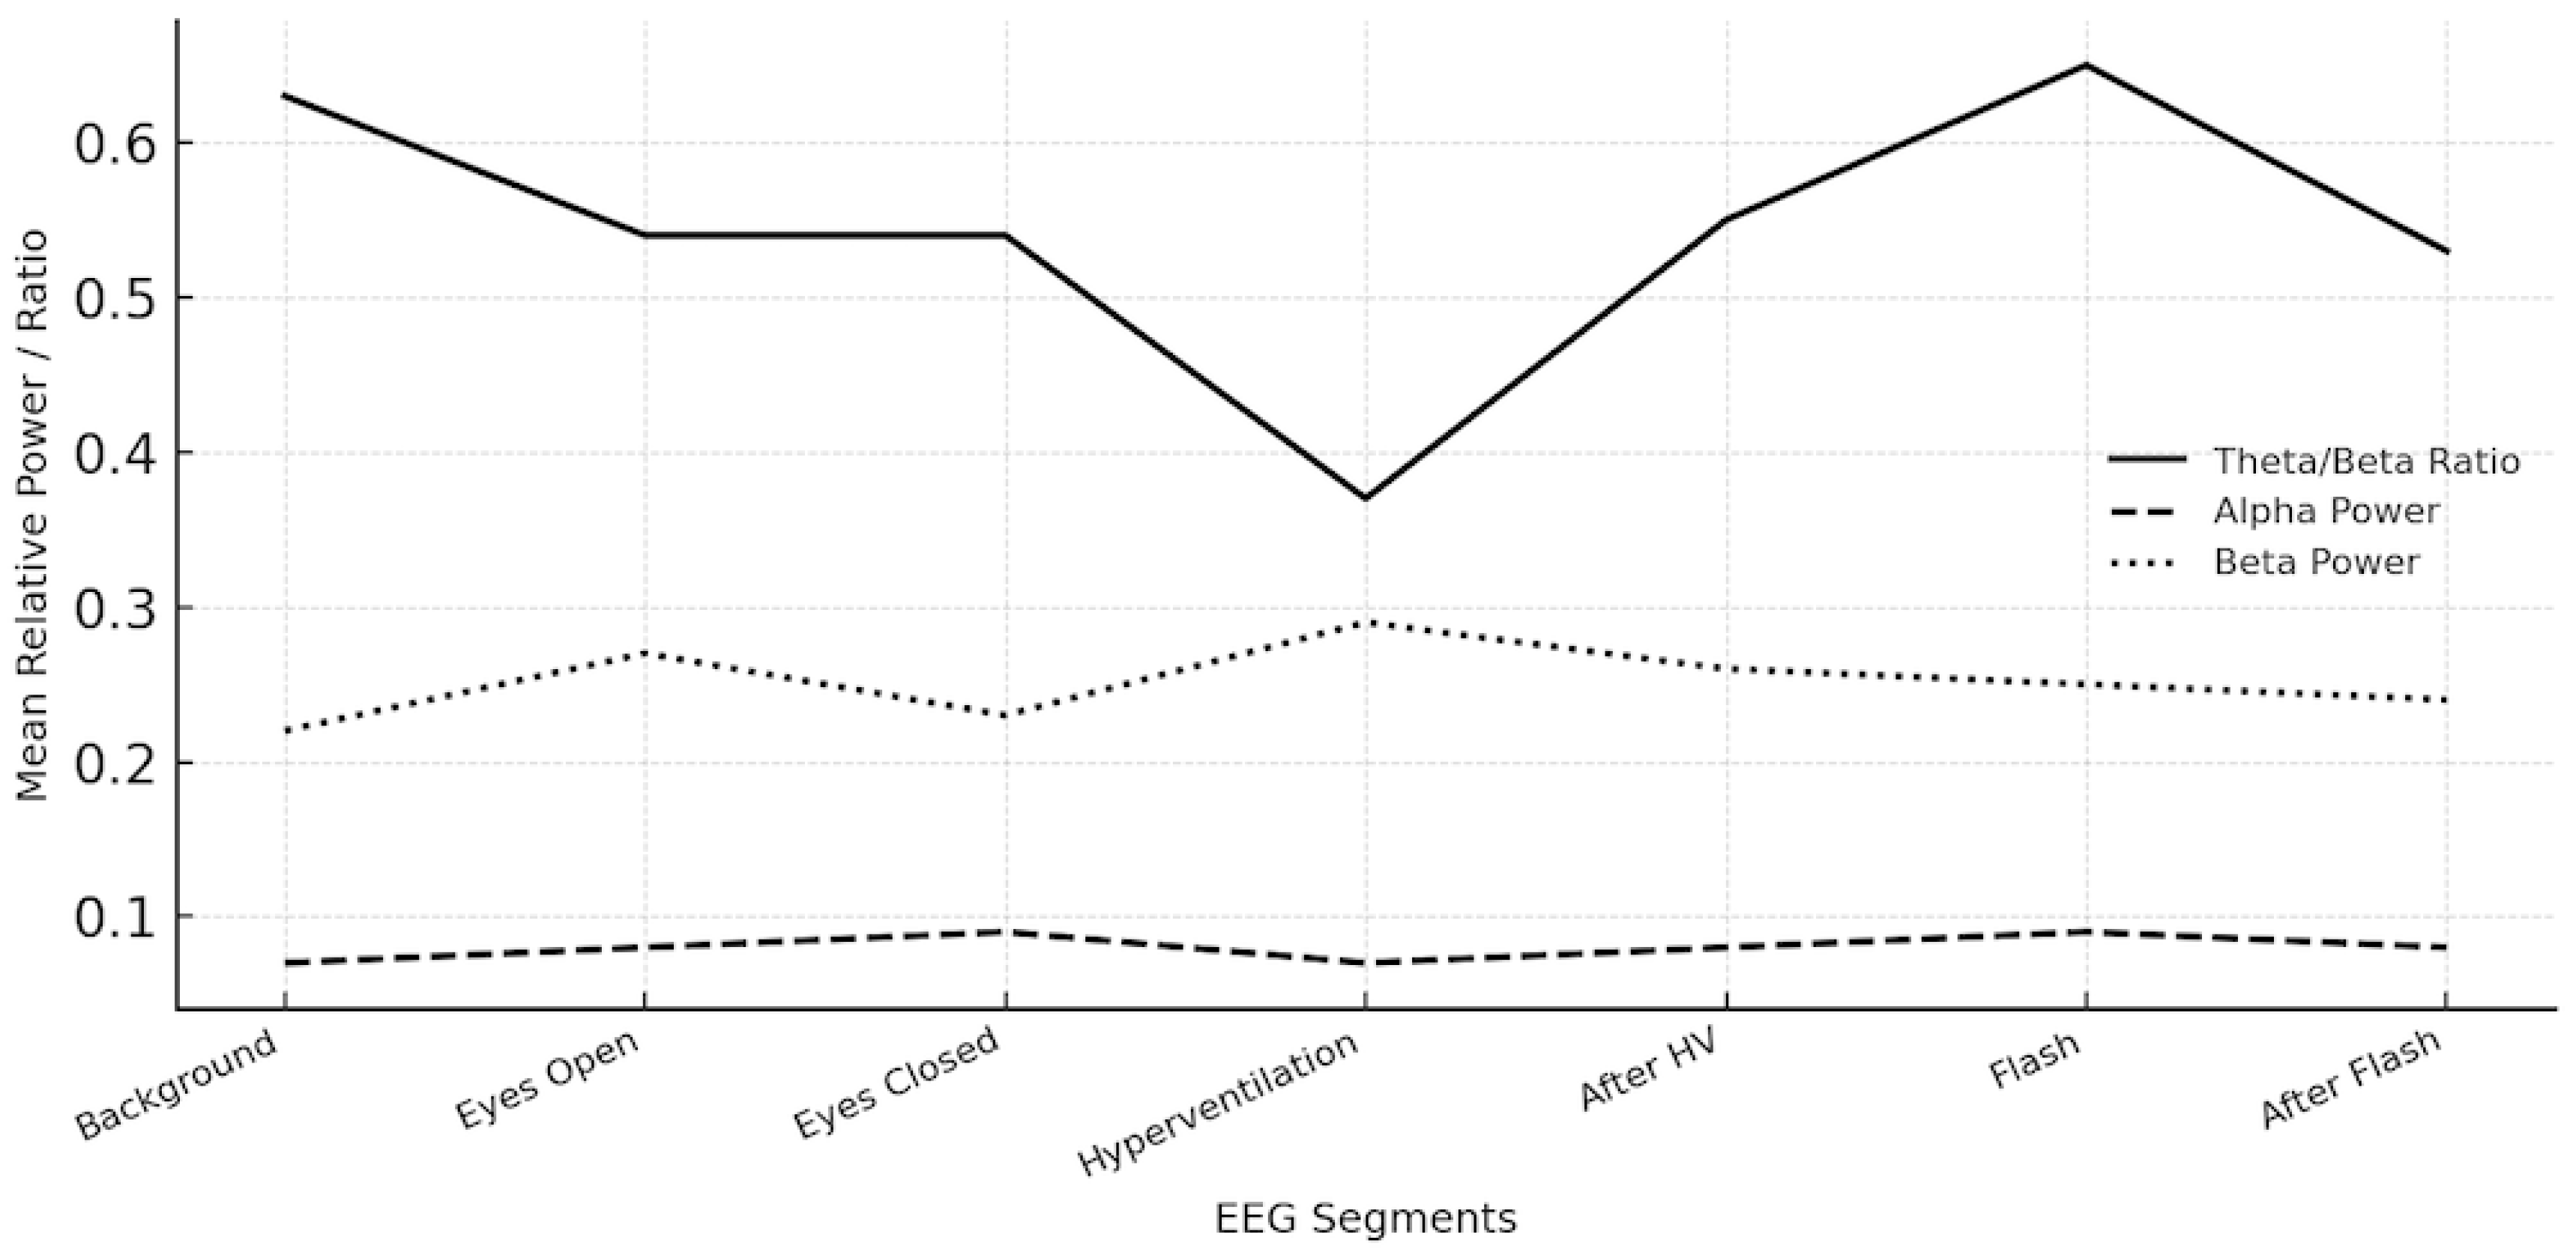

Table 1.
Presence of EEG Recording Segments in Patient Data.
| EEG of Cases % |
|
|---|---|
|
Background Activity Segment yes |
47 (100.0%) |
|
Open Eyes Segment yes |
47 (100.0%) |
|
Close Eyes Segment yes |
47 (100.0%) |
|
Hyperventilation Segment no yes |
2 (4.3%) 45 (95.7%) 47 (100%) |
|
After Hyperventilation Segment no yes |
2 (4.3%) 45 (95.7%) 47 (100%) |
|
Flash Stimulation Segment no yes |
4 (8.5%) 43 (91.5%) 47 (100%) |
|
After Flash Stimulation Segment no yes |
18 (38.3%) 29 (61.7%) 47 (100%) |
Table 2.
Mean Absolute and Relative Power Spectral Density Values Calculated By Welch’s Method From Segment-Based EEG Analysis in Frontal and Central Regions.
Table 2.
Mean Absolute and Relative Power Spectral Density Values Calculated By Welch’s Method From Segment-Based EEG Analysis in Frontal and Central Regions.
| Band | Calculated Variable | Mean |
|---|---|---|
| Theta/Beta | After Flash Stimulation Theta/Beta Ratio | 0.53 |
| Eyes Open Theta/Beta Ratio | 0.54 | |
| Eyes Closed Theta/Beta Ratio | 0.54 | |
| Flash Stimulation Theta/Beta Ratio | 0.65 | |
| Hyperventilation Theta/Beta Ratio | 0.37 | |
| After Hyperventilation Theta/Beta Ratio | 0.55 | |
| Background Activity Theta/Beta Ratio | 0.63 | |
| Alpha | Eyes Open Alpha Relative | 0.07 |
| Background Activity Alpha Absolute | 1.34E-11 | |
| Hyperventilation Alpha Absolute | 4.99E-12 | |
| Eyes Closed Alpha Absolute | 5.21E-12 | |
| Flash Stimulation Alpha Absolute | 6.30E-12 | |
| Hyperventilation Alpha Relative | 0.09 | |
| Eyes Closed Alpha Relative | 0.09 | |
| Background Activity Alpha Relative | 0.08 | |
| Eyes Open Alpha Absolute | 0 | |
| After Flash Stimulation Alpha Absolute | 0 | |
| After Hyperventilation Alpha Absolute | 5.96E-12 | |
| After Flash Stimulation Alpha Relative | 0.07 | |
| After Hyperventilation Alpha Relative | 0.08 | |
| Flash Stimulation Alpha Relative | 0.08 | |
| Beta | Flash Stimulation Beta Relative | 0.24 |
| Hyperventilation Beta Relative | 0.29 | |
| Eyes Closed Beta Absolute | 1.43E-11 | |
| Eyes Open Beta Absolute | 0 | |
| Hyperventilation Beta Absolute | 1.43E-11 | |
| Background Activity Beta Absolute | 4.11E-11 | |
| After Flash Stimulation Beta Relative | 0.2 | |
| Flash Stimulation Beta Absolute | 1.76E-11 | |
| After Hyperventilation Beta Absolute | 2.10E-11 | |
| After Hyperventilation Beta Relative | 0.26 | |
| After Flash Stimulation Beta Absolute | 0 | |
| Eyes Open Beta Relative | 0.22 | |
| Background Activity Beta Relative | 0.22 | |
| Eyes Closed Beta Relative | 0.26 | |
| Gamma | Eyes Closed Gamma Relative | 0.02 |
| After Hyperventilation Gamma Absolute | 0 | |
| After Flash Stimulation Gamma Absolute | 0 | |
| Flash Stimulation Gamma Relative | 0.03 | |
| Background Activity Gamma Absolute | 0 | |
| After Flash Stimulation Gamma Relative | 0.02 | |
| Hyperventilation Gamma Relative | 0.02 | |
| Eyes Closed Gamma Absolute | 0 | |
| After Hyperventilation Gamma Relative | 0.03 | |
| Background Activity Gamma Relative | 0.02 | |
| Hyperventilation Gamma Absolute | 0 | |
| Eyes Open Gamma Absolute | 0 | |
| Flash Stimulation Gamma Absolute | 0 | |
| Eyes Open Gamma Relative | 0.02 | |
| Theta | Flash Stimulation Theta Absolute | 1.88E-11 |
| Eyes Closed Theta Absolute | 8.03E-12 | |
| After Flash Stimulation Theta Relative | 0.06 | |
| After Hyperventilation Theta Absolute | 1.04E-11 | |
| After Flash Stimulation Theta Absolute | 0 | |
| Eyes Closed Theta Relative | 0.07 | |
| Hyperventilation Theta Relative | 0.07 | |
| Background Activity Theta Relative | 0.08 | |
| Background Activity Theta Absolute | 2.51E-11 | |
| Flash Stimulation Theta Relative | 0.07 | |
| Hyperventilation Theta Absolute | 1.38E-11 | |
| Eyes Open Theta Relative | 0.07 | |
| After Hyperventilation Theta Relative | 0.07 | |
| Eyes Open Theta Absolute | 0 | |
| Delta | Eyes Closed Delta Absolute | 0 |
| Hyperventilation Delta Absolute | 0 | |
| After Flash Stimulation Delta Absolute | 4.66E-12 | |
| Hyperventilation Delta Relative | 0.1 | |
| Flash Stimulation Delta Absolute | 2.37E-12 | |
| Eyes Closed Delta Relative | 0.11 | |
| Background Activity Delta Absolute | 0 | |
| Flash Stimulation Delta Relative | 0.13 | |
| Background Activity Delta Relative | 0.14 | |
| Eyes Open Delta Absolute | 0 | |
| After Hyperventilation Delta Relative | 0.13 | |
| Eyes Open Delta Relative | 0.15 | |
| After Hyperventilation Delta Absolute | 1.38E-11 | |
| After Flash Stimulation Delta Relative | 0.23 |
Table 3.
Derived EEG Variables Used for Quantitative Feature Extraction and Classification.
| Derived EEG Indices | Variable Type | Definition / Calculation |
|---|---|---|
| After Flash Stimulation Alpha Rebound | Categorical | “Yes” if After Flash Alpha Relative Mean > Flash Alpha Relative Mean; “No” otherwise |
| After Hyperventilation Alpha Recovery | Categorical | “Low” if After HV Alpha < HV Alpha; “Normal” if After HV Alpha > HV Alpha |
| After Hyperventilation Delta Increase | Categorical | “Yes” if After HV Delta > HV Delta; “No” otherwise |
| Alpha Blocking Ratio | Continuous | Eyes Closed Alpha Relative Mean / Eyes Open Alpha Relative Mean |
| Alpha Blocking Intact | Categorical | “Yes” if Alpha Blocking Ratio ≥ 1.3; “No” if < 1.3 |
| Alpha Power Status | Categorical | “Low” if Background Alpha Relative Mean < 0.25; “Normal” if ≥ 0.25 |
| Beta Power Status | Categorical | “High” if Background Beta Relative Mean > 0.20; otherwise “Normal” |
| Cortical Reactivity Index | Continuous | Mean of [(Eyes Closed Alpha − Eyes Open Alpha) + (After Flash Alpha − Flash Alpha)] / 2 |
| Cortical Reactivity Index Category | Categorical | “Low” (<0), “Normal” (0–0.05), “High” (>0.05) |
| Dependence Likelihood | Categorical | “Yes” if (TBR < 1.0) & (Alpha < 0.30) & (Beta > 0.25) & (Hyperarousal ≥ 2.0) & (Alpha Blocking = No); “No” otherwise |
| Dependence Score | Continuous | Composite index: 0.25×(1−TBR_norm) + 0.25×Beta_norm + 0.25×HRI_norm + 0.15×(1−Alpha_norm) + 0.10×AlphaBlock_def (0–1 range) |
| Dependence Likelihood Result | Categorical | Descriptive interpretation: dependence-related, borderline, or normal pattern |
| Dependence Pattern | Categorical | “Hyperaroused” if Alpha Low + Beta High; “Disinhibited” if TBR Low + Beta High; else “Balanced” |
| Flash Stimulation Beta Reactivity | Categorical | “Yes” if Flash Beta Relative Mean > Background Beta Relative Mean; “No” otherwise |
| Homeostatic Recovery Category | Categorical | “Low” if Score < 0.8; “Normal” if 0.8–1.2; “High” if > 1.2 |
| Homeostatic Recovery Score | Continuous | After Hyperventilation Alpha Relative Mean / Hyperventilation Alpha Relative Mean |
| Hyperarousal Index | Continuous | Background Beta Relative Mean / Background Alpha Relative Mean |
| Hyperarousal Index Category | Categorical | “Low” (<1.0), “Normal” (1.0–2.0), “High” (>2.0) |
| Theta/Beta Ratio Category | Categorical | “Low” if < 1.0; “Normal” if 1.0–4.0; “High” if > 4.0 |
Table 4.
Normalization and Feature Scaling of EEG-Derived Variables Used in Dependence Score Calculation.
Table 4.
Normalization and Feature Scaling of EEG-Derived Variables Used in Dependence Score Calculation.
| Variable | Normalization Formula | Normalization Range | Rationale | Effect on Dependence Score |
|---|---|---|---|---|
| Theta/Beta Ratio (TBR) | tbr_norm = min(tbr / 4.0, 1.0) | 0–1 (truncated at 1.0) | TBR values between 1.0 – 4.0 represent normal cortical activation; dividing by 4 scales values to [0,1]. Values >4.0 capped to prevent overweighting. | Used as (1 − TBR_norm) → low TBR (excess beta) increases dependence score. |
| Alpha Relative Power | alpha_norm = min(alpha / 0.30, 1.0) | 0–1 | Alpha <0.30 reflects reduced cortical inhibition and hyperarousal. Normalization ensures proportional scaling to the physiological range. | Used as (1 − Alpha_norm) → lower alpha increases dependence score. |
| Beta Relative Power | beta_norm = min(beta / 0.25, 1.0) | 0–1 | Beta >0.25 indicates excessive cortical excitation; normalization anchors the hyperarousal threshold. | Higher beta_norm increases dependence score. |
| Hyperarousal Index (HRI) | HRI_norm = min(HRI / 3.0, 1.0) | 0–1 | Typical HRI (Beta/Alpha) values around 1–3; dividing by 3 limits extreme excitatory dominance. | Higher HRI_norm increases dependence score. |
| Alpha Blocking Deficit | AlphaBlocking_def = 1 if AlphaBlocking == “No” else 0 | Binary (0 or 1) | Absence of alpha blocking reflects impaired sensory gating and cortical modulation. | Adds 0.10 weight when alpha blocking is absent, increasing dependence score. |
Each parameter is first scaled to a 0–1 range, ensuring comparability and preventing any single feature from dominating the composite index. The “min()” truncation limits the impact of extreme values and stabilizes interindividual variability. Parameters indicating inhibitory deficits or excitatory dominance (low TBR, low alpha, high beta, high HRI, absent alpha blocking) contribute positively to the final Dependence Score, consistent with the hyperarousal–disinhibition model of substance dependence.
Table 5.
Derived EEG Variables and Computational Definitions in Patients With Substance Use Disorder.
Table 5.
Derived EEG Variables and Computational Definitions in Patients With Substance Use Disorder.
| substance use disorder mean / % |
|
|---|---|
|
After Hyperventilation Delta Increase No Yes |
26 (55.3%) 21 (44.7%) 47 (100%) |
|
Alpha Blocking Intact No Yes |
25 (53.2%) 22 (46.8%) 47 (100%) |
|
Flash Stimulation Beta Reactivity No Yes |
24 (51.1%) 23 (48.9%) 47 (100%) |
|
Theta/Beta Ratio Category Low Normal |
39 (83.0%) 8 (17.0%) 47 (100%) |
| Homeostatic Recovery Score | 0.78 |
|
After Flash Stimulation Alpha Rebound No Yes |
33 (70.2%) 14 (29.8%) 47 (100%) |
|
Cortical Reactivity Index Category High Low Normal |
5 (10.6%) 23 (48.9%) 19 (40.4%) 47 (100%) |
|
Homeostatic Recovery Category High Low Normal |
1 (2.1%) 20 (42.6%) 26 (55.3%) 47 (100%) |
|
Dependence Pattern Label Balanced Hyperaroused |
22 (46.8%) 25 (53.2%) 47 (100%) |
|
Alpha Power Status Low |
47 (100.0%) |
|
Dependence Likelihood Result borderline dependence-related normal pattern |
4 (8.5%) 41 (87.2%) 2 (4.3%) 47 (100%) |
| Cortical Reactivity Index | -0.0044 |
| Dependence Score | 0.86 |
|
Beta Power Status High Normal |
25 (53.2%) 22 (46.8%) 47 (100%) |
|
After Hyperventilation Alpha Recovery Low Normal |
29 (61.7%) 18 (38.3%) 47 (100%) |
| Alpha Blocking Ratio | 1.60 |
| Hyperarousal Index | 3.45 |
|
Hyperarousal Index Category High Low Normal |
33 (70.2%) 4 (8.5%) 10 (21.3%) 47 (100%) |
|
Dependence Likelihood No Yes |
41 (87.2%) 6 (12.8%) 47 (100%) |
Table 6.
Case Characteristics and Comparative Results of Variables in Substance Use Disorder Cases.
| Substance use disorder mean / % |
|
|---|---|
| N | 47 (100%) |
|
Gender female male |
11 (23.4%) 36 (76.6%) |
| Age | 31.6 |
|
Marital Status married single |
19 (40.4%) 28 (59.6%) |
|
Educational Status High School Middle School University |
13 (27.7%) 9 (19.1%) 25 (53.2%) |
|
Economic Status High Medium |
44 (93.6%) 3 (6.4%) |
|
Employed? no yes |
22 (46.8%) 25 (53.2%) |
|
Lives with Family no yes |
25 (53.2%) 22 (46.8%) |
|
Lives with Spouse no yes |
29 (61.7%) 18 (38.3%) |
|
Lives Alone no yes |
41 (87.2%) 6 (12.8%) |
|
Physical Health good |
47 (100.0%) |
|
History of Psychiatric Treatment no yes |
8 (17.0%) 39 (83.0%) |
|
History of Psychiatric Drug Usage no yes |
13 (27.7%) 34 (72.3%) |
|
Suicide Attempt no yes |
44 (93.6%) 3 (6.4%) |
|
Addiction Type Count 1 2 3 4 |
27 (57.4%) 15 (31.9%) 4 (8.5%) 1 (2.1%) |
|
History of Addiction Treatment no yes |
12 (25.5%) 35 (74.5%) |
|
Family History of Addiction no yes |
41 (87.2%) 6 (12.8%) |
|
Addiction In Mother no yes |
46 (97.9%) 1 (2.1%) |
|
Addiction In Father no yes |
44 (93.6%) 3 (6.4%) |
|
Addiction In Sister No no |
1 (2.1%) 46 (97.9%) |
|
Addiction In Brother no yes |
45 (95.7%) 2 (4.3%) |
|
Alcohol no yes |
24 (51.1%) 23 (48.9%) |
|
Alcohol Every X Days 1 2 |
21 (91.3%) 2 (8.7%) 23 (100%) |
|
Heroin no yes |
46 (97.9%) 1 (2.1%) |
|
Heroin Every X Days 1 |
1 (100.0%) |
|
Gambling no yes |
44 (93.6%) 3 (6.4%) |
|
Gambling Every X Days 1 |
3 (100.0%) |
|
Cocaine no yes |
36 (76.6%) 11 (23.4%) |
|
Cocaine Every X Days 1 3 30 |
8 (72.7%) 2 (18.2%) 1 (9.1%) |
|
cannabis no yes |
27 (57.4%) 20 (42.6%) |
|
Cannabis every x days 1 2 |
19 (95.0%) 1 (5.0%) 20 (100%) |
|
Met no yes |
43 (91.5%) 4 (8.5%) |
|
Met every x days 1 |
4 (100.0%) |
|
Other substance no yes |
36 (76.6%) 11 (23.4%) |
|
Other substance every x days 1 3 |
10 (90.9%) 1 (9.1%) 11 (100%) |
Disclaimer/Publisher’s Note: The statements, opinions and data contained in all publications are solely those of the individual author(s) and contributor(s) and not of MDPI and/or the editor(s). MDPI and/or the editor(s) disclaim responsibility for any injury to people or property resulting from any ideas, methods, instructions or products referred to in the content. |
© 2026 by the authors. Licensee MDPI, Basel, Switzerland. This article is an open access article distributed under the terms and conditions of the Creative Commons Attribution (CC BY) license (http://creativecommons.org/licenses/by/4.0/).
Copyright: This open access article is published under a Creative Commons CC BY 4.0 license, which permit the free download, distribution, and reuse, provided that the author and preprint are cited in any reuse.


