Submitted:
24 February 2026
Posted:
25 February 2026
You are already at the latest version
Abstract
Soil organic carbon (SOC) is essential for ecosystem stability and long-term carbon storage in alpine grasslands, yet the relative importance and interactions of hydrothermal and biotic controls remain poorly understood at regional scales. In this study, we quantified surface SOC (0–20 cm) across the Yellow River Source Region (YRSR) on the northeastern Tibetan Plateau, a climate-sensitive alpine headwater system characterized by strong hydrothermal gradients and freeze–thaw dynamics. Field-based SOC measurements were integrated with multi-source remote sensing and reanalysis data that describe thermal conditions, moisture processes, vegetation productivity, soil properties, topography, and human influence. A two-step screening approach was applied using Boruta and variance inflation factor filtering, followed by modeling with random forest. The model outputs were interpreted using Shapley Additive Explanations (SHAP). SOC displayed significant spatial heterogeneity across the region. Vegetation productivity, moisture availability, and thermal conditions were identified as the dominant nonlinear drivers of SOC variation. Moisture processes were found to function as a central mediator, regulating SOC both directly and indirectly through vegetation and thermal pathways. These findings highlight the critical role of hydrothermal stability in sustaining soil carbon stocks and provide a quantitative foundation for sustainable grassland management strategies in the face of climate warming.
Keywords:
soil organic carbon
; alpine headwater region
; hydrothermal processes
; vegetation productivity
; sustainable grassland management
; remote sensing
1. Introduction
Soil organic carbon (SOC) is the largest terrestrial carbon reservoir and plays a pivotal role in regulating ecosystem resilience, supporting carbon neutrality goals, and contributing to climate change mitigation efforts [1,2]. In alpine grasslands, SOC stability is intricately linked to hydrological regulation, vegetation productivity, and permafrost dynamics. Even slight variations in soil temperature and moisture under ongoing climate warming can significantly alter the carbon balance, rendering alpine SOC both a vulnerable component of the climate system and a critical target for sustainable land management [3].The Tibetan Plateau, often referred to as the “Third Pole,” is home to vast alpine grasslands and permafrost systems that are highly sensitive to warming [4]. These grasslands store approximately 7.4 Pg of SOC within the upper 100 cm of soil, with significant spatial variation largely driven by moisture availability [5,6]. However, warming-induced permafrost degradation may accelerate organic matter decomposition and carbon release, while increases in vegetation productivity may simultaneously enhance carbon inputs [7,8]. These opposing processes generate complex, spatially heterogeneous SOC responses, adding uncertainty to the assessment of regional carbon sink stability.
At regional scales, SOC in alpine environments is characterized by strong spatial heterogeneity, typically exhibiting right-skewed distributions with localized high-carbon patches embedded within broader low-carbon areas [4]. These spatial patterns suggest that regional carbon stability is strongly dependent on hydrothermally favorable zones, including wetlands and seasonally moist grasslands. Identifying and protecting these high-SOC areas is thus essential for sustainable grassland management and climate adaptation strategies[9]. The dynamics of SOC in these alpine systems are governed by interacting thermal, hydrological, biological, and edaphic processes[10]. Temperature influences microbial activity and freeze–thaw disturbances, moisture availability governs vegetation growth and soil redox conditions, and soil texture and mineral composition affect carbon stabilization [11]. These tightly coupled processes generate nonlinear and hierarchical responses, which are difficult to capture using conventional linear models[12,13,14]. Recent advancements in remote sensing have provided spatially explicit data on vegetation productivity, surface temperature, moisture status, and cryospheric processes, offering valuable tools for regional carbon assessments in remote alpine regions [15,16,17]. While machine learning methods, particularly Random Forest (RF) models, have significantly improved SOC prediction accuracy, many applications focus on predictive performance without addressing the underlying processes or providing actionable management insights[18,19]. Bridging predictive modeling with process-based interpretation is therefore critical for translating spatial carbon assessments into effective land management strategies[20].
This study focuses on the Yellow River Source Region (YRSR), a climate-sensitive alpine headwater area located on the northeastern Tibetan Plateau. By integrating field-measured SOC data with multi-source environmental predictors, the objectives of this study are to: (1) characterize the spatial heterogeneity of SOC, (2) identify the dominant hydrothermal and biotic drivers of SOC variation, and (3) uncover the direct and indirect regulatory pathways influencing SOC distribution. From a sustainability perspective, understanding these mechanisms is crucial for identifying vulnerable carbon pools, prioritizing the conservation of high-moisture areas, and developing adaptive grassland management strategies under climate change.
2. Materials and Methods
2.1. Study Area
The Yellow River Source Region (YRSR), located on the northeastern Tibetan Plateau, is the headwaters and a critical water supply area for the Yellow River. As an ecologically important region, it plays a central role in regulating regional hydrological processes, maintaining alpine ecosystem stability, and supporting socio-economic development downstream[21,22]. Consequently, environmental changes in the YRSR have implications not only for local ecosystem functioning but also for water security and sustainable development across the broader Yellow River Basin. Originating from the Bayan Har Mountains, the study area spans elevations of approximately 2680–6248 m, with topography generally decreasing from northwest to southeast (Figure 1) [23,24,25]. The landscape is characterized by extensive glaciers, seasonal snow cover, lakes, and permafrost, representing a typical alpine ecosystem of the Tibetan Plateau [26,27]. The regional climate is dominated by a cold continental regime, with low annual mean temperatures, a short growing season, and frequent freeze–thaw cycles. Precipitation occurs mainly between May and September and exhibits pronounced seasonal and spatial heterogeneity [28,29]. Vegetation is primarily composed of alpine meadows, alpine steppes, and wetlands, with localized floodplains, marshes, and seasonally inundated depressions. Wetland and marsh areas, characterized by low temperatures and high moisture conditions, often develop peat-rich or humus-enriched soils with relatively high SOC accumulation. In contrast, surrounding alpine grasslands and wind-eroded uplands typically exhibit lower SOC contents [23,30,31]. Overall, SOC dynamics in the YRSR are jointly regulated by climatic gradients, hydrological processes, vegetation productivity, and soil–topographic controls [32,33,34]. Low temperatures constrain decomposition rates, while spatial variability in moisture availability mediates vegetation growth and soil hydrothermal conditions. Given the region’s sensitivity to climate warming and hydrological shifts, understanding SOC spatial patterns in the YRSR is essential for safeguarding carbon stability and supporting sustainable alpine land management [35,36,37].
2.2. Data Sources
2.2.1. Field Sampling and Laboratory Analysis
Soil sampling was conducted during July–August 2023 across the YRSR on the Qinghai-Tibet Plateau. A total of 240 sampling sites were selected to capture the spatial variability of SOC. To ensure representative coverage of environmental gradients with a limited number of samples, conditional Latin hypercube sampling (cLHS) was used to design the sampling sites. Auxiliary variables representing topography, climate, vegetation, and hydrological conditions were resampled to a 500 m resolution. Road networks, settlements, elevation, and slope were incorporated as constraints to construct a sampling cost surface, assigning penalty weights to inaccessible areas (Figure 2). The sampling design was implemented in R (version 4.5.2) [38]. Samples were collected using a handheld soil auger (5 cm diameter) from the 0–20 cm soil layer to represent surface SOC characteristics. At each sampling location, three subsamples were collected using a randomized design and combined into a composite sample to reduce the influence of small-scale spatial heterogeneity. All samples were air-dried, cleared of plant residues and gravel, ground, and passed through a 0.25 mm sieve prior to analysis. SOC content was determined using the potassium dichromate–sulfuric acid external heating oxidation method following standard procedures [39,40].
2.2.2. Construction of Environmental Predictor Set
To ensure that variable grouping and pathway specification were based on ecological processes rather than purely statistical associations, we adopted the STEP–AWBH structural framework to organize the environmental predictors[41]. This framework conceptualizes SOC formation and spatial variability as emergent outcomes of interacting subsystems operating across hierarchical levels within the regional Earth system. Specifically, environmental drivers were partitioned into eight interacting components: soil properties (S), topography (T), ecological and vegetation processes (E), precipitation (P), atmospheric conditions (A), hydrological processes (W), biotic activity (B), and human influences (H) [41]. This process-oriented framework enabled the systematic representation of thermal regulation, moisture mediation, biological productivity, and anthropogenic disturbance within a unified conceptual model. Following this framework, 37 initial candidate environmental variables were compiled from multi-source remote sensing products and reanalysis datasets (Table 1), ensuring that variable selection reflected ecological mechanisms relevant to SOC regulation rather than purely statistical associations.
2.2.3. Sentinel-2 Remote Sensing Data and Cloud Masking
High-resolution environmental variables representing vegetation productivity, surface moisture status, and cryospheric dynamics were derived from Sentinel-2 Multispectral Instrument (MSI) Level-2A surface reflectance products (10–20 m spatial resolution). The red-edge and near-infrared bands were used to compute vegetation indices sensitive to canopy structure and physiological activity, which are closely linked to carbon input processes in alpine ecosystems [42,43]. To reduce the influence of frequent cloud cover and terrain-induced shadows, all imagery was subjected to strict cloud and cloud-shadow masking prior to index calculation. Variable-specific temporal compositing strategies were applied to reflect ecological seasonality. Leaf Area Index (LAI) was derived from Sentinel-2 Level-2A surface reflectance data using the ESA SNAP Biophysical Processor, which applies a neural network trained on radiative transfer simulations to retrieve biophysical variables from red-edge and shortwave infrared bands. Growing-season (May–September) LAI was composited using the median to represent peak vegetation productivity. Surface moisture-related indices were calculated as growing-season means to represent average hydrothermal conditions. Snow-related metrics, including the normalized difference snow index (NDSI), were computed for the cold season (October–April), and snow frequency was quantified as the proportion of snow-covered observations relative to the total number of valid observations during the cold season [44,45,46]. This seasonally stratified preprocessing framework minimized atmospheric noise and ensured that derived variables were ecologically consistent with SOC formation and stabilization processes.
2.3. Methods
2.3.1. Screening and Optimization of Environmental Predictors
To construct an independent and ecologically interpretable predictor set, a two-stage variable convergence strategy combining relevance screening and multicollinearity control was implemented. First, the Boruta algorithm was applied to evaluate the relevance of each environmental predictor to SOC. Boruta compares the importance of original predictors with that of randomly permuted shadow variables. For each predictor, its importance scoreis compared with the maximum importance of shadow features . A predictor was confirmed as relevant when:
consistently across repeated iterations. This procedure retained only predictors with statistically significant explanatory power.
Second, multicollinearity among retained predictors was assessed using the Variance Inflation Factor (VIF) [47]. For each predictor Xi, VIF is defined as:
where is the coefficient of determination obtained by regressing predictor Xᵢ against all remaining predictors. A high indicates strong linear dependence on other variables. Predictors with were iteratively removed, beginning with the variable exhibiting the highest VIF value, while maintaining ecological representativeness [48]. The final predictor set satisfied:
ensuring statistical independence and model stability for subsequent analyses.
2.3.2. Random Forest Modeling and SHAP Interpretation
Random forest (RF) models were constructed using the optimized predictor set to characterize nonlinear relationships between SOC and environmental drivers. RF is an ensemble learning algorithm that aggregates predictions from multiple regression trees built on bootstrap samples of the training data. The ensemble prediction for an observation x is expressed as:
where T denotes the number of trees and represents the prediction from the t-th tree.
Model performance was evaluated using the coefficient of determination () and root mean square error (RMSE) [49]. The coefficient of determination was calculated as:
where denotes observed SOC, represents predicted SOC, and is the mean of observed SOC values. RMSE was defined as:
To enhance interpretability, Shapley Additive exPlanations (SHAP) were applied to decompose RF predictions into additive contributions from individual predictors. For fea- ture , the SHAP value quantifies its marginal contribution to the prediction and is de fined as:
where represents the set of all predictors and denotes a subset not containing feature .
Global variable importance was assessed using the mean absolute SHAP value:
which reflects the average contribution magnitude of predictor across all observations. SHAP dependence patterns were examined to characterize nonlinear SOC responses to dominant environmental drivers.
SHAP attribution was used strictly for model interpretation and identification of influential predictors, rather than for causal inference.
2.3.3. Spatial Prediction and Distribution Analysis of SOC
The spatial distribution of SOC was derived from RF predictive model. The model-generated SOC raster was resampled to a 500 m spatial resolution and clipped to the boundary of the Yellow River Source Region. A multi-year mean SOC layer was subsequently calculated to represent the long-term spatial pattern. To evaluate differences among vegetation types, the predicted SOC raster was overlaid with land cover data. Zonal statistical analysis was performed to extract descriptive statistics [8,9]. This approach provided a spatially explicit characterization of SOC heterogeneity across grassland types and supported subsequent interpretation of environmental controls [50,51].
3. Results
3.1. Characteristics of Soil Organic Carbon Measurements
SOC at a depth of 0–20 cm in the Yellow River Source Region (YRSR) exhibited considerable variability, ranging from 2.96 to 169.32 g/kg (Table 2). The mean and median values were 46.61 g/kg and 40.75 g/kg, respectively, indicating moderate central tendency but substantial dispersion. The coefficient of variation (CV) was 64.97%, reflecting high relative variability across sampling sites. The SOC distribution was positively skewed (skewness = 1.22) and leptokurtic (kurtosis = 4.85), suggesting a right-skewed and heavy-tailed pattern. Most observations clustered in lower SOC ranges, while a few high-value samples extended the upper tail of the distribution. This distribution pattern indicates that localized high-SOC patches disproportionately contribute to regional variability. Spatially, elevated SOC concentrations were concentrated in discrete areas, whereas lower SOC values dominated the broader regional background. This patch-matrix configuration implies that SOC accumulation is strongly regulated by localized hydrothermal and ecological conditions, rather than by uniform regional controls. The observed non-normality and spatial concentration patterns underscore the importance of employing spatially explicit and nonlinear approaches to resolving SOC variability in alpine environments.
3.2. Identification of Key Environmental Predictors for SOC
The Boruta algorithm was applied to assess the relevance of 37 candidate environmental variables to soil organic carbon (SOC) in the Yellow River Source Region (YRSR). After iterative comparison with randomly permuted shadow variables, 27 predictors were identified as significant contributors to SOC variability, with their importance values significantly exceeding those of the random shadow variables (Figure 3). These retained variables encompassed key environmental factors, including thermal conditions (e.g., land surface temperature), moisture processes (e.g., precipitation and soil moisture), vegetation productivity (e.g., Leaf Area Index (LAI), Gross Primary Productivity (GPP)), and soil properties (e.g., pH, bulk density). To control for multicollinearity among the retained predictors, the Variance Inflation Factor (VIF) was applied. Predictors with VIF values greater than 5 were iteratively removed until all remaining variables exhibited acceptable VIF values (<5), ensuring statistical independence and reducing potential model instability (Table 3). The final predictor set included 16 variables, which adequately represent the dominant environmental gradients shaping SOC spatial variability in the region. These variables will serve as robust inputs for subsequent nonlinear modeling, offering a comprehensive, ecologically interpretable basis for assessing SOC in the YRSR.
3.3. Nonlinear Importance Patterns of SOC Revealed by RF–SHAP
The random forest (RF) model demonstrated robust predictive performance, explaining 68% of the variance in soil organic carbon (SOC), with an RMSE of 15.59 g/kg (Figure S1). These results indicate that the optimized environmental predictors effectively captured the primary spatial gradients in the Yellow River Source Region (YRSR). Among the predictors, vegetation productivity indicators such as LAI and GPP were the most significant contributors, with high SHAP values indicating their strong role in SOC accumulation. These variables demonstrated a nonlinear relationship with SOC, where SOC increased with higher productivity but plateaued at certain thresholds. Moisture-related variables (such as NDWI and SM) were also identified as crucial drivers, with SHAP highlighting their nonlinear contributions to SOC variation. Moderate to high moisture conditions were associated with higher SOC due to enhanced vegetation growth and reduced decomposition. In contrast, drier conditions corresponded to lower SOC values, underscoring the importance of maintaining a stable hydrothermal balance. Thermal variables, particularly daytime land surface temperature (Terra_LsTD) and the AI, showed significant contributions to SOC variability, with SHAP results indicating that lower temperatures were associated with higher SOC levels due to suppressed microbial activity. However, extreme thermal fluctuations, especially from freeze–thaw cycles, were found to reduce SOC stability, signaling the complex role of temperature variability in SOC dynamics (Figure 4). Overall, the results from RF–SHAP emphasize the nonlinear and context-dependent nature of SOC regulation in the YRSR, driven by the coupled effects of moisture, temperature, and vegetation productivity. These findings provide a strong empirical foundation for the subsequent modeling of SOC dynamics, which can inform the management of alpine ecosystems.
3.4. Spatial Heterogeneity and Vegetation-Type Differences in SOC in the YRSR
SOC in the Yellow River Source Region exhibited pronounced spatial heterogeneity in 2023(Figure 5). The multi-year mean SOC during the study period was 69.2 g/kg. Overall, SOC showed a clear spatial gradient, decreasing from southeast to northwest. High SOC values were primarily concentrated in the southeastern part of the region, whereas relatively low SOC levels were observed in the northwestern areas. Significant differences in SOC were identified among vegetation types. Mountain meadow exhibited the highest mean SOC (85.63 g/kg), representing the most carbon-rich ecosystem in the region. Forest land, improved grassland, lowland meadow, and wetlands also showed relatively high SOC levels, with mean values exceeding 76 g/kg. Alpine meadow and alpine steppe had intermediate SOC levels, with mean values of 70.63 g/kg and 53.12 g/kg, respectively. Temperate steppe showed a mean SOC of 58.75 g/kg, while temperate desert grassland exhibited the lowest SOC content (42.40 g/kg). In terms of variability, alpine meadow and wetland displayed relatively large SOC ranges, with standard deviations of 17.72 g/kg and 16.82 g/kg, respectively, indicating stronger spatial fluctuations. In contrast, improved grassland and lowland meadow showed smaller standard deviations, suggesting a more uniform spatial distribution of SOC. Overall, SOC in the Yellow River Source Region demonstrated clear vegetation-type differentiation and a distinct spatial gradient, reflecting substantial heterogeneity in carbon storage among different grassland ecosystems.
4. Discussion
4.1. Spatial Heterogeneity of Soil Organic Carbon in the Yellow River Source Region
The surface OC in the Yellow River Source Region (YRSR) exhibited significant spatial heterogeneity, which is consistent with the findings of previous studies in other alpine regions. The observed variation in SOC, ranging from 2.96 to 169.32 g/kg, indicates that SOC in the region is highly variable, with localized high-carbon patches embedded within broader low-carbon backgrounds. The mean value of 46.61 g/kg and the high coefficient of variation (CV = 64.97%) reflect a high degree of spatial variability in SOC concentrations. This variability is likely driven by the complex interactions of multiple environmental factors such as moisture, temperature, and vegetation. The positive skewness (skewness = 1.22) and leptokurtic distribution (kurtosis = 4.85) suggest a right-skewed and heavy-tailed distribution, where most of the SOC values are clustered in the lower range, while a few high-value samples extend the distribution’s upper tail. This distribution pattern implies that localized high-SOC patches play a disproportionate role in contributing to the regional SOC variability [52,53]. The spatial clustering of high SOC concentrations in specific areas indicates that localized hydrothermal and ecological conditions, rather than uniform regional controls, govern SOC accumulation in the YRSR [34,54]. These findings highlight the importance of using spatially explicit and nonlinear approaches to accurately capture SOC variability in heterogeneous alpine [55].
4.2. Key Environmental Drivers of SOC Variability Identified by RF–SHAP
The RF–SHAP analysis revealed that vegetation productivity, moisture availability, and thermal conditions are the primary contributors to SOC variability in the YRSR. These findings support existing literature, which highlights the strong regulatory effects of hydrothermal conditions and vegetation productivity on SOC dynamics in alpine ecosystems. Vegetation productivity indicators, such as the LAI and GPP, were found to be significant drivers of SOC accumulation. Higher vegetation productivity generally promotes SOC storage due to increased carbon inputs from aboveground biomass [56]. Moisture-related variables, including precipitation and soil moisture, were identified as critical drivers in SOC variability, displaying strong nonlinear contributions. SOC levels were higher under moderate to high moisture conditions, corresponding to enhanced vegetation growth and reduced decomposition in moist soils, while drier conditions led to lower SOC levels. These findings are consistent with previous studies that have shown moisture availability as a key regulator of SOC in cold alpine environments[57,58]. Thermal conditions, particularly freeze-thaw dynamics and surface temperature, were also significant contributors to SOC variability. These results align with studies that have shown that temperature strongly influences microbial decomposition and carbon turnover[59,60]. Lower temperatures were generally associated with higher SOC concentrations, reflecting suppressed microbial activity, while extreme thermal fluctuations, particularly freeze-thaw cycle s, reduced SOC stability [61,62,63].
4.3. The Role of Nonlinear Interactions in SOC Regulation
A key finding of this study is the importance of nonlinear interactions between environmental variables in shaping SOC patterns. The RF–SHAP analysis demonstrated that the relationship between SOC and its environmental drivers, such as moisture and temperature, is not linear [64,65,66,67]. For instance, higher vegetation productivity led to increased SOC accumulation up to a certain threshold, after which the relationship plateaued. This indicates that carbon stabilization processes may constrain SOC accumulation beyond certain productivity levels [68,69]. Moisture availability showed similar nonlinear behavior, with moderate to high moisture conditions promoting SOC accumulation, while drier conditions resulted in lower SOC levels. These findings suggest that SOC regulation is highly context-dependent and nonlinear, emphasizing the need for advanced models that can account for these complex interactions [70,71,72].
4.4. Context-Dependent Effects of Vegetation Productivity and Biological Inputs
The results of this study have important implications for the sustainable management of grasslands in the YRSR. Given the strong influence of moisture, vegetation productivity, and thermal conditions on SOC dynamics, it is crucial to prioritize the conservation of areas with high SOC potential, particularly those in hydrothermally favorable zones such as wetlands and seasonally moist grasslands[73,74]. These areas, which serve as significant carbon sinks, should be prioritized for conservation efforts to maintain regional SOC stocks. The findings also highlight the need for adaptive management strategies that consider the effects of climate warming on SOC dynamics [75]. As temperatures rise and precipitation patterns shift, the stability of SOC in the region may be threatened [76]. Therefore, management strategies should focus on enhancing vegetation productivity in moisture-limited areas and maintaining stable thermal conditions to protect SOC stocks [76,77]. These strategies are critical to ensuring the long-term sustainability of alpine grasslands under future climate scenarios [78].
4.5. Implications for Remote Sensing–Based SOC Modeling in Alpine Regions
Our study emphasizes the need to combine diverse remote sensing data sources to develop comprehensive SOC models that better capture interactions between these variables. diverse remote sensing data sources to build comprehensive SOC models that better reflect the interactions between these variables. Thermal and moisture-related remote sensing indicators, ncluding LST, freeze–thaw cycles, and NDWI, were identified as critical predictors of SOC variability in the YRSR. These variables provide a spatially explicit representation of hydrothermal conditions that influence microbial activity, carbon stabilization, and vegetation productivity. High-resolution moisture proxies, such as NDWI, are particularly effective in capturing local hydrological variability and SOC hotspots, complementing coarser-resolution data from reanalysis and microwave products[48]. The integration of such high-resolution moisture proxies with thermal and vegetation productivity data enhances the spatial reliability and ecological understanding of SOC distribution in alpine ecosystems [74]. One of the key advantages of using machine learning techniques, such as random forest (RF), in combination with remote sensing data is their ability to capture nonlinear relationships between SOC and environmental predictors. The RF–SHAP analysis demonstrated that moisture availability, temperature, and vegetation productivity interact in complex, nonlinear ways to regulate SOC [49]. These findings highlight the importance of using advanced modeling techniques that can account for the intricate dynamics of SOC accumulation, particularly in regions with strong environmental gradient Looking ahead, future research could focus on expanding the integration of remote sensing data with machine learning models to further improve SOC predictions in regions with limited field data. In particular, the use of high-resolution, multi-sensor data (e.g., optical, thermal, and radar remote sensing) could provide more comprehensive insights into SOC dynamics, especially in remote and data-scarce regions like the Tibetan Plateau [79,80].
5. Conclusions
This study quantified the spatial heterogeneity of surface soil organic carbon (SOC) in the Yellow River Source Region, identifying the dominant hydrothermal and biotic controls using an integrated RF–SHAP framework. The results revealed significant spatial variability in SOC, with moisture-related processes acting as a central mediator between thermal conditions, vegetation productivity, and soil properties. Thermal regimes and freeze-thaw dynamics directly influenced SOC, while vegetation productivity and soil properties primarily affected SOC through moisture-mediated pathways. These findings underscore the hierarchical and nonlinear nature of SOC regulation in alpine headwater ecosystems. From a sustainability perspective, maintaining favorable hydrothermal conditions is crucial for stabilizing soil carbon stocks. Prioritizing wetland conservation, adaptive grazing management, and reducing soil disturbance in high-SOC areas will help mitigate carbon loss, especially under climate warming. The integrated modeling approach developed in this study provides a transferable method for identifying vulnerable carbon pools and supporting sustainable land management in other alpine and climate-sensitive regions.
Supplementary Materials
The following supporting information can be downloaded at the website of this paper posted on Preprints.org, Figure S1 Observed versus predicted SOC from out-of-fold predictions of the RF model.
Funding
This research was funded by the Qinghai Provincial Science and Technology Plan, Basic Research Program (Youth Project), grant number 2023-ZJ-985Q, and by the Self-Supported Project of the World-Class Discipline of Ecology at Qinghai University (Ecosystem Succession and Management Program), grant number 2025-ZZ-08.
Data Availability Statement
Remote sensing and reanalysis datasets used in this study are publicly available from their respective data providers. Sentinel-2 imagery was accessed and processed via the Google Earth Engine (GEE) platform (https://earthengine.google.com/). ERA5-Land climate data were obtained from the Copernicus Climate Data Store (https://cds.climate.copernicus.eu/). Soil and terrain datasets were derived from publicly available products, including SoilGrids and the 30 m SRTM digital elevation model provided by USGS (https://earthexplorer.usgs.gov/). Field-measured SOC data supporting the findings of this study are available from the corresponding author upon reasonable request. Access may be subject to institutional and data protection policies. Modeling scripts and derived datasets can be provided upon reasonable request to facilitate result replication.
Acknowledgments
We greatly appreciate the valuable advice provided by Prof. Xilai Li on the discussion of the soil-landscape relationship and the literature review section. The authors thank Yan Lei, Xiaojie Tang, Yu Deng, Hailing Liu, and Yapei Shan from the College of Eco-Environmental Engineering, Qinghai University for their assistance with field sampling.
Conflicts of Interest
The authors declare no conflicts of interest.
Abbreviations
The following abbreviations are used in this manuscript:
| SOC | Soil organic carbon |
| YRSR | Yellow River Source Region |
| VIF | variance inflation factor |
| RF | Random forest |
| SHAP | SHapley Additive exPlanations |
| CLHS | conditional Latin hypercube sampling |
References
- Tripathi, S.K.; Chanda, R.; Ao, A.; Moirangthem, B.; Chauhan, S.; Mizo, L.; Singh, S.S.; Singh, N.S.; Upadhyay, K.K.; Vanlalfakawma, D.C.; et al. Elevation and Management-Induced Vegetation and Soil Carbon Shift in Eastern Himalayan Forests: Advancing Nature-Based Sustainability Solutions (NbS). Environmental and Sustainability Indicators 2026, 29, 101082. [Google Scholar] [CrossRef]
- Yadav, M.; Mittal, R.; Kumari, A.; Bhatia, A.; Khatri, A.; Bhateria, R. Soil Carbon Fractions and Their Role in Climate-Resilient Agriculture: A Review. Sustainable Chemistry for Climate Action 2025, 7, 100127. [Google Scholar] [CrossRef]
- Gorain, S.; Dutta, S.; Balo, S.; Malakar, A.; Roy Choudhury, M.; Das, S. Harnessing Green Wealth: A Two-Decade Global Assessment of Forest Carbon Sequestration and Credits and the Economic Implications of Sustainable Forest Management Practices. J. Environ. Manage. 2025, 393, 126987. [Google Scholar] [CrossRef]
- Shen, T.; Yu, Z.; Ju, Q.; Jin, J.; Wang, G.; Liu, Y.; Hu, C.; Lyu, S.; Lin, H.; Si, X.; et al. Climate Change Intensifies Carbon Emissions from the Earth’s Third Pole: Projected Trajectories of Soil and Ecosystem Respiration. Glob. Planet. Change 2026, 259, 105359. [Google Scholar] [CrossRef]
- Lin, X.; Han, P.; Zhang, W.; Wang, G. Sensitivity of Alpine Grassland Carbon Balance to Interannual Variability in Climate and Atmospheric CO2 on the Tibetan Plateau during the Last Century. Glob. Planet. Change 2017, 154, 23–32. [Google Scholar] [CrossRef]
- Hou, Y.; Chen, Y.; Chen, X.; He, K.; Zhu, B. Changes in Soil Organic Matter Stability with Depth in Two Alpine Ecosystems on the Tibetan Plateau. Geoderma 2019, 351, 153–162. [Google Scholar] [CrossRef]
- Wang, Y.; Ao, D.; Wang, B.; Chen, Y.; Hu, Y.; Zhang, B.; Zhang, H.; Guo, W.; An, S. Particulate Organic Carbon Dominates Soil Organic Carbon Dynamics in Alpine Ecosystems for Its Climate Sensitivity and Continuous Storage. Catena (Amst). 2026, 262, 109607. [Google Scholar] [CrossRef]
- Kasraei, B.; Schmidt, M.G.; Zhang, J.; Bulmer, C.E.; Filatow, D.S.; Arbor, A.; Pennell, T.; Heung, B. A Framework for Optimizing Environmental Covariates to Support Model Interpretability in Digital Soil Mapping. Geoderma 2024, 445, 116873. [Google Scholar] [CrossRef]
- Yang, R.-M.; Huang, L.-M.; Liu, F. Evaluation and Mapping Soil Organic Carbon in Seasonally Frozen Ground on the Tibetan Plateau. Catena (Amst). 2024, 235, 107631. [Google Scholar] [CrossRef]
- Elias, S.A. Environmental Consequences of Permafrost Degradation. In Reference Module in Earth Systems and Environmental Sciences; Elsevier, 2025; ISBN 978-0-12-409548-9. [Google Scholar]
- Gao, H.; Gong, J.; Liu, J.; Wen, X.; Huang, L.; Maier, M. Modeling of Soil Organic Carbon Stock and Sequestration Potential in Grassland and Cropland in Qinghai-Tibet Plateau: Prediction and Carbon Management Strategies Based on Different Climate Scenarios. Catena (Amst). 2025, 261, 109545. [Google Scholar] [CrossRef]
- Zhou, Y.; Duan, L.; Guo, J.; Yan, D.; Wu, Y.; Wang, Y.; Guan, H.; Batelaan, O.; Liu, T. Responses of Plant Productivity and Soil Nutrient Concentration to Different Levels of Semi-Arid Grassland Degradation. Agric. Ecosyst. Environ. 2026, 399, 110198. [Google Scholar] [CrossRef]
- Saba, T.; Chen, Q.; Lei, Y.; Shen, J.; Liu, L.; Sun, G. Plant-Soil Synchrony and Its Role in the Restoration of Desertified Grassland on the Qinghai-Tibet Plateau. Soil Tillage Res. 2026, 255, 106787. [Google Scholar] [CrossRef]
- Mortensen, E.Ø.; Abalos, D.; Rasmussen, J. Well-Designed Multi-Species Grassland Mixtures Enhance Both Soil Carbon Inputs and Aboveground Productivity. Agric. Ecosyst. Environ. 2025, 385, 109578. [Google Scholar] [CrossRef]
- Liu, Z.; Si, J.; Jia, B.; Zhou, D.; Zhu, X.; Ndayambaza, B.; Bai, X.; Wang, B. Soil Organic Carbon Distribution and Multi-Scale Drivers in Semi-Arid Alpine Regions: Implications for Carbon Storage Function Stability. J. Environ. Manage. 2025, 393, 126989. [Google Scholar] [CrossRef] [PubMed]
- Zheng, H.; Liu, M.; Chu, H.; Gaffney, P.P.J.; Pan, J.; Wang, Q.-C.; Li, Y.; Tian, D.; Zhang, R.; Zhou, R.; et al. Water Table-Driven Divergent Patterns and Drivers of Particulate and Mineral-Associated Organic Carbon in Alpine Peatlands. Catena (Amst). 2026, 262, 109650. [Google Scholar] [CrossRef]
- Wang, Z.; Huang, L.; Shao, M. Spatial Variations and Influencing Factors of Soil Organic Carbon under Different Land Use Types in the Alpine Region of Qinghai-Tibet Plateau. Catena (Amst). 2023, 220, 106706. [Google Scholar] [CrossRef]
- Shen, J.; Ou, B.; Lei, Y.; He, Y.; Xue, J.; Deng, X.; Wang, C.; Li, Y.; Sun, G. Mechanisms of Soil Persistent Organic Carbon Loss in Alpine Ecosystems: Insights into Microbial and Calcium Spatial Footprint. Soil Biol. Biochem. 2025, 204, 109765. [Google Scholar] [CrossRef]
- Xu, H.; Chen, T.; Huang, K.; Liu, Z.; Wang, X. Sensitivity of Alpine Grassland Productivity to Atmospheric Aridity and Soil Moisture on the Qinghai-Tibet Plateau: Spatial Patterns and Determinants. J. Hydrol. (Amst). 2026, 664, 134476. [Google Scholar] [CrossRef]
- Zhou, Y.; Duan, L.; Guo, J.; Yan, D.; Wu, Y.; Wang, Y.; Guan, H.; Batelaan, O.; Liu, T. Responses of Plant Productivity and Soil Nutrient Concentration to Different Levels of Semi-Arid Grassland Degradation. Agric. Ecosyst. Environ. 2026, 399, 110198. [Google Scholar] [CrossRef]
- Huiling, Z.; Zongxing, L.; Zhengliang, Y.; Yunying, W.; Fa, D.; Jian, X. Permafrost Impacts on Chemical Weathering and CO2 Budgets in the Tibetan Plateau: Micro-Watershed Perspective on a Headwater Catchment. Catena (Amst). 2024, 247, 108479. [Google Scholar] [CrossRef]
- Zhang, Y.; Li, X.; Shi, F.; Zhang, X.; Hu, G.; Zuo, F.; Wang, Z.; Liu, X. Spatiotemporal Variability of Dissolved Carbon and Sources of Dissolved Inorganic Carbon Influenced by Freeze–Thaw and Subsurface Flow in an Alpine Headwater Catchment of the Qinghai-Tibetan Plateau. J. Hydrol. (Amst). 2024, 640, 131740. [Google Scholar] [CrossRef]
- Liu, W.; Li, Y.; Li, D.; Lin, P.; Wang, X.; Pritchard, H.D.; Kraaijenbrink, P.D.A. Impacts of Changes in Climate, Cryosphere, and Vegetation on Freshwater Supply in the Southeastern Tibetan Plateau. J. Hydrol. (Amst). 2025, 661, 133713. [Google Scholar] [CrossRef]
- Li, X.; Long, D.; Scanlon, B.R.; Slater, L.J. Retrievals and Simulations of Terrestrial Water Storage Changes and Runoff over the Tibetan Plateau: Challenges and Opportunities. Fundamental Research 2025. [Google Scholar] [CrossRef]
- Ye, Y.; Tan, X. The Yellow River Headwater Is Shrinking in Response to the Northeastward Expansion of the Tibetan Plateau. Palaeogeogr. Palaeoclimatol. Palaeoecol. 2025, 657, 112609. [Google Scholar] [CrossRef]
- Li, X.; Jin, R.; Pan, X.; Zhang, T.; Guo, J. Changes in the Near-Surface Soil Freeze–Thaw Cycle on the Qinghai-Tibetan Plateau. International Journal of Applied Earth Observation and Geoinformation 2012, 17, 33–42. [Google Scholar] [CrossRef]
- Chang, Y.; Ding, Y.; Zhang, S.; Shangguan, D.; Qin, J.; Zhao, Q. Contribution of Climatic Variables and Their Interactions to Reference Evapotranspiration Changes Considering Freeze-Thaw Cycles in the Tibetan Plateau during 1960–2022. Atmos. Res. 2024, 305, 107425. [Google Scholar] [CrossRef]
- Zheng, J.; Zhao, T.; Lü, H.; Zou, D.; Rodriguez-Fernandez, N.; Mialon, A.; Richaume, P.; Xiao, J.; Ma, J.; Fan, L.; et al. Use of a New Tibetan Plateau Network for Permafrost to Characterize Satellite-Based Products Errors: An Application to Soil Moisture and Freeze/Thaw. Remote Sens. Environ. 2024, 300, 113899. [Google Scholar] [CrossRef]
- Liu, W.; Wen, J.; Chen, J.; Wang, Z.; Lu, X.; Wu, Y.; Jiang, Y. Characteristic Analysis of the Spatio-Temporal Distribution of Key Variables of the Soil Freeze-Thaw Processes over the Qinghai-Tibetan Plateau. Cold Reg. Sci. Technol. 2022, 197, 103526. [Google Scholar] [CrossRef]
- Zhang, J.; Lan, Y.; Chen, X.; Tan, Y.; Wu, T.; Lyu, S.; Zhou, Y.; Zhang, Y.; Cheng, L.; Chen, Y.; et al. Baseflow Characteristics and Drivers in Headwater Catchment of the Yellow River, Tibetan Plateau. J. Hydrol. Reg. Stud. 2024, 56, 101991. [Google Scholar] [CrossRef]
- Du, J.; Yu, X.; Zhou, L.; Li, X.; Ao, T. Less Concentrated Precipitation and More Extreme Events over the Three River Headwaters Region of the Tibetan Plateau in a Warming Climate. Atmos. Res. 2024, 303, 107311. [Google Scholar] [CrossRef]
- Wang, K.; Ma, Z.; Qin, W.; Li, X.; Shi, H.; Hasi, B.; Liu, X. Soil Nutrients and PH Modulate Carbon Dynamics in Particulate and Mineral-Associated Organic Matter during Restoration of a Tibetan Alpine Grassland. Ecol. Eng. 2025, 212, 107522. [Google Scholar] [CrossRef]
- Cui, G.; Li, W.; Meng, Y.; Dong, L. Differential Effects of Vegetation Types on Regional Carbon Stocks in China: A Meta-Analysis-Based Integrated Assessment of above-Ground and Surface Soil Carbon Pools. Environ. Dev. 2026, 57, 101377. [Google Scholar] [CrossRef]
- Lin, X.; Zhang, S.; Huete, A.; Chen, H.Y.H.; Zhao, H.; He, Q.; Lv, S.; Zhang, Q.; Zhang, X.; Zhang, X. Global-to-Regional Variations in the Effects of Grassland Management on Soil Carbon. Agric. Ecosyst. Environ. 2026, 400, 110251. [Google Scholar] [CrossRef]
- Zhang, M.; Zhou, T.; Li, R.; Zhang, C.; Li, Y.; Liu, T.; Yu, H.; Liang, E.; Sun, J. Short-Term Grazing Exclusion Is More Conducive to the Rate of Soil Organic Carbon Stock in Alpine Grassland of the Tibetan Plateau. Agric. Ecosyst. Environ. 2026, 395, 109955. [Google Scholar] [CrossRef]
- Zhang, J.; Zhou, T.; Cao, L.; Zeng, J.; Zhang, Y.; Zhang, Q.; Wu, X.; Qu, Y.; Tan, E.; Liu, X. Simulation of Carbon Fluxes from Tibetan Plateau Grasslands by Integrating Data Assimilation and Parameter Inversion within the Biome-BGC Model. Ecol. Modell. 2025, 510, 111335. [Google Scholar] [CrossRef]
- Zheng, L.; Pei, Y.; Yang, F.; Yuan, X.; Peng, J.; Zhu, B.; Wang, G. Modeling Grazing Effects on Carbon Dynamics in Alpine Grasslands of the Qinghai-Tibetan Plateau Using the Biome-BGCMuSo Model. Agric. Ecosyst. Environ. 2026, 397, 110056. [Google Scholar] [CrossRef]
- Tang, R.; Zhao, Y.; Lin, H. Spatio-Temporal Variation Characteristics of Aboveground Biomass in the Headwater of the Yellow River Based on Machine Learning. Remote Sens. (Basel). 2021, 13. [Google Scholar] [CrossRef]
- Gu, J.; Yang, F.; Li, D.-X.; Ye, M.-L.; Wen, H.-Y.; Feng, W.-L.; Song, X.-D.; Zhang, G.-L. Stock and Carbon Sequestration Potential of Mineral-Associated Organic Carbon in the Qinghai-Tibetan Plateau. Geoderma 2025, 463, 117585. [Google Scholar] [CrossRef]
- Jiang, M.; Zhang, W.; Liu, J.; Zhang, Q. Increasing Soil Organic Carbon Stock of Alpine Wetlands on the Tibetan Plateau: Results of Future Scenarios. Glob. Planet. Change 2025, 255, 105104. [Google Scholar] [CrossRef]
- Xiong, X.; Grunwald, S.; Myers, D.B.; Kim, J.; Harris, W.G.; Comerford, N.B. Holistic Environmental Soil-Landscape Modeling of Soil Organic Carbon. Environmental Modelling & Software 2014, 57, 202–215. [Google Scholar] [CrossRef]
- Wicaksono, P.; Harahap, S.D.; Ananda, S.R.; Benyamin, K.O.; Nabiha, R.I.; Maharsi, V.W. Compressed High-Spatial-Resolution Imagery to Train and Validate Seagrass Percent Cover Mapping Using Sentinel-2 Imagery. Reg. Stud. Mar. Sci. 2026, 95, 104808. [Google Scholar] [CrossRef]
- Stefanescu Miralles, G.; Biglia, A.; Ricauda Aimonino, D.; Mattetti, M.; Gay, P.; Comba, L. Maize Yield Estimation from Sentinel-2 Multi-Temporal Imagery and CANbus Data Integration: A Non-Parametric Regression Approach. Biosyst. Eng. 2026, 264, 104401. [Google Scholar] [CrossRef]
- Reisi Gahrouei, O.; Guindon, L.; Perbet, P.; L.P. Correia, D.; Cøté, J.-F.; Béland, M. Windthrow Mapping in Boreal Forests Using a Spatio-Temporal Deep Learning Approach and Sentinel-2 Imagery. Remote Sens. Environ. 2026, 335, 115270. [Google Scholar] [CrossRef]
- Wang, Y.; Foody, G.; Zhou, P.; Li, Y.; Li, X.; Zhang, Y.; Du, Y.; Li, X. Dynamic Surface Water Fraction (DSWF): Global Surface Water Fraction Mapping at 10-Meter Spatial Resolution with Sentinel-2 Imagery in Google Earth Engine. International Journal of Applied Earth Observation and Geoinformation 2025, 143, 104813. [Google Scholar] [CrossRef]
- Liu, J.; Wang, Z.; Sun, Z.; Geng, S.; Yu, F.; Liu, N.; Wen, M.; Yang, L. Integrating Multi-Temporal Information for Monitoring Plant Spectral Diversity with PlanetScope and Sentinel-2 Satellite Imagery. Ecol. Indic. 2025, 180, 114348. [Google Scholar] [CrossRef]
- Tian, L.; Huang, W.; Cui, G.; Huang, X.; Cui, F.; Wei, Y.; Zhao, C.; Tong, S.; Wang, A. Wetland Restoration Enhances Soil Carbon Sequestration in Lake Ecosystems: Integrating Multi-Source Remote Sensing and Optimized Ensemble Machine Learning to Map Soil Organic Carbon Density. Ecol. Indic. 2026, 182, 114551. [Google Scholar] [CrossRef]
- Yang, M.; Chen, S.; Guo, X.; Shi, Z.; Zhao, X. Exploring the Potential of Vis-NIR Spectroscopy as a Covariate in Soil Organic Matter Mapping. Remote Sens. (Basel). 2023, 15. [Google Scholar] [CrossRef]
- Liu, Y.; Samat, A.; Du, P.; Chen, J.; Abuduwaili, J.; Luo, K.; Zhu, E.; Shokparova, D. High-Resolution Spatiotemporal Analysis and Driver Attribution of Floods in Kazakhstan Using SHAP and Remote Sensing Integration. Clim. Risk Manag. 2026, 51, 100783. [Google Scholar] [CrossRef]
- Wu, Y.; Dong, M.; Wang, Y.; Yu, X.; Wang, Z.; Ye, X. The Mechanisms of Microbial and Soil Carbon Pool Responses to Soil Aggregates Improvement by Different Organic Fertilizers. J. Environ. Manage. 2025, 395, 127814. [Google Scholar] [CrossRef]
- PAN, Y.; TANG, H.; JIN, Q.; SHI, P. Organic Carbon Density in Qingzang Plateau Grasslands Is Highly Variable and Primarily Controlled by Soil Properties. Pedosphere 2026. [Google Scholar] [CrossRef]
- Guidi, P.; Falsone, G.; Wilson, C.; Cavani, L.; Ciavatta, C.; Marzadori, C. New Insights into Organic Carbon Stabilization in Soil Macroaggregates: An in Situ Study by Optical Microscopy and SEM-EDS Technique. Geoderma 2021, 397, 115101. [Google Scholar] [CrossRef]
- Liu, B.; Huang, L.; Zhang, F.; Cai, J.; Tian, L.; Jiang, X.; Liang, Y.; Zhu, G.; Huang, G. High PH Decreases the Contents of Stable Organic Nitrogen Fractions and Nitrogen Supply Capacity by Inhibiting Soil Organic Carbon in Saline-Sodic Paddy Fields. Soil Tillage Res. 2026, 258, 107018. [Google Scholar] [CrossRef]
- Kong, D.; Chu, N.; Luo, C.; Liu, H. Urbanization Gradient Effects and Spatial Heterogeneity of Soil Organic Carbon Stocks in Northeast China. Catena (Amst). 2026, 262, 109610. [Google Scholar] [CrossRef]
- Li, H.; Jin, X.; Shan, W.; Han, B.; Zhou, Y.; Tittonell, P. Optimizing Agricultural Management in China for Soil Greenhouse Gas Emissions and Yield Balance: A Regional Heterogeneity Perspective. J. Clean. Prod. 2024, 452, 142255. [Google Scholar] [CrossRef]
- Zeng, F.; Yang, R.; Liu, H.; Du, Q.; Liu, Y.; Cun, H. Spring Factors Controlling Interannual CO2 Flux Variations in a Subtropical Humid Alpine Meadow on the Southeastern Tibetan Plateau. Agric. For. Meteorol. 2025, 370, 110603. [Google Scholar] [CrossRef]
- Xing, Y.; Wang, P.; Zhang, D.; Sun, H.; Li, S. Convergent Control of Soil Temperature on Seasonal Carbon Flux in Tibetan Alpine Meadows: An in-Situ Monitoring Study. Ecol. Indic. 2023, 156, 111116. [Google Scholar] [CrossRef]
- Fan, B.; Peng, H.; Yao, H.; Li, K.; Hong, B. Seasonal and Inter-Annual Dynamics of Water Vapor Flux Based on Five-Year Eddy Covariance Measurements over an Alpine Grassland in Arid Central Asia. J. Hydrol. (Amst). 2025, 663, 134259. [Google Scholar] [CrossRef]
- Hou, Q.; Yu, X. Seasonal Variation in Carbon Flux and the Driving Mechanisms in the Grassland Ecosystem in a Mountain Region of Northwest China. Ecol. Indic. 2025, 179, 114168. [Google Scholar] [CrossRef]
- Wang, S.; Zhang, Y.; Meng, X.; Shang, L.; Li, Z.; Li, S. Water Availability Control the Seasonal and Inter-Annual Variability of CO2 Fluxes in an Alpine Meadow on the Eastern Tibetan Plateau. Agric. For. Meteorol. 2024, 356, 110187. [Google Scholar] [CrossRef]
- Zou, C.; Ma, R.; Xiong, J.; Pan, Z.; Sun, Z. Seasonal Variation of Groundwater Flow Path Induced by Freeze‒thaw Process Drives the Changes of DOC Export and DOM Composition in Streams in an Alpine Catchment, Qinghai‒Tibet Plateau. J. Hydrol. (Amst). 2026, 667, 134943. [Google Scholar] [CrossRef]
- Fu, Y.; Cao, Y.; Sun, L.; Liang, N.; Bahadur, A.; Jin, J.; Yang, P.; Chen, S. Seasonal Freeze-Thaw Processes Controlled the Carbon Flux Components of an Alpine Meadow Ecosystem above 4000 m. Research in Cold and Arid Regions 2025. [Google Scholar] [CrossRef]
- Shi, L.; Lin, Z.; Shi, Y.; He, Y.; Yao, Z.; Zhang, R.; Shao, X. Contrasting Effects of Long-Term Warming and Increased Precipitation on Ecosystem Respiration and Methane Fluxes in an Alpine Meadow. J. Integr. Agric. 2025. [Google Scholar] [CrossRef]
- Wang, W.; Rong, Y.; Zhang, C.; Wang, C.; Huo, Z. Data Assimilation of Soil Moisture and Leaf Area Index Effectively Improves the Simulation Accuracy of Water and Carbon Fluxes in Coupled Farmland Hydrological Model. Agric. Water Manag. 2024, 291, 108646. [Google Scholar] [CrossRef]
- Liu, S.; Wang, P.; Yu, J.; Zhou, R.; Bai, B.; Gabysheva, O.I.; Frolova, N.L.; Pozdniakov, S.P. Changes in Hydrological Regime Regulate POC Export across Permafrost-Dominated Arctic River Basins. Geoscience Frontiers 2026, 17, 102208. [Google Scholar] [CrossRef]
- Zhang, Y.; Wu, J.; Gao, Y.; Wang, G.; Wang, J.; Wen, X. Estimation of Organic Carbon Source Composition and Riverine Outflow Using an Integrated Watershed Hydrological–Carbon Modelling Approach. Water Res. 2025, 280, 123545. [Google Scholar] [CrossRef] [PubMed]
- Patrick, M.E.; Myers-Pigg, A.N.; Gates, Z.; Gaviria Salazar, C.; Morry, A.K.; Prestegaard, K.; Ziegler, S.E. Hillslope Hydrologic Influences on Soil Dissolved Organic Carbon Fate Informs Extreme Precipitation Impacts on Boreal Forest Mineral Soil Stocks. Catena (Amst). 2025, 259, 109361. [Google Scholar] [CrossRef]
- Zhu, B.; Xie, X.; Yao, Y.; Zhao, X. Evaluating the Impact of Elevated CO2 on the Hydrological Cycle and Carbon Budgets in the Loess Plateau. J. Hydrol. Reg. Stud. 2026, 63, 103104. [Google Scholar] [CrossRef]
- Zeng, Y.; Liu, Y.; Yu, X. Contribution of Hydrological Connectivity to the Retention of Soil Organic Carbon by Vegetation Patches: Insight from a Dryland Hillslope on the Loess Plateau, China. Catena (Amst). 2022, 216, 106436. [Google Scholar] [CrossRef]
- Chen, H.; Bittner, D.; Yin, W.; Thompson, L.; Campbell, G.; Hastings, A.; Abdalla, M. Dynamics of Methane Flux in Permafrost-Affected Wetlands: A Meta-Analysis of Permafrost Continuity Effects and Hydrological Controls. Environmental Pollution 2025, 385, 127040. [Google Scholar] [CrossRef]
- Post, J.; Krysanova, V.; Suckow, F.; Mirschel, W.; Rogasik, J.; Merbach, I. Integrated Eco-Hydrological Modelling of Soil Organic Matter Dynamics for the Assessment of Environmental Change Impacts in Meso- to Macro-Scale River Basins. Ecol. Modell. 2007, 206, 93–109. [Google Scholar] [CrossRef]
- Zhang, S.; Zhong, H.; Wang, B.; Zou, F.; Liu, Y.; Nie, M.; Wu, L. Decadal Dynamics of Wetland Soil Carbon Driven by Hydrological Variability. J. Hydrol. (Amst). 2026, 667, 134919. [Google Scholar] [CrossRef]
- Ya, Y.; Dongdong, L.; Lin, Y. Staging Effects of Biological Soil Crust-Driven Coupled Soil–Water-Vegetation Mechanisms in Vegetation-Limited Areas. Catena (Amst). 2025, 260, 109430. [Google Scholar] [CrossRef]
- Chen, L.; Jing, X.; Flynn, D.F.B.; Shi, Y.; Kühn, P.; Scholten, T.; He, J.-S. Changes of Carbon Stocks in Alpine Grassland Soils from 2002 to 2011 on the Tibetan Plateau and Their Climatic Causes. Geoderma 2017, 288, 166–174. [Google Scholar] [CrossRef]
- Liu, Z.; Feng, T.; Wei, W.; Tan, M.; Li, Z.; Wang, H.; Jin, L.; Wang, P. The Effect of Vegetation Restoration on Soil Organic Carbon Mineralization in Bibliometric Analysis and a Review. Ecological Frontiers 2025, 45, 1546–1556. [Google Scholar] [CrossRef]
- Hao, Z.; Le, Q.; He, J.; Ma, J. Distance-Dependent Effects of Road Traffic on Soil Water Content and Vegetation Biomass in Protected Grassland Ecosystems. Catena (Amst). 2025, 257, 109114. [Google Scholar] [CrossRef]
- Song, Y.; Yao, Y.; Kong, W.; Guo, L.; Bao, K.; Qiu, L.; Shao, M.; Wei, X. Effects of Vegetation Loss and Soil Erosion Intensity on Soil Carbon Dynamics across Landscape Position: Evidence from China’s Loess Plateau. Agric. Ecosyst. Environ. 2026, 396, 109992. [Google Scholar] [CrossRef]
- Hoffman, S.A.; Zhao, D.; Markewitz, D. Soil Carbon and Nitrogen through Twenty Years of Forest Management. For. Ecol. Manage. 2025, 580, 122548. [Google Scholar] [CrossRef]
- Zheng, Z.; Liu, C.; Wu, X.; Man, H.; Dong, X.; Zang, S. Organic Carbon in Wetland Soils Is More Vulnerable to Climate Warming than Forest Soils in Permafrost Regions. Catena (Amst). 2025, 259, 109363. [Google Scholar] [CrossRef]
- Zhang, R.; Chan, S.; Bindlish, R.; Lakshmi, V. A Performance Analysis of Soil Dielectric Models over Organic Soils in Alaska for Passive Microwave Remote Sensing of Soil Moisture. Remote Sens. (Basel). 2023, 15. [Google Scholar] [CrossRef]
Figure 1.
Spatial distribution of field sampling sites in the Yellow River Source Region.
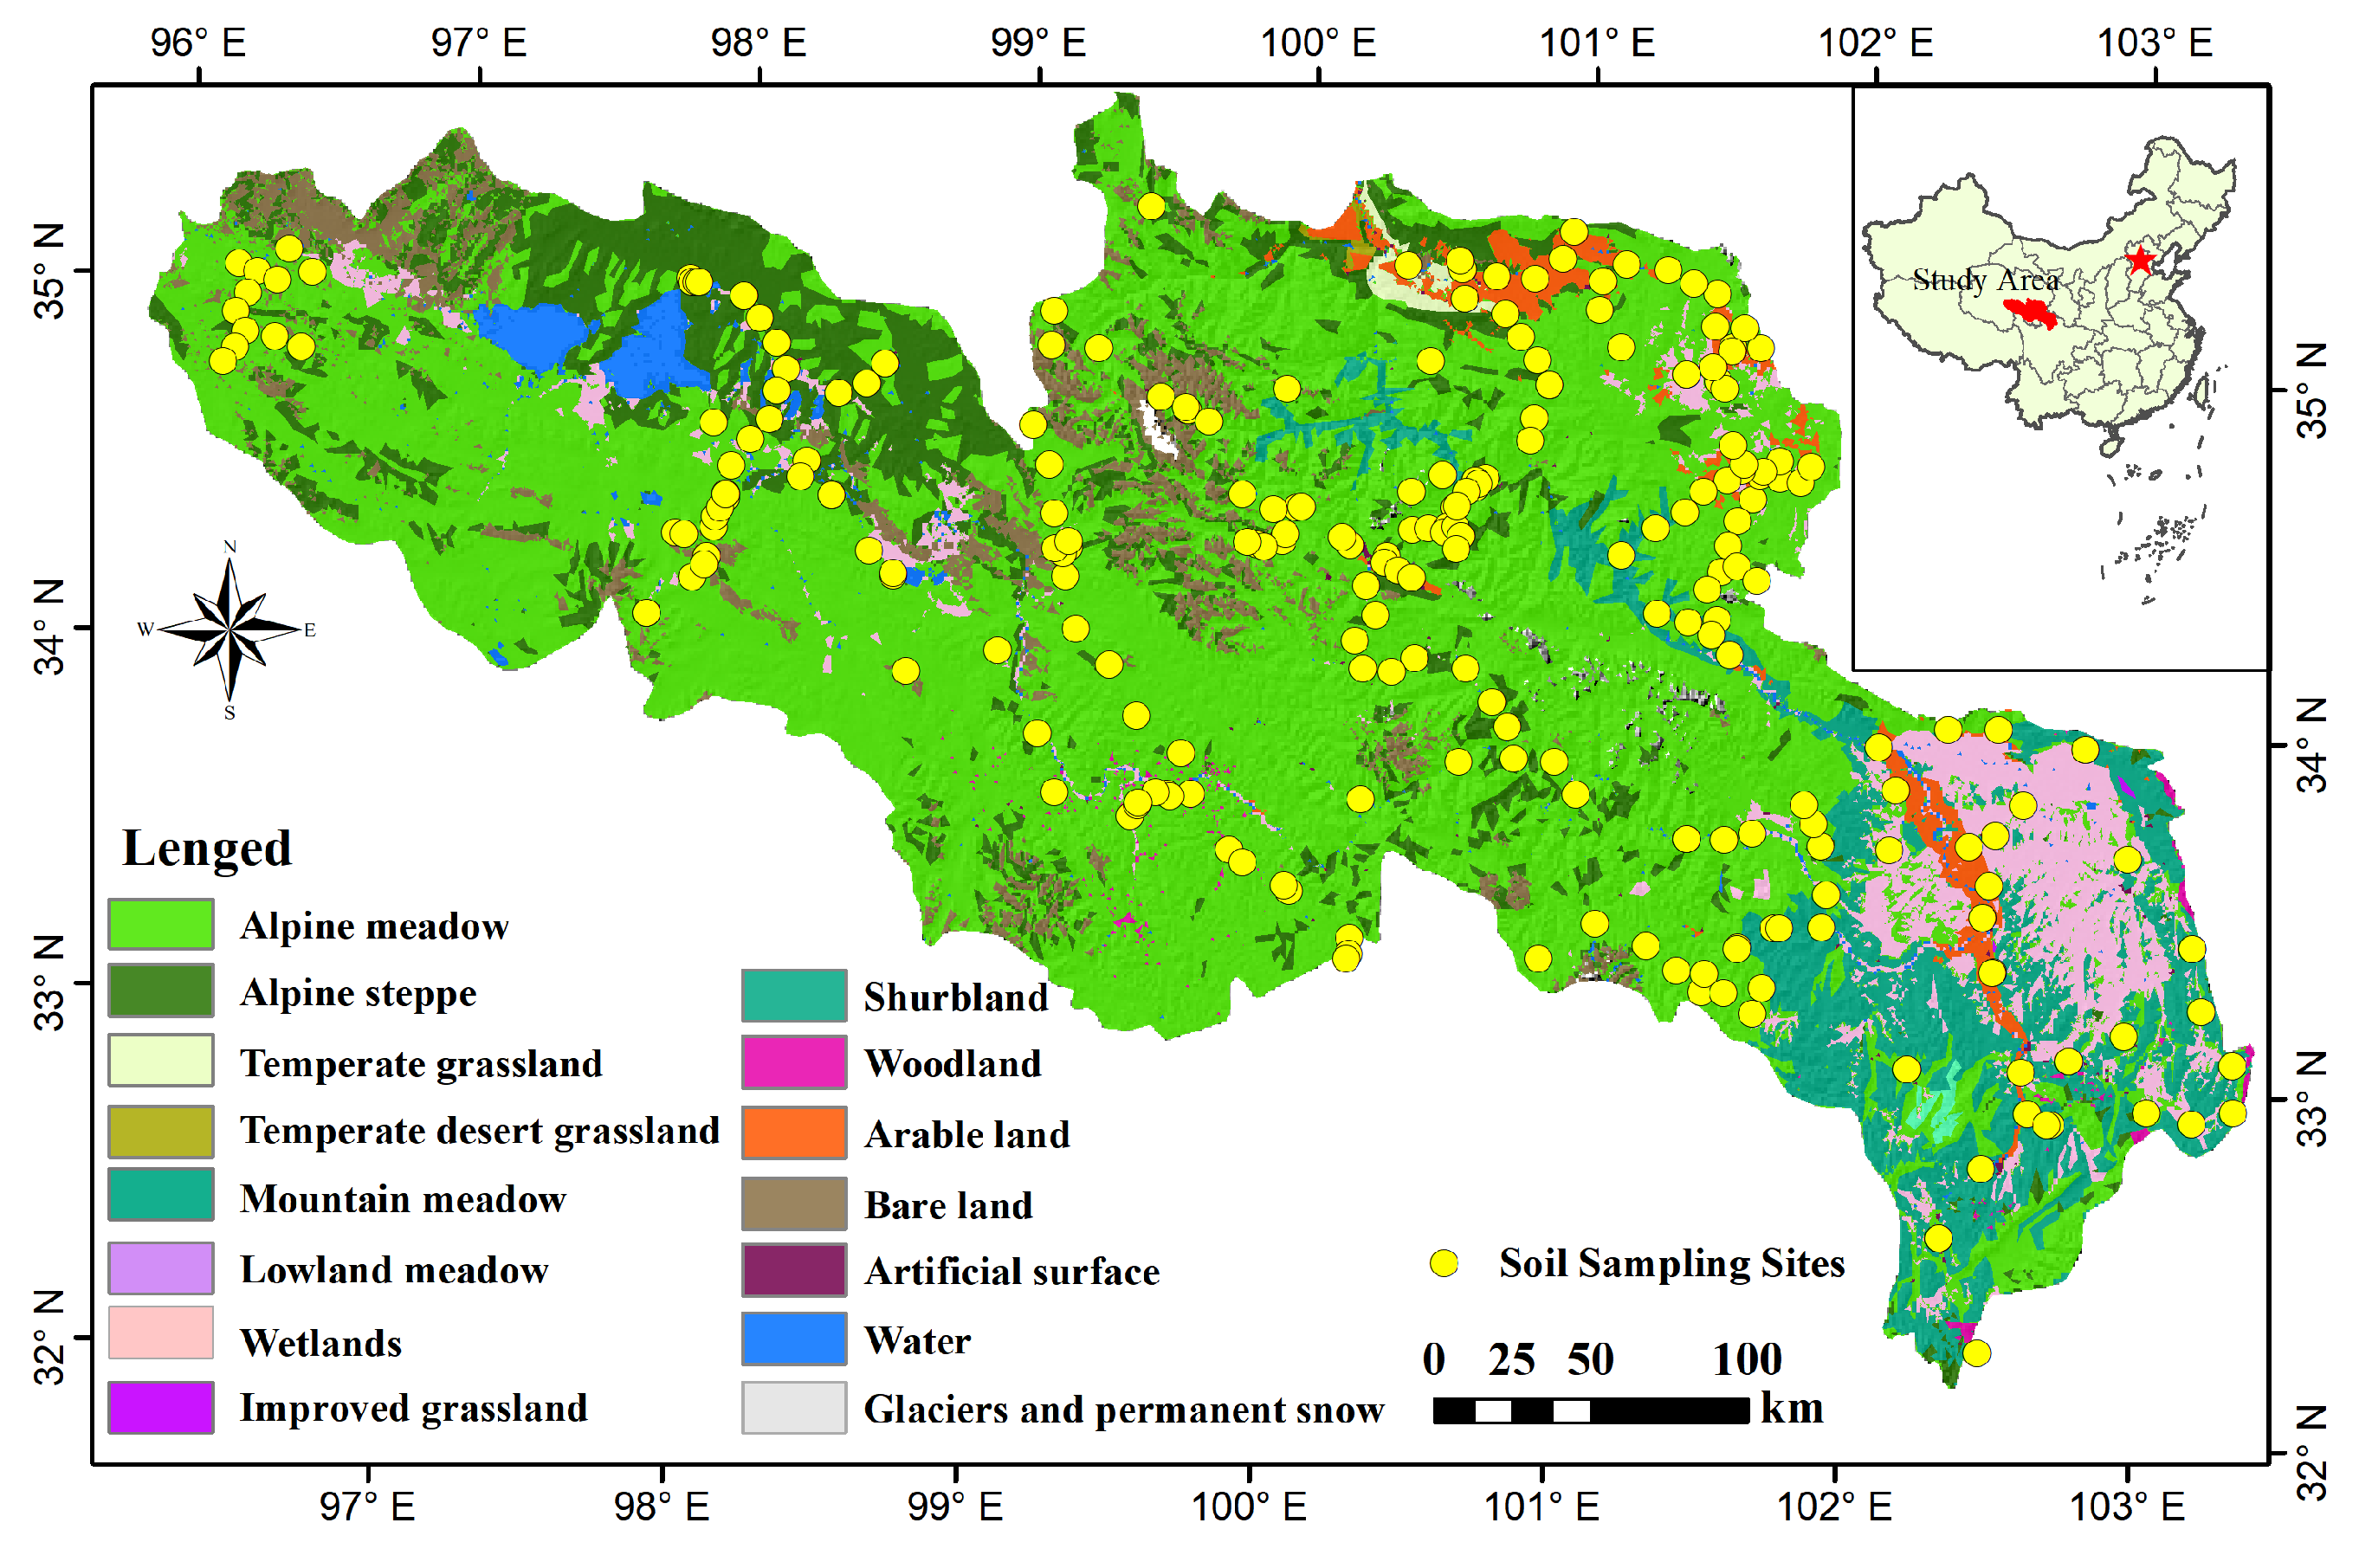
Figure 2.
Spatial distribution of sampling cost layers used for field sampling of SOC.
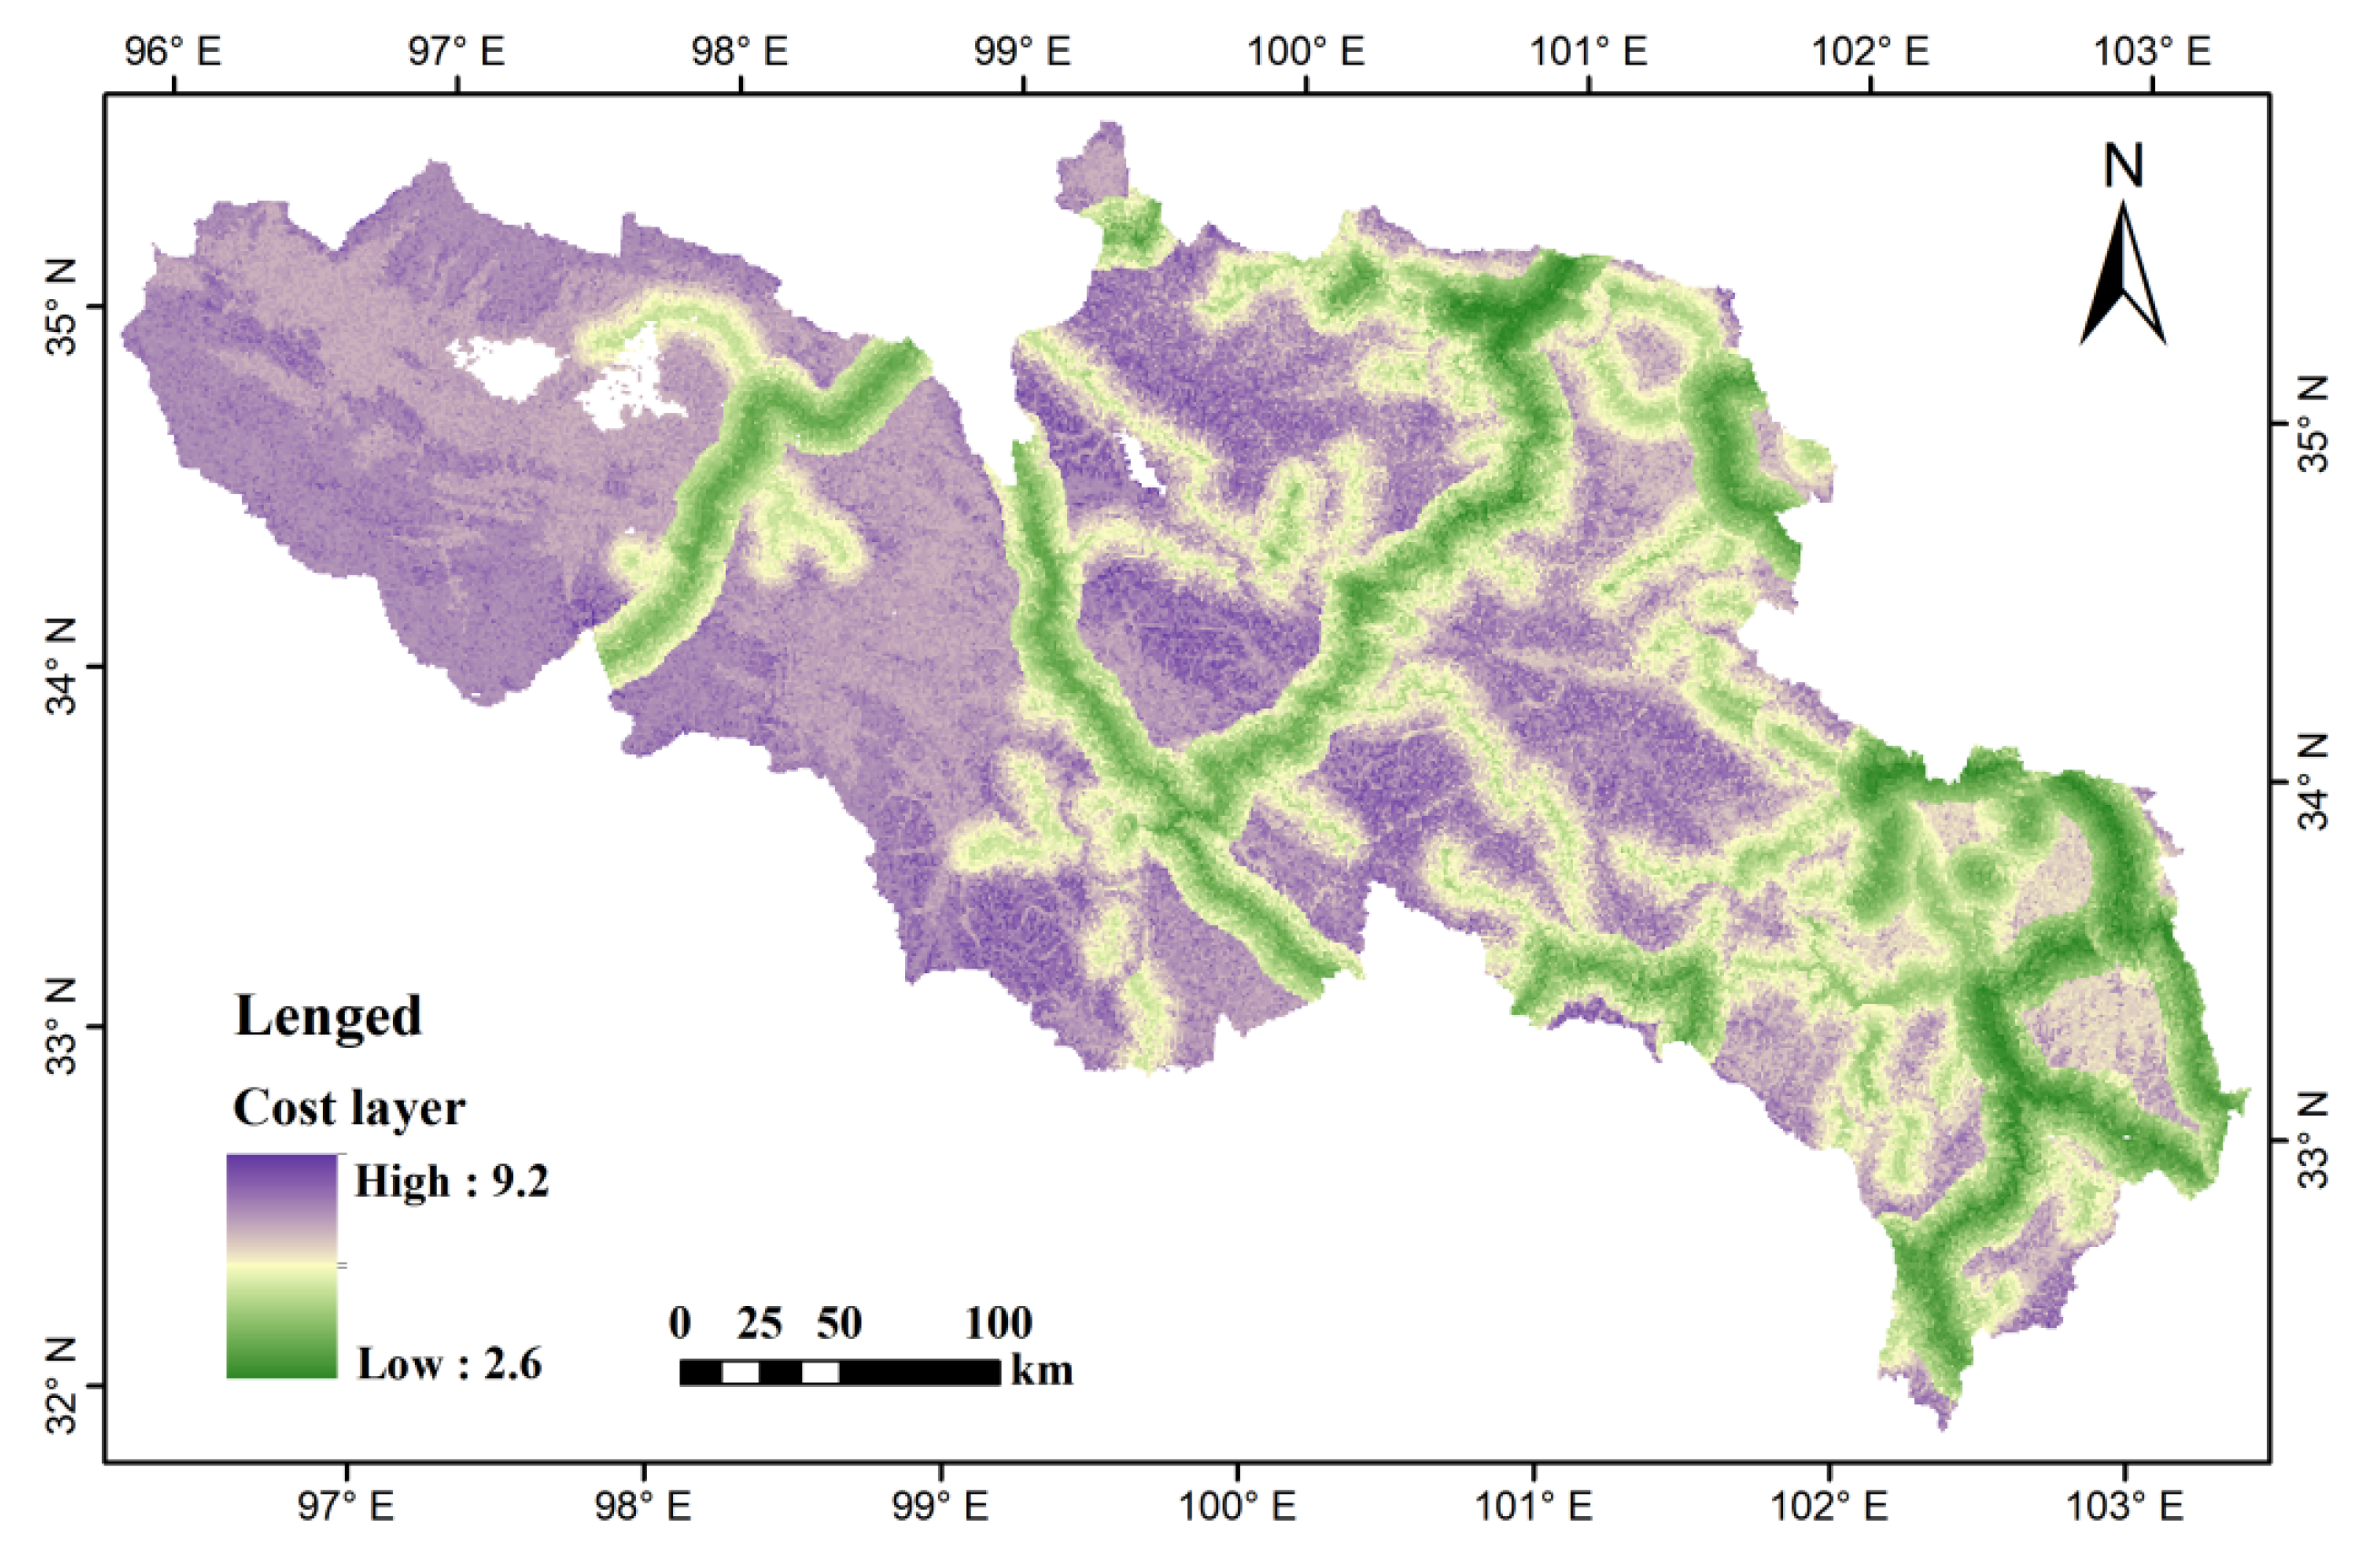
Figure 3.
Boruta feature selection results for all candidate predictors.
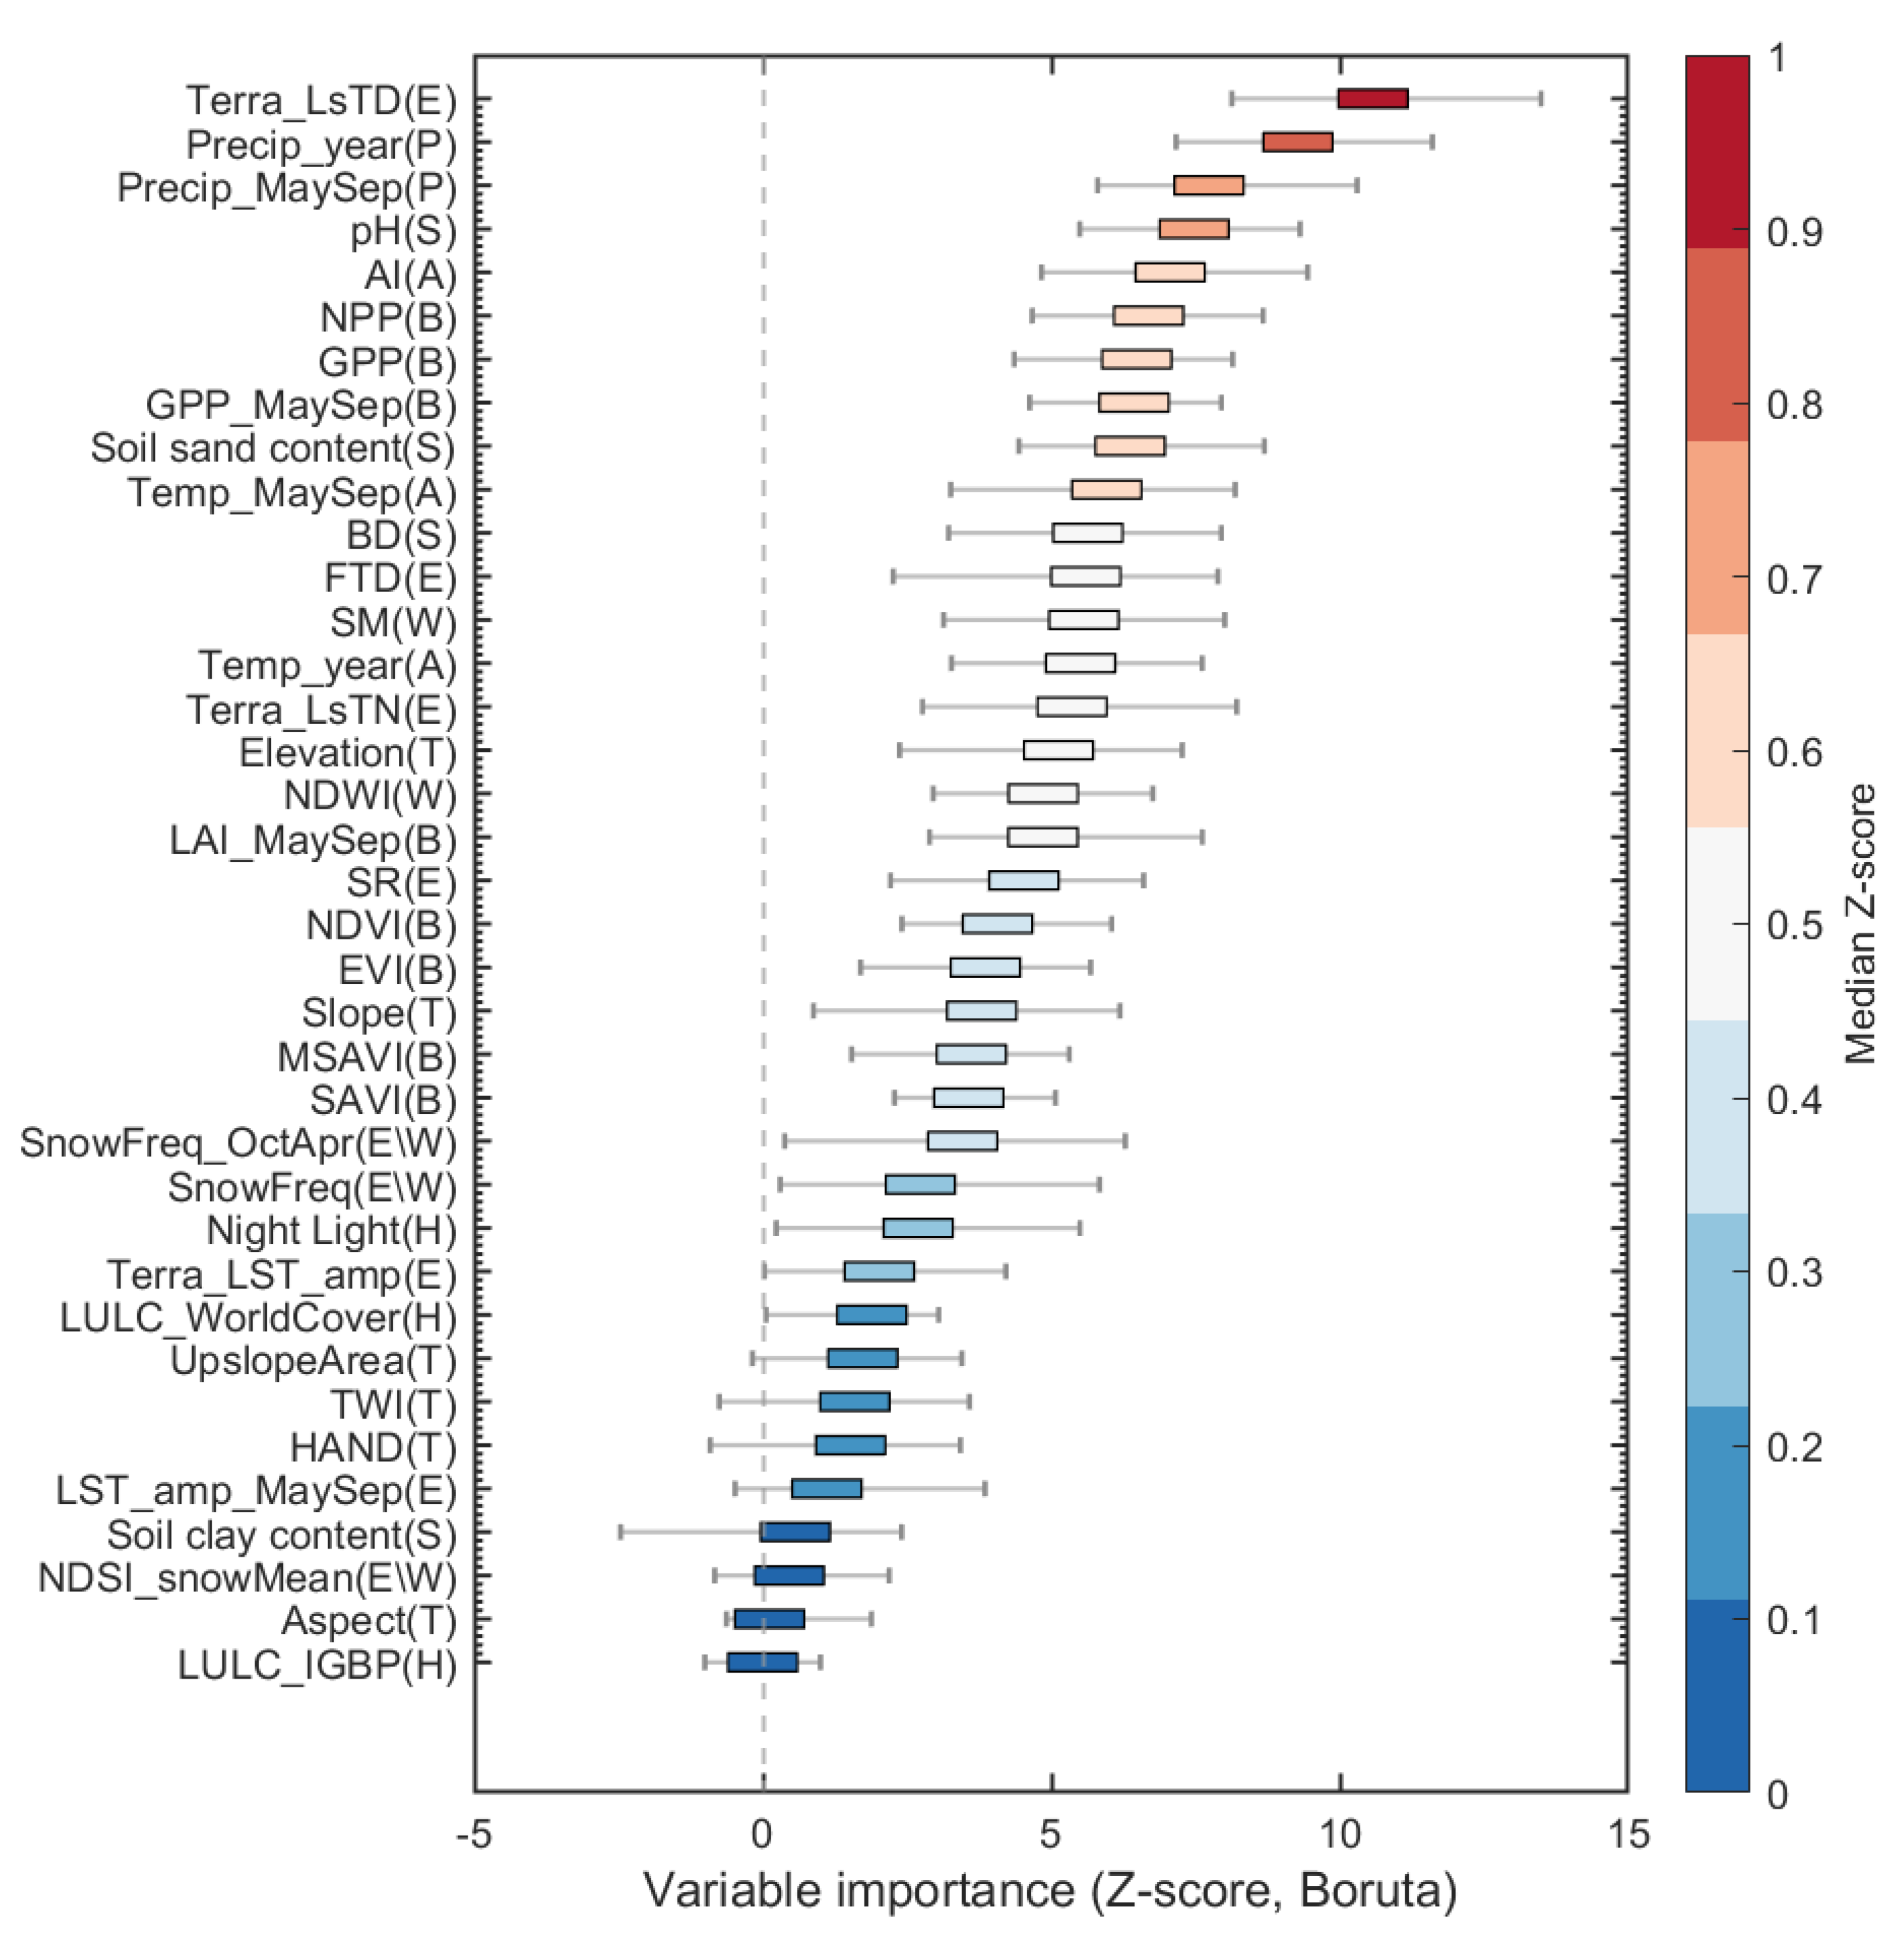
Figure 4.
Relative importance of environmental predictors controlling SOC based on mean absolute SHAP values.
Figure 4.
Relative importance of environmental predictors controlling SOC based on mean absolute SHAP values.
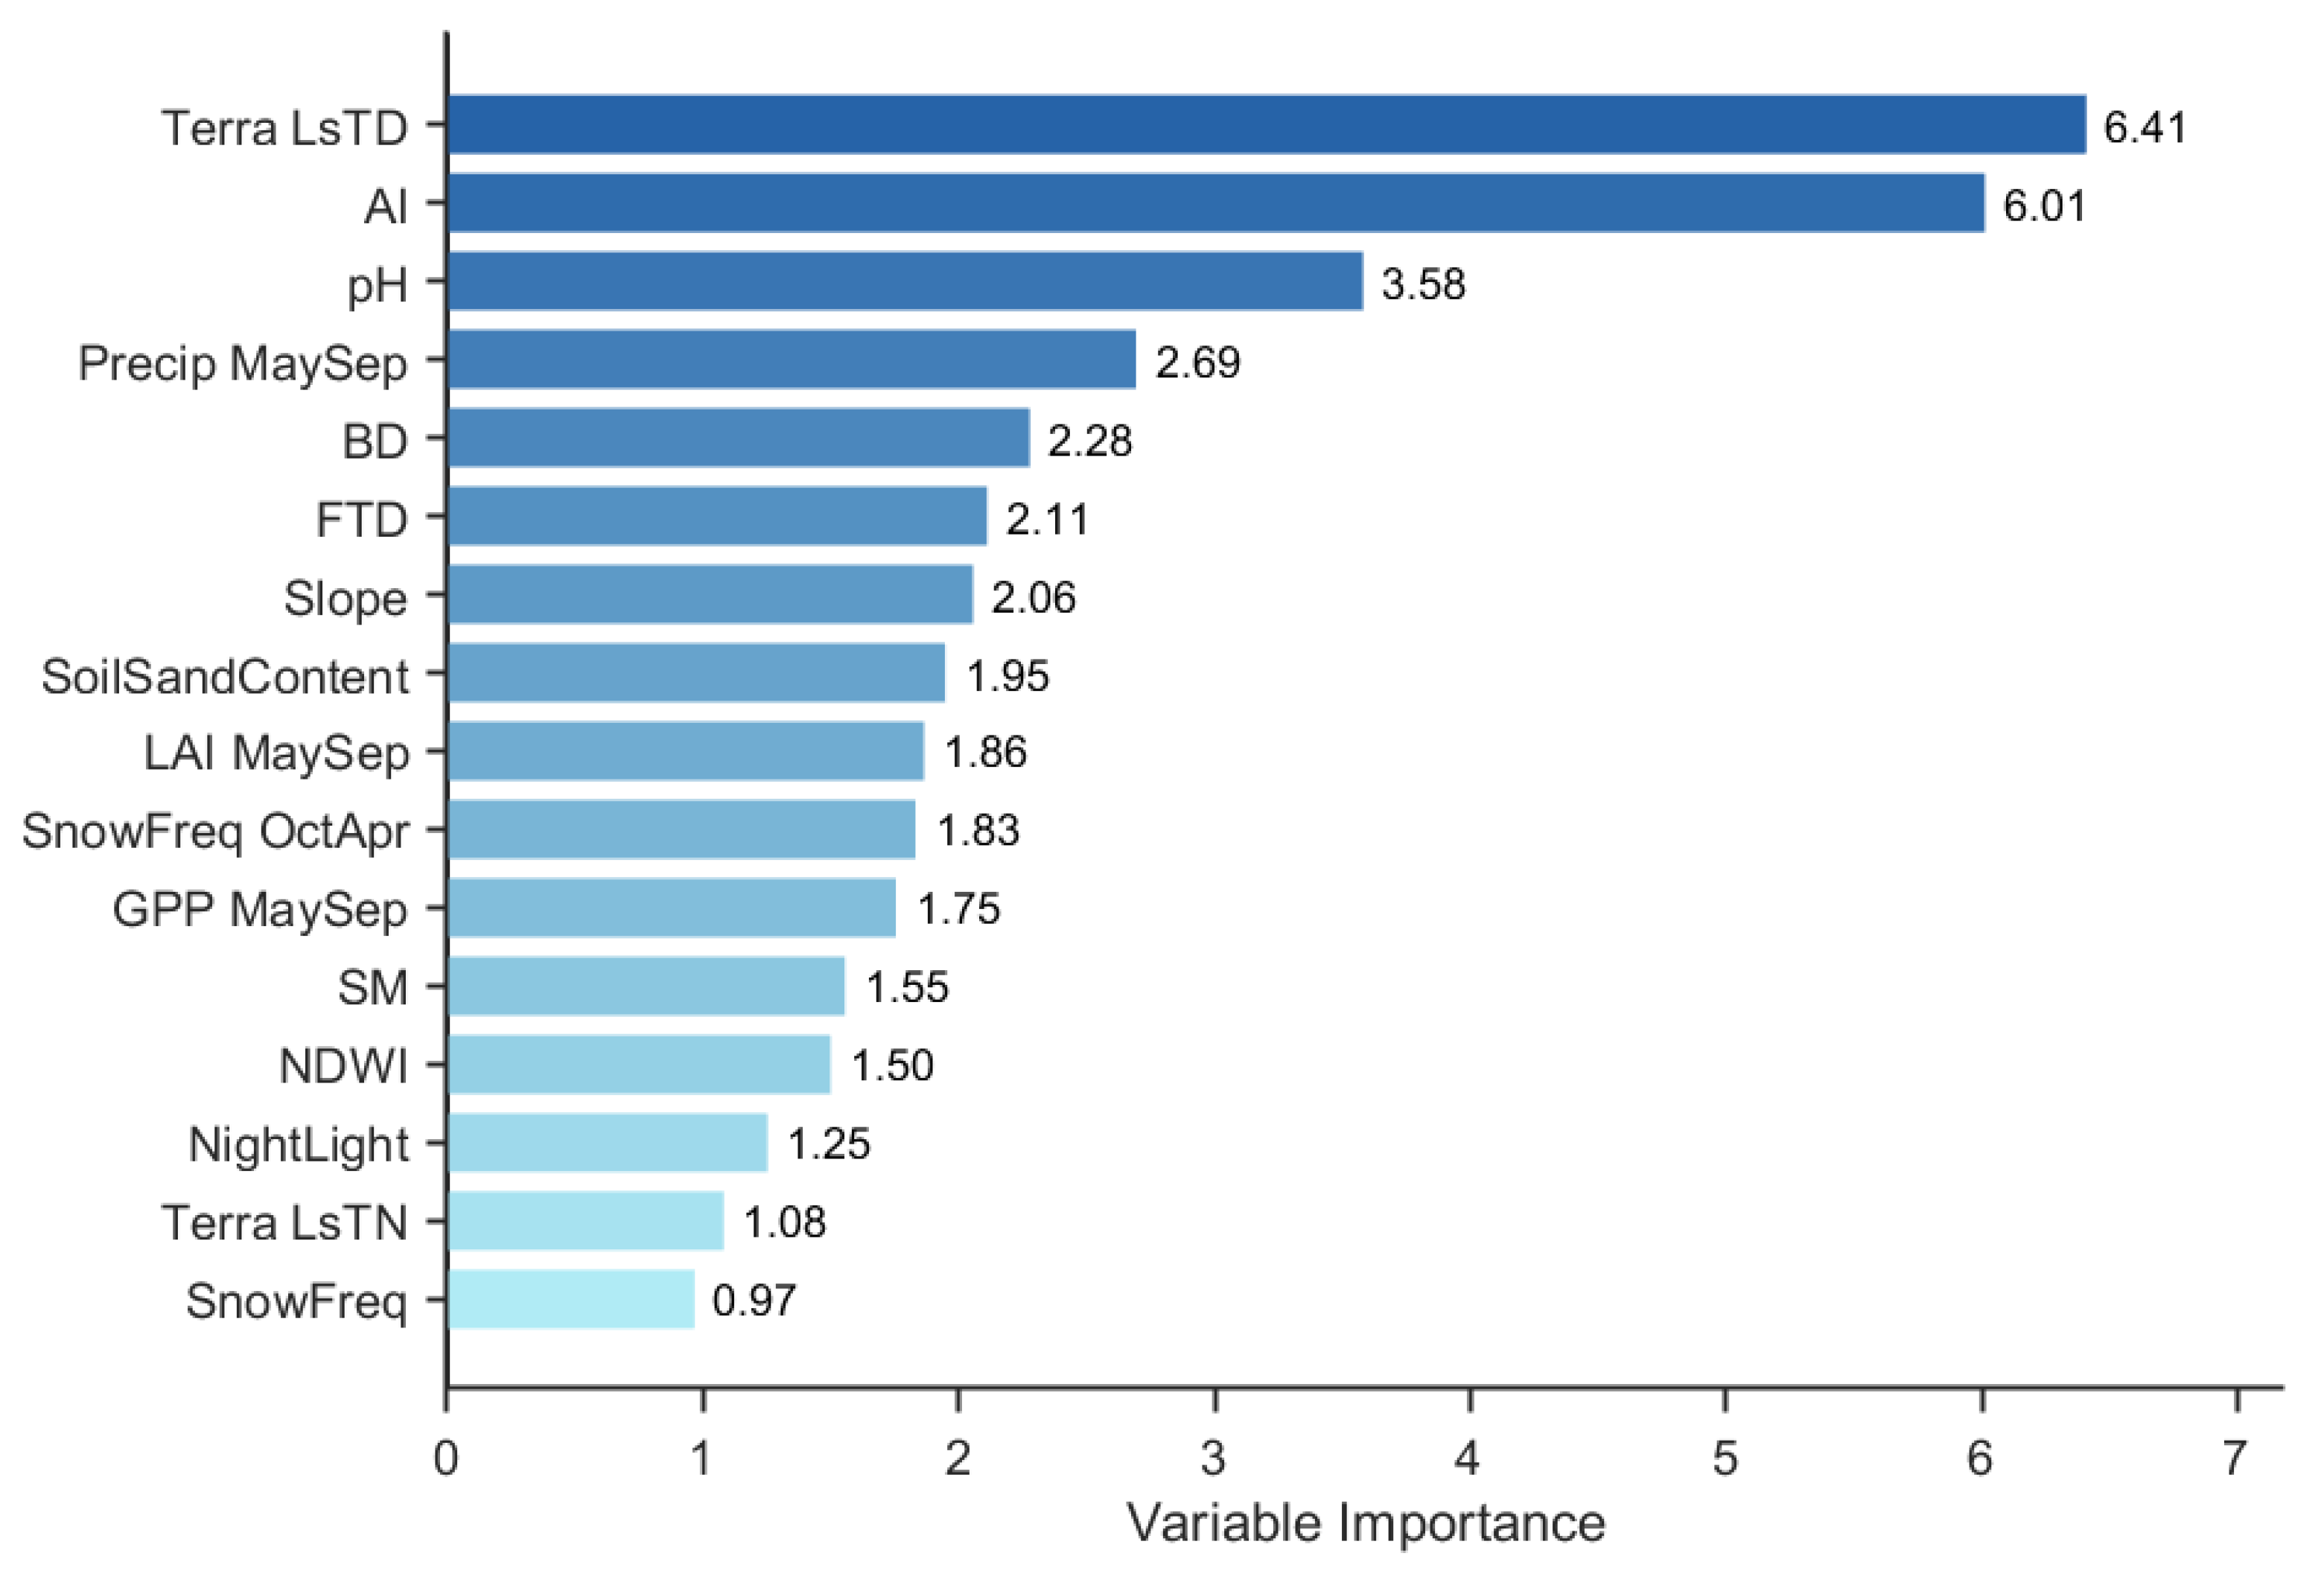
Figure 5.
Spatial Distribution of SOC in the YRSR.
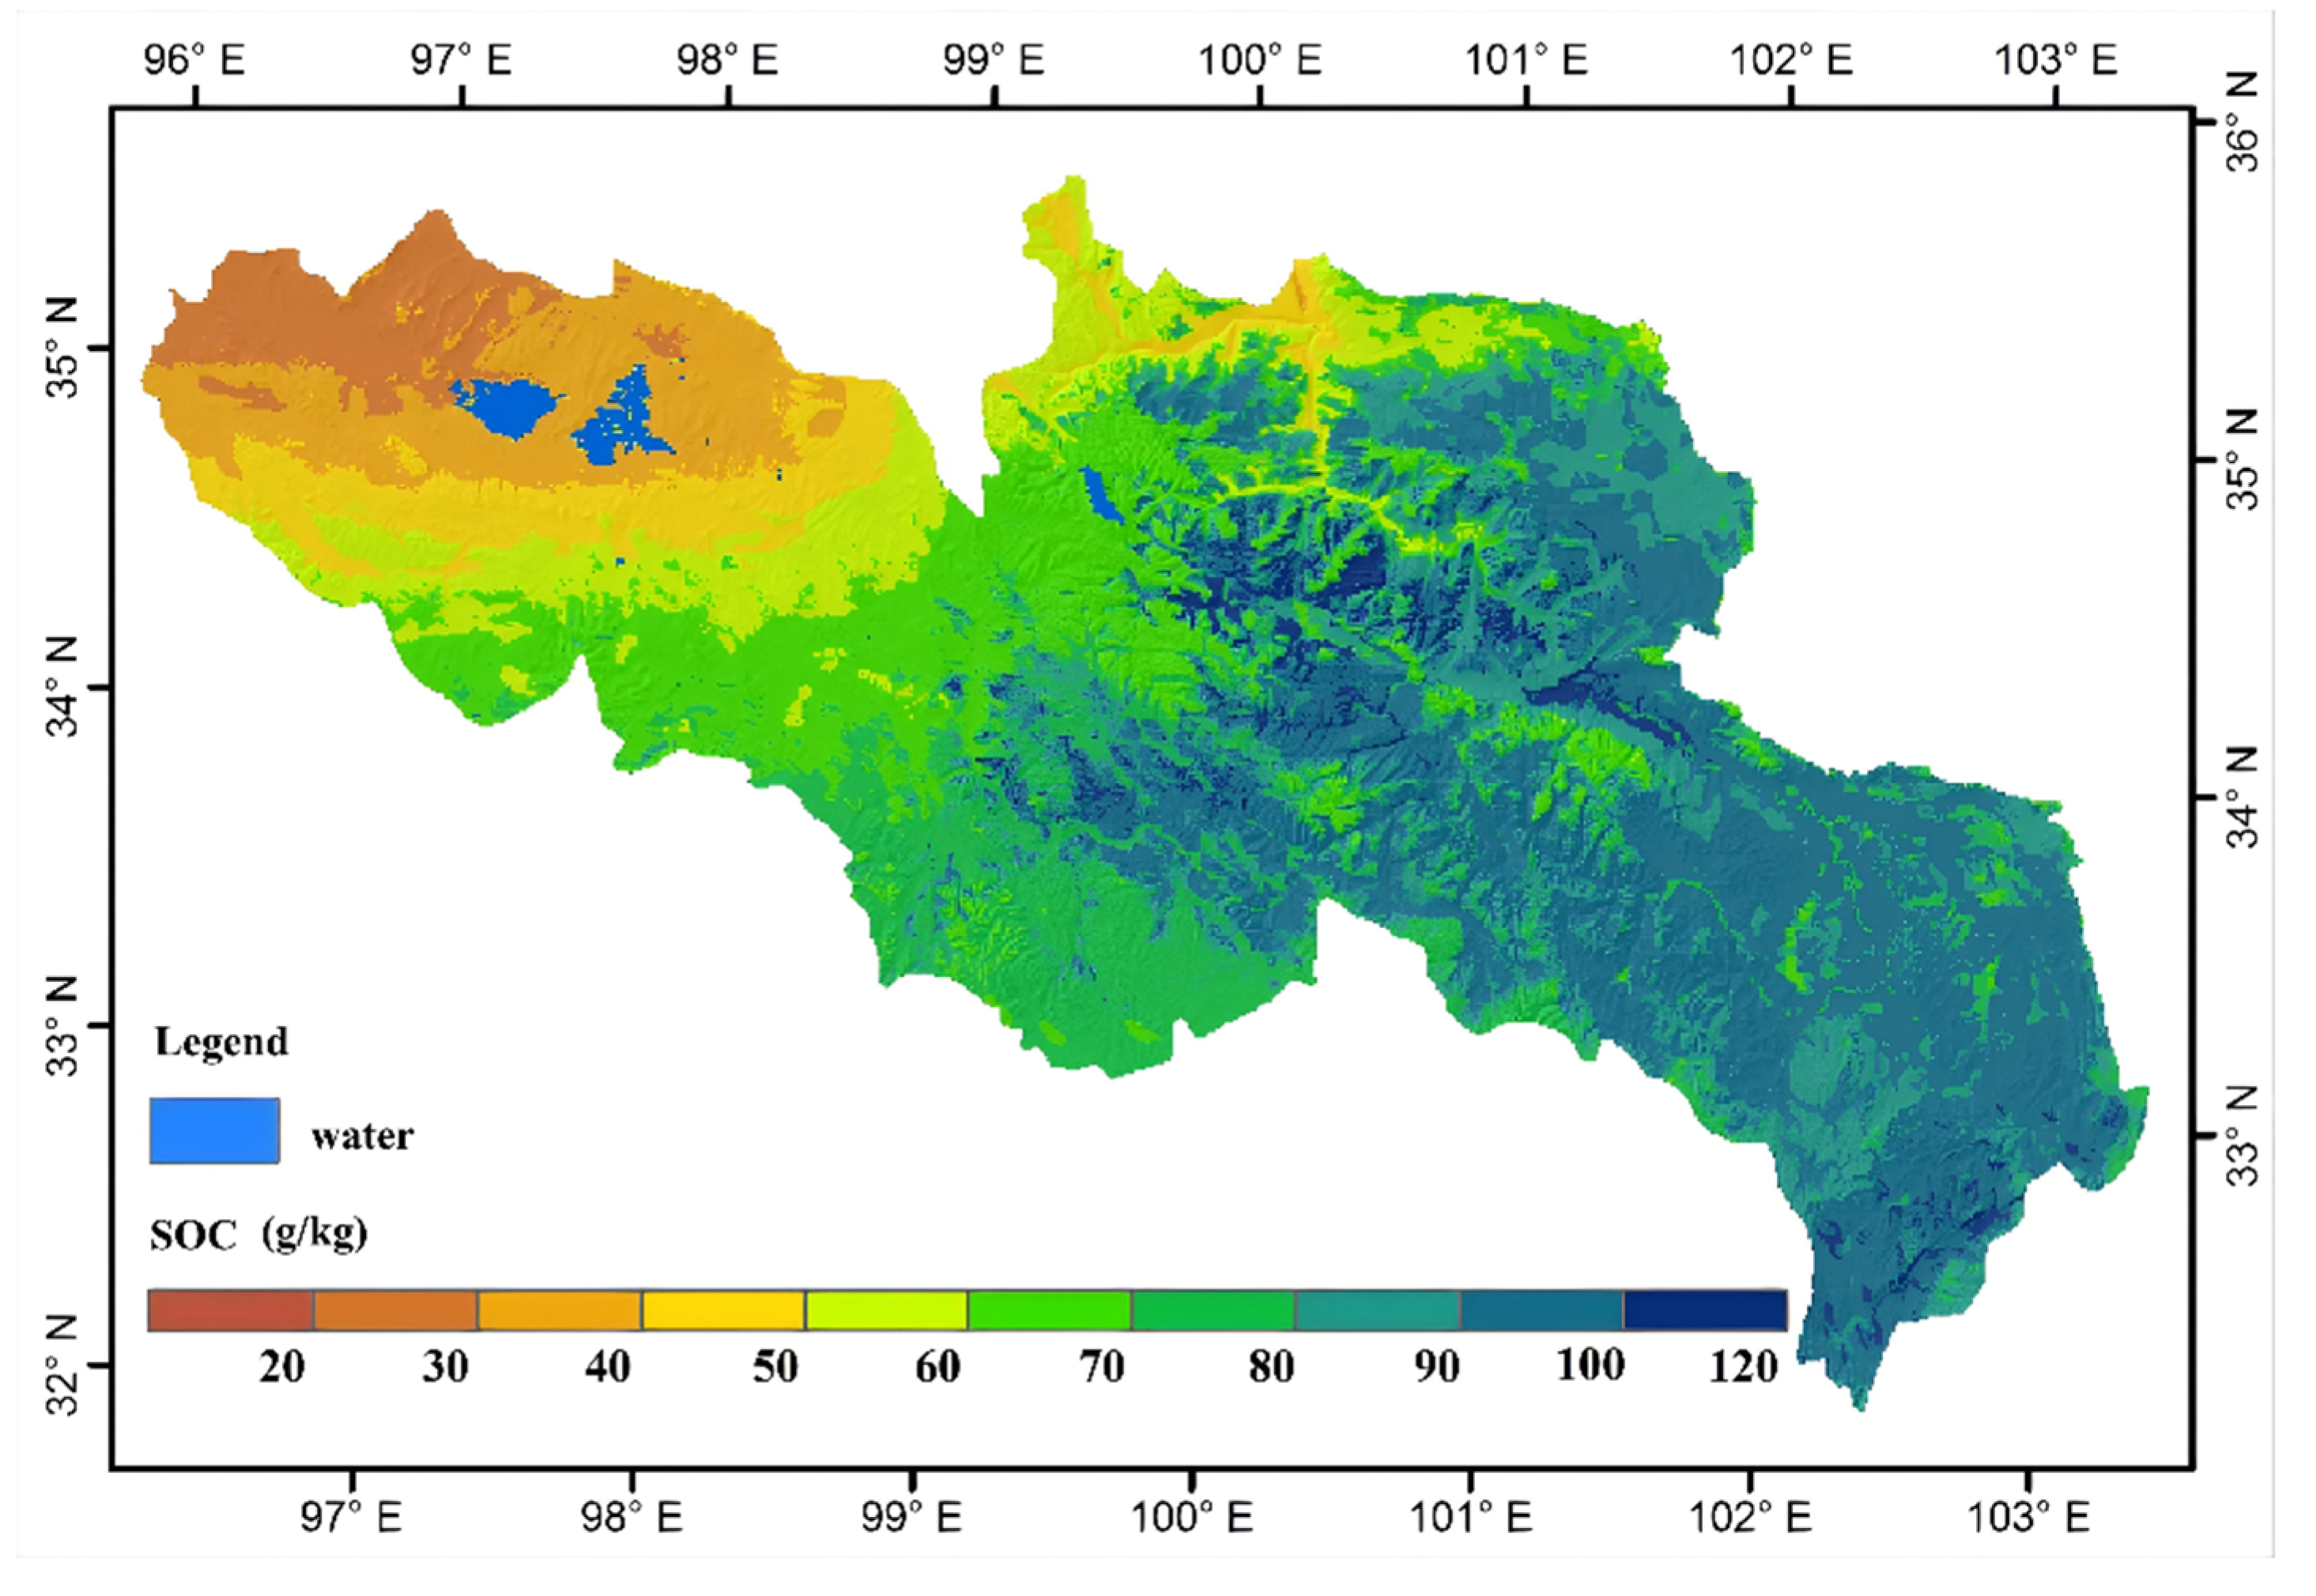

Table 1.
Assembled environmental variables representing STEP-AWBH factors (S: soil, T: topography p, E: ecology, P: precipitation, A: Atmosphere, W: Water, B: Biota, H: Human.).
Table 1.
Assembled environmental variables representing STEP-AWBH factors (S: soil, T: topography p, E: ecology, P: precipitation, A: Atmosphere, W: Water, B: Biota, H: Human.).
| Variable | Relevant variable abbreviation | Factor | Sourcea | resolution | Units | Date |
| Soil pH | pH | S | OpenLandMap | 250 m | – | Static |
| Soil clay content | Soil clay content | S | SoilGrids v2.0 | 250 m | % | Static |
| Soil sand content | Soil sand content | S | SoilGrids v2.0 | 250 m | % | Static |
| Soil bulk density | BD | S | OpenLandMap | 250 m | g/cm³ | Static |
| Elevation | Elevation | T | SRTM DEM | 30m | m | Static |
| Slope | Slope | T | SRTM DEM | 30m | ° | Static |
| Aspect | Aspect | T | SRTM DEM | 30m | ° | Static |
| Height above nearest drainage | HAND | T | SRTM DEM | 30m | m | Static |
| Upslope contributing area | UpslopeArea | T | MERIT Hydro | 90m | m² | Static |
| Topographic Wetness Index | TWI | T | SRTM + MERIT Hydro | 30m | – | Static |
| Surface shortwave radiation | SR | E | ERA5-Land | ~9 km | J m⁻² | 2023 |
| Terra daytime LST | Terra_LsTD | E | MODIS Terra MOD11A1.061 | 1 km | °C | GS |
| Terra nighttime LST | Terra_LsTN | E | MODIS Terra MOD11A1.061 | 1 km | °C | GS |
| Terra diurnal LST amplitude (annual) | Terra_LST_amp | E | MODIS Terra MOD11A1.061 | 1 km | °C | GS |
| Freeze–thaw cycle days | FTD | E | MODIS Terra MOD11A1.061 | 1 km | days | 2023 |
| Soil thaw proxy (MaySep) | LST_amp_MaySep | E | MODIS Terra MOD11A1.061 | 1 km | °C | 2023 |
| Normalized Difference Snow Index | NDSI_snowMean | E\W | Sentinel-2 Level-2A | 20m | – | CS |
| Cold-season snow frequency | SnowFreq_OctApr | E\W | Sentinel-2 Level-2A | 20m | % | CS |
| Annual snow frequency | SnowFreq_year | E\W | Sentinel-2 Level-2A | 20m | % | 2023 |
| Annual precipitation | Precip_year | P | ERA5-Land (ECMWF) | ~9 km | mm | 2023 |
| May–Sep precipitation | Precip_MaySep | P | ERA5-Land (ECMWF) | ~9 km | mm | GS |
| Annual mean temperature | Temp_year | A | ERA5-Land (ECMWF) | ~9 km | °C | 2023 |
| May–Sep temperature | Temp_MaySep | A | ERA5-Land (ECMWF) | ~9 km | °C | GS |
| Aridity Index (P/PET) | AI | A | ERA5-Land (ECMWF) | 10km | – | 2023 |
| Soil moisture | SM | W | SMAP L3 | ~9 km | m³ m⁻³ | GS |
| Normalized Difference Water Index | NDWI | W | Sentinel-2 MSI L2A | 20m | – | 2023 |
| Leaf Area Index | LAI | B | Sentinel-2 Level-2A biophysical product | 10 m | – m²/m² | GS |
| Normalized Difference Vegetation Index | NDVI | B | Sentinel-2 Level-2A Surface | 10m | – | GS |
| Enhanced Vegetation Index | EVI | B | Sentinel-2 Level-2A Surface | 10m | – | GS |
| Soil Adjusted Vegetation Index | SAVI | B | Sentinel-2 Level-2A Surface | 10m | – | GS |
| Modified Adjusted Vegetation Index | MSAVI | B | Sentinel-2 Level-2A Surface | 10m | – | GS |
| Gross Primary Productivity (May–Sep) |
GPP_MaySep | B | MODIS/061/MOD17A3HGF | 500 m | g C m⁻² yr⁻¹ | GS |
| Net Primary Productivity (annual) | NPP | B | MODIS/061/MOD17A3HGF | 500 m | g C m⁻² yr⁻¹ | 2023 |
| Gross Primary Productivity (annual) | GPP | B | MODIS/061/MOD17A3HGF | 500 m | g C m⁻² yr⁻¹ | 2023 |
| Land cover class (ESA WorldCover) | LC_WorldCover | H | ESA WorldCover | 10 m | Class | 2020 |
| Land cover class (MODIS IGBP) | LC_IGBP | H | MODIS MCD12Q1 | 500 m | Class | 2023 |
| Nighttime light intensity | NightLight | H | NOAA VIIRS | 500 m | nW cm⁻² sr⁻¹ | 2023 |
1 Note: GS represents the growing season (2023-May–September), and CS represents the cold season (2022-October–2023-April).
Table 2.
Descriptive statistics of soil organic carbon at 0–20 cm in YRSR.
| Variable | Unit | N | Min | Mean | Median | Max | MAD | SD | CV% | Skewness | Kurtosis |
|---|---|---|---|---|---|---|---|---|---|---|---|
| SOC | g kg-1 | 240 | 2.96 | 46.61 | 40.75 | 169.32 | 17.94 | 30.29 | 64.97 | 1.22 | 4.85 |
Table 3.
Variance inflation factors (VIF) of predictors retained after collinearity screening.
| Variable | VIF |
|---|---|
| LAI_MaySep | 4.98 |
| GPP_MaySep | 4.95 |
| NDWI | 4.37 |
| Terra_LsTN | 3.96 |
| Soil sand content | 3.74 |
| Terra_LsTD | 3.67 |
| SnowFreq_OctApr | 3.66 |
| SnowFreq_ year | 3.53 |
| AI | 3.40 |
| Precip_MaySep | 3.10 |
| FTD | 2.37 |
| pH | 2.23 |
| BD | 1.55 |
| Slope | 1.40 |
| SM | 1.24 |
| Night Light | 1.13 |
Disclaimer/Publisher’s Note: The statements, opinions and data contained in all publications are solely those of the individual author(s) and contributor(s) and not of MDPI and/or the editor(s). MDPI and/or the editor(s) disclaim responsibility for any injury to people or property resulting from any ideas, methods, instructions or products referred to in the content. |
© 2026 by the authors. Licensee MDPI, Basel, Switzerland. This article is an open access article distributed under the terms and conditions of the Creative Commons Attribution (CC BY) license (http://creativecommons.org/licenses/by/4.0/).
Copyright: This open access article is published under a Creative Commons CC BY 4.0 license, which permit the free download, distribution, and reuse, provided that the author and preprint are cited in any reuse.


