Submitted:
20 February 2026
Posted:
27 February 2026
You are already at the latest version
Abstract
This study employed a gamification-based integrated physical and cognitive program for older adults to examine the applicability of kinematic assessment using a markerless motion capture system (OpenCap). The program was designed as a step-based dual-task intervention with progressively adjusted difficulty to simultaneously stimulate physical and cognitive functions. Nineteen older adults participated in the study, which evaluated their lower limb strength (Five Times Sit-to-Stand Test), dynamic balance (Four Square Step Test), curved walking ability (Figure-of-8 Walk Test, F8WT), cognitive function, and program satisfaction. Significant reductions in completion time were observed across all physical performance tests, indicating improvements in lower limb strength, dynamic balance, and curved walking ability. Cognitive function also showed significant im-provements. Kinematic analysis using OpenCap found a significant increase in knee joint angular velocity at the midpoint of the movement, but not in joint range of motion. In addition, high attendance and satisfaction levels were reported. These findings suggest that gamification-based offline interventions may be effective in enhancing both physical and cognitive functions in older adults and that markerless motion capture technologies like OpenCap can facilitate process-oriented movement analysis in digital healthcare environments.
Keywords:
older adults
; dual-task
; integrated physical and cognitive program
; OpenCap
; fall risk
1. Introduction
South Korea has become a superaged society, one in which the proportion of adults aged 65 years and older exceeds 20% [1]. As falls and fall-related accidents account for approximately 65.1% of injuries among older adults, they constitute a major public health concern [2]. At the same time, as the prevalence of dementia has steadily increased, the need has grown for cognitive health management to extend its focus from older adults to middle-aged populations [3]. With aging, physical and cognitive functions often decline simultaneously. Reductions in lower limb muscle strength and balance ability are known to increase the risk of falls [4], while cognitive decline negatively impacts the overall performance of activities of daily living and shows close associations with the development of dementia. Numerous studies have demonstrated that physical activity has positive effects on the maintenance and improvement of cognitive function [5], and that gait and balance abilities are strongly associated with cognitive performance [6]. These findings highlight the interdependence of physical and cognitive functions in older adults. However, many exercise programs for older adults currently predominantly consist of single-task, repetitive activities that fail to adequately reflect the combined physical and cognitive demands of daily life [7]. In addition, motivation-enhancing elements and interest-based design strategies to promote sustained participation are often inadequate [8,9]. Moreover, there is limited empirical evidence regarding the effects of physical activity on cognitive and psychological functions in older adults [10]. Accordingly, the present study examined changes in physical and cognitive functions in older adults through the application of a gamification-based dual-task program, and employed OpenCap, a markerless motion capture system, to conduct comparative analyses with conventional physical assessment tools. This integration of quantitative kinematic analysis with qualitative evaluation will facilitate research on the practical applications of markerless motion capture technology in offline intervention programs for older adults.
2. Literature Review
2.1. Age-Related Declines in Physical and Cognitive Functions
Advancing age is accompanied by muscle fiber atrophy and decreased neuromuscular activation, leading to sarcopenia and reduced proprioceptive function, as well as declines in balance control and lower limb function, all of which increase the risk of falls in older adults [11,12]. According to injury statistics among older adults in South Korea, falls are the most prevalent cause of major injuries [2]. The empirical verification of interventions aimed at improving lower limb muscular function is thus essential [13]. Substantial research has demonstrated that regular physical activity improves lower limb strength, balance ability, and gait performance, key factors in fall prevention in older adults [14].
Cognitive function also exhibits a gradual decline with aging in multiple domains, such as memory, executive function, and attention, which constitutes a major risk factor for such age-related neurodegenerative conditions as dementia, whose prevalence rates continue to increase [15]. Dementia is closely associated with reduced quality of life and imposes substantial burdens on not only older individuals but their families and society as a whole [16].
Moreover, physical and cognitive functions do not deteriorate independently during aging but are interrelated [17], in line with which , individuals at high risk of dementia who participated in physical activity–based intervention programs exhibited significant improvements in cognitive function and quality of life [18,19]. The interdependence between physical and cognitive domains that these findings indicate suggest that physical stimulation may ameliorate declines in brain activation and spur neurophysiological recovery. Therefore, integrated intervention strategies that simultaneously enhance physical function and provide cognitive stimulation are a necessary part of measures to promote healthy aging.
2.2. Dual-Task Programs and the Stroop Stepping Game
Dual-task paradigms are complex task structures designed to require the simultaneous performance of two tasks. Dual-task performance demands higher levels of attentional switching, inhibitory control, and executive function than single-task conditions, thereby providing effective stimulation for both physical and cognitive domains. Previous studies have reported a greater effectiveness of dual-task interventions than single-task–based approaches [7]. Moreover, intervention outcomes vary with the presentation order and integration strategy of physical and cognitive tasks [20]. Further, sequential dual-task training in individuals with stroke resulted in limited improvements in cognitive function, but yielded significant enhancements of dynamic balance performance [6].
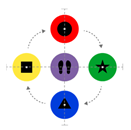
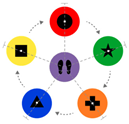
One representative dual-task–based intervention is the Stroop Stepping Game (SSG), which integrates a Stroop task with stepping movements in a game-based program requiring simultaneous cognitive processing and physical responses [20]. Although the traditional well-known Stroop task requires participants to inhibit word meaning while identifying color information, the present approach employed shapes and colors as visual stimuli rather than words in light of the visual processing characteristics of the target population. This design enhances the effectiveness of cognitive training by allowing cognitive load to be manipulated through the use of congruent and incongruent conditions [21].
The present study adapted a color step–based integrated physical and cognitive program to the current research context [20] by expanding and refining the experimental tools, game difficulty design strategies, assessment instruments, and analytical perspectives. The game structure employed in this study is presented in Figure 1.
2.3. Gamification
Gamification is a strategic design approach that applies game elements—such as goals, feedback, rewards, and challenge structures—to nongame contexts to enhance user motivation and engagement [22,23]. This approach promotes both intrinsic and extrinsic motivation [24]. In particular, extrinsic for a high degree of autonomy is associated with positive affective responses and improved performance outcomes [24]. Previous studies of older adults have identified competition, rewards, and feedback as effective gamification elements that play a critical role in sustaining participation in physical activity programs [25]. Nevertheless, a lack of motivational design elements sufficient to effectively support long-term user engagement has been reported in the healthcare domain [26].
Several studies have reported that gamification-based exercise programs have benefits for physical function in older adults, including improvements in gait speed and stride length, as well as increasing individuals’ willingness to participate in physical activity [27]. However, as many of these studies conducted only short-term interventions or lacked appropriate control groups, they were generally unable to adequately verify long-term behavioral changes or cognitive improvement effects [28].
Furthermore, gamification design for older adults requires a systematic and structured approach that extends beyond simple entertainment features. In South Korea, the need for theoretical frameworks and empirical validations of effectiveness has been increasingly emphasized in recent years with expansions in the practical applications of gamification [29]. In light of the rapid progression of population aging and the growing prevalence of cognitive decline, the motivational role of gamification in programs designed to enhance physical and cognitive functions in older adults has gained increasing importance.
The present study applies gamification strategies in an integrated physical and cognitive program for older adults and evaluates their empirical effects. In particular, we measured the effectiveness of the proposed program through gait-related physical performance measures and changes in cognitive function, providing foundational evidence for the design of effective gamification-based interventions to promote healthy aging.
2.4. A Machine-Learning–Based Markerless Motion Capture System: OpenCap
Conventional marker-based three-dimensional motion capture systems have been widely used as standard tools to acquire precise movement data in clinical and biomechanical research. However, these systems have several substantial limitations, including complex marker placement procedures, expensive recording equipment, and strict environmental constraints. In particular, the physical markers may restrict participants’ natural movements, and optical marker-based infrared camera systems have significant cost and space requirements that limit their practical applicability [30].
Accordingly, markerless motion capture technologies have emerged that employ camera-based video data and machine-learning–based algorithms to estimate three-dimensional human movement. This approach allows naturalistic movement data to be collected without marker attachment, affording researchers greater flexibility in experimental and applied settings [31].
OpenCap, developed by Stanford University, is a markerless motion capture system that performs three-dimensional kinematic and kinetic analyses using only two or more iOS smartphone cameras. OpenCap provides advantages over conventional motion capture systems like reduced cost, simplified setup, and rapid data processing [32]. Previous validation studies comparing OpenCap with traditional marker-based systems have reported high levels of agreement in key gait parameters, including walking speed and stride length, thereby demonstrating the reliability of markerless measurements in gait analysis [33]. However, as these validity studies have primarily focused on fundamental movements like walking and running, evidence regarding the applicability of OpenCap to dynamic balance assessments like the Timed Up and Go test or to analyses of complex movement patterns remains limited [32].
3. Materials and Methods
3.1. Expert Interviews and Design Rationale
We conducted interviews with four domain experts to identify key elements of a dual-task program for older adults that need modification and refinement. Interviews on program composition were conducted with one specialist in rehabilitation medicine and one expert in sports rehabilitation and biomechanics, while interviews on the application of OpenCap involved one biomedical engineering researcher and one researcher from a laboratory specializing in aging and exercise science.
All the experts consistently emphasized the importance of task designs that consider dynamic balance in addition to lower-extremity function, the inclusion of cognitive assessments that capture cognitive processing speed, the application of progressive difficulty adjustments, and measures to ensure participant safety throughout the program. Based on these expert recommendations, the present study extended the scope of physical function assessment in Chung (2025) [34] to include dynamic balance and curved walking performance and further enhanced the cognitive evaluation framework by incorporating a Stroop Test.
Regarding the use of OpenCap, the experts highlighted the necessity of maintaining consistent measurement environments and carefully selecting appropriate tasks. In particular, tasks involving minimal leg overlap and clearly defined repetitive structures were considered the most suitable for markerless motion analysis. Accordingly, the Five Times Sit-to-Stand Test (FTSST) was selected as the primary task for OpenCap-based kinematic analysis in the present study. The key findings from the expert interviews are summarized in Table 1 and Table 2.
3.2. Research Model and Hypotheses
This study aimed to develop and implement a gamification-based integrated physical and cognitive dual-task program for older adults and comprehensively examine pre- and post-intervention changes in physical and cognitive functions. To this end, the effectiveness of the program was evaluated using a multidimensional assessment. In addition, movement performance data were collected from older adults with OpenCap, and compared with conventional functional assessment measures to determine the interpretability and practical applicability of OpenCap-derived kinematic indicators. Furthermore, this study explores the applicability and scalability of gamification-based intervention programs for older adults and provides foundational evidence for the design of digital-technology–supported exercise assessment and intervention strategies in aging populations. The model of this study is presented in Figure 2.
This study posited the following hypotheses:
H1. As the distance between step pads increases in the integrated physical–cognitive dual-task program, lower-extremity muscle strength in older adults will improve significantly.
H2. As the distance between step pads increases in the integrated physical–cognitive dual-task program, dynamic balance ability in older adults will improve significantly.
H3. As the distance between step pads increases in the integrated physical–cognitive dual-task program, curved walking ability in older adults will improve significantly.
H4. Increases in game difficulty within the integrated physical–cognitive dual-task program will result in significant improvements in cognitive function in older adults.
H5. Markerless gait analysis based on OpenCap will provide meaningful kinematic information for assessing changes in physical function in older adults.
H6. Gamification elements will have a positive effect on program participation among older adults.
3.3. Participants
This study included 24 older adults aged 65 years or older who attended the J Silver Welfare Center in Seongbuk-gu, Seoul, in 2025. The intervention program was conducted over 11 weeks, and participants were recruited on a voluntary basis and of their own free will.
The inclusion criteria for study participants were as follows:
- The ability to communicate independently without assistance from others
- Normal vision, excluding individuals who required corrective lenses
- No color vision deficiency
- No diagnosis of dementia
- No hearing impairment, with the use of hearing aids permitted.
3.4. Physical Performance Assessment Tools
3.4.1. Five Times Sit-to-Stand Test
The FTSST is a widely used functional assessment of lower limb strength and dynamic balance. Participants sit on a chair without armrests and maintain an upright posture without leaning against the backrest, with their arms crossed over the shoulders. Upon the examiner’s signal to begin, participants perform five consecutive sit-to-stand movements as quickly as possible. The time is recorded from the initial movement until the final seated position is achieved. One practice trial is provided before the formal assessment. Shorter completion times indicate superior lower limb strength and balance performance.
3.4.2. Four Square Step Test
The Four Square Step Test (FSST) is a functional assessment incorporating elements such as directional changes, obstacle avoidance, and agility that comprehensively evaluates balance and functional mobility. In this test, four canes are arranged on the floor in a cross formation to create four quadrants. Participants begin in quadrant 1 and step sequentially to quadrants 2, 3, 4, and back to quadrant 1 in a clockwise direction, after which the same sequence is repeated in a counterclockwise direction. If a participant touched a cane or performed the sequence incorrectly, the trial was repeated. One practice trial was provided, followed by three recorded trials. Shorter completion times indicate superior functional mobility and dynamic balance control.
3.4.3. Figure-of-8 Walk Test (F8WT)
The Figure-of-8 Walk Test (F8WT) is a curved walking assessment tool used to evaluate fall risk in older adults and verify rehabilitation outcomes in individuals with neurological and musculoskeletal conditions. Two cones are placed approximately 1.5 m apart, and participants start from the midpoint between the cones, around the front cone in a counterclockwise direction, and then around the rear cone in a clockwise direction, forming a figure-of-eight walking pattern. The time required to return to the starting position was recorded. This test differs from linear gait assessments in that it reflects direction-changing walking demands encountered in daily life. One practice trial was provided, followed by three recorded trials. Shorter completion times indicate superior curved walking ability.
3.4.4. OpenCap
OpenCap is an open-source, machine-learning–based markerless motion capture system developed by a research team at Stanford University used to estimate three-dimensional joint kinematics and kinetics from videos recorded using two or more iOS device cameras. In the present study, OpenCap was employed to collect movement data during task performance in older adults.
Among the assessment tasks, the FTSST was selected for the final kinematic analysis because it requires little lower-limb crossing movement, which ensures higher tracking stability. Knee joint range of motion and velocity-related metrics (vel\_RoM and vel\_time) were extracted from the FTSST video recordings and the angular velocity and velocity parameters at the 25%, 50%, and 75% time points of the movement cycle were analyzed and used to compare changes in knee joint kinematic characteristics during FTSST performance before and after participation in the intervention program.
3.5. Cognitive Performance Assessment Tools
3.5.1. Cognitive Impairment Screening Test
The Cognitive Impairment Screening Test (CIST) is a standardized cognitive assessment tool developed by the Ministry of Health and Welfare of Korea officially used in the national dementia management program. The test is administered one-on-one between the examiner and the participant using a paper-based questionnaire. It assesses six cognitive domains: orientation, attention, visuospatial ability, executive function, memory, and language, with a total score of 30 points, where higher scores indicate better cognitive function. Because normative ranges differ by age and years of education, the interpretation of identical total scores may depend on the participant’s demographic background.
3.5.2. Stroop Test
The Stroop Test is a cognitive assessment tool used to comprehensively evaluate cognitive flexibility, processing speed, and executive function in older adults. The test consists of three conditions administered using separate test sheets, each containing 100 word or color stimuli.
- The word-reading condition requires participants to read color names printed in black ink.
- The color-naming condition requires participants to name the color of stimuli presented without any word content.
- The incongruent word–color condition presents color words printed in incongruent ink colors, and participants are instructed to ignore the word meaning and respond only to the ink color.
3.6. Program Satisfaction Evaluation
A participant satisfaction survey was administered after the completion of the program consisting of a questionnaire with total of 18 items: 16 closed-ended and 2 open-ended questions. Participants completed the survey using a self-administered format, and the closed-ended items were scored on a 5-point Likert scale. Only the responses to the closed-ended questions were used in a quantitative analysis of overall levels of program satisfaction.
3.7. Assessment Schedule and Measurement Timeline
This study aimed to examine not only the changes observed before and after program participation but also the changes in physical and cognitive functions occurring throughout the process of progressively increasing task difficulty. To this end, the FTSST, FSST, F8WT, and Stroop Test were administered three times: pre-intervention, mid-intervention, and post-intervention.
OpenCap-based kinematic analysis was conducted across three measurement sessions; however, to ensure data validity, only the pre- and post-intervention datasets were included in the final analysis. Cognitive function assessments primarily focused on pre–post comparisons. All assessments were conducted face-to-face at the same welfare center. The overall assessment timeline is presented in Table 5.
3.8. Program Structure and Overview
The program was conducted twice per week for a total of 20 sessions. Each session was administered face-to-face by one researcher and one social worker. Sessions were held in the auditorium of the welfare center and lasted approximately 50–55 minutes. An overview of the program is presented in Table 6 and Table 7.
The program was organized into three sequential phases—preparation, individual competition, and group competition—with scheduled rest periods. During the preparation phase, participants’ physical condition on the day of the session was checked and light warm-up exercises were performed to prevent safety incidents, thereby ensuring adequate physical readiness and environmental preparation for program participation.
In the individual competition phase, the start of the game was signaled by rhythmic music, followed by approximately 25 minutes of the individual game “Match It! Color Step.” Six stepping pads (diameter: 24 cm) made of SEBS material were used. Participants remained at their individual positions and completed tasks by recognizing the shape and color of stimuli presented on a screen and selecting the corresponding stepping pad. The researcher observed the participants’ performance and provided immediate feedback throughout the phase. Upon completion of the individual competition, performance results were shared to reinforce participants’ sense of achievement. This phase was followed by an approximately 5-minute rest period, during which the next game was announced.
The group competition phase lasted approximately 15 minutes. In each session, participants were randomly divided into two teams. Each team performed tasks sequentially as displayed on a front-facing screen in a relay format, passing a Styrofoam ring to the next team member upon task completion. The rules were explained before the group competition and mutual encouragement among team members was promoted to enhance cooperation and motivation. The team that completed all the tasks first was designated the winning team, and points were awarded on the individual scoreboards accordingly. After the group competition, information on the next session was announced, followed by closing remarks.
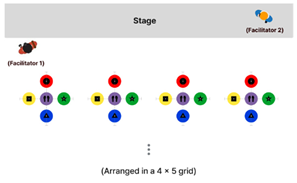
An overview of the overall program structure and the operational layouts of the individual and group competition phases are presented in Table 8 and Table 9 and Figure 3.
Game difficulty was progressively adjusted based on both physical and cognitive components. Physical difficulty was determined by increasing the distance between the stepping pads according to the participants’ average step length. The initial interpad distance was set at 45 cm and was increased by 5 cm at four-session intervals, gradually increasing the physical load across sessions.
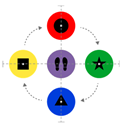
Cognitive difficulty was manipulated by applying congruent and incongruent conditions of the Stroop task. From the ninth session onward, an orange (+) stepping pad was introduced, expanding the number of pads and simultaneously increasing cognitive and physical task demands. To minimize task adaptation and learning effects, the arrangement of the stepping pads was rotated clockwise across sessions. This difficulty-adjustment strategy was applied consistently to both the individual and group competition phases. The difficulty structure across game sessions is summarized in Table 10.
3.9. Gamification Strategies Within the Program
The program was designed using gamification strategies to promote participation and enhance engagement among older adults. Focusing on the core elements of competition, achievement, reward, and social interaction, the program transcended simple task execution by strengthening sustained participation and experiences of accomplishment. Through this approach, the effectiveness of a physical and cognitive dual-task program tailored to the characteristics of older adults was enhanced.
3.9.1. Competition
Competition was implemented by assigning individual points based on team game outcomes, which were cumulatively displayed on a personal leaderboard that remained continuously visible without the need to reorder participant rankings in order to avoid excessive competitive pressure while encouraging participants to recognize their accumulated participation and remain motivated to engage consistently in the program.
3.9.2. Achievement
Achievement was employed in the pre-, mid-, and post-program phases. Attendance-based scoring was used to encourage sustained participation, and changes in difficulty levels and task stages were visually presented during the program to reinforce participants’ awareness of goal attainment. After program completion, the number of stepping pads completed was shared, allowing participants to intuitively recognize their individual exercise volume and performance.
3.9.3. Rewards
Rewards were designed to support participants’ recognition of their achievement throughout the program. Following the physical and cognitive assessments at the pre-, mid-, and post-intervention time points, individual results were provided to enable participants to perceive their own changes over time objectively. In addition, upon completion of the program, a small reward was provided along with a certificate of completion to enhance positive perceptions of the participation experience and reinforce a sense of accomplishment.
3.9.4. Social Interaction
Social interaction was included to promote social engagement among participants and encourage immersion and sustained participation. Random team assignments were used in each session to create a cooperative task environment, and emotional exchange was facilitated through mutual encouragement and feedback provided before and after task performance. This design supported the development of group cohesion beyond individual-centered task execution, thereby contributing to continued participation in the program.
An overview of the gamification strategies applied in the program is presented in Table 11.
4. Results
All statistical analyses were conducted using IBM SPSS Statistics (version 29.0.2). For the main variables collected at the pre-, mid-, and post-intervention time points, descriptive statistics, including means and standard deviations, were first calculated to display overall trends. To test for statistically significant changes over time, repeated-measures analysis using estimated marginal means (EMM) was performed. Changes in performance associated with increasing stepping-pad distance were visually examined using EMM plots.
4.1. Physical Function Outcomes
4.1.1. Inbody, FTSST, FSST, and F8WT
For the analysis of physical performance, stepping-pad distance was treated as the independent variable, and changes in lower limb strength (FTSST), dynamic balance (FSST), and curved walking ability (F8WT) were examined. Descriptive statistics across the three time points indicated a general pattern in all measures of decreased completion times with increased stepping-pad distance.
Repeated-measures analysis revealed statistically significant differences across time points for all physical function measures, including FTSST (p < 0.001), FSST (p < 0.001), and F8WT (p < 0.001). These findings indicate that the program structure, which incorporated a gradual increase in stepping-pad distance, contributed positively to improvements in lower limb strength, dynamic balance, and curved walking ability. The changes in participants’ InBody measurements and the means and standard deviations of the FTSST, FSST, and F8WT scores are presented in Table 12, Table 13 and Table 14.
An examination of the effects of increased stepping-pad distance on physical performance revealed that all three physical indicators demonstrated the most pronounced improvements between the pre- and mid-intervention stages, suggesting that the increased task difficulty resulting from a 5-cm expansion in the stepping-pad distance effectively stimulated such functional components as lower limb strength, dynamic balance, and curved walking ability.
A more detailed analysis showed that both the FTSST and F8WT exhibited a slight increase in completion time at post-intervention; however, performance levels remained improved over the baseline. In contrast, the FSST showed a continuous decrease in completion time through post-intervention, indicating a relatively stable pattern of functional improvement.
These results suggest that physical adaptations were most prominent during the early phase of the program and tended to stabilize during the later stages. Furthermore, the stepwise adjustment of task difficulty using incremental increases in stepping-pad distance appears to have functioned as an effective intervention mechanism. The EMM of FTSST, FSST, and F8WT across time are presented in Figure 4.
4.1.2. OpenCap
In this study, kinematic data for joint angles and task completion time collected during the FTSST were analyzed. First a signal stabilization procedure was applied, after which the sit-to-stand movement was segmented into five repeated cycles. To minimize interindividual variability at the beginning and end of task performance, the first and fifth repetitions were excluded from the analysis; only the second, third, and fourth repetitions were used for pre–post comparisons.
To account for differences in movement speed across participants, time normalization was applied to each repetition and angular velocity values of the joint angles at 25%, 50%, and 75% of movement progression were extracted and analyzed.
To examine the distribution of each variable, the Shapiro–Wilk test of normality was conducted. The results indicated that, at baseline, the total range of motion (RoM; p = 0.004), joint angles (p = 0.047), and angular velocities (p = 0.026) at the 75% phase of the movement did not satisfy the assumption of normality.
Accordingly, paired-samples t-tests were applied to variables that met the normality assumption and the Wilcoxon signed-rank test to the others. The results of the Shapiro–Wilk normality tests for joint angles and angular velocities across movement phases are presented in Table 15.
t-tests found no statistically significant pre–post differences for joint RoM at the 25% (p = 0.710) and 50% (p = 0.982) phases, nor for angular velocity at the 25% phase (p = 0.803), while at the 50% phase angular velocity showed a statistically significant increase over baseline in the post-intervention assessment (p = 0.018). This finding suggests a partial improvement in movement speed during the mid-phase of the FTSST following the intervention. Overall, the results indicate that improvements in movement velocity were not uniformly distributed across the entire movement cycle but were localized to specific phases of task performance.
The paired-samples t-test results for joint angles and angular velocities at the 25% and 50% phases are presented in Table 16.
Wilcoxon signed-rank tests found no statistically significant pre–post difference in knee joint RoM (p = 0.629), suggesting that the intervention had a limited effect on the magnitude of joint angle excursion. In addition, angular velocity at the 75% phase based on RoM showed an increasing trend in the post-intervention assessment over baseline; however, this difference did not reach statistical significance (p = 0.070). Similarly, no significant pre–post difference was observed for the angular velocity at the 75% phase (p = 0.872).
The results of the Wilcoxon signed-rank tests for overall joint angles and for joint angles and angular velocities at the 75% movement phase are presented in Table 17.
These findings suggest substantial interindividual variability in speed regulation strategies and movement characteristics during FTSST performance. Although partial trends of improvement were observed in some kinematic indicators, these changes did not reach statistical significance at the group level.
For a more intuitive illustration of pre–post changes, paired line plots were generated for each kinematic variable in which the solid red line represents the trajectory of the group mean and the gray dashed lines indicate individual participants’ change patterns. The direction of individual changes was inconsistent for all variables, with overall patterns reflecting either slight increases or maintenance of baseline levels. These visual patterns were consistent with the results of the statistical analyses. Graphical representations of changes in knee joint RoM and angular velocity are presented in Figure 5 and Figure 6.
4.2. Cognitive Function Outcomes
4.2.1. CIST
The analysis of cognitive function revealed a statistically significant increase in the total cognitive score following the intervention (p = 0.012). Among the subdomains, significant improvements were observed in executive function (p < 0.001) and memory (p = 0.028), which may be interpreted as the result of repeated exposure to the Stroop-based game activities and diverse cognitively demanding tasks embedded in the program, which provided direct stimulation of specific cognitive abilities.
In contrast, no significant differences were observed in other subdomains, including orientation, attention, and language function, suggesting that the program exerted selective effects on cognitively demanding domains like executive function and memory, rather than producing uniform improvements across all aspects of cognitive function.
4.2.2. Stroop Test
The analysis of the results of the Stroop task revealed consistent increases in post-test scores over pre-test scores across all conditions, including word reading, color naming, and the word–color incongruent condition, indicating improvements in overall cognitive processing speed and executive function. These changes were further supported by repeated-measures analysis of variance, which demonstrated statistically significant differences across time for word reading (p < 0.001), color naming (p < 0.001), and the incongruent condition (p < 0.001).
The means and standard deviations for the Stroop task and the results of the repeated-measures ANOVA are presented in Table 20 and Table 21.
Notably, the largest magnitude of change was observed in the word–color incongruent condition, suggesting that the difficulty-adjustment components of the program were effective in stimulating cognitive abilities involving selective attention and inhibitory control. In other words, the progressive increases in game difficulty appear to have led to direct improvements in cognitive processing efficiency and executive function. A graphical representation of the Stroop Test results is presented in Figure 7.
4.2.3. Program Satisfaction
To assess participants’ overall satisfaction and perceptions of program usability, a separate satisfaction survey was administered at the conclusion of the program. The questionnaire consisted of 18 items in five evaluation domains: usability, usefulness, safety, sustainability, and open-ended questions. Of these, 16 items were multiple-choice questions scored on a 5-point Likert scale, while two items were open-ended questions designed to explore participants’ motivation for participation and factors influencing continued engagement. The survey items are presented in Table 22.
The results of the program satisfaction survey indicated a very high level of overall satisfaction, with a mean score of 4.66 on a 5-point Likert scale. Among the evaluation domains, safety received the highest rating (mean = 4.73), indicating that participants had strong confidence regarding safety throughout the program.
Analysis of the open-ended responses revealed that the most frequently reported motivation for participation was the expectation of improvements in physical and cognitive functions. In addition, the desire to experience a novel form of activity was identified as another important motivating factor. Factors contributing to sustained participation included the provision of three physical and cognitive assessments and the instructional approach of the program facilitator, both of which participants perceived positively. The results of the program satisfaction evaluation are presented in Table 23.
When comparing participation experiences in individual and group exercise sessions, some participants reported occasionally skipping individual exercises due to fatigue, whereas they tended to engage more actively during group activities. One participant noted that “individual exercise allows for better concentration, while group activities are more enjoyable due to the added encouragement and sense of tension.”
These observations suggest that the provision of a safe program environment, active facilitation by instructors, social interaction among participants, and regular health-related feedback in integrated programs for older adults are key in higher program satisfaction and sustained participation.
5. Discussion
This study confirmed that an offline, dual-task–based physical–cognitive integrated program led to significant improvements in lower-extremity strength, dynamic balance, curved walking performance, and overall cognitive function in older adults. Falls in older adults are not solely attributable to declines in lower-extremity function but predominantly occur under dynamic conditions; dynamic balance, lower-extremity motor function, and cognitive ability play critical roles in reducing fall risk [35]. However, Chung (2025) primarily focused on lower-extremity strength or straight-line gait performance [34], with cognitive function assessed using a single screening measure, which limited the comprehensive evaluation of fall-related functional capacity. In contrast, this study incorporated expert interviews to inform program design and expanded the physical function assessment to include dynamic balance and curved walking performance for a broader examination of gait balance and the dynamic movement conditions that are more directly associated with fall risk. Statistically significant improvements were observed across lower-extremity strength, dynamic balance ability, and curved walking performance, indicating that the proposed intervention positively influenced not only the lower-extremity function but also balance control and curved gait performance of older adults.
From a methodological perspective, this study is significant in integrating conventional quantitative functional assessments with OpenCap-based kinematic analysis to examine intervention effects in a multilayered manner. By applying markerless kinematic analysis to the FTSST, movement characteristics that are difficult to capture through time-based performance measures alone could be examined quantitatively across movement phases. The results showed no significant changes in overall joint RoM or most angular velocity parameters; however, knee joint angular velocity during the mid-phase of the movement increased significantly following the intervention. This finding suggests that the intervention selectively influenced phase-specific speed regulation rather than inducing global changes in joint motion patterns. Although these changes were limited to specific parameters, the results demonstrate the potential of OpenCap to provide complementary information on the process of functional performance as well as its outcomes.
Regarding cognitive function, the present study went beyond the single cognitive screening tool (CIST) commonly used in previous research by additionally applying the Stroop Test. This approach enabled changes not only in general cognitive status but also in cognitive processing speed and cognitive flexibility to be examined. Following the intervention, significant improvements were observed in executive function, memory, and cognitive processing speed, suggesting that a dual-task, game-based design incorporating progressively adjusted difficulty effectively stimulates higher-order cognitive functions. Moreover, the program demonstrated potential utility for reducing fall risk and preventing cognitive decline in older adults.
In program operation and participation, several factors were identified as contributing to enhanced intervention effectiveness and sustained engagement, including the instructional approach of the program facilitator, physical and cognitive assessments at pre-, mid-, and post-intervention, immediate feedback, progressive game difficulty, and opportunities for participant interaction. Notably, participation continuity was higher in group-based activities than in individual exercises, highlighting the importance of social interaction and competitive elements in maintaining exercise engagement among older adults. These characteristics were reflected in the program attendance rate, which averaged 78.7%, indicating relatively high adherence. Together, these findings underscore the importance of taking social context and participation structure, in addition to physical and cognitive stimulation, into account when designing intervention programs for older adults.
Several limitations should be acknowledged. This study had a small sample size, limiting the generalizability of the findings, and the higher proportion of female participants precluded a detailed analysis of sex differences. In addition, the interpretation of certain kinematic variables derived from OpenCap was constrained by variability in recording environments and individual movement strategies, and some variables did not meet normality assumptions, necessitating cautious statistical interpretation. Furthermore, external constraints related to program scheduling temporarily limited intervention continuity, which should be borne in mind when interpreting the results. Despite these limitations, this study holds academic and practical significance by combining a gamification-based integrated physical–cognitive intervention with markerless kinematic analysis to comprehensively evaluate functional changes in older adults from a comprehensive perspective.
6. Conclusions
This study demonstrated that functional changes in older adults can be more comprehensively and precisely captured by supplementing conventional time-based performance assessments with quantitative analyses of joint RoM and phase-specific velocity changes during task execution. In particular, the application of the markerless motion capture system OpenCap demonstrates the feasibility of quantifying movement patterns and analyzing intra-task performance dynamics in older adults within a relatively simple and accessible measurement environment.
These findings suggest that this approach constitutes a practical analytical framework that can be applied to the development of personalized exercise assessment and program design in digital healthcare contexts for older populations. Furthermore, this study offers empirical evidence of the effectiveness of a gamification-based integrated physical and cognitive program for older adults, while also demonstrating the potential for enhanced program evaluation by combining intervention design with technology-driven kinematic analysis tools. Overall, our results may contribute to the future development of customized dual-task programs for older adults and to the broader application of digital healthcare services to promote healthy aging.
Author Contributions
Conceptualization, J.-S.K. and J.-H.Y.; methodology, J.-S.K. and J.-H.Y.; software, J.-S.K.; validation, J.-S.K.; formal analysis, J.-S.K.; investigation, J.-S.K.; resources, J.-S.K.; data curation, J.-S.K.; writing—original draft preparation, J.-S.K.; writing—review and editing, J.-S.K. and J.-H.Y. ; visualization, J.-S.K.; supervision, J.-H.Y.; project administration, J.-H.Y.; All authors have read and agreed to the published version of the manuscript.
Funding
This research received no external funding.
Institutional Review Board Statement
This study was conducted after receiving approval (Institu-tional Review Board (IRB) No. KMU-202509-HR-504) from the Institutional Review Board (IRB) of Kookmin University to ensure ethical protection of the research subjects Informed Consent Statement: Informed consent was obtained from all subjects involved in the study.
Informed Consent Statement
Written informed consent was obtained from all participants involved in the study.
Data Availability Statement
The raw data supporting this study are available from the authors and corresponding author upon request.
Acknowledgments
The authors would like to express their sincere gratitude to Professor Jin-Ho Yim, the corresponding author, for his valuable support and guidance in this study.
Conflicts of Interest
The authors declare no conflicts of interest.
References
- Digital Times. Available online: https://www.dt.co.kr/article/12020737?ref=naver (accessed on 12 December 2025).
- Korea Disease Control and Prevention Agency. Available online: https://www.kdca.go.kr/board/board.es?mid=a20501000000&bid=0015&list_no=725530&act=view (accessed on 14 December 2025).
- National Health Insurance Service. Available online: https://www.nhis.or.kr/magazin/149/html/sub1.html (accessed on 23 December 2025).
- Kim, S.J. Comparison of muscle contraction onset time during a sit-to-stand task among young adults, healthy older adults, and older adults with a history of falls. Master’s Thesis, Daegu University, Graduate School of Rehabilitation Science, 2005. [Google Scholar]
- Oh, Y.-S.; Shin, Y.-J.; Han, K.-S. The effect of exercise program for physical fitness, mental health, and cognitive function in the elderly. Korean J. Growth Dev. 2007, 15, 295–302. [Google Scholar]
- Kang, B.R.; Park, S.H.; Kang, H.Y.; Ho, S.H.; Bae, Y. The effects of sequential dual-task training on cognitive and physical function in stroke patients: A case series study. J. Korean Soc. Neurocogn. Rehabil. 2023, 15, 47–55. [Google Scholar]
- Lee, H.K. Effects of an 8-week dual-task fall prevention exercise program on body composition, physical function, balance, cognitive function, and psychosocial characteristics in older adults. Doctoral Dissertation, Kyungnam University, 2024. [Google Scholar]
- Lee, H.Y.; Hong, J.-H.; Song, W.-Y. Exercise motivations of regularly participating elderly individuals: Involvement, fun, and stress factors. Korean J. Sport Psychol. 2008, 19, 51–64. [Google Scholar]
- Chu, Y.-K.; Shon, J.-H. Effect of a 16-week combined exercise program on health-related physical fitness and depression in elderly women. J. Coach. Dev. 2012, 14, 105–114. [Google Scholar]
- Kim, J.; Lee, D.; Youn, S. Application of a dual-task-based physical activity program for improving cognitive function in older adults: An fNIRS study. J. Sport All 2025, 100, 289–298. [Google Scholar] [CrossRef]
- Na, B.-R.; Oh, B.-S. Aging and muscular strength in the lower limbs. Korean J. Res. Gerontol. 2020, 29, 1–24. [Google Scholar] [CrossRef]
- Kim, N.-I. The effect of complex exercise on physical performance and geriatric locomotive function scale in elderly with aging-induced sarcopenia. Korean J. Sport 2024, 22, 231–240. [Google Scholar] [CrossRef]
- Wang, H.; Huang, W.Y.; Zhao, Y. Efficacy of exercise on muscle function and physical performance in older adults with sarcopenia: An updated systematic review and meta-analysis. Int. J. Environ. Res. Public Health 2022, 19, 8212. [Google Scholar] [CrossRef] [PubMed]
- Choe, M.A.; Jeon, M.Y.; Choi, J.A. Effect of walk training on physical fitness for prevention in a home-bound elderly. J. Korean Acad. Nurs. 2000, 30, 1318–1332. [Google Scholar] [CrossRef]
- Jung, J.; Kim, J.M. The cognitive and affective characteristics of Korean older adults with subjective memory complaints. J. Korean Gerontol. Soc. 2015, 35, 835–851. [Google Scholar]
- Lee, H.W. Risk factors for cognitive decline in older adults in Korea. Master’s Thesis, Kyung Hee University, 2019. [Google Scholar]
- Clouston, S.A.; Brewster, P.; Kuh, D.; Richards, M.; Cooper, R.; Hardy, R.; Rubin, M.S.; Hofer, S.M. The dynamic relationship between physical function and cognition in longitudinal aging cohorts. Epidemiol. Rev. 2013, 35, 33–50. [Google Scholar] [CrossRef] [PubMed]
- Lee, B.; Park, J.-S.; Kim, N. The effect of physical activity programs on cognitive function, physical performance, gait, quality of life, and depression in elderly individuals with dementia. J. Spec. Educ. Rehabil. Sci. 2011, 50, 307–328. [Google Scholar]
- Song, C.; Kim, K. The effect of health promotion exercise on Alzheimer’s dementia-related factors and cognitive function in elderly women. Korean J. Sport Sci. 2018, 27, 1219–1228. [Google Scholar] [CrossRef]
- Chung, E.; Bok, J.; Yim, J. A study on the impact of stepping gamification on improving gait ability in elderly people. J. Ergon. Soc. Korea 2024, 43, 245–256. [Google Scholar] [CrossRef]
- ae, J.; Lee, Y.; Choi, W. The relationship between aging and inhibition ability: Evidence from a web-based number Stroop task. Korean J. Cogn. Sci. 2025, 36, 1–20. [Google Scholar]
- Treiblmaier, H. Research commentary: Setting a definition, context, and theory-based research agenda for the gamification of non-gaming applications. AIS Trans. Hum.-Comput. Interact. 2018, 10, 3. [Google Scholar] [CrossRef]
- Kim, Y.J.; Kim, Y.; Kim, T. The impact of gamification strategies in fitness applications on user flow and continuous use intention. J. Korean Soc. Sport Ind. Manag. 2019, 24, 55–73. [Google Scholar] [CrossRef]
- Arufe-Giráldez, V.; Sanmiguel-Rodríguez, A.; Ramos-Álvarez, O.; Navarro-Patón, R. Gamification in physical education: A systematic review. Educ. Sci. 2022, 12, 540. [Google Scholar] [CrossRef]
- Guo, Y.; Yuan, T.; Yue, S. Designing personalized persuasive game elements for older adults in health apps. Appl. Sci. 2022, 12, 6271. [Google Scholar] [CrossRef]
- Park, Y.H.; Yun, R.J. Convergent gamification strategies to promote health behavior according to the tendency of goal achievement. J. Korean Soc. Sci. Arts 2019, 37, 141–155. [Google Scholar] [CrossRef]
- Chung, E.J. Research on integrated program leveraging gamification to enhance cognitive and physical fitness in the elderly. Master’s Thesis, Kookmin University, Graduate School of Techno Design, 2025. [Google Scholar]
- Seaborn, K.; Fels, D.I. Gamification in theory and action: A survey. Int. J. Hum.-Comput. Stud. 2015, 74, 14–31. [Google Scholar] [CrossRef]
- Han, A. A systematic literature review of research trends in domestic gamification. J. Korea Contents Assoc. 2018, 18, 566–578. [Google Scholar]
- Choi, M.; Park, B.; Koo, B.; Chae, J.; Kim, J. Human motion analysis based on a markerless motion capture using Kinect. In Proceedings of the Joint Conference of the Institute of Control, Robotics and Systems, Seoul, South Korea, 2012. [Google Scholar]
- Yoo, Y.W. Validity of lower-limb kinematic variables derived from a markerless system during the Y-Balance Test and comparison of explanatory power for reach distance. Master’s Thesis, Kookmin University, Graduate School, 2022. [Google Scholar]
- Uhlrich, S.D.; Falisse, A.; Kidziński, Ł.; Muccini, J.; Ko, M.; Chaudhari, A.S.; Hicks, J.L.; Delp, S.L. OpenCap: Human movement dynamics from smartphone videos. PLoS Comput. Biol. 2023, 19, e1011462. [Google Scholar] [CrossRef]
- Kanko, R.M.; Laende, E.K.; Strutzenberger, G.; Brown, M.; Selbie, W.S.; DePaul, V.; Scott, S.H.; Deluzio, K.J. Assessment of spatiotemporal gait parameters using a deep-learning algorithm-based markerless motion capture system. J. Biomech. 2021, 122, 110414. [Google Scholar] [CrossRef]
- Chung, E.-J.; Yim, J.-H. An integrated program to improve cognitive and physical abilities in older people. Appl. Sci. 2025, 15, 2677. [Google Scholar] [CrossRef]
- An, S.H.; Lee, B.K. The relationships among fall down, self-efficacy and the functional performance ability in stroke patients. J. Spec. Educ. 2011, 50, 269–288. [Google Scholar]
Figure 1.
Stepping-pad configuration for the Stroop Stepping Game.
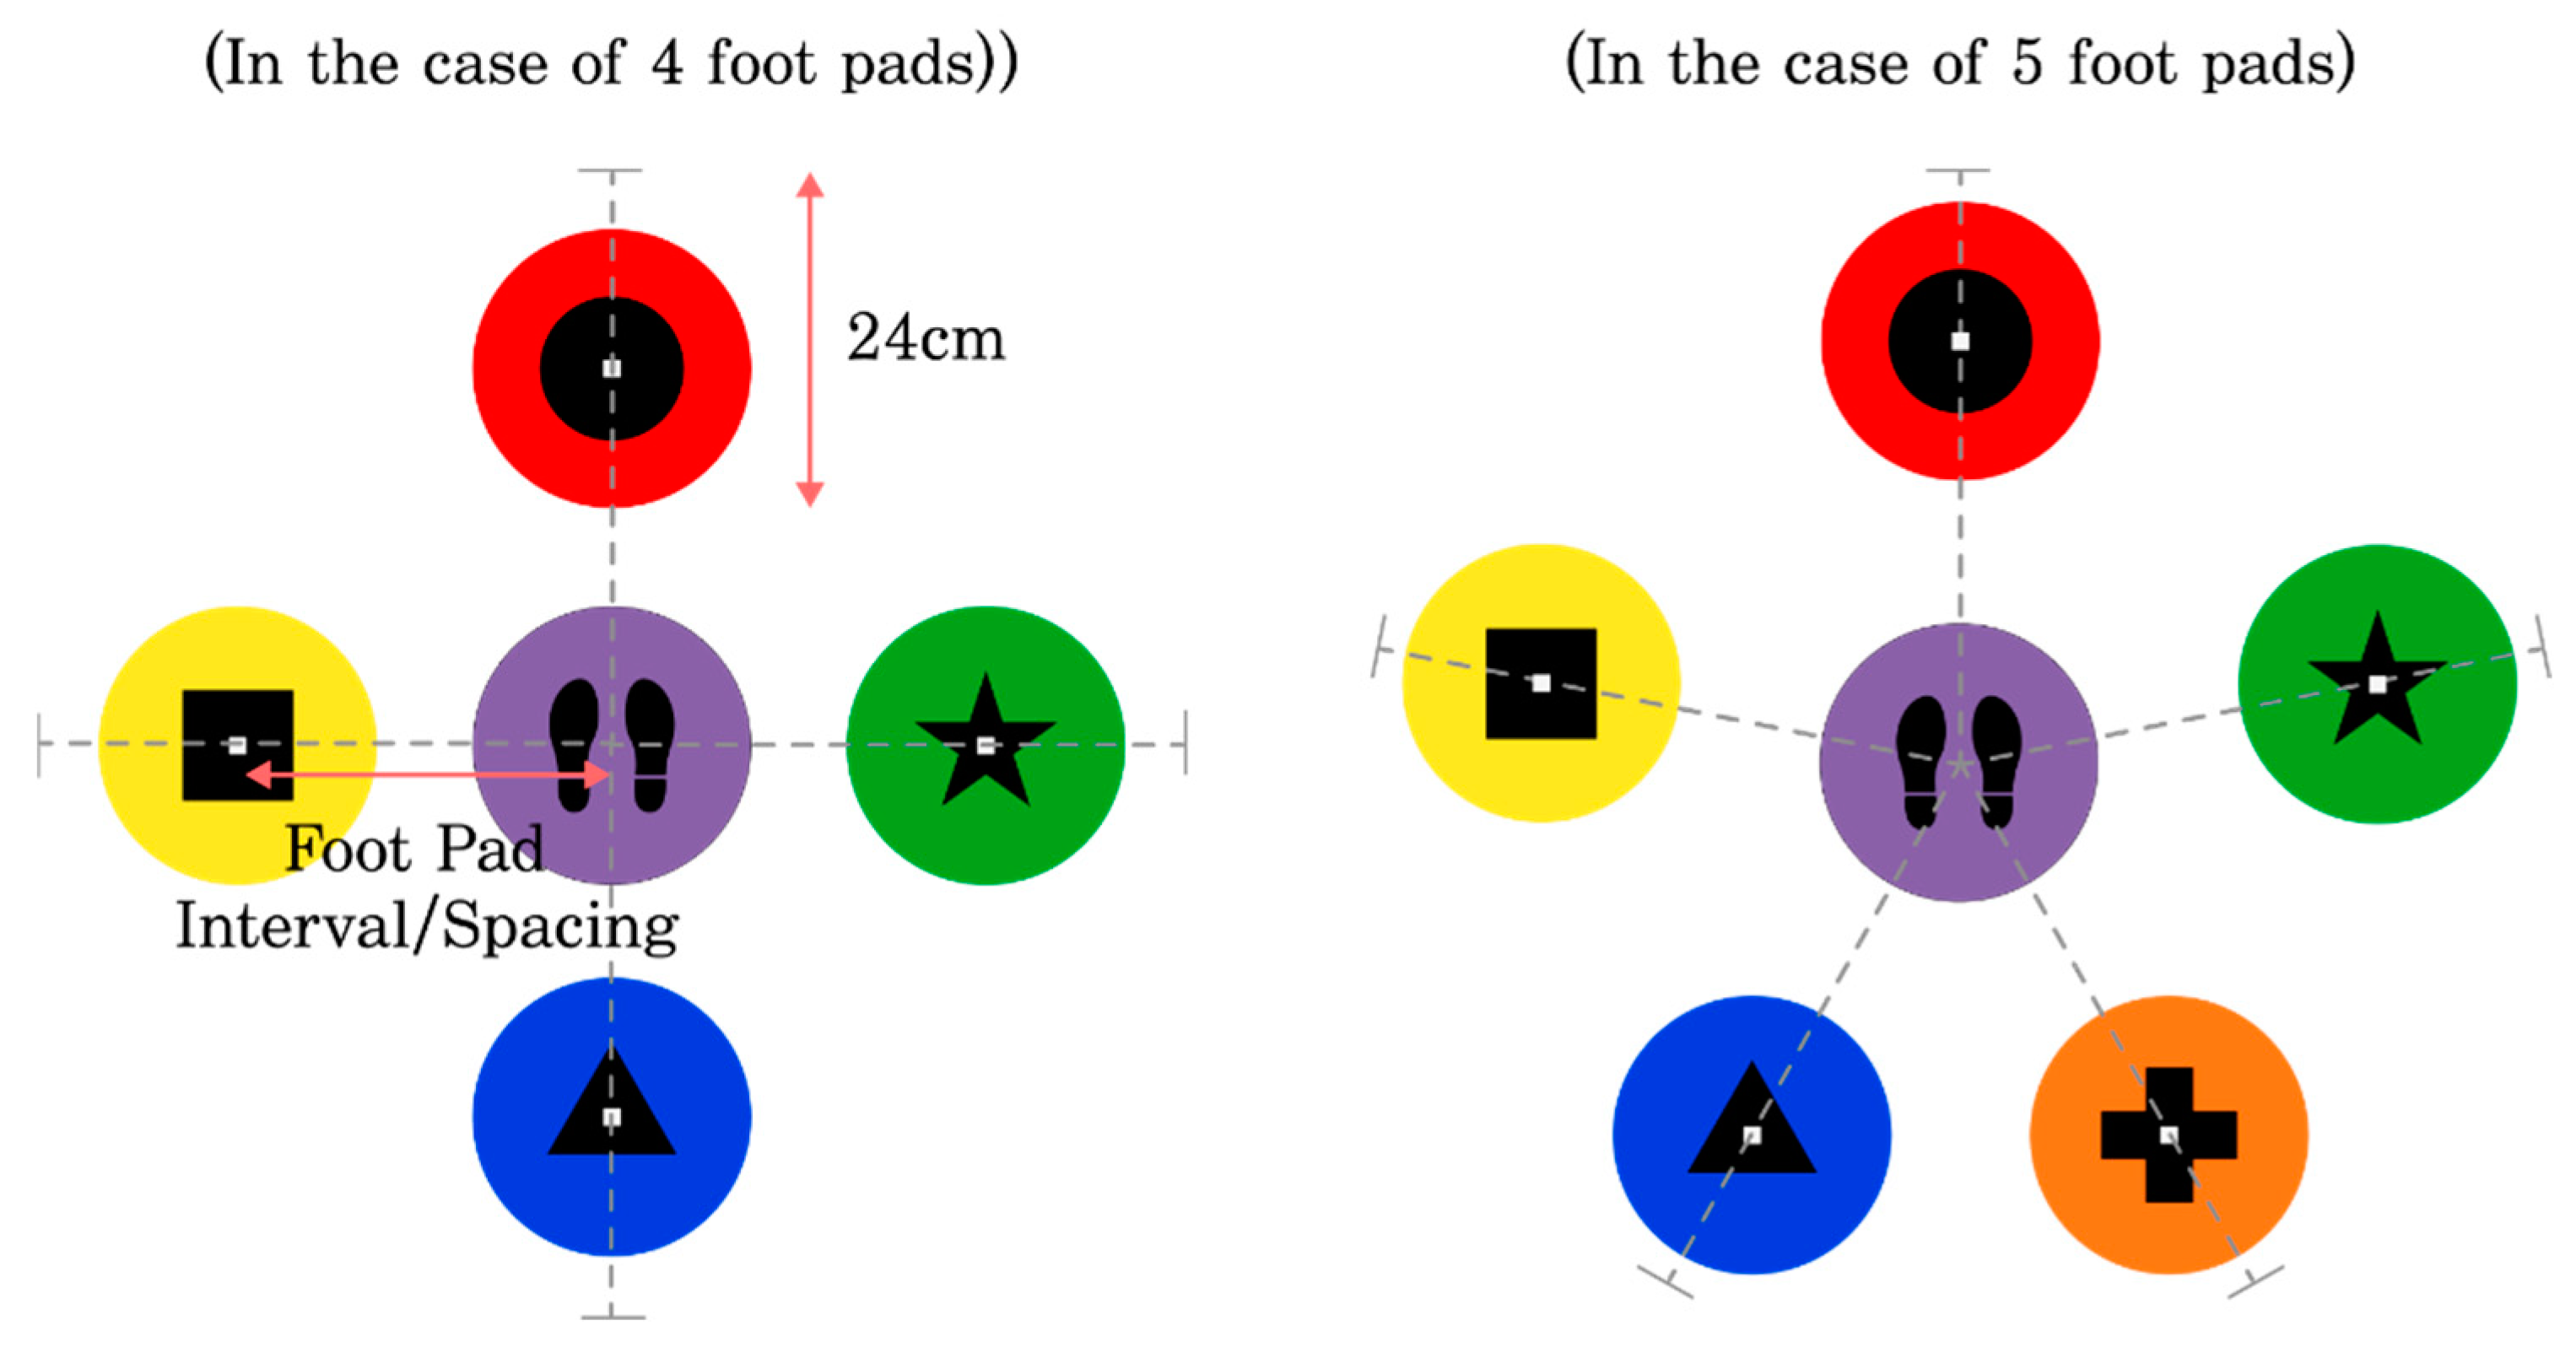
Figure 2.
Physical and Cognitive Research Model.
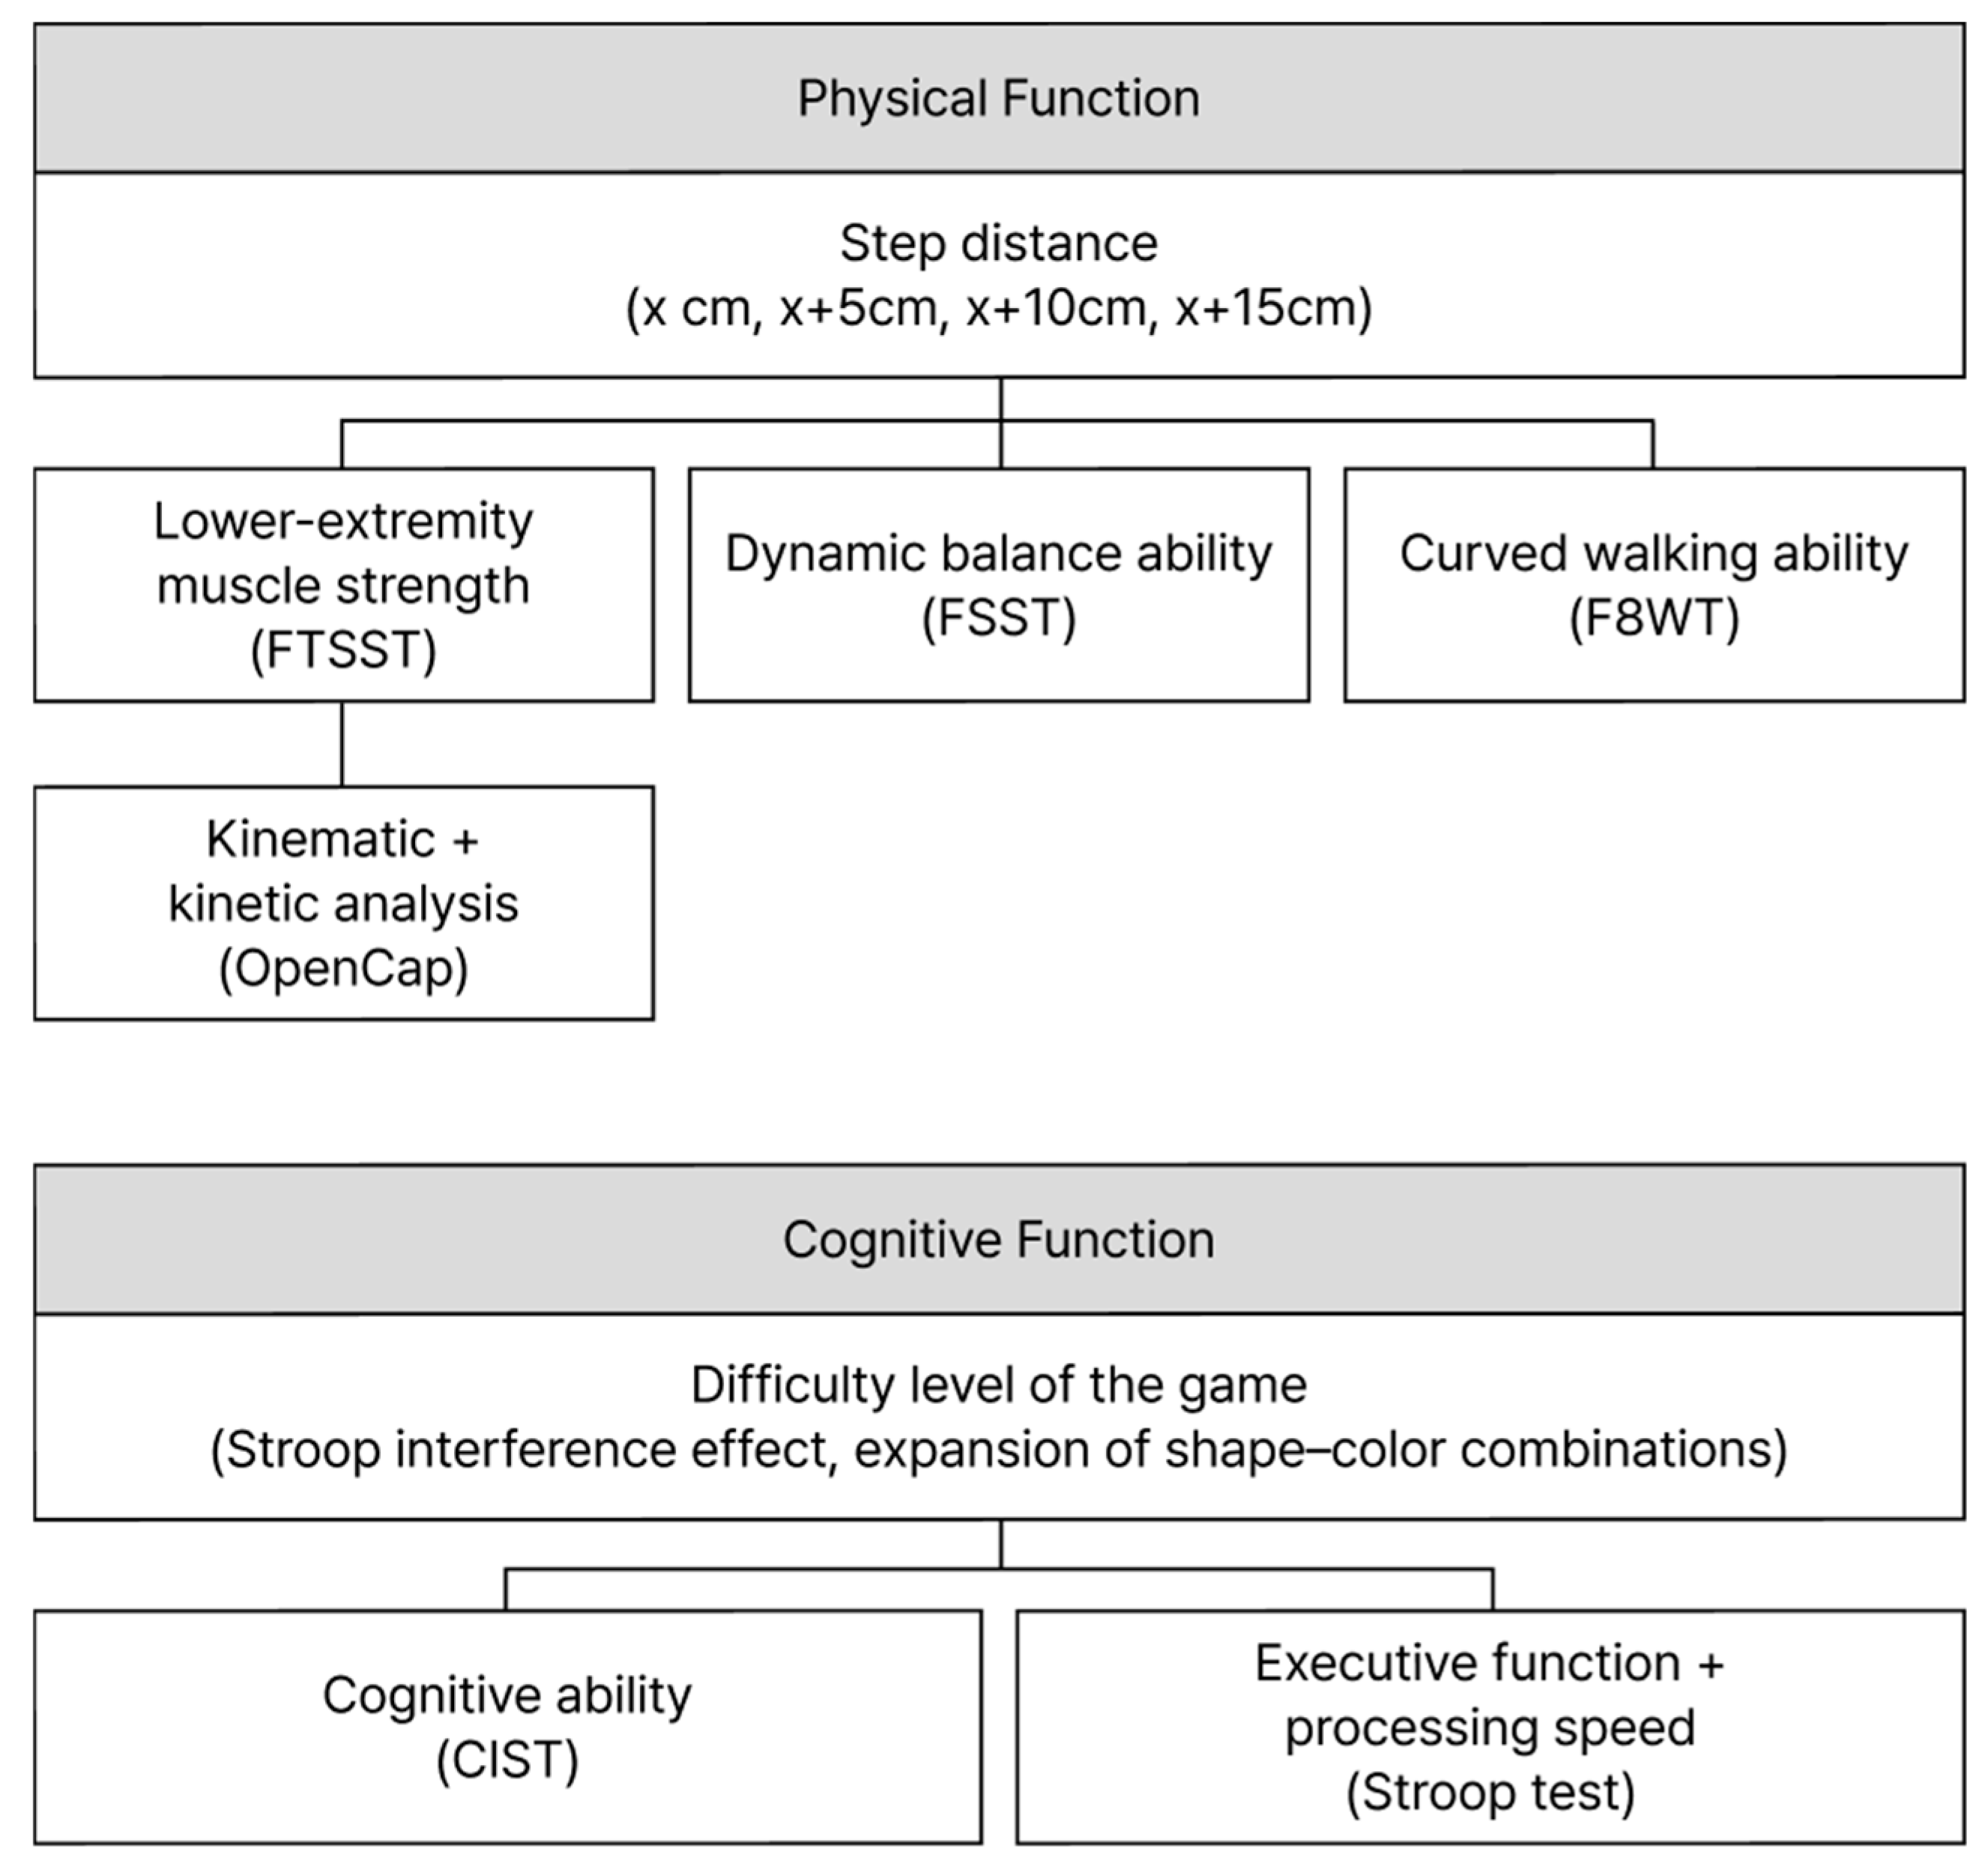
Figure 3.
“Match It!” Color-Step game (individual mode) (a), “Match It!” Color-Step game (team-based mode) (b).
Figure 3.
“Match It!” Color-Step game (individual mode) (a), “Match It!” Color-Step game (team-based mode) (b).
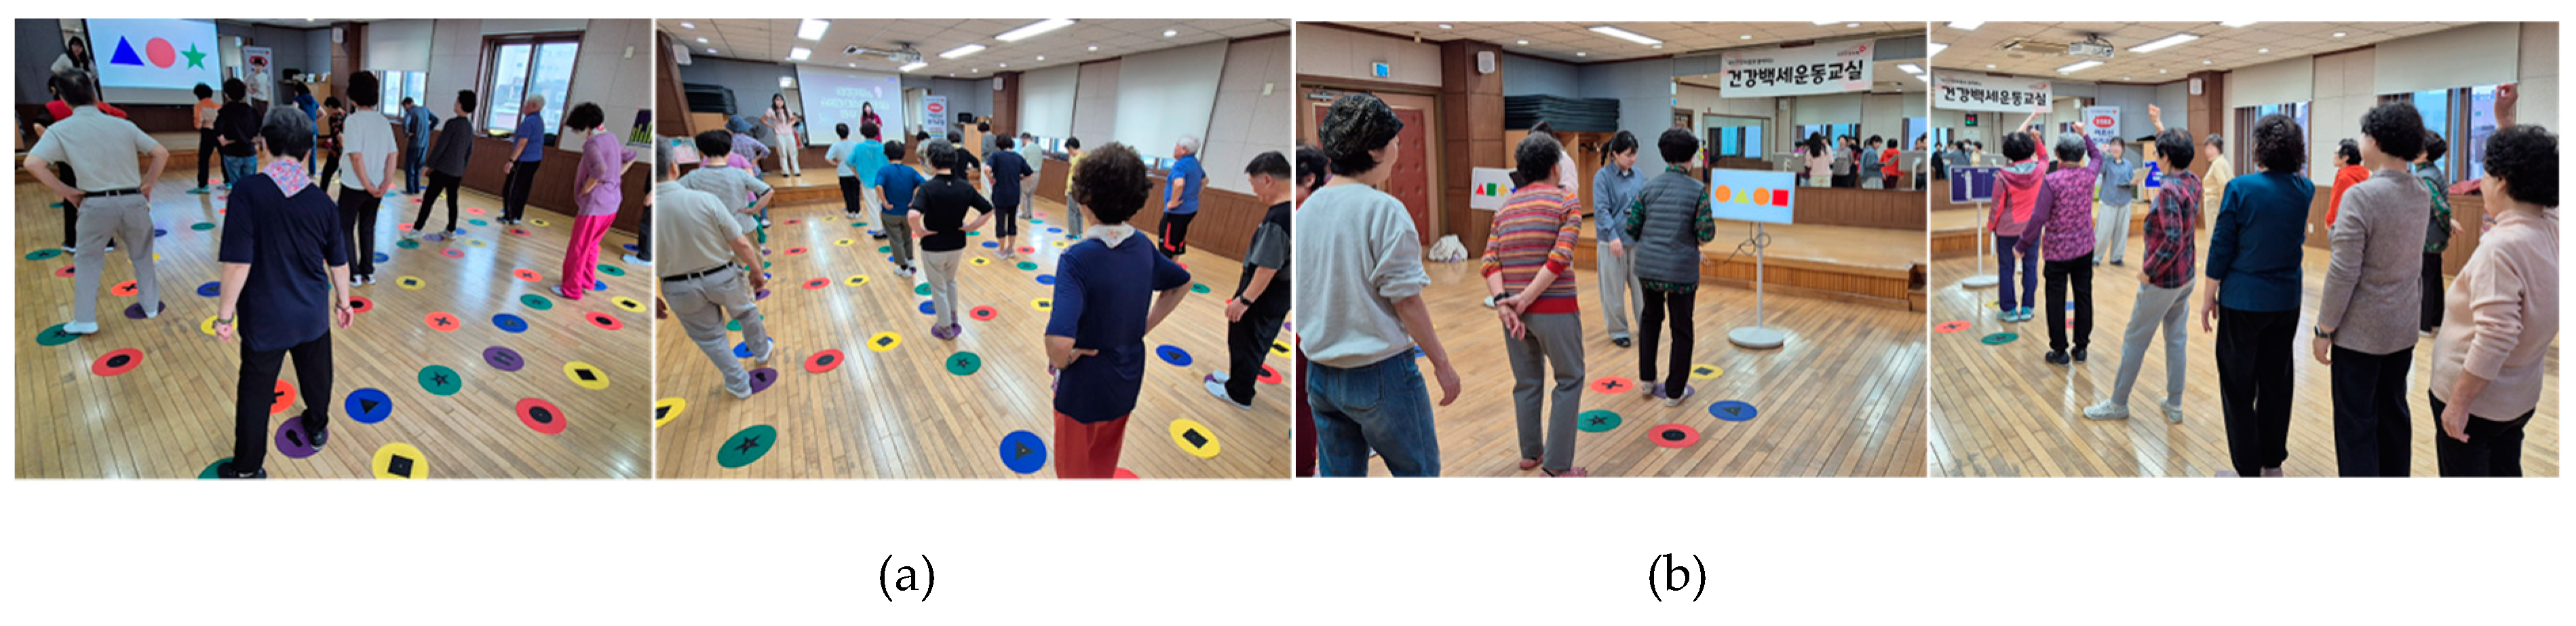
Figure 4.
Estimated marginal averages of FTSST (a), FSST (b), F8WT (c).
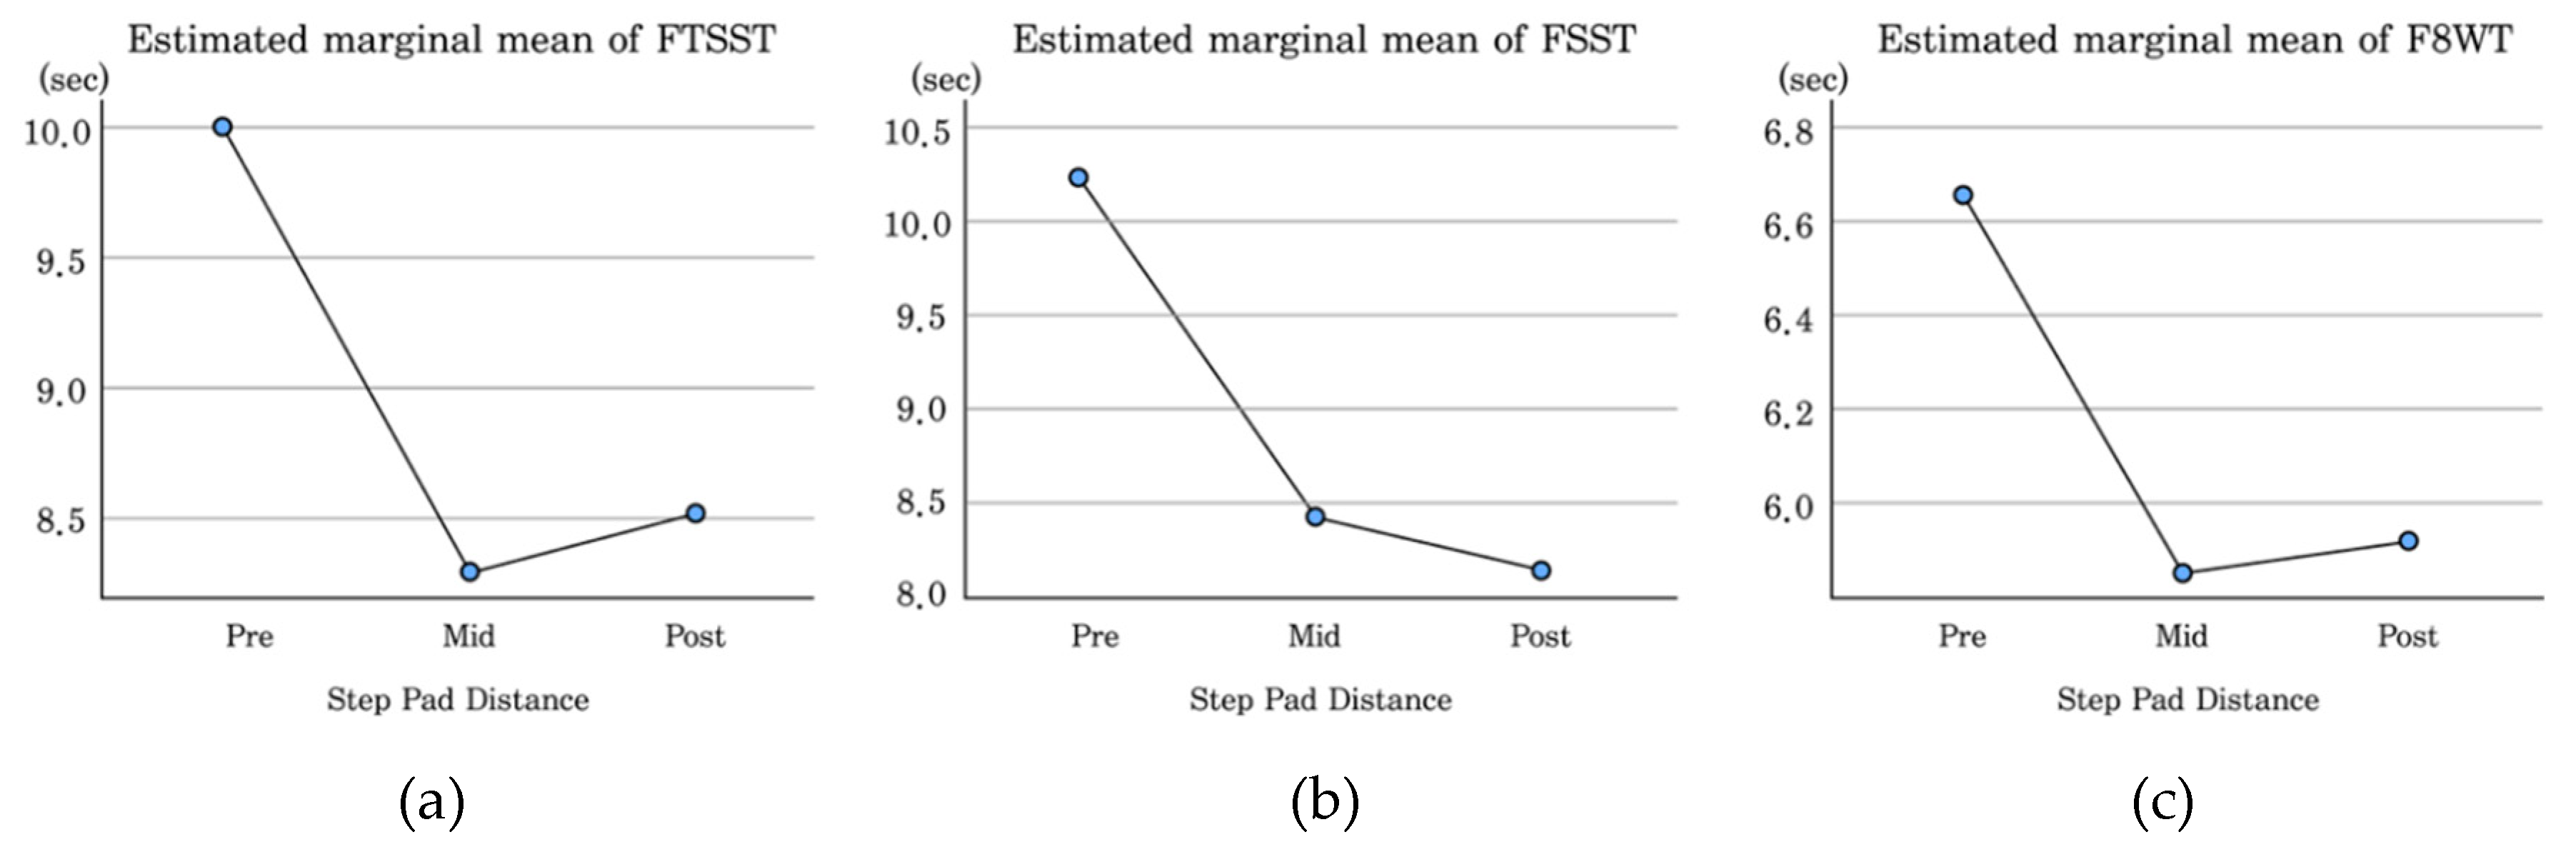
Figure 5.
Pre–post knee joint angles (a), knee joint angles at 25% (b), 50% (c), and 75% (d) of the movement phase.
Figure 5.
Pre–post knee joint angles (a), knee joint angles at 25% (b), 50% (c), and 75% (d) of the movement phase.
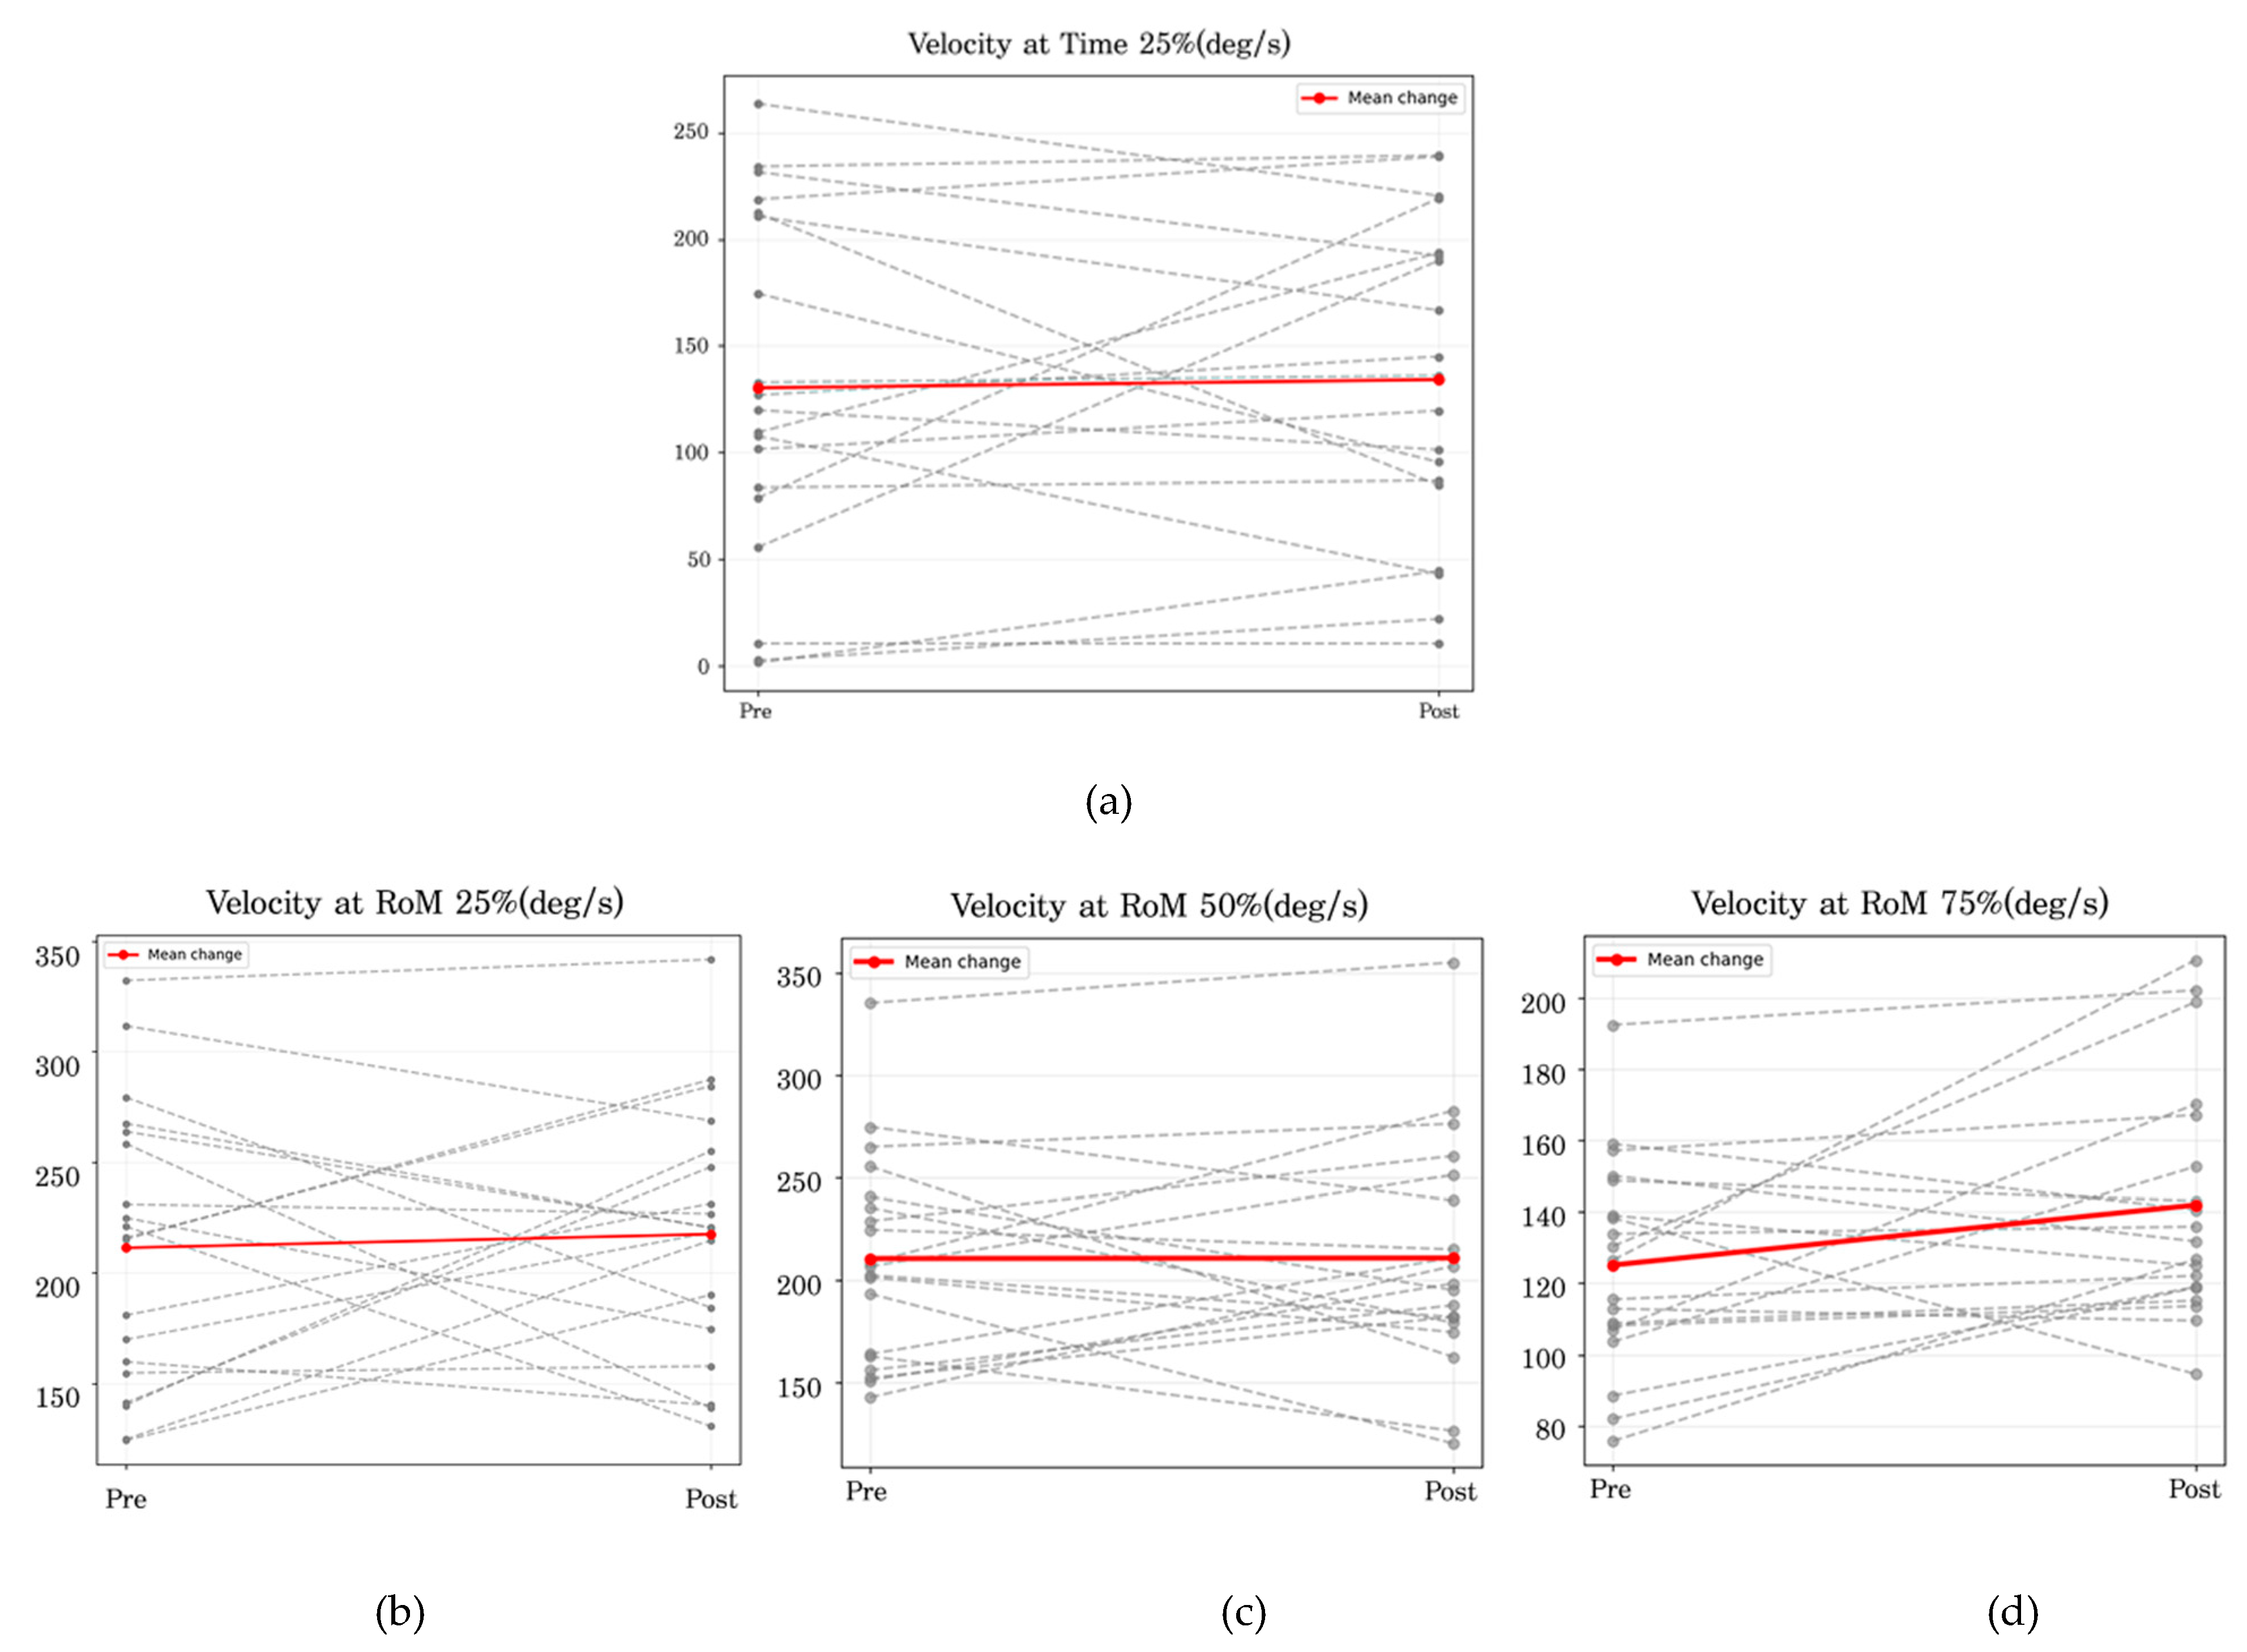
Figure 6.
Pre–post intervention angular velocity at the 25% (a), 50% (b), and 75% (c) phases.
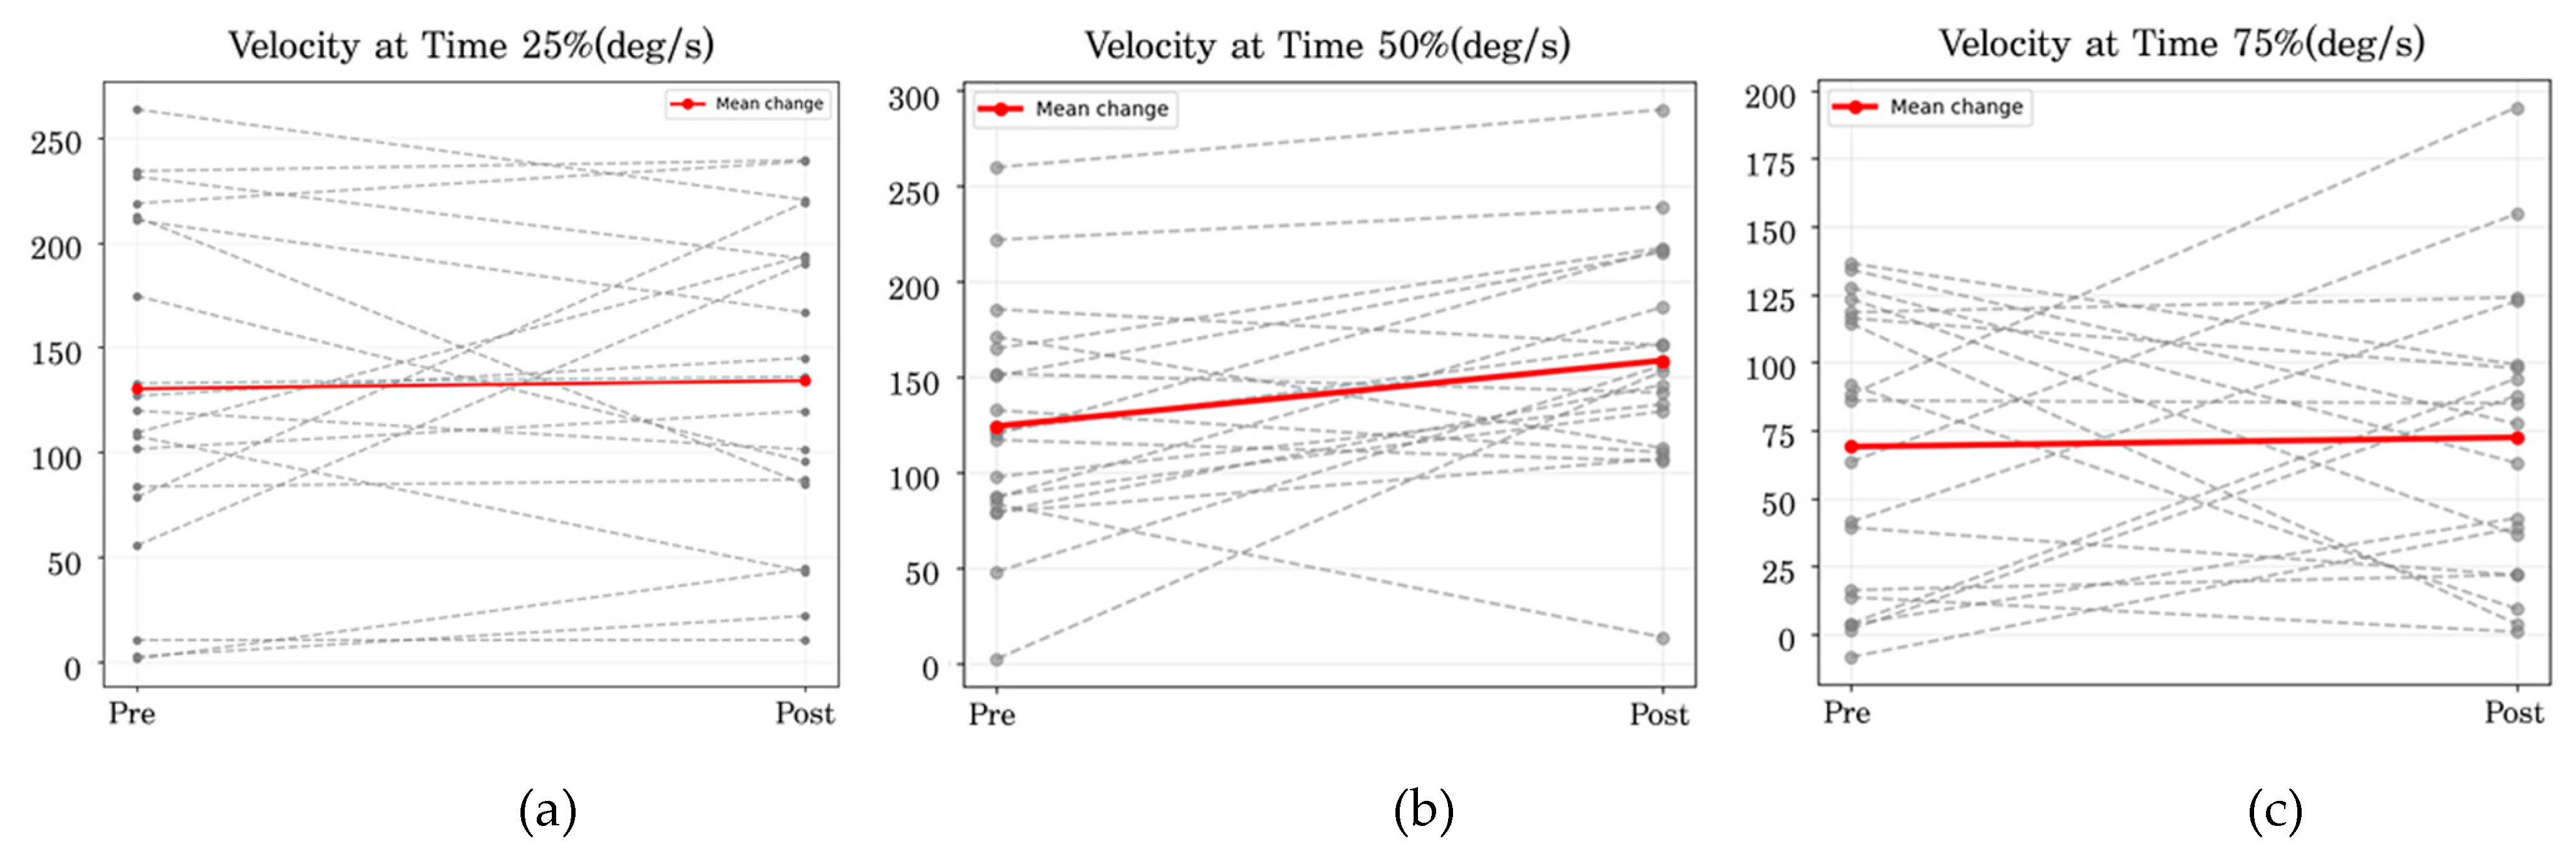
Figure 7.
Estimated marginal averages of Word (a), Color (b), and Word–Color Incongruence (c).
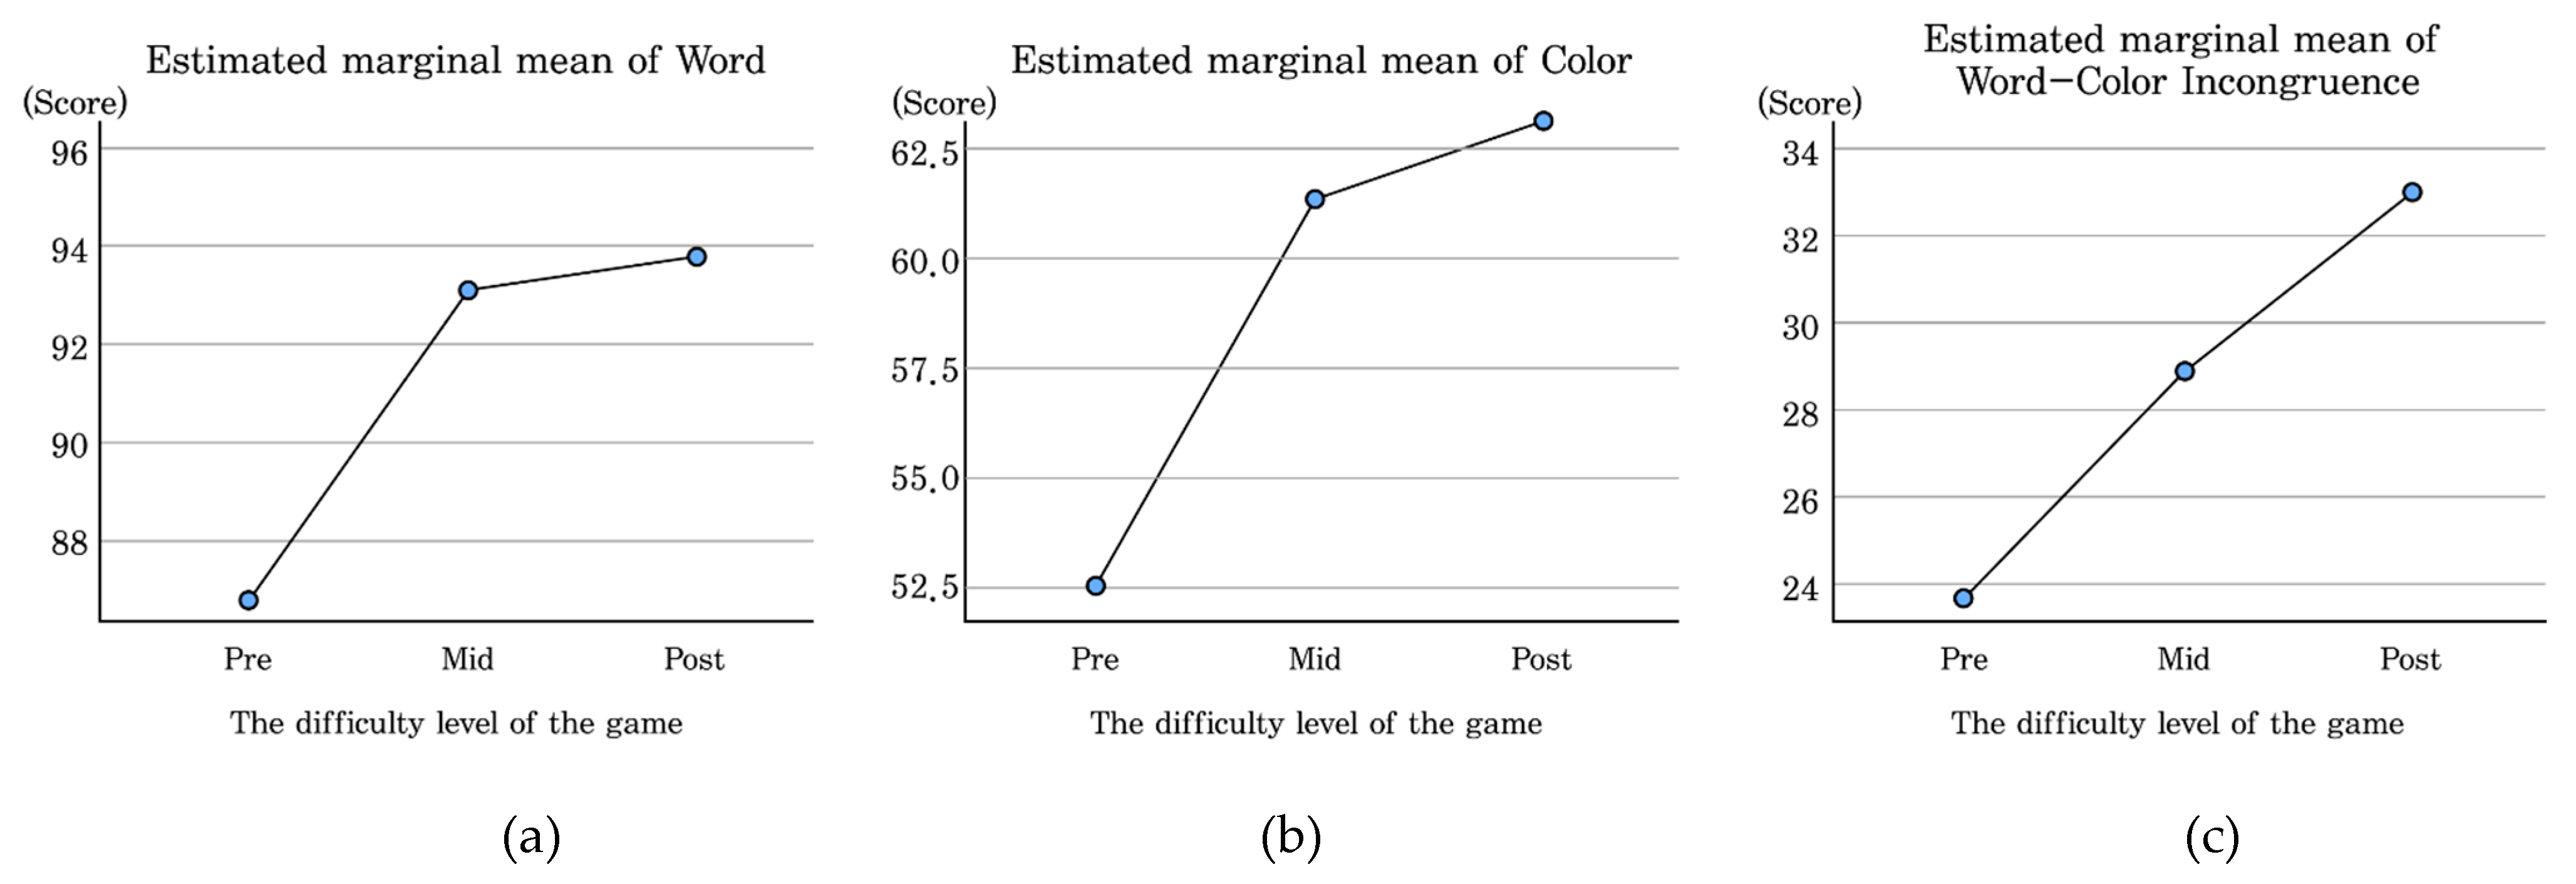

Table 1.
Expert Interviews on Program Design.
| Design Domain | Interview Content | Revisions and Refinements |
|---|---|---|
| Participation Motivation | Meaningful goals and emotional interaction are critical for sustaining participation. | Incorporation of gamification elements, immediate feedback, and interactive components within the program. |
| Assessment Tools | Time-based functional assessments are more sensitive to detecting change than score-based tests. (2) Fall prevention requires evaluation tools that capture balance ability rather than lower-extremity strength alone. | Adoption of functional assessments such as FSST (dynamic balance) and F8WT (curved walking). |
| Cognitive Assessment | In addition to the general cognitive level, tools that assess cognitive processing speed and cognitive flexibility are necessary. | Additional application of the Stroop Test. |
| Game Difficulty | Progressive escalation of game difficulty is essential to maintain safety and sustained program engagement. | Gradual increase in stepping-pad distance and task complexity. |
| Program Safety | The risk of falls is highest during program execution; therefore, continuous and attentive monitoring is required. | Continuous observation and health monitoring during program implementation. |
Table 2.
Expert Interviews on the Use of OpenCap.
| Design Domain | Interview Content | Revisions and Refinements |
| Measurement Environment | Maintaining a consistent recording environment and accurate calibration and having subjects wear tight-fitting clothing are critical for data reliability. | Use of a consistent space and camera setup, prior calibration, and careful control of clothing conditions. |
| Recording Conditions | Proper vertical placement of the checkerboard, sufficient recording space, and minimization of camera distortion through appropriate angle settings are essential. | Pre-checking the measurement environment and conducting pilot tests before data collection. |
| Analytical Limitations | Pre-checking the measurement environment and conducting pilot tests prior to data collection. | Restricting analysis to FTSST tasks, which involve minimal leg overlap and high measurement stability. |
| Applicability | Restricting analysis to FTSST tasks, which involve minimal leg overlap and high measurement stability. | Conducting pre–post analyses of joint range of motion and angular velocity. |
| Applicability | Conducting pre–post analyses of joint range of motion and angular velocity. | Applying repetition segmentation and time normalization, followed by phase-specific analysis. |
Table 3.
Characteristics of Participants (N = 19).
| Measure | Characteristics | Number of Participants (n) |
|---|---|---|
| Gender | Male | 4 |
| Female | 15 | |
| Education Level | Elementary school | 3 |
| Middle school | 5 | |
| High school | 7 | |
| University degree | 4 | |
| Age | 60s | 5 |
| 70s | 13 | |
| 80s | 1 | |
| Cognitive Status (CIST) | Normal | 16 |
| Suspected cognitive decline | 3 |
Table 4.
Physical Characteristics of Participants (N = 19).
| Measure | Mean ± SD |
|---|---|
| Age (years) | 73.68 ± 2.76 |
| Height (cm) | 157.21 ± 5.09 |
| Weight (kg) | 58.09 ± 8.4 |
| BMI (kg/m²) | 23.46 ± 2.79 |
| Skeletal Muscle Mass (kg) | 21.36 ± 3.22 |
| Body Fat Mass (kg) | 18.07 ± 4.48 |
| Body Fat Percentage (%) | 30.89 ± 4.85 |
Table 5.
Assessment Tools and Measurement Timeline for Physical and Cognitive Outcomes.
| Measure | Assessment Tool | Pre | Mid | Post |
|---|---|---|---|---|
| Physical | FTSST | O | O | O |
| FSST | O | O | O | |
| F8WT | O | O | O | |
| OpenCap | O | O | O | |
| Cognitive | CIST | O | - | O |
| Stroop Test | O | O | O | |
| Program Satisfaction | - | - | O |
Table 6.
Program Overview.
| Category | Description |
|---|---|
| Program Title | Match It! Color Step |
| Participants | 19 Participants |
| Period | August 25, 2025–November 7, 2025 (11 weeks) |
| Sessions | Twice per week, total of 20 sessions (1 program orientation and practice game, 16 main program sessions, and 3 assessment sessions) |
| Session Duration | About 50–55min |
Table 7.
Program Components and Materials.
| Title | Game Procedure | Game Equipment |
|---|---|---|
| Match It! Color Step | 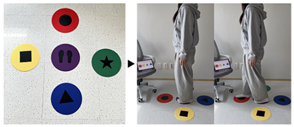 |
 |
| Circular Marker Set Made of SEBS Material, 24cm Diameter Styrofoam Rings | ||
Table 8.
Program Structure of the “Match It! Color Step” Program.
| Category | Detailed Description | Time (min) |
|---|---|---|
| Start-Up Preparation | Greeting (daily health check) and attendance confirmation, warm-up exercises, and game setup |
5 |
| Individual Exercise |
“Match It!” Color-Step game | 25 |
| Break | Break and preparation for the next session | 5 |
| Group Exercise |
“Match It!” Color-Step game (team-based mode) | 15 |
| Closing | Closing remarks and preview of the next session | 5 |
| Total | - | About 50–55 |
Table 9.
Layout of Individual and Team-Based Game Operations.
| Game Layout Diagram | |
|---|---|
| Individual Mode | Team-Based Mode |
 |
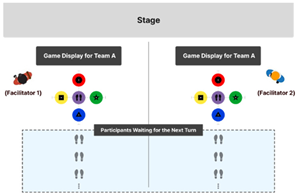 |
Table 10.
Session-Based Progression of Step-Pad Configuration and Stroop Task Difficulty.
| Session Phase | 1–4 | 5–8 | 9–12 | 13–16 |
|---|---|---|---|---|
| Game Task | Stroop Congruent Condition |
Stroop Incongruent Condition | Stroop Congruent Condition |
Stroop Incongruent Condition |
| Step-Pad Distance | 45cm | 50cm | 55cm | 60cm |
| Example |  |
 |
 |
 |
| Number of Step Pads | 4 | 4 | 5 | 5 |
| Step Pads Positions |
 |
 |
 |
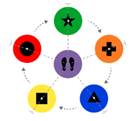 |
Table 11.
Gamification Strategies Applied in the Program.
| Gamification Strategies | |
|---|---|
| Competition | Competition with other teams, individual leaderboards |
| Achievement | Attendance scoreboard, progression of game difficulty, sharing of task performance |
| Rewards | Three rounds of physical and cognitive assessments, program completion certificate, gift rewards |
| Social Interaction | Community building and interaction among program participants |
Table 12.
Changes in the Physical Performance of Participants (N = 19).
| Variable | Pre | Mid | Post |
|---|---|---|---|
| Body weight (kg) | 58.09 ± 8.4 | 58.16 ± 8.24 | 57.72 ± 8.51 |
| BMI (kg/m ²) | 23.46 ± 2.79 | 23.37 ± 2.71 | 23.3 ± 2.88 |
| Skeletal muscle mass (kg) | 21.36 ± 3.22 | 21.57 ± 3.15 | 21.22 ± 2.91 |
| Body fat mass (kg) | 18.07 ± 4.48 | 17.7 ± 4.56 | 17.94 ± 5.1 |
| Body fat percentage (%) | 30.89 ± 4.85 | 30.25 ± 5.09 | 30.67 ± 5.52 |
* M ± SD.
Table 13.
Means and Standard Deviations of FTSST, FSST, and F8WT Scores (N = 19).
| Variable | Measure | Pre | Mid | Post |
|---|---|---|---|---|
| Lower-extremity muscle strength | FTSST | 9.99 ± 2.38 | 8.24 ± 1.69 | 8.48 ± 1.76 |
| Dynamic balance ability | FSST | 10.19 ± 2.19 | 8.37 ± 1.23 | 8.13 ± 1.38 |
| Curved walking ability | F8WT | 6.63 ± 1.12 | 5.86 ± 1.08 | 5.93 ±1.3 |
* M ± SD.
Table 14.
Repeated-Measures ANOVA Results for FTSST, FSST, and F8WT Scores (N = 19).
| Variable | Type III SS | df | MS | F | p |
|---|---|---|---|---|---|
| FTSST | 34.245 | 2 | 17.122 | 11.754 | < .001*** |
| FSST | 48.311 | 2 | 24.155 | 16.429 | < .001*** |
| F8WT | 6.867 | 2 | 3.434 | 10.938 | < .001*** |
* p < .05, **p < .01, ***p < .001.
Table 15.
Shapiro–Wilk Tests of Normality for Joint Angles and Angular Velocities (N = 19).
| Variable | Pre | Post |
|---|---|---|
| RoM | 0.004** | 0.778 |
| Vel RoM 25% | 0.404 | 0.775 |
| Vel time 25% | 0.280 | 0.290 |
| Vel RoM 50% | 0.305 | 0.384 |
| Vel time 50% | 0.920 | 0.632 |
| Vel RoM 75% | 0.902 | 0.047* |
| Vel time 75% | 0.026* | 0.406 |
* p < .05, **p < .01, ***p < .001.
Table 16.
Paired-Samples t-Tests for Joint Angles and Angular Velocities at 25% and 50% Phases (N = 19).
Table 16.
Paired-Samples t-Tests for Joint Angles and Angular Velocities at 25% and 50% Phases (N = 19).
| Variable | Pre | Post | t | df | p |
|---|---|---|---|---|---|
| Vel RoM 25% | 211.35 ± 63.05 | 217.53 ± 56.19 | −0.378 | 18 | 0.710 |
| Vel time: 25% | 130.26 ± 82.23 | 134.14 ± 74.48 | −0.253 | 18 | 0.803 |
| Vel RoM 50% | 210.33 ± 50.74 | 210.59 ± 56.76 | −0.023 | 18 | 0.982 |
| Vel time: 50% | 124.07 ± 60.9 | 158.36 ± 61.05 | −2.605 | 18 | 0.018* |
* p < .05, **p < .01, ***p < .001.
Table 17.
Wilcoxon Signed-Rank Tests for Overall Joint Angles and for Joint Angles and Angular Velocities at the 75% Phase (N = 19).
Table 17.
Wilcoxon Signed-Rank Tests for Overall Joint Angles and for Joint Angles and Angular Velocities at the 75% Phase (N = 19).
| Variable | Pre | Post | Z | p |
|---|---|---|---|---|
| RoM | 81.86 ± 12.82 | 83.29 ± 8.65 | −0.483 | 0.629 |
| Vel_RoM_75% | 125.12± 29.39 | 141.93 ± 33.33 | −1.811 | 0.07 |
| Vel_time_75% | 68.94 ± 52.55 | 72.33 ± 53.35 | −0.161 | 0.872 |
* p < .05, **p < .01, ***p < .001.
Table 18.
Paired-Samples t-Test Results for Pre–Post Cognitive Function (N = 19).
| Variable | Measure | Pre | Post | t | p |
|---|---|---|---|---|---|
| Cognitive Function | CIST | 25.47 ± 4.2 | 28 ± 1.91 | −2.808 | .012* |
* p < .05, **p < .01, ***p < .001.
Table 19.
Paired-Samples t-Test Results for Subdomains of Cognitive Function (N = 19).
| Variable | Pre | Post | t | p |
|---|---|---|---|---|
| Immediate Memory | 4.89 ± 0.45 | 5.0 ± 0 | −1.00 | 0.331 |
| Attention | 2.52 ± 0.61 | 2.57 ± 0.5 | −0.325 | 0.749 |
| Visuospatial Ability | 1.84 ± 0.5 | 1.68 ± 0.67 | 0.900 | 0.380 |
| Executive Function | 4.31 ± 1.0 | 5.36 ± 0.89 | −5.410 | < 0.001*** |
| Memory Recall | 8.21 ± 2.65 | 9.68 ± 0.89 | −2.384 | 0.028* |
| Language Ability | 3.63 ± 0.59 | 3.68 ± 0.47 | −0.567 | 0.578 |
* p < .05, **p < .01, ***p < .001.
Table 20.
Means and Standard Deviations of the Stroop Test (N = 19).
| Variable | Pre | Mid | Post |
|---|---|---|---|
| Word | 86.89 ± 11.37 | 93.95 ± 8.93 | 94.74 ± 9.42 |
| Color | 52.42 ± 13.07 | 61.32 ± 12 | 62.11 ± 12.8 |
| Word–Color Incongruent | 23.68 ± 7.59 | 28.84± 9.33 | 32.95 ± 11.28 |
* M ± SD.
Table 21.
Repeated-Measures ANOVA Results for the Stroop Test (N = 19).
| Variable | Type III SS | df | MS | F | p |
|---|---|---|---|---|---|
| Word | 708.456 | 2 | 354.228 | 10.96 | < 0.001*** |
| Color | 1244.316 | 2 | 622.158 | 15.028 | < 0.001*** |
| Word–Color Incongruent | 818.667 | 2 | 409.333 | 12.39 | < 0.001*** |
* p < .05, **p < .01, ***p < .001.
Table 22.
Structure of the Program Survey Items.
| Survey Items | Item Description | Number of Questionnaire Items |
|---|---|---|
| Usability | Items assessing program pace, comprehensibility, level of game difficulty, and the facilitator’s program delivery competence |
10 |
| Usefulness | Items comparing perceived improvements in physical and cognitive functions before and after the program |
3 |
| Safety | Items evaluating overall program safety | 1 |
| Sustainability | Items assessing willingness to participate in other programs and intention to recommend the program to others | 2 |
| Open-ended Questions | Open-ended items exploring motivation for program participation and factors influencing continued engagement | 2 |
*Scored on a 5-point Likert scale (excluding open-ended items).
Table 23.
Results of the Program Satisfaction Evaluation (N = 19).
| Survey Items | Post |
|---|---|
| Usability | 4.64 ± 0.63 |
| Usefulness | 4.7 ± 0.56 |
| Safety | 4.73 ± 0.45 |
| Sustainability | 4.64 ± 0.62 |
| Total | 4.66 |
* M ± SD.
Disclaimer/Publisher’s Note: The statements, opinions and data contained in all publications are solely those of the individual author(s) and contributor(s) and not of MDPI and/or the editor(s). MDPI and/or the editor(s) disclaim responsibility for any injury to people or property resulting from any ideas, methods, instructions or products referred to in the content. |
© 2026 by the authors. Licensee MDPI, Basel, Switzerland. This article is an open access article distributed under the terms and conditions of the Creative Commons Attribution (CC BY) license.
Copyright: This open access article is published under a Creative Commons CC BY 4.0 license, which permit the free download, distribution, and reuse, provided that the author and preprint are cited in any reuse.


