Submitted:
23 February 2026
Posted:
24 February 2026
You are already at the latest version
Abstract
This paper presents a nonlinear time-history re-assessment of an existing reinforced concrete (RC) frame building designed in 2007 according to the Romanian seismic code P100-1/2006 and re-checked against current seismic demand. Two three-dimensional solid finite-element models were developed in ANSYS: a bare RC frame and an RC frame with masonry infill panels. A distinctive feature is the explicit representation of longitudinal and transverse reinforcement embedded in the concrete solids, enabling direct tracking of steel stress demand and post-cracking load transfer. The models were subjected to bidirectional ground motions from the Vrancea 1977 and 1990 earthquakes and the Türkiye 2023 earthquake, scaled to match the P100-1/2013 target spectrum for the investigated site (a_g=0.40g). Modal analysis shows a clear stiffness increase due to infills, with the fundamental frequency rising from 4.4669 Hz (RC) to 5.8680 Hz (RC+M). Under the scaled records, infills substantially reduce global deformation demand: peak roof displacements in the transversal direction decrease from 9.87–14.26 mm (RC) to 2.74–3.38 mm (RC+M), and peak interstorey drift increments decrease from 3.35–4.94 mm to 0.92–1.16 mm, with drift ratios remaining well below conservative serviceability thresholds. Roof peak accelerations also decrease, reaching 0.490 g for RC versus 0.211 g for RC+M in the governing VN90 case. Base-reaction resultants and F_y–roof displacement loops confirm a stiffer global response with reduced displacement excursions for the infilled configuration. Local fields indicate that, in the bare frame, plastic strain concentrates at perimeter column bases and beam ends, while in the infilled model inelastic indicators shift toward masonry discontinuities around openings and panel corners; reinforcement demand peaks at beam ends, column bases, and the staircase region, consistent with torsional participation. The results highlight that masonry infills can strongly govern stiffness and drift demand at current design-level intensity, while introducing localised concentration zones that are relevant for performance assessment of existing buildings.
Keywords:
nonlinear time-history
; reinforced concrete frames
; masonry infills
; 3D solid FEM
; explicit reinforcement modelling
; Vrancea and Türkiye earthquakes
1. Introduction
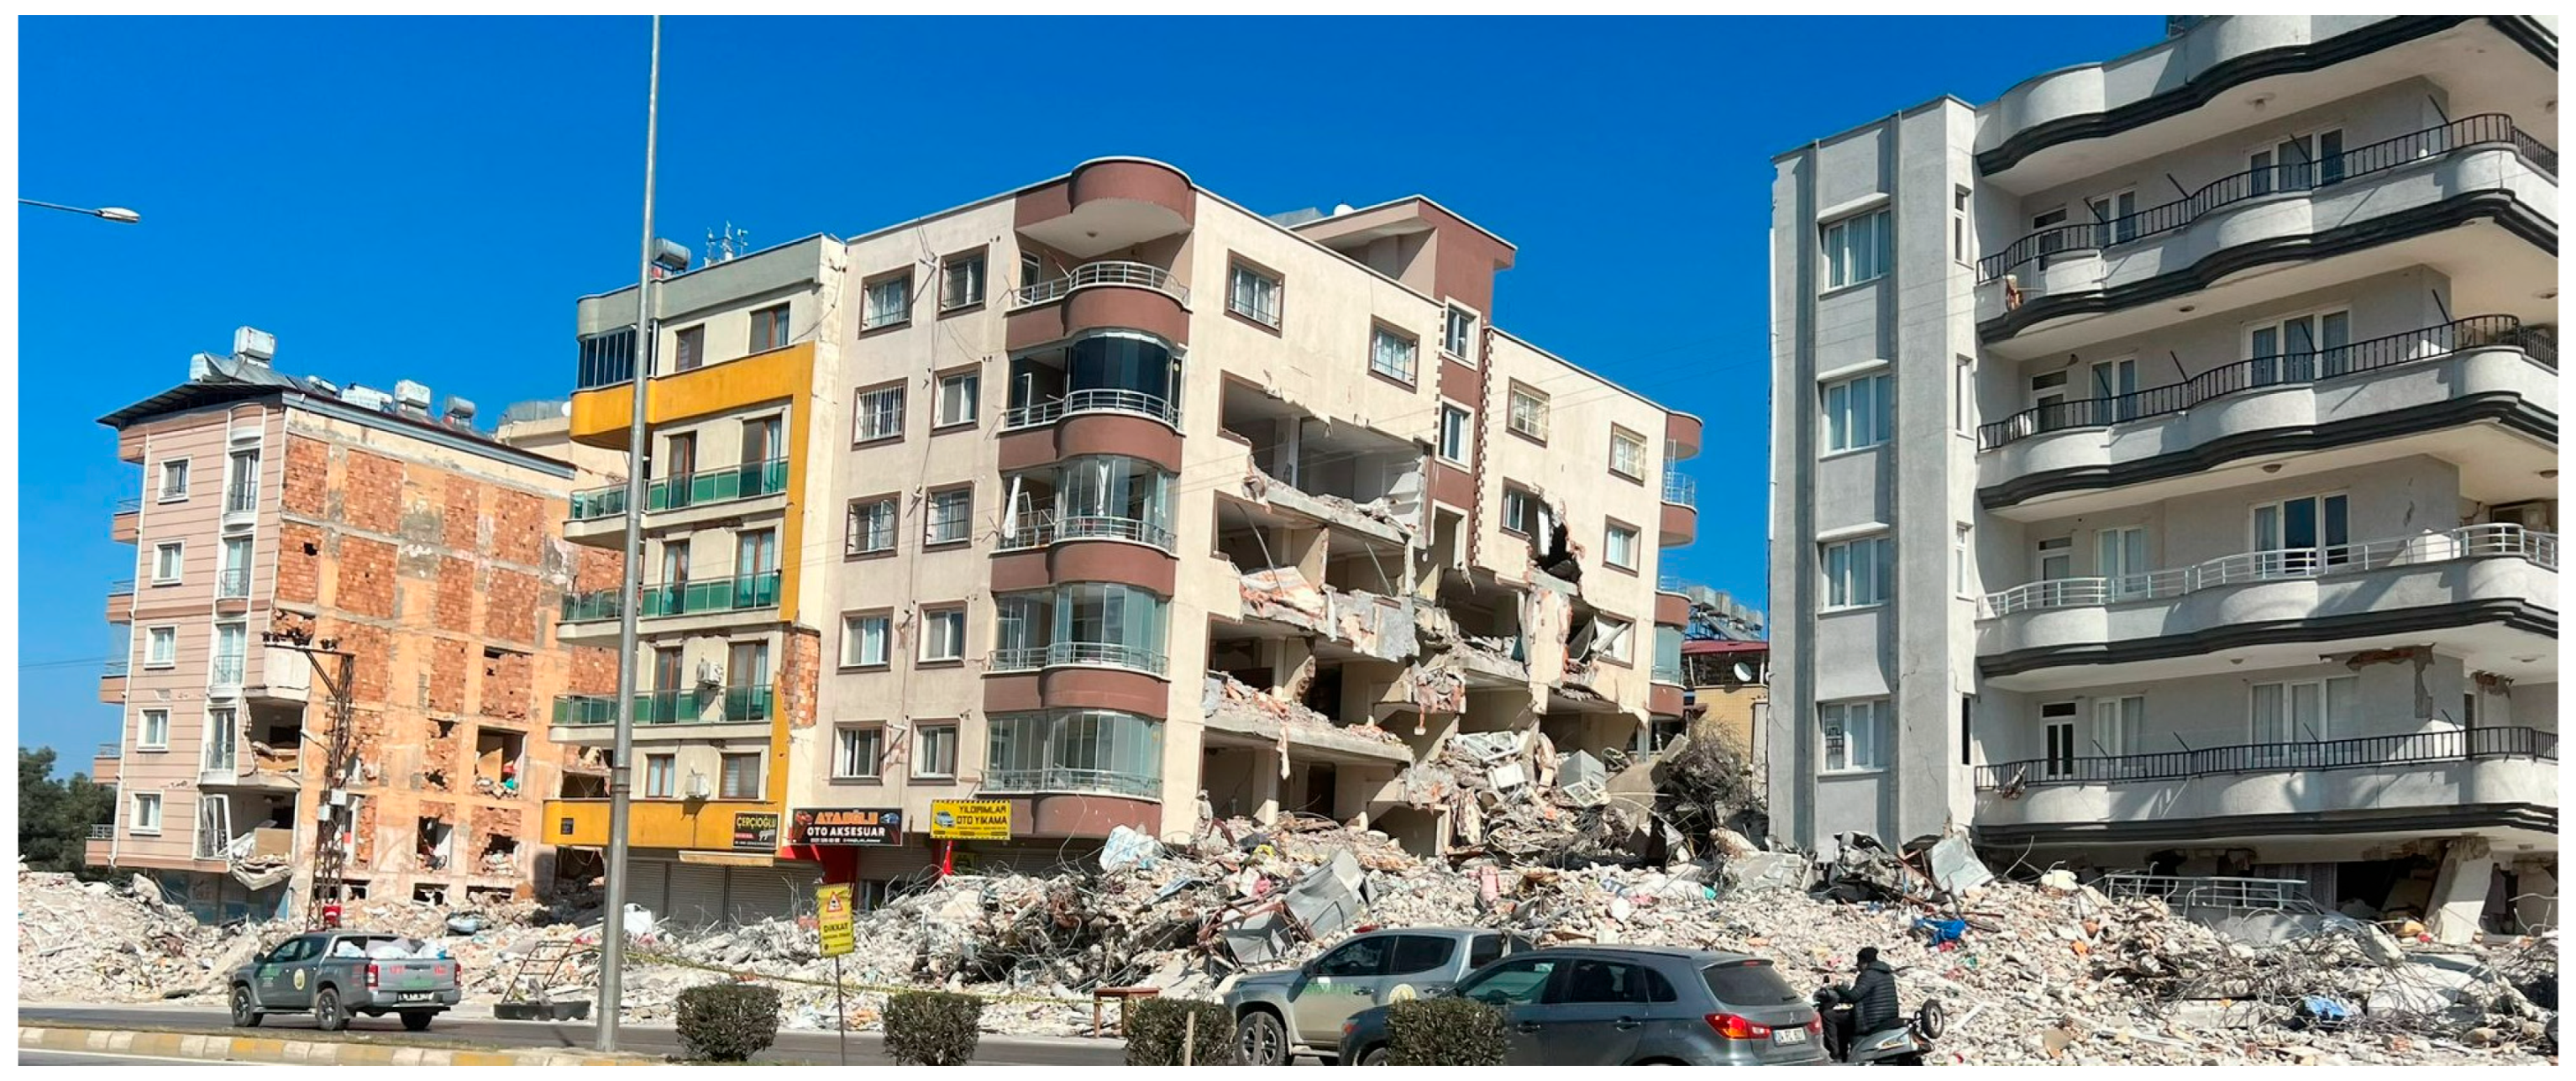
The seismic performance of reinforced concrete (RC) frame buildings with masonry infill walls remains a critical issue in regions exposed to strong ground motions, including Romania and Türkiye. The 4 March 1977 Vrancea earthquake caused widespread damage and collapse of RC buildings in Romania, highlighting the vulnerability of mid-rise frame structures with infill walls and limited ductile detailing [1,2,3]. More recently, the 6 February 2023 Kahramanmaraş earthquake sequence in Türkiye produced severe damage and collapse in many RC frame buildings with masonry infills, showing that this structural typology continues to dominate seismic risk in the current building stock [4,5,6]. Post-earthquake reconnaissance in Türkiye has repeatedly pointed to brittle infill failure, soft-story mechanisms, and inadequate confinement and detailing in RC members as frequent contributors to damage and collapse [4,5,6].
RC frames with masonry infills exhibit complex in-plane and out-of-plane seismic behaviour. Their response depends on infill strength and stiffness, opening layout, RC detailing quality, and the frame–infill interaction. In many older buildings, infills were ignored in structural models and treated as non-structural components, although they can significantly modify global dynamic response and damage distribution [7,8,9,10]. Research indicates that infills can increase lateral stiffness and strength and reduce global drifts. At the same time, they may induce short-column effects, torsional irregularities, and abrupt stiffness degradation after cracking and crushing [7,8,9,10]. Reviews and experimental–numerical studies therefore stress the need for reliable modelling strategies to capture these competing effects in performance-based assessment [7,8,9,10].
Over the last two decades, modelling approaches for masonry-infilled RC frames have ranged from equivalent diagonal strut models to detailed finite-element formulations [8,9,11,12]. Simplified macro-models support efficient nonlinear static or dynamic analyses in practice. More refined approaches aim to reproduce cracking, interface sliding, and possible out-of-plane failure modes [8,9,11,12]. Nonlinear static procedures and nonlinear time-history analyses have been used to study ductility capacity, strength degradation, and collapse mechanisms in prototype and existing infilled frames [11,12,13,14,15]. These studies show that including infills can lead to markedly different estimates of seismic demand than bare-frame models, especially for interstory drifts and the development of plastic mechanisms [11,12,13,14,15].
The influence of infill distribution and mechanical properties on global performance has also been widely investigated. Parametric and case-study analyses indicate that vertical or plan irregularities in infill layout can trigger soft-story or torsional mechanisms. Different masonry types and opening ratios can also modify capacity curves and fragility functions [16,17,18,19,20]. Large-scale experimental campaigns provide key evidence for calibration and validation, and they highlight the coupling between in-plane and out-of-plane actions and the tendency for damage concentration in specific stories [19,21]. These findings are particularly relevant for existing buildings not detailed according to modern capacity-design and confinement rules.
Despite the extensive literature, gaps remain for the seismic reassessment of existing RC frame buildings in Eastern Europe. Many studies address generic prototypes, low-rise buildings, or structures designed either without seismic provisions or according to international standards such as Eurocode 8. Fewer works focus on buildings designed to older Romanian provisions such as P100-1/2006, which still represent a substantial share of the current building stock [3,16]. Moreover, only a limited number of studies combine three-dimensional nonlinear time-history analysis of an actual multi-story building with explicit modelling of masonry infills, using recorded motions from both the 1977 Vrancea event and the 2023 Türkiye earthquakes for direct comparison [4,5,21,22]. The influence of infills on drift profiles and on the distribution of local demands in RC members under these two distinct seismotectonic scenarios is therefore not yet well quantified.
The present study addresses these issues through a nonlinear reassessment of an existing multi-story RC frame building designed in 2007 according to P100-1/2006 and located in a high-seismicity region of Romania. The building is analysed using detailed three-dimensional nonlinear finite-element models with and without masonry infills, subjected to recorded ground motions from the 1977 Vrancea earthquake and the 2023 Türkiye earthquake sequence. The time-history inputs are scaled to the current Romanian seismic hazard level (ag = 0.40 g, P100-1/2013), whereas the original 2007 design used ag = 0.32 g with a reduced design spectrum through a behaviour factor q = 4.5. By comparing four scenarios—bare and infilled frames under the two recorded motions—the study evaluates how infills modify the global and local response, including fundamental periods, base shear demand, interstory drifts, and the development of plastic mechanisms. The results are discussed in relation to observed damage in Romania and Türkiye and to recent research on infilled RC frames [4,5,6,7,11,12,13,14,15,16,17,18,19,20,21,22], with the aim of supporting seismic re-evaluation and retrofit decisions for buildings designed to earlier code generations.
The general historical discussion and fatality statistics are not repeated here, since the manuscript focuses on a mechanics-based comparison between code-era design assumptions and present-day nonlinear reassessment under updated hazard levels.
Figure 1.
Partially collapsed reinforced concrete apartment buildings with masonry infill walls, Gaziantep, Türkiye, February 2023.
Figure 1.
Partially collapsed reinforced concrete apartment buildings with masonry infill walls, Gaziantep, Türkiye, February 2023.
In Romania, seismic activity is largely controlled by the Vrancea intermediate-depth source. During the last century, several large Vrancea earthquakes with moment magnitude above 7 have affected the country. The 1940 event (Mw 7.6, focal depth about 150 km) caused 593 deaths, while the 1977 Vrancea earthquake (Mw 7.5) resulted in 1,578 fatalities [29,30,31]. Figure 2 illustrates representative examples of severe structural damage and partial collapse in Bucharest during the 1977 event [32,33]. The observed differences in casualties between earthquakes and across regions reflect a combination of factors, including magnitude and source characteristics, site effects, urban density, and the prevailing structural typology. Low-rise, horizontally spread building stocks generally imply lower occupant concentration per unit footprint than mid-rise apartment blocks. They can also lead to different damage patterns, because the dominant periods and failure mechanisms differ from those of multi-story RC frames with infills.
2. Case-Study Building and Original Seismic Design
The case-study structure is a social housing block with one basement, ground floor, two typical stories and a habitable attic (D+P+2E+M), located in Panciu (Vrancea County), in one of the highest seismic hazard zones of Romania. In the original design, the site parameters were taken as ag = 0.32 g and Tc = 1.0 s according to P100-1/2006. The building belongs to importance class C and importance–exposure class III (γI = 1.0) and was designed as a cast-in-place reinforced concrete (RC) frame system with medium ductility and behaviour factor q = 4.5 [35].
The load-bearing system consists of lamellar RC frames in both principal directions. Beams have a 25 × 60 cm cross-section, while columns include L-, T- and rectangular shapes, typically 25 cm in the minor dimension and 60–100 cm in the major one. Floors are solid RC slabs 20 cm thick, cast monolithically with the beams. The basement slab at −2.65 m is 10 cm thick, while stair flights are 13 cm thick and landings 15 cm thick. The roof is a timber pitched structure supported by RC ring beams at attic level. Foundations are continuous strip footings with RC pedestals at about −3.15 m. Footing widths are 1.60 m (reinforced concrete) and 2.20 m (plain concrete blocks), designed for a conventional bearing pressure of 150 kPa, with subgrade modulus ks ≈ 20,000 kN/m³.
The architectural layout is typical for Romanian social housing. The basement contains storage rooms, technical spaces, and circulation areas. The ground floor, upper stories, and attic contain apartments. In plan, the building comprises two 5.10 m bays and seven 3.30 m bays in the longitudinal direction, with a constant storey height of 2.85 m above the basement. Exterior walls are made of hollow ceramic masonry blocks with external thermal insulation. Interior partitions consist of masonry and gypsum-board walls on cold-formed steel studs with mineral wool infill. In the original structural model, these walls were considered only as gravity loads acting on the slabs and were not included as structural members in the seismic analysis.
Concrete class C16/20 (Bc 20) and reinforcing steel types PC52 and OB37 were specified throughout. The design followed NP 007-97 [36] for RC frames, STAS 10107/0-90 [37] for concrete members, CR0 and CR1-1-3 for actions, and the seismic code P100-1/2006 [38]. The structural analysis at the time of design was performed using ROBOT Millennium, assuming a bare-frame model with rigid diaphragms at slab levels. Modal response spectrum analysis was conducted using the P100-1/2006 design spectrum for the Vrancea region (ag = 0.32 g, Tc = 1.0 s). In this original design context, the seismic demand was reduced through the behaviour factor q = 4.5, consistent with code-based force design. For this value, the plateau spectral acceleration is of the order of Sd(T) ≈ 0.18 g in the period range relevant to the fundamental mode, leading to a design base shear of the order of 0.18 times the seismic weight in each principal direction. These values are reported to document the original force-based design assumptions and should not be interpreted as direct predictors of nonlinear time-history demand.
Figure 3 documents key construction stages and provides visual confirmation of the executed configuration and materials. The images show the slab and beam reinforcement prior to concreting, the erection of RC frames, and the progressive construction of hollow clay masonry infill walls between columns and beams. The final images illustrate completed infills with openings, balcony and stair-core detailing, and the installation of the timber roof structure. These photographs are used primarily as qualitative evidence of the presence, extent, and construction sequence of the infills, which later motivates their explicit inclusion in the nonlinear finite-element models.
The foundations consist of continuous strip footings and pedestals under the main columns, as detailed in the foundation plan in Figure 4. Footing widths range between 1.60 m and 2.20 m, depending on column loads and soil bearing capacity. The typical floor formwork plan in Figure 5 shows the arrangement of beams and solid slabs, including stair-core and balcony openings, and was used to verify consistency between architectural and structural layouts and to define tributary areas for gravity loads.
Table 1 summarises the main subsystems and materials as specified in the original design and clarifies their role in the original analytical model. For the later nonlinear reassessment, the same material classes are retained as a starting point, while nonlinear constitutive laws are introduced for concrete and explicit reinforcement representations are adopted, consistent with the objectives of time-history simulation.
3. Seismic Actions and Ground Motion Selection
The case-study building is located in the Vrancea seismic region, which controls the hazard for most of Romania. Intermediate-depth events, with focal depths typically between 70 and 150 km, generate long-period motions that can strongly affect mid-rise reinforced concrete frame buildings over large areas, including Bucharest and eastern Romania. The current Romanian seismic code P100-1/2013 specifies the design ground acceleration and elastic response spectrum for this source. For the investigated site, the code parameters are and corner period . These parameters define the target elastic spectrum used to scale the selected ground-motion records for the nonlinear time-history analyses.
3.1 Overview of the selected earthquakes
Three recorded earthquakes were considered to represent two distinct seismotectonic scenarios: intermediate-depth Vrancea motions (1977 and 1990) and shallow crustal strike-slip motions from the 2023 Türkiye sequence. The inclusion of both 1977 and 1990 aims to capture the record-to-record variability within the Vrancea source while maintaining a consistent scaling target.
The first event is the 4 March 1977 Vrancea earthquake. This intermediate-depth shock had a moment magnitude in the range 7.4–7.5 and a focal depth of about 85–95 km [39]. It produced the most severe earthquake damage recorded in modern Romanian history, with 1,578 fatalities in Romania and widespread collapses of mid-rise reinforced concrete frame buildings with masonry infills [39]. The 1977 event led to a major revision of the national seismic regulations and remains a reference scenario for the Vrancea region.
The second event is the 30–31 May 1990 Vrancea earthquake sequence. According to the National Institute for Earth Physics and subsequent syntheses, the main shocks had magnitudes and 6.4 and focal depths around 90 km [39]. Peak intensities reached VIII in the epicentral area and about VII in Bucharest, with moderate structural damage and limited casualties compared with 1977. Although less destructive, the 1990 sequence is the strongest Vrancea event after 1977 and provides an additional strong-motion sample from the same intermediate-depth source.
The third event is the 6 February 2023 Kahramanmaraş–Gaziantep earthquake in Türkiye. The first main shock had and was followed about nine hours later by a second event of [40]. The earthquakes were generated by shallow strike-slip faulting and produced very high ground accelerations and widespread collapse of reinforced concrete frame buildings with unreinforced masonry infills in southern Türkiye and northern Syria, with more than 50,000 fatalities [40]. The structural typologies and failure mechanisms observed in the affected area resemble those of many Romanian residential buildings, making this sequence relevant for comparative assessment under a different seismotectonic environment.
3.2 Strong-Motion Records
For each earthquake, one accelerogram recorded on stiff soil was selected from the Engineering Strong-Motion (ESM) database, which provides uniformly processed waveforms and metadata for the Euro-Mediterranean region [39]. The selected records are:
- Vrancea 1977: station A39 (Romania), event RO-1977-0001, two horizontal components (HN-N and HN-E).
- Vrancea 1990: station A1856 (Romania), event RO-1990-0003, two horizontal components (HN2 and HN3).
- Türkiye 2023: station 3138 (network TK), event INT-20230206_0000008, two horizontal components (HNN and HNE).
The raw peak ground accelerations at the recording sites are approximately 0.17–0.20 g for Vrancea 1977, 0.08–0.19 g for Vrancea 1990, and 0.75–0.90 g for the 2023 Türkiye record in the horizontal directions (values from the processed ESM records used in this study). Only the two horizontal components were considered in the structural analyses, consistent with common code practice for ordinary buildings, where vertical action is typically checked separately. The components were applied simultaneously along the global X and Y axes of the numerical models.
Each pair of horizontal components was scaled using a single factor so that the resulting response spectrum matches the P100-1/2013 target elastic spectrum defined by and over the selected period range. This scaling ensures a consistent intensity level for comparing the response under different records and structural configurations. Figure 6 shows the scaled acceleration time histories of the selected records, for both horizontal components (N–S and E–W). The plots highlight the different duration and pulse content of the Vrancea and Türkiye motions, while maintaining a consistent intensity level after scaling.
3.3. Record Processing and Spectral Scaling
All accelerograms were downloaded in processed form from ESM, then re-processed using the online ITACA/ESM tools to ensure a consistent procedure. A causal band-pass filter with cut-off frequencies 0.2–25 Hz was adopted for all components, following common practice for building-scale analyses in the Euro-Mediterranean region. The records were then re-sampled to a constant time step Δt = 0.005 s, compatible with the integration requirements of the nonlinear time-history analyses.
Each pair of horizontal components was scaled by a single factor so that the geometric-mean, 5%-damped elastic response spectrum matches, in an average least-squares sense, the P100-1/2013 elastic target spectrum for the considered site over the period range 0.1–2.0 s. This range covers the fundamental and higher-mode periods of the investigated RC frame building. The target spectrum corresponds to the local site conditions and the building importance category, with ag = 0.40 g and Tc = 1.0 s, while the remaining spectral parameters follow the code definitions. Figure 7 compares the resulting record spectra with the P100-1/2013 elastic target and, for reference, with the P100-1/2006 design and elastic spectra.
After scaling, the spectral ordinates of the selected records in the period range of interest become comparable and consistent with the design level prescribed by P100-1/2013. The scaled acceleration time histories for the N–S and E–W components of the three events are shown in Figure 8. The effective durations of strong shaking are about 20 s for the Vrancea 1977 record, 18 s for Vrancea 1990, and 15 s for the Türkiye 2023 motion, reflecting the intermediate-depth versus shallow crustal source characteristics.
3.4. Justification of the Selected Suite
The selected suite of three scaled records is intended to represent two seismotectonic environments that are relevant for reinforced concrete frame buildings with masonry infills. Two motions (Vrancea 1977 and Vrancea 1990) capture the characteristic features of the Vrancea intermediate-depth source, which governs the seismic hazard over large areas of Romania. The third motion (Türkiye 2023) represents a strong shallow crustal earthquake, included to explore how a different source mechanism and waveform characteristics may affect Romanian-type frame buildings under the same intensity level.
The Vrancea 1977 record represents the reference major event that strongly influenced the evolution of Romanian seismic regulations and produced severe damage in building typologies comparable to the case-study structure. The Vrancea 1990 record corresponds to the strongest Vrancea event after 1977 and provides an additional sample from the same source, representative of a lower-magnitude but more frequent scenario that can still generate significant shaking in Bucharest and other urban areas.
The 2023 Türkiye record introduces a different tectonic context, with shallow strike-slip faulting and waveform features often associated with near-fault effects, including pronounced velocity pulses and relatively shorter effective durations. This event is considered because it caused extensive collapse of reinforced concrete frame buildings with unreinforced masonry infills, which share key vulnerability drivers with many residential buildings in Romania. By scaling all records to the same P100-1/2013 elastic target spectrum, the influence of record-to-record differences in frequency content, duration, and cumulative hysteretic demand on the nonlinear seismic response of the building can be assessed in a consistent framework.
4. Numerical Modelling and Analysis Procedure
The seismic response of the case-study building was analysed in ANSYS using detailed three-dimensional finite-element models. The objective was to obtain nonlinear response-history results able to represent stiffness degradation, force redistribution, and reinforcement activation after concrete cracking. The load-bearing RC members (beams, columns, slabs, and stair flights) were modelled with 3D solid elements. Two structural configurations were investigated: a bare RC frame and an infilled RC frame, in which masonry panels were introduced in the corresponding bays.
Two analysis levels were used. The first level was intended as a verification step for global dynamic characteristics. The second level provided the final nonlinear time-history response.
- Approach 1 (verification). A modal-based transient workflow was used to check fundamental periods, mode shapes, and global mass participation. This step served as a consistency check of the 3D FE idealisation and as a benchmark against the linear elastic reference model. Because the response is obtained through modal superposition, the dynamic response remains essentially linear, even if nonlinear constitutive laws are assigned at material level.
- Approach 2 (final). Nonlinear transient time-history analyses were performed by direct time integration. In this approach, nonlinear constitutive laws were activated and reinforcement was introduced explicitly using ANSYS reinforcement capabilities, so that the post-cracking load transfer to steel is represented in a physically consistent manner.
4.1. Linear Elastic Reference Model in Robot
The original design model prepared in 2007 was developed in Robot Structural Analysis. Beams and columns were represented by frame elements, while floor slabs were assumed to act as rigid diaphragms. The model was used for code-based checks according to P100-1/2006.
In the present study, the same Robot model was recomputed using the elastic response spectrum of P100-1/2013, while keeping the original member cross-sections. The resulting fundamental periods and principal mode shapes served as reference values for the ANSYS models. Linear response-spectrum indicators, such as base-shear and interstorey drift demand, are used later only as a baseline for interpreting the nonlinear time-history results.
4.2. Nonlinear 3D Model in ANSYS
The three-dimensional ANSYS model reproduces the geometry of the building above the basement slab. Only the superstructure was modelled. The real building includes a basement level with reinforced concrete perimeter walls, which was not represented explicitly. Instead, the slab above the basement was adopted as the support plane. All nodes at this level were fully restrained, corresponding to a fixed-base condition provided by a stiff basement box. This idealisation neglects soil–structure interaction and potential basement flexibility effects.
Figure 8 illustrates the numerical geometry used in the analyses. Figure 8a shows the discrete reinforcement layout for the RC members, represented through embedded bar reinforcement. Figure 8b shows the concrete solids for beams, columns, slabs, and stairs in the bare-frame configuration. Figure 8c presents the complete infilled-frame model, where masonry panels are included in the corresponding bays.
Concrete beams, columns, slabs, and stair flights were discretised with three-dimensional solid finite elements (ANSYS SOLID186). Local mesh refinement was introduced in beam–column joint regions, around slab–beam intersections, and in the staircase core to capture stress gradients while keeping the global model size tractable for nonlinear response-history analyses. For the bare RC frame model, the global mesh was generated with a nominal element size of 200 mm, resulting in 581,913 nodes and 261,341 solid elements. For the infilled configuration (RC+M), the discretisation was extended to the masonry panels; the executed model contains 295,765 solid elements and 1,017,386 nodes, reflecting the increased computational demand associated with the frame–infill interfaces. A coarser discretisation was retained in regions with smoother stress fields to maintain feasible runtimes for nonlinear time-history analyses. Self-weight was included through material density. Additional permanent loads from finishes and partitions were applied as surface loads on slab elements.
Material models and key parameters adopted in ANSYS for concrete, masonry infills, and reinforcement are summarized in Table 3. Concrete nonlinear behaviour was represented using a Drucker–Prager plasticity model, with compressive and tensile strengths defined from the specified material class and a tension cut-off based on the uniaxial tensile strength. This constitutive choice was adopted to obtain stable nonlinear response under cyclic loading with a limited set of parameters, consistent with full-building solid modelling. Two reinforcement representations were used, consistent with the two analysis levels. In the verification step, reinforcement was not introduced explicitly and the model was used primarily to check global dynamic characteristics. In the final nonlinear analyses, longitudinal and transverse reinforcement was introduced explicitly using embedded reinforcement capabilities in ANSYS. Reinforcing steels (PC52 and OB37) were modelled with a multilinear isotropic hardening law, and demand was evaluated using von Mises equivalent stress. This explicit reinforcement representation is required once concrete enters cracking and crushing regimes, because it enables a realistic post-cracking load transfer to steel and allows direct tracking of steel stress demand, avoiding an unrealistically brittle loss of lateral resistance.
4.3. Nonlinear Infilled-Frame Model
The infill-to-frame interaction was modelled using bonded surface-to-surface contact. This assumption reflects the construction sequence of the case-study building, where concrete was cast after the masonry panels were already in place, leading to an extensive interface engagement that was idealised as fully bonded in the numerical model. As a result, no separation or sliding was allowed at the interface, and both compression and shear were transferred through the bonded contact. This modelling choice tends to increase the initial stiffness of the infilled system and should be regarded as a simplifying assumption for global response prediction.
Masonry infill panels were modelled as continuum solids governed by the same Drucker–Prager framework, using reduced stiffness and strength parameters representative of hollow ceramic masonry. The uniaxial compressive strength, tensile strength, and biaxial compressive strength were taken as , , and , respectively, with linear elastic properties and . The nonlinear direct-integration analyses performed for the bare-frame model were then repeated for the infilled configuration under the same set of scaled ground motions, in order to isolate the influence of the masonry panels on both global response and local demand in RC members and reinforcement.
4.4. Damping, Numerical Integration and Loading Protocol
Rayleigh damping was adopted in all transient analyses. The Rayleigh coefficients were calibrated from the eigenvalue analyses of each structural configuration, because the modal properties differ between the bare RC frame and the infilled frame. For the infilled model, the first six eigenfrequencies range from 5.868 to 16.169 Hz, while for the bare RC-frame model (with discrete reinforcement) they range from 4.467 to 14.25 Hz. In both cases, the low-order modes capture a substantial fraction of the effective translational mass (cumulative fractions ≈0.81–0.84 in X and Y).
Rayleigh damping was adopted using mass- and stiffness-proportional terms. The modal damping ratio is given by:
where is the mass-proportional coefficient , is the stiffness-proportional coefficient , and is the circular frequency. In the executed ANSYS model, the coefficients were introduced as and , calibrated to provide approximately 5% damping in the low-mode range governing the global response. The coefficients and were obtained by imposing for two selected modal frequencies.
Nonlinear time-history analyses were performed using implicit direct time integration. For the bare RC frame model, a constant time step was adopted over an analysis step end time of 15/ 18/ 20 s. For the infilled configuration (RC+M), automatic time stepping was enabled, with an initial time step , a minimum time step of 0.001 s, and a maximum time step of 0.05 s, to improve robustness when stiffness changes occur due to the frame–infill interaction. A direct solver was used. Geometric nonlinearity was activated (large deflection: On). Nonlinear equilibrium iterations were performed using a Full Newton–Raphson scheme with line search enabled, while stabilization was kept off. Force convergence was activated with a tolerance of 5% and a minimum reference force of 1 N, whereas the remaining convergence checks (moment, displacement, rotation, and energy) were left program-controlled.
Permanent actions were applied prior to the seismic excitation. Self-weight was introduced through standard earth gravity using the material densities defined for concrete, reinforcement, and masonry. Non-structural permanent actions (finishes and partitions) were introduced at slab level in two consistent forms: as additional distributed mass and as uniformly distributed permanent pressure loads. The adopted equivalent floor masses were for the bare RC-frame model and for the infilled-frame model; the same values were also applied as permanent slab pressures to define the gravity pre-step state used to start the transient analyses.
The seismic input was then imposed as base acceleration at the restrained support plane (the slab above the basement), with the two horizontal components applied simultaneously along the global X and Y axes. For each structural configuration (bare and infilled), three ground-motion cases were analysed (Vrancea 1977, Vrancea 1990, and Türkiye 2023), and each record was scaled to the target intensity level as described in Section 3.
4.5. Response Quantities and Post-Processing
The response assessment was performed consistently for both structural configurations (bare RC frame and RC frame with masonry infill) and for all three input motions (Vrancea 1977, Vrancea 1990, and Türkiye 2023), scaled to . The global coordinate system follows the numerical model convention. The X axis is the longitudinal building direction and the Y axis is the transversal direction. The two horizontal acceleration components were applied simultaneously along X and Y.
The primary kinematic outputs were storey displacements and interstorey drifts along the transversal direction, because the lateral response discussed in this section refers to Y. Absolute nodal displacements were extracted at representative points for the basement and each storey. The reporting levels are denoted as , and roof (level 4). Interstorey drift histories were computed from displacement differences between consecutive levels as:
The corresponding drift ratios were obtained as:
where for all storeys except the top level. For the fourth level, the storey height was 4.00m.
Global force–deformation behaviour was quantified through base shear–roof displacement hysteresis loops. The base shear in the transversal direction, , was taken from the reaction force at the fixed support plane, consistent with the global axes shown in the model. The roof displacement was the total displacement at level 4 along Y. The hysteresis curves – were plotted for each analysis case to compare stiffness, strength, and energy dissipation between the bare and infilled frames.
Peak demand measures were reported using absolute maxima over the full record. For each response history , the peak was defined as . The reported peaks were:
where is the base moment component taken from the support reactions, in the global system, consistent with the transversal action effects. Alongside these peak values, the raw time histories were retained for traceability and for identifying the time instants associated with peak responses.
To characterise the nonlinear response mechanisms, field outputs were extracted at the time instants associated with critical peaks and were reported as contour plots. The adopted fields included maximum and minimum principal stresses in the continuum materials, equivalent plastic strain as an indicator of inelastic demand, and reinforcement stress measures for the steel bars. Reinforcement demand was reported through peak stresses in the steel domains, to highlight the most stressed zones under each ground motion and to enable direct comparisons between the bare and infilled configurations. These plots were complemented by the displacement fields along X and Y, to confirm the deformation patterns and the directional consistency of the response.
All outputs were extracted in a consistent manner across cases, using the same level definitions, sign conventions, and peak metrics. This ensured that differences between RC and RC+M models reflect physical effects of stiffness, mass, and interaction mechanisms, rather than changes in post-processing rules.
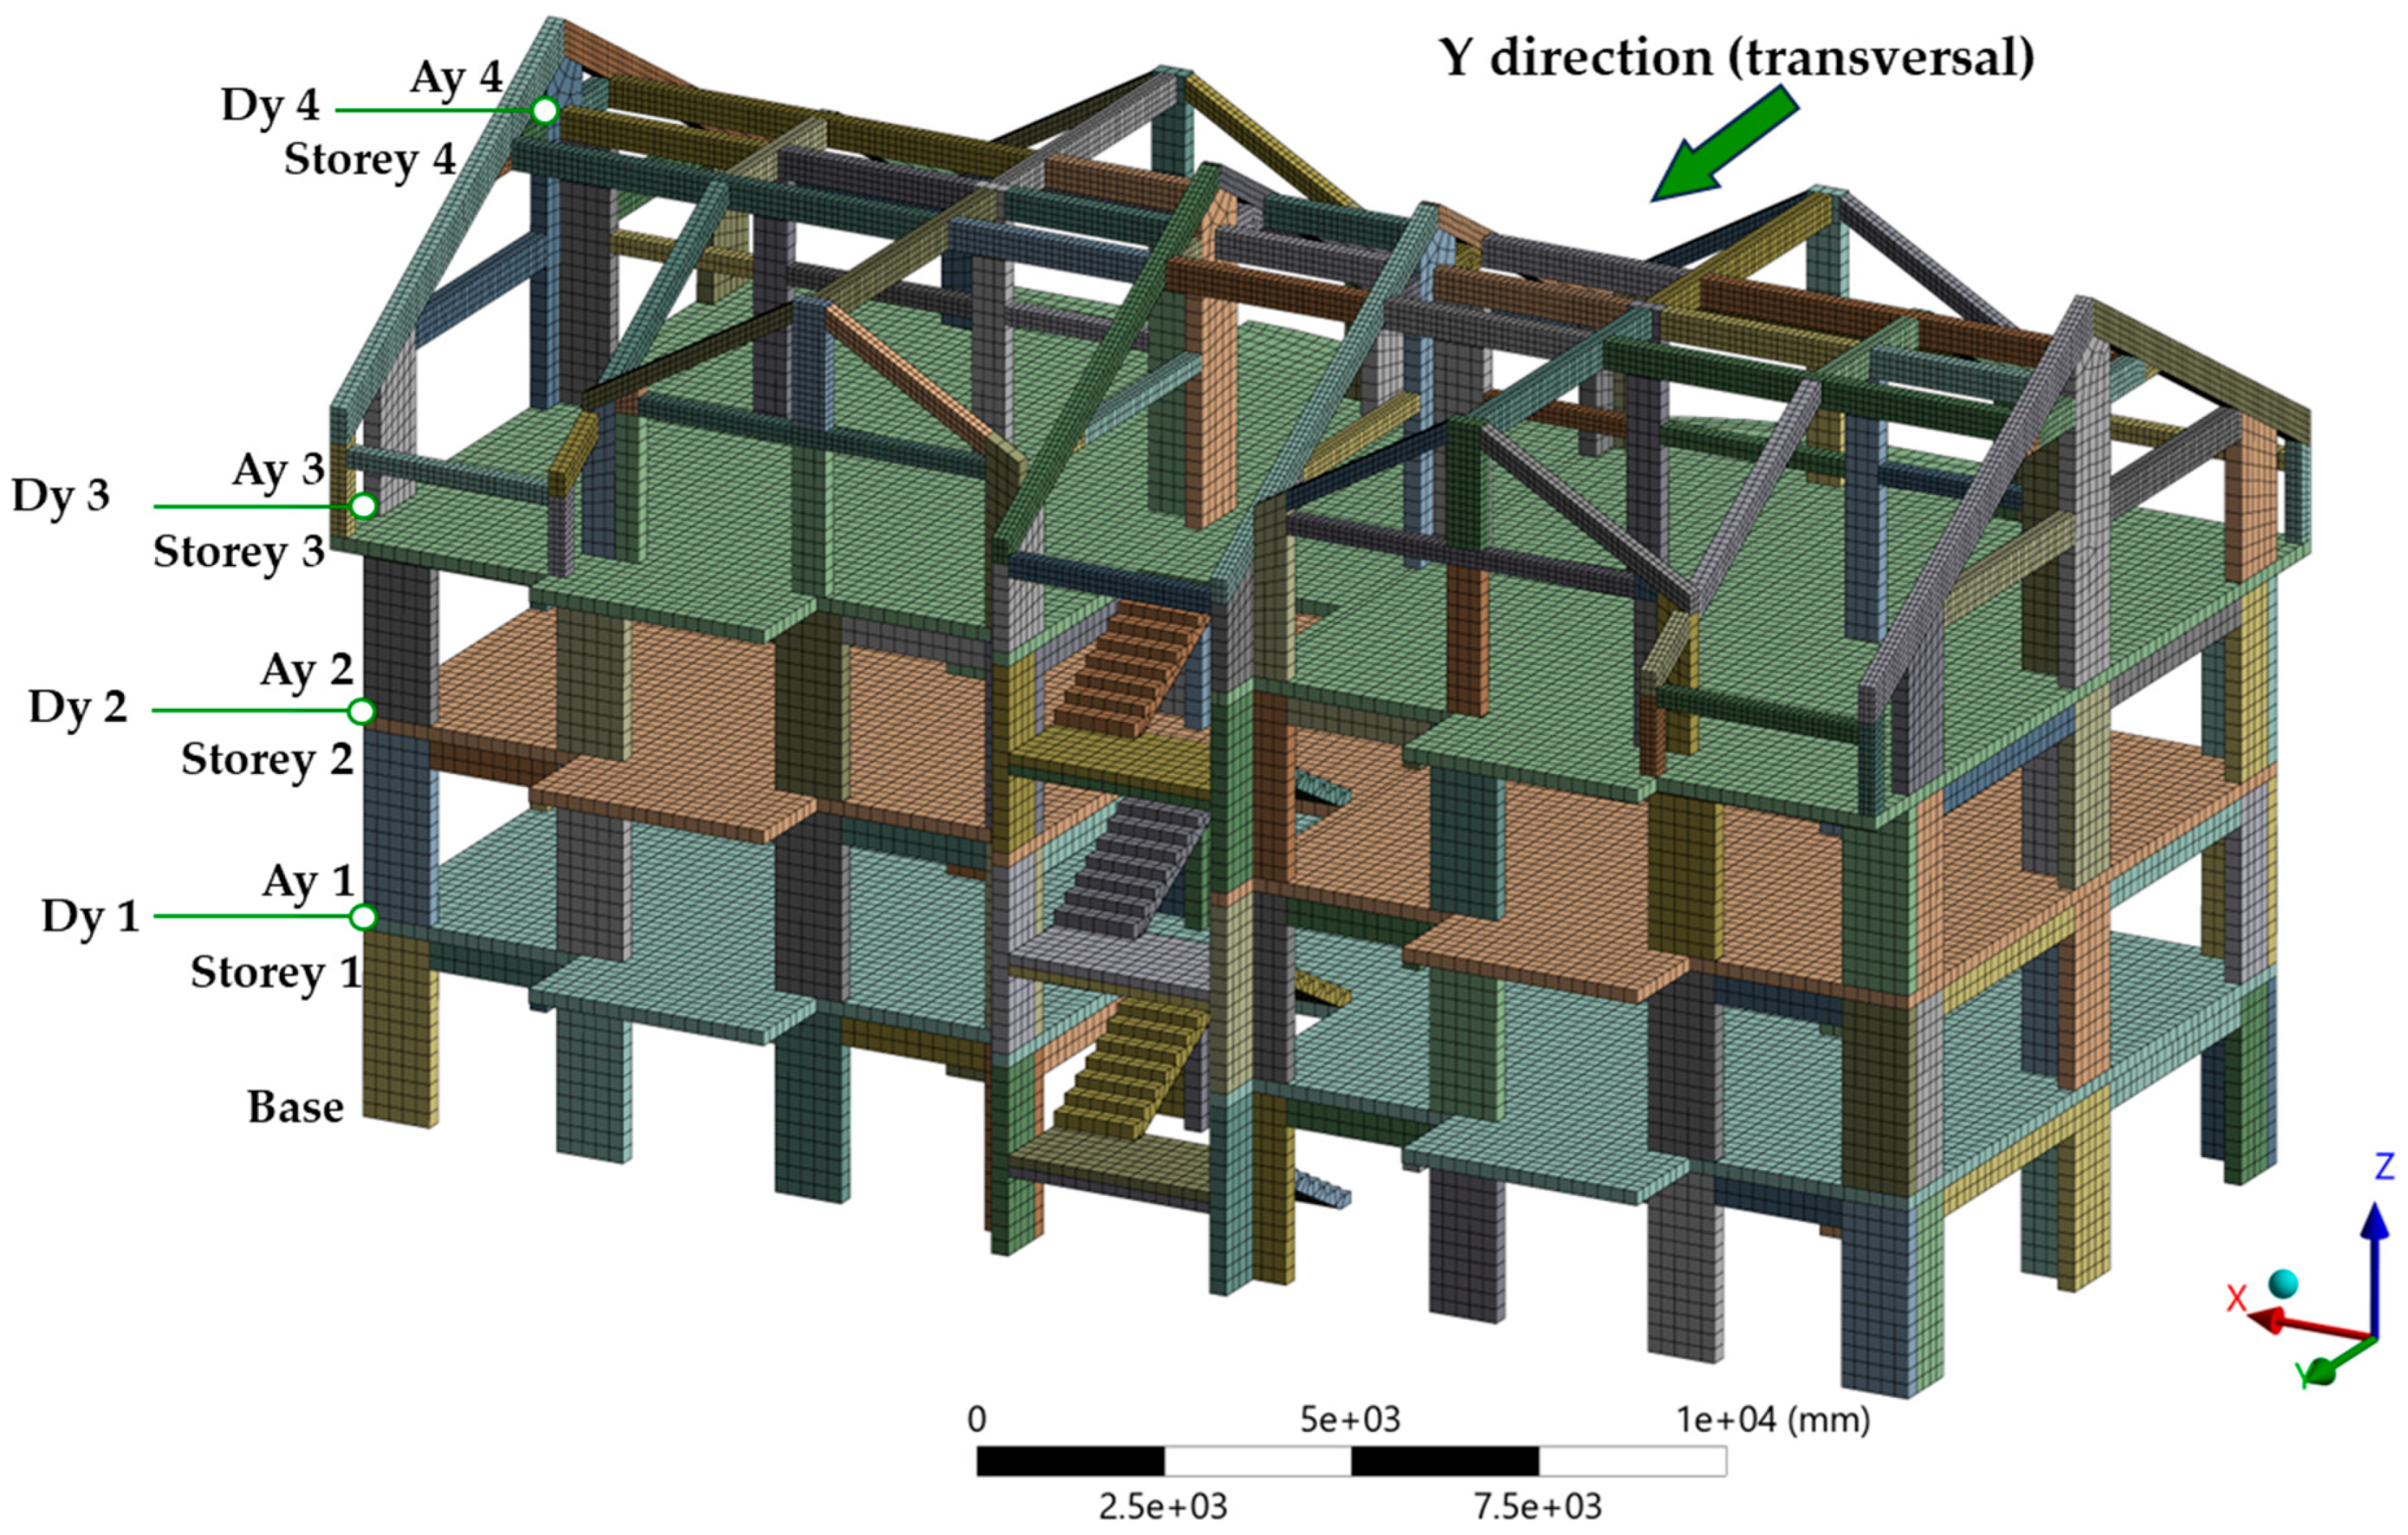
As illustrated in Figure 9, response quantities were extracted at predefined points along the building height in the global coordinate system (X longitudinal, Y transversal). The results reported in Section 5 refer to the transversal response (Y) at these locations.
Figure 10.
FE model showing the global coordinate system and the marked points used to extract transversal (Y) displacements and accelerations.
Figure 10.
FE model showing the global coordinate system and the marked points used to extract transversal (Y) displacements and accelerations.
5. Results and Discussion
All response quantities were extracted consistently with the global axes used in the FE model, with X = longitudinal and Y = transversal. The two horizontal components were applied simultaneously. The results below focus on the transversal (Y) response, because it governs the reported base shear–roof displacement hysteresis and the interstorey drift checks.
5.1. Modal analysis results
A linear eigenvalue (modal) analysis was first performed for both structural configurations to characterise the dynamic properties that govern the subsequent nonlinear time-history response. The same global coordinate system was used as in the transient analyses, with X taken as the longitudinal direction and Y as the transversal direction. Modal properties are reported in terms of natural frequency, period, and translational mass participation in X and Y.
Table 4 summarises the first three modes for the bare RC frame and the infilled configuration (RC+M). The periods were computed as . For the bare RC frame, the first three natural frequencies were 4.4669 Hz, 5.5851 Hz, and 6.7955 Hz, corresponding to periods of 0.2239 s, 0.1790 s, and 0.1472 s. For RC+M, the corresponding frequencies increased to 5.8680 Hz, 6.9433 Hz, and 7.5634 Hz, with periods of 0.1704 s, 0.1440 s, and 0.1322 s. This systematic increase indicates a higher global stiffness when masonry infill panels are included, as expected from the added in-plane stiffness and the interaction between infills and the RC frame.
The effective modal mass confirms that the response is dominated by global translations in the low modes. Mode 1 is primarily a transversal (Y) translation for both models, with effective mass of about 939.35 t (RC) and 945.16 t (RC+M), and corresponding Y mass ratios of 0.784 and 0.776. Mode 3 is primarily a longitudinal (X) translation, with effective mass of about 914.91 t (RC) and 918.73 t (RC+M), and X mass ratios of 0.764 and 0.754. Mode 2 is torsional, which is reflected by its comparatively small translational mass ratios in both directions. Therefore, the dominant lateral translational behaviour is captured by modes 1 and 3, while mode 2 mainly describes twisting of the structural system.
Figure 11 shows the first three mode shapes (total deformation) for both models. The deformed shapes are consistent with the mass-participation results, with a predominantly translational fundamental mode, a torsional second mode, and a higher translational mode in the orthogonal direction. These modal characteristics provide the baseline for interpreting the differences observed later in roof displacement, interstorey drift, and base reaction demands under the bidirectional seismic input.
5.2 Peak Displacements and Interstorey Drifts (Y Direction)
The peak lateral response was evaluated along the transversal direction (Y) using floor displacements relative to the base, , extracted at the reporting levels , , , , and roof . Interstorey drift increments and drift ratios were computed as defined in Section 4.5. The discussion below focuses on the governing storeys – and –, for which the storey height is .
Table 5 summarises the peak roof displacement , the maximum drift increment , the governing storey where occurs, and the resulting peak drift ratio . The infilled configuration (RC+M) exhibits a marked reduction in both and for all three input motions. The largest demand occurs for VN90, where the bare RC frame reaches and , while RC+M remains limited to and . Using the admissible drift limits typically adopted from P100-1/2013 (SLS and ULS , reported here as conservative reference values), all computed drifts remain well below both thresholds.
The deformation patterns at the time instant corresponding to the peak roof response confirm the global sway behaviour in the Y direction. For the bare RC frame, the displacement contours show a more flexible response with larger storey translations and a clearer drift concentration in the lower storeys, consistent with the governing – drift increments reported in Table 5 (Figure 12). In contrast, the RC+M configuration develops a stiffer global response, with reduced displacement amplitudes and a more restrained deformation field due to the in-plane contribution of the masonry infills (Figure 13).
The peak displacement profiles along height provide a compact comparison across all records (Figure 14). For each motion, the peak transversal displacement increases monotonically from to , which indicates sway-dominated response. The RC+M curves remain clustered in a narrow band, with roof peaks limited to about 2.7–3.4 mm, while the bare RC frame reaches about 9.9–14.3 mm. The separation between the RC and RC+M profiles at every level quantifies the stiffness increase introduced by the infills and explains the reduction in drift demand reported in Table 5.
For completeness, Figure 15 compares the roof displacement time histories (Dy4, Y) for both configurations and all three records, illustrating the consistent amplitude reduction produced by the infills, most pronounced for VN90.
5.3 Peak Floor Accelerations (Y Direction)
Peak absolute accelerations in the transversal direction were extracted at the same reporting levels used for displacements, namely Base (B), S1, S2, S3, and roof R. For each record and level, the reported value is the absolute maximum of the acceleration time history, , evaluated over the full record duration.
Table 6 summarises the results in both mm/s2 and . A consistent height amplification is observed for both structural configurations, with the roof governing the peak accelerations in all cases. For the infilled configuration (RC+M), the roof peaks range from 710 to 2068 mm/s2 (0.072–0.211 g), depending on the input record. For the bare frame (RC), the roof demand is substantially higher, reaching 4801 mm/s2 (0.490 g) under VN90. This trend is consistent with the displacement results, where the bare frame shows a more flexible global response and therefore develops larger vibration amplitudes under the same bidirectional excitation, while the masonry infills increase lateral stiffness and reduce global sway and associated acceleration amplification.
Figure 16 compares the roof acceleration histories (Ay4) for RC and RC+M under VN77, VN90, and TK2023 (0.4 g scaled). The VN90 input produces the largest roof accelerations, and the reduction provided by infills is visible as a clear drop in peak amplitudes and a narrower response envelope for RC+M across all three records.
5.4. Base Reactions and Global Force–Deformation Response
The global lateral behaviour was further assessed using (i) the support reactions at the fixed base and (ii) base shear–roof displacement hysteresis loops in the transversal direction. The base shear, , was taken from the reaction resultants at the constrained support component, consistent with the global axes. The roof displacement was taken as the Y-direction displacement at level R (Dy4). The –Dy4 loops (Figure 17) provide a compact measure of global stiffness, strength demand, and energy dissipation under the bidirectional input.
Figure 17 shows that the bare RC frame develops substantially larger lateral excursions, with wider loops and a lower initial slope, indicating a more flexible global response. The infilled configuration (RC+M) exhibits a much steeper response with markedly reduced displacement demand, and the loops remain narrow, consistent with the increased in-plane stiffness contribution of the masonry infills. Differences in loop shape between records reflect the frequency content and duration of the input, while the overall separation between RC and RC+M remains systematic, confirming the dominant role of infills in controlling global translations and drift demand.
Table 7 reports the extreme (signed) reaction components extracted from the transient analyses. The vertical reaction remains practically constant across records for each model, reflecting the dominant gravity contribution and the constraint conditions at the base. The transversal base shear component reaches the largest absolute values among the horizontal reactions and is consistent with the relative severity of the records observed in the displacement and acceleration results. The bending moments and also increase in magnitude for the cases that generate higher lateral demand, providing an additional indicator of global overturning effects at the base.
5.5. Stress Demand and Inelastic Indicators
Local response was assessed using stress- and strain-type field outputs extracted from the 3D solid FE models. For concrete and masonry, the principal-stress fields were used to separate tension- and compression-dominated regions. Here, the maximum principal stress is used as a practical indicator for regions where tensile cracking may develop when , while the minimum principal stress is used as an indicator for compression-dominated regions when . Note that is the largest principal value and may remain negative in fully compressive stress states; therefore, tensile regions are identified only where becomes positive. For reinforced concrete members, inelastic demand was tracked using the ‘Equivalent Plastic Strain’ field in the concrete solids. For reinforcement, steel demand was evaluated using the ‘Equivalent (von Mises) Stress’ in the rebar domains, consistent with J2 plasticity, and directly comparable to the steel yield strength .
Among the analysed records at , VN90 produced the largest global response measures (roof displacement, drift, and roof accelerations). Therefore, contour plots are presented for VN90 as the representative governing case for both configurations. The other records remain documented through peak summaries consolidated in Table 8. In this way, VN90 is used to illustrate spatial patterns, while VN77 and TK2023 remain covered through global extremes.
For each field quantity, the contour snapshot was taken at the time instant when that specific quantity reaches its peak. Therefore, the ‘Maximum Principal Stress’ contour is extracted at the time when the maximum tensile principal stress peaks, while the ‘Minimum Principal Stress’ contour is extracted at the time when the most negative compressive principal stress occurs. The same approach is used for equivalent plastic strain and for rebar von Mises stress. This avoids mixing non-synchronous maxima and keeps each map physically consistent.
Figure 18, Figure 19, Figure 20 and Figure 21 show that positive values (tension) are limited and localised, with peak values (up to about 3 MPa), whereas reaches markedly higher magnitudes in compression (up to about 25 MPa in the bare RC frame). In many zones, remains negative, indicating a fully compressive stress state.
In the RC+M configuration, the compressive principal stress field also highlights the engagement of masonry panels in the transversal direction, with compression paths compatible with in-plane strut action. Tension concentrations in masonry are localised around openings and near panel corners, where stress trajectories change abruptly (Figure 18, Figure 19, Figure 20 and Figure 21).
Figure 22 and Figure 23 show that equivalent plastic strain concentrations are more pronounced in the bare RC frame than in the infilled model, which is consistent with the larger drift demand of the bare RC configuration. In the RC frame, plastic strains localise primarily at the base of columns, especially for perimeter columns, and at the ends of beams near beam–column joints. Localised concentrations also appear in the staircase zone, at the connections between landings and adjacent RC members, where stiffness discontinuities and force transfer details amplify local demand (Figure 22 and Figure 23).
In the RC+M model, plastic strain in concrete is generally reduced, while inelastic indicators in masonry concentrate around openings and their corners, along infill-to-frame boundary regions in the transversal direction, and near the base storey. These zones are consistent with local shear transfer and stress concentrations at geometric discontinuities (Figure 22 and Figure 23).
Figure 24 and Figure 25 show that the reinforcement von Mises stress in the bare RC frame reaches about 360 MPa, close to the yielding range of the PC52 steel.
The highest steel stresses occur in (i) the longitudinal reinforcement at beam ends adjacent to columns, (ii) the extreme bars at the base of columns, and (iii) the staircase region, where landings connect into the surrounding frame and local force transfer is intensified (Figure 24 and Figure 25). This spatial pattern is compatible with the torsional contribution identified in Mode 2, where the staircase core and its asymmetric stiffness participate in global twisting and in local demand concentration (Figure 11). For the RC+M model, peak rebar stresses remain much lower (about 121 MPa), which is consistent with the reduced drift and reduced curvature demand in beams and columns under the same scaled intensity (Figure 24 and Figure 25).
Table 8 consolidates the extreme values across all three records. For the bare RC frame, peak tensile principal stress is about 2.8–3.345 MPa, peak compressive principal stress magnitude is about 20.55–25.28 MPa, peak equivalent plastic strain is about 0.0021–0.0025, and peak rebar von Mises stress is about 338–360 MPa. For RC+M, peak tensile principal stress is about 3.25–3.32 MPa, peak compressive principal stress magnitude is about 13.46–17.01 MPa, peak equivalent plastic strain is about 0.0011–0.0015, and peak rebar von Mises stress is about 121–127 MPa. These results are consistent with the global response metrics. Masonry infills reduce lateral deformation demand and, consequently, limit both concrete inelastic demand and reinforcement stress demand at the considered design-level intensity.
6. Discussion and Implications
The adopted intensity level corresponds to the current design level for the investigated site (P100-1/2013) and may be considered representative for high-seismicity areas in Romania. At this level, the building satisfies the drift-based checks used in this manuscript, with peak drift ratios remaining well below the conservative serviceability reference . The comparison between the original 2007 design basis (P100-1/2006, lower design acceleration and force reduction through ) and the current reassessment suggests that the analysed structure exhibits a performance margin above the minimum requirements of the original code, provided that the as-built configuration, including masonry infills, is considered.
The results also indicate that the infills strongly govern stiffness and deformation demand at . With infills included (RC+M), global drifts and reinforcement stresses remain low, while in the bare-frame configuration (RC) the response becomes markedly more drift-governed, with localised plasticity at column bases and beam ends and steel stresses approaching yielding in critical regions. Extrapolation to substantially higher intensity levels (e.g., 0.6g and above) should be treated as qualitative in the present work, since such analyses were not performed. Nevertheless, the observed localisation patterns suggest that increased intensity would likely amplify degradation of masonry around openings and panel corners and increase demand in RC end regions and in the staircase vicinity.
From a design and assessment perspective, a conservative approach should not rely on masonry infills as primary lateral-resisting components, due to their uncertain properties and potentially brittle degradation. Therefore, design-type verification of the RC system should be performed without infill stiffness contribution, treating masonry primarily as mass and gravity load. At the same time, for performance assessment of existing buildings, infills should be examined explicitly because they can dominate global stiffness, drift distribution, torsional response, and damage localisation. In this study, the most restrictive requirement remains the global stiffness (drift) condition, which is also the response measure most sensitive to whether infills are present.
7. Limitations
The reported results should be interpreted within the adopted modelling assumptions. The base was idealised as fully fixed at the slab above the basement; soil–structure interaction and potential basement flexibility were not modelled. The frame–infill interface was idealised as bonded contact, which may overestimate initial stiffness and modify local damage localisation compared with frictional separation and sliding. Masonry and concrete were represented using Drucker–Prager-type constitutive laws, while reinforcement was modelled with a multilinear isotropic hardening law; alternative damage–plasticity formulations and parameter calibration from material/interface tests were not addressed. Rayleigh damping was kept constant during the analyses and may not fully represent amplitude-dependent dissipation at larger damage states. Finally, the local stress and plastic strain maps are mesh-dependent to some extent, and the present study reports response indicators rather than explicit crack patterns or discrete failure modes.
8. Conclusions
This study re-assessed an existing RC frame building designed to P100-1/2006 using nonlinear 3D solid FE models with explicit reinforcement, comparing a bare frame (RC) and an infilled frame (RC+M) under bidirectional time-history records from Vrancea 1977, Vrancea 1990, and Türkiye 2023 scaled to .
Masonry infills increase global stiffness, raising the fundamental frequency from 4.4669 Hz (RC) to 5.8680 Hz (RC+M) and reducing the fundamental period from 0.2239 s to 0.1704 s. The first mode is translation-dominated in Y, the second mode is torsional, and the third mode is translation-dominated in X, for both configurations.
Infills reduce global deformation demand. Peak roof displacements in Y decrease from 9.87–14.26 mm (RC) to 2.74–3.38 mm (RC+M), and peak interstorey drift increments decrease from 3.35–4.94 mm to 0.92–1.16 mm, with the governing storey typically at S1–S2. Peak drift ratios remain low, reaching about 0.173% in the most demanding bare-frame case.
Peak floor accelerations increase with height and are governed by the roof. The roof peak reaches 4801 mm/s2 (0.490 g) for RC and 2068 mm/s2 (0.211 g) for RC+M in VN90, consistent with the larger sway response of the bare frame.
Base-reaction results and –Dy4 loops show larger displacement excursions and wider hysteresis for RC, while RC+M exhibits a stiffer response with reduced displacement demand. Local fields indicate different localisation mechanisms: in RC, plastic strain concentrates at perimeter column bases and beam ends; in RC+M, inelastic indicators concentrate in masonry around openings and panel corners and near the base storey. Reinforcement von Mises stress peaks at column bases, beam-end longitudinal bars, and the staircase region, consistent with torsional participation.
These conclusions apply under the adopted modelling assumptions, including fixed-base conditions, bonded frame–infill interface, Drucker–Prager-type continua and MISO steel, and constant Rayleigh damping.
Supplementary Materials
The following supporting information can be downloaded at the website of this paper posted on Preprints.org.
Author Contributions
Conceptualization, G.T.; methodology, software, validation, writing
Funding
This research received no external funding
Data Availability Statement
Data is contained within the article or supplementary material.
Conflicts of Interest
The author declare no conflict of interest.
References
- Fattal; George; Simiu; Emil; Culver; Charles. Observations on the Behavior of Buildings in the Romania Earthquake of March 4, 1977. In National Bureau of Standards; 1977. [Google Scholar] [CrossRef]
- Mihail Ifrim Earthquake of March 4, 1977 in Romania-Damage and Strengthening of Structures. In Proceedings of the Proceedings of the 3rd Canadian Conference on Earthquake Engineering, Montréal, 1979; pp. 825–836.
- Pavel, F. An Updated Perspective of the Impact of the 1940 Vrancea Earthquake on Design and Construction Practices in Romania. Buildings 2024, Vol. 14 14, 1152. [Google Scholar] [CrossRef]
- Sonmez, E.; Eryilmaz Yildirim, M.; Aydin, M.F.; Koroglu, F.B. Seismic Performance Assessment of Structural Systems in the Aftermath of the 2023 Kahramanmaraş Earthquakes: Observations and Fragility Analyses. Earthquake Spectra 2025, 41, 198–218. [Google Scholar] [CrossRef]
- Cilsalar, H.; Anil, O.; Cilsalar, H.; Anil, O. Investigation of Seismic Collapse Performance of RC Frames with Strengthened Masonry Infill Walls under February 6, 2023 Earthquakes in Türkiye. BuEE 2025, 23, 4499–4524. [Google Scholar] [CrossRef]
- Marinković, M; Butenweg, C. Behaviour and Damage of Masonry Infill Walls during the Earthquake Sequence In Turkey 2023: What Can Be Done to Prevent Extensive Damage of Infilled RC Structures?
- Kaushik, H.B.; Rai, D.C.; Jain, S.K. Code Approaches to Seismic Design of Masonry-Infilled Reinforced Concrete Frames: A State-of-the-Art Review. Earthquake Spectra 2006, 22, 961–983. [Google Scholar] [CrossRef]
- Dias-Oliveira, J.; Rodrigues, H.; Asteris, P.G.; Varum, H. On the Seismic Behavior of Masonry Infilled Frame Structures. Buildings 2022, Vol. 12 12, 1146. [Google Scholar] [CrossRef]
- Asteris, P.G.; Cotsovos, D.M.; Chrysostomou, C.Z.; Mohebkhah, A.; Al-Chaar, G.K. Mathematical Micromodeling of Infilled Frames: State of the Art. Eng. Struct. 2013, 56, 1905–1921. [Google Scholar] [CrossRef]
- Wang, B.; Guo, X.; Xuan, Y.; Fan, X.Q.; Chen, B. The Effects of Infilled Walls on Seismic Performance of RC Frame Structures with Eccentrically Placed Open Corridor. Sustainability 2022, Vol. 14 14, 5299. [Google Scholar] [CrossRef]
- Pohoryles, D.A.; Bournas, D.A. A Unified Macro-Modelling Approach for Masonry-Infilled RC Frames Strengthened with Composite Materials. Eng. Struct. 2020, 223, 111161. [Google Scholar] [CrossRef]
- Angelucci, G.; De Luca, F.; De Risi, R.; Mollaioli, F.; Spacone, E. Simplified Model for the Seismic Performance of Masonry Infilled RC Buildings. Eng. Struct. 2025, 342, 120903. [Google Scholar] [CrossRef]
- Martinelli, E.; Lima, C.; De Stefano, G. A Simplified Procedure for Nonlinear Static Analysis of Masonry Infilled RC Frames. Eng. Struct. 2015, 101, 591–608. [Google Scholar] [CrossRef]
- Gentile, R.; Pampanin, S.; Raffaele, D.; Uva, G. Non-Linear Analysis of RC Masonry-Infilled Frames Using the SLaMA Method: Part 1—Mechanical Interpretation of the Infill/Frame Interaction and Formulation of the Procedure. Bulletin of Earthquake Engineering 2019, 17, 3283–3304. [Google Scholar] [CrossRef]
- Vahed, M.; Habibi, A.; Vahed, M.; Habibi, A. Seismic Evaluation of Set-Back RC Frames with and without Masonry Infill Walls. Earthquakes and Structures 2025, 28, 173. [Google Scholar] [CrossRef]
- Falcão Moreira, R.; Varum, H.; Castro, J.M. Influence of Masonry Infill Walls on the Seismic Assessment of Non-Seismically Designed RC Framed Structures. Buildings 2023, Vol. 13, Page 1148 2023, 13, 1148. [CrossRef]
- Kong, J.; Su, Y.; Zheng, Z.; Wang, X.; Zhang, Y. The Influence of Vertical Arrangement and Masonry Material of Infill Walls on the Seismic Performance of RC Frames. Buildings 2022, Vol. 12 12, 825. [Google Scholar] [CrossRef]
- Messaoudi, A.; Chebili, R.; Mohamed, H.; Rodrigues, H. Influence of Masonry Infill Wall Position and Openings in the Seismic Response of Reinforced Concrete Frames. Applied Sciences 2022, Vol. 12 12, 9477. [Google Scholar] [CrossRef]
- Lubrano Lobianco, A.; Del Zoppo, M.; Rainieri, C.; Fabbrocino, G.; Di Ludovico, M. Damage Estimation of Full-Scale Infilled RC Frames under Pseudo-Dynamic Excitation by Means of Output-Only Modal Identification. Buildings 2023, Vol. 13 13, 948. [Google Scholar] [CrossRef]
- Venghiac, V.-M.; Neagu, C.-P.; Taranu, G.; Rotaru, A. Time History Analyses of a Masonry Structure for a Sustainable Technical Assessment According to Romanian Design Codes. Sustainability 2023, Vol. 15, Page 2932 2023, 15, 2932. [CrossRef]
- Kallioras, S.; Pohoryles, D.A.; Bournas, D.; Molina, F.J.; Pegon, P. Seismic Performance of a Full-Scale Five-Story Masonry-Infilled RC Building Subjected to Substructured Pseudodynamic Tests. Earthq. Eng. Struct. Dyn. 2023, 52, 3649–3678. [Google Scholar] [CrossRef]
- Ibrahim, A.R.; Makhloof, D.A.; Ren, X. Seismic Performance and Collapse Analysis of RC Framed-Wall Structure Excited with Turkey/Syria Destructive Earthquake. Structures 2024, 59, 105774. [Google Scholar] [CrossRef]
- Baltzopoulos, G.; Baraschino, R.; Chioccarelli, E.; Cito, P.; Iervolino, I. Preliminary Engineering Report on Ground Motion Data of the Feb. 2023 Turkey Seismic Sequence 2023.
- M7.8 and M7.5 Kahramanmaraş Earthquake Sequence near Nurdağı, Turkey (Türkiye) | U.S. Geological Survey. Available online: https://www.usgs.gov/news/featured-story/m78-and-m75-kahramanmaras-earthquake-sequence-near-nurdagi-turkey-turkiye (accessed on 23 February 2023).
- Bendimerad, F.; Laurie Johnson, P.; Coburn, A.; Rahnama, M.; Morrow, G. The Kocaeli Earthquake.
- Storchak, D.A.; di Giacomo, D.; Bondár, I.; Engdahl, E.R.; Harris, J.; Lee, W.H.K.; Villaseñor, A.; Bormann, P. Public Release of the ISC-GEM Global Instrumental Earthquake Catalogue (1900-2009). Seismological Research Letters 2013, 84, 810–815. [Google Scholar] [CrossRef]
- Historic Worldwide Earthquakes. Available online: https://web.archive.org/web/20090825081330/http://earthquake.usgs.gov/regional/world/historical.php/ (accessed on 24 February 2023).
- Gürcan Kurtuluş, T.; Aksoy, M. Study Area Introduction Revising Earthquake Source Parameters of the 26.12.1939 Erzincan Earthquake from Historical Seismograms; 2019. [Google Scholar]
- Georgescu, E.-S.; Pomonis, A. Building Damage vs. Territorial Casualty Patterns during the Vrancea (Romania) Earthquakes of 1940 and 1977.
- The 1940 Vrancea Earthquake. Issues, Insights and Lessons Learnt; Springer International Publishing: Cham, 2016; ISBN 978-3-319-29843-6. [Google Scholar]
- INFP Bridging the Gap between Seismology and Earthquake Engineering: From the Seismicity of Romania towards a Refined Implementation of Seismic Action EN 1998-1 (2004) in Earthquake Resistant Design of Buildings (BIGSEES Project). Available online: http://bigsees.infp.ro/ (accessed on 26 December 2022).
- Bunea, G.; Atanasiu, G.M. Overview of Romania’s Seismicity Focusing on the North-Eastern Region. The Bulletin of the Polytechnic Institute of Jassy, Construction. Architecture Section 2013, LX (LXIV). [Google Scholar]
- Georgescu, E.-S.; Steinbrueck, K. New Archival Evidence on the 1977 Vrancea, Romania Earthquake and Its Impact on Disaster Management and Seismic Risk The World Bank. Disaster Management Specialist.
- PROTV Se Împlinesc 48 de Ani de La Cutremurul Din 1977. Zgomotul Care s-a Auzit La Cutremurul Din 1977 - Știrile ProTV. Available online: https://stirileprotv.ro/divers/se-implinesc-48-de-ani-de-la-cutremurul-din-1977-zgomotul-care-s-a-auzit-la-cutremurul-din-1977.html#slide7 (accessed on 20 November 2025).
- MDLPA P100-1/2006 - Cod de Proiectare Seismica - Partea I; Prevederi de Proiectare Pentru Cladiri. 2006.
- MDPL NP007-97.
- MDPL STAS 10107/0-90 Construcţii Civile Şi Industriale. Calculul Şi Alcătuirea Elementelor Structurale Din Beton, Beton Armat Şi Beton Precomprimat 1990.
- MDPL Prevederi de Proiectare Pentru Cl„diri, Indicativ P 100-1/2006 2006.
- Engineering Strong Motion Database ESM. Available online: https://esm-db.eu/processing/select (accessed on 11 March 2023).
- Hussaini, S.S.; Karimzadeh, S.; Rezaeian, S.; Lourenço, P.B. Broadband Stochastic Simulation of Earthquake Ground Motions with Multiple Strong Phases with an Application to the 2023 Kahramanmaraş, Turkey (Türkiye), Earthquake. Earthquake Spectra 2025, 41, 2399–2435. [Google Scholar] [CrossRef]
Figure 2.
Partial collapse of reinforced concrete buildings in Bucharest during the 1977 Vrancea earthquake [34]
Figure 2.
Partial collapse of reinforced concrete buildings in Bucharest during the 1977 Vrancea earthquake [34]

Figure 3.
Construction stages of the RC frame building (a) - slab and beam reinforcement; (b), (c)- erection of RC frames and masonry infills; (d) - installation of the timber roof structure.
Figure 3.
Construction stages of the RC frame building (a) - slab and beam reinforcement; (b), (c)- erection of RC frames and masonry infills; (d) - installation of the timber roof structure.
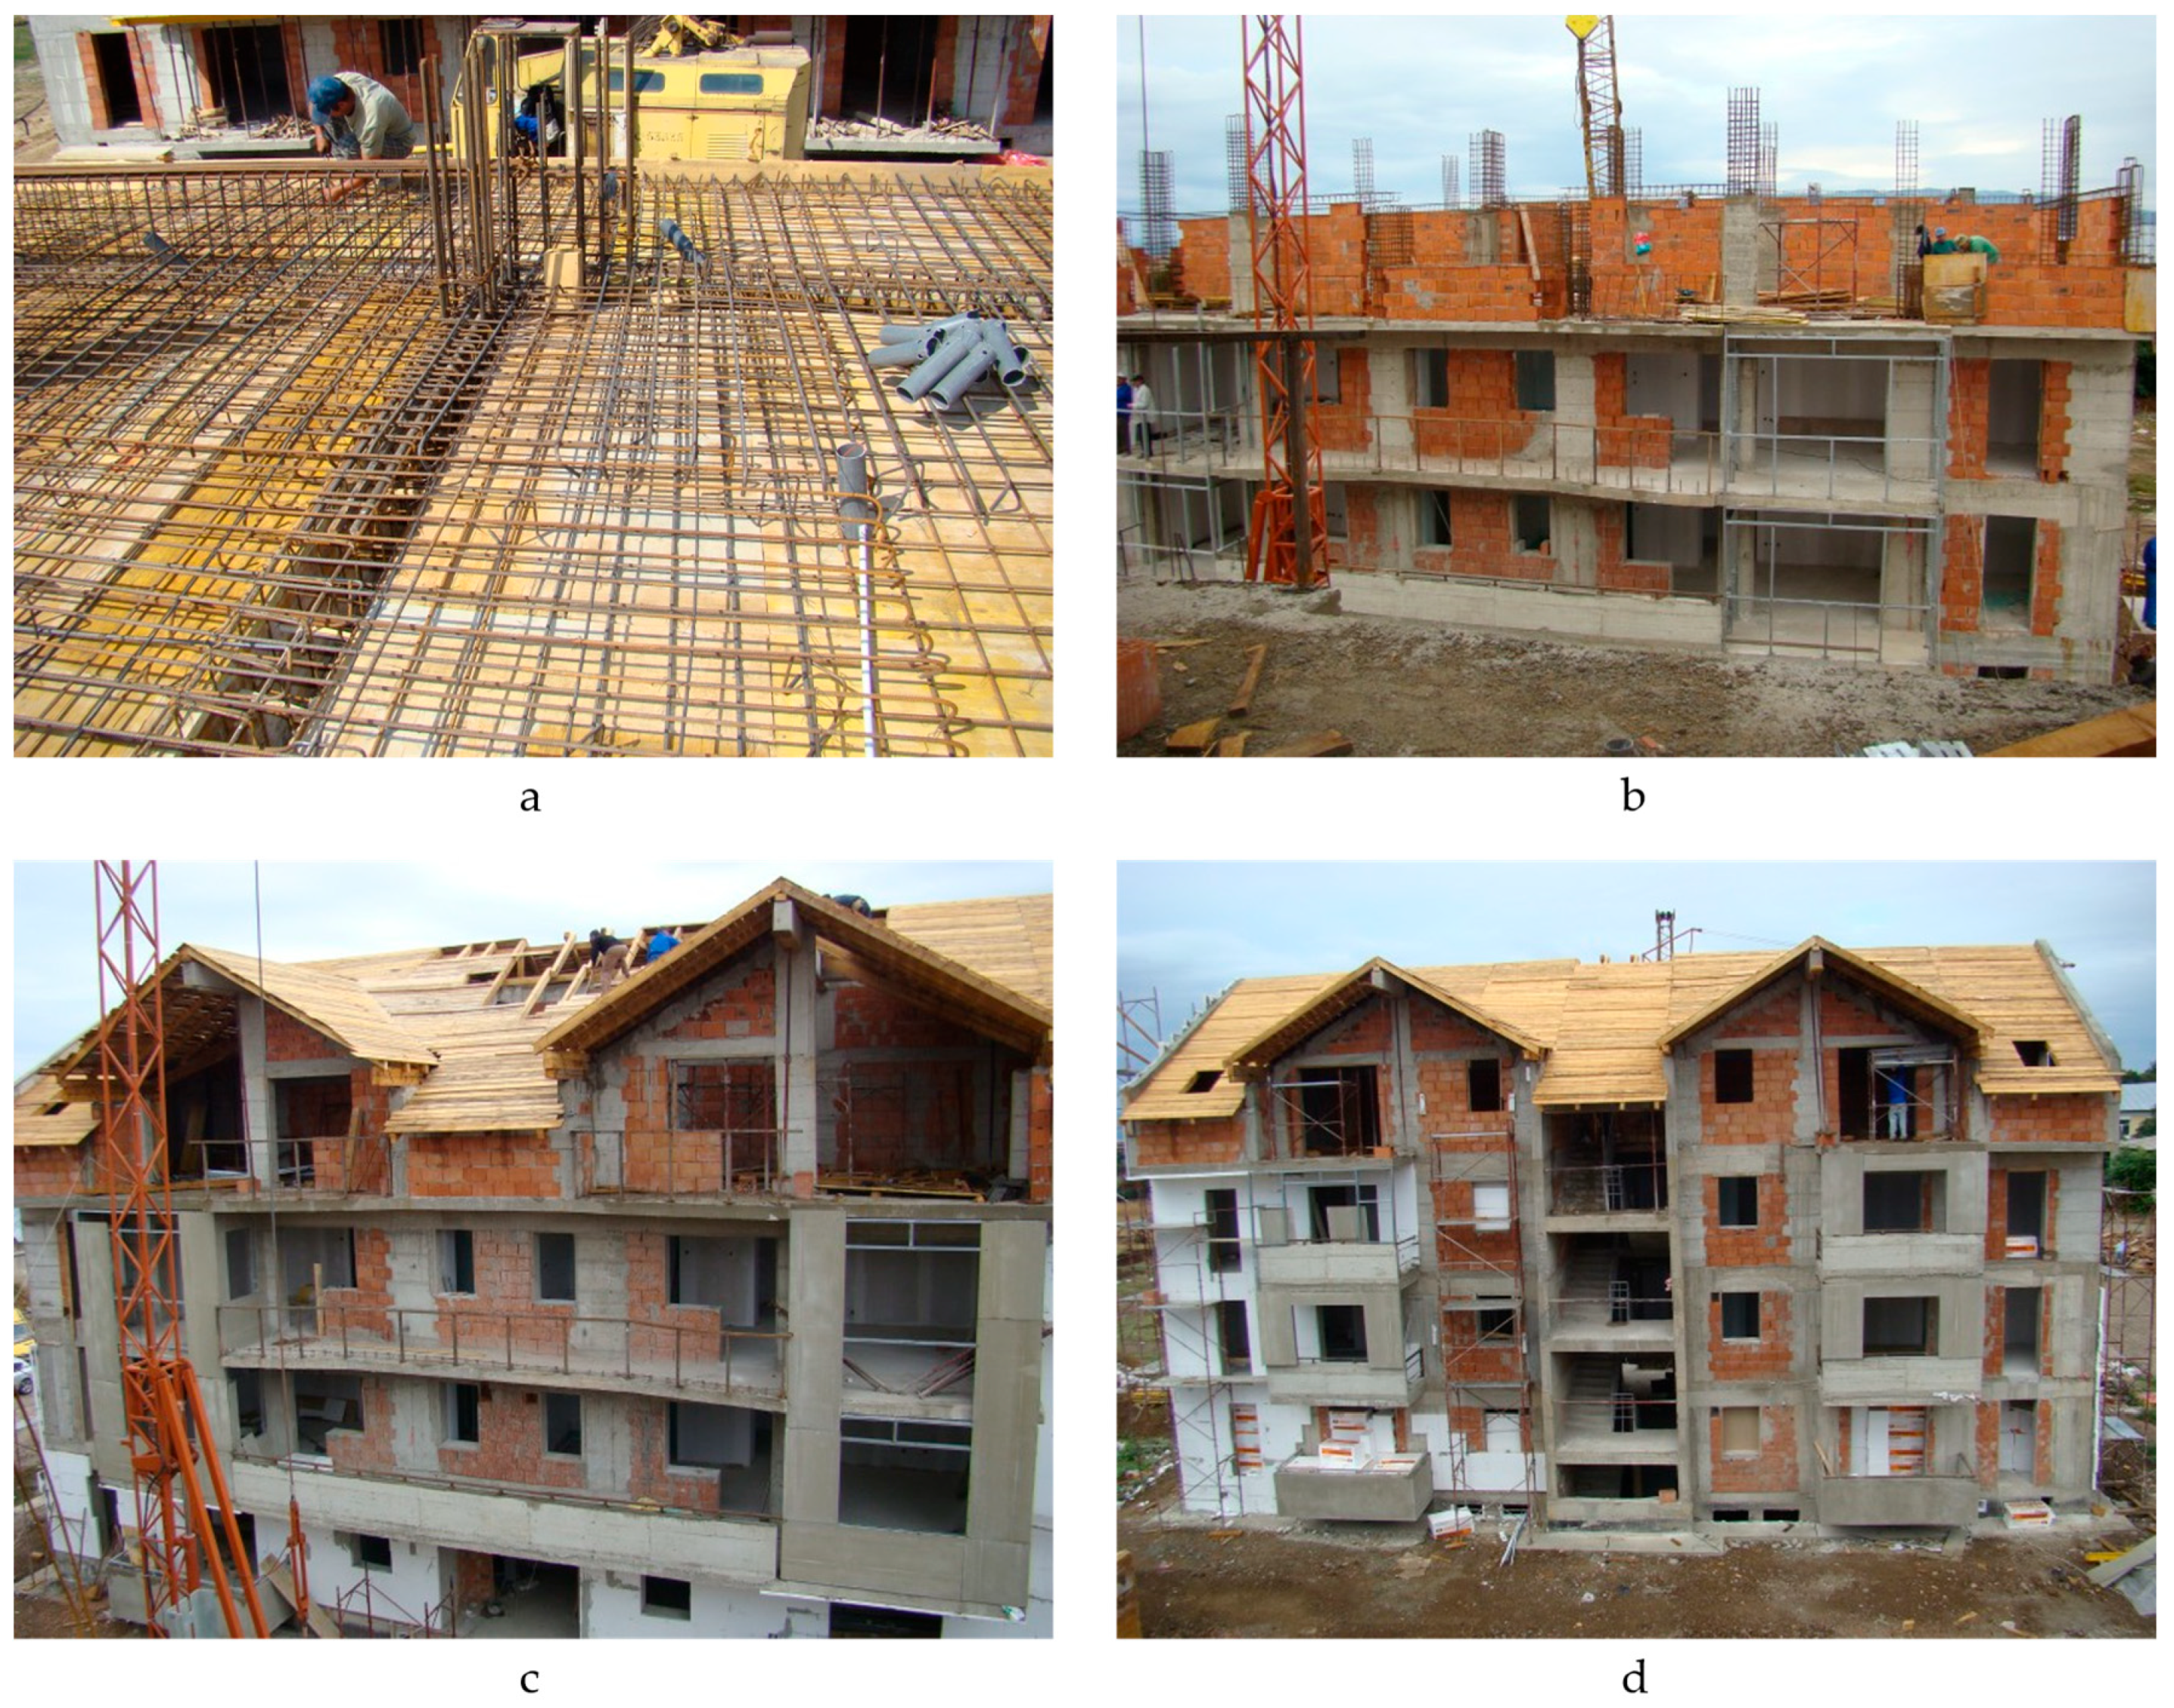
Figure 4.
Typical floor formwork plan with beam and slab layout.
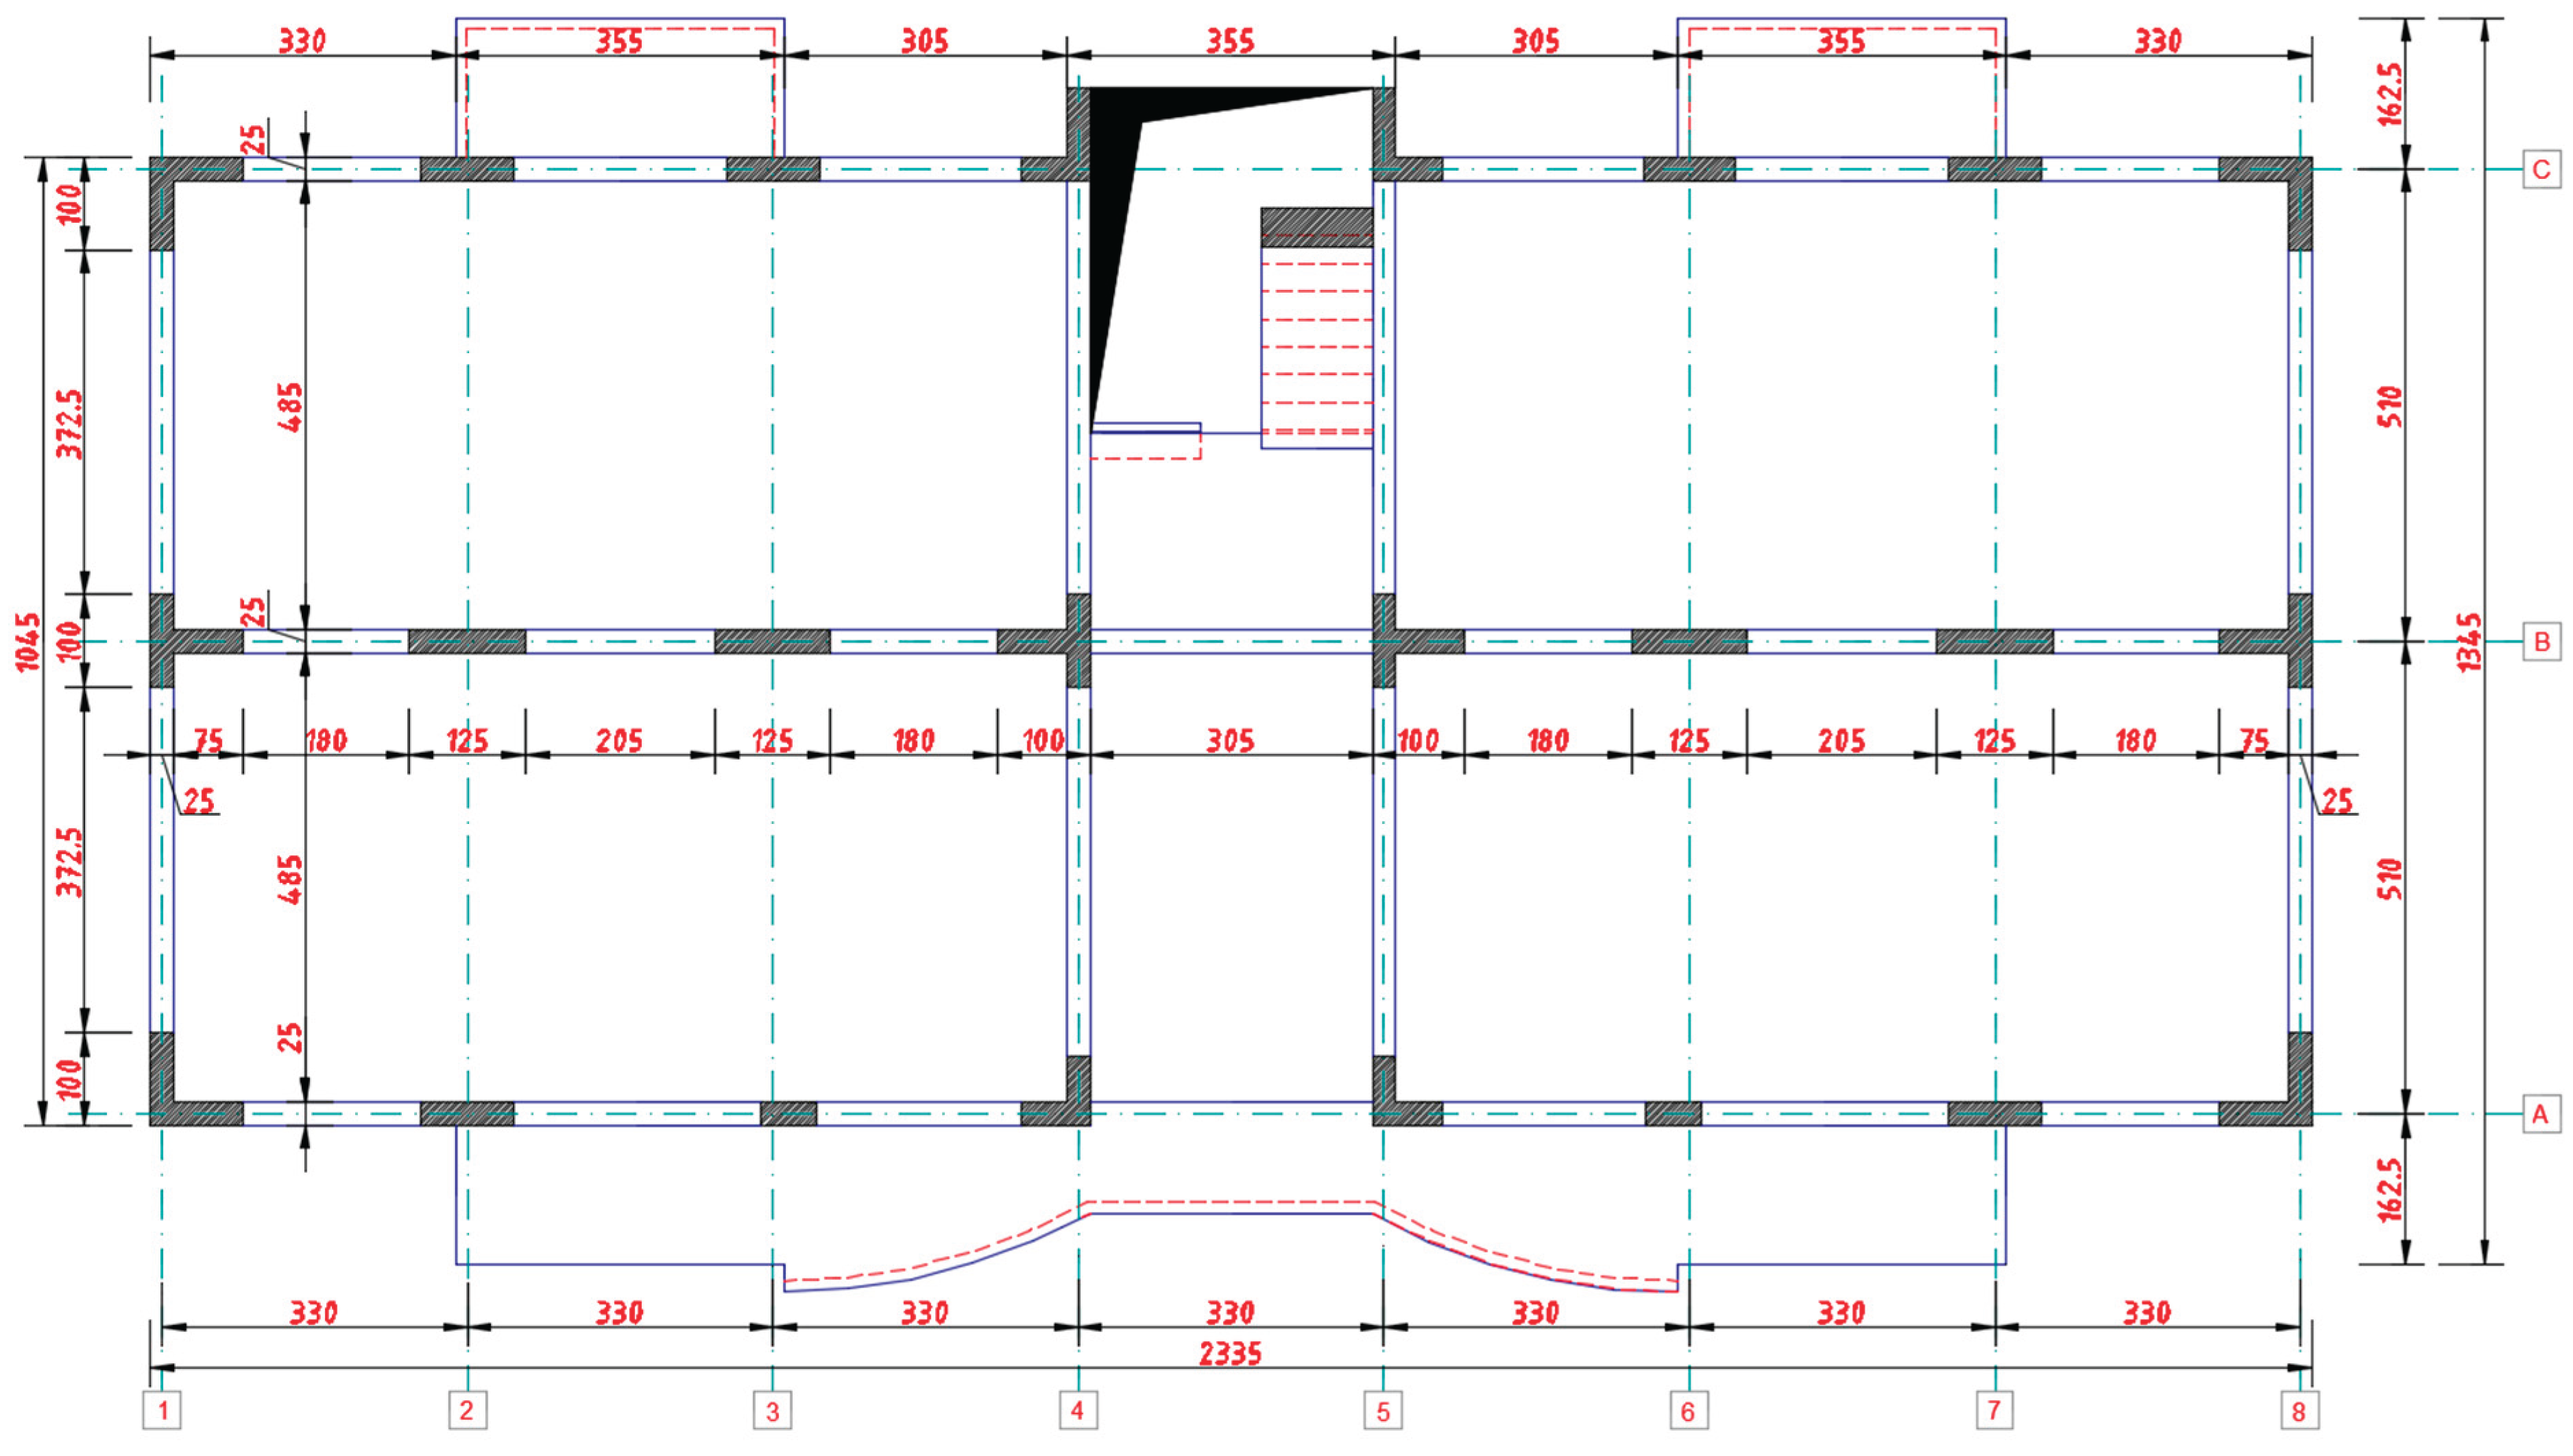
Figure 5.
Transversal section.
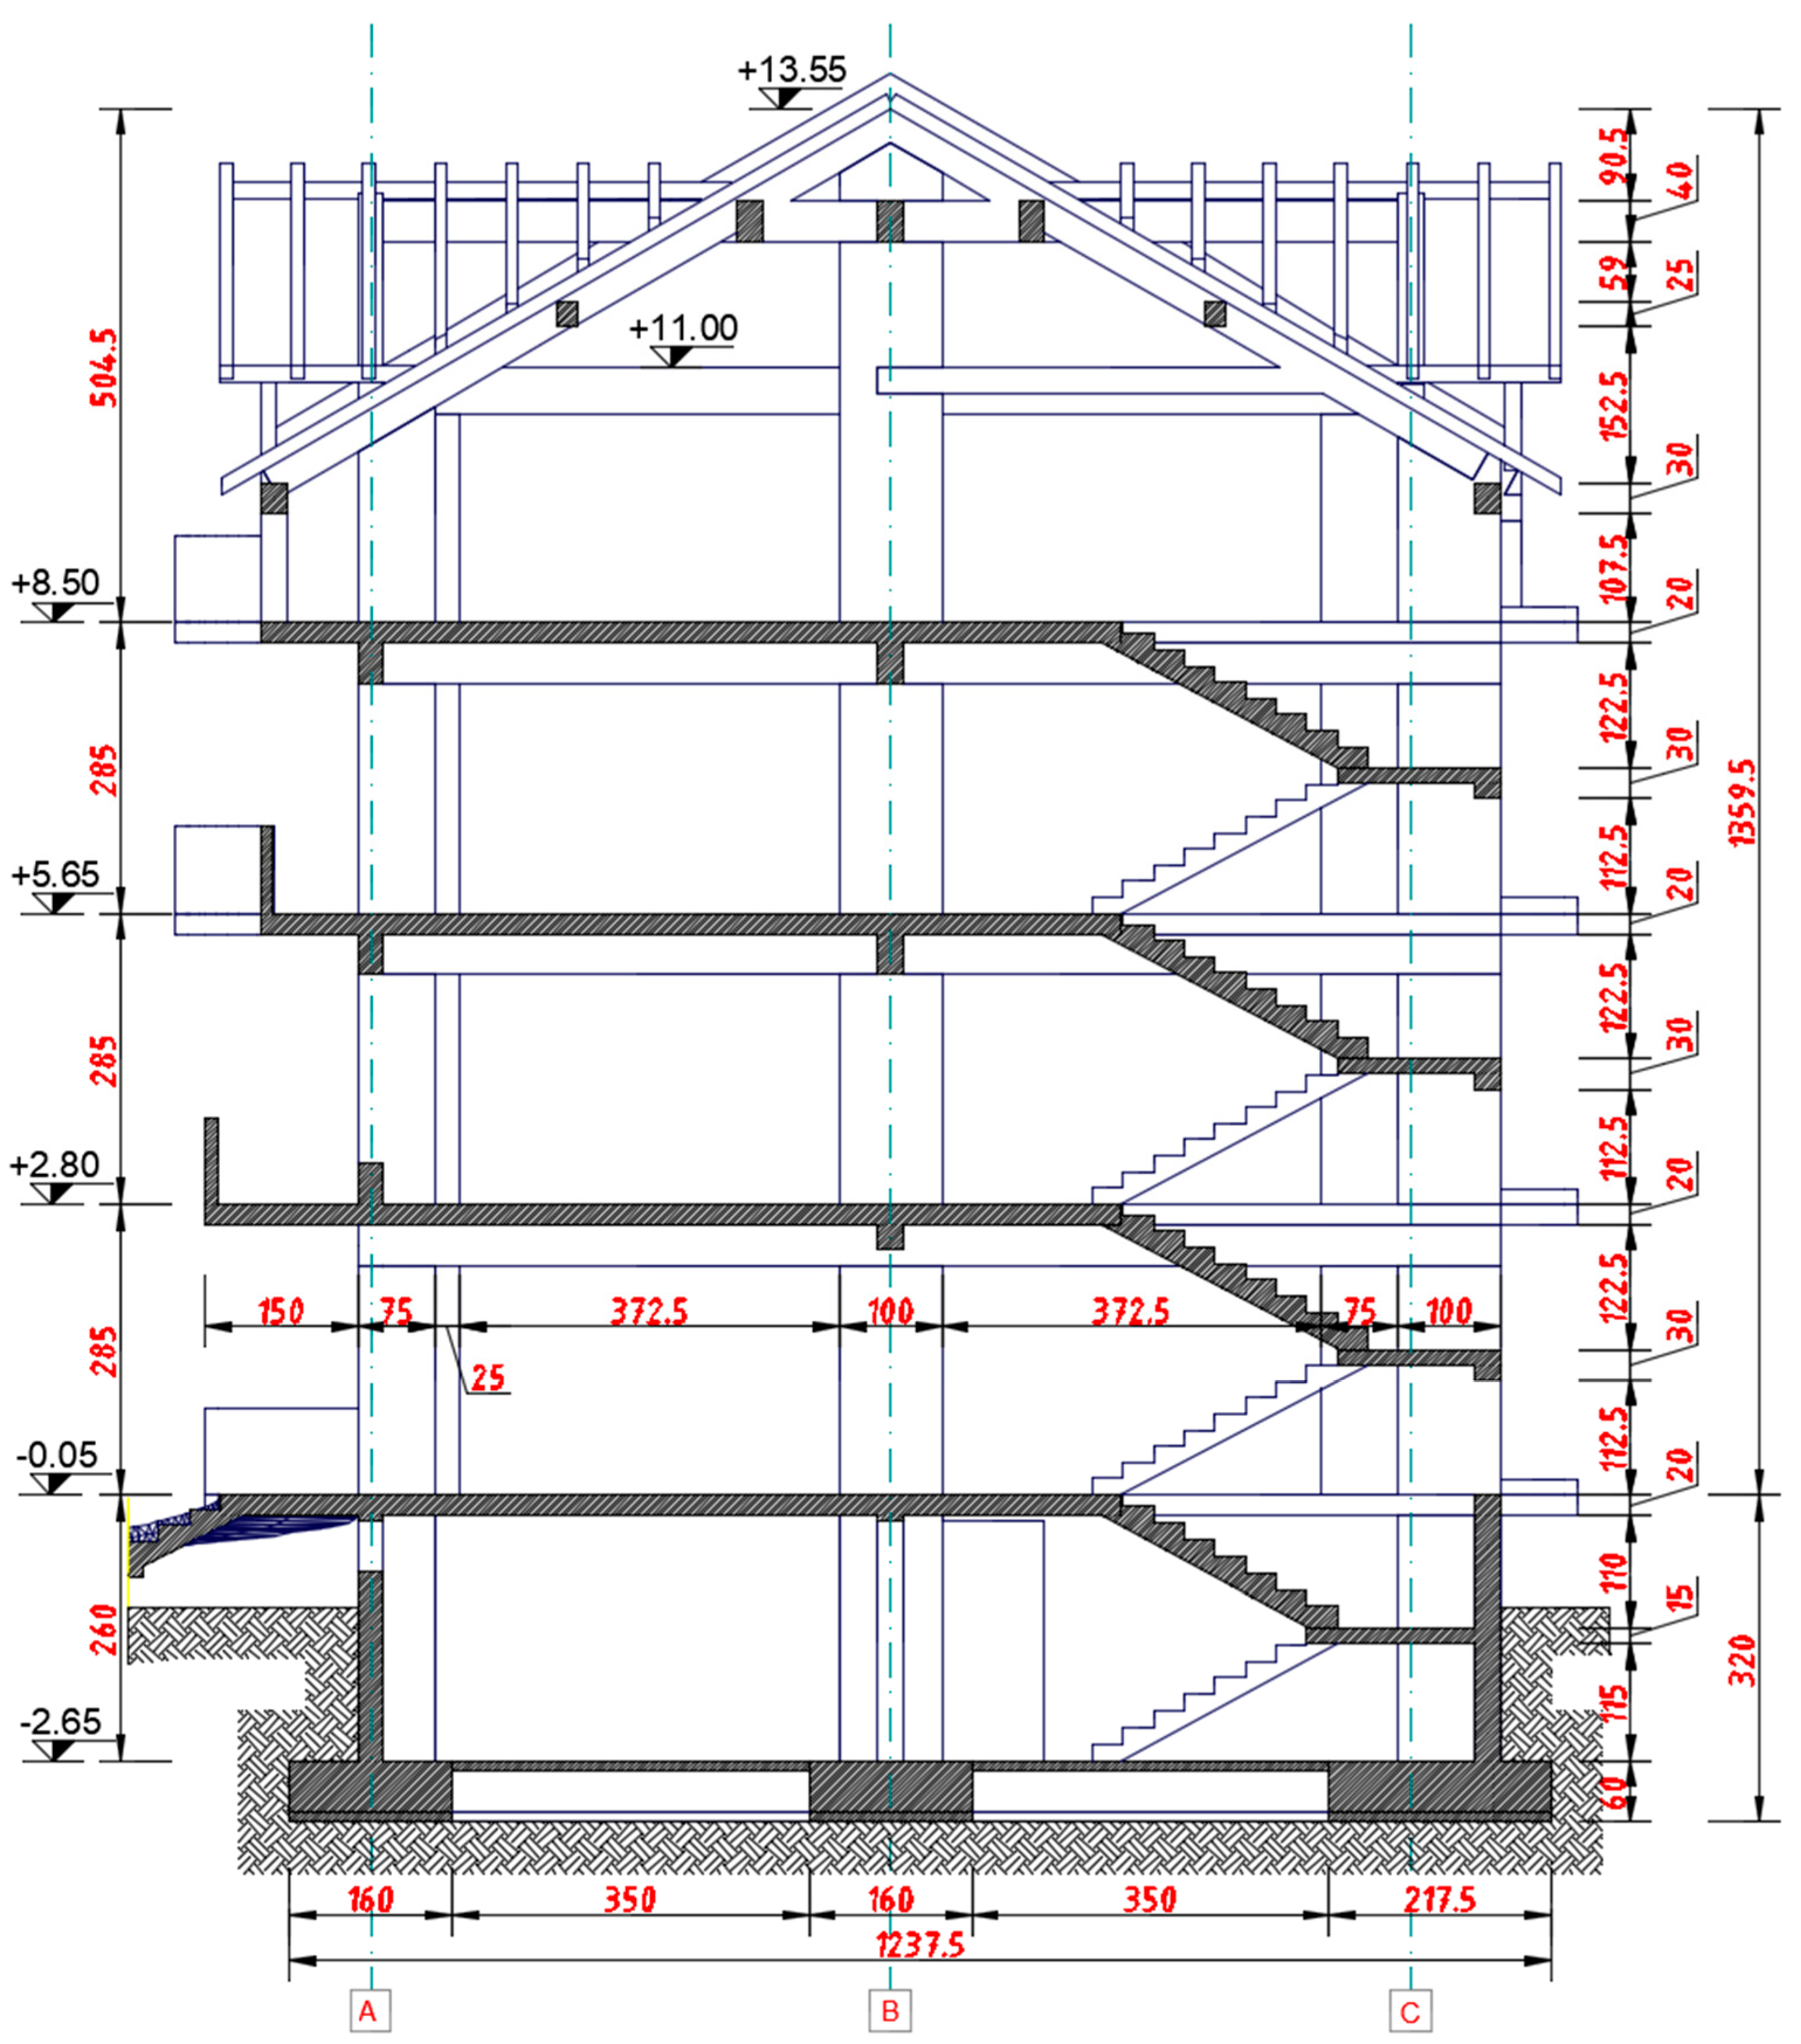
Figure 6.
Scaled horizontal acceleration time histories of the selected records: Vrancea 1977 (top), Vrancea 1990 (middle), and 2023 Türkiye (bottom). For each event, the N–S component is shown on the left and the E–W component on the right, after scaling to the P100-1/2013 target elastic spectrum (ag = 0.40 g, Tc = 1.0 s).
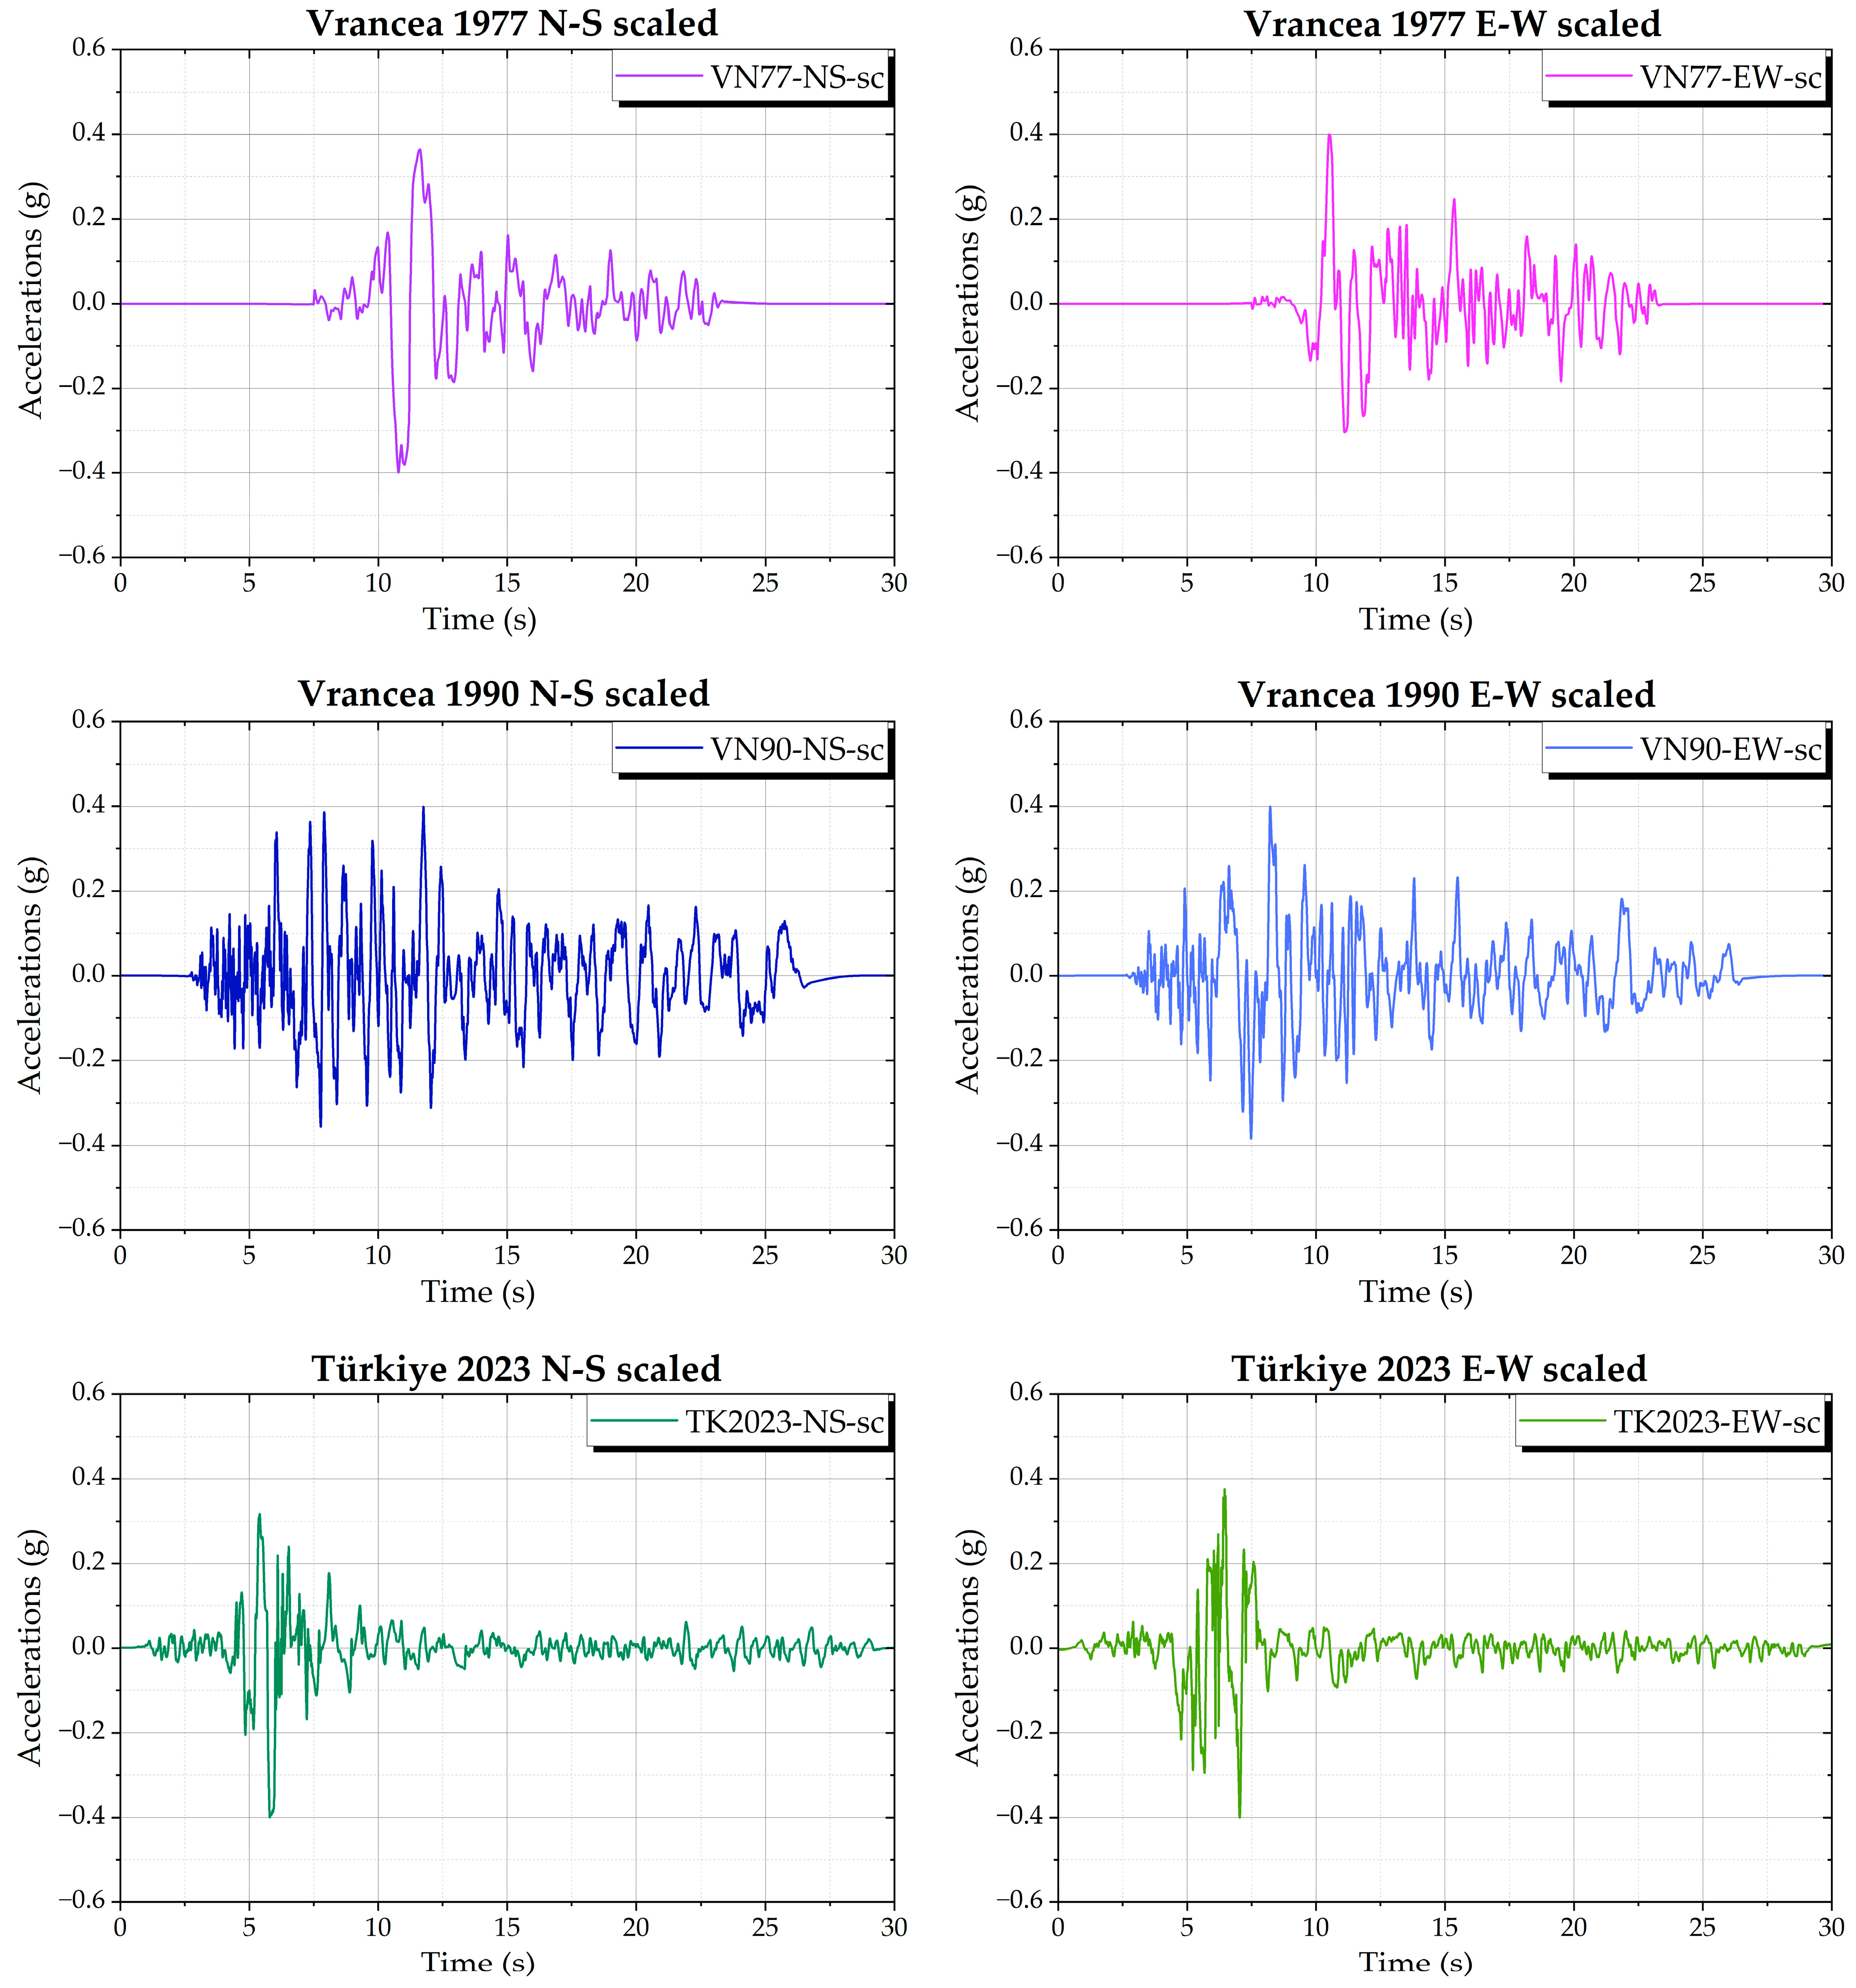
Figure 7.
5%-damped elastic response spectra of the selected and scaled records compared with Romanian code spectra: (a) E–W component applied along the global X axis (longitudinal direction of the model); (b) N–S component applied along the global Y axis (transversal direction of the model).
Figure 7.
5%-damped elastic response spectra of the selected and scaled records compared with Romanian code spectra: (a) E–W component applied along the global X axis (longitudinal direction of the model); (b) N–S component applied along the global Y axis (transversal direction of the model).
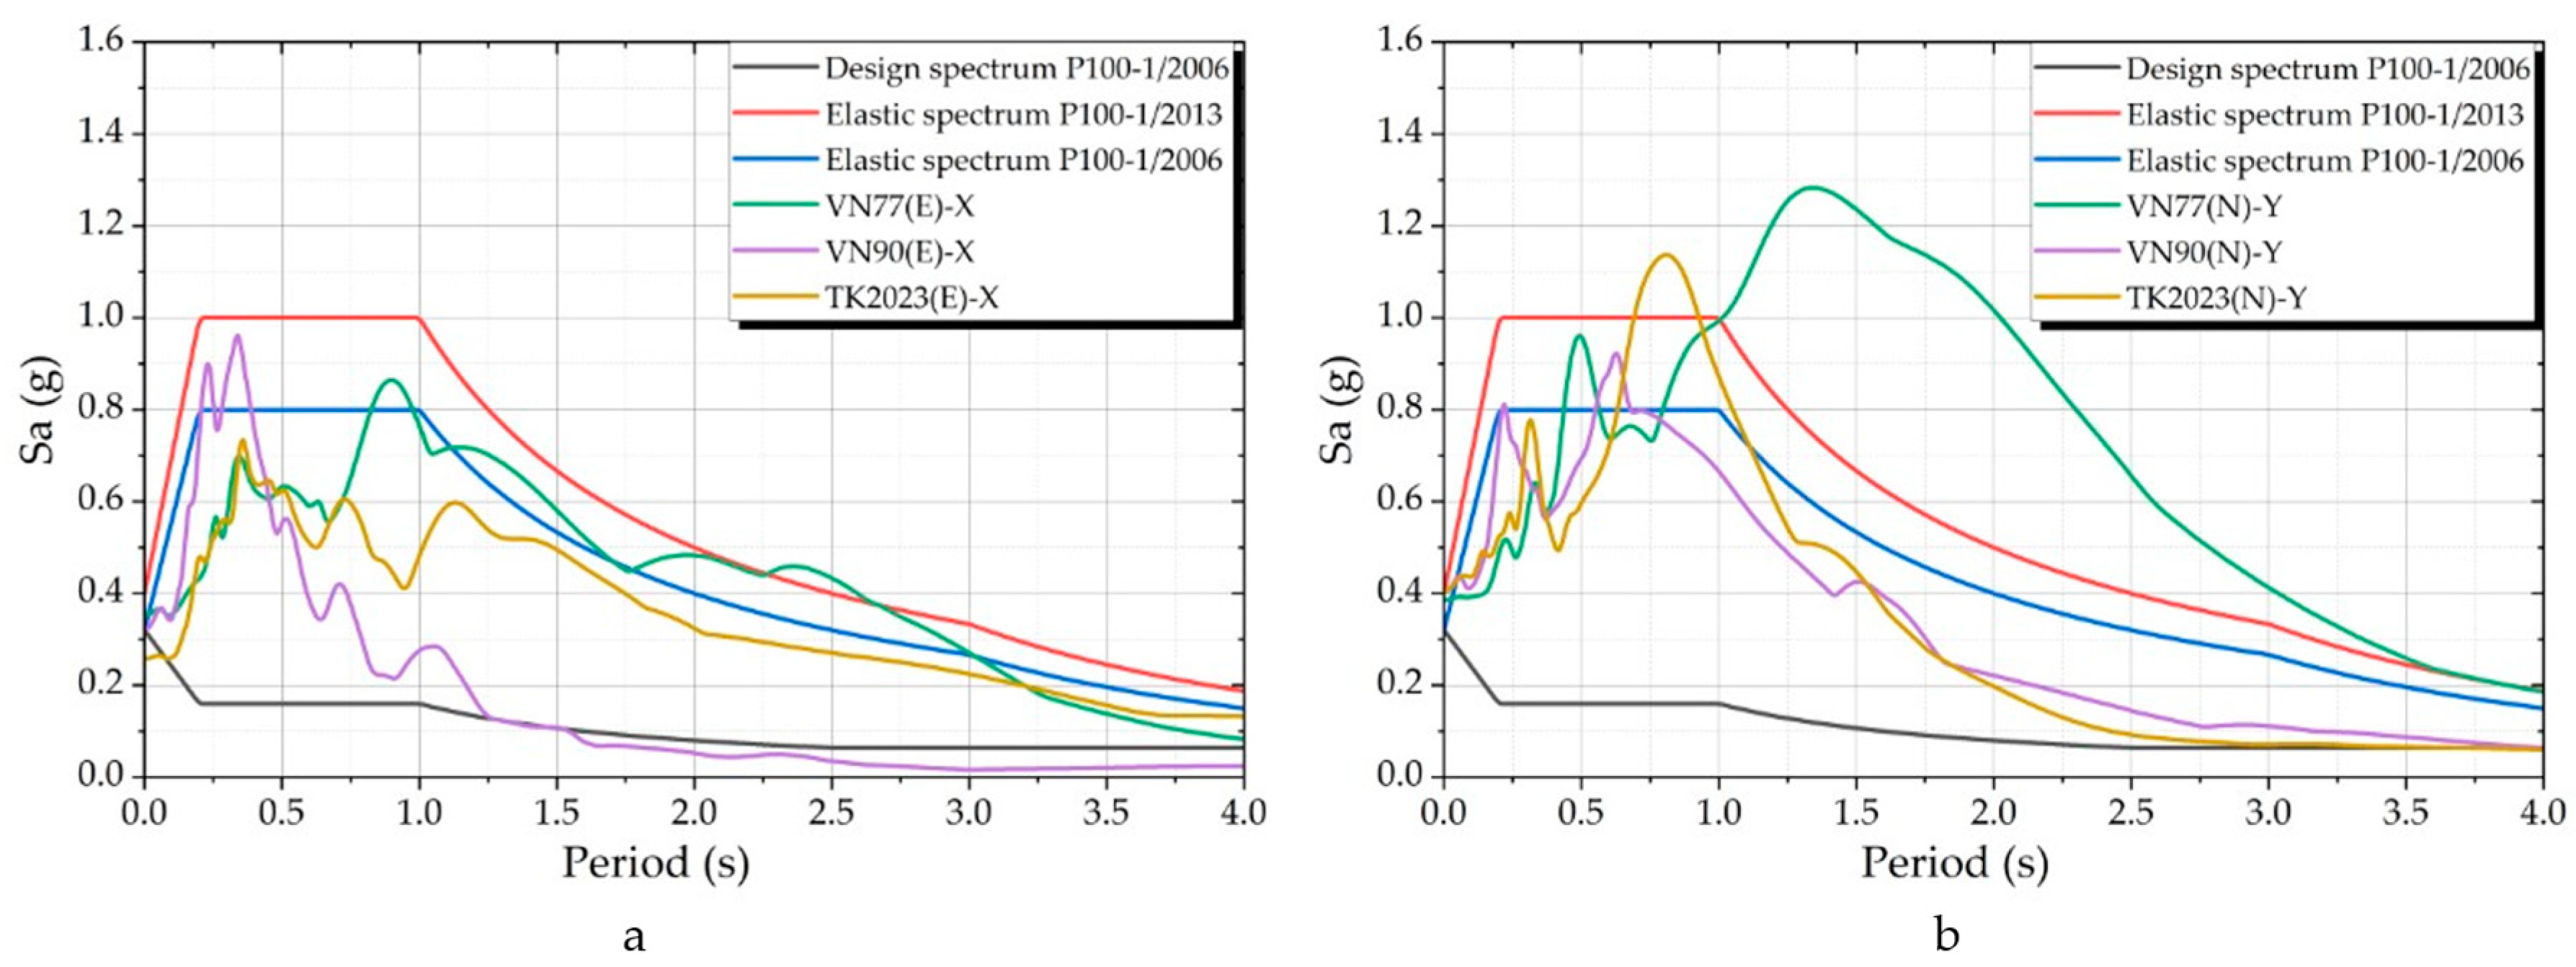
Figure 8.
Geometry of the three-dimensional FE models used in ANSYS: (a) discrete reinforcement layout for RC members, modelled as embedded bar reinforcement; (b) concrete solids for beams, columns, slabs, and stairs (bare-frame configuration); (c) complete infilled-frame model, including the RC frame and masonry infill panels.
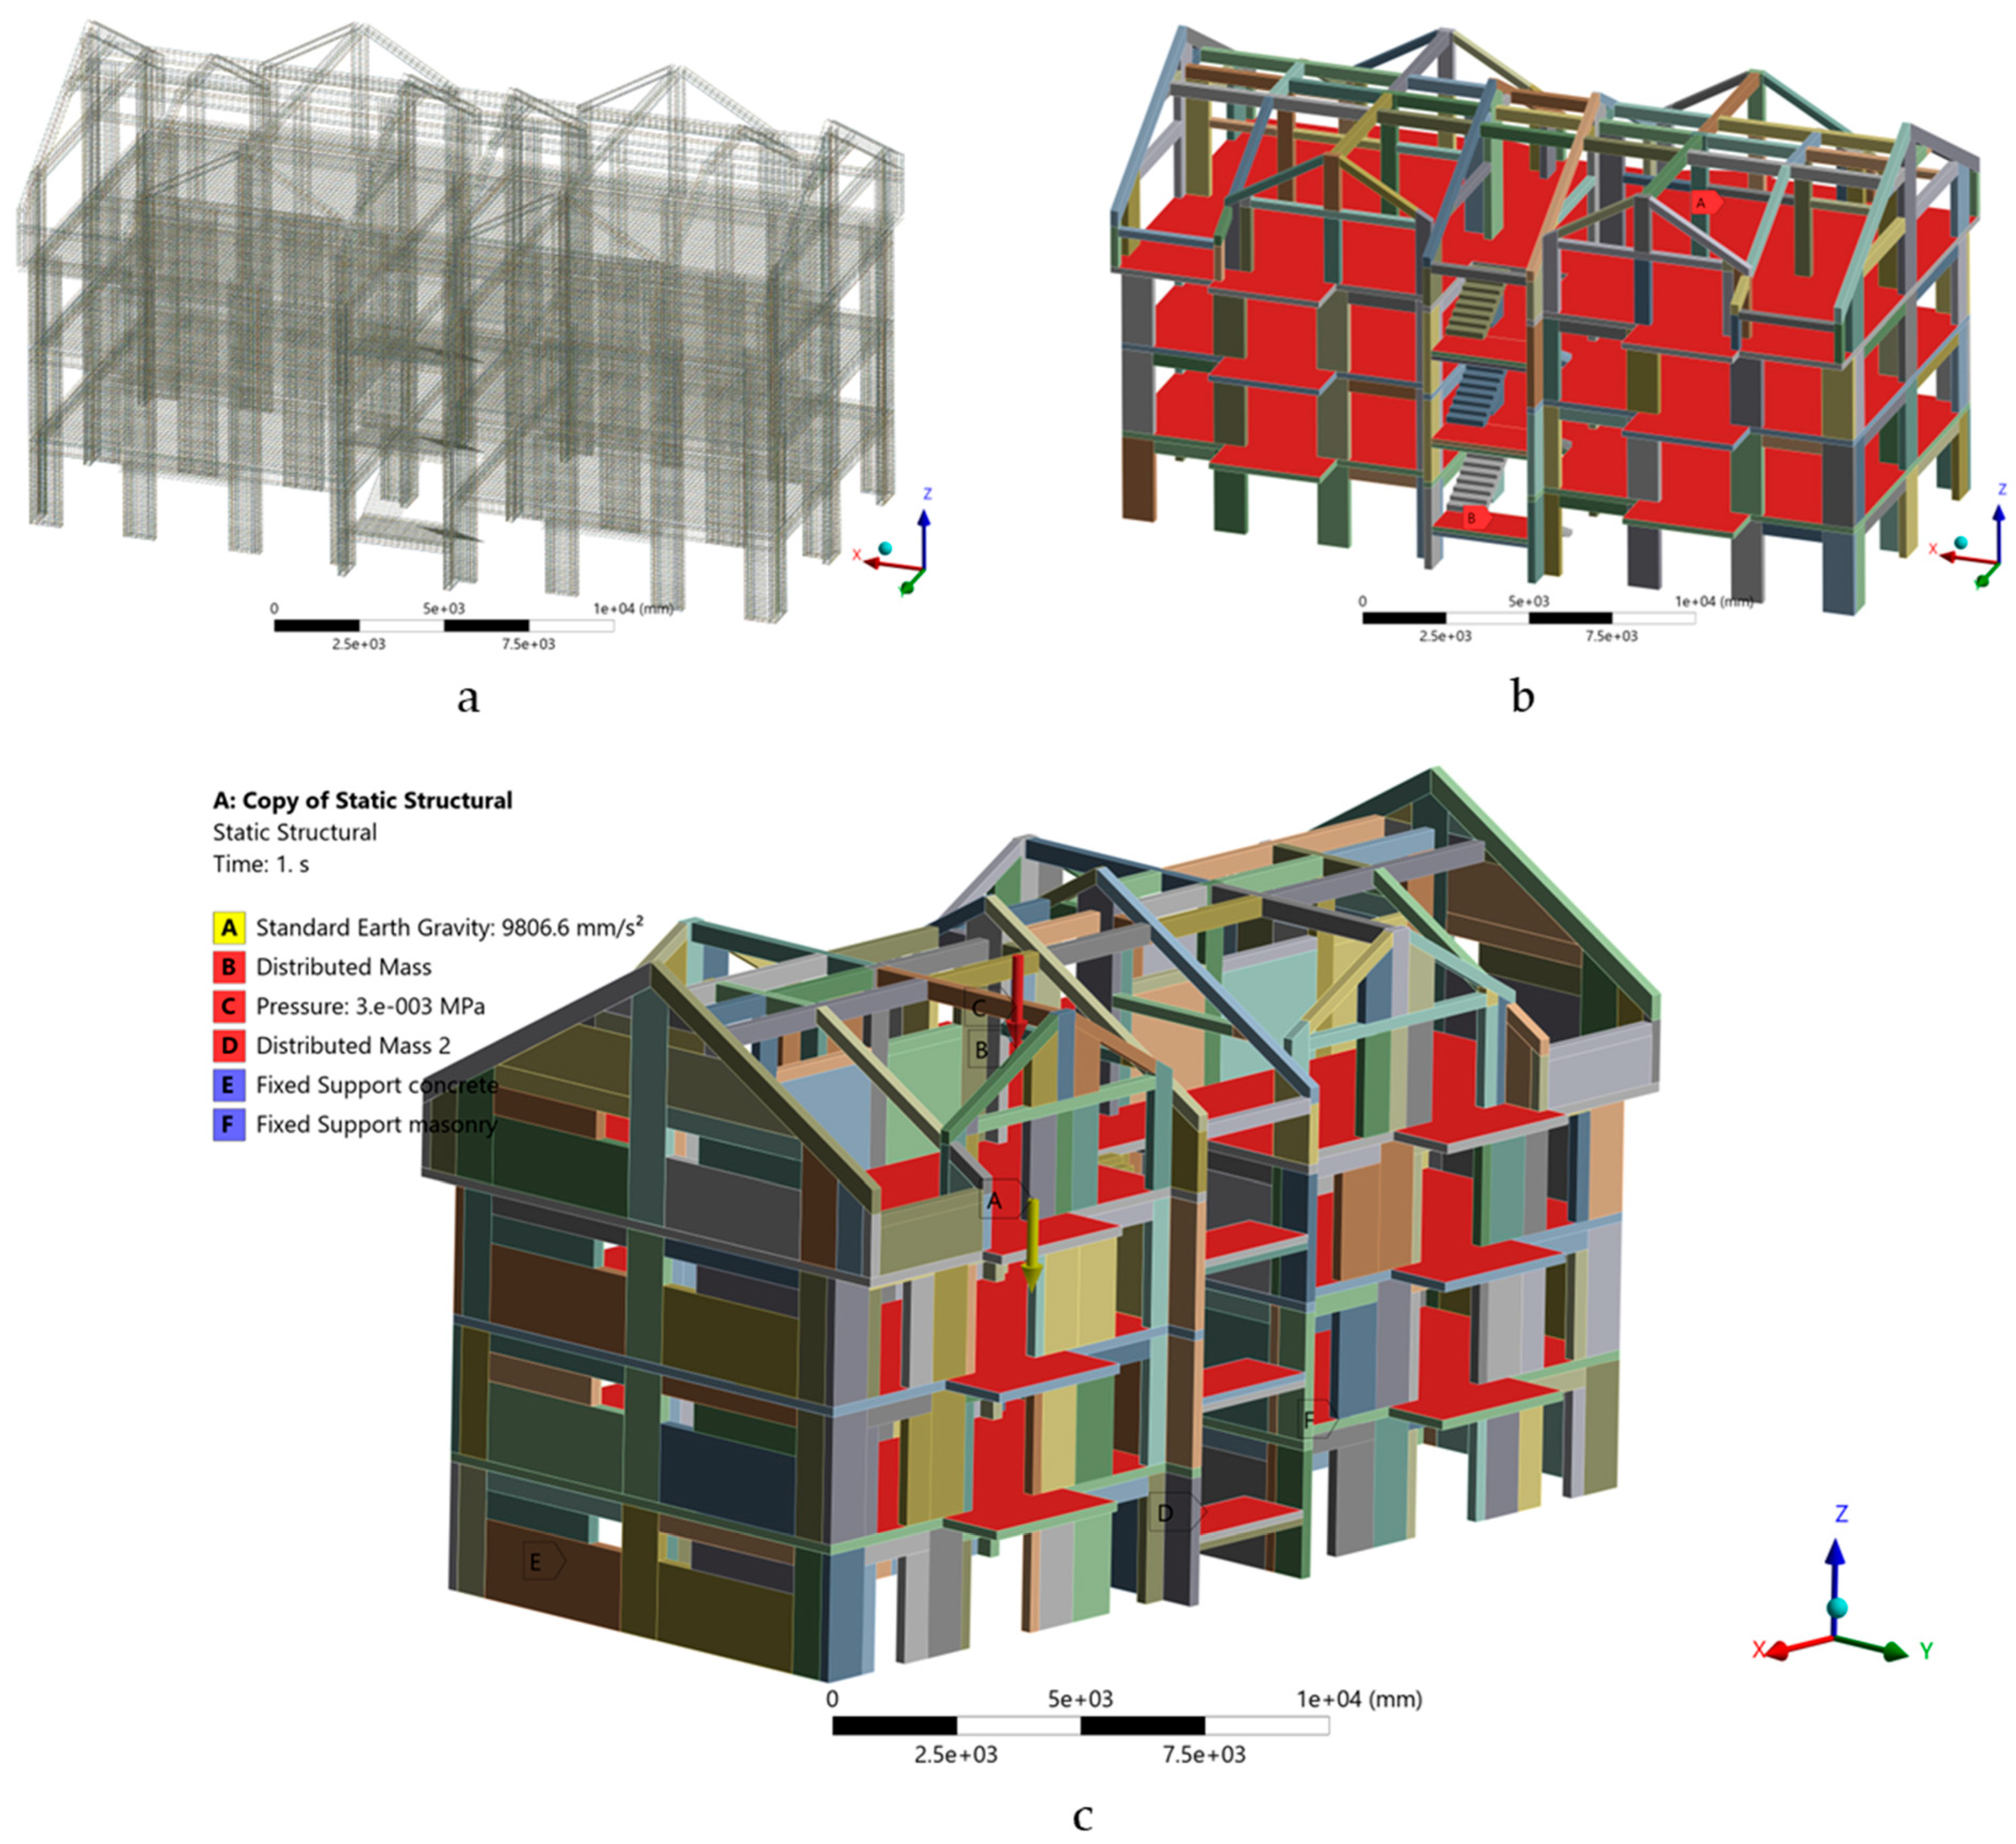
Figure 9.
Three-dimensional FE models used in ANSYS and corresponding mesh discretization: (a) bare RC frame; (b) RC frame with masonry infill panels.
Figure 9.
Three-dimensional FE models used in ANSYS and corresponding mesh discretization: (a) bare RC frame; (b) RC frame with masonry infill panels.
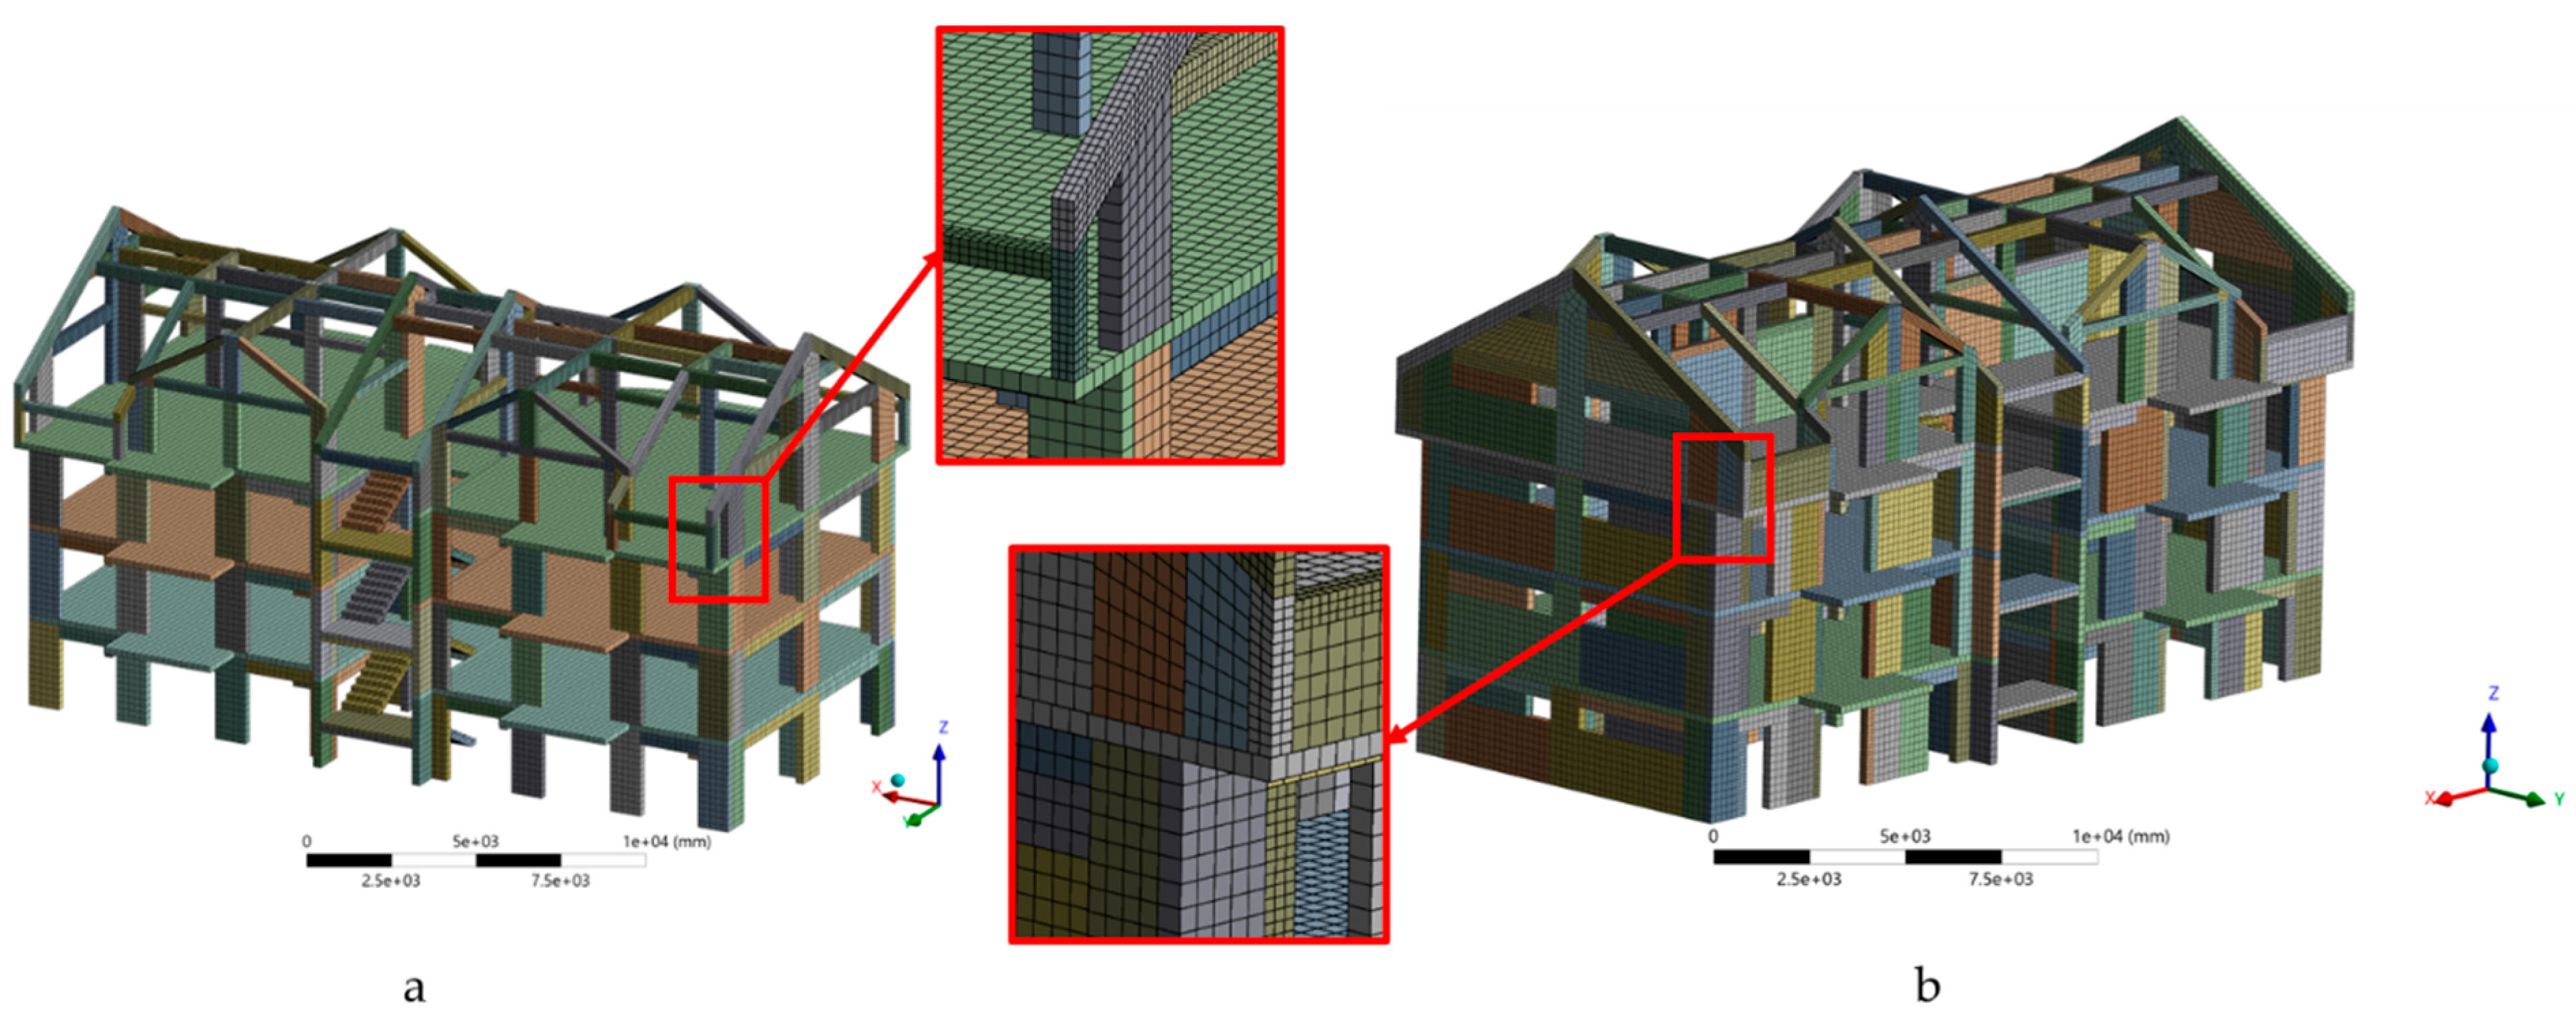
Figure 11.
First three vibration mode shapes (total deformation) from the modal analysis: bare RC frame and RC frame with masonry infills, RC+M.
Figure 11.
First three vibration mode shapes (total deformation) from the modal analysis: bare RC frame and RC frame with masonry infills, RC+M.
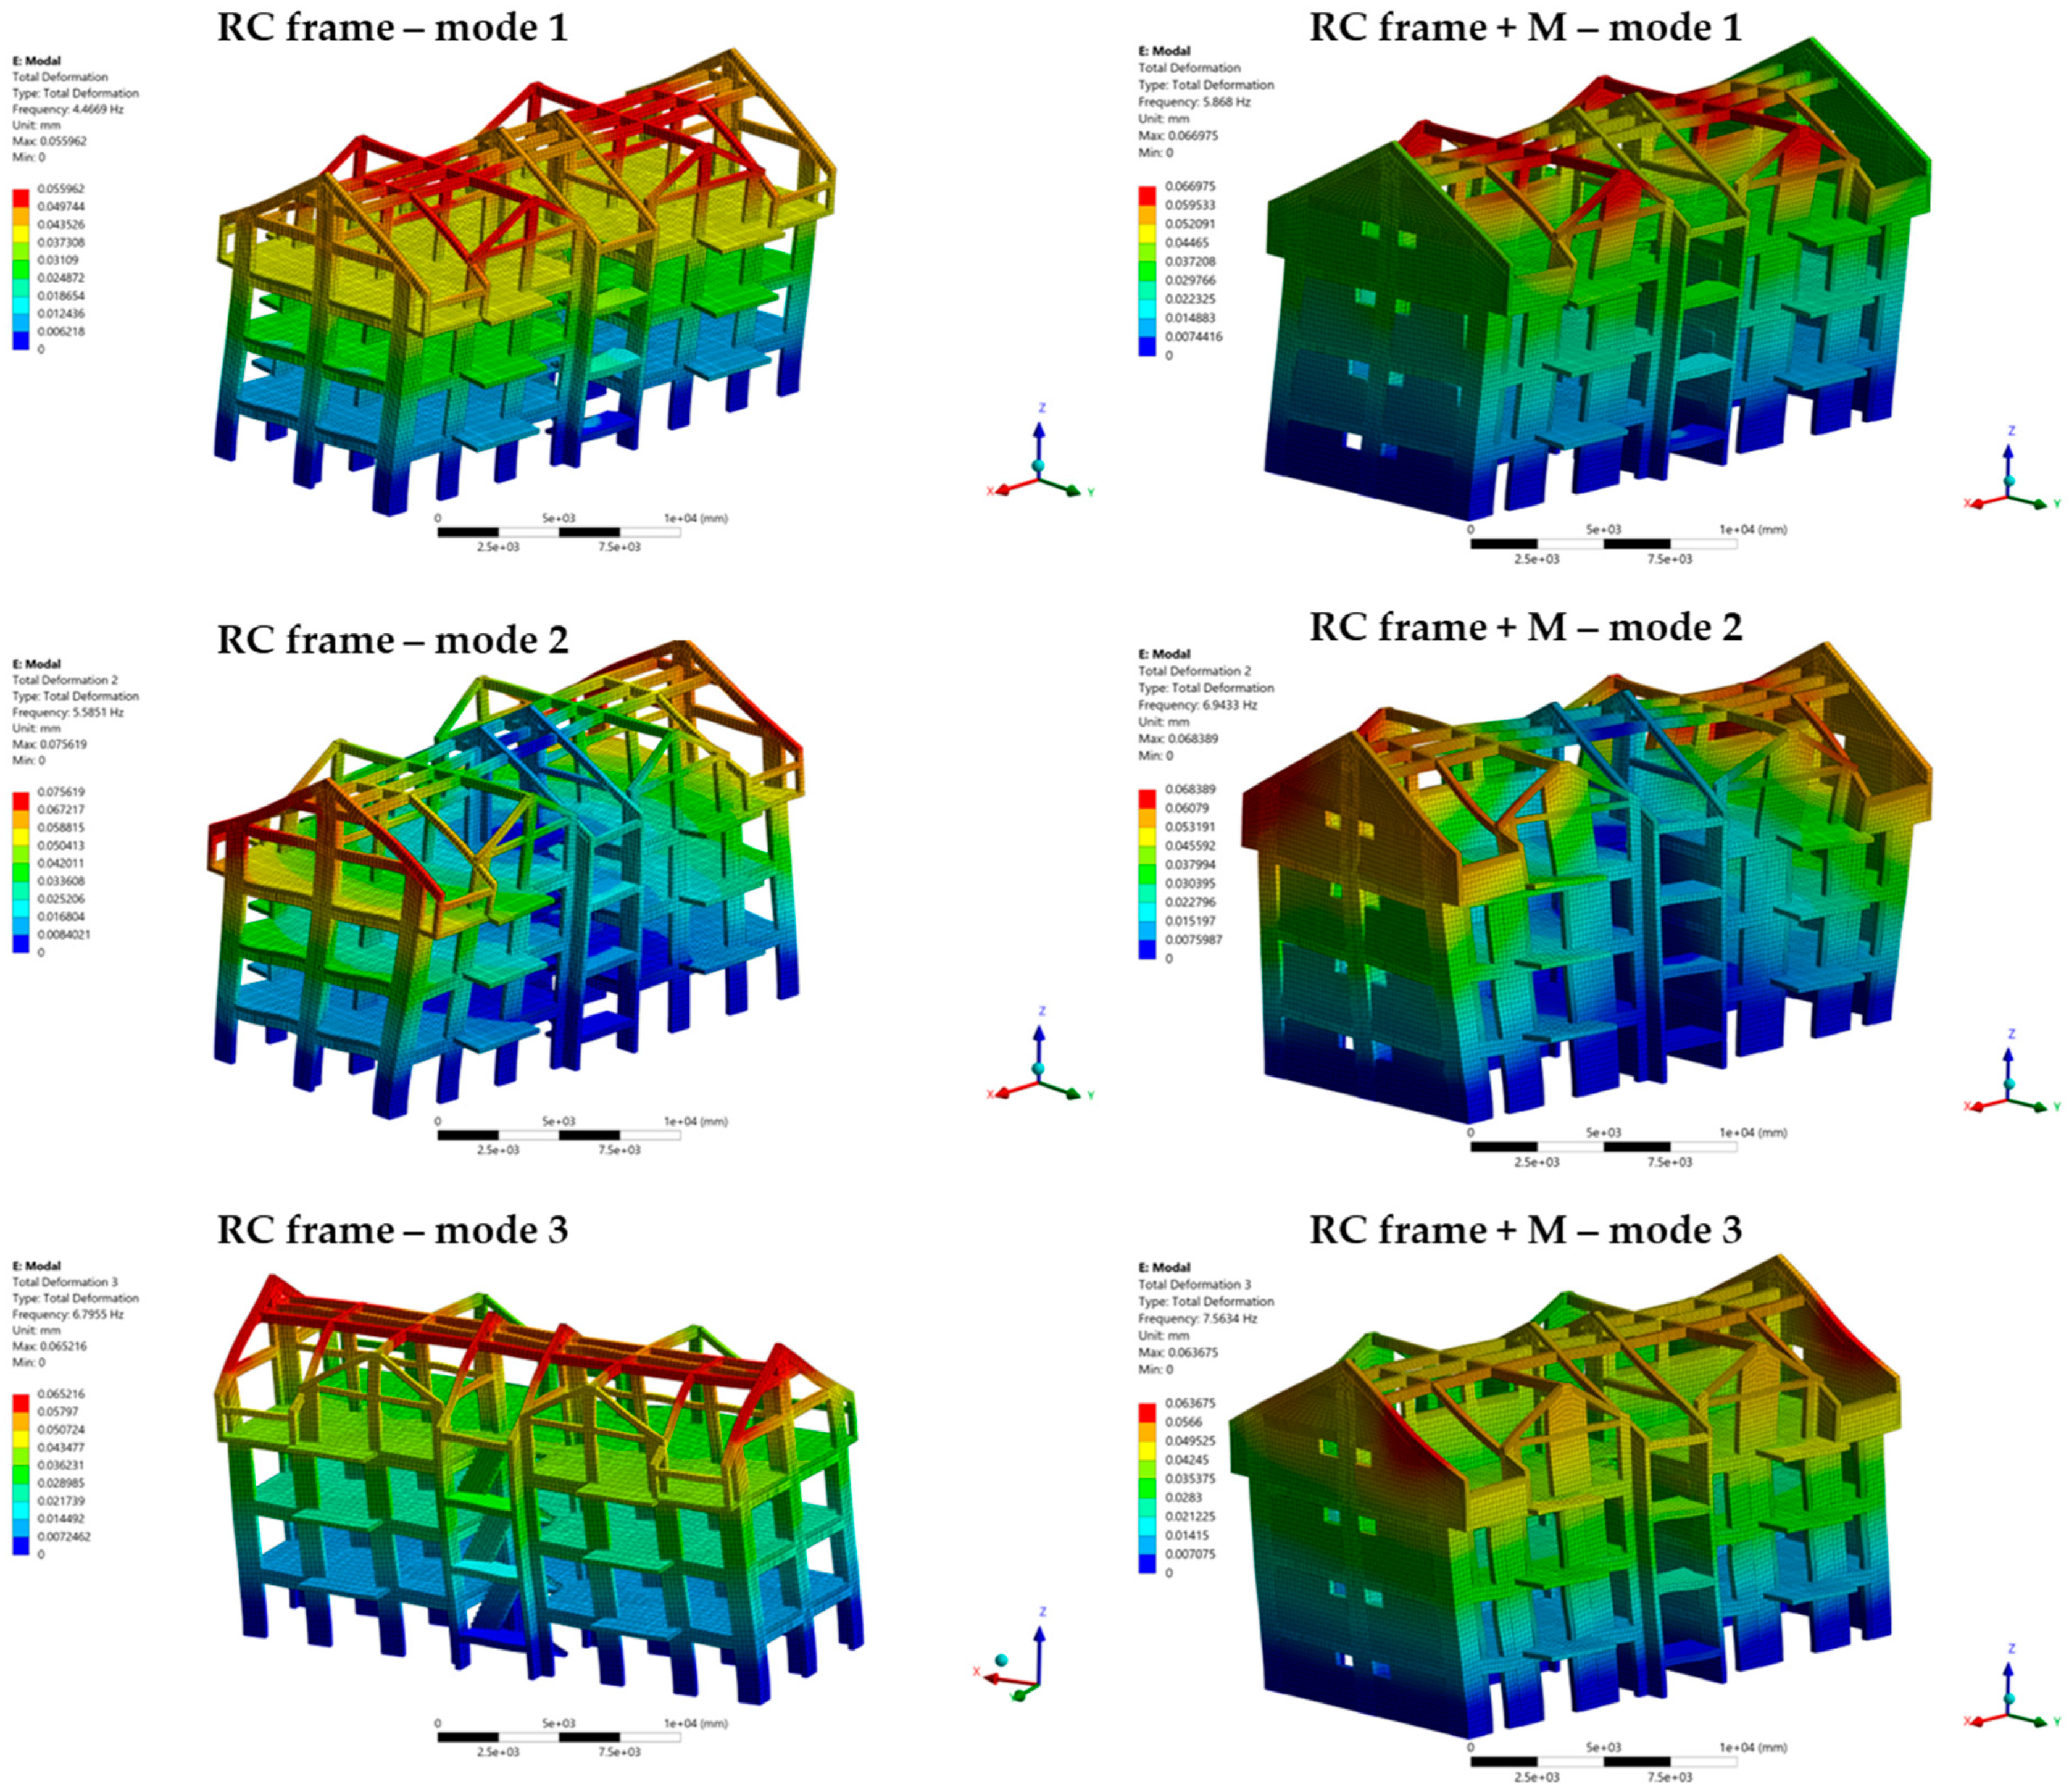
Figure 12.
Transversal (Y) displacement contours (Directional Deformation, ) at the time of peak roof response for the bare RC frame – VN90 scenario.
Figure 12.
Transversal (Y) displacement contours (Directional Deformation, ) at the time of peak roof response for the bare RC frame – VN90 scenario.
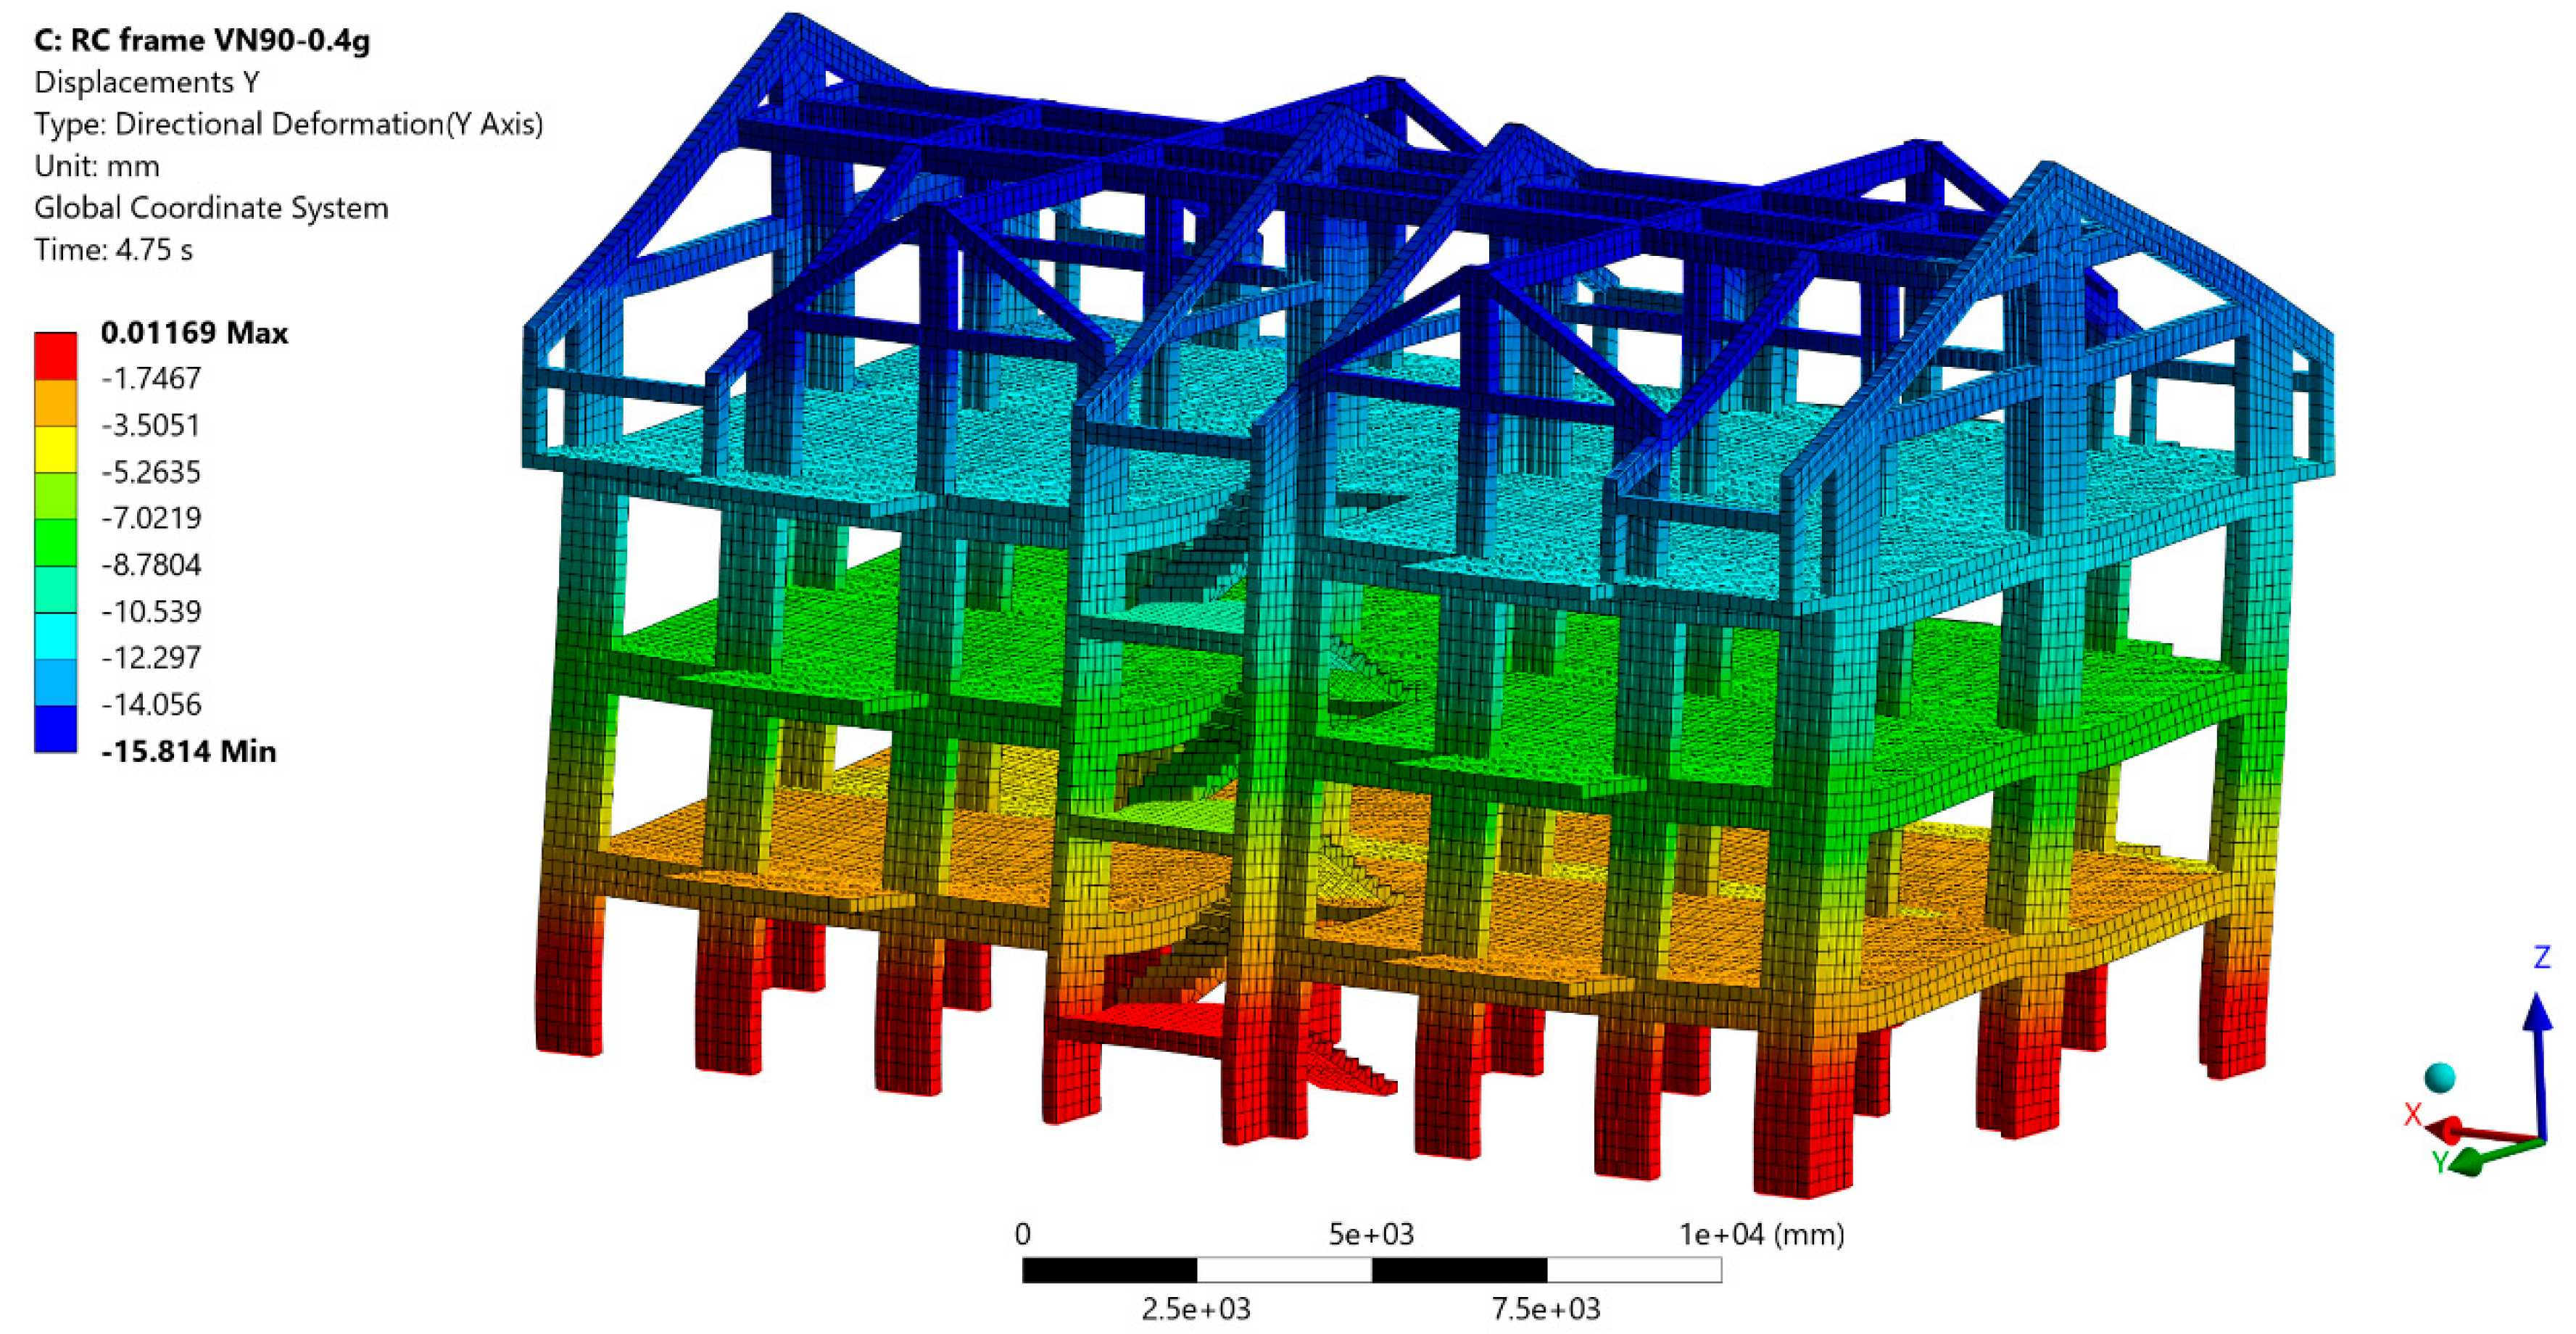
Figure 13.
Transversal (Y) displacement contours (Directional Deformation, ) at the time of peak roof response for the RC frame with masonry infills, RC+M – VN90 scenario
Figure 13.
Transversal (Y) displacement contours (Directional Deformation, ) at the time of peak roof response for the RC frame with masonry infills, RC+M – VN90 scenario
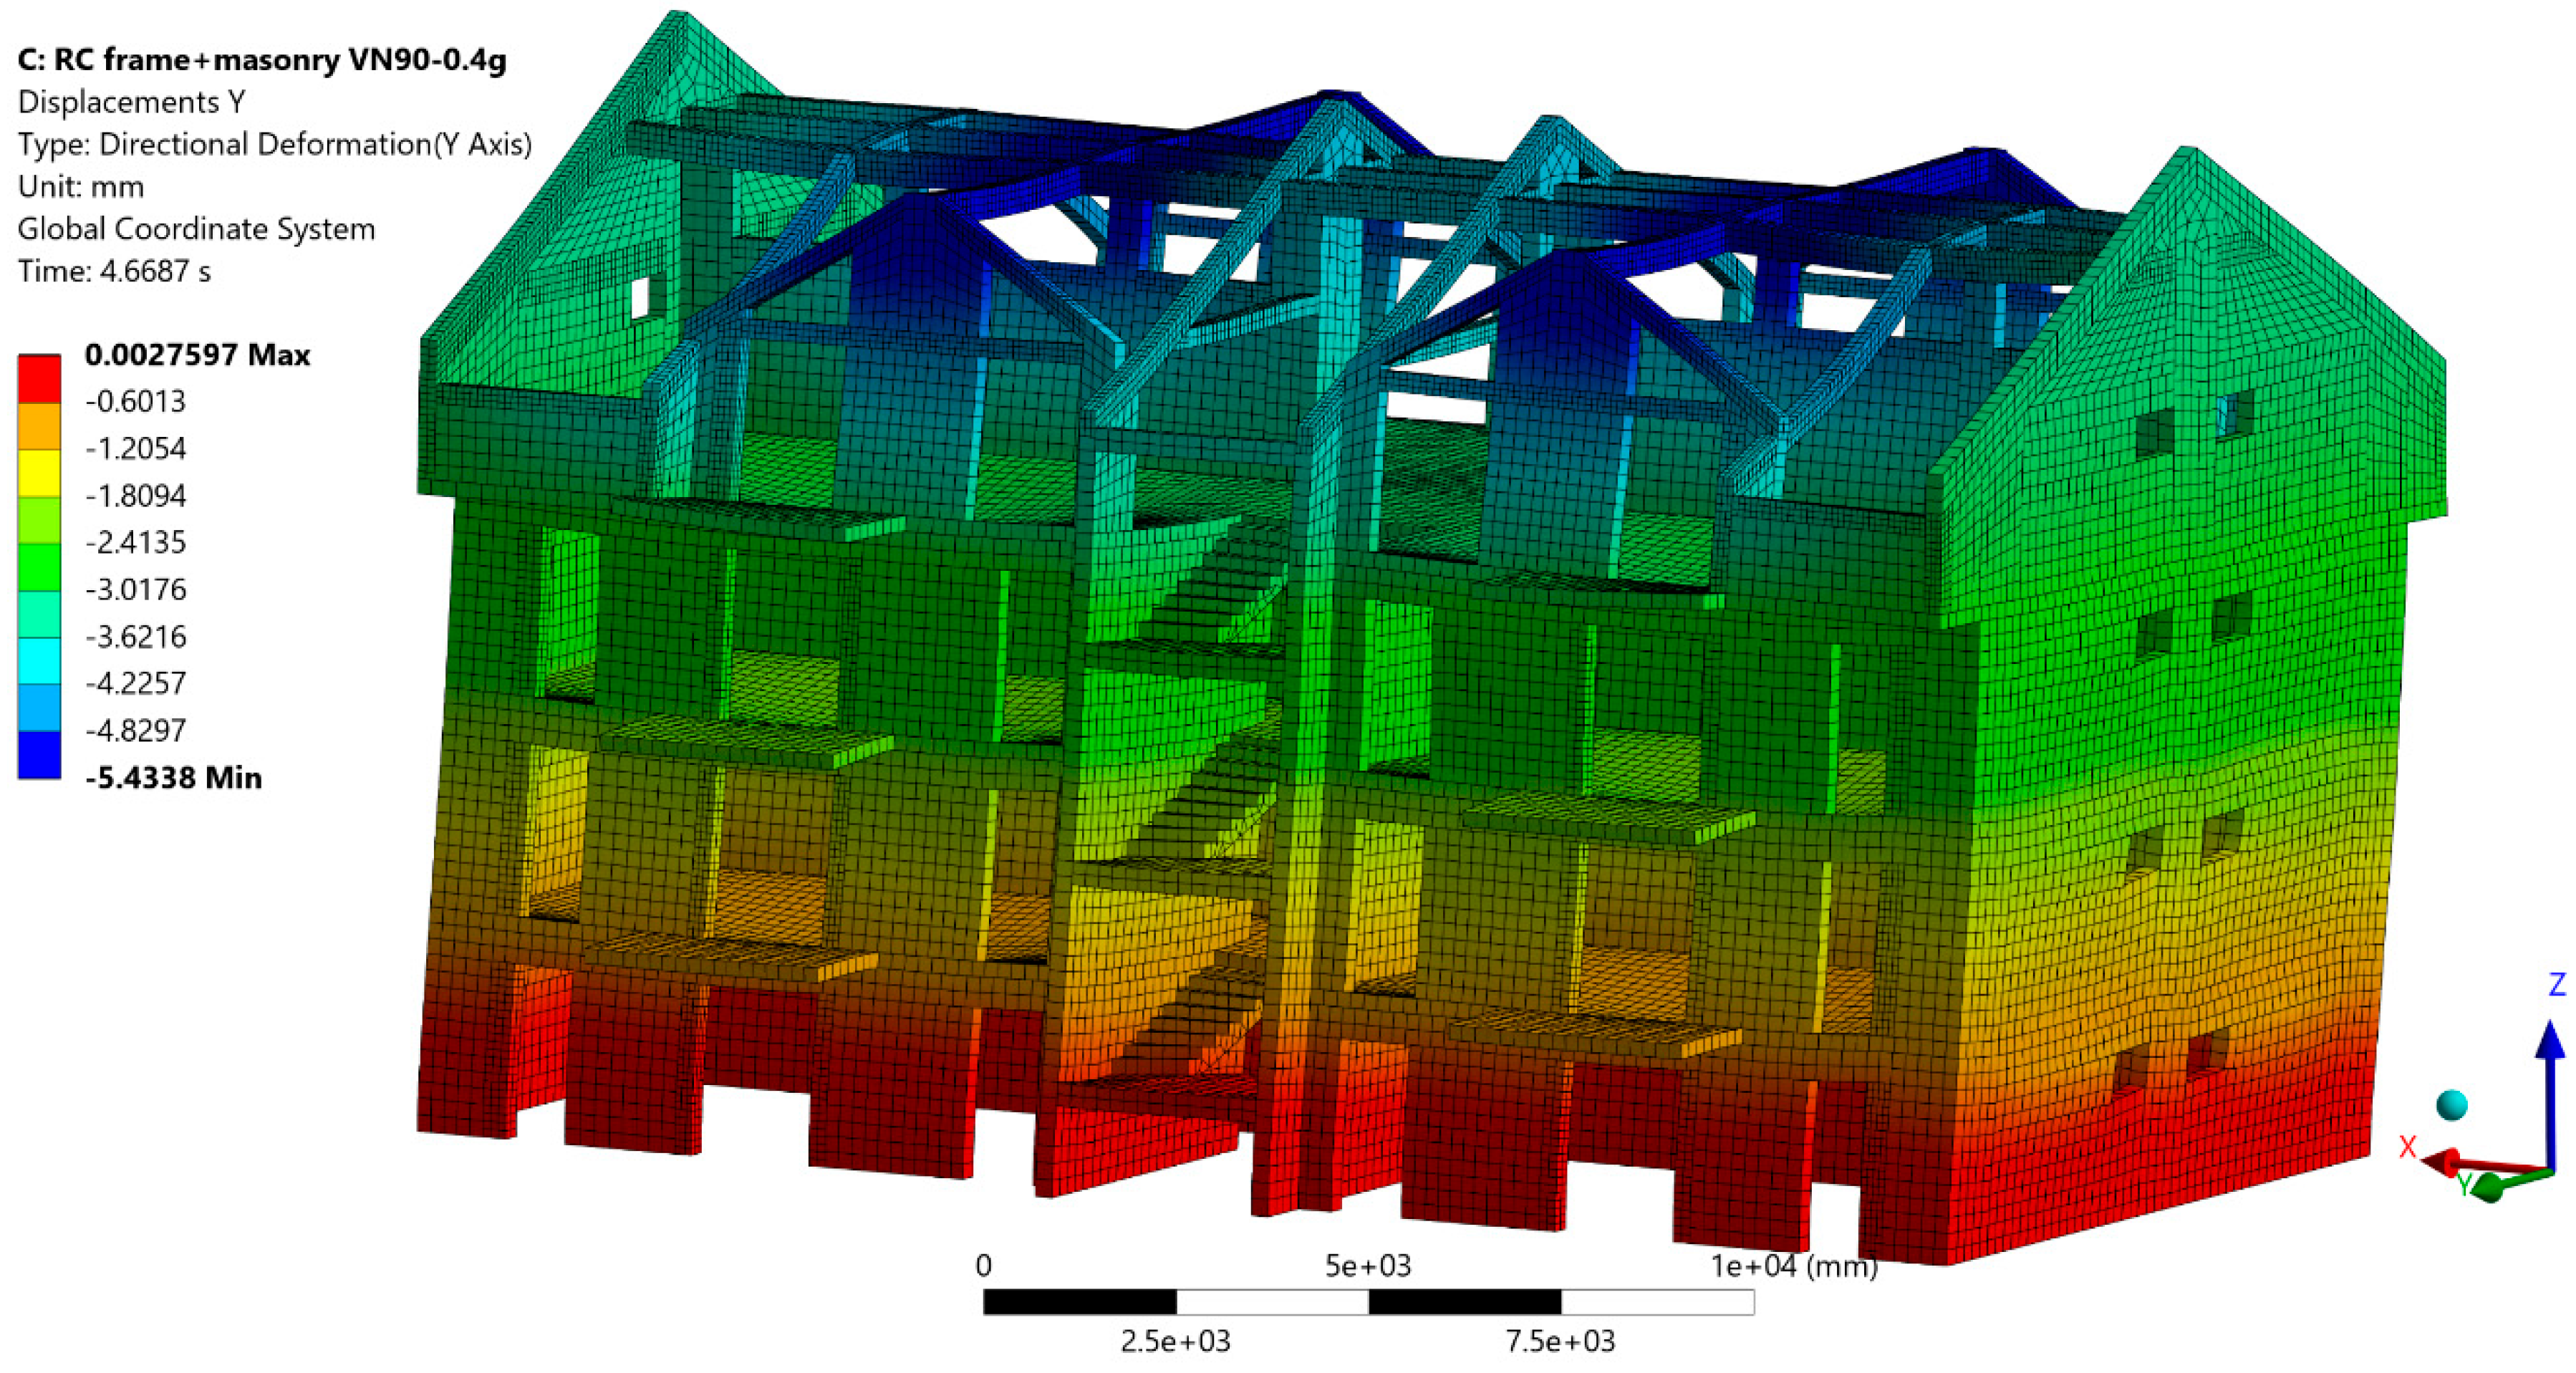
Figure 14.
Peak floor displacements along the transversal direction (Y) for RC and RC+M under VN77, VN90, and TK2023, reported at levels B, S1, S2, S3, and roof R; inset shows the monitoring points and the global coordinate system.
Figure 14.
Peak floor displacements along the transversal direction (Y) for RC and RC+M under VN77, VN90, and TK2023, reported at levels B, S1, S2, S3, and roof R; inset shows the monitoring points and the global coordinate system.
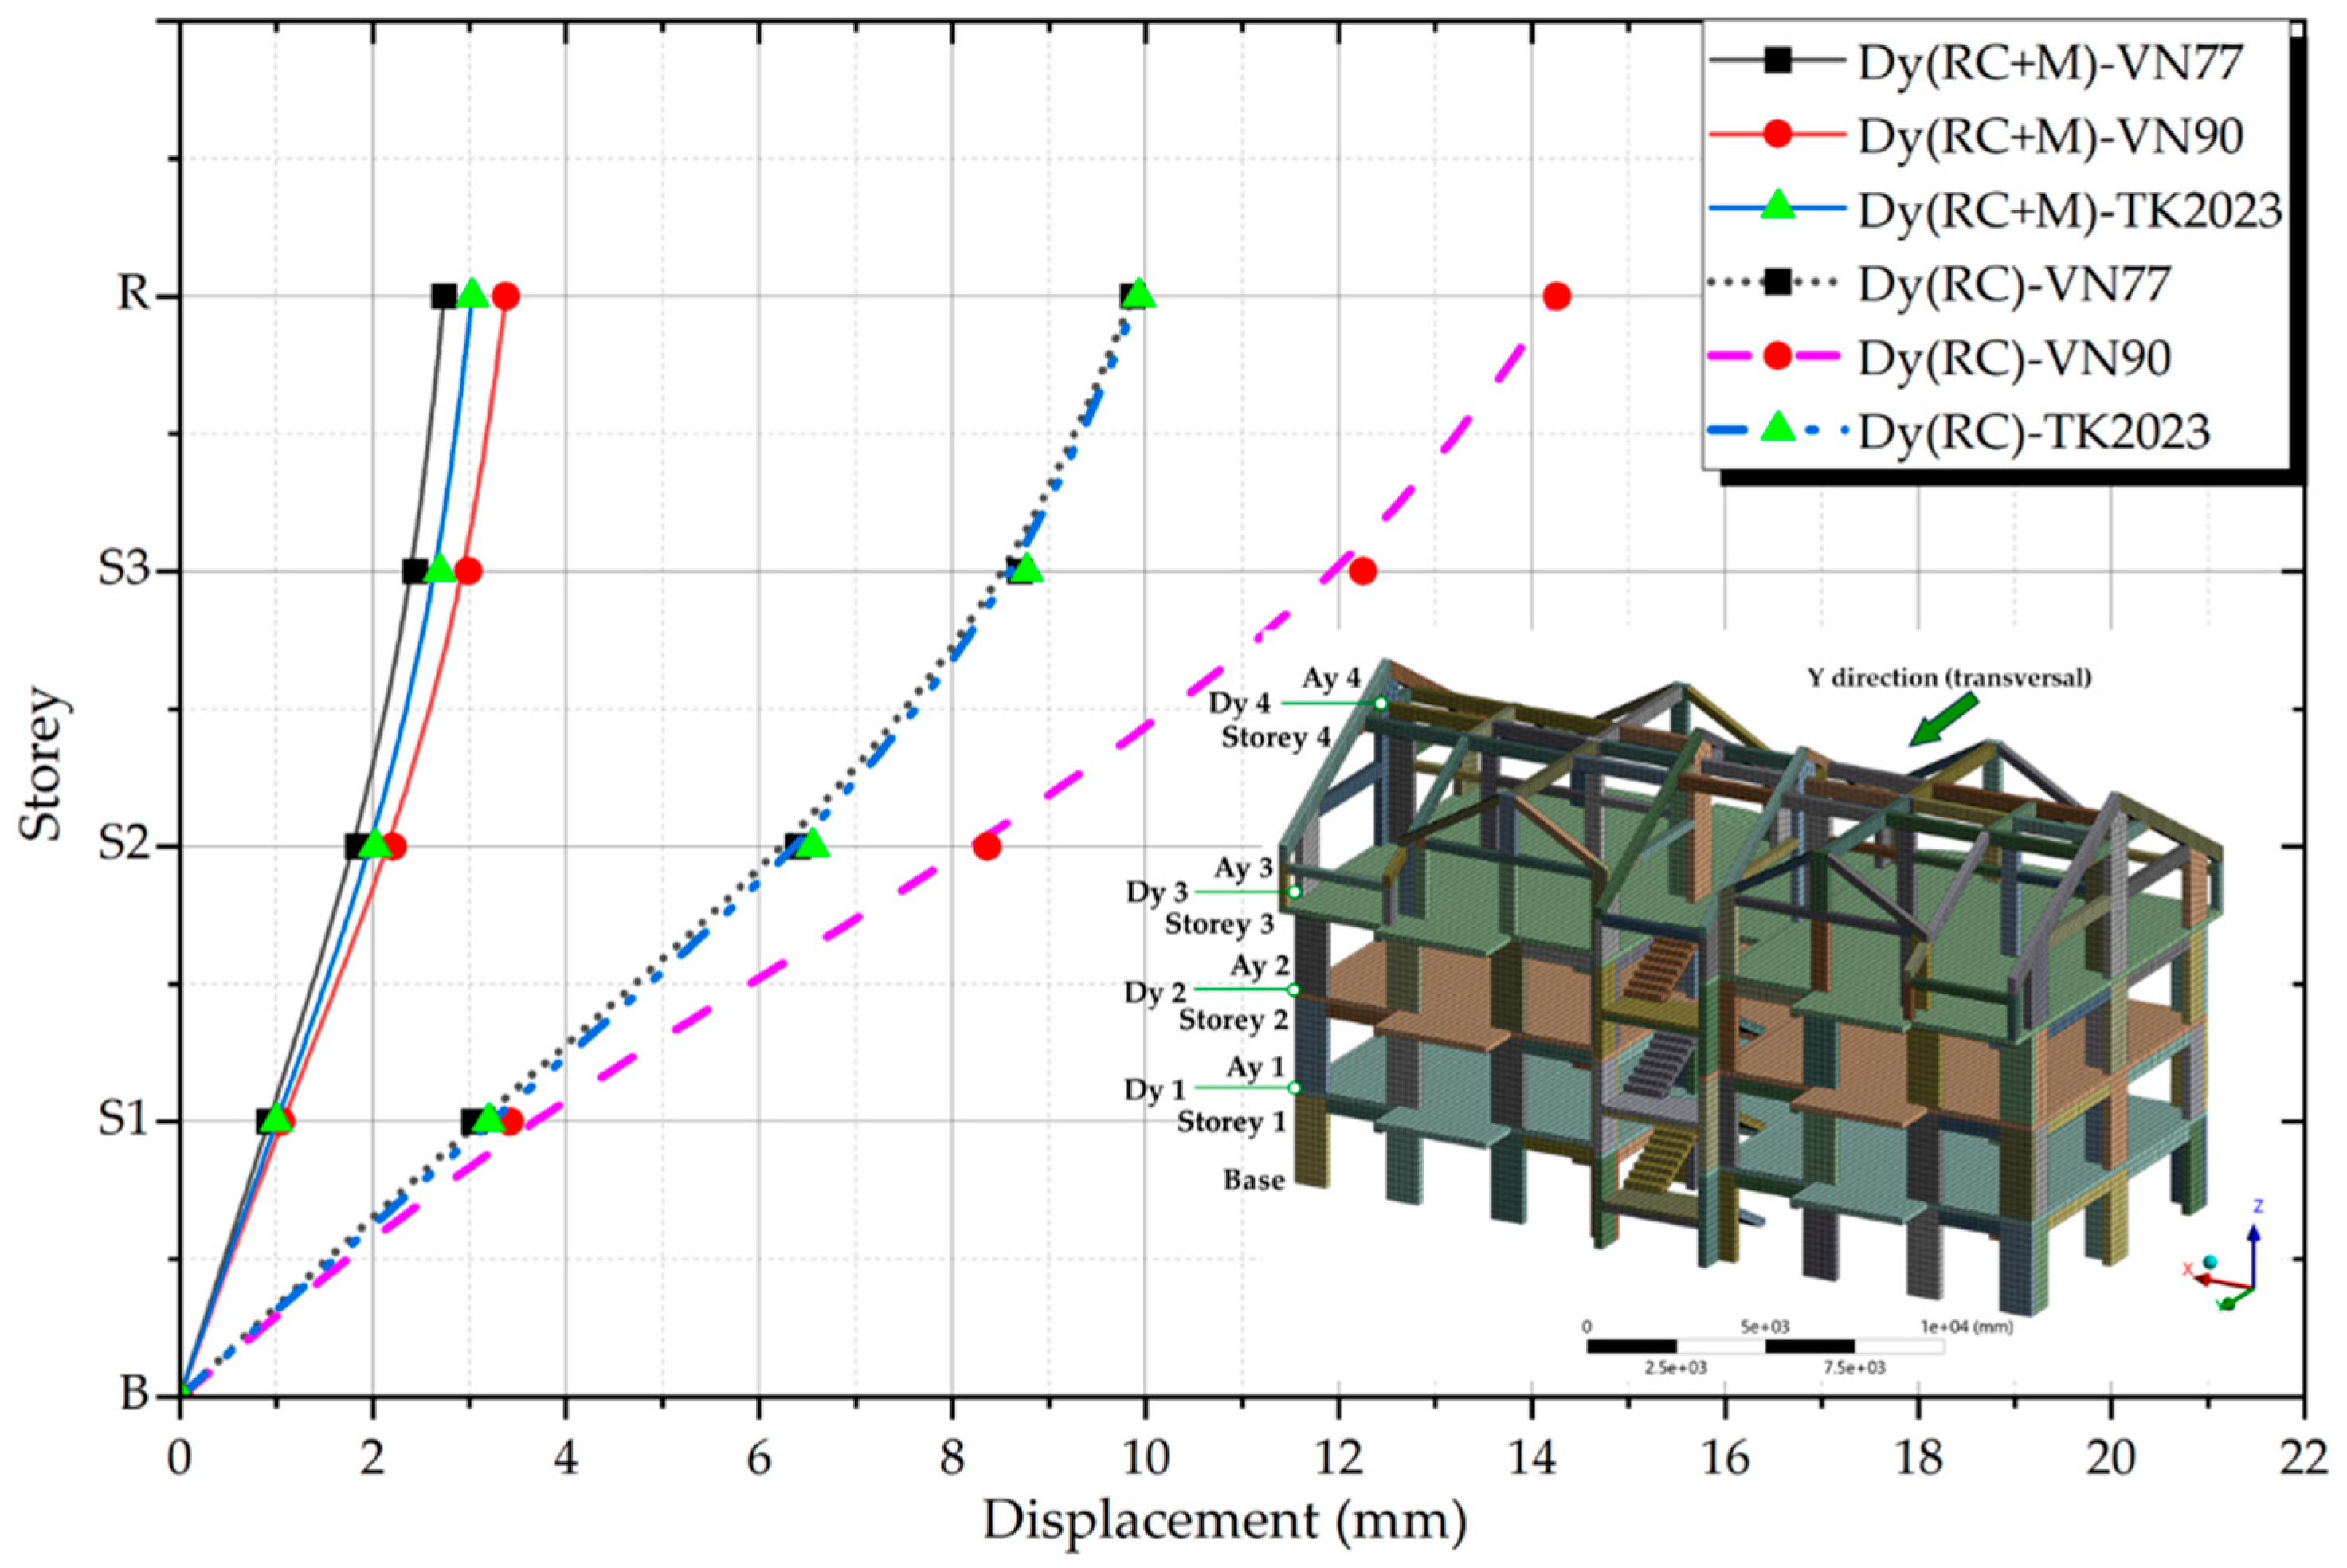
Figure 15.
Roof displacement time histories along Y (Dy4) for the bare RC frame (left column) and RC+M (right column) under VN77, VN90, and TK2023 (0.4g scaled).
Figure 15.
Roof displacement time histories along Y (Dy4) for the bare RC frame (left column) and RC+M (right column) under VN77, VN90, and TK2023 (0.4g scaled).
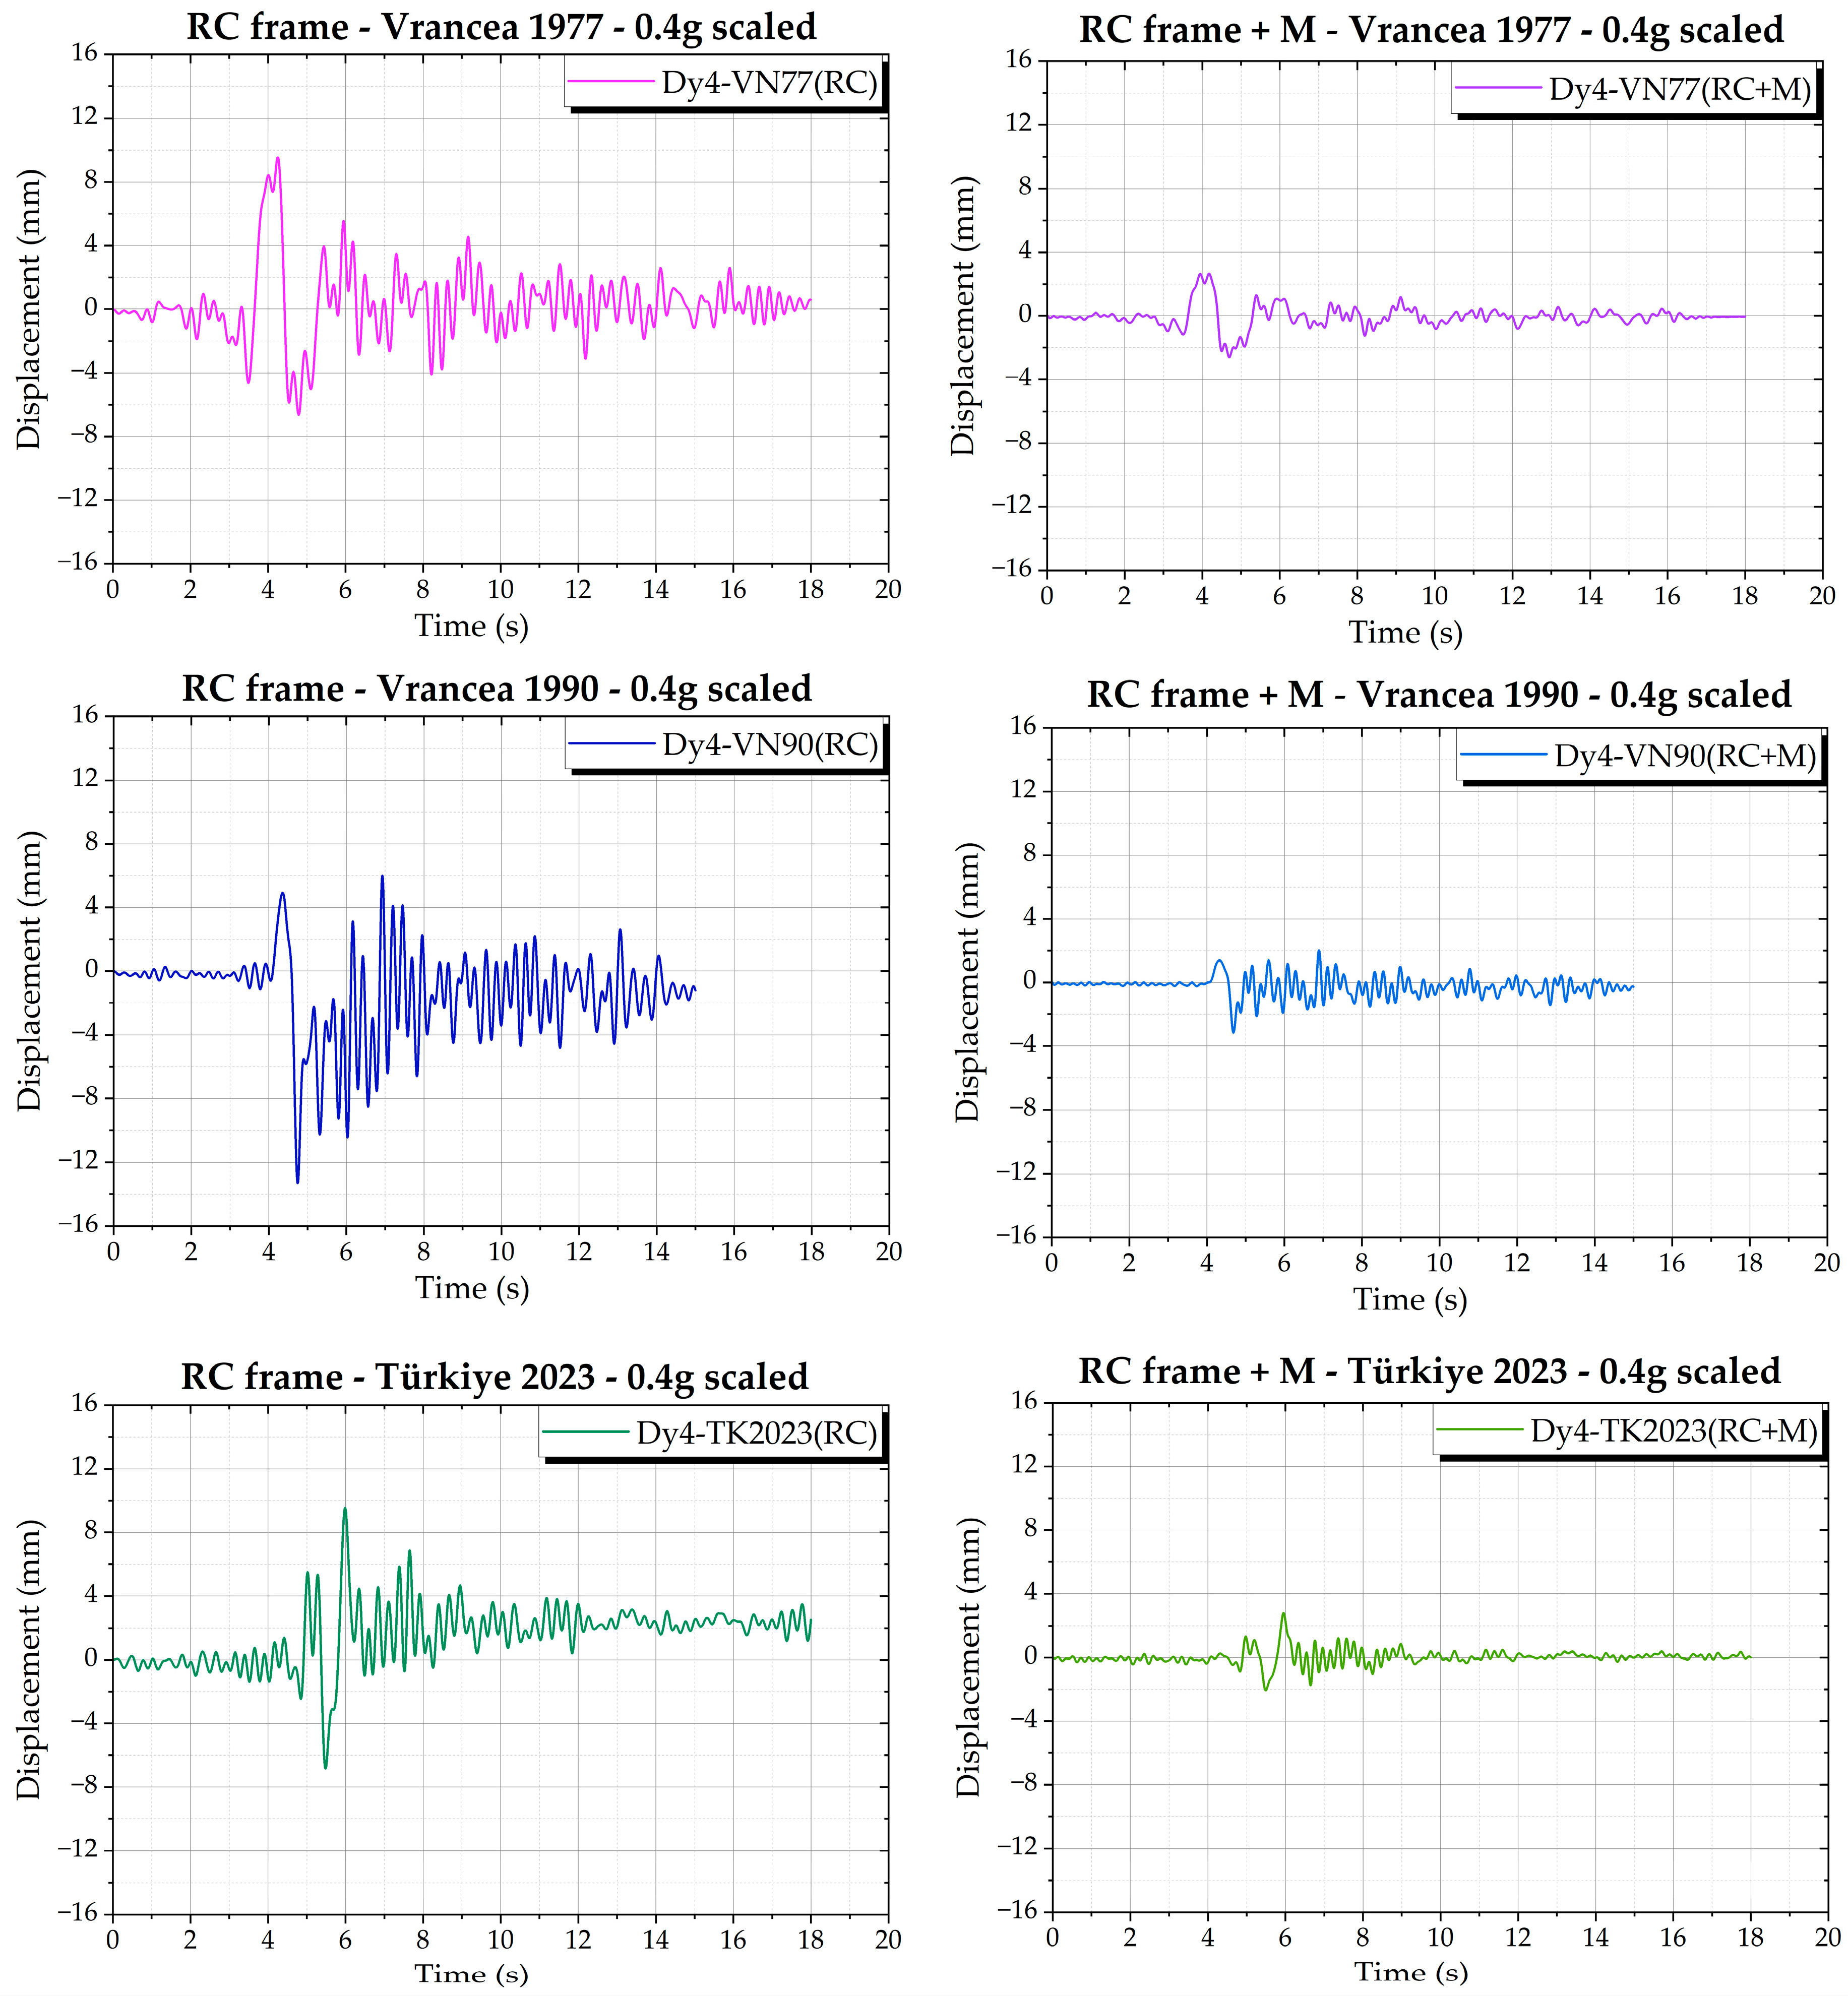
Figure 16.
Roof acceleration time histories along the transversal direction (Ay4, Y) for the bare RC frame and the RC frame with masonry infills (RC+M) under VN77, VN90, and TK2023 (0.4 g scaled).
Figure 16.
Roof acceleration time histories along the transversal direction (Ay4, Y) for the bare RC frame and the RC frame with masonry infills (RC+M) under VN77, VN90, and TK2023 (0.4 g scaled).
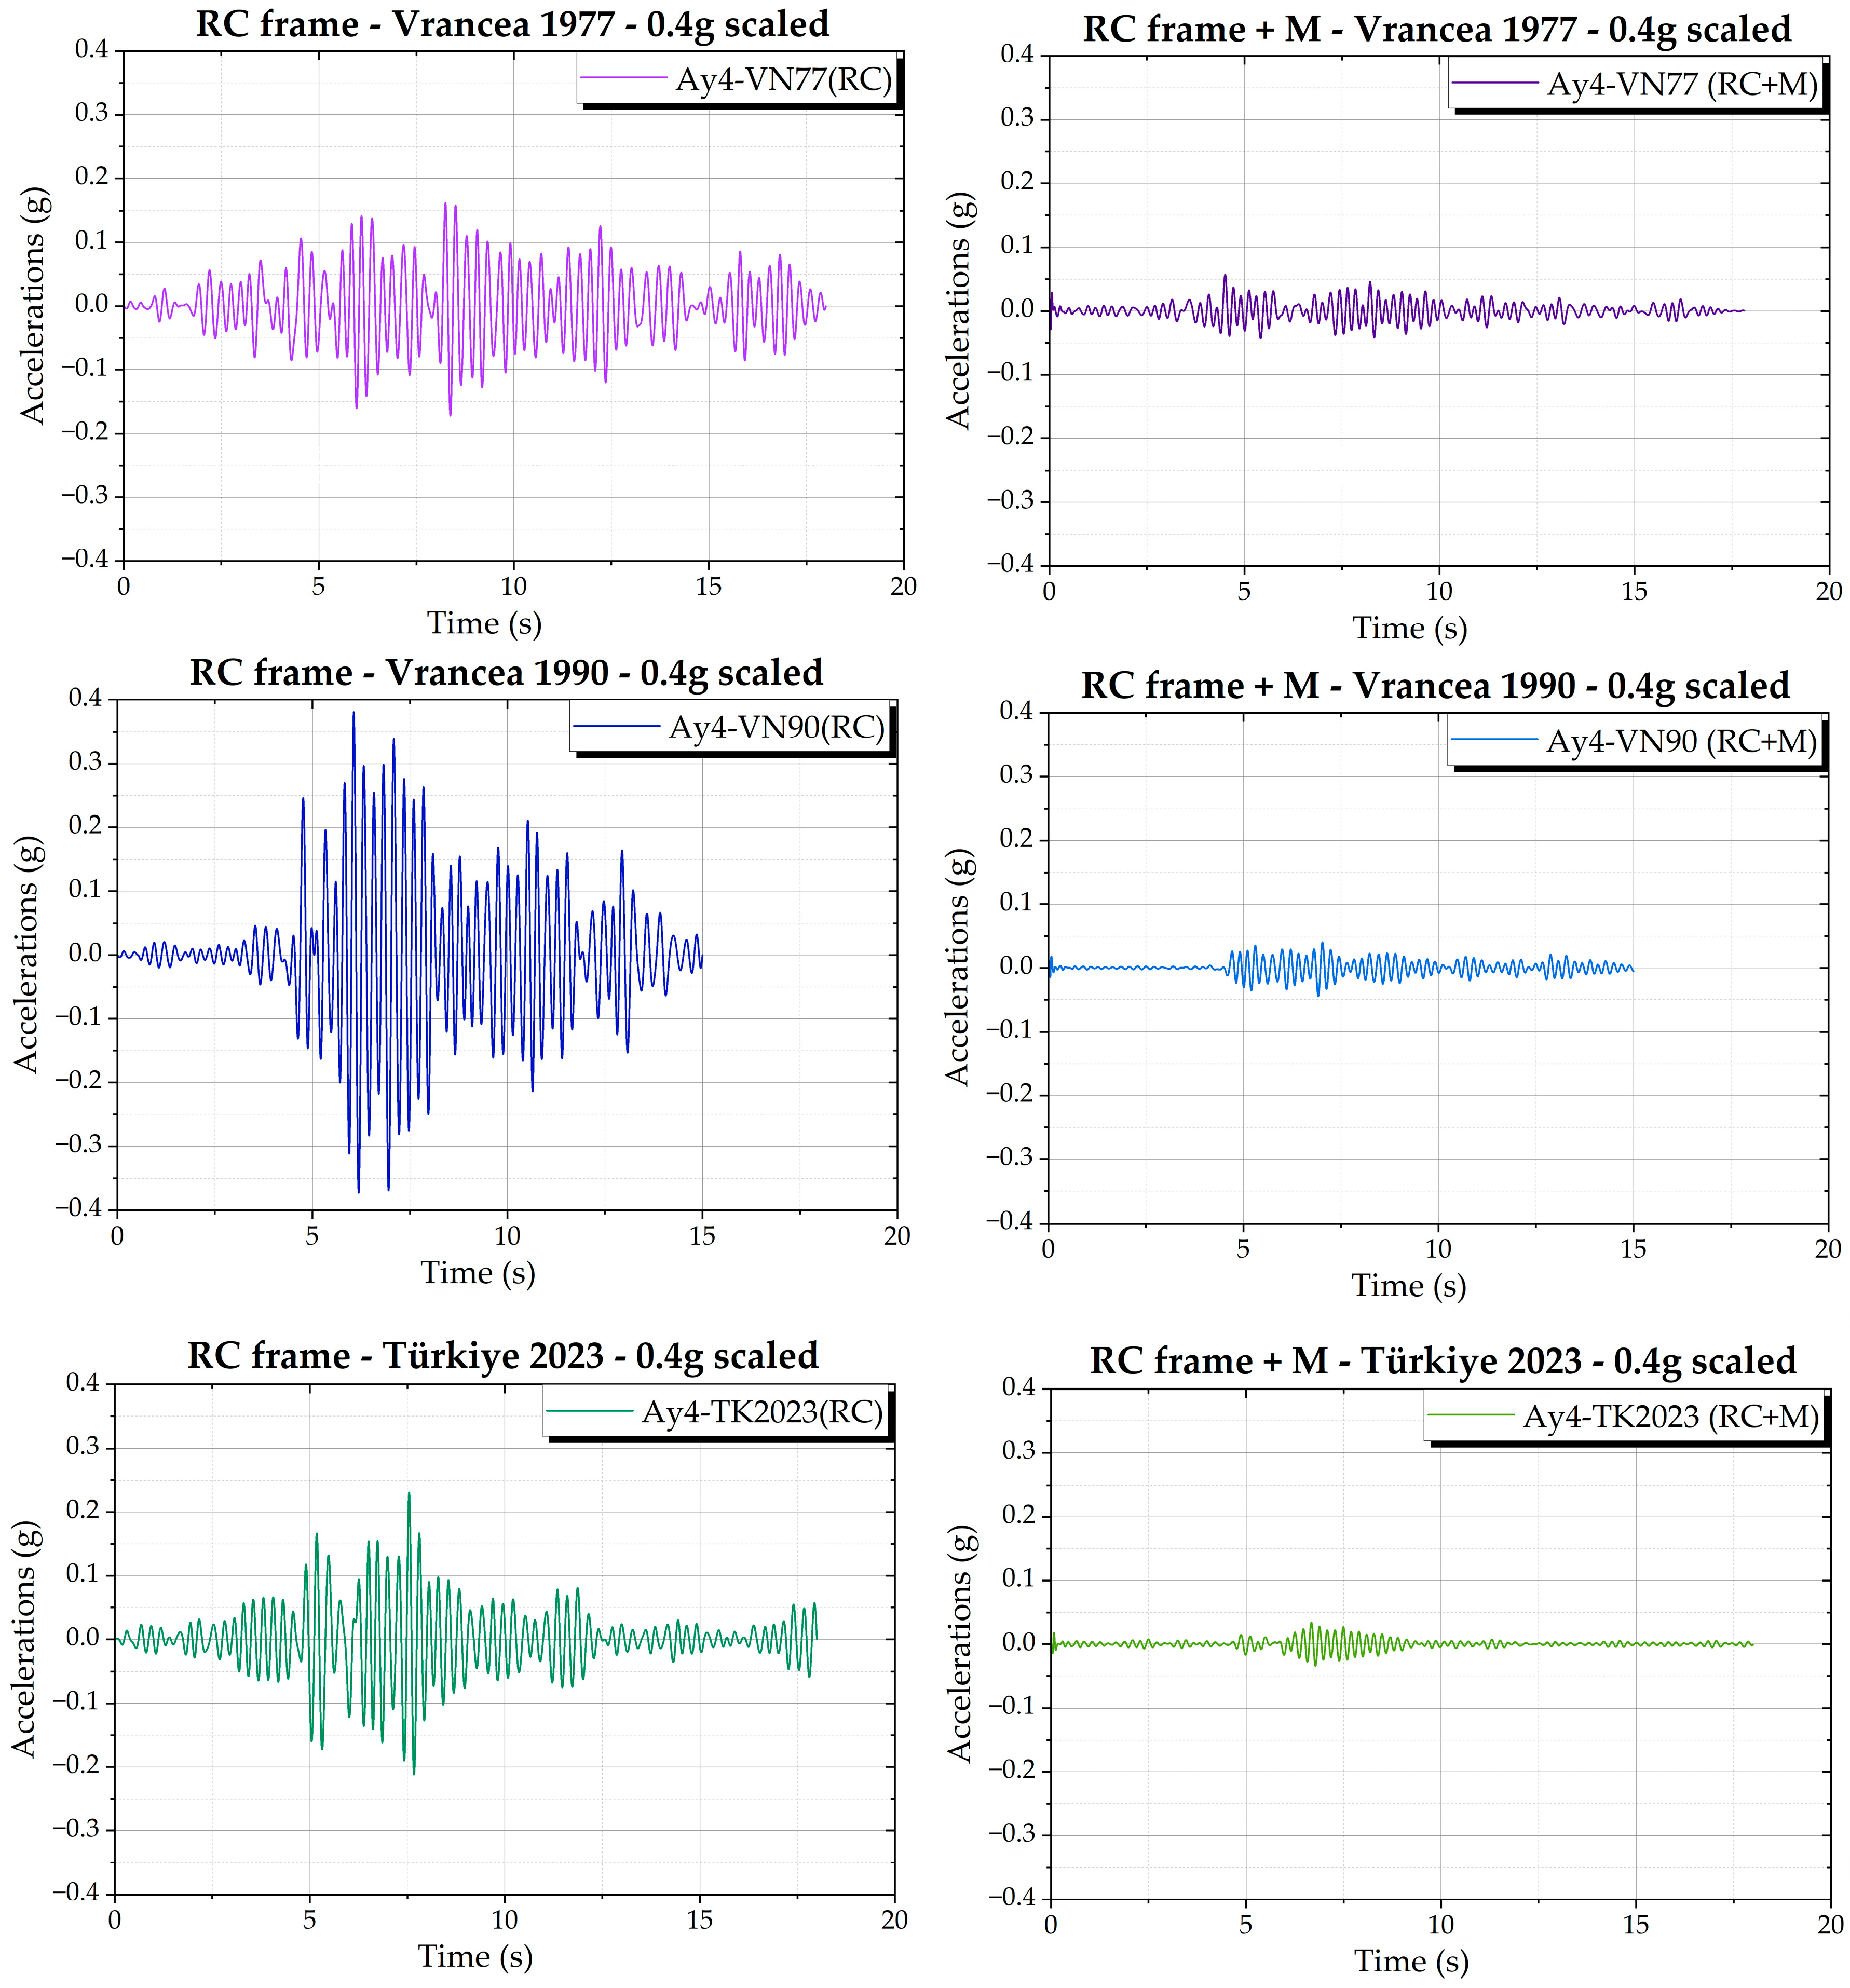
Figure 17.
Base shear–roof displacement hysteresis loops in the transversal direction: (base reaction) versus Dy4 (roof displacement along Y)
Figure 17.
Base shear–roof displacement hysteresis loops in the transversal direction: (base reaction) versus Dy4 (roof displacement along Y)
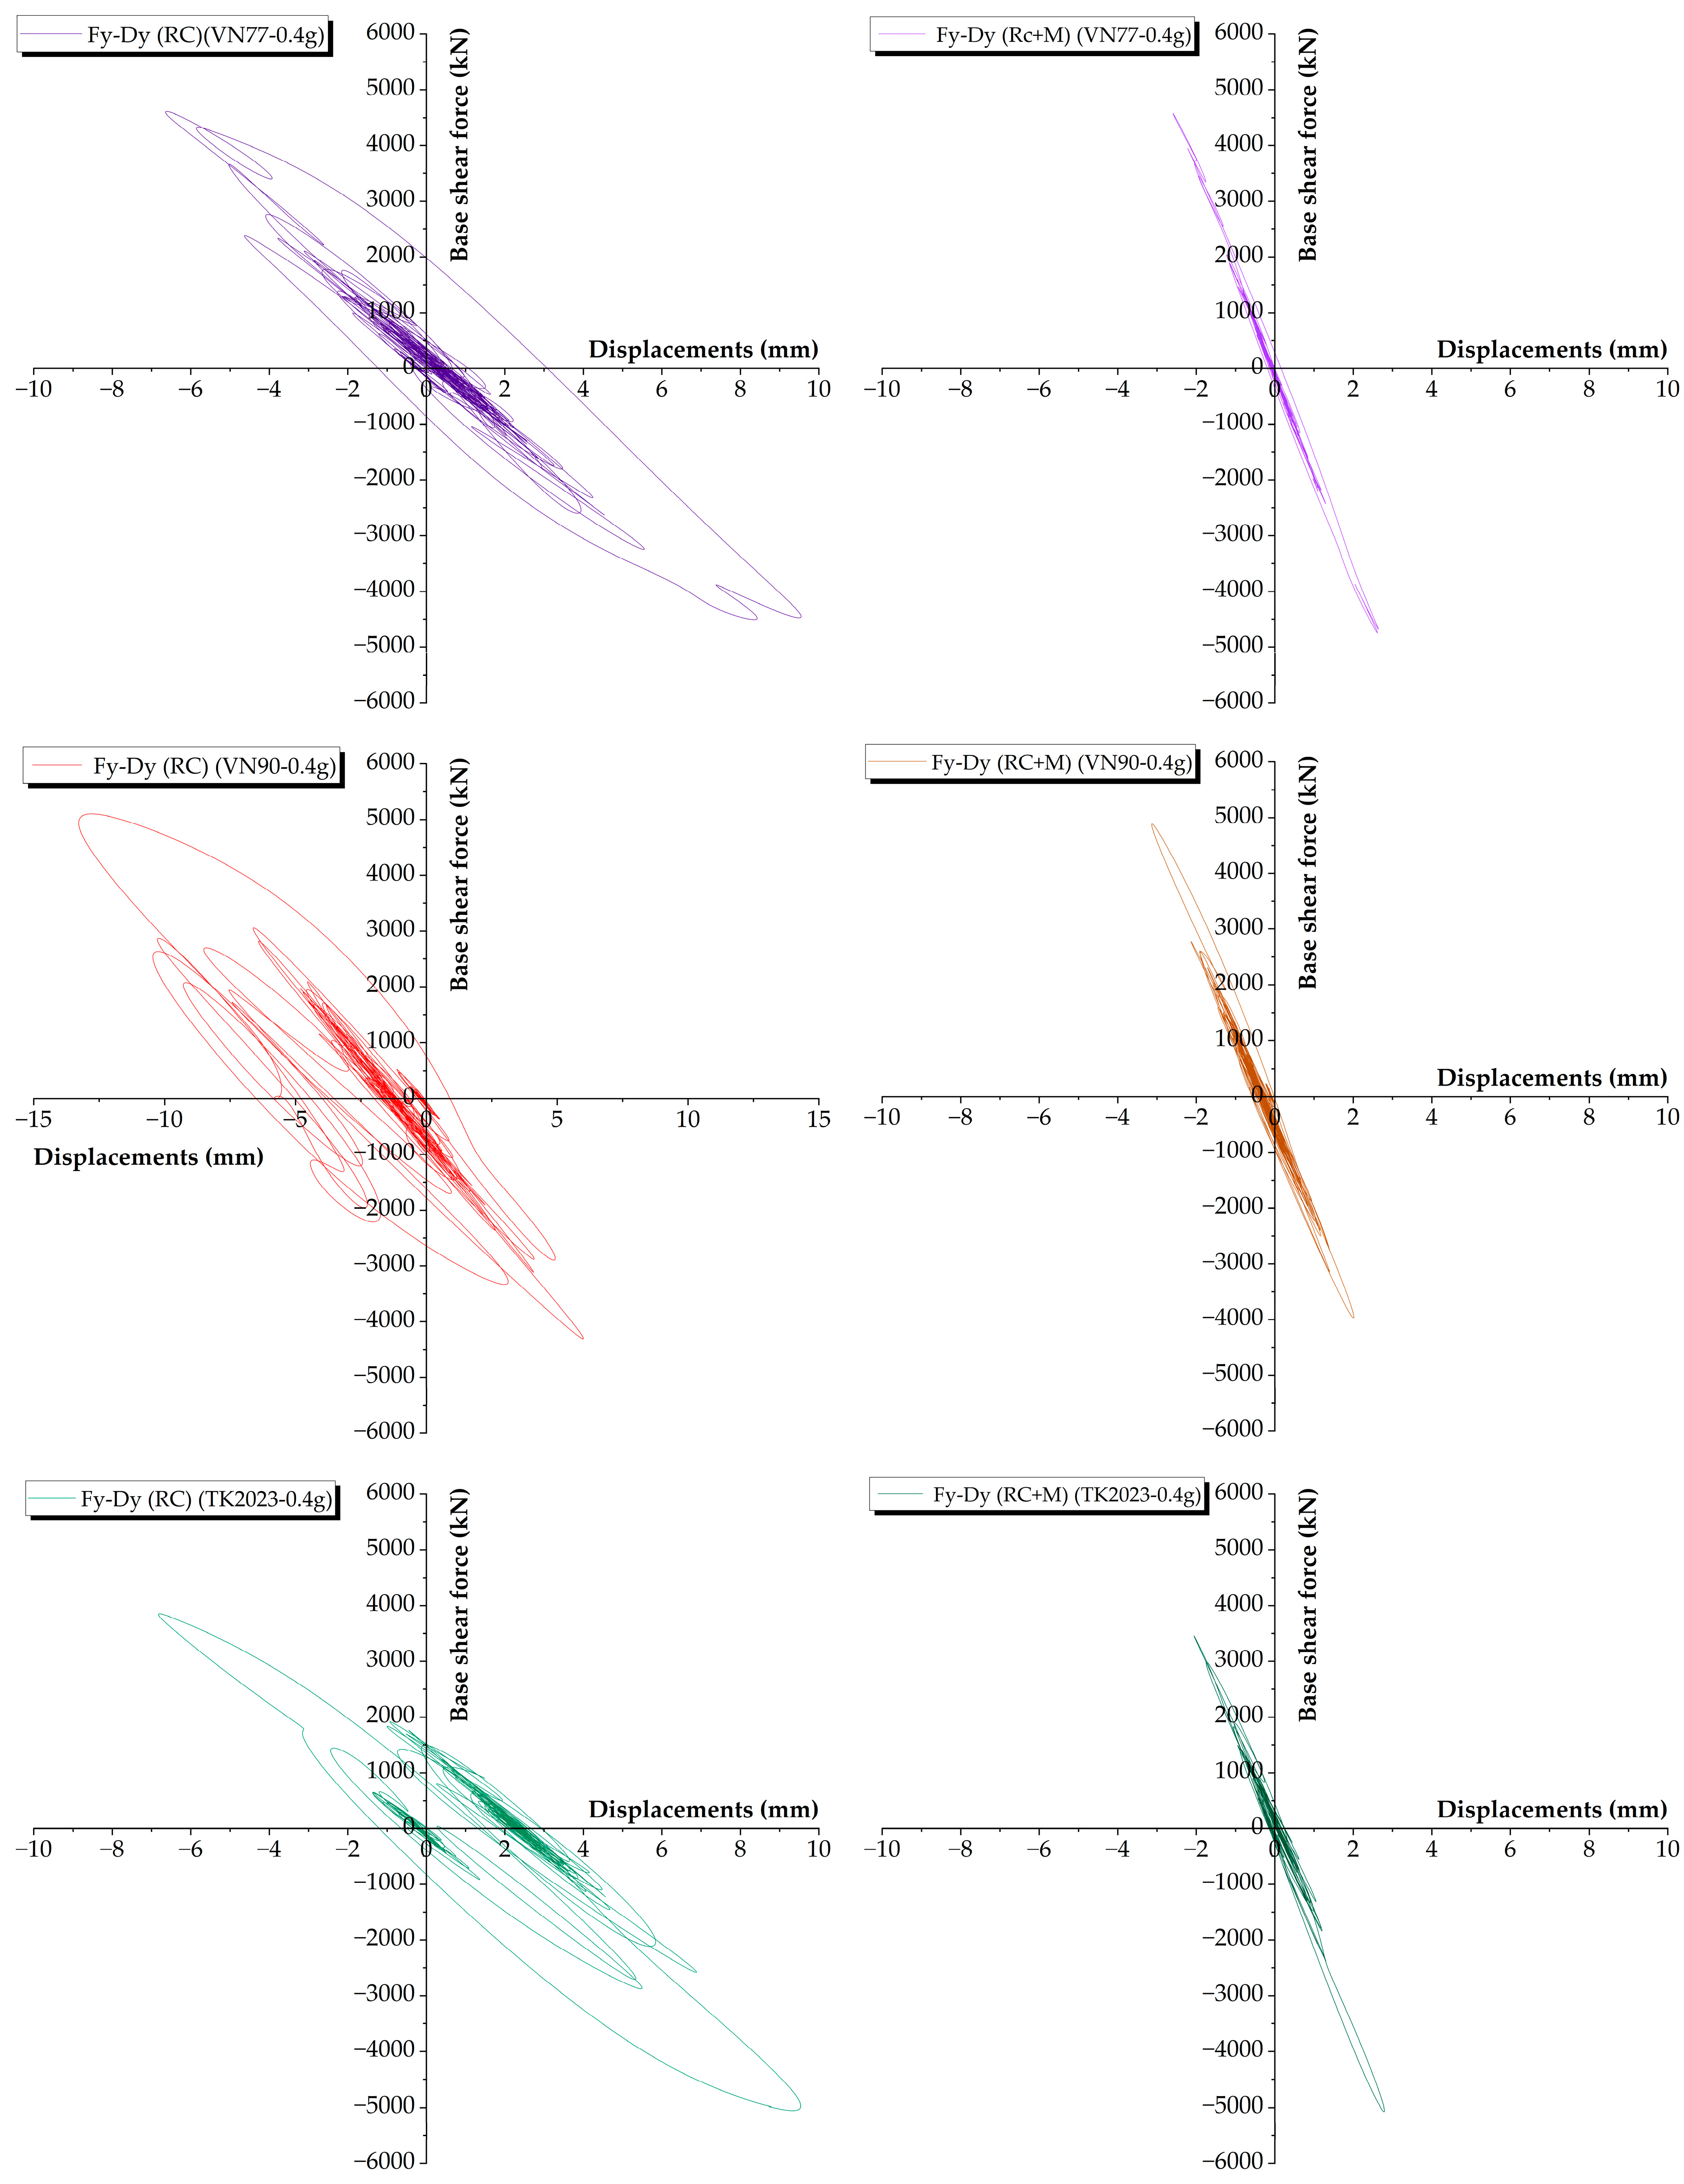
Figure 18.
Maximum principal stress in concrete elements RC frame model, VN90-0.4g scenario.
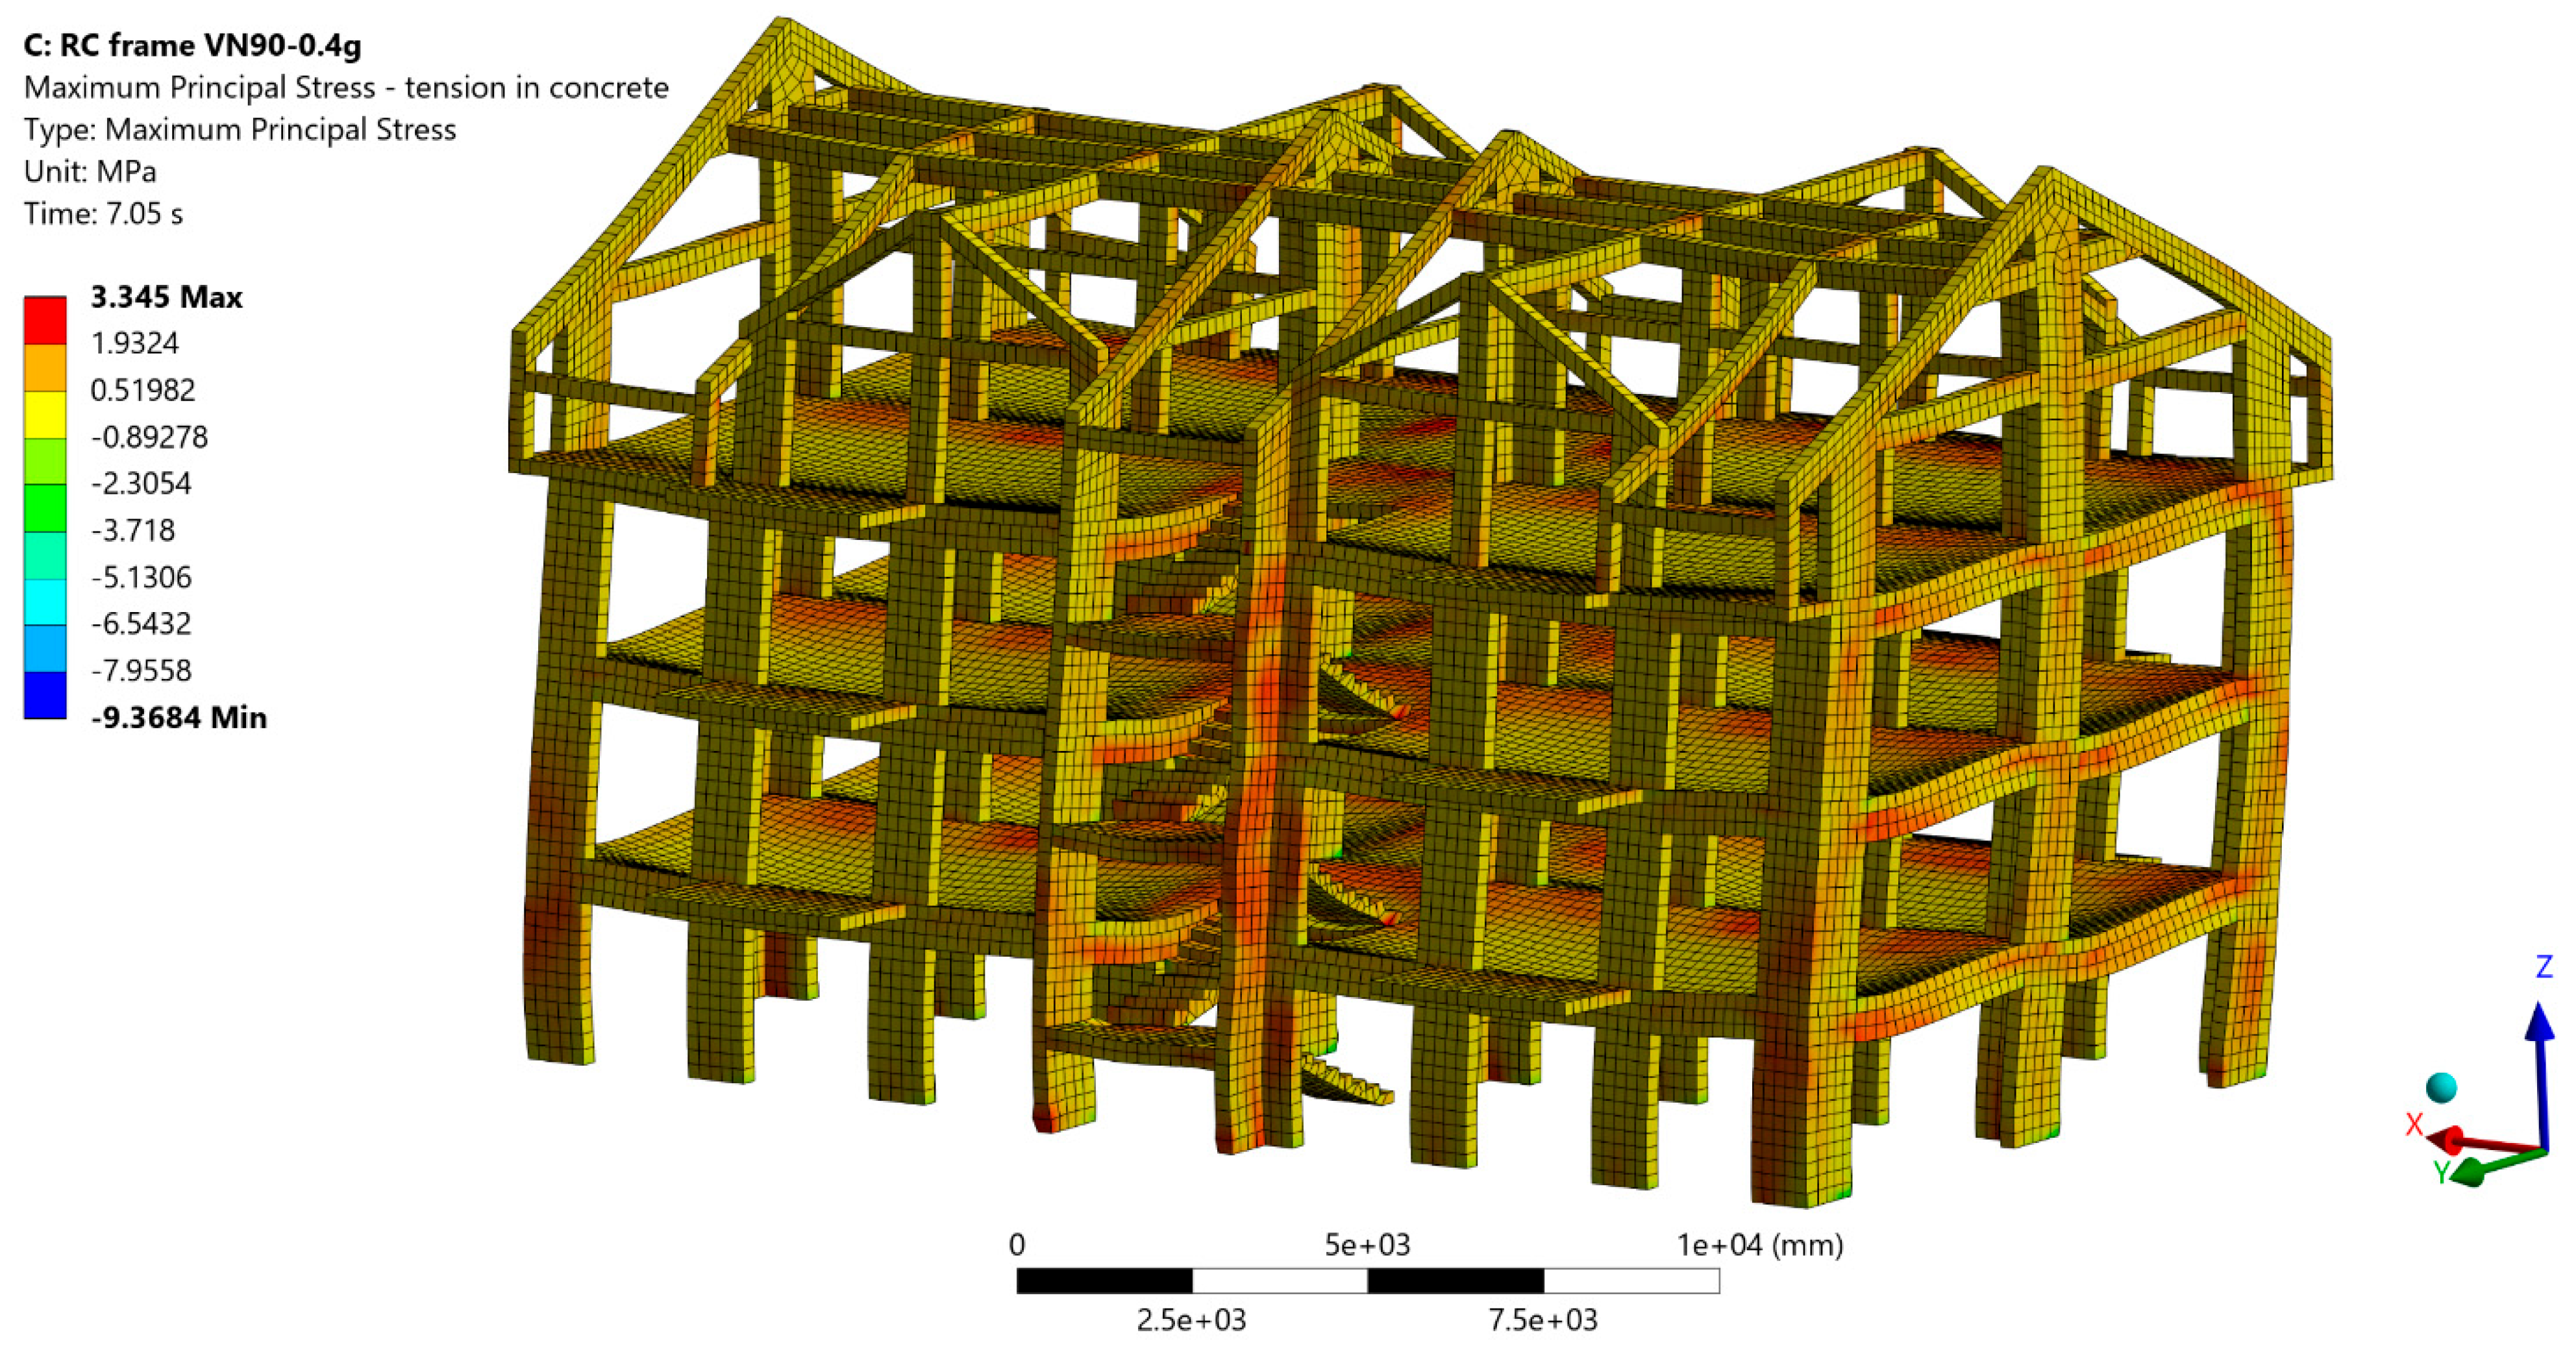
Figure 19.
Maximum principal stress in concrete and masonry elements RC frame + masonry model, VN90-0.4g scenario.
Figure 19.
Maximum principal stress in concrete and masonry elements RC frame + masonry model, VN90-0.4g scenario.
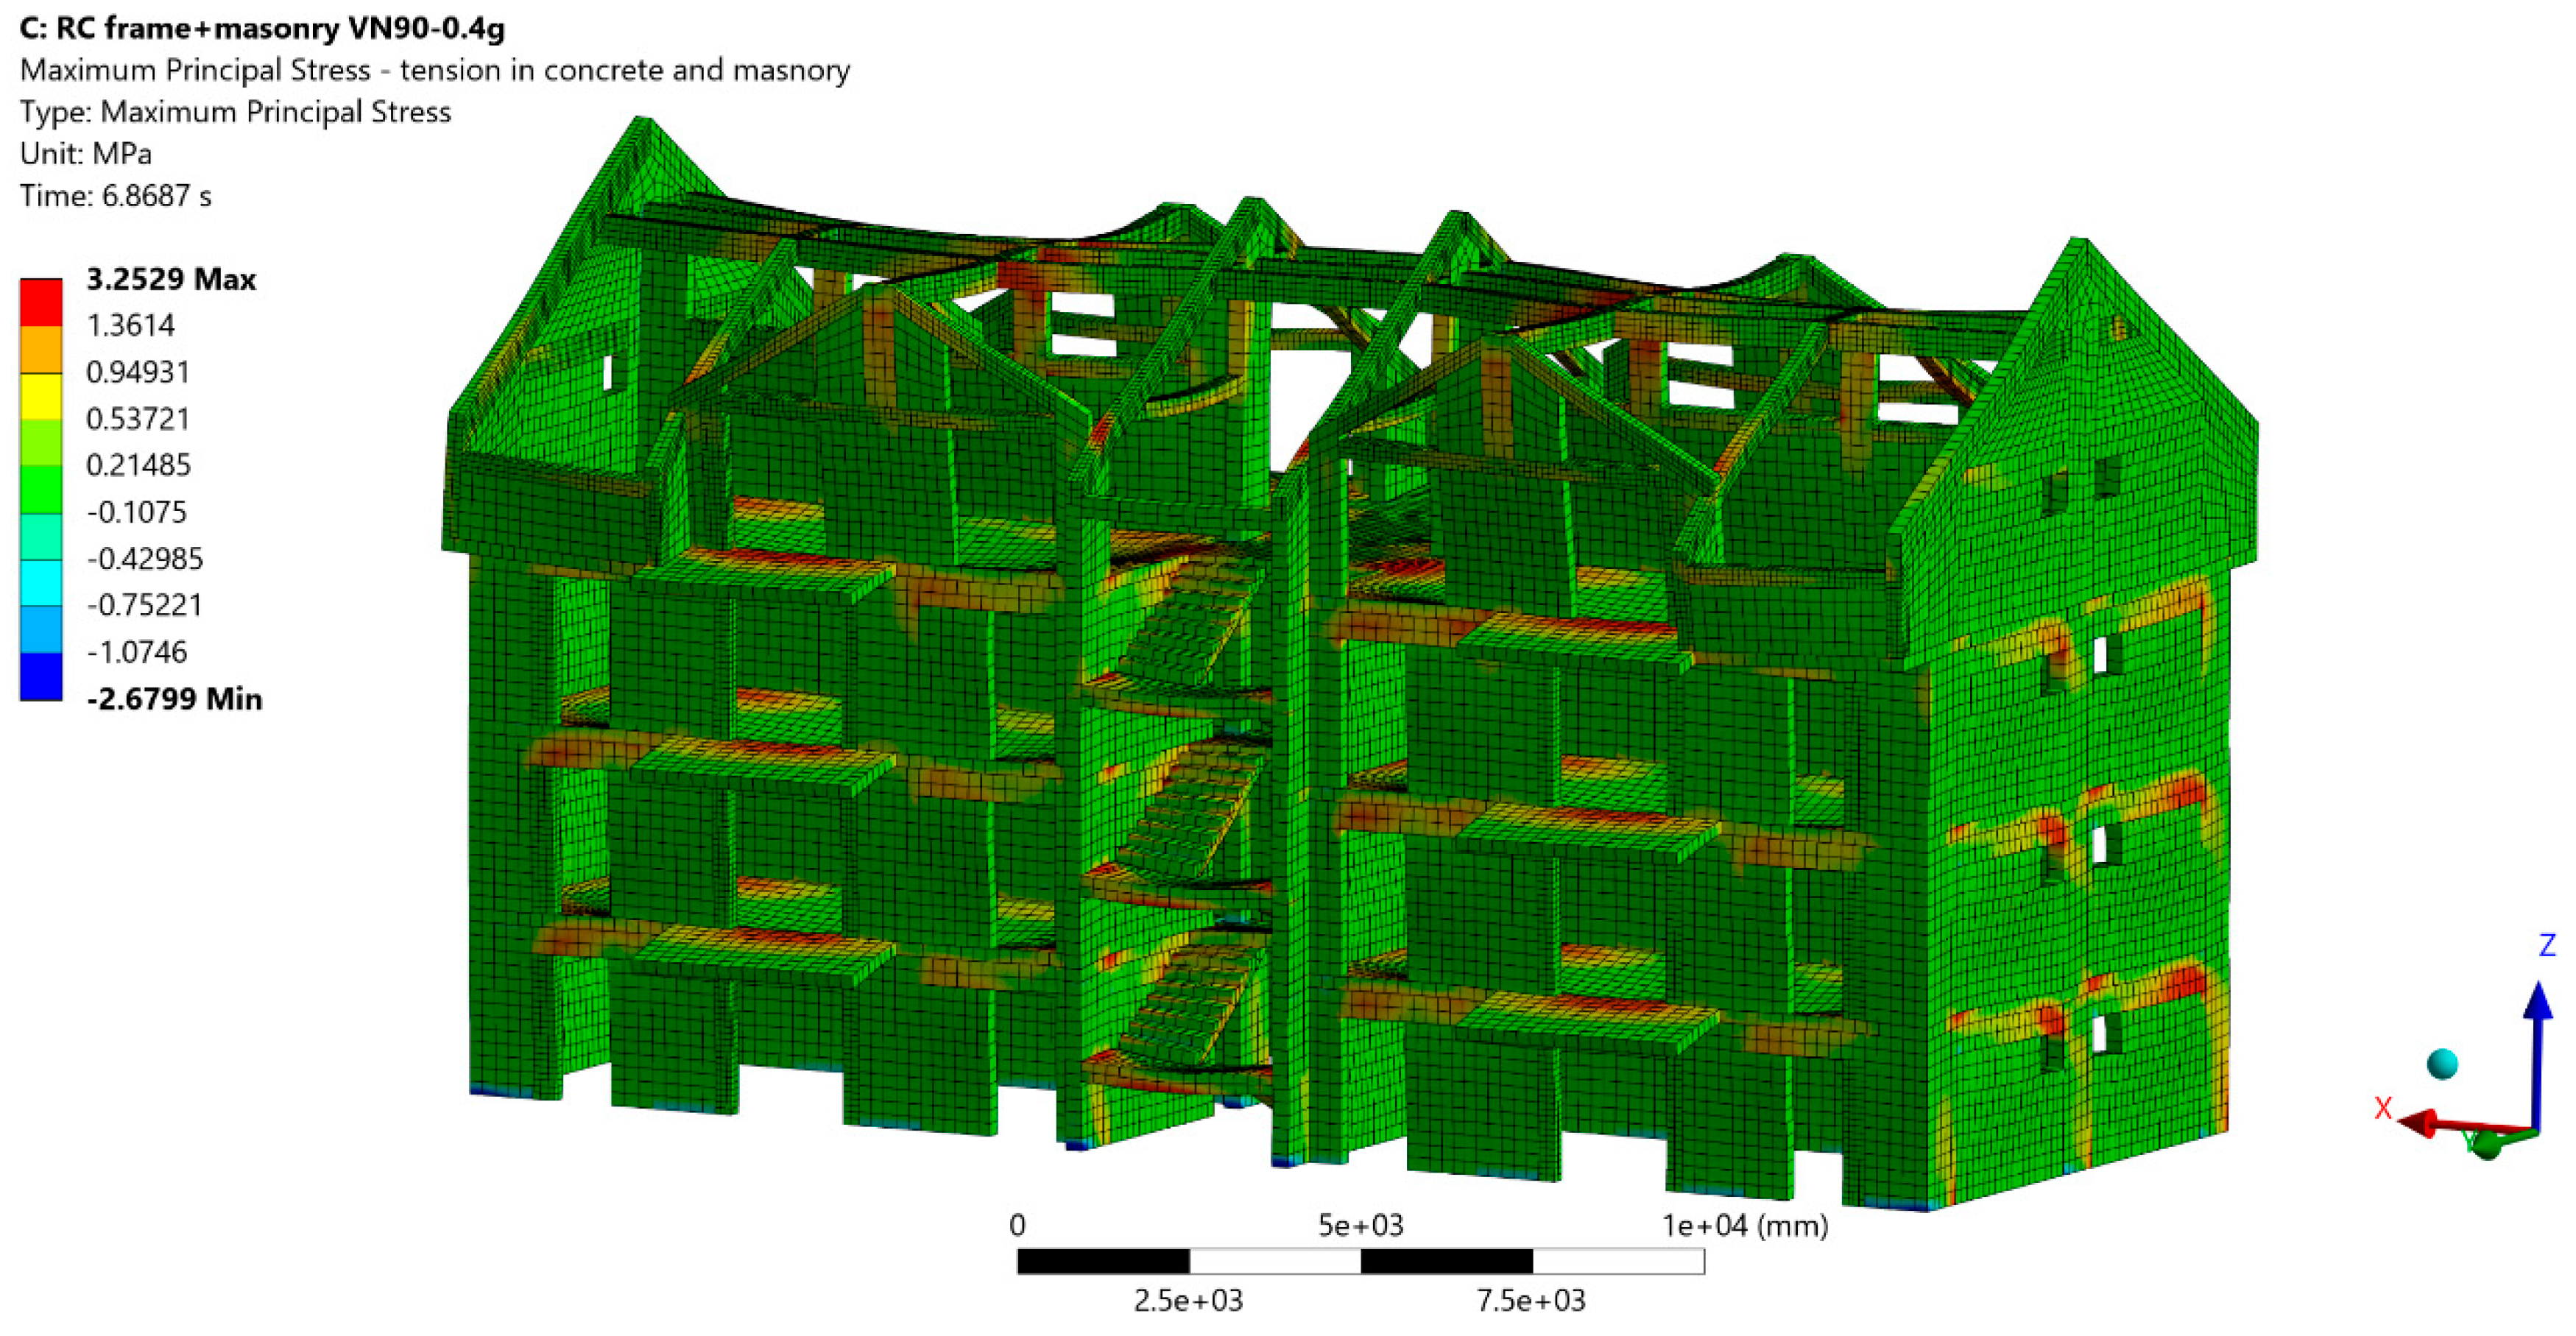
Figure 20.
Minimum principal stress in concrete elements RC frame model, VN90-0.4g scenario.
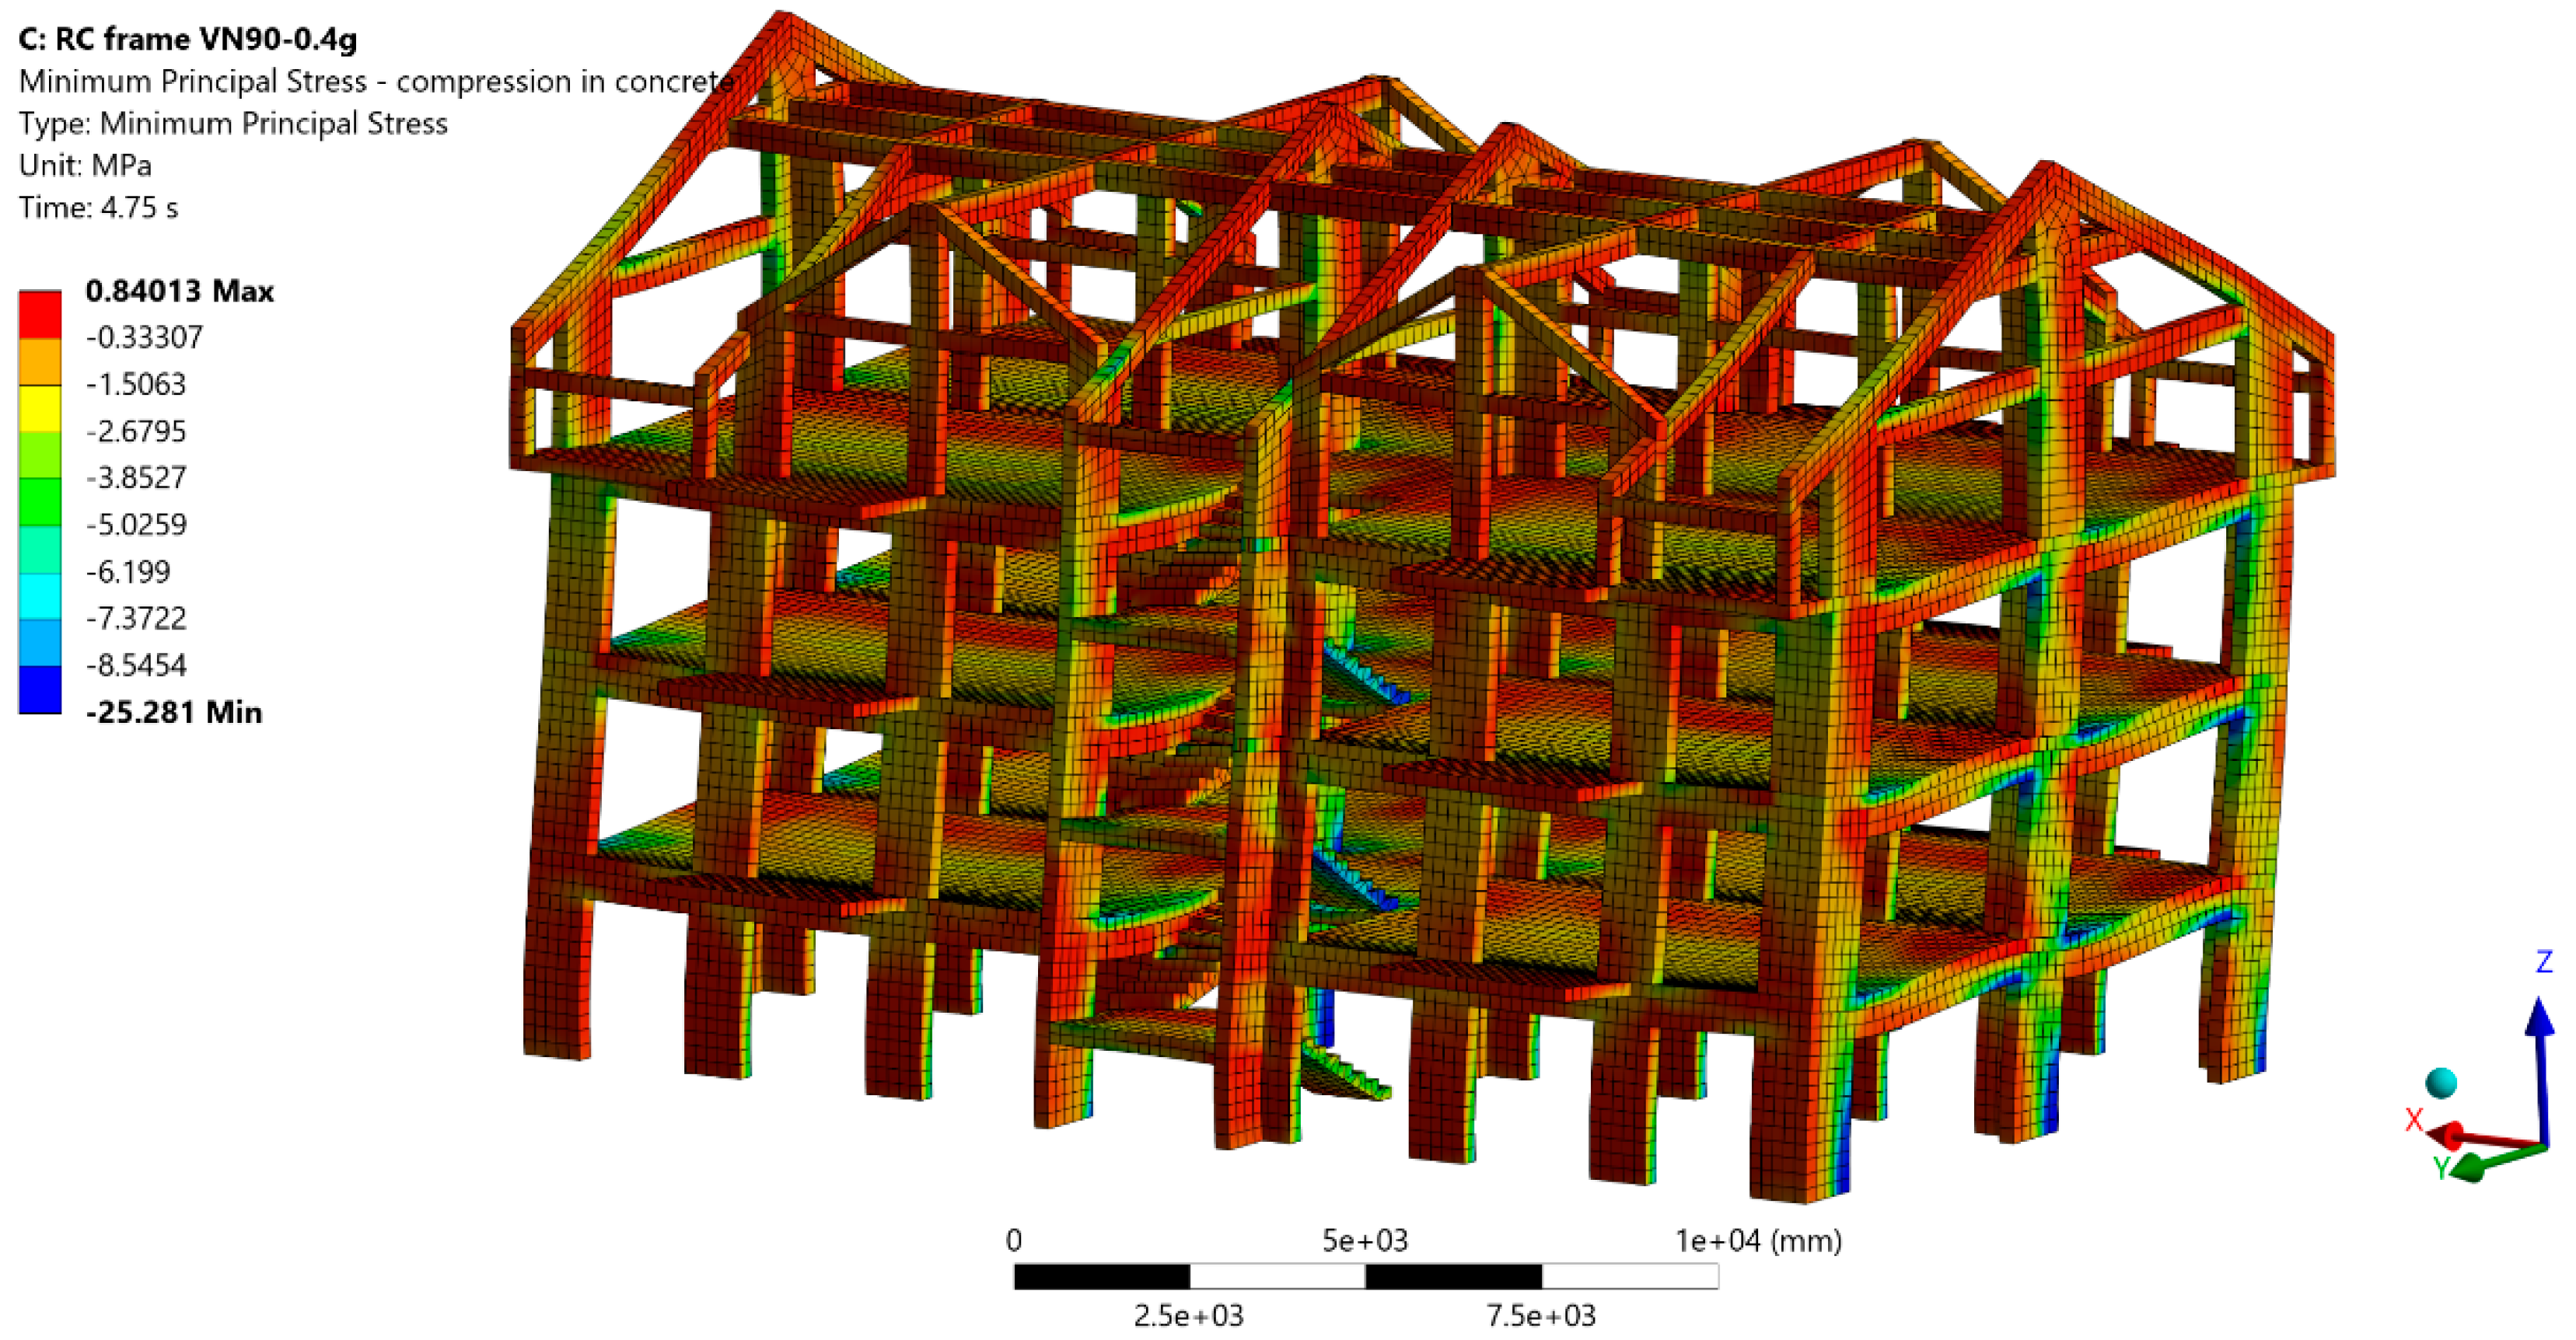
Figure 21.
Minimum principal stress in concrete and masonry elements RC frame + masonry model, VN90-0.4g scenario.
Figure 21.
Minimum principal stress in concrete and masonry elements RC frame + masonry model, VN90-0.4g scenario.
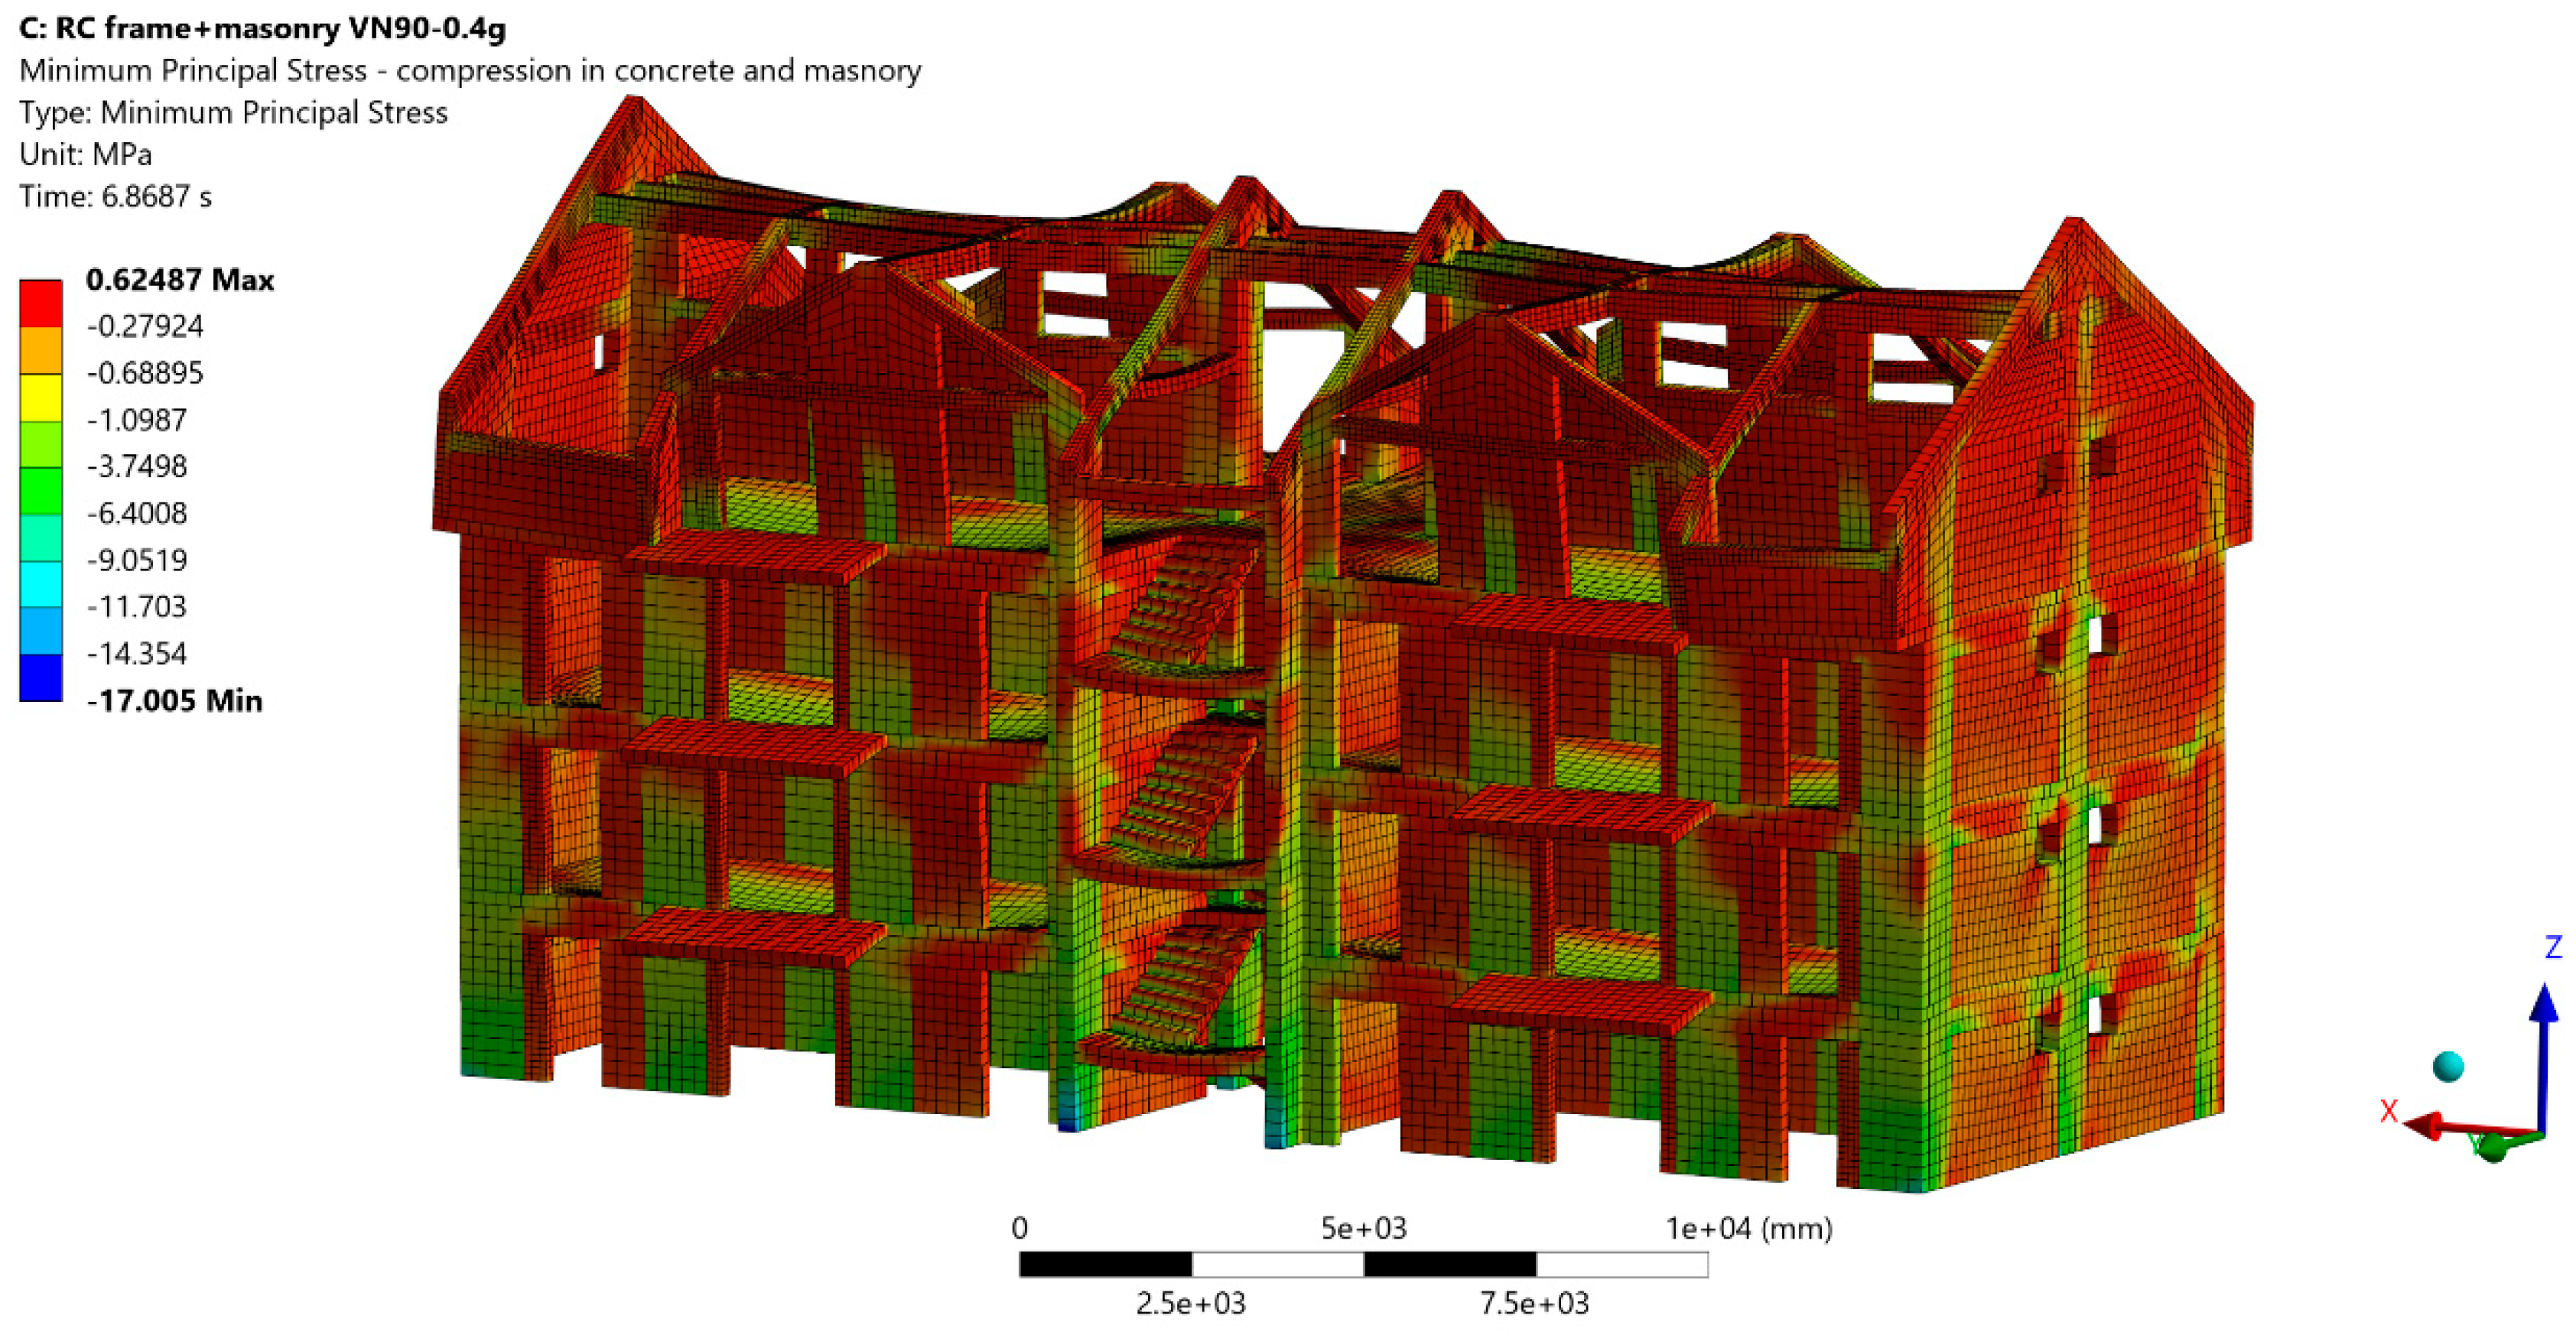
Figure 22.
Equivalent plastic strain in concrete elements RC frame model, VN90-0.4g scenario.
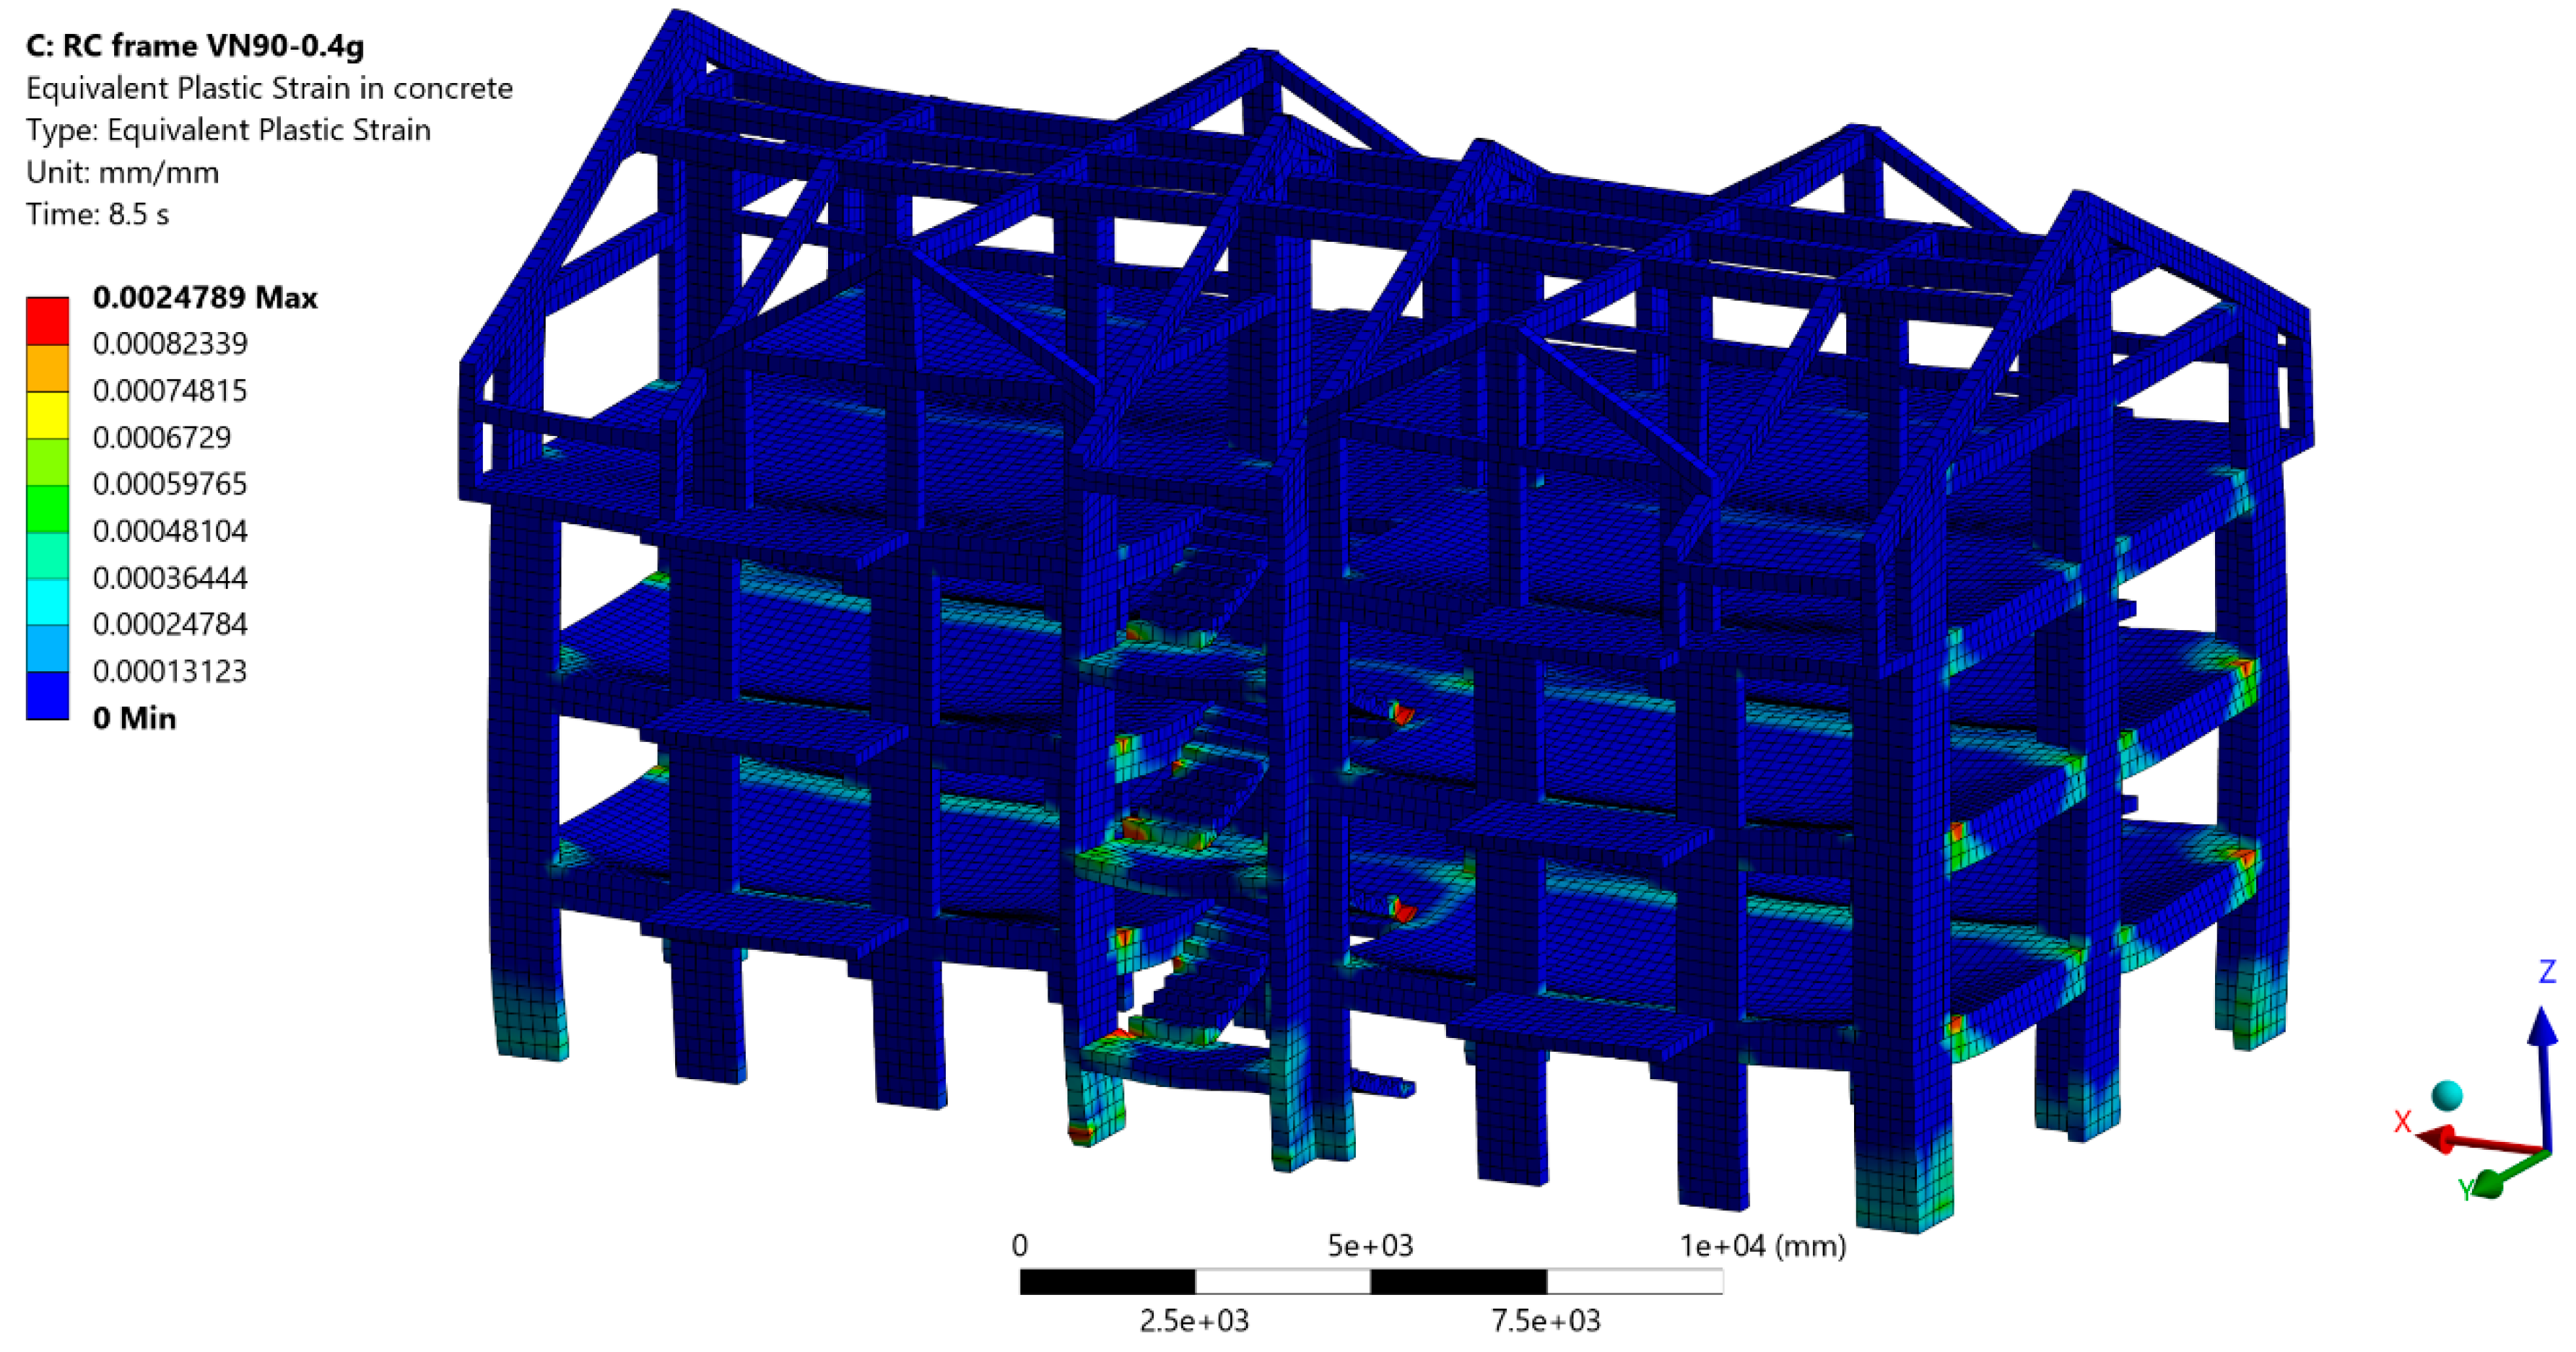
Figure 23.
Equivalent plastic strain in concrete and masonry elements RC frame + masonry model, VN90-0.4g scenario.
Figure 23.
Equivalent plastic strain in concrete and masonry elements RC frame + masonry model, VN90-0.4g scenario.
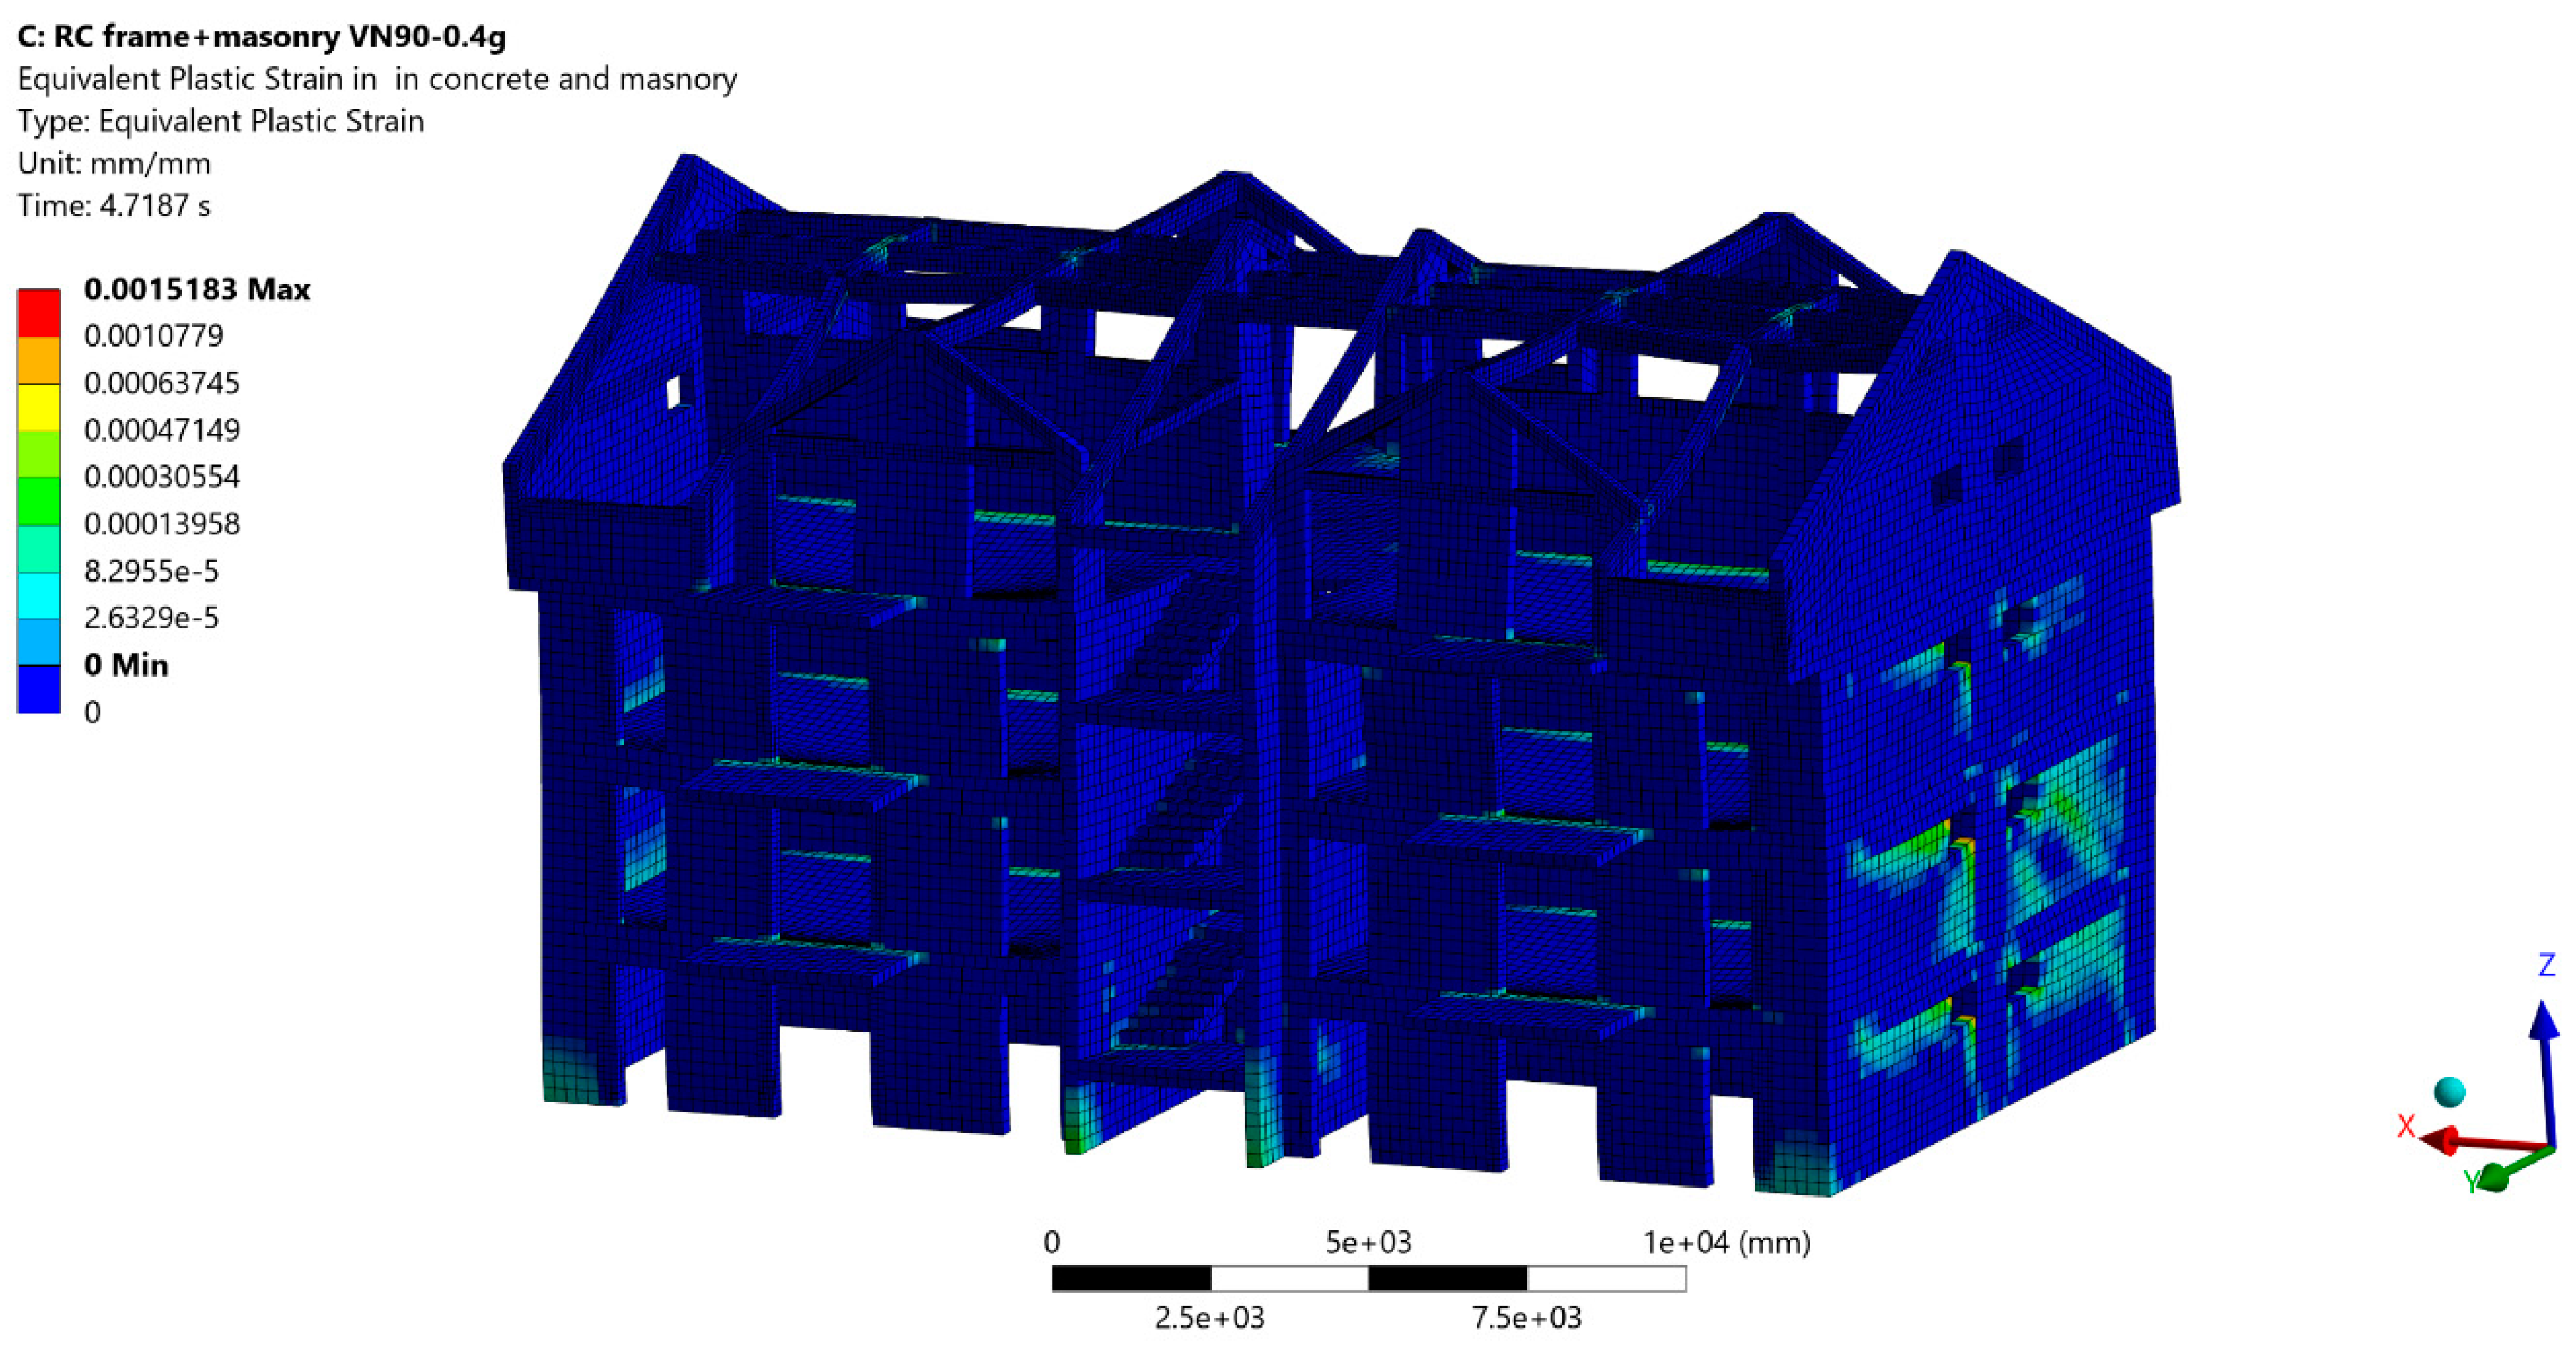
Figure 24.
Equivalent von Mises stress in reinforcement (steel rebars) RC frame model, VN90-0.4g scenario.
Figure 24.
Equivalent von Mises stress in reinforcement (steel rebars) RC frame model, VN90-0.4g scenario.
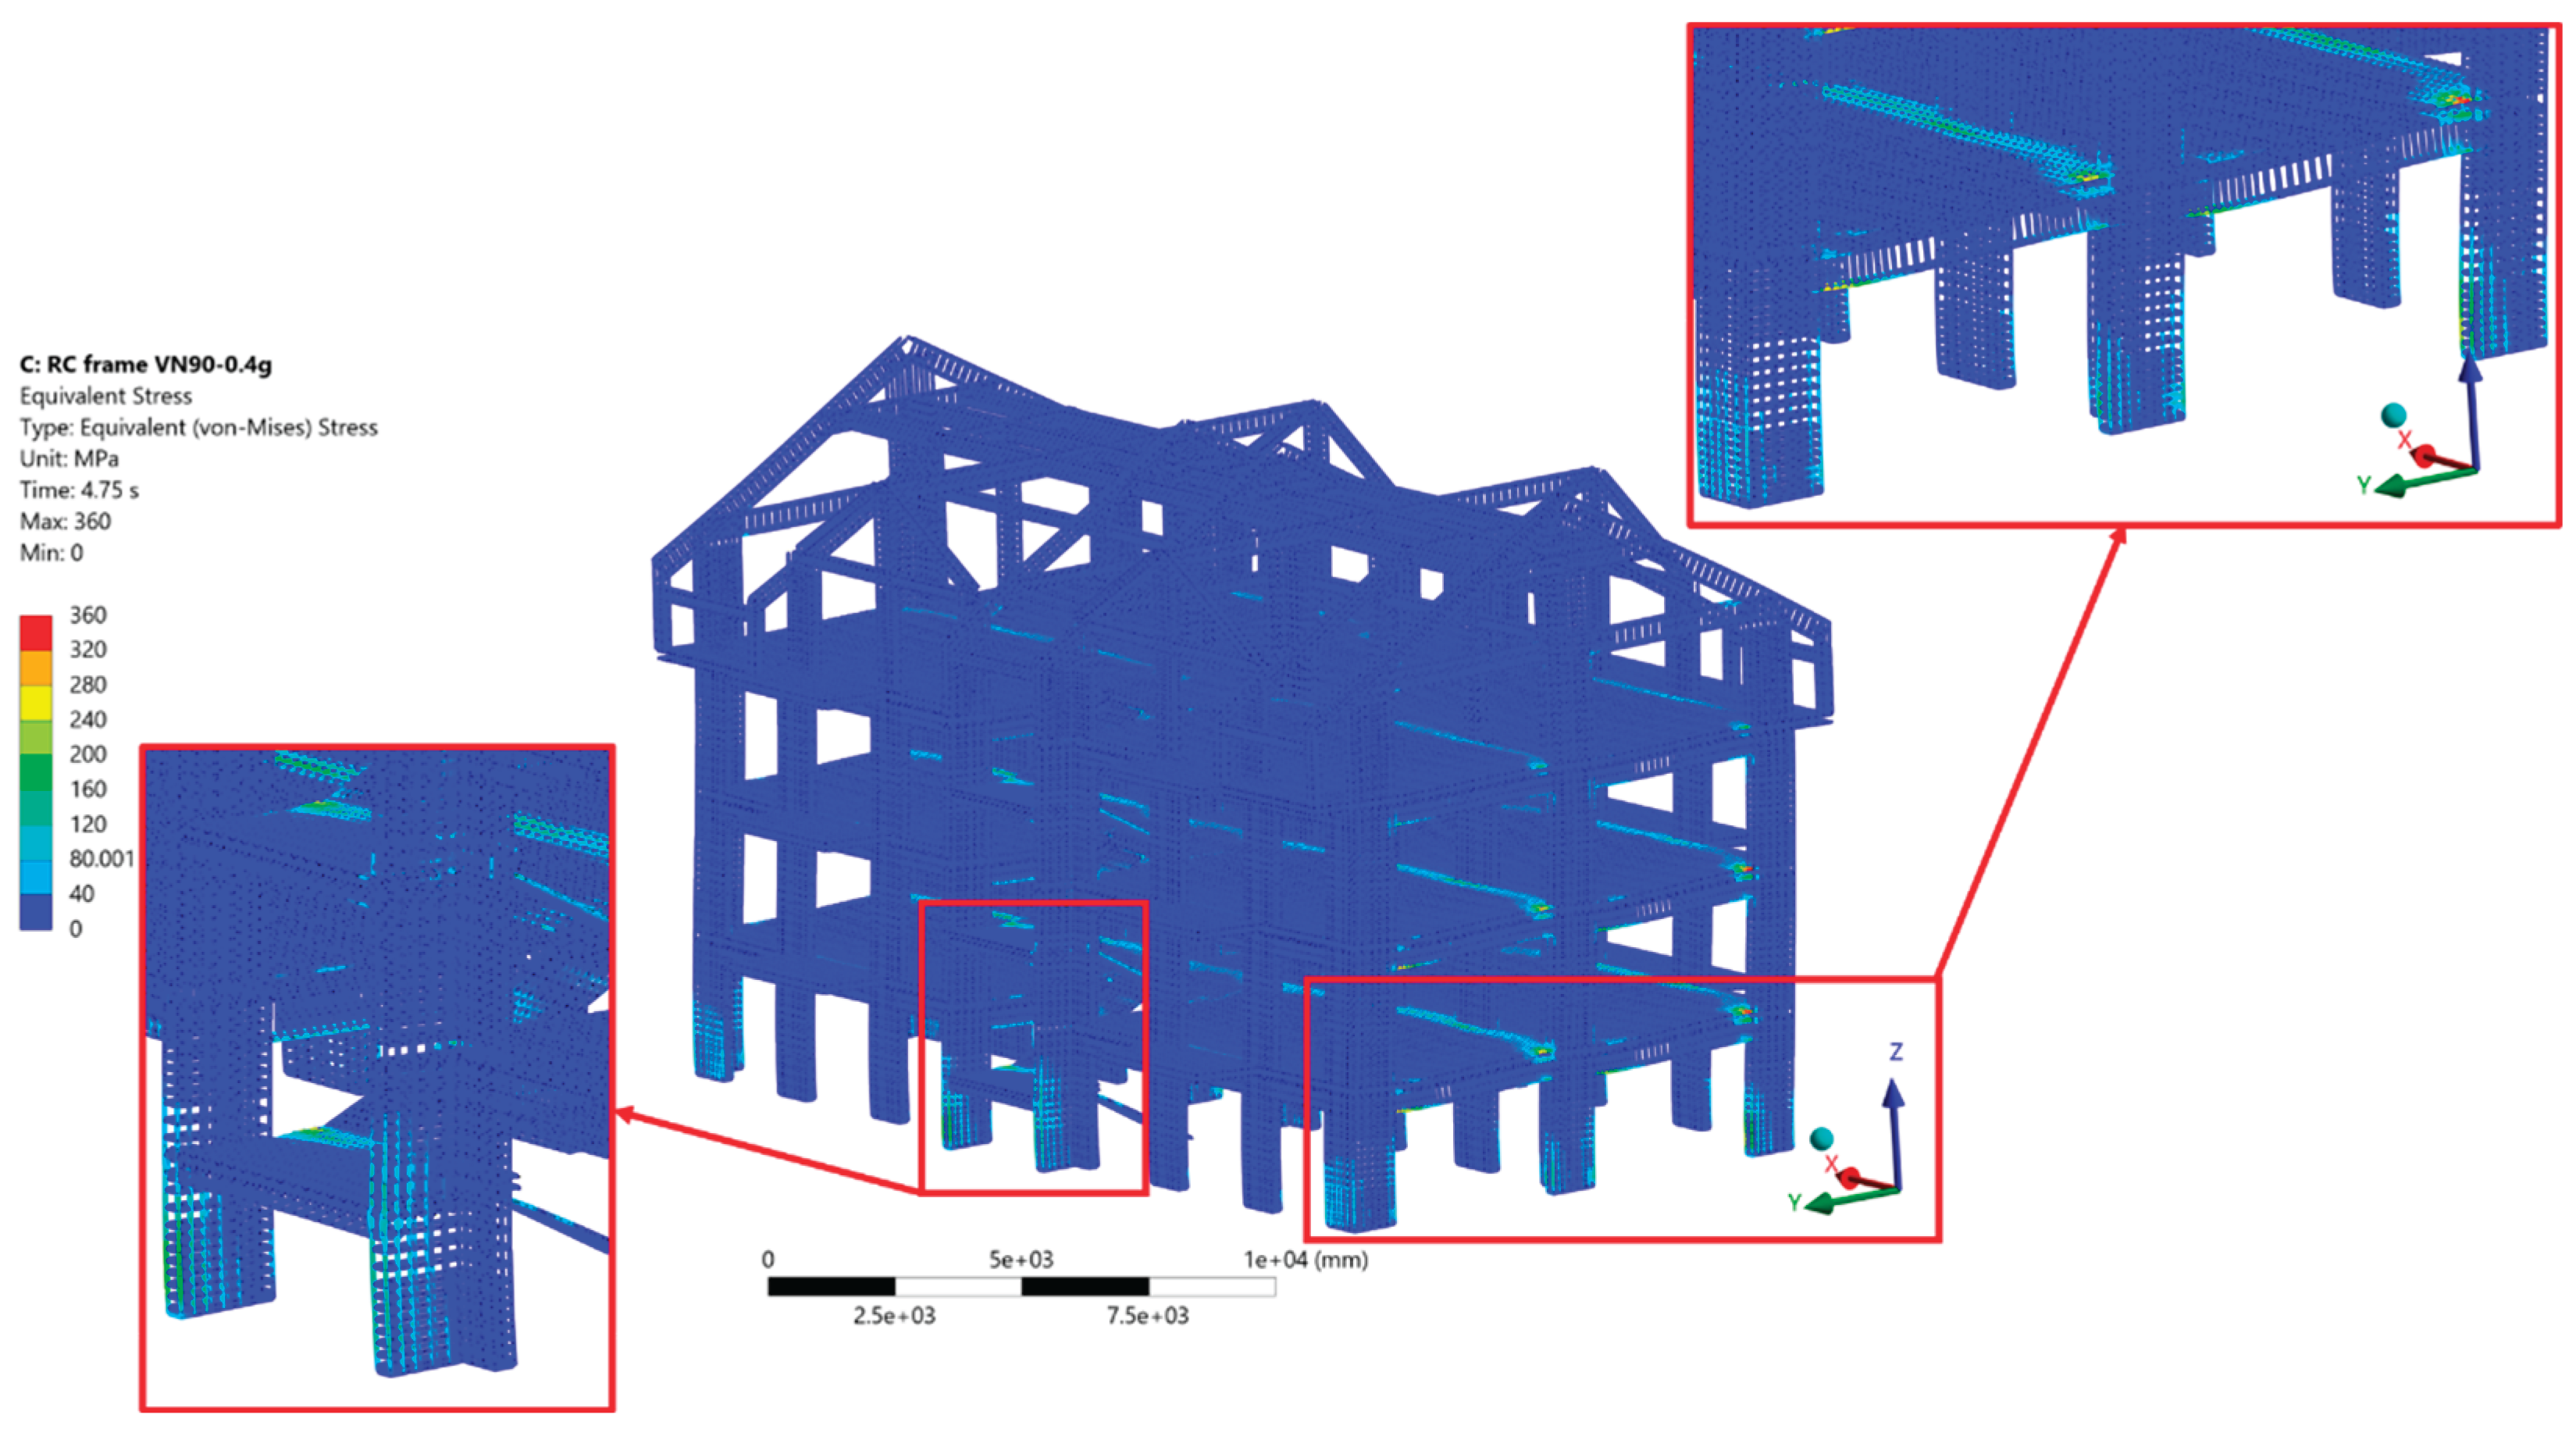
Figure 25.
Equivalent von Mises stress in reinforcement (steel rebars) RC frame + masonry model, VN90-0.4g scenario.
Figure 25.
Equivalent von Mises stress in reinforcement (steel rebars) RC frame + masonry model, VN90-0.4g scenario.
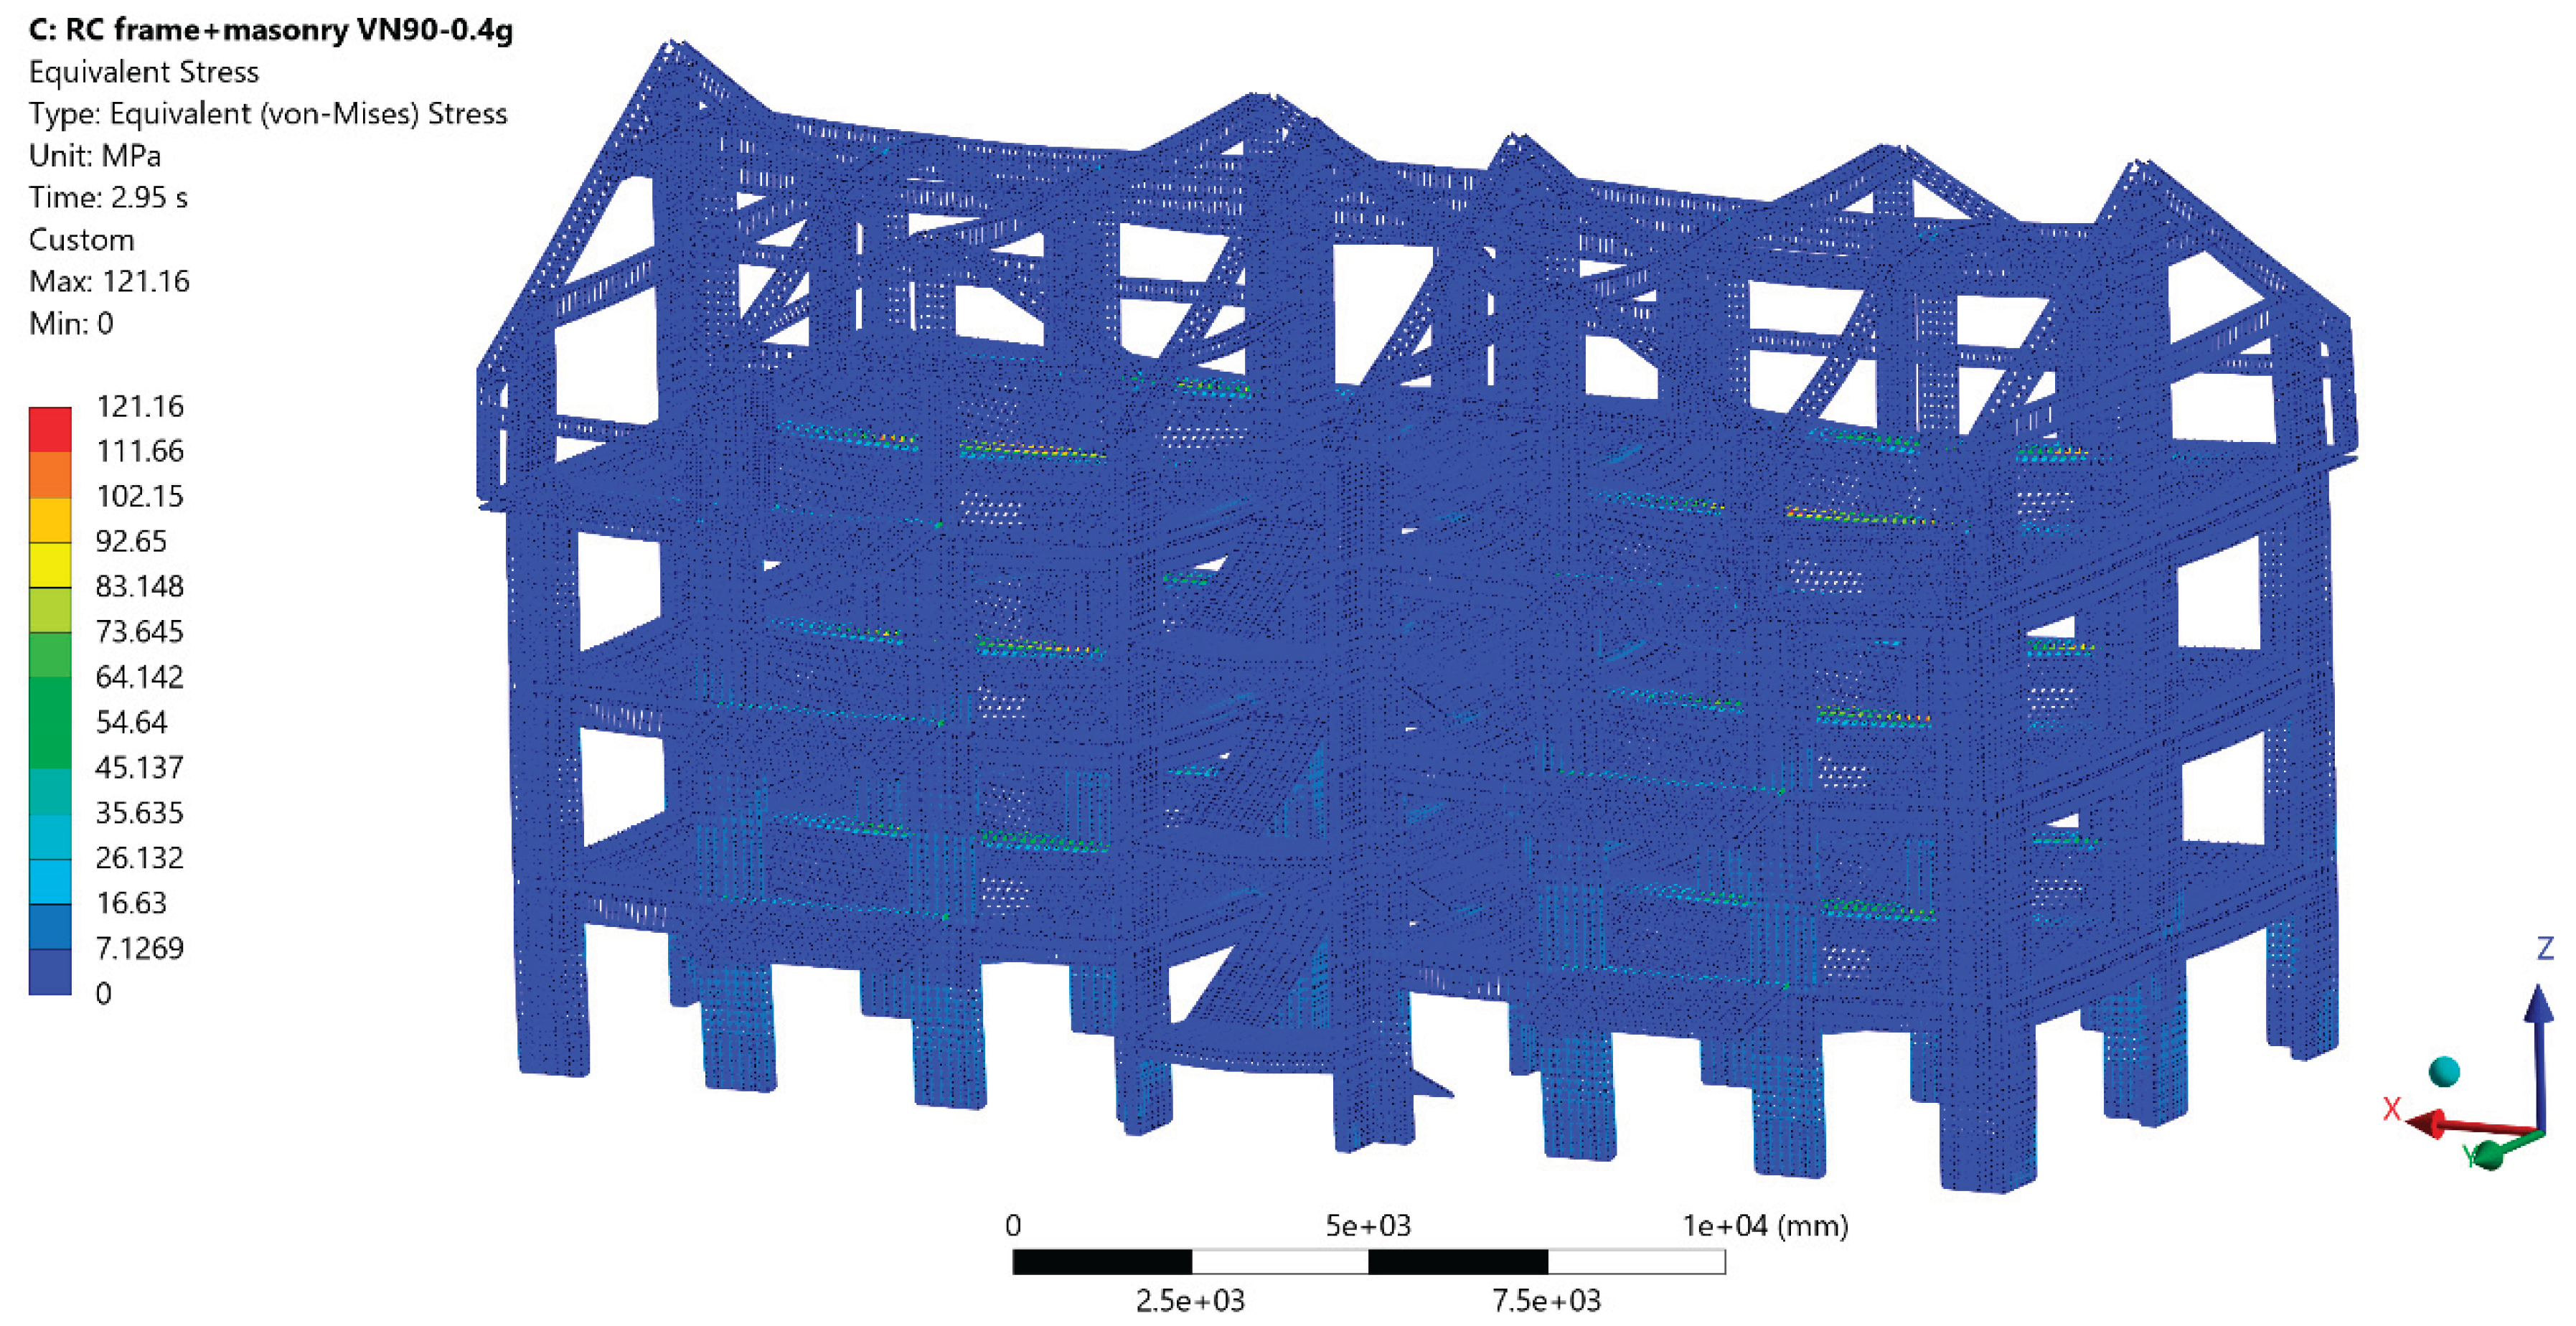

Table 1.
Materials and components in the original building (as designed).
| Subsystem / component | Material (as specified) | Structural role in original design model |
| Beams, columns, slabs, stairs | Reinforced concrete, class C16/20 | Primary lateral and gravity system |
| Reinforcement | Steel types PC52 - Ø22, Ø16 and OB37 – Ø8, Ø10 |
Reinforcement of RC members |
| Foundations | Reinforced concrete | Gravity and seismic load transfer to soil |
| Exterior infill / envelope walls | Hollow ceramic masonry blocks + external thermal insulation | Non-structural in original seismic model (gravity load only) |
| Interior partitions | Masonry partitions and gypsum-board walls on cold-formed steel studs with mineral wool infill | Non-structural in original seismic model (gravity load only) |
| Roof | Timber pitched roof (rafters, purlins, boarding) supported by RC ring beams | Gravity system; limited in-plane diaphragm action |
Table 3.
Materials properties used in ANSYS.
| Property | Concrete (Drucker–Prager) | Masonry infill (Drucker–Prager) | Reinforcement PC52 (MISO) | Reinforcement OB37 (MISO) |
| Density ρ [kg/m³] | 2500 | 1600 | 7850 | 7850 |
| Young’s modulus E [GPa] | 28 | 2 | 200 | 200 |
| Poisson’s ratio ν [–] | 0.20 | 0.15 | 0.30 | 0.30 |
| Bulk modulus K [GPa] | 15.556 | 0.95238 | 166.67 | 166.67 |
| Shear modulus G [GPa] | 11.667 | 0.86957 | 76.923 | 76.923 |
| Uniaxial compressive strength fcu [MPa] | 16 | 3 | – | – |
| Uniaxial tensile strength ftu [MPa] | 1.8 | 0.3 | – | – |
| Biaxial compressive strength fbc [MPa] | 20 | 5 | – | – |
| Tensile yield strength fy,t [MPa] | – | – | 355 | 255 |
| Tensile ultimate strength fu,t [MPa] | – | – | 510 | 320 |
| Plasticity model | Drucker-Prager | Drucker-Prager | Multilinear isotropic hardening | Multilinear isotropic hardening |
Table 4.
Modal properties and translational mass participation (X and Y) for the bare RC frame and the RC frame with masonry infills (RC+M).
Table 4.
Modal properties and translational mass participation (X and Y) for the bare RC frame and the RC frame with masonry infills (RC+M).
| Model | Mode | Frequency, f (Hz) |
Period, T (s) |
Effective mass X (t) |
Ratio X | Effective mass Y (t) |
Ratio Y |
| RC | 1 | 4.4669 | 0.2239 | 0.02 | 1.607×10⁻⁵ | 939.35 | 0.784 |
| RC | 2 | 5.5851 | 0.1790 | 29.06 | 0.024 | 3.9574×10⁻³ | 3.3016×10⁻⁶ |
| RC | 3 | 6.7955 | 0.1472 | 914.91 | 0.764 | 0.03 | 2.2394×10⁻⁵ |
| RC+M | 1 | 5.8680 | 0.1704 | 0.02 | 1.9853×10⁻⁵ | 945.16 | 0.776 |
| RC+M | 2 | 6.9433 | 0.1440 | 63.41 | 0.052 | 0.15 | 1.2567×10⁻⁴ |
| RC+M | 3 | 7.5634 | 0.1322 | 918.73 | 0.754 | 2.9724×10⁻³ | 2.4390×10⁻⁶ |
Table 5.
Peak displacements and interstorey drift increments along Y
| Model | Record | (mm) | (mm) | Governing storey | (%) |
SLS (%) |
ULS (%) |
|
| RC+M | VN77 | 2.74 | 0.92 | B–S1 or S1–S2 | 0.000323 | 0.0323 | 0.5 | 2.5 |
| RC+M | VN90 | 3.38 | 1.16 | S1–S2 | 0.000407 | 0.0407 | ||
| RC+M | TK2023 | 3.03 | 1.02 | S1–S2 | 0.000358 | 0.0358 | ||
| RC | VN77 | 9.87 | 3.35 | S1–S2 | 0.001175 | 0.1175 | ||
| RC | VN90 | 14.26 | 4.94 | S1–S2 | 0.001733 | 0.1733 | ||
| RC | TK2023 | 9.93 | 3.35 | S1–S2 | 0.001175 | 0.1175 |
Note: θadm depends on the type of non-structural components; the conservative value θadm = 0.5%is reported here.
Table 6.
Peak floor accelerations along ,
| Level | RC+M–VN77 | RC+M–VN90 | RC+M–TK2023 | RC–VN77 | RC–VN90 | RC–TK2023 | ||||||
| (mm/s2) | (g) | (mm/s2) | (g) | (mm/s2) | (g) | (mm/s2) | (g) | (mm/s2) | (g) | (mm/s2) | (g) | |
| Base | 0 | 0 | 0 | 0 | 0 | 0 | 0 | 0 | 0 | 0 | 0 | 0 |
| S1 | 225 | 0.023 | 600 | 0.061 | 411 | 0.042 | 465 | 0.047 | 1458 | 0.149 | 633 | 0.065 |
| S2 | 445 | 0.045 | 1300 | 0.133 | 878 | 0.090 | 1154 | 0.118 | 2884 | 0.294 | 1616 | 0.165 |
| S3 | 620 | 0.063 | 1803 | 0.184 | 1206 | 0.123 | 1705 | 0.174 | 4072 | 0.415 | 2450 | 0.250 |
| R | 710 | 0.072 | 2068 | 0.211 | 1379 | 0.141 | 2012 | 0.205 | 4801 | 0.490 | 2907 | 0.296 |
Table 7.
Extreme base reaction resultants (support reactions) for each record (global system).
| Component | Units | RC+M–VN77 | RC+M–VN90 | RC+M–TK2023 | RC–VN77 | RC–VN90 | RC–TK2023 |
| Mx | kNm | -34143 | -39318 | -30861 | -36287 | -42265 | -32540 |
| My | kNm | 23054 | -21085 | -19462 | 26493 | 36990 | 27643 |
| Mz | kNm | 1205.3 | 1281.2 | 1425.6 | -3755.4 | 7643 | 2899.4 |
| Fx | kN | 3725.7 | -3091.7 | -2942.2 | 4423.5 | 5393.4 | 4315.6 |
| Fy | kN | -4825.9 | 5311.9 | -5397.7 | 4700.9 | 5197.6 | -5129.7 |
| Fz | kN | 18130 | 18130 | 18130 | 18155 | 18155 | 18155 |
Table 8.
Extreme values of maximum and minimum principal stress in concrete elements, equivalent von Mises stress in steel rebar reinforcements and equivalent plastic strain.
Table 8.
Extreme values of maximum and minimum principal stress in concrete elements, equivalent von Mises stress in steel rebar reinforcements and equivalent plastic strain.
| Model | Scenario | Maximum principal stress (tension in concrete) |
Minimum principal stress (compression in concrete) |
Equivalent plastic deformation | Equivalent von Mises stress (steel rebar reinforcement) |
| (MPa) | (MPa) | (mm/mm) | (MPa) | ||
| RC frame | VN77 | 2.8 | 24.14 | 0.0025 - c | 357.88 |
| VN90 | 3.345 | 25.28 | 0.0025 - c | 360 | |
| TK2023 | 2.81 | 20.55 | 0.0021 - c | 338 | |
| RC frame + masonry | VN77 | 3.32 | 13.46 | 0.0011 - m | 123.03 |
| VN90 | 3.25 | 17.005 | 0.0015 - m | 121.16 | |
| TK2023 | 3.3 | 16.07 | 0.0014 - m | 127.25 |
Disclaimer/Publisher’s Note: The statements, opinions and data contained in all publications are solely those of the individual author(s) and contributor(s) and not of MDPI and/or the editor(s). MDPI and/or the editor(s) disclaim responsibility for any injury to people or property resulting from any ideas, methods, instructions or products referred to in the content. |
© 2026 by the authors. Licensee MDPI, Basel, Switzerland. This article is an open access article distributed under the terms and conditions of the Creative Commons Attribution (CC BY) license (http://creativecommons.org/licenses/by/4.0/).
Copyright: This open access article is published under a Creative Commons CC BY 4.0 license, which permit the free download, distribution, and reuse, provided that the author and preprint are cited in any reuse.


