Submitted:
23 February 2026
Posted:
24 February 2026
You are already at the latest version
Abstract
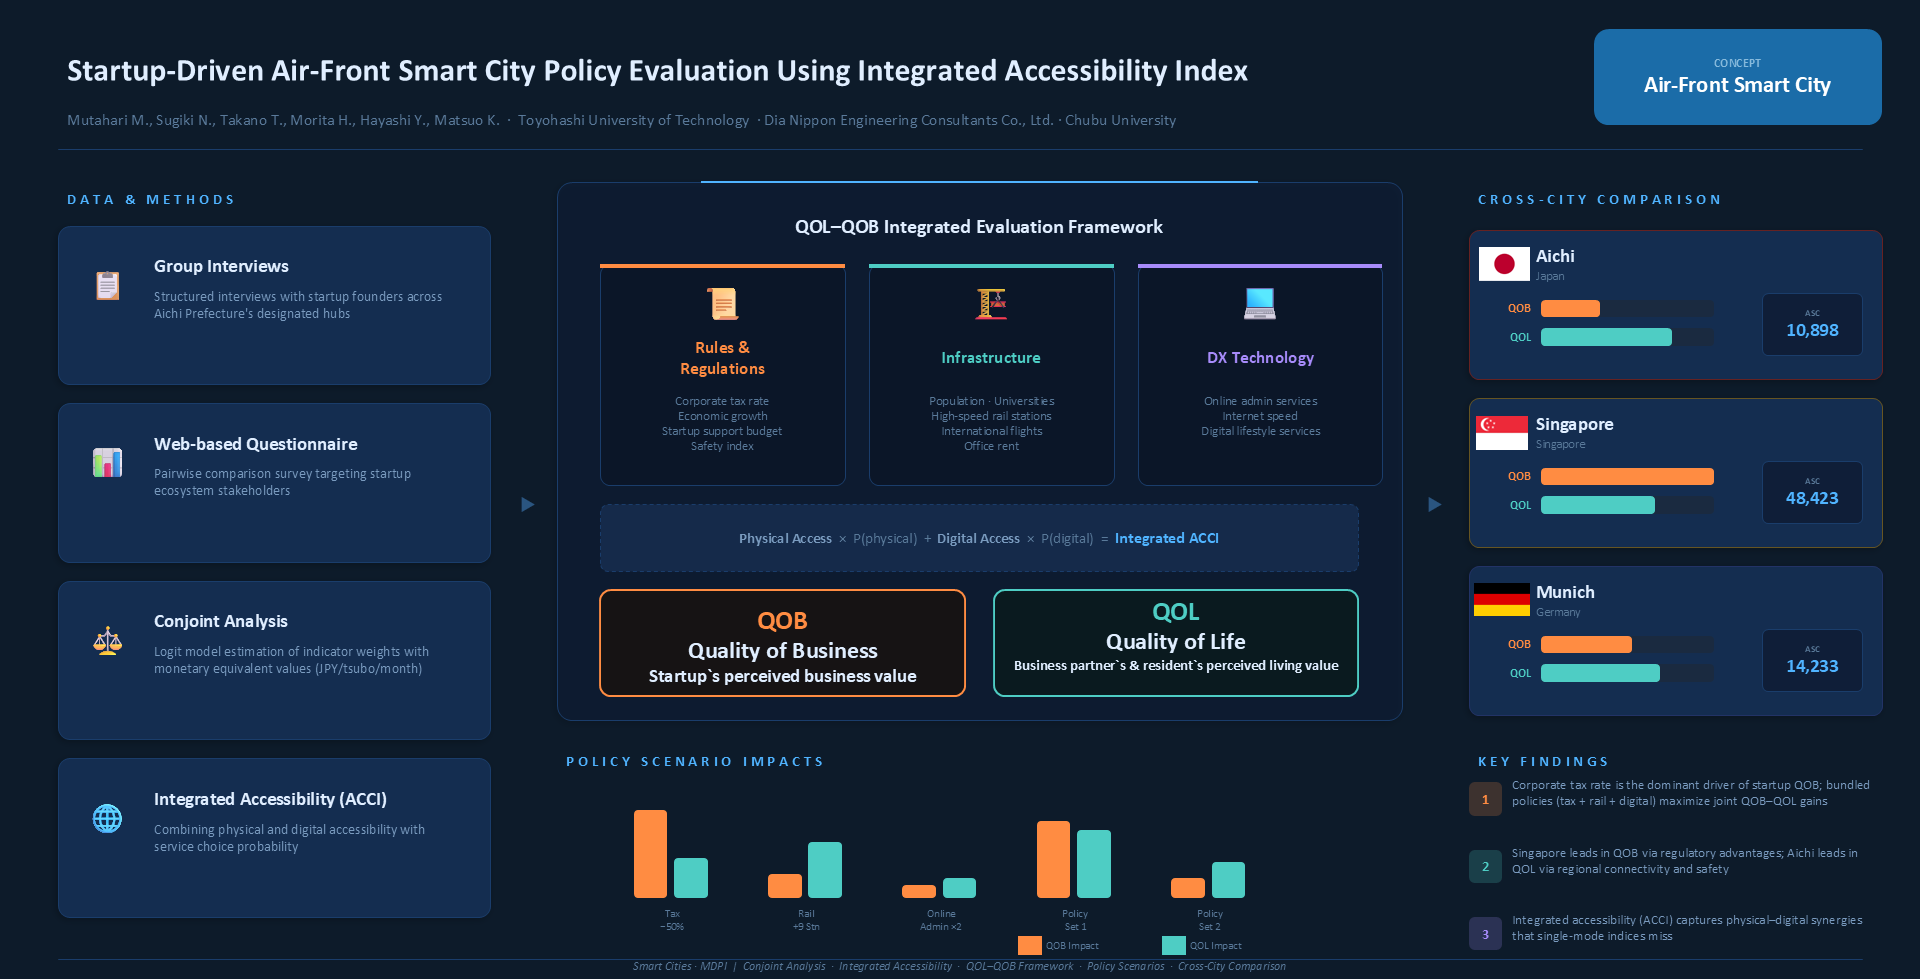
The Air-front Smart City (ASC) concept is proposed to address the stagnation of industries in developed countries and stimulate economic growth in developing countries while maintaining a higher quality of life for people and contributing to decarbonization and overall United Nations SDGs in an existing study. However, no studies have been conducted to assess ASC policies. Therefore, this study integrates the integrated accessibility index into the quality of life (QOL) and quality of business (QOB) evaluation models to assess the startup ecosystem in Aichi, Singapore, and Munich within the ASC concept. The study uses survey data conducted in Aichi to estimate monetary values of QOL and QOB component indicators, calculates the integrated accessibility indices, and estimates QOL and QOB. Furthermore, the study sets scenarios to assess the impacts of living and business urban policies in Aichi. Additionally, the study using Aichi parameters compares the startup ecosystem in Singapore and Munich. The result shows that the key drivers of startup attraction are corporate tax rate, economic growth, and safety; enhancing these indicators directly increases startups' QOB, business partners, and residents' QOL. It was found that QOB in Singapore is comparatively higher, whereas QOL is higher in Aichi.
Keywords:
air-front smart city
; startups
; digital and physical accessibility
; quality of life
; quality of business
1. Introduction
The concept of smart cities has evolved through multiple generations, shifting from technology-driven implementations in Smart City 1.0 [1] toward city authorities-driven in Smart City 2.0 [1] and more participatory, citizen-centered, and sustainability-oriented models in Smart City 3.0 [1] and Smart City 4.0 [2]. Recent discourse further highlights Smart City 5.0 [3], which emphasizes human-centric innovation, social inclusion, and the integration of digital technologies with societal well-being rather than purely technological efficiency. Although the priorities of smart cities shift or will shift through each smart city generation, from smart city 1.0 to smart city 5.0, still, excessive utilization and integration of technologies into daily life services may harm human-centric urban structures and their functionality.
The development of smart cities aims to solve urbanization challenges while improving sustainability efforts and enhancing quality of life [4] through innovative urban development strategies [5,6] and utilizing cutting-edge technologies to improve urban performance and efficiency [7,8]. Additionally, growing adoption of technology in everyday life, along with pandemic-related transformations like COVID-19, has led to advanced technological solutions delivering services through both physical and virtual networks to improve individuals' Quality of Life (QOL) [9]. It is argued that the provision of services through physical and virtual networks is the core principle of smart city development. To this end, enormous studies have been conducted to comprehensively evaluate smart cities [10,11,12,13,14,15].
Similarly, existing studies covered the multiple aspects of smart cities, such as environmental sustainability [16,17], governance [12,18], urban service and infrastructure [19,20,21], accessibility [22,23], decision making [24], United Nations SDGs [25], economic trajectories [26], and so on. Several existing studies criticize the smart city development policies for prioritizing technologies over human-centric urban development [27], social inclusion and inequality [28,29,30], user satisfaction [14], and human rights concerning privacy [31], which are the key components of QOL evaluation. However, smart city development plans are implemented in a region without considering the uniqueness and potential strength of that area for economic development, gross regional happiness improvements, and contribution to environmental sustainability.
The smart city design basically focuses on the immediate site without considering the surrounding regions or the characteristics and uniqueness of the region. To this end, the concept of Air-front Smart City (ASC) is introduced by an existing study [32] to address industrial stagnation in developed countries and economic growth challenges in developing countries, while maintaining a higher QOL. The study introduced an evaluation framework to assess living and business environments within an air-front smart city. However, the study did not apply the evaluation framework to a real case and did not quantitatively evaluate living and business environments considering a specific business sector.
Furthermore, in recent years, attracting and nurturing startups has become an increasingly important policy objective for regional economic revitalization. In Japan, the Cabinet Office has promoted the initiative “Formation of Startup Ecosystem Hub Cities Competitive on a Global Scale,” designating four Global Hub Cities and a further four Promotion Hub Cities. Through these designated startup ecosystem hub cities, various programs have been implemented to support ecosystem formation and accelerate growth in each city. However, without an accurate understanding of local conditions and bottom-up processes, it is difficult to construct sustainable and regionally appropriate startup ecosystems. Aichi Prefecture, one of the Global Hub Cities, has also strengthened its efforts to foster a startup ecosystem in line with this national policy direction. As regional industrial economies face a historic turning point, identifying new business opportunities and enabling entry into new business domains, structural transformation, and business innovation require leveraging existing industrial assets and urban environmental resources to create pathways for regionally rooted, innovation-driven economic development.
The promotion of startup ecosystems has become a central pillar of urban and regional development policy [33], particularly in advanced economies facing structural economic transformation, demographic decline, and intensified global competition for talent and innovation. Startups are widely recognized as key drivers of technological innovation, productivity growth, and regional economic resilience. The study [33] provides a comprehensive synthesis of empirical evidence showing that startups contribute to regional development not only directly through job creation but also indirectly through competition, knowledge spillovers, and long-term evolutionary processes within regional economies. Importantly, these effects are highly spatially heterogeneous and depend on regional characteristics such as human capital, infrastructure, and institutional context. However, unlike traditional firms, startups exhibit high sensitivity to their surrounding urban environments, as their survival and growth depend not only on market opportunities and financial access but also on human capital availability, institutional support, and everyday living conditions for founders and employees.
On the other hand, recent empirical studies provide robust evidence that airport investment contributes to urban economic development. Using global nighttime light data as a proxy for economic activity, an existing study [34] demonstrates that the opening of new airports leads to statistically significant increases in urban economic intensity across diverse regional contexts. Their findings confirm that airport infrastructure functions as a catalyst for spatial economic growth by enhancing regional accessibility and connectivity. Within this context, air-front urban areas, cities located in proximity to international airports, can emerge as strategic spaces for startup-oriented development. These areas offer unique advantages, including superior international accessibility, concentration of global business interactions, and potential integration of physical and digital infrastructures. Consequently, many governments and local authorities have positioned cities with higher transportation connectivity as innovation hubs intended to attract globally oriented startups. Despite these policy ambitions, systematic methods for evaluating the effectiveness of ASC environments in supporting startup development remain limited.
Existing studies and policy evaluations tend to focus predominantly on economic and business-related indicators, such as market size, industrial agglomeration, and investment volume. While these factors are undoubtedly critical, they provide only a partial explanation of startup location behavior. Increasingly, empirical evidence suggests that QOL, including housing conditions, accessibility to services, environmental quality, safety, and overall urban livability, plays a decisive role in attracting entrepreneurial talent, particularly in knowledge-intensive and internationally mobile sectors. As a result, startup competitiveness cannot be adequately assessed without simultaneously considering QOB and QOL as interdependent dimensions of the urban environment.
Building on the fact that startups tend to be highly sensitive to both business-related conditions and living environments when selecting their locations, evaluating urban environments from an integrated perspective that incorporates QOL and QOB is essential for formulating effective startup attraction policies. Therefore, this study advances an integrated QOL and QOB evaluation framework that captures both the economic-functional and socio-spatial characteristics of cities. In previous studies, the framework was conceptually developed [32], whereas this study extends this framework by incorporating digital and physical accessibility (Integrated accessibility) and applying it explicitly to startup development policy evaluation, with a particular focus on air-front smart cities. Where, previous studies investigated the importance and impacts of integrated accessibility on social network and urban structure [35], presented a conceptual framework for incorporating the integrated accessibility into QOL evaluation [36], the current study integrates the integrated accessibility to the developed framework, assessing urban policies affecting the startup ecosystem in Aichi, and carries a comparative cross-city analysis in Aichi, Singapore, and Munich by transferring estimated parameters in Aichi. The result of this study fills the academic gap and provides policymakers with a mathematical tool to quantitatively evaluate startup-related urban development policies.
The overall objective of this study is to operationalize the integrated QOL and QOB framework for evaluating startup attraction potential and to demonstrate its applicability through a case study of Aichi Prefecture, Japan. Aichi represents a compelling empirical setting due to its strong manufacturing base, growing startup support initiatives, and strategic emphasis on airport-oriented development centered around Chubu Centrair International Airport. By incorporating insights directly obtained from startup founders, this study bridges the gap between top-down policy objectives and bottom-up perceptions of urban environments, thereby enhancing the policy relevance of the evaluation. Specifically, this section translates qualitative knowledge derived from group interviews with startups into a structured set of measurable indicators reflecting both QOB and QOL dimensions. These indicators are designed to enable cross-city comparison, support scenario-based policy evaluation, and identify structural strengths and weaknesses of ASC strategies.
Furthermore, this paper extends the empirical applicability of the proposed framework by transferring the parameters estimated from the Japanese startup case to international contexts. Specifically, the parameters derived from the startup ecosystem evaluation in Aichi are applied to comparative case studies in Singapore and Munich. These cities were selected due to their differing institutional settings, levels of global connectivity, and maturity of startup ecosystems, which together provide a robust basis for testing the external validity and transferability of the QOL and QOB-based evaluation framework. By applying a common set of parameters across heterogeneous urban contexts, the analysis enables systematic cross-city comparison and assesses whether the relative importance of QOL and QOB factors identified in Japan can explain startup ecosystem performance in other leading global cities. This comparative exercise contributes to policy evaluation by clarifying the extent to which startup-oriented ASC strategies can be generalized beyond the Japanese context.
Through this application, the study contributes not only to the empirical assessment of startup ecosystems but also to the broader discourse on smart city policy design, demonstrating how integrated evaluation approaches can support evidence-based urban and regional planning.
2. Materials and Methods
2.1. Component Indicator Selections
To operationalize the QOL and QOB-based evaluation framework for ASC development, this study first uses the results of a series of structured group interviews with startup founders to identify the urban business, service, and living environment conditions that facilitate startup establishment and growth, as well as those that act as barriers. These qualitative investigations were designed to capture startups’ revealed preferences regarding both QOB, such as market access, talent availability, institutional support, and operational costs, and QOL, including living convenience, safety, and overall urban comfort, which increasingly influence location decisions in knowledge-intensive and innovation-driven firms.
With the cooperation of the Aichi Prefecture Startup Promotion Division, interview requests were extended to startups located within officially designated startup hubs and partner hubs across the prefecture, as well as to firms participating in public startup support programs. A total of 18 startups agreed to participate. To efficiently collect diverse perspectives within a limited timeframe, the interviews were conducted in a group format. The result of the preliminary questionnaire survey enabled the identification of both shared and stage-specific urban needs among startups, resulting in the listing of 30 component indicators as shown in Table 1.
Building on this qualitative foundation, a set of evaluation indicators for startup attraction potential was established. The indicators were further restructured into three air-front policy evaluation categories: rules and regulations, infrastructure, and DX technology. Through this process, qualitative perceptions of startup founders collected through the survey were translated into a standardized, data-driven evaluation system capable of quantifying startup attraction potential from both QOL and QOB perspectives. This indicator framework forms the empirical foundation for subsequent component weighting, aggregation, and comparative analysis, enabling the assessment of how ASC policies and spatial configurations in Aichi Prefecture contribute to startup development within a broader ASC strategy.
The group interview could give us a list of QOL and QOB component indicators, as shown in Table 1. Table 1 presents the indicators and their description, which were used for a web-based questionnaire survey conducted between January and June 2025. Survey invitations were primarily distributed to firms located in startup hubs within Aichi Prefecture, including partner hubs. A total of 35 valid responses were obtained. A pairwise conjoint analysis was carried out on a web-based questionnaire survey to estimate the weights and get the monetary values of component indicators. With the web-based questionnaire survey, we could get the perceived value of each component indicator, and we could estimate the monetary value of the parameters. The result of the indicator weight estimation is disclosed in the following section of this manuscript.
2.2. Indicator Weight Estimation
To estimate indicator weights, a pairwise comparison–based conjoint analysis was adopted. In this approach, respondents are repeatedly asked to choose the more preferable option from two alternative profiles, each consisting of different attribute levels across multiple indicators, as shown in Table 2. Based on the observed choice outcomes, a binary logit model, as shown in Equation (1), was constructed, and the weight parameters were estimated using the maximum likelihood estimation method.
Where denotes the probability of selecting an alternative , represents the weight parameter of the evaluation indicator , and is the value of the evaluation indicator for alternative . By taking the ratio of the weight parameter of each indicator to that of office rent, it is possible to derive a monetary equivalent value. The monetary equivalent value wkfor each indicator, is made using the weight parameter for office rent, βrent as shown in Equation (2).
This monetary equivalent value represents the extent to which a unit improvement in a given indicator corresponds to a reduction in office rent, thereby enabling diverse indicators to be compared on a unified monetary scale in terms of their contribution to startup attraction and growth. The questionnaire items used for estimating the weight parameters were designed by first providing respondents with explanations of each indicator, followed by presenting profiles of two hypothetical cities and asking respondents to select the more preferable one. Each profile consisted of four attributes: three evaluation indicators and office rent. The attribute levels for each indicator are shown in Table 2. Although respondents were required to answer repeated choice tasks across different profile combinations, respondent burden was reduced by limiting the number of tasks. Specifically, for each component, four randomly selected profile combinations were presented, and choice responses were collected accordingly.
2.3. Integrated Accessibility Index
Based on a previous study [32], which had conceptualized a QOL and QOB integrated accessibility based evaluation method for ASC, the current study defines the integrated accessibility index and incorporates it into the QOL and QOB evaluation model to quantitatively measure QOL and QOB in air-front smart cities. The study considers accessibility of individuals and businesses to the services and products through physical (transportation) networks and also through digital (ICT) networks. The importance of integration of digital and physical accessibility is widely discussed in existing studies [35,36]. In this study, physical accessibility is defined as accessibility of individuals and businesses to services through a traditional transportation network in a real (physical) space. Whereas digital activities are defined as accessibility of individuals and businesses to the services and products through ICT networks in virtual (digital) space. Services provided in physical space and digital space are called physical services and digital services, respectively.
The integrated accessibility index is calculated as a combination of the physical accessibility index multiplied by the probability of choosing physical service and the digital accessibility index multiplied by the probability of choosing digital service. However, due to data limitations, we consider road congestion as a physical accessibility index and internet speed as a digital accessibility index. For the weight (probability) calculation of physical and digital (service choice, we used questionnaire survey data conducted in Japan on 24 and 25 November 2023 with 6210 valid responses, and used a binary logit model to estimate the probability of choosing specific services either in physical or digital spaces. The integrated accessibility index is applied to the accessibility related indicators that rely on both real and virtual networks, such as access to shopping and access to education centers. Using equation (3), we estimate the integrated accessibility index for real and virtual networks.
where
: Probability of choosing a service m in real space (physical service)
: Real space access cost from zone i to zone j (Road congestion, Km/h)
: Probability of choosing a service m in virtual space (digital service
: Virtual access cost (Internet speed, Mbps)
: Integrated accessibility from zone i to zone j
Table 3 shows the QOL and QOB indicators categorized into three categories: Rules and Regulation, Infrastructure and DX technology, and the tick mark shows if it is related to any accessibility related indicators. Additionally, the city data, which is gathered from the internet and open sources, is also listed in Table 3.
2.4. QOL and QOB Evaluation Models
The study utilizes QOL and QOB evaluation models introduced in a previous study [32] and incorporates the integrated accessibility index (ACCI) into it as follows:
: Weight of service m for individual k
: Accessible value of service m for individual k
: Existing value of service m in zone j
: Integrated accessibility of individual category n in zone i
: Perceived value of service m for business k located in region i.
: Weight of business service m for business k.
: Accessible value of service m located in zone j.
: Existing value of service m in zone j
QOL and QOB through integrated accessibility using the estimated parameters from the questionnaire survey conducted in Aichi is calculated for startup-driven ASC in Aichi, Singapore, and Munich.
2.5. Scenario Settings
The study sets scenarios to evaluate ASC policies using the developed QOL and QOB evaluation model. Policy impacts are examined under two analytical settings. Setting 1 assesses the effects of individual policy interventions on startups’ QOB and on the QOL of relevant stakeholders, while Setting 2 evaluates the combined effects of ASC policies on startups’ QOB and stakeholders’ QOL.
Indicators are selected for this purpose based on direct policy controllability (if authorities can realistically change these indicators within a policy cycle), ASC specificity (if the indicators are specific to the ASC concept), strong impact (if the indicators have a higher monetary weight or large marginal impact on QOL and QOB), and clear interpretability (if policy impact can be clearly explained without ambiguity). For the policy evaluation purpose, 6 key indicators (corporate tax rate, number of international flights, air quality, number of high-speed rails, online administrative service coverage, and number of international flight destinations) are selected.
The primary objective of this scenario analysis is to examine how different ASC policies contribute to the enhancement of business and living environments and to verify the effectiveness of the proposed QOL and QOB models. In addition to estimating perceived QOL and QOB scores, the study analyzes changes in existing QOL conditions under each policy intervention. Below are the two scenario settings.
2.5.1. Scenario Setting 1
This scenario examines the effects of a single ASC policy on living and business environments, using the startup ecosystem in Aichi as a case study. For this purpose, one representative indicator is selected from each policy category: the corporate tax rate for Rules and Regulations, the number of high-speed rail stations for Infrastructure, and the level of online administrative services for DX Technologies. Three scenarios (A, B, and C) are analyzed in this setting where the corporate tax rate is reduced by 50%, 9 train stations are added to the existing condition, and online administrative service usage is increased by 100%, respectively.
2.5.2. Scenario Setting 2
In this scenario setting, multiple ASC policies are simultaneously implemented to evaluate their combined effects on startup-driven air-front smart ciASC. Specifically, six key policy indicators are selected: corporate tax rate, number of international conferences, number of high-speed rail stations, coverage of digital administrative services, number of international flight destinations, and air quality. Each indicator is adjusted by ±10 percent relative to the baseline condition.
To systematically examine different policy orientations, the policy indicators in Scenario Setting 2 are organized into two distinct policy sets to reflect different strategic orientations of ASC development and to explicitly examine how policy bundles with different functional roles influence startup QOB and stakeholders’ QOL. The primary criterion for constructing the policy sets is the mechanism through which each policy affects urban value creation within a startup-driven ASC. Specifically, the indicators are classified based on whether they primarily influence internal operational efficiency and institutional conditions, or whether they enhance the city’s external connectivity and international attractiveness.
Policy Set 1, comprising corporate tax rate, number of high-speed rail stations, and coverage of online administrative services, represents foundational competitiveness policies as shown in Table 4. These indicators directly affect a startup’s day-to-day business costs, administrative efficiency, and domestic accessibility. Their impacts are largely realized through improvements in regulatory efficiency, infrastructure availability, and digital service provision, making them essential baseline conditions for startup activity regardless of global positioning. Whereas, policy Set 2, including the number of international conferences, the number of international flight destinations, and air quality, represents global orientation and place-attractiveness policies. These indicators primarily influence a city’s visibility, connectivity, and reputation within international bodies and innovation networks. Their effects are strongly mediated by air-front characteristics, such as airport connectivity and international mobility, and are therefore particularly relevant to the ASC concept.
Separating policies into these two sets allows the analysis to (i) isolate the relative effectiveness of internal efficiency–oriented versus external connectivity-oriented policy packages, and (ii) evaluate potential synergies and trade-offs between improving baseline business conditions and enhancing global competitiveness. This distinction reflects real-world policy-making practices, in which ASC strategies typically combine regulatory reforms with investments aimed at strengthening international linkages.
2.6. Startup Ecosystem Comparison in Aichi, Singapore, and Munich
The study applies the startup attraction parameters estimated for Aichi to two international cities, Singapore and Munich, and compares their urban business and living environments from the perspective of ASC development. By transferring the parameter values, the analysis ensures a consistent evaluative framework, allowing differences in QOL and QOB outcomes to be attributed to variations in city characteristics rather than to changes in preference structures.
The objective of this analysis is twofold. First, it provides comparative insights into startup-driven ASC development across three international cities, highlighting similarities and contrasts in their policy environments and stakeholder outcomes. Second, it examines the applicability and robustness of the proposed integrated accessibility–based QOL and QOB evaluation framework in a broader international context. Through this comparative analysis, the study demonstrates the generalizability of the model and its potential usefulness for evaluating ASC strategies beyond the case of Aichi.
Additionally, the study gives scores, a startup-driven ASC score to each city based on its living and business environment conditions. The startup-driven ASC score is defined as the summation of QOL and QOB scores categorized into rules and regulations, infrastructure, and DX technology.
2.6.1. Singapore
Singapore, with a population of approximately 6 million, is a global city-state in Southeast Asia that functions as a major international hub for finance, trade, logistics, and innovation. Owing to its strategic geographic location, world-class airport (Changi Airport), and highly integrated transport and digital infrastructure, Singapore has developed strong air-front characteristics that support global business connectivity. The city-state is also known for its stable regulatory environment, pro-business policies, and advanced digital government services, which have contributed to the rapid growth of its startup ecosystem, particularly in sectors such as fintech, deep tech, and urban solutions. These features make Singapore a representative benchmark city for evaluating startup-driven ASC development in an international context. The estimated parameters estimated for startup-driven ASC in Aichi, and data available on the internet were used to estimate QOB and QOL in Singapore. Table 3 shows the three cities' attributes side by side.
2.6.2. Munich
Munich is one of the main economic hubs of southern Germany and is known for combining strong industry, modern technology, and a rich cultural background. The city has about 1.59 million residents and covers an area of 308 square kilometers. It plays an important role in Germany’s economy and innovation activities. In 2024, Munich’s city budget is about 7.91 billion GBP, showing its strong financial capacity to support urban development and public services. Although the city accounts for only around 1.9% of Germany’s total population, it has a high GDP per capita of 36,664 GBP. Population growth continues, but at a slow and stable rate of about 0.2%.
As can be seen in Table 6.9, Munich exhibits a strong but cost-intensive ASC profile. Under Rules and Regulations, Munich has the highest corporate tax rate among the three cities at 33%, compared with 24.86% in Aichi and 17% in Singapore. The other strength of Munich is having a larger international flight destination, with 184 international flight destinations, exceeding both Aichi (27) and Singapore (161). However, its economic growth rate is only 1.1%, indicating a mature and stable economy. In terms of Infrastructure, Munich has higher office costs. Office rents are the highest among the three cities at 20.6 thousand JPY/tsubo/month compared with 13.45 in Aichi and 4.79 in Singapore. The young population share is 33%, higher than both Aichi (23.7%) and Singapore (30%), supporting startup activity. Munich also benefits from 7 high-speed rail stations, reinforcing regional accessibility, while flood risk remains relatively low at 15%. Regarding DX Technologies, Munich performs at an intermediate level. Coverage of online administrative services is 54%, and online living services reach 80%, indicating advanced but not fully optimized digital governance compared with Singapore. The average internet speed is 130 Mbps, higher than Aichi (55.99 Mbps) but significantly lower than Singapore (372 Mbps). Also, road congestion is high compared to other cities, which will reduce the QOL and QOB scores.
3. Results
3.1. Parameter Estimations
Table 4 presents the parameter estimation results of the conjoint analysis, indicating the direction, statistical significance, and monetary value of each indicator affecting startup location preferences. Overall, most variables exhibit statistically significant coefficients with expected signs, suggesting that the model robustly captures startups’ urban evaluation behavior.
Population size has a positive and statistically significant effect, suggesting that larger cities are perceived as more attractive due to broader market opportunities. Economic growth rate also shows a strong positive and significant coefficient, indicating that startups place considerable value on dynamic and future-oriented economic environments. In contrast, per-capita GRP does not yield a statistically significant estimate, implying that aggregate economic affluence alone does not strongly influence startup location decisions.
The number of venture capital firms and the number of related large industries are not statistically significant, indicating that the mere presence of financial institutions or large firms does not directly drive startup preferences. Conversely, the size of the startup support budget provided by local governments has a positive and highly significant effect, highlighting the importance of tangible and accessible public support.
A higher proportion of the young population significantly increases urban attractiveness, reflecting startups’ preference for locations with a robust labor supply. The number of major universities and the share of English-proficient talent are also positive and significant, underscoring the value of human capital availability and international communication capacity. The number of high-class hotels and international conferences both show positive and significant coefficients, suggesting that business hospitality and opportunities for global interaction contribute to location appeal. The number of World Heritage Sites, however, does not exhibit a significant effect, indicating that cultural prestige alone is not a decisive factor.
The corporate tax rate has the largest negative and most statistically significant coefficient in the model, demonstrating that taxation exerts a substantial deterrent effect on startup location choice. Its monetary-equivalent value is the highest among all indicators, indicating that tax reductions generate the strongest incentive for startup attraction. Business registration time is not statistically significant, suggesting that procedural speed alone may be less influential than ongoing cost burdens. Office rent shows a significant negative effect, confirming that higher fixed operating costs reduce urban attractiveness.
The number of international flight destinations and high-speed rail stations within two hours both have positive and significant effects, indicating that domestic and international accessibility is a critical consideration. Higher average road travel speed is also positively associated with startup preference, reflecting the importance of efficient daily mobility.
Average internet speed and the diffusion of digital administrative services and digital lifestyle services are all positive and statistically significant, demonstrating that both business-related and daily digital infrastructures materially enhance urban attractiveness for startups. Longer travel times to retail, dining, and childcare facilities have significant negative effects, indicating that everyday accessibility constraints reduce location desirability. Residential floor area per capita is not statistically significant, suggesting that housing size alone is not a primary concern. Poor air quality, higher crime rates, increased traffic fatalities, and greater flood risk all show significant negative coefficients, indicating that safety and environmental risks directly and adversely affect startups’ urban preferences. Indicators that are not statistically significant are not included in our analysis.
Figure 1 presents the office rent equivalent monetary value of indicators, and it is expressed in JPY/tsubo/month. Tsubo is a traditional Japanese unit of area, and 1 tsubo is almost equal to 3.3058 Sq.m. The corporate tax rate exhibits the largest monetary impact (approximately 8,100 JPY/tsubo/month per 1% change), followed by economic growth, criminal offenses, international conferences, and so on. Where the lowest are high-class hotels, international flights, and digital life services.
3.2. QOL and QOB Estimations
3.2.1. Startup`s QOB
Table 5 presents the estimated QOB for startups, calculated by aggregating the perceived values of the business services within the startup ecosystem. Twelve indicators, which are categorized into three categories, are selected for the QOB evaluation for startups. Monetary-equivalent values of indicators estimated from the conjoint analysis of the survey, perceived accessible values of the services are calculated using equations (2) and (6). The monetary equivalent value of each indicator relative to its coefficient sign shows that an increase or reduction of a unit of the indicator corresponds to that equivalent monetary value expressed in JPY/tsubo/month of office rent for startup businesses. The gross startup’s QOB score is estimated to be equivalent to 10,489, representing the comprehensive business attractiveness of the city from the startup perspective.
From a category-level viewpoint, rules and regulations account for the largest share of QOB. Indicators such as the economic growth rate, startup support budget, and corporate tax rate exhibit high monetary-equivalent weights derived from the estimated parameter coefficients, resulting in substantial QOB contributions. This indicates that startups are particularly sensitive to institutional and macroeconomic conditions that directly affect long-term profitability, growth expectations, and investment risk. The relatively high estimated weights (coefficients) for these indicators imply that policy interventions in regulatory and fiscal domains yield disproportionately large impacts on startup attractiveness, especially considering the corporate tax rate, which has the highest parameter coefficient.
Infrastructure-related indicators form the second-largest contribution to QOB. High values for city population size, young population ratio, and office rents reflect the importance of labor-market scale, demographic structure, and operational cost conditions. Indicators related to physical connectivity and business support facilities, such as high-speed rail stations, major universities, and high-class hotels, exhibit moderate weights but contribute meaningfully when combined with favorable accessibility conditions. For these indicators, QOB contributions are partially mediated by the integrated accessibility (ACCI), indicating that their effectiveness depends not only on the existing value of the services but also on their spatial and functional accessibility through real and virtual networks.
DX technology–related indicators, represented by online administrative services, show a positive but relatively smaller contribution to QOB of startups in Aichi. Although the monetary-equivalent weight of this indicator is lower than that of fiscal or economic indicators, its contribution is enhanced through the ACCI, reflecting the role of digital accessibility in reducing transaction costs and administrative burdens. This suggests that DX policies function as efficiency enhancers that strengthen the overall business environment rather than acting as primary attraction drivers on their own.
3.2.2. Business Partner`s QOL
Table 6 presents the estimated QOL for business partners, calculated using the perceived monetary value of indicators, normalized city-level conditions, and the ACCI for accessibility-related indicators using equation (4). The overall business partner`s QOL is estimated at 6,967, representing the rent-equivalent value of the Aichi`s living and business environment for business partners under existing conditions.
The Rules and Regulations category contributes approximately 4,460, accounting for about 64% of the total business partner`s QOL. This category clearly dominates the evaluation, driven primarily by indicators related to international business interaction, environmental quality, traffic safety, and public support measures. The Infrastructure category contributes approximately 2,410, representing about 35% of the total QOL. The majority of this contribution comes from indicators associated with urban scale and knowledge infrastructure, while accessibility-dependent infrastructure elements show reduced perceived values due to integrated accessibility constraints. The DX Technologies category contributes approximately 78, accounting for about 1% of the total Business Partner’s QOL. Although quantitatively small, this value captures the realized benefit of digital administrative services under existing digital accessibility conditions.
These results indicate that, from a startup-driven ASC perspective, institutional and regulatory policies currently account for nearly two-thirds of business partner QOL in Aichi. Similarly, infrastructure policies provide a substantial supporting role for the QOL of business partners, whereas DX-oriented policies yield a smaller role. Some of the perceived accessibility related indicators get reduced due to the integrated accessibility constraints incorporated into the evaluation model.
3.2.3. Resident`s QOL
Table 7 presents the estimated residents’ QOL, calculated using perceived monetary values of indicators, normalized city conditions, and integrated accessibility constraints for accessibility-related indicators using equation (4). The total Residents’ QOL is estimated at 12,483.
3.3 Scenario Settings Evaluation
3.3.1. Scenario Setting 1
This scenario examines the effects of a single ASC policy on living and business environments, using the startup ecosystem in Aichi as a case study. For this purpose, one representative indicator is selected from each policy category: the corporate tax rate for Rules and Regulations, the number of high-speed rail stations for Infrastructure, and the level of online administrative services for DX Technologies. The result of this scenario analysis is shown in Figure 2.
Scenario A: 50% Reduction in the corporate tax rate
In this scenario, the corporate tax rate is reduced from 24.86% to 12.43%. Such a reduction is expected to substantially improve the urban business environment for startup firms. Given the relatively large estimated coefficient for the corporate tax rate, the results indicate that a 50% reduction leads to a 95% increase in startups’ QOB, nearly doubling their perceived business value. In parallel, business partners’ QOL increases by 115%, reflecting strong spillover effects on the broader business ecosystem. By contrast, this policy intervention has no direct impact on residents’ QOL, as the corporate tax rate does not enter the residential QOL evaluation model.
Scenario B: Adding 9 train stations
In this scenario, the number of high-speed rail stations accessible within two hours is increased from 21 to 30. This policy intervention is expected to enhance both living and business environments by improving regional and intercity accessibility within the startup ecosystem. The estimation results indicate that this improvement leads to an 8% increase in startups’ QOB, a 12% increase in business partners’ QOL, and a 6.7% increase in residents’ QOL. These results highlight a key feature of the ASC concept: infrastructure investments aimed at strengthening regional connectivity can simultaneously support economic activities and improve quality of life for multiple stakeholder groups, rather than benefiting only businesses. This emphasizes the novelty of the ASC concept, which connects economic growth with residents' QOL, considering the strength and uniqueness of the city.
Furthermore, this scenario demonstrates the capability of the proposed QOL and QOB model to quantitatively capture the spillover effects of transport infrastructure policies across different stakeholders. In monetary terms, the addition of nine high-speed rail stations generates an estimated 17,334 JPY/tsubo/month in aggregate business value within the startup ecosystem in Aichi, indicating a substantial rent-equivalent gain attributable to improved accessibility. The result can confirm that enhancing high-speed rail accessibility within a two-hour range represents a highly effective ASC strategy, as it generates measurable business value for startups while simultaneously improving quality of life for business partners and residents through integrated regional connectivity.
Scenario C: 100% increase in online administrative service percentage
In this scenario, the proportion of administrative services delivered online is increased from 30% to 60%. Using the proposed QOL and QOB evaluation framework, the impacts on urban living environments and the business environment are assessed. The results indicate improvements of 2% in startups’ QOB, 3% in business partners’ QOL, and 1.7% in residents’ QOL. Furthermore, the analysis reveals that a 100% increase in online administrative service utilization generates an additional equivalent office rent value of 13,393 JPY per tsubo per month for the startup ecosystem in Aichi. Figure 6.3 illustrates the impacts of scenario setting 1 on QOL and QOB.
3.4.2. Scenario Setting 2
Policy Set 1 scenario assessment
Policy Set 1 comprises the corporate tax rate, the number of high-speed rail stations, and the coverage of online administrative services. Two scenarios are evaluated. Scenario A applies a 10% increase to the existing values of the indicators in this package, while Scenario B applies a 20% increase. The resulting impacts on startups’ QOB and stakeholders’ QOL are examined. Figure 3 presents the results of the scenario analysis for Policy Set 1, where S1-A and S1-B denote Scenario A and Scenario B, respectively. As shown in the figure, a 10% improvement in the selected indicators leads to a 21% increase in startups’ QOB, a 32% increase in business partners’ QOL, and a 1.7% increase in residents’ QOL.
When the magnitude of policy intervention is doubled to 20%, the impact scales proportionally. Specifically, startups’ QOB increases by 42%, business partners’ QOL by 64%, and residents’ QOL by 3.4%. These results indicate a near-linear response of economic and quality-of-life outcomes to improvements in foundational regulatory, infrastructure, and DX-oriented policies, with particularly strong effects observed for startups and business partners.
Policy set 2 scenario assessment
Policy Set 2 includes the number of international conferences held, the number of international flight destinations, and the air quality. Two scenarios are evaluated. Scenario A applies a 10% increase to the existing values of the indicators in this package, while Scenario B applies a 20% increase, similar to policy set 2 scenario assessment. The resulting impacts on startups’ QOB and stakeholders’ QOL are investigated. Figure 4 presents the results of the scenario analysis for Policy Set 2, where S2-A and S2-B denote Scenario A and Scenario B, respectively. As shown in the figure, a 10% improvement in the selected indicators leads to a 2.2% increase in startups’ QOB, a 7.6% increase in business partners’ QOL, and a 2.2% increase in residents’ QOL.
When the magnitude of policy intervention is doubled to 20%, the impact scales proportionally. Specifically, startups’ QOB increases by 4.8%, business partners’ QOL by 15.3%, and residents’ QOL by 4.4%. Compared with Policy Set 1, these results indicate that policies enhancing international connectivity and urban attractiveness yield more moderate direct gains for startups’ business value, while generating relatively greater improvements in stakeholders’ quality of life, particularly for business partners and residents.
3.5. Cross City Comparative Analysis
3.5.1. Startup`s QOB, Business Partner`s QOL, and Resident`s QOL
Figure 5 presents the estimated QOB and QOL values for Aichi, Singapore, and Munich. As illustrated in the figure, Singapore exhibits substantially higher startup QOB and business partners’ QOL than both Aichi and Munich, while its residents’ QOL remains comparatively low. Munich shows a higher startup QOB and business partners’ QOL than Aichi, reflecting stronger business-oriented conditions; however, its residents’ QOL is lower than that of Aichi. In contrast, Aichi demonstrates a more balanced profile, with moderate business performance and the highest residents’ QOL among the three cities.
The corporate tax rate, as a main indicator of startup-driven ASC, largely contributes to the enhancement of business environments. Additionally, considering lower traffic congestion (physical accessibility) and higher internet speed (digital accessibility), captured by the integrated accessibility index, significantly contribute to simultaneous gains in QOL and QOB. This highlights the effectiveness of ASC policies that jointly integrate regulatory measures, infrastructure, and digital services to amplify both urban business performance and living environments.
Singapore’s QOB is strongly driven by regulatory and global connectivity advantages. Its low corporate tax rate generates a large positive contribution to startup QOB, while its exceptionally high startup support budget dominates the business value structure. Strong performance in international flight destinations, English proficiency, and digital administrative services reflects Singapore’s highly concentrated ASC model, where global accessibility is primarily achieved through air networks and advanced digital services. However, weaker environmental indicators, such as air quality, and limited integration with surrounding regions constrain the spillover of business value into residents’ QOL.
Aichi demonstrates how an ASC can leverage regional connectivity and distributed urban assets to enhance both QOB and QOL. High contributions from high-speed rail accessibility, major universities, and population scale indicate that startups and residents benefit from access to a wide range of services, talent, and markets beyond the immediate air-front. These elements strengthen perceived accessibility through both physical and virtual networks, reinforcing economic growth while maintaining relatively balanced living conditions. This illustrates that the effectiveness of ASC policies depends on how well airport functions are embedded within the wider metropolitan and regional system.
Munich represents a case where strong environmental quality and demographic advantages, such as a high share of young population, contribute positively to QOL and QOB. However, a high corporate tax burden results in a substantial negative contribution to startup QOB, limiting the city’s competitiveness in attracting startups despite favorable living conditions. While Munich benefits from strong startup support budget, international flight destination, and lower traffic accidents, weaker crime rates, office rent, and high-speed rail stations reduce the overall QOB and QOL.
3.5.2. Startup-Driven ASC Scores
As shown in Figure 6, the results reveal substantial inter-city differences in startup-driven ASC score, particularly across institutional, physical, and digital dimensions. In the Rules and Regulations category, Singapore demonstrates a pronounced advantage, achieving a score of 48,423, which is more than four times higher than Aichi (10,898 and over three times higher than Munich (14,233). This large gap highlights the decisive role of institutional quality, including regulatory efficiency, fiscal incentives, and international connectivity, in shaping urban attractiveness for startup firms. The findings suggest that rules and regulation policies exert a strong, largely non-substitutable influence on the startup ecosystem, which cannot be fully offset by improvements in infrastructure and DX technology policies alone.
In contrast, differences in the infrastructure category are comparatively modest. Singapore and Aichi exhibit nearly equivalent values, at 5,301 and 5,196, respectively, indicating similar levels of monetized benefits from transport systems, service proximity, and urban facilities once normalized and weighted. Munich records a lower value of 3,467, reflecting comparatively higher spatial costs or less efficient physical access. This pattern supports the notion that, beyond a certain development threshold, further investments in physical infrastructure yield diminishing marginal returns, and their contribution to overall QOL and QOB becomes less differentiated across advanced cities.
Figure 6.
Overall Startup-driven ASC scores for Aichi, Singapore, and Munich
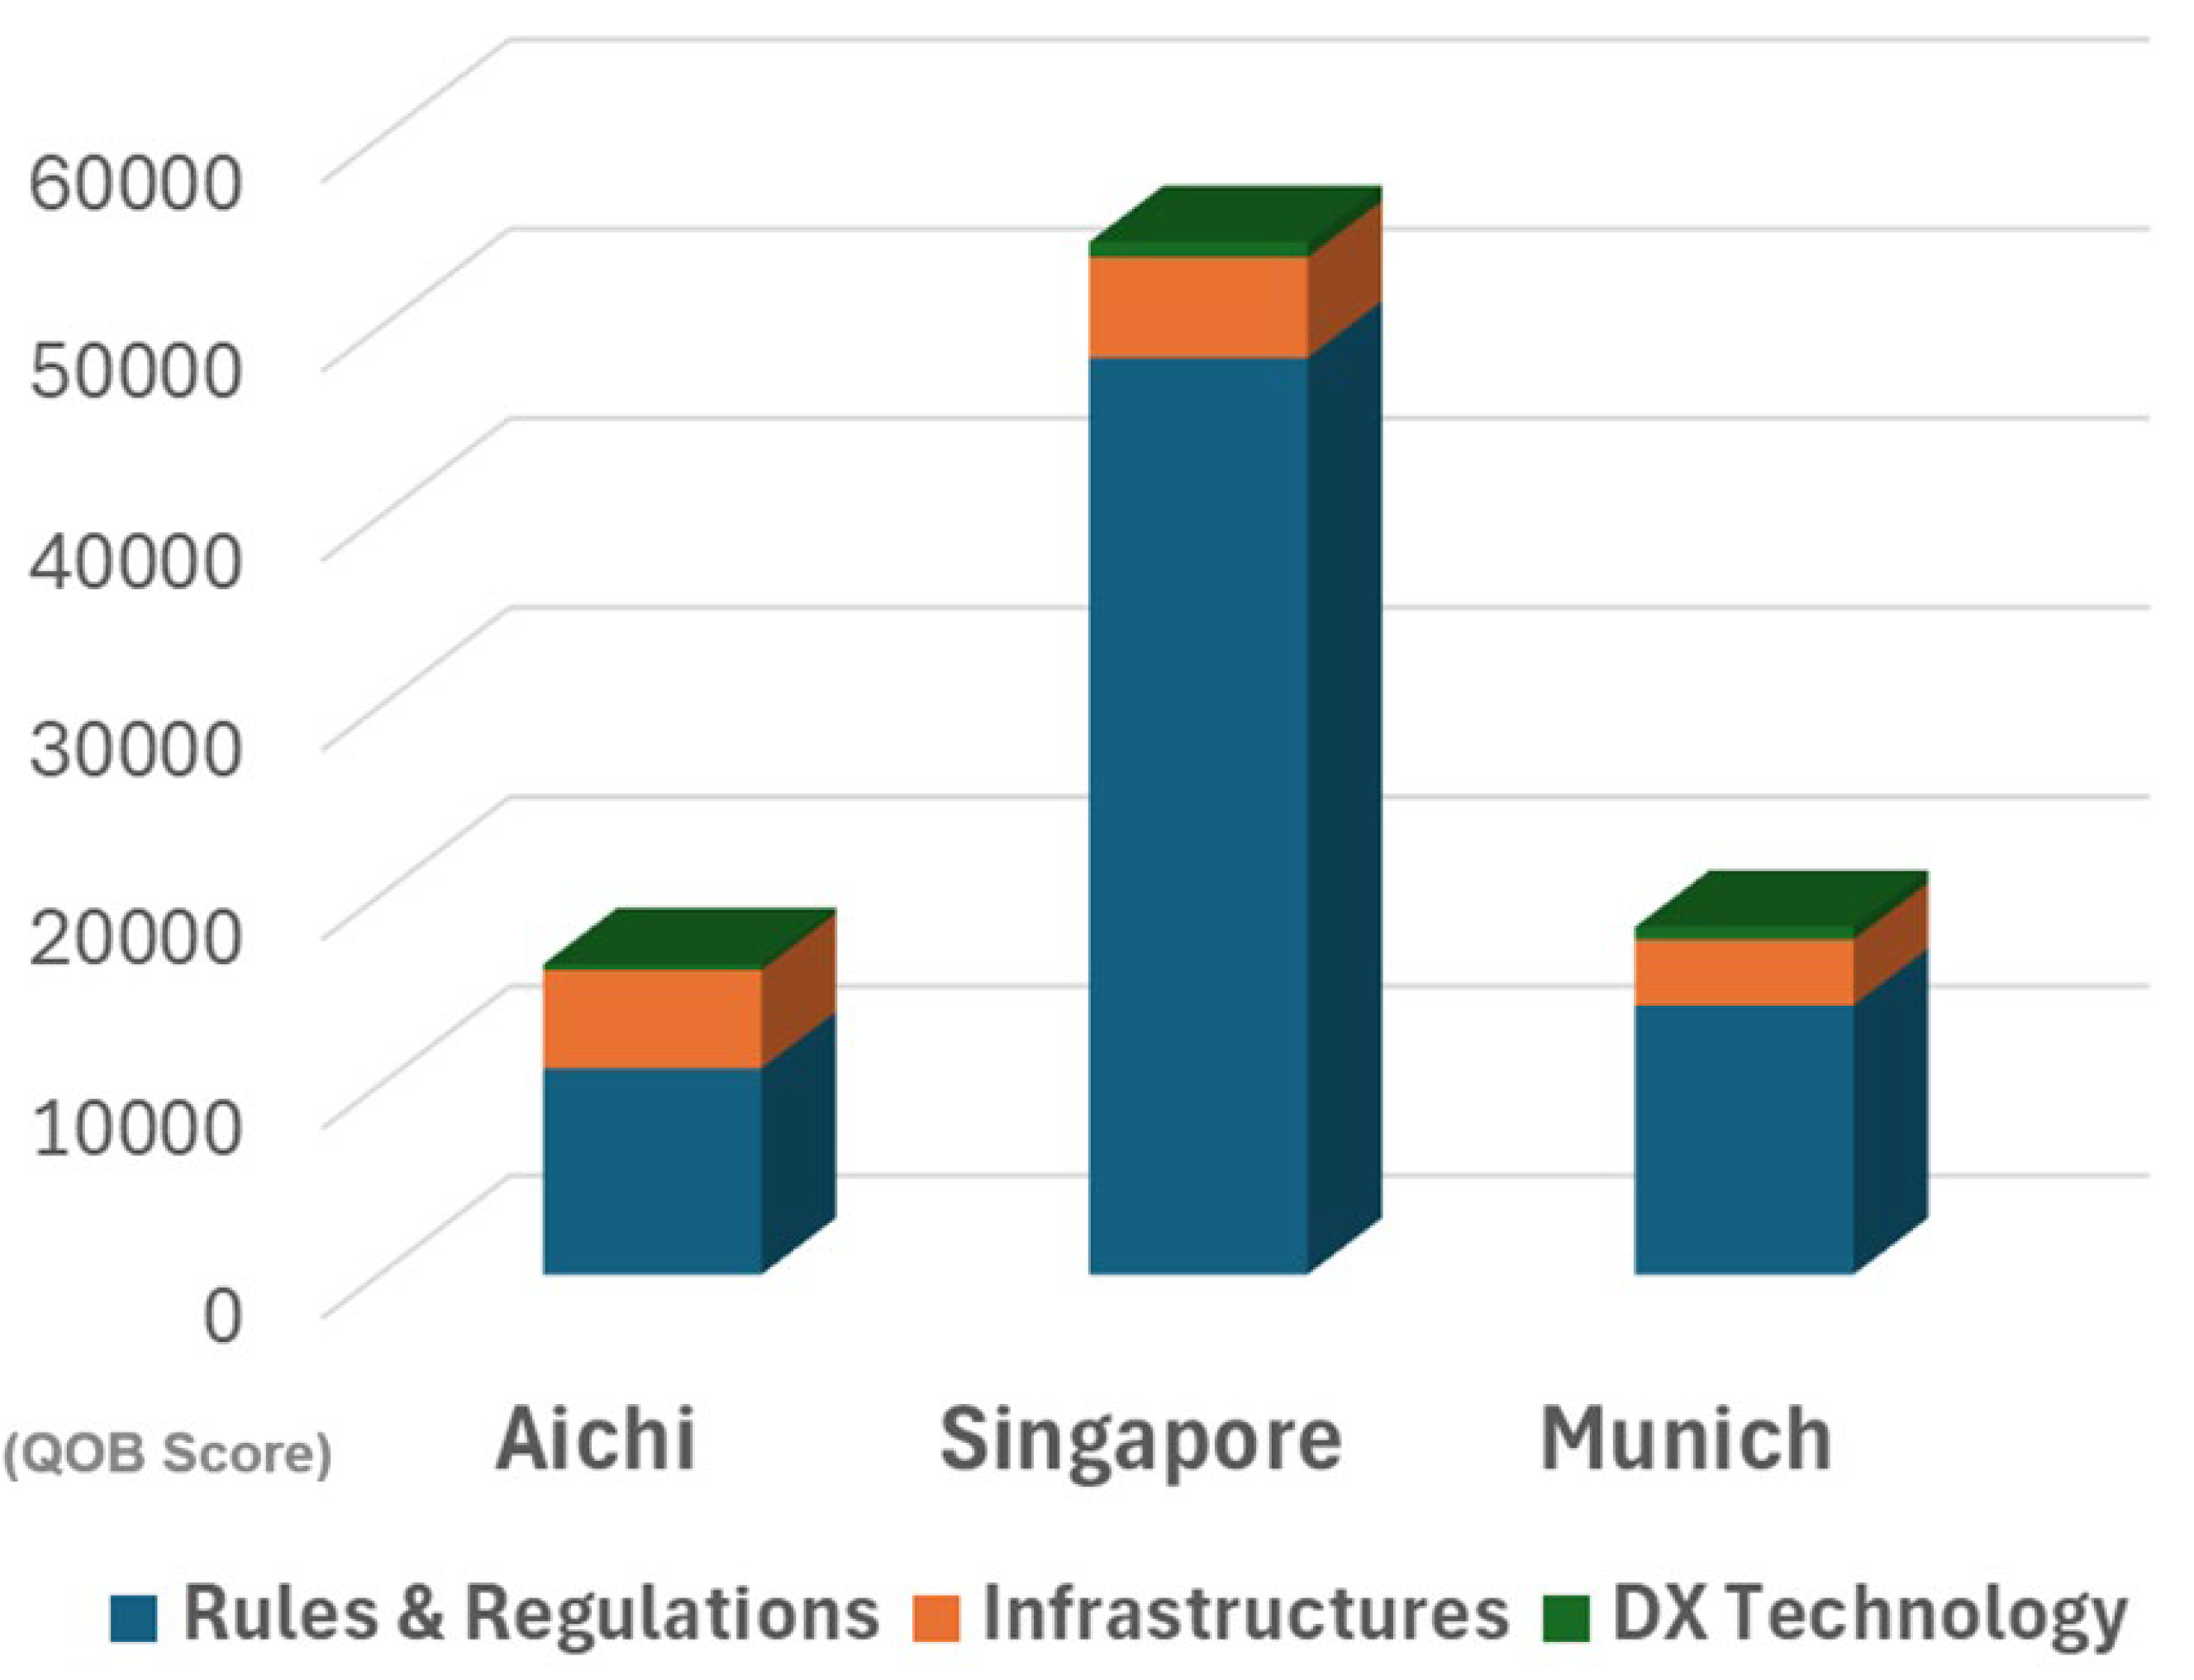
Clear disparities emerge again in the DX Technology category. Singapore attains the highest value at 804, followed by Munich at 667, while Aichi lags considerably at 299. These differences indicate varying capacities to provide high-quality digital services, including internet performance and the availability of online administrative and living services. The results imply that digital accessibility can partially substitute for physical accessibility by reducing the need for travel and enhancing service reach; however, this substitution effect materializes only when digital service maturity is sufficiently high.
Taken together, the findings indicate that Singapore’s superior Startup-driven ASC score is primarily driven by its strong institutional framework, reinforced by advanced DX technology, rather than by physical infrastructure alone. Aichi’s performance remains largely dependent on physical accessibility, but comparatively weaker regulatory and digital components constrain its overall utility gains. Munich occupies an intermediate position, characterized by a lower infrastructure score, intermediate rules and regulations, and DX technology scores. Overall, the results corroborate the argument that rules and regulations and DX policies function as key amplifiers of QOL and QOB, while infrastructure policies alone are insufficient to ensure urban competitiveness in the context of startup-driven ASC.
4. Discussion
4.1. Dominant Drivers of Startup Attraction in Air-Front Smart Cities
The results indicate that rules and regulation policies dominate startup location preferences within the ASC context. Among all evaluated indicators, the corporate tax rate exhibits the largest negative coefficient and monetary-equivalent value, substantially outweighing infrastructure- or DX-technology related policies. This finding confirms that startups are primarily sensitive to long-term cost structures and regulatory certainty, rather than isolated improvements in infrastructure and DX technology policies.
Economic growth emerges as the second most influential positive driver of startup QOB, underscoring the importance of dynamic economic expectations over static indicators such as per-capita GRP. This result suggests that startups value future-oriented regional trajectories more than current affluence levels. Similarly, safety-related indicators, particularly crime risk and traffic accident risk, show strong negative effects, indicating that risk perceptions directly affect both QOL and QOB, even in economically advanced regions.
Collectively, these results imply that ASC strategies that promote infrastructure investment or airport functions alone are insufficient. Instead, fiscal competitiveness, macroeconomic vitality, and urban safety form the structural foundation of startup-driven air-front development.
4.2. Relative Roles of Infrastructure and Digitalization
Infrastructure policies play a secondary but complementary role in shaping startup attractiveness. City population size, young population share, and access to universities significantly contribute to QOB by strengthening labor-market depth and knowledge availability. However, their realized contribution is partially constrained by integrated accessibility effects, demonstrating that infrastructure value depends not only on supply but also on functional access through physical and digital networks.
DX technology policies, particularly online administrative services, consistently show positive and statistically significant effects, but their absolute contribution remains modest compared to rules and regulations and infrastructure. This suggests that DX policies function primarily as efficiency multipliers, reducing transaction costs and administrative friction rather than acting as standalone attraction mechanisms. Importantly, the integrated accessibility formulation reveals that the effectiveness of DX interventions is conditional on baseline internet performance and service adoption probabilities, reinforcing the need for coordinated physical–digital infrastructure planning.
4.3. Policy Implications from Scenario Analysis
The scenario evaluations provide strong evidence that policy effectiveness varies substantially by policy type. Single-policy interventions demonstrate highly asymmetric impacts. In particular, a 50% reduction in the corporate tax rate nearly doubles startup QOB and more than doubles business partner QOL, while having no direct effect on residents’ QOL. In contrast, infrastructure expansion and DX improvements yield incremental and distributed gains, affecting all stakeholder groups but at a smaller magnitude.
The bundled policy analysis further demonstrates that foundational competitiveness policies, combining tax reduction, high-speed rail expansion, and digital administrative coverage, outperform global visibility-oriented policy bundles in generating joint QOB and QOL gains. This finding highlights that internal efficiency and cost-reduction mechanisms dominate external attractiveness measures in startup-driven ASCs, at least under existing economic conditions. These results caution against overemphasizing flagship projects or international branding strategies without first addressing structural regulatory and institutional barriers.
4.4. Cross-City Comparison
The comparative analysis between Aichi, Singapore, and Munich demonstrates the external validity and transferability of the proposed QOL and QOB evaluation model. Singapore’s superior QOB performance is primarily explained by its low corporate tax rate, higher DX technology indicators, and strong global connectivity, whereas Aichi’s higher QOL reflects lower safety risks, better environmental conditions, and balanced infrastructure indicators. Munich, despite strong international connectivity and human capital, exhibits a lower overall score due to high taxation and operational costs, confirming the model’s sensitivity to regulatory and fiscal factors.
These cross-city results suggest that airport function advantages alone do not guarantee startup competitiveness. Instead, airports act as amplifiers whose effectiveness depends on complementary institutional and urban conditions. The consistent explanatory power of the Aichi-derived parameters across heterogeneous cities supports the framework’s applicability for ex-ante policy evaluation in different national and institutional contexts.
4.5. Contributions and Limitations
This study advances smart city research by operationalizing the ASC concept through a quantified, integrated accessibility based QOL and QOB evaluation model grounded in startup preferences. Methodologically, the integration of conjoint analysis with accessibility-adjusted evaluation models provides a rigorous basis for translating qualitative perceptions into policy-relevant metrics.
Nevertheless, the findings should be interpreted with awareness of limitations. Parameter estimation relies on startup preferences observed in Aichi, and while transferability is demonstrated, local institutional differences may alter preference structures in other contexts. Additionally, accessibility was proxied using road congestion and internet speed due to data constraints, suggesting opportunities for refinement using multimodal transport and service-specific digital access measures in future research.
5. Conclusions
This study incorporated the integrated accessibility index into the QOL and QOB evaluation model to assess urban business and living environments within a startup-driven ASC concept in Aichi. The study used preliminary interview survey data for selecting indicators for startup ecosystem evaluation, then used conjoint analysis data to estimate indicator weight parameters using a questionnaire survey. Taking advantage of conjoint analysis, the study estimated the monetary value of each indicator with respect to office rent (JPY/tsubo/month). The study took traffic congestion (km/h) and internet speed (Mbps) as physical and digital accessibility indices, respectively, for integrated accessibility index calculation. The integrated accessibility calculation, which is a novelty of this paper, is used to estimate the perceived accessible values of each component indicator.
The model is applied to three cities: Aichi, Singapore, and Munich, by calibrating parameters estimated within Aichi`s startup ecosystem for the other two cities. All three cities are investing in promoting startups to boost their economic growth. However, within the concept of an ASC, economic growth is not the only focus, but the residents' and business stakeholders' QOL as well. Therefore, this study estimated the QOB score for startups and the QOL scores for business partners of startups, and the residents in the three cities.
The study could positively test different urban policy scenarios in different settings, by which we could verify the effectiveness and applicability of the model for assessing ASC policies. Incorporating the integrated accessibility in the model could give us a clear picture of scenarios for startup developments within the concept of an ASC.
The result of this chapter discloses that corporate tax rates have a higher weight compared to other ASC policies, which are followed by economic growth, criminal offenses, international conferences, and so on. Whereas the lower rank indicators are high-class hotels, international flight destinations, digital life services, and so on. Using these parameter weights, living and business environments for startup developments were evaluated within the context of an ASC.
The result of this chapter emphasizes reducing corporate tax rates and startup support budgets, which substantially improve business environments. Whereas policies related to the improvements of airport function, physical and digital accessibility, crime rate, and air quality enhance both living and business environments. Therefore, policymakers are advised to look for policy packages that can enhance opportunities for both residents and businesses. Such a way of policy assessment, while considering the uniqueness and strength of the region, and integrating airport functions and DX technologies, aligns with the ASC policy implementations.
QOL and QOB for startup-driven ASCs in Aichi, Singapore, and Munich were investigated. The results disclosed that Singapore has a higher startup-driven ASC core, followed by Munich and Aichi. Whereas Aichi has a higher resident's QOL compared to the other two cities.
As a future research prospect, the study suggests incorporating QOL and QOB evaluation into regional evaluation models and regenerative economic models. A decarbonization estimation model can be developed to assess the three-fold ASC (happiness for people, happiness for businesses, and happiness for the environment).
Author Contributions
Conceptualization, M.M., N.S.; methodology, M.M. and N.S.; software, M.M.; validation, M.M.; formal analysis, M.M. and T.T.; investigation, M.M. and T.T.; resources, M.M.; data curation, M.M.; writing—original draft preparation, M.M.; writing—review and editing, M.M. and N.S.; visualization, M.M.; supervision, N.S., H.M., Y.H., and K.M.; project administration, N.S. and Y.H.; funding acquisition, N.S. All authors have read and agreed to the published version of the manuscript.
Funding
This work was supported by JST SICORP Grant Number JPMJSC22E2, Japan, and the Japan Society for the Promotion of Science (JSPS) under Grant-in-Aid for Scientific Research (23H01530). We would like to express our sincere gratitude for this support.
Data Availability Statement
The original contributions presented in this study are included in the article. Further inquiries can be directed at the corresponding author.
Conflicts of Interest
Not applicable.
Abbreviations
The following abbreviations are used in this manuscript:
| QOL | Quality of Life |
| QOB | Quality of Business |
| ASC | Air-front Smart City |
References
- Cohen, B. The three generations of smart cities: Inside the development of the technology-driven city. FastCompany CoExist 2015, 25. [Google Scholar]
- Makieła, Z.J.; Stuss, M.M.; Mucha-Kuś, K.; Kinelski, G.; Budziński, M.; Michałek, J. Smart City 4.0: Sustainable Urban Development in the Metropolis GZM. Sustainability 2022, 14, 3516. [Google Scholar] [CrossRef]
- Svitek, M.; Kozhevnikov, S. Smart City 5.0 as a digital ecosystem of smart services: Basic concept. In Smart Cities and Digital Transformation: Empowering Communities, Limitless Innovation, Sustainable Development and the Next Generation; Lytras, M.D., Housawi, A.A., Alsaywid, B.S., Eds.; 2023. [Google Scholar] [CrossRef]
- Vodák, J.; Šulyová, D.; Kubina, M. Advanced Technologies and Their Use in Smart City Management. Sustainability 2021, 13, 5746. [Google Scholar] [CrossRef]
- Chang, S.; Smith, M.K. Residents’ Quality of Life in Smart Cities: A Systematic Literature Review. Land 2023, 12, 876. [Google Scholar] [CrossRef]
- Teixeira, J.V.S.; Baracho, R.M.A.; Soergel, D. Smart cities, sustainability, and quality of life: A comparison of indexes and the indicators they include. J. Systemics Cybern. Inform. 2022, 20, 80–90. [Google Scholar] [CrossRef]
- Ejaz, W.; Anpalagan, A. Internet of Things for smart cities: Overview and key challenges. In Internet of Things for Smart Cities; SpringerBriefs in Electrical and Computer Engineering; Springer: Cham, Switzerland, 2019; pp. 1–15. [Google Scholar] [CrossRef]
- Chen, Z.; Gan, W.; Wu, J.; Lin, H.; Chen, C.M. Metaverse for smart cities: A survey. Internet Things Cyber-Phys. Syst. 2024, 4, 203–216. [Google Scholar] [CrossRef]
- Sheng, H.; Zhang, Y.; Wang, W.; Shan, Z.; Fang, Y.; Lyu, W.; Xiong, Z. High-confidence evaluation for smart city services. Front. Environ. Sci. 2022, 10, 950055. [Google Scholar] [CrossRef]
- Dai, Y.; Hasanefendic, S.; Bossink, B. A systematic literature review of the smart city transformation process: The role and interaction of stakeholders and technology. Sustain. Cities Soc. 2024, 101, 105112. [Google Scholar] [CrossRef]
- Zhao, F.; Fashola, O.I.; Olarewaju, T.I.; Onwumere, I. Smart city research: A holistic and state-of-the-art literature review. Cities 2021, 119, 103406. [Google Scholar] [CrossRef]
- Hartley, K. Public perceptions about smart cities: Governance and quality-of-life in Hong Kong. Soc. Indic. Res. 2023, 166, 731–753. [Google Scholar] [CrossRef]
- Madakam, S.; Ramaswamy, R.; Date, H. Quality of life @ Palava smart city: A case study. Glob. Bus. Rev. 2019, 20, 708–742. [Google Scholar] [CrossRef]
- Janaina, M.; Rodrigo, M.C.; João, A.R.S.; Kelin, A.S. Smart city and quality of life: Citizens’ perception in a Brazilian case study. J. Clean. Prod. 2018, 182, 717–726. [Google Scholar] [CrossRef]
- Hsiaoping, Y. The effects of successful ICT-based smart city services: From citizens’ perspectives. Gov. Inf. Q. 2017, 34, 556–565. [Google Scholar] [CrossRef]
- Li, B.; Yang, X.; Wu, X. Role of net-zero renewable-based transportation systems in smart cities toward enhancing cultural diversity: A realistic model using a digital twin. Sustain. Energy Technol. Assess. 2024, 65, 103715. [Google Scholar] [CrossRef]
- Wu, D.; Xie, Y.; Lyu, S. Disentangling the complex impacts of urban digital transformation and environmental pollution: Evidence from smart city pilots in China. Sustain. Cities Soc. 2023, 88, 104266. [Google Scholar] [CrossRef]
- Hämäläinen, M. A framework for a smart city design: Digital transformation in the Helsinki smart city. In Entrepreneurship and the Community; Ratten, V., Ed.; Springer: Cham, Switzerland, 2020. [Google Scholar] [CrossRef]
- Sharifi, A.; Beris, A.T.; Javidi, A.S.; Nouri, M.; Lonbar, A.G.; Ahmadi, M. Application of artificial intelligence in digital twin models for stormwater infrastructure systems in smart cities. Adv. Eng. Inform. 2024, 61, 102485. [Google Scholar] [CrossRef]
- Larrinaga, F.; Pérez, A.; Aldalur, I.; Hernández, J.L.; Izkara, J.L.; Sáez de Viteri, P. A Holistic and Interoperable Approach towards the Implementation of Services for the Digital Transformation of Smart Cities: The Case of Vitoria-Gasteiz (Spain). Sensors 2021, 21, 8061. [Google Scholar] [CrossRef] [PubMed]
- Soyata, T.; Habibzadeh, H.; Ekenna, C.; Nussbaum, B.; Lozano, J. Smart city in crisis: Technology and policy concerns. Sustain. Cities Soc. 2019, 50, 101566. [Google Scholar] [CrossRef]
- Mora, H.; Gilart-Iglesias, V.; Pérez-del Hoyo, R.; Andújar-Montoya, M.D. A Comprehensive System for Monitoring Urban Accessibility in Smart Cities. Sensors 2017, 17, 1834. [Google Scholar] [CrossRef] [PubMed]
- Rashid, Z.; Melià-Seguí, J.; Pous, R.; Peig, E. Using augmented reality and the Internet of Things to improve accessibility for people with motor disabilities in smart cities. Future Gener. Comput. Syst. 2017, 76, 248–261. [Google Scholar] [CrossRef]
- Osman, A.M.S.; Elragal, A.A.; Ståhlbröst, A. Data-Driven Decisions in Smart Cities: A Digital Transformation Case Study. Appl. Sci. 2022, 12, 1732. [Google Scholar] [CrossRef]
- Furtado, L.S.; Coelho da Silva, T.L.; Ferreira, M.G.F.; Fernandes de Macedo, J.A.; Cavalcanti Moreira, J.K.M.L. A framework for digital transformation towards smart governance: Using big data tools to target SDGs in Ceará, Brazil. J. Urban Manag. 2023, 12, 74–87. [Google Scholar] [CrossRef]
- Marchesani, F.; Masciarelli, F.; Bikfalvi, A. Smart city as a hub for talent and innovative companies: Exploring the (dis)advantages of digital technology implementation in cities. Technological Forecasting and Social Change 2023, 193, 122636. [Google Scholar] [CrossRef]
- de Oliveira, Á.; Campolargo, M. From smart cities to human smart cities. In Proceedings of the 48th Hawaii International Conference on System Sciences, Kauai, HI, USA, 2015; pp. 2336–2344. [Google Scholar] [CrossRef]
- Kruhlov, V.; Dvorak, J. Social Inclusivity in the Smart City Governance: Overcoming the Digital Divide. Sustainability 2025, 17, 5735. [Google Scholar] [CrossRef]
- Jonek-Kowalska, I.; Wolny, M. Age Sustainability in Smart City: Seniors as Urban Stakeholders in the Light of Literature Studies. Sustainability 2025, 17, 6333. [Google Scholar] [CrossRef]
- Li, L.; Li, D.; Zhou, S.; Huang, H.; Huang, G.; Yu, L. Unveiling age-friendliness in smart cities: A heterogeneity analysis based on the IAHP–CRITIC–IFCE approach. Habitat Int. 2024, 151, 103153. [Google Scholar] [CrossRef]
- Flak, L.S.; Hofmann, S. The impact of smart city initiatives on human rights. In EGOV-CeDEM-ePart, 2020.
- Mutahari, M.; Sugiki, N.; Mababangloob, G.R.; Concepcion, R., II; Maniquiz-Redillas, M.; Hayashi, Y.; Matsuo, K. A holistic evaluation framework for air-front smart cities: Integrating quality of life and quality of business via accessibility modeling. J. East. Asia Soc. Transp. Stud. 2025, 16. [Google Scholar] [CrossRef]
- Fritsch, M. New business formation and regional development: A survey and assessment of the evidence. Found. Trends Entrep. 2013, 9, 249–364. [Google Scholar] [CrossRef]
- Uchida, K.; Kato, H.; Murakami, J.; Takeuchi, W. Does new airport investment promote urban economic development? Global evidence from nighttime light data. Transp. Res. Part A Policy Pract. 2024, 180, 103948. [Google Scholar] [CrossRef]
- Mutahari, M.; Suzuki, D.; Sugiki, N.; Matsuo, K. Digital service substitution and social networks: Implications for sustainable urban development. Sustainability 2025, 17, 5185. [Google Scholar] [CrossRef]
- Mutahari, M.; Sugiki, N.; Suzuki, D.; Hayashi, Y.; Matsuo, K. A computational framework for evaluating quality of life in sustainable urban environments: Integrating physical and digital service accessibility. Sustainability 2025, 17, 9660. [Google Scholar] [CrossRef]
Figure 1.
Equivalent monetary value of indicators (JPY/tsubo/month)
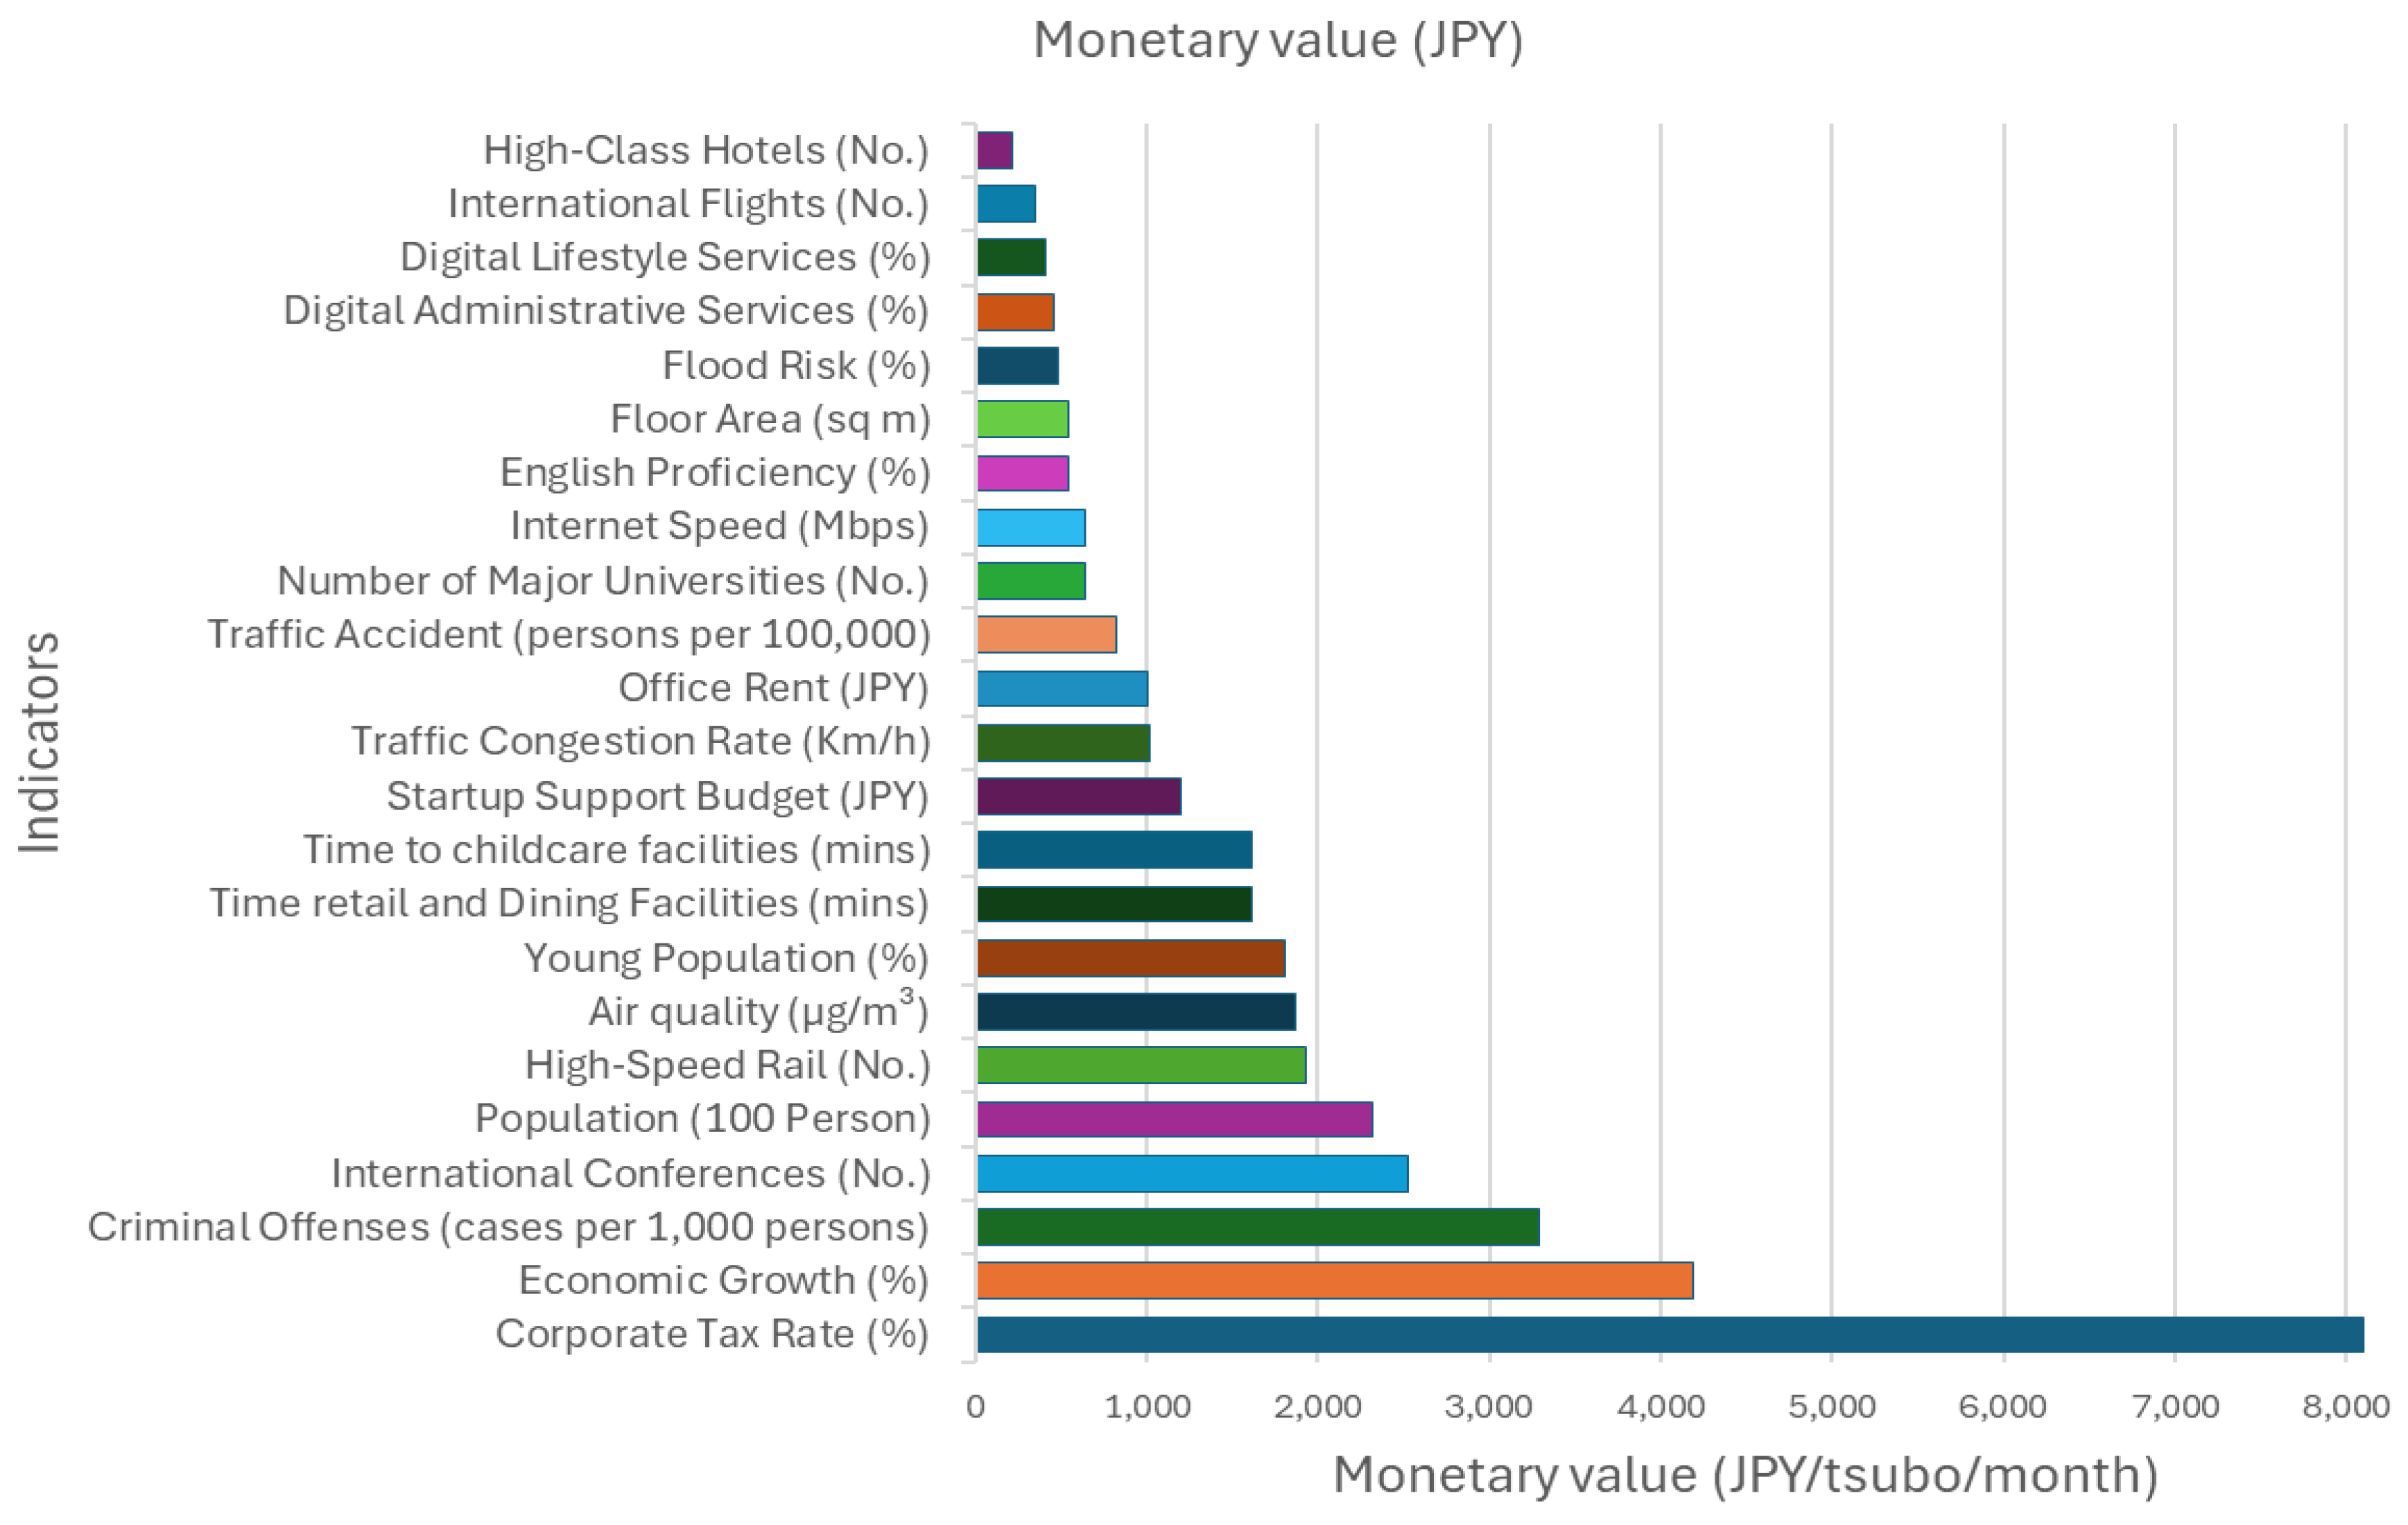
Figure 2.
Impacts of scenarios on QOL and QOB
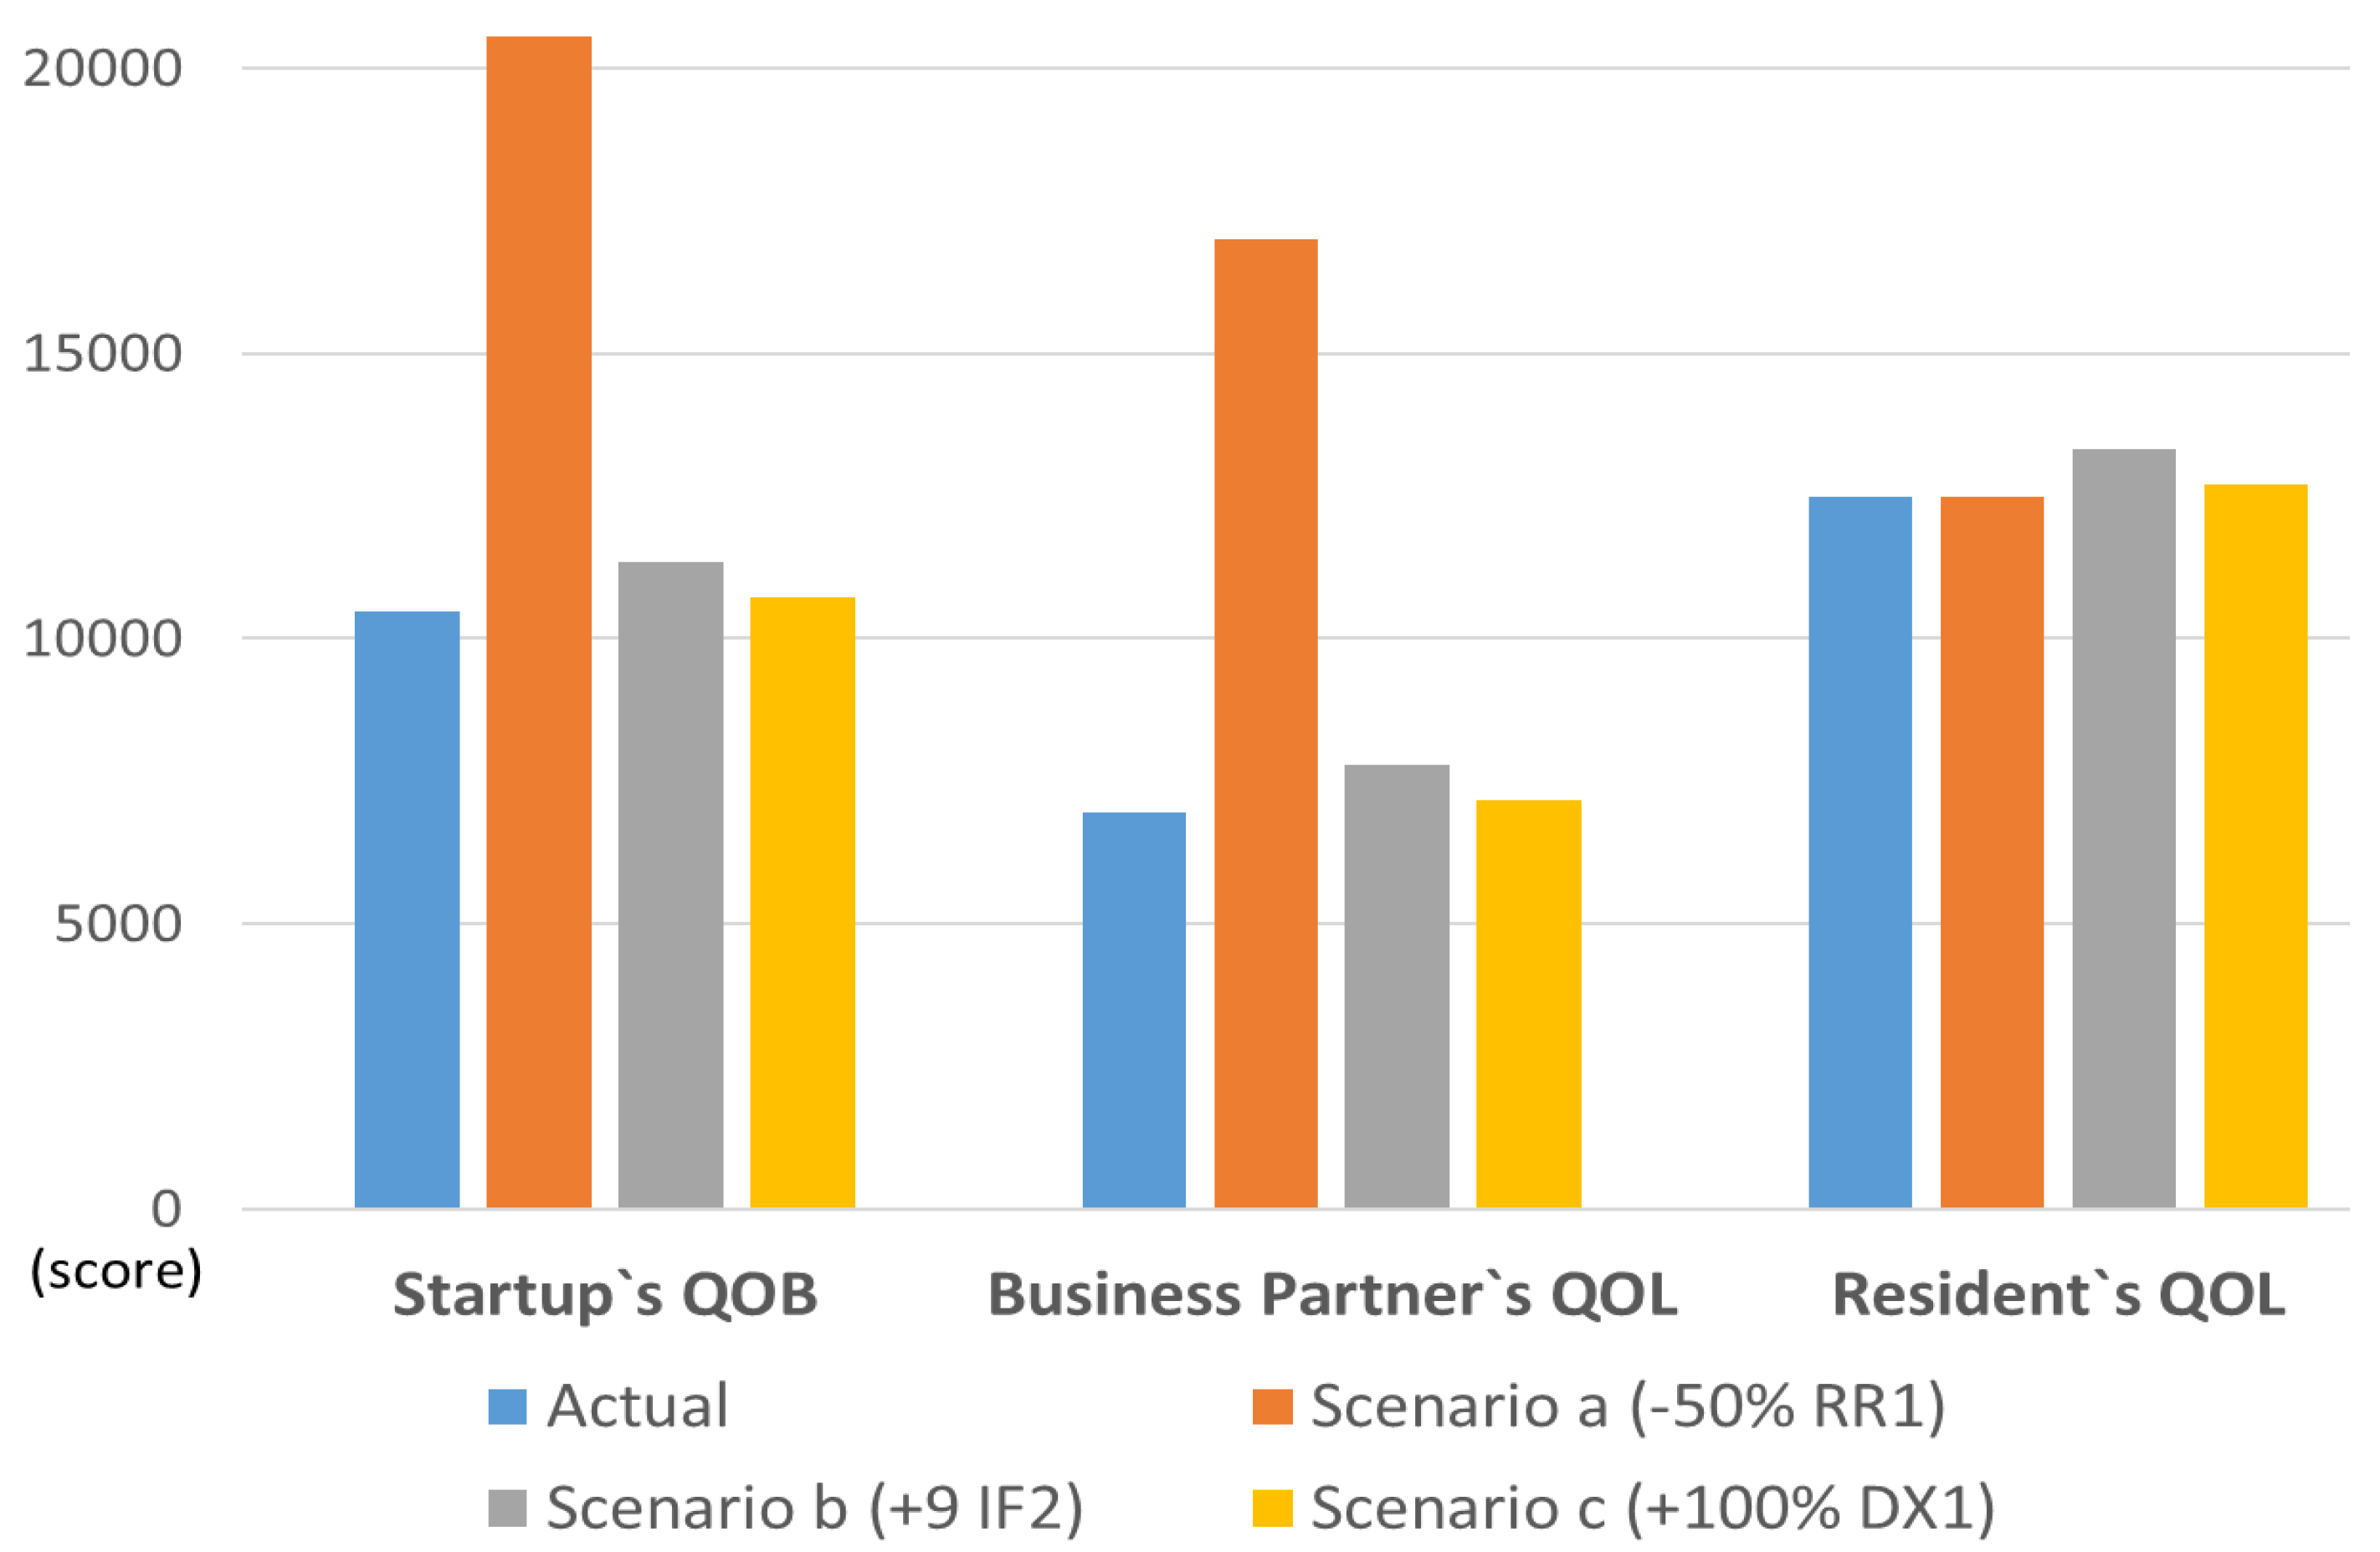
Figure 3.
Impacts of Policy Set 1 scenarios on QOL and QOB
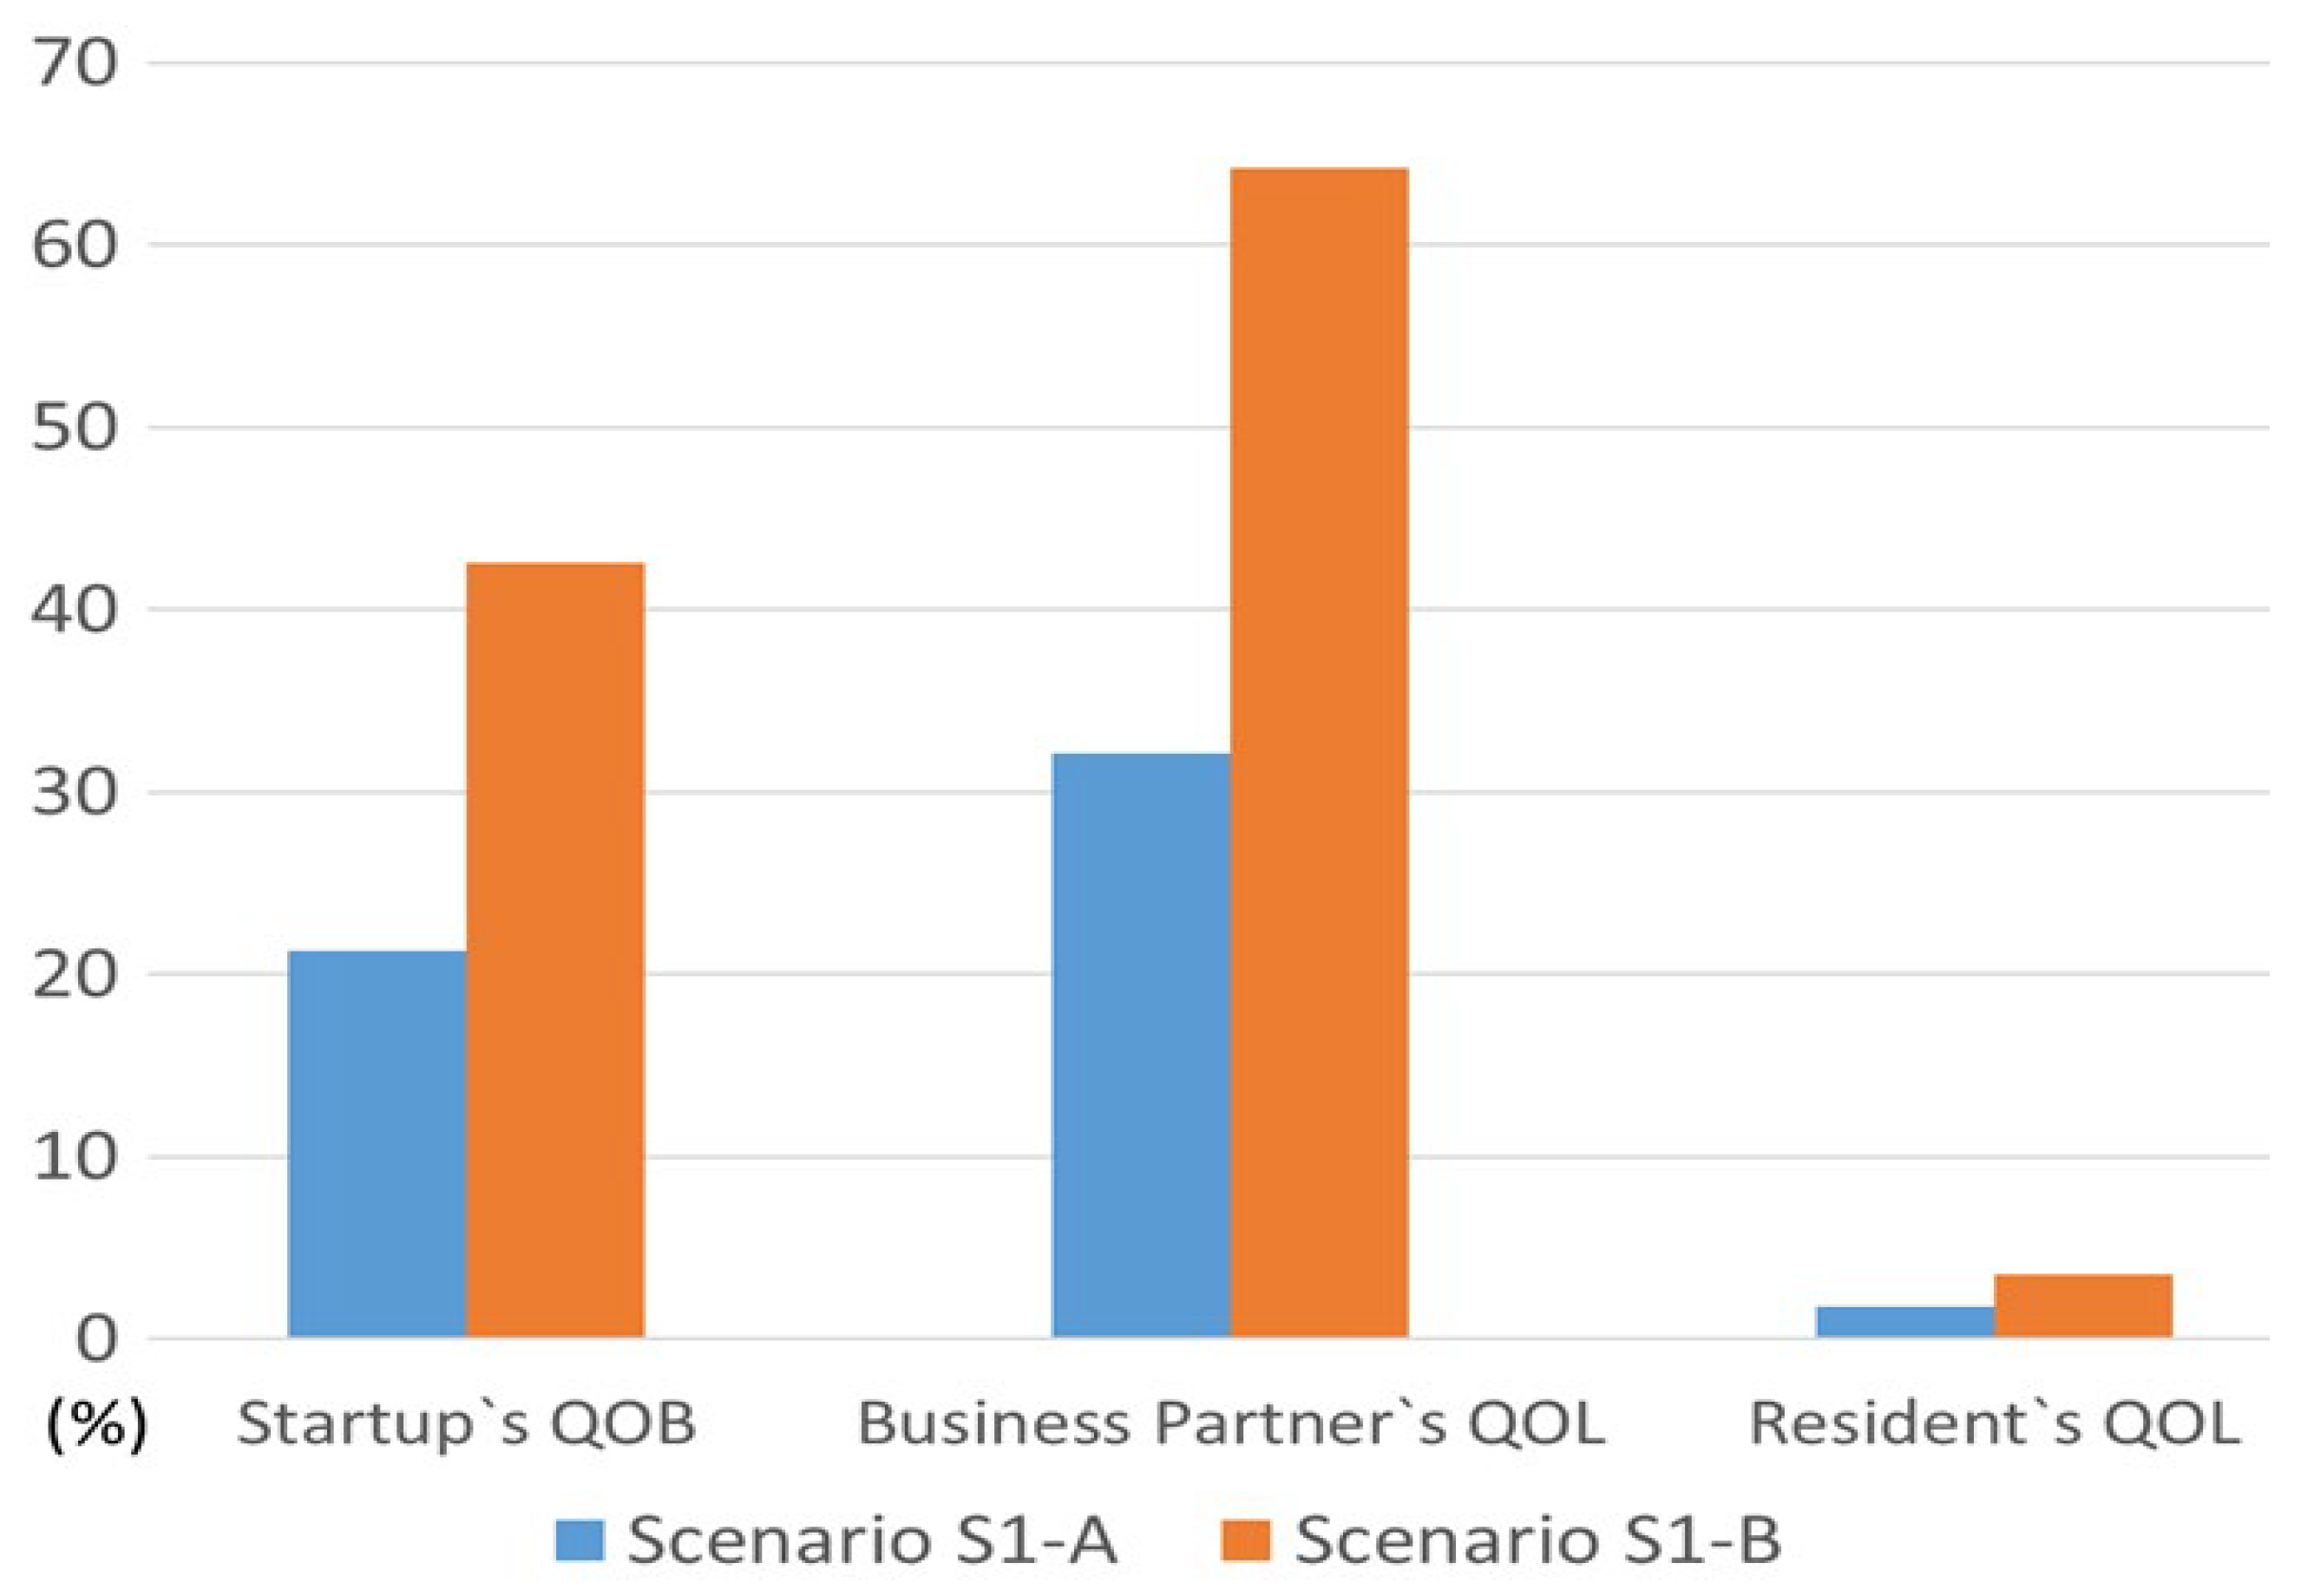
Figure 4.
Impacts of Policy Set 2 scenarios on QOL and QOB
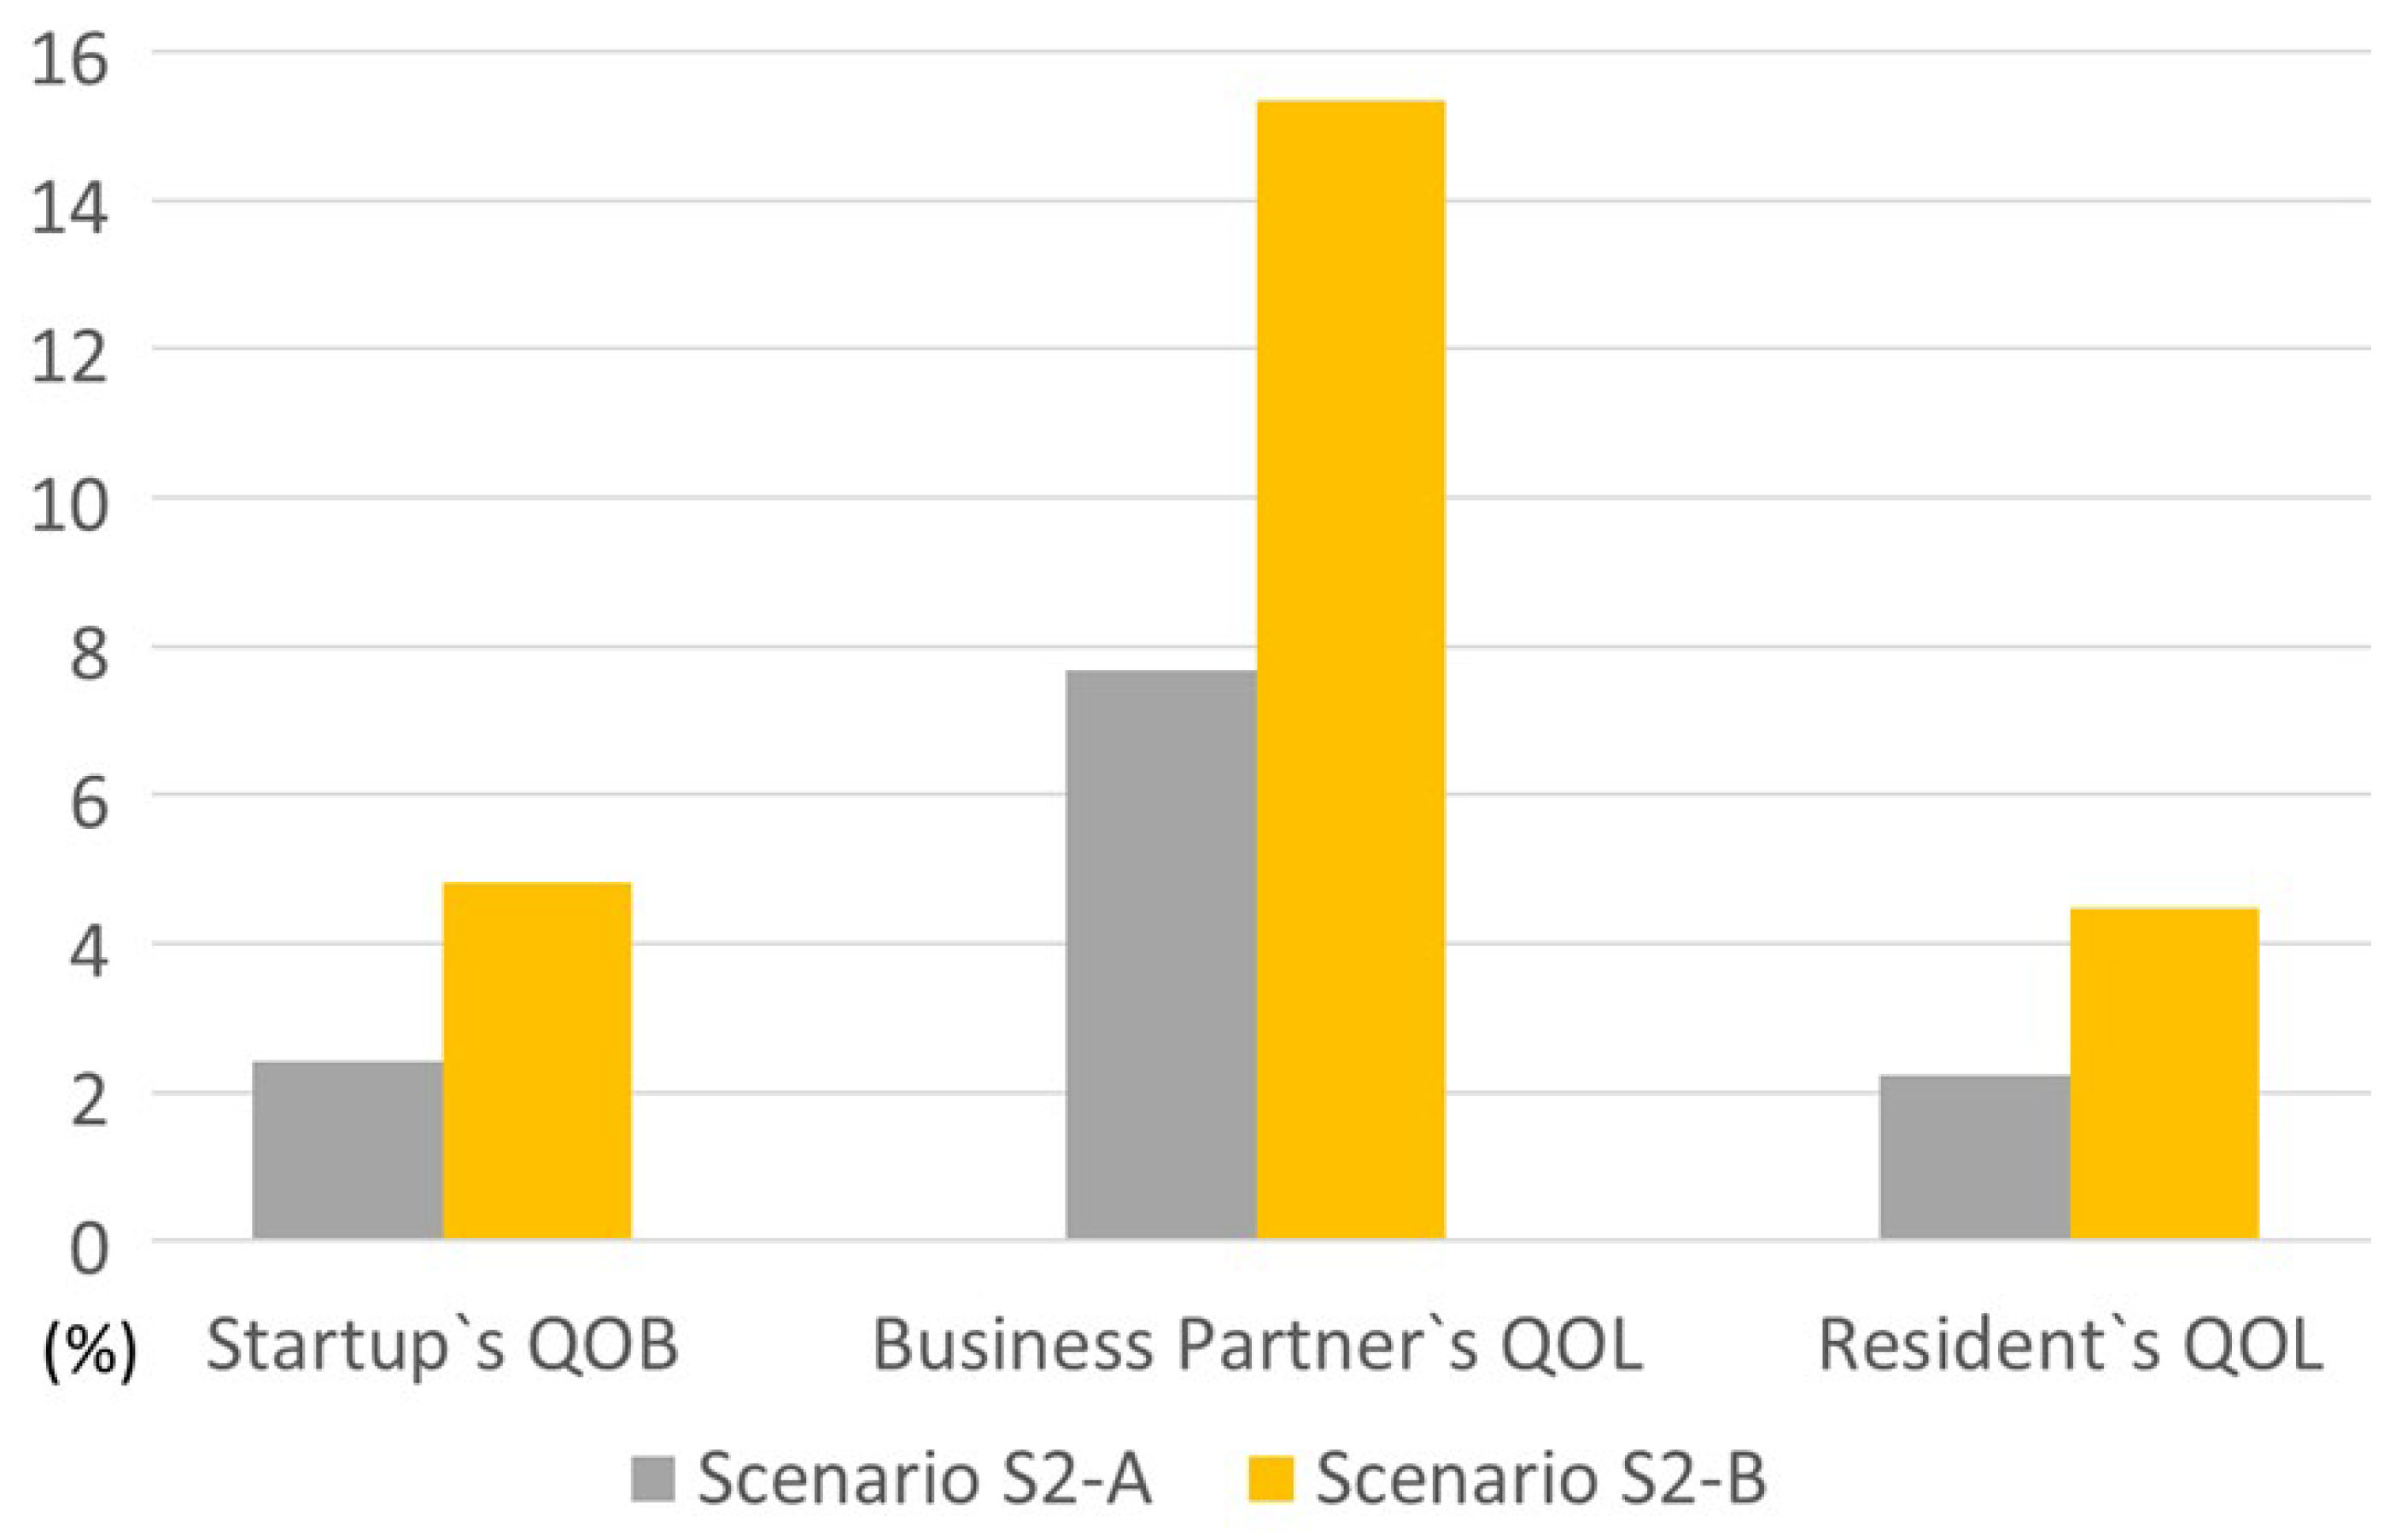
Figure 5.
QOL and QOB in Aichi, Singapore, and Munich
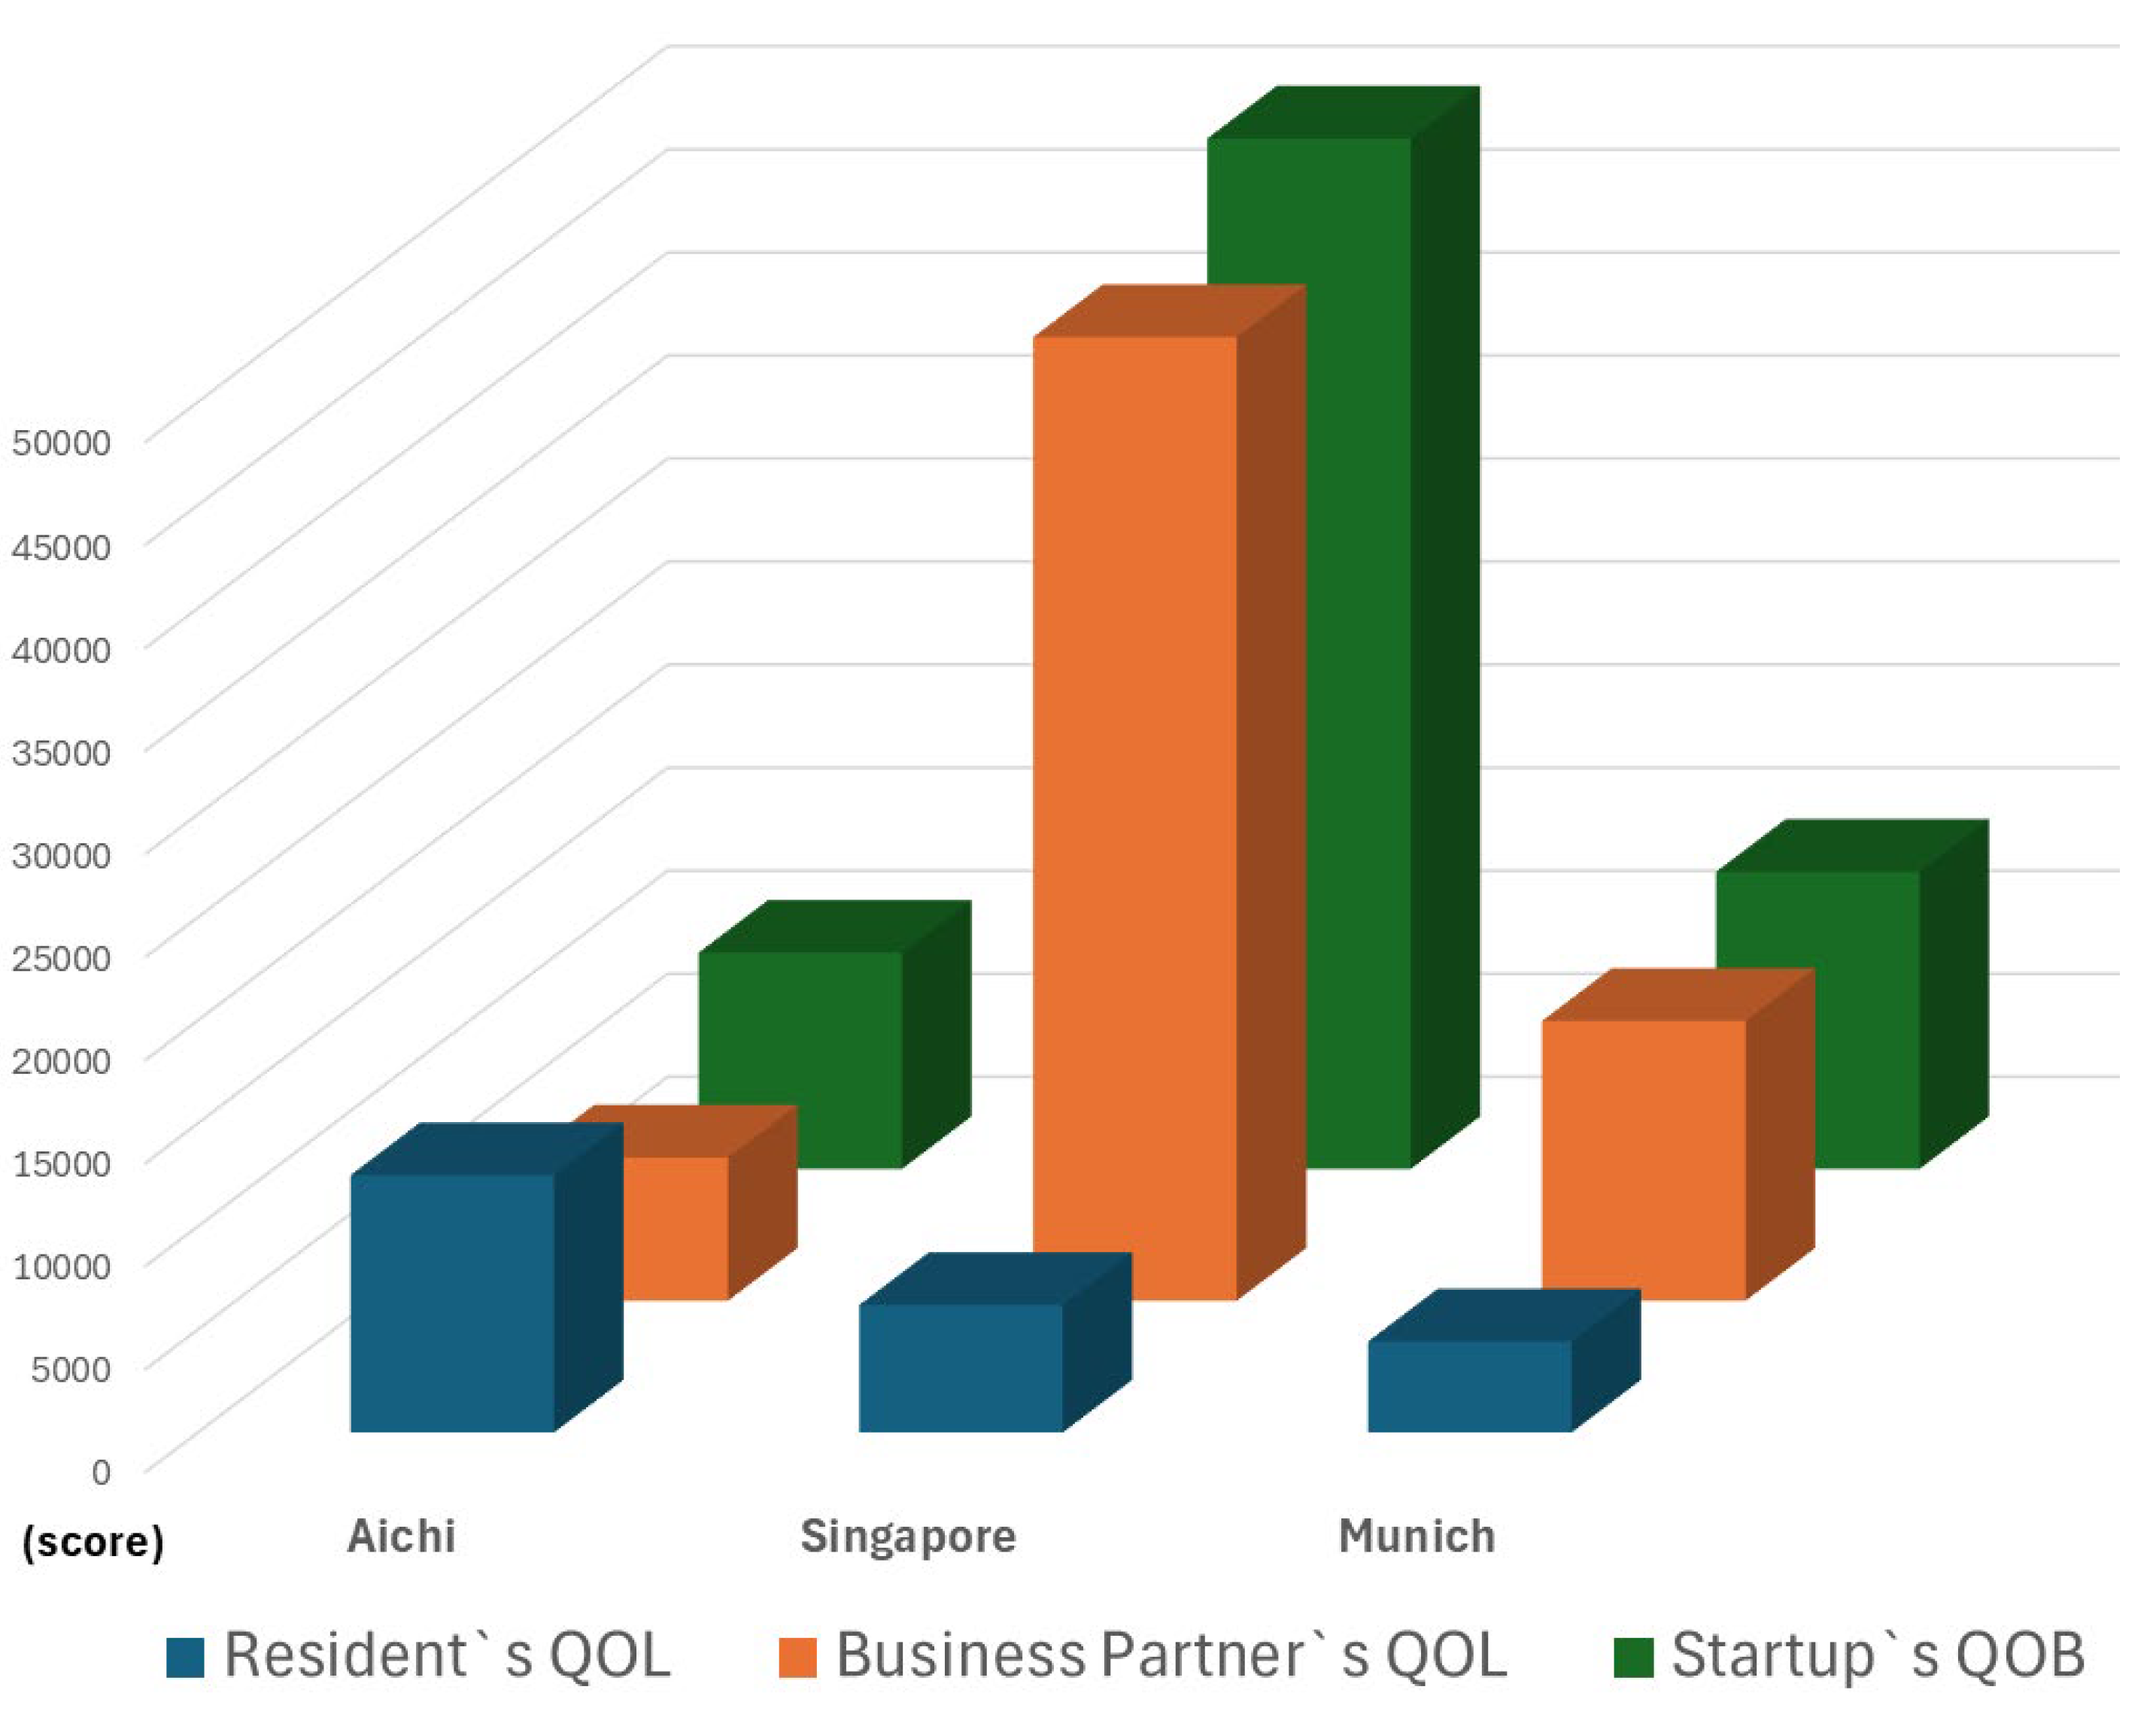

Table 1.
QOL and QOB component indicators for the startup ecosystem
| No | Components indicators | Description |
|---|---|---|
| 1 | Population (Person) | Total population within the city |
| 2 | GRP (JPY) | The Gross Regional Product (GRP) of a city is divided by its total population, indicating the average economic output per person in that city |
| 3 | Economic Growth (%) | The rate of increase in the economic output of a city or region in recent years |
| 4 | Venture per Capita (VCs) (No.) | The number of venture capital firms based in the city |
| 5 | Related Industries (No.) | Number of significant companies in fields related to your business that are based in the city |
| 6 | Startup Support Budget (JPY) | Annual startup support budgets of the city |
| 7 | Young Population (%) | Percentage of young population (15-34 years) in the city's labor force |
| 8 | Number of Major Universities (No.) | Number of major universities in the city (Universities capable of accepting joint research funds from companies, etc.) |
| 9 | English Proficiency (%) | Percentage of individuals in the city with an English proficiency index (EF EPI) score of 500 or above, indicative of the ability to participate in professional field-specific English meetings |
| 10 | High-Class Hotels (No.) | Number of 5-star class hotels in the city |
| 11 | International Conferences (No.) | Number of international conferences held per year in the city |
| 12 | World Heritage Sites (No.) | Number of World Heritage Sites accessible within about 2 hours from the city |
| 13 | Corporate Tax Rate (%) | Effective corporate tax rate in the city |
| 14 | Business Registration (days) | Minimum days required to open a new office and start a business (includes visa process if outside the country) |
| 15 | International Flights Destinations (No.) | Number of destinations served by direct international flights from the nearest airport. |
| 16 | High-Speed Rail (No.) | Number of high-speed rail stations within 2 hours, including those reachable by taking the nearest high-speed train |
| 17 | Traffic Congestion Rate (Km/h) | Average travel speeds on roads within the city |
| 18 | Internet Speed (Mbps) | Average Internet speed on mobile devices |
| 19 | Digital Administrative Services (%) | Percentage of administrative procedures, such as tax payments, bidding, permit applications, and applications for municipally sponsored training and events, that are available online |
| 20 | Digital Lifestyle Services (%) | Percentage of services available online for shopping, medical care, transportation, and other daily living services |
| 21 | Time medical Facilities (mins) | Travel time to the nearest general hospital |
| 22 | Time retail and Dining Facilities (mins) | Travel time to the nearest large retail store (>1,000 sq. m. of retail space) |
| 23 | Time to childcare facilities (mins) | Travel time to the nearest kindergarten or preschool. |
| 24 | Floor Area (sq m) | Size of living space per person in housing |
| 25 | Greenary (%) | The percentage of land covered by greenery and water in the city |
| 26 | Air quality | PM2.5 concentration in the atmosphere in the city |
| 27 | Criminal Offenses (No.) | Annual number of criminal offenses in the city (per 1,000 population) |
| 28 | Traffic Accident (No.) | Annual fatalities due to traffic accidents in the city (per 100,000 population) |
| 29 | Flood Risk (%) | The percentage of land (inhabitable land) expected to be inundated in the event of the largest possible heavy rainfall. |
| 30 | Office Rent (JPY) | Monthly office rent |
Table 2.
Component indicators and attribute levels used in conjoint analysis.
| No | Indicators | Level 1 | Level 2 | Level 3 |
|---|---|---|---|---|
| 1 | Population (Person) | 0.5 M | 2 M | 10 M |
| 2 | GRP (JPY) | JPY 5 M | JPY 10 M | – |
| 3 | Economic Growth (%) | 0% | 5% | – |
| 4 | Venture per Capita (VCs) (No.) | 100 | 200 | 300 |
| 5 | Related Industries (No.) | 200 | 1,000 | – |
| 6 | Startup Support Budget (JPY) | JPY 3 B | JPY 30 B | – |
| 7 | Young Population (%) | 20% | 30% | – |
| 8 | Number of Major Universities (No.) | 2 | 10 | – |
| 9 | English Proficiency (%) | 10% | 70% | – |
| 10 | High-Class Hotels (No.) | 1 | 60 | – |
| 11 | International Conferences (No.) | 20 | 100 | – |
| 12 | World Heritage Sites (No.) | 0 | 1 | – |
| 13 | Corporate Tax Rate (%) | 15% | 20% | 25% |
| 14 | Business Registration (days) | 1 day | 10 days | – |
| 15 | International Flights (No.) | 20 cities | 200 cities | – |
| 16 | High-Speed Rail (No.) | 20 | 40 | – |
| 17 | Traffic Congestion Rate (Km/h) | 20 km/h | 40 km/h | – |
| 18 | Internet Speed (Mbps) | 25 Mbps | 50 Mbps | 100 Mbps |
| 19 | Digital Administrative Services (%) | 20% | 80% | – |
| 20 | Digital Lifestyle Services (%) | 20% | 80% | – |
| 21 | Time medical Facilities (mins) | 5 min | 15 min | – |
| 22 | Time retail and Dining Facilities (mins) | 5 min | 15 min | – |
| 23 | Time to childcare facilities (mins) | 5 min | 15 min | – |
| 24 | Floor Area (sq m) | 25 m² | 40 m² | – |
| 25 | Greenary (%) | 5% | 40% | – |
| 26 | Air quality (μg/m³) | 10 μg/m³ | 20 μg/m³ | – |
| 27 | Criminal Offenses (cases per 1,000 persons) | 3 /1,000 | 15 /1,000 | – |
| 28 | Traffic Accident (persons per 100,000) | 3 /100,000 | 30/100,000 | – |
| 29 | Flood Risk (%) | 20% | 80% | – |
| 30 | Office Rent (JPY/tsubo/month) | JPY 5,000 | JPY 10,000 | JPY 20,000 |
Table 3.
Indicators and city data
| Category | Indicator | Unit | Aichi | Singapore | Munich | ||
|---|---|---|---|---|---|---|---|
| Rules & Regulations | Corporate Tax Rate | % | 24.86 | 17 | 33 | ||
| Startup Support Budget | B JPY | 0.2 | 8.18 | 3.54 | |||
| Crime Risk | reports/1000 | 6.670 | 12.5 | 16.15 | |||
| Intl. Flight Destinations | No. | 27 | 161 | 184 | |||
| Economic Growth Rate | % | 4.98 | 2.4 | 1.1 | |||
| Intl. Conferences Held | No. (10×) | 8 | 8 | 8 | |||
| Air Quality PM2.5 | µg/m³ | 15 | 19 | 12 | |||
| Traffic Accident Risk | deaths/100000 | 3.99 | 2.35 | 0.56 | |||
| Infrastructures | Office Rents | 1k JPY/tsubo | 13.45 | 4.79 | 20.6 | ||
| High-Speed Rail Stations | No. | ✓ | 21 | 0 | 7 | ||
| Major Universities | No. | ✓ | ✓ | 53 | 34 | 22 | |
| Flood Risk | % | 20 | 30 | 15 | |||
| English Proficiency | % | 11 | 74 | 50 | |||
| City Population (100 P) | 100 people | 74800 | 60000 | 15900 | |||
| Young Population | % | 23.7 | 30 | 33 | |||
| Time to Childcare Facilities | min | ✓ | 14 | 14 | 14 | ||
| High-Class Hotels | No. | ✓ | 17 | 70 | 14 | ||
| Time to Shopping Facilities | min | ✓ | ✓ | 8.41 | 7 | 10 | |
| Road Congestion (speed) | km/h | 30.1 | 28.9 | 20 | |||
| DX Technology | Internet Speed | Mbps | 55.99 | 372 | 130 | ||
| Online Admin Services | % | ✓ | 30.5 | 70 | 54 | ||
| Online Living Services | % | ✓ | 52.6 | 82 | 80 |
Table 4.
Mapping of policy sets to ASC policy categories
| Policy Set | Indicators | Policy Category | Role in ASC |
|---|---|---|---|
| Set 1: Foundational Competitiveness Policies | Corporate tax rate | Rules & Regulations | Directly reduces startup business costs and improves regulatory attractiveness. |
| High-speed rail stations (within 2 h) | Infrastructure | Enhances domestic and interregional accessibility for firms, employees, and residents | |
| Online administrative services coverage | DX Technologies | Improves administrative efficiency and reduces transaction costs | |
| Set 2: Global Orientation and Attractiveness Policies | International conferences | Rules & Regulations | Strengthens international business interaction and global visibility |
| International flight destinations | Rules & Regulations | Expands global connectivity through airport functions | |
| Air quality (PM2.5) | Rules & Regulations | Enhances environmental quality for businesses and individuals |
Table 4.
Parameter estimation results
| No | Indicators | β | z | p | M. value (JPY) |
|---|---|---|---|---|---|
| 1 | Population (100 Persons) | 0.079 | 2.547 | 0.011 | 2,319 |
| 2 | GRP (JPY) | – | – | – | – |
| 3 | Economic Growth (%) | 0.142 | 3.25 | 0.001 | 4,182 |
| 4 | Venture per Capita (VCs) (No./10 firms) | - | - | - | - |
| 5 | Related Industries (No.) | - | - | - | - |
| 6 | Startup Support Budget (JPY) | 0.041 | 4.601 | 0.000 | 1,200 |
| 7 | Young Population (%) | 0.061 | 2.695 | 0.007 | 1,806 |
| 8 | Number of Major Universities (No.) | 0.022 | 3.668 | 0.000 | 637 |
| 9 | English Proficiency (%) | 0.018 | 3.085 | 0.002 | 544 |
| 10 | High-Class Hotels (No.) | 0.007 | 2.532 | 0.011 | 212 |
| 11 | International Conferences (No.) | 0.085 | 3.118 | 0.002 | 2,521 |
| 12 | World Heritage Sites (No.) | – | – | – | – |
| 13 | Corporate Tax Rate (%) | −0.275 | −6.193 | 0.000 | 8,095 |
| 14 | Business Registration (days) | – | – | – | – |
| 15 | International Flights (No.) | 0.012 | 4.436 | 0.000 | 347 |
| 16 | High-Speed Rail (No.) | 0.065 | 3.982 | 0.000 | 1,931 |
| 17 | Traffic Congestion Rate (Km/h) | 0.034 | 2.432 | 0.015 | 1,012 |
| 18 | Internet Speed (Mbps) | 0.022 | 3.878 | 0.000 | 637 |
| 19 | Digital Administrative Services (%) | 0.015 | 3.39 | 0.001 | 455 |
| 20 | Digital Lifestyle Services (%) | 0.014 | 3.272 | 0.001 | 416 |
| 21 | Time medical Facilities (mins) | – | – | – | – |
| 22 | Time retail and Dining Facilities (mins) | −0.055 | −2.486 | 0.013 | 1,616 |
| 23 | Time to childcare facilities (mins) | −0.055 | −2.486 | 0.013 | 1,616 |
| 24 | Floor Area (sq m) | – | – | – | – |
| 25 | Greenary (%) | – | – | – | – |
| 26 | Air quality (μg/m³) | −0.063 | −2.970 | 0.003 | 1,868 |
| 27 | Criminal Offenses (cases per 1,000 persons) | −0.112 | −4.723 | 0.000 | 3,291 |
| 28 | Traffic Accident (persons per 100,000) | −0.028 | −2.742 | 0.006 | 819 |
| 29 | Flood Risk (%) | −0.017 | −3.411 | 0.001 | 488 |
| 30 | Office Rent (JPY) | −0.034 | −4.745 | 0.000 | 1,000 |
Table 5.
Startup`s QOB estimation results
| Category | Indicator (unit) | (JPY) | |||
|---|---|---|---|---|---|
| Rules & Regulations | RR1: Corporate Tax Rate (%) | 8097 | 0.014 | - | 113 |
| RR2: Startup Support Budget (B JPY) | 1196 | 0.629 | - | 753 | |
| RR3: Intl. Flight Destinations (No.) | 346 | 0.038 | - | 13 | |
| RR3: Economic Growth Rate (%) | 4176 | 0.996 | - | 4159 | |
| RR4: Intl. Conferences Held No. x10) | 2483 | 0.75 | - | 1862 | |
| Infrastructures | IF1: Office Rents (1000 JPY/tsubo) | 1000 | 0.436 | - | 436 |
| IF2: High-Speed Rail Stations (No.) | 1926 | 0.05 | 0.03 | 93 | |
| IF3: Major Universities (No.) | 635 | 0.879 | 0.03 | 541 | |
| IF4: English Proficiency (%) | 542 | 0.016 | - | 9 | |
| IF5: City Population (100 P) | 2324 | 0.734 | - | 1707 | |
| IF6: Young Population (%) | 1801 | 0.37 | - | 666 | |
| IF7: High-Class Hotels (No.) | 214 | 0.271 | 0.03 | 56 | |
| DX Technology | DX1: Online Admin Services (%) | 454 | 0.175 | 0.017 | 78 |
| Startup`s QOB | 10489 | ||||
Table 6.
Business Partner`s QOL estimation results
| Category | Indicator (unit) | (JPY) | |||
|---|---|---|---|---|---|
| Rules and Regulations | RR1: Corporate Tax Rate (%) | 8097 | 0.014 | - | 113 |
| RR2: Startup Support Budget (B JPY) | 1196 | 0.629 | - | 753 | |
| RR3: Intl. Flight Destinations (No.) | 346 | 0.038 | - | 13 | |
| RR4: Intl. Conferences Held No. x10) | 2483 | 0.75 | - | 1862 | |
| RR5: Air Quality PM2.5 (µg/m³) | 1863 | 0.50 | - | 931 | |
| RR6: Traffic Accident Risk (deaths/100,000) | 817 | 0.96 | - | 787 | |
| Infrastructure | IF1: High-Speed Rail Stations (No.) | 1926 | 0.05 | 0.033 | 93 |
| IF2: Major Universities (No.) | 635 | 0.879 | 0.03 | 541 | |
| IF3: English Proficiency (%) | 542 | 0.016 | - | 9 | |
| IF4: City Population (100 P) | 2324 | 0.734 | - | 1707 | |
| IF5: High-Class Hotels (No.) | 214 | 0.271 | 0.033 | 56 | |
| DX Technology | DX1: Online Admin Services (%) | 454 | 0.175 | 0.017 | 78 |
| Business Partner`s QOB | 6967 | ||||
Table 7.
Residents' QOL estimation result
| Category | Indicator | (JPY) | |||
|---|---|---|---|---|---|
| Rules and Regulations | RR1: Crime Risk | 3282 | 0.694 | - | 2278 |
| RR2: Economic Growth Rate | 4176 | 0.996 | - | 4159 | |
| RR3: Air Quality PM2.5 | 1863 | 0.5 | - | 931 | |
| RR4: Traffic Accident Risk | 817 | 0.963 | - | 787 | |
| Infrastructures | IF1: High-Speed Rail Stations | 1926 | 0.05 | 0.033 | 93 |
| IF2: Major Universities | 635 | 0.87 | 0.030 | 541 | |
| IF3: Flood Risk | 486 | 1 | - | 486 | |
| IF4: City Population (100 P) | 2324 | 0.734 | - | 1707 | |
| IF5: Time to Childcare Facilities | 1618 | 0.1 | 0.033 | 156 | |
| IF6: Time to Shopping Facilities | 1618 | 0.659 | 0.021 | 1043 | |
| DX Technologies | DX1: Online Admin Services | 454 | 0.175 | 0.017 | 78 |
| DX2: Online Living Services | 415 | 0.543 | 0.017 | 221 | |
| Resident`s QOL | 12483 | ||||
Disclaimer/Publisher’s Note: The statements, opinions and data contained in all publications are solely those of the individual author(s) and contributor(s) and not of MDPI and/or the editor(s). MDPI and/or the editor(s) disclaim responsibility for any injury to people or property resulting from any ideas, methods, instructions or products referred to in the content. |
© 2026 by the authors. Licensee MDPI, Basel, Switzerland. This article is an open access article distributed under the terms and conditions of the Creative Commons Attribution (CC BY) license (http://creativecommons.org/licenses/by/4.0/).
Copyright: This open access article is published under a Creative Commons CC BY 4.0 license, which permit the free download, distribution, and reuse, provided that the author and preprint are cited in any reuse.


