Submitted:
20 February 2026
Posted:
25 February 2026
You are already at the latest version
Abstract
Electron collision broadening parameters calculations were performed for 33 singly ionized yttrium spectral lines, 27 with special relevance in astrophysical applications (can be found in the Atmospheres of FGK Stars). Calculations were made in the semi-empirical Griem approach using the Gaunt factors proposed by Van Regemorter and those proposed by Douglas H. Sampson. Furthermore, to test our calculations, the electron collision broadening of 4 well isolated spectral lines of Y II was experimentally measured in laser- induced breakdown experiments using a Q-switched Nd:YAG laser focused on Pb-Y alloy samples.
Keywords:
atomic data
; atomic processes
; Stark broadening
1. Introduction
Yttrium is a metallic chemical element that belongs to the group of rare earth elements. Currently, it plays an important role in a broad range of scientific (Astrophisics and atomic physics), technological, and industrial applications. Investigating the spectral lines of Yttrium, the atomic number 39 element, and its relative abundances compared to other elements is fundamental to deepening the knowledge, history, and classification of stars, because Yttrium is a neutron capture element and its study helps to understand the processes of nucleosynthesis in the early epochs of the galaxy (early universe) and its temporal evolution [1,2,3].
Furthermore, the Stark broadening of lines originating from energy levels with high principal quantum numbers of Y II may be important for the analysis of some lines in the atmospheres of cooler stars [4,5] .
In optoelectronics, yttrium compounds are widely used as luminescent materials in display technologies and solid-state lighting devices. Yttrium is a key constituent of high-temperature superconductors, such as yttrium barium copper oxide, which is employed in the development of electrical power transmission systems, superconducting magnets, and high-sensitivity detection technologies. Yttrium oxide (Y2O3) is used in the production of advanced refractory ceramics exhibiting high thermal, chemical, and mechanical stability, allowing operation under extreme conditions in industrial furnaces. In medicine, yttrium is applied in oncological treatments, particularly in selective internal radiotherapy procedures.
Yttrium aluminum garnet (YAG) is a fundamental material in industrial laser applications. Neodymium-doped YAG lasers are among the most widely used solid-state laser systems.
For all these reasons, there are several experimental and theoretical works on Y II in the literature, mainly in the field of transition probabilities and lifetimes [5,6,7,8]. However, there is insufficient data on the electron collision broadening parameters of its spectral lines. In their 1996 article, Popovic et al. discussed this need to provide electron collider broadening data for Y II spectral lines, but they only provided calculations for 6 multiplets [5]. Unfortunately, this is all that is available in the literature. Consequently, further experimental benchmarks are required to assess the reliability of existing semi-empirical approaches. The present work aims to address this gap by providing new experimental measurements and complementary theoretical calculations of Stark broadening parameters for a selected set of Y II spectral lines
The 33 lines analyzed in this work were chosen due to their presence in the atmospheres of FGK stars [3].
2. Materials and Methods
2.1. Experimental Setup
Different fluoride–lead-diluted yttrium glass samples were prepared in our laboratory. The mixtures were heated at 700 °C in a ceramic crucible in an air atmosphere for 12 h. The glass sample was not prepared with silica as a result of probable UV radiation absorption of silicate.
The fundamental wavelength (1.06 m) of a Q-switched Nd:YAG laser (Quanta-Ray PRO-350 de Spectra-Physics) was focused on these samples in several laser-induced breakdown (LIB) experiments to obtain several spectral lines of singly ionized yttrium (including the 3327.876 Å, 3361.98 Å, 3496.079 Å and 3549.005 Å spectral lines), neutral and single ionized lead, and the H line. The energy per pulse (10 ns width) was measured at the target surface and was found to be 2.5 J. To avoid self-absorption of the yttrium spectral lines, the yttrium content in the samples was approximately 0.02%
A picture of the experimental setup is shown in Figure 1a and is analogous to the one used by these authors in a recent work [9].
A simple lens (f = 20 cm, biconvex) focuses the laser light on the sample. There is also a vessel with water supply system via hose connection, which provides a confined environment in permanent circulation (used only in LSP experiments) and a programmable 3D positioning system; the sample is over it, which allows us to control the distances between the lens and the sample and thus the spot size. The emission spectra were acquired using a spectrograph (Horiba Jobin Ybon FHR1000) equipped with a CCD camera (Andor, model iStar 334T). The CCD of this camera is bidimensional, 1024 × 1024 pixels (26 × 26 m2 size per pixel), which allowed us to study the plasma spatially. The camera was time-controlled in both gate and delay with a maximum resolution of 100 ns. The spectrometer is equipped with a diffraction grating of 1800 groves/mm and covers a wavelength region of 200 to 700 nm. The emitted light was transferred to the spectrograph through a 0.5 mm diameter quartz fiber cable.
The data were taken by placing the optical fiber in the direction normal to the plasma emission and at a distance of 2 mm from the target surface (where the best signal-to-noise ratio was found). The spectra obtained were stored on a computer for further analysis.
Examples of the obtained spectra are shown in Figure 2. We have used the numerical facilities of the Microcal Origin program itself, where we analyze the spectral lines. This program fits a Voigt profile with four free parameters: the baseline position, the spectral line position, the Gaussian width, and the Lorentzian width. In the figure, the red line is the adjusted Voigt profile.
2.2. Electron Densities Measurement
The determination of the electron density was made by fitting a Voigt profile to the experimental H line emission. In Figure 1b, we display a sample of the H line (the red line is the adjusted Voigt profile).
This profile was analyzed two times: first using plasma diagnostic tables using the Lyman and Balmer hydrogen lines [10]. The second using the following expression (Section 2.2) [11] was used to obtain the electron number density, Ne, from the width of the H alpha line. This is a semi-empirical equation perfectly described in the bibliography.
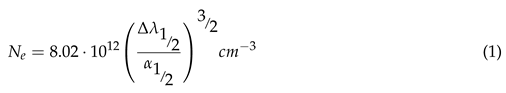
where is the FWHM (Full Width at Half Maximum) of the line in Å, and is half the width of the reduced Stark profiles in Å, and their precise values can be found in Kepple and Griem [12]. A value between 5000 and 10 000 K was used (values compatible with the redshift of the line H) to choose the value from the table included in the paper mentioned above.
The electron density obtained for both procedures in our experiments for a delay from the laser pulse of 5 s was compatible with a value of (0.78 ± 0.20)·1017 cm−3. This result is identical, within experimental limits, to that obtained in our previous work [13] since the experimental conditions are identical except for the small traces of yttrium added that replace the small traces of scandium
2.3. Temperature Measurement
As in our previous work on Ti II [14], plasma temperatures at the different time windows were determinated from Boltzmann plots using several Pb I lines (see Figure 3) with upper level energies in the range 4.4–6.1 eV and well-known transition probabilities [15]. The resulting temperature before a self-absorption correction at 5.0 s was (13 800 ± 1 500) K.
To minimize the influence of self-absorption effects, corrections were applied following established procedures [16]. In this procedure, we used our experimental lorentzian FWHM for the spectral lines and the experimental Stark broadening parameters of [17]. The resulting temperature after a self-absorption correction at 5.0 s was (8 900 ± 1 500) K. As expected, the temperature obtained was identical within experimental limits to that of our previous work mentioned above [9,14]. In addition, this temperature was compatible with the shift of the H line planned by Griem [11] and used for us in [18].
3. Theoretical Calculations
In the same way as in our previous studies the Stark broadening parameters were calculated using the Equations (Section 3) and (Section 3) of semi-empirical Griem approximation [19] where Griem incorporated Baranger’s work [20]. The Stark line width (HWHM), se, and shift, d, in angular frequency units, were determined using these equations. Initially, the effective Gaunt factors by [21] and van Regemorter [22], denoted as and , were used.
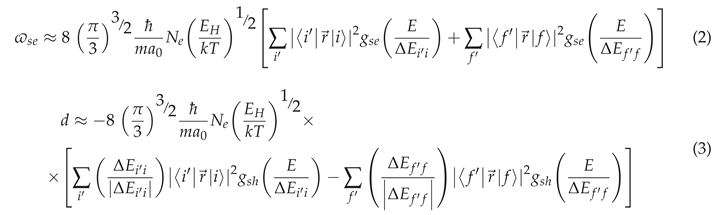
Additionally, EH and E=3/2 kT represented the hydrogen ionization energy and the perturbing electron energy, respectively, with k as the Boltzmann constant. The free electron density and electron temperature were denoted as Ne and T. The transitions’ initial and final levels were labeled as i and f with i’ and f’ representing the levels of Sc II with optical transitions corresponding to i and f. The energy differences between levels i’ and i and levels f’ and f were denoted and , respectively. The expressions of the type are the square of matrix elements of the optical transitions.
To facilitate the spectroscopic use of our results, conversion of the angular frequency obtained in Griem’s expressions into units of wavelength was essential. This conversion was achieved using the equation = /. In this equation, represents the Stark broadening (full width at half maximum, FWHM), denotes the wavelength, and c represents the speed of light.
Cowan’s code [23] was used to obtain the matrix elements required for Equations (Section 3) and (Section 3). In this way, we have used in our calculations 19 configurations of even parity namely, 5s2, 5s6s, 5s7s, 5s8s, 6s2, 5s4d, 5s5d, 5s6d, 5p2, 4d2, 4d6s, 4d7s, 4d8s, 4d9s, 4d5d, 4d6d, 4d7d, 4d8d, 4d5g and 11 configurations of odd parity namely, 5s5p, 5s6p, 5s4f, 5s5f, 4d5p, 4d6p, 4d7p, 4d4f, 4d5f, 4d6f and 4d7f.
To adjust our calculations, we used a previously cited work by A. E. Nilsson, S. Johansson, and R. L. Kurucz (Nilsson, 1991). This paper we used to obtain the experimental levels to which we could fit our theoretical levels. Following Cowan’s recommendations, to get a good set of matrix elements, we have not forced the fits more than 1 % (As is well known a more precise fit is almost always achieved at the cost of worsening the fit of the transition probabilities (or, in other words, of the matrix elements).
Two sets of calculations were performed: using Regemorter’s Gaunt factors and using for the calculation of Gaunt factors the expression (4) and the tables provided by [24].
where Ii is the ionization energy for level i and the values of Hi, ri and Ai were tabulated by Sampson and Zhang.
Information about Y II spectral lines analyzed in our calculations can be seen in Table 1.
4. Discussion
The theoretical values of the Stark line widths and line shifts, (Å) and d(Å),normalized to an electron density of 1017 cm−3 (calculated using both Gaunt factors: van Regemorter and Sampson) are displayed in Table 2. The temperatures used in our calculations can be seen in the third column of the table. Calculations for temperatures other than those shown can be provided upon request.
Our experimental measurements of the Stark broadening of four of these spectral lines are shown in the penultimate column. In the last column, we present the scan Popović calculations [25] in the modified semi empirical approach. The raw comparison of both theoretical values has problems because, as can be seen in the cited reference, in Popović’s calculations only multiplets have been calculated. By a simple inspection it can be seen that our theoretical values agree well, within the margins suggested by Griem, with our experimental results.
As in our previous articles [13,14], the calculations with the Gaunt factors of Regemorter differ from the values calculated with Sampson’s Gaunt factors by a factor between 5 and 7. The calculations performed with the expression proposed by Sampson and Zhang are very close to the experimental values, as can be seen in Figure 4.
As an example, in Figure 4 we present the calculated Stark width (FWHM) , (Å),normalized to Ne= 1017 cm−3 vs temperature for the 3327.876 Åof single ionized Yttrium.
5. Conclusions
In this work, we performed Stark broadening measurements of 4 spectral lines of single-ionized yttrium and one spectral line of neutral scandium. These 4 experimental values are new in the bibliography. In addition, we have calculated the Stark broadening parameters, using the procedure suggested by Sampson to obtain the Gaunt factors, for 33 Y II spectral lines. In this way, we have obtained results close (around a factor of 1.5) to the experimental values of these 4spectral lines.They have allowed us to assume that the calculations performed for 33 lines ranging between 3242.27 Å and 7881.88 Å are accurate using the Gaunt factors proposed by Sampson.
We are preparing a similar study of Th II. We are also preparing a study on the effect of traces of different elements (V, Ti, Sc, Y and Th) on the behavior of laser-generated plasmas on Pb samples.
Author Contributions
All authors contributed equally to this work All authors have read and agreed to the published version of the manuscript.
Funding
This research received no external funding.
Acknowledgments
Work partly supported by MINECO (Spain; Grants MAT2015–63974-C4–2-R and PID2019– 104351GB-C21.
Conflicts of Interest
The authors declare no conflicts of interest.
References
- Sneden, C.; Gallino, J.J.C.R. Neutron-capture elements in the early galaxy. Annual Review of Astronomy and Astrophysics 2008, 46, 48. [Google Scholar] [CrossRef]
- Karakas, A.I.; Lugaro, M. STELLAR YIELDS FROM METAL-RICH ASYMPTOTIC GIANT BRANCH MODELS. The Astrophysical Journal 2016, 825, 26. [Google Scholar] [CrossRef]
- Alexeeva, S.; Wang, Y.; Zhao, G.; Wang, F.; Wu, Y.; Wang, J.; Yan, H.; Shi, J. NLTE Analysis of Y i and Y ii in the Atmospheres of FGK Stars. The Astrophysical Journal 2023, 957, 10. [Google Scholar] [CrossRef]
- Vince, I.; Dimitrijević, M.S.; Kršljanin, V. Pressure Broadening and Solar Limb Effect. In Progress in Stellar Spectral Line Formation Theory; Beckman, J.E., Crivellari, L., Eds.; Springer Netherlands: Dordrecht, 1985; pp. 373–380. [Google Scholar] [CrossRef]
- Popović, L. Č..; Dimitrijević, M. S. Stark widths for astrophysically important ns-np transitions in Sc II, Y II and Zr II spectra. Astron. Astrophys. Suppl. Ser. 1996, 120, 373–374. [Google Scholar] [CrossRef]
- Hannaford, P.; Lowe, R.M.; Grevesse, N.; Biemont, E.; Whaling, W. Oscillator strengths for Y I and Y II and the solar abundance of yttrium. apj 1982, 261, 736–746. [Google Scholar] [CrossRef]
- Nilsson, A. E; Kurucz, S.J.R.L. The spectrum of singly ionized yttrium, Y II. Physica Scripta 1991, 44, 226. [Google Scholar] [CrossRef]
- Biemont, E.; Blagoev, K.; Engström, L.; Hartman, H.; Lundberg, H.; Malcheva, G.; Nilsson, H.; Whitehead, R.B.; Palmeri, P.; Quinet, P. Lifetime measurements and calculations in Y+ and Y2+ ions. Monthly Notices of the Royal Astronomical Society 2011, 414, 3350–3359. Available online: https://academic.oup.com/mnras/article-pdf/414/4/3350/18710615/mnras0414-3350.pdf. [CrossRef]
- de Andrés-García, I.; Isidoro-García, L.; Fernández, F.; Porro, J.; Colón, C. Influence of Gaunt factors on the calculation of the Stark broadening parameters for 56 spectral lines of Vii with high industrial and astrophysical interest. Monthly Notices of the Royal Astronomical Society 2023, 523, 2146–2157. [Google Scholar] [CrossRef]
- Gigosos, M.; Cardeñoso-Payo, V. New plasma diagnosis tables of hydrogen Stark broadening including ion dynamics. Journal of Physics B: Atomic, Molecular and Optical Physics 1999, 29, 4795. [Google Scholar] [CrossRef]
- Ashkenazy, J.; Kipper, R.; Caner, M. Spectroscopic measurements of electron density of capillary plasma based on Stark broadening of hydrogen lines. Phys. Rev. A 1991, 43, 5568–5574. [Google Scholar] [CrossRef]
- Kepple, P.; Griem, H.R. Improved Stark Profile Calculations for the Hydrogen Lines Hα, Hβ, Hγ, and Hδ. Phys. Rev. 1968, 173, 317–325. [Google Scholar] [CrossRef]
- Isidoro-García, L.; de Andrés-García, I.; Porro, J.; Fernández, F.; Colón, C. Theoretical and experimental electron collisions broadening parameters for several Sc II spectral lines of industrial and astrophysical interest. Journal of Quantitative Spectroscopy and Radiative Transfer 2025, 346, 109587. [Google Scholar] [CrossRef]
- Isidoro-García, L.; de Andrés-García, I.; Porro, J.; Fernández, F.; Colón, C. Experimental and Theoretical Electron Collision Broadening Parameters for Several Ti II Spectral Lines of Industrial and Astrophysical Interest. Atoms 2024, 12. [Google Scholar] [CrossRef]
- Kramida, A.; Ralchenco, Y.; Reader, J. NIST ASD Team (2013) NIST Atomic Spectra Database (v.5.3). 2013. Available online: http://physics.nist.gov/asd.
- El Sherbini, A.; El Sherbini, T.; Hegazy, H.; Cristoforetti, G.; Legnaioli, S.; Palleschi, V.; Pardini, L.; Salvetti, A.; Tognoni, E. Evaluation of self-absorption coefficients of aluminum emission lines in laser-induced breakdown spectroscopy measurements. Spectrochimica Acta Part B: Atomic Spectroscopy 2005, 60, 1573–1579. [Google Scholar] [CrossRef]
- Alonso-Medina, A. Experimental determination of the Stark widths of Pb I spectral lines in a laser-induced plasma. Spectrochimica Acta Part B: Atomic Spectroscopy 2008, 63, 598–602. [Google Scholar] [CrossRef]
- Colón, C.; de Andrés-García, M.I.; Moreno-Díaz, C.; Alonso-Medina, A.; Porro, J.A.; Angulo, I.; Ocaña, J.L. Experimental Determination of Electronic Density and Temperature in Water-Confined Plasmas Generated by Laser Shock Processing. Metals 2019, 9. [Google Scholar] [CrossRef]
- Griem, H.T. Semiempirical formulas for the Electron-Impact widths and shifts of isolated ion lines in plasmas. Physical Review 1968, 165, 258–266. [Google Scholar] [CrossRef]
- Baranger, M. General Impact Theory of Pressure Broadening*. Physical Review 1958, 112, 855–865. [Google Scholar] [CrossRef]
- Seaton, M.J. The Theory of Excitation and Ionization by Electron Impact. In Proceedings of the Atomic and Molecular Processes; Bates, D.R., Ed.; 1962. [Google Scholar]
- van Regemorter, H. Rate of Collisional Excitation in Stellar Atmospheres. The Astrophysical Journal 1962, 136, 906. [Google Scholar] [CrossRef]
- Cowan, R. The theory of atomic struture and spectra; University of California Press, 1981; p. 57. [Google Scholar] [CrossRef]
- Sampson, D.H.; Zhang, H.L. Semiempirical Formulae for Electron Impact Excitation and Ionization of Hydrogenic Ions. 1988, 335, 516. [Google Scholar] [CrossRef]
- Popović, L.C.; Dimitrijević, M.S. Stark broadening parameter tables for Xe II, Sc II, Y II and Zr II. Bulletin Astronomique de Belgrade 1997, 155, 159–163. [Google Scholar]
Figure 1.
[a]Photographic view of the LIB (and LSP) irradiation experimental setup. [b]Fitting of a Voigt profile to the experimental H line emission from the plasma with a gate time of 500 ns at 5 s delay time with a wavelength range from 6530 to 6590 Å.
Figure 1.
[a]Photographic view of the LIB (and LSP) irradiation experimental setup. [b]Fitting of a Voigt profile to the experimental H line emission from the plasma with a gate time of 500 ns at 5 s delay time with a wavelength range from 6530 to 6590 Å.
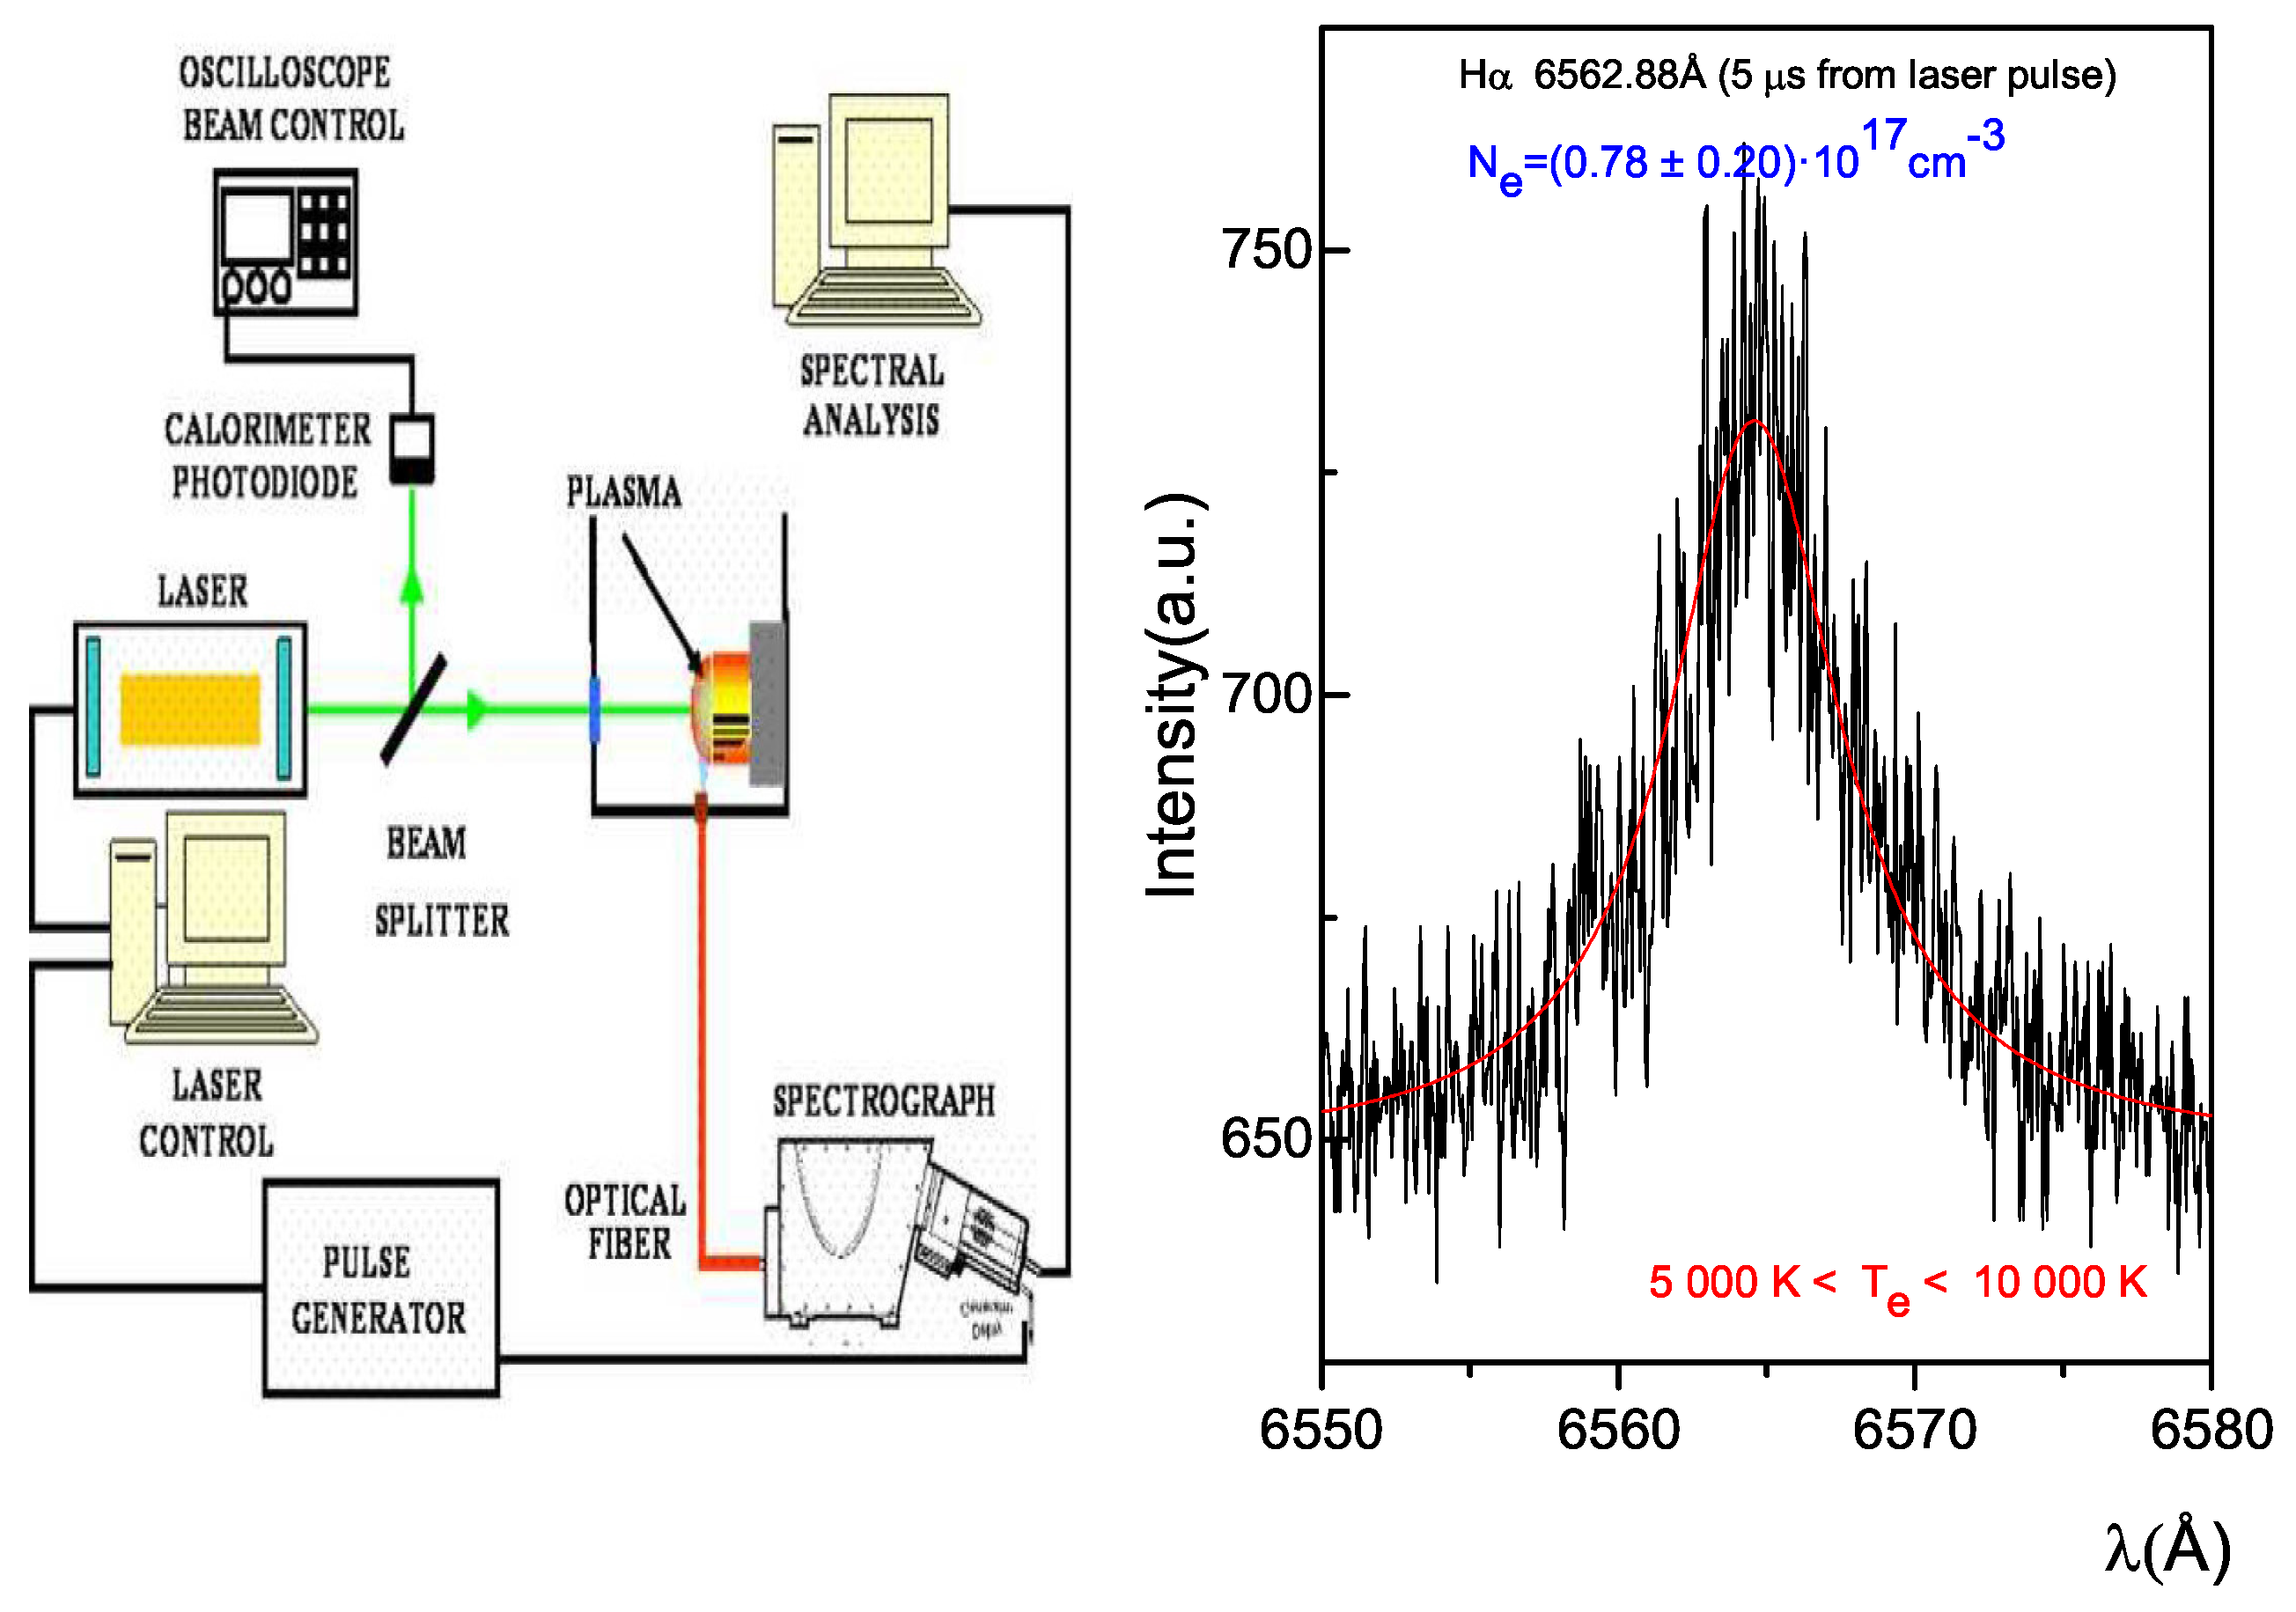
Figure 2.
Three examples of Spectral emission of Y–Pb sample at 5 s after laser pulse in the 3280 at 3560 Å range. The figure shows, , the Lorentzian broadening of several Y II interest spectral lines (3327.88, 3496.87 and 3549.0 Å) at the temperature and electron density of the plasmas generated in this experiment.
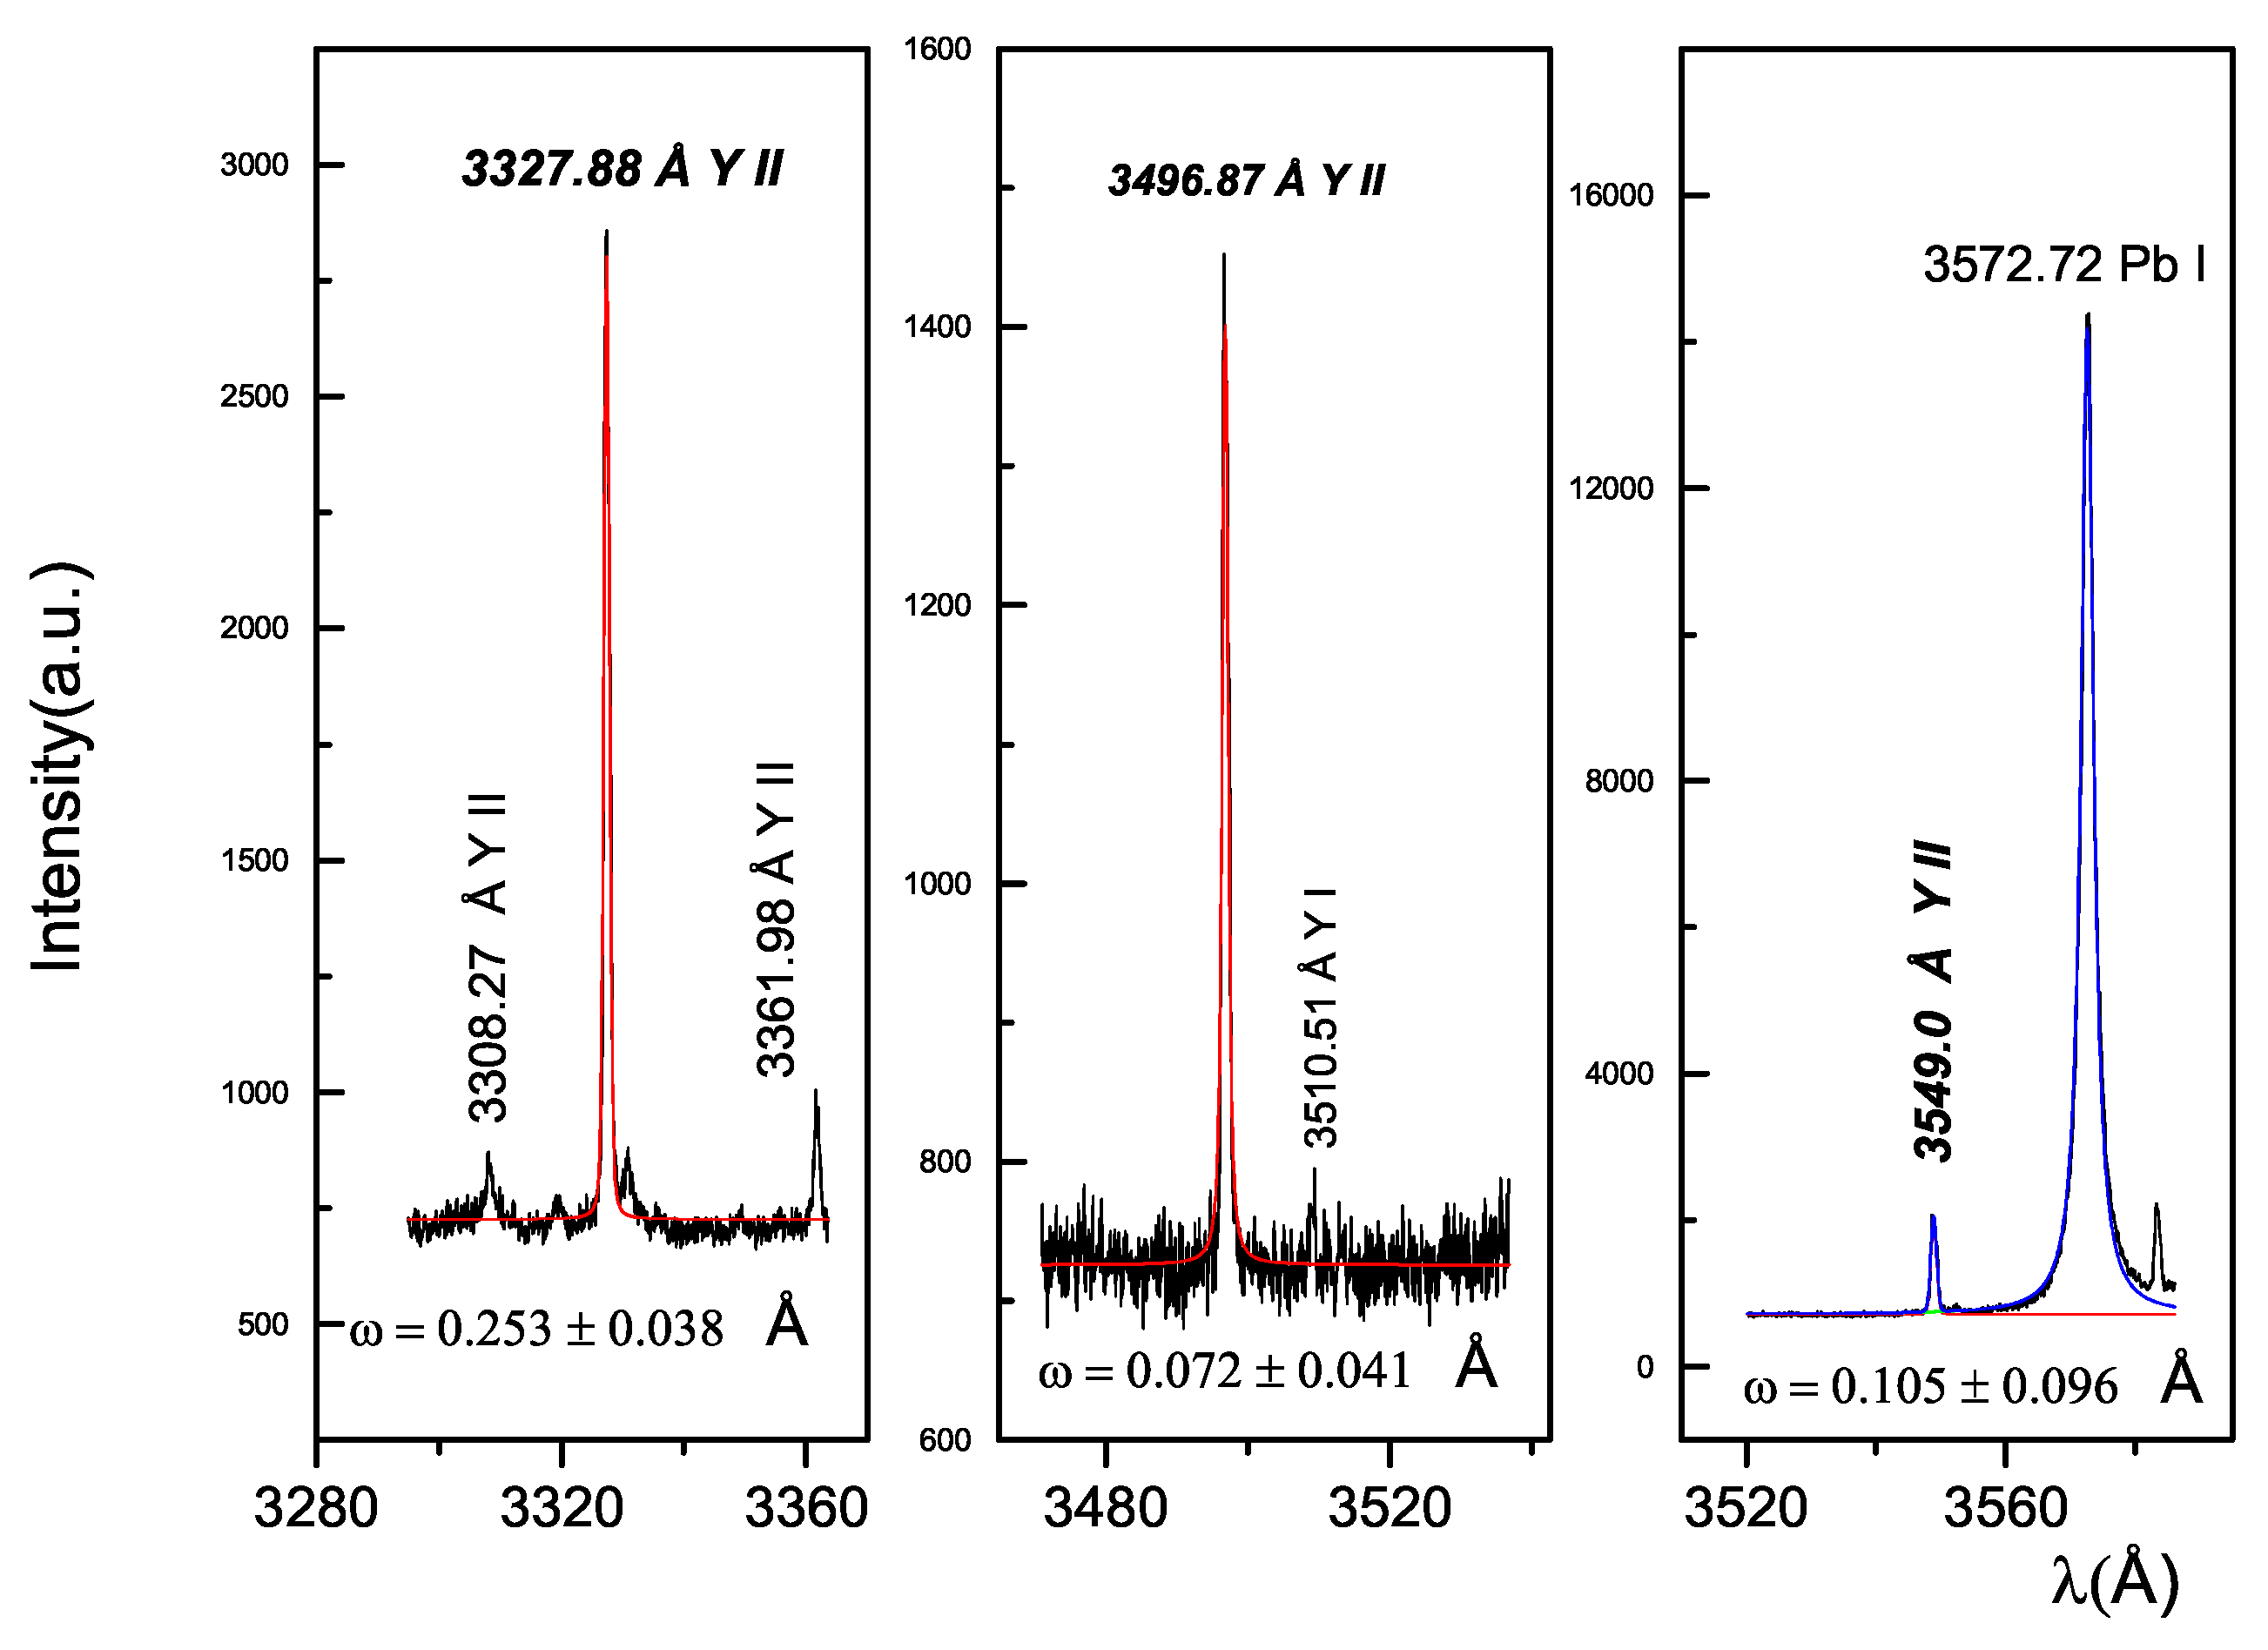
Figure 3.
(a): Spectral emission of Y–Pb sample at 5 s after laser pulse in the 3630 at 3755 Å range. (b): Plasma temperature, at 5 s after the laser pulse, estimated by a Boltzmann plot from the lines displayed in Figure 3a.
Figure 3.
(a): Spectral emission of Y–Pb sample at 5 s after laser pulse in the 3630 at 3755 Å range. (b): Plasma temperature, at 5 s after the laser pulse, estimated by a Boltzmann plot from the lines displayed in Figure 3a.
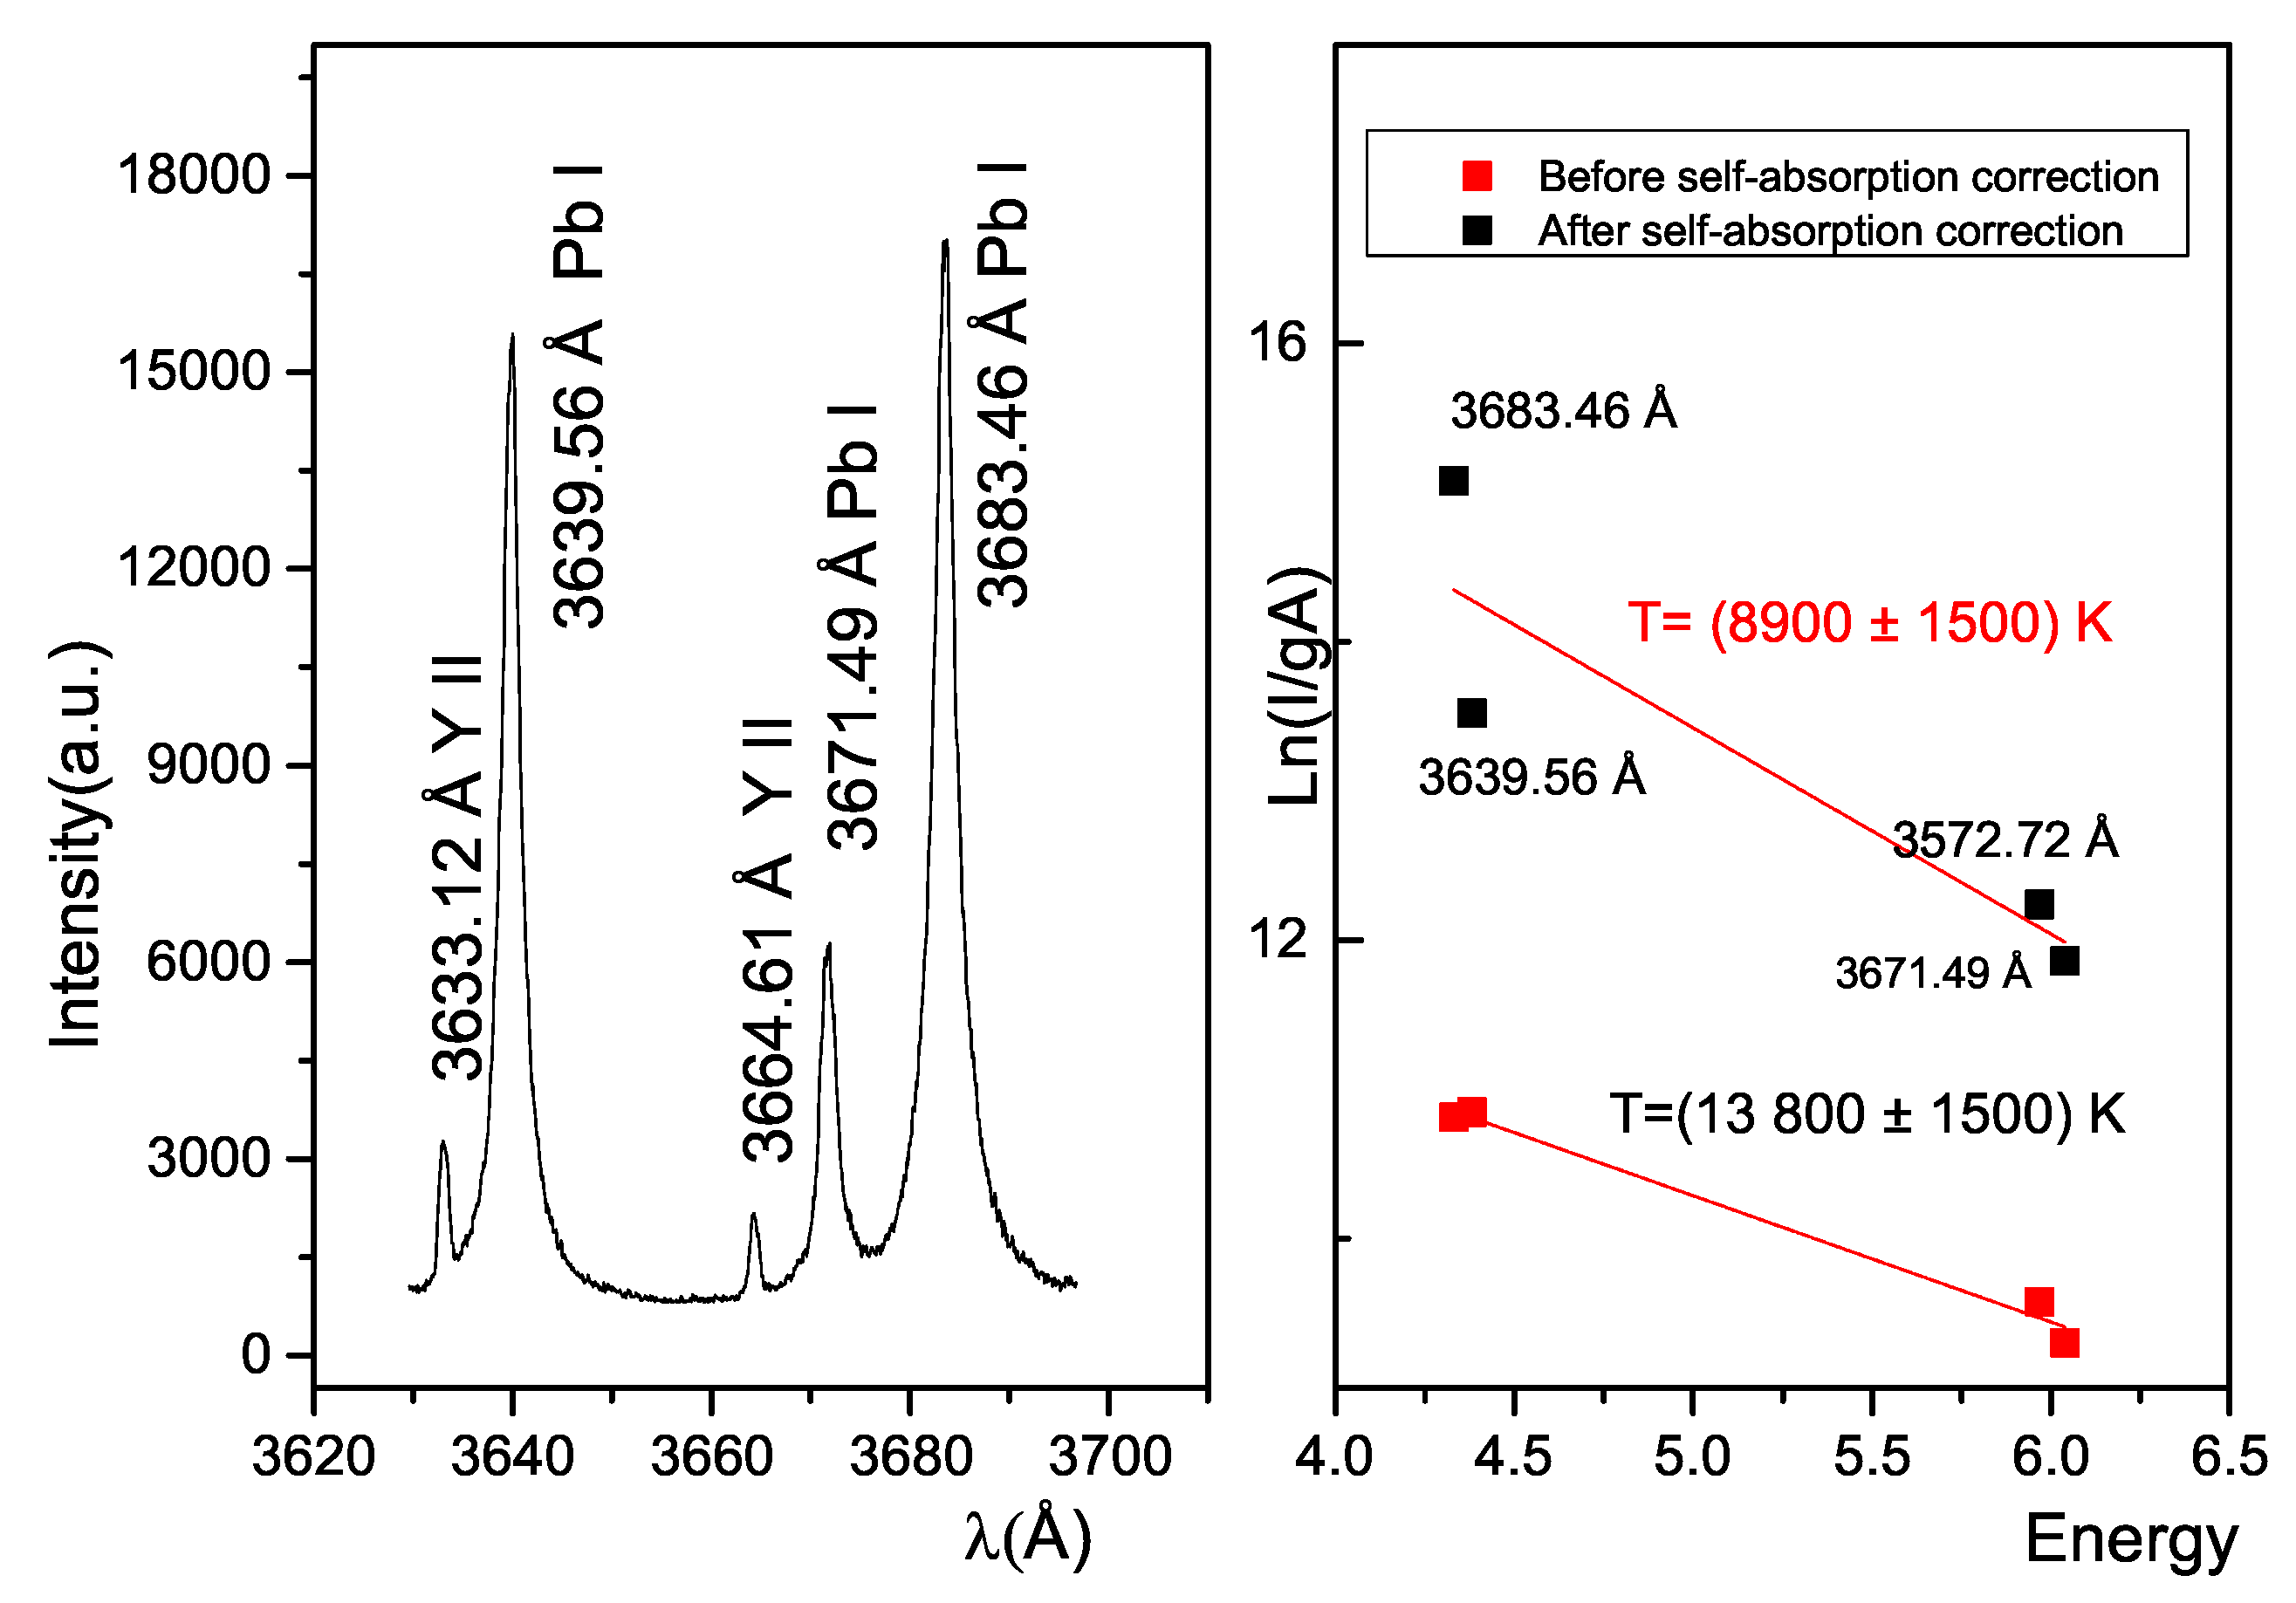
Figure 4.
a) Spectral emission of Y–Pb sample at 5 s after laser pulse in the 3300 at 3360 Å range. b) Stark width (FWHM)normalized to Ne= 1017 cm−3 vs. temperature for 3327,867 Å spectral line of single ionized Yttrium.
Figure 4.
a) Spectral emission of Y–Pb sample at 5 s after laser pulse in the 3300 at 3360 Å range. b) Stark width (FWHM)normalized to Ne= 1017 cm−3 vs. temperature for 3327,867 Å spectral line of single ionized Yttrium.
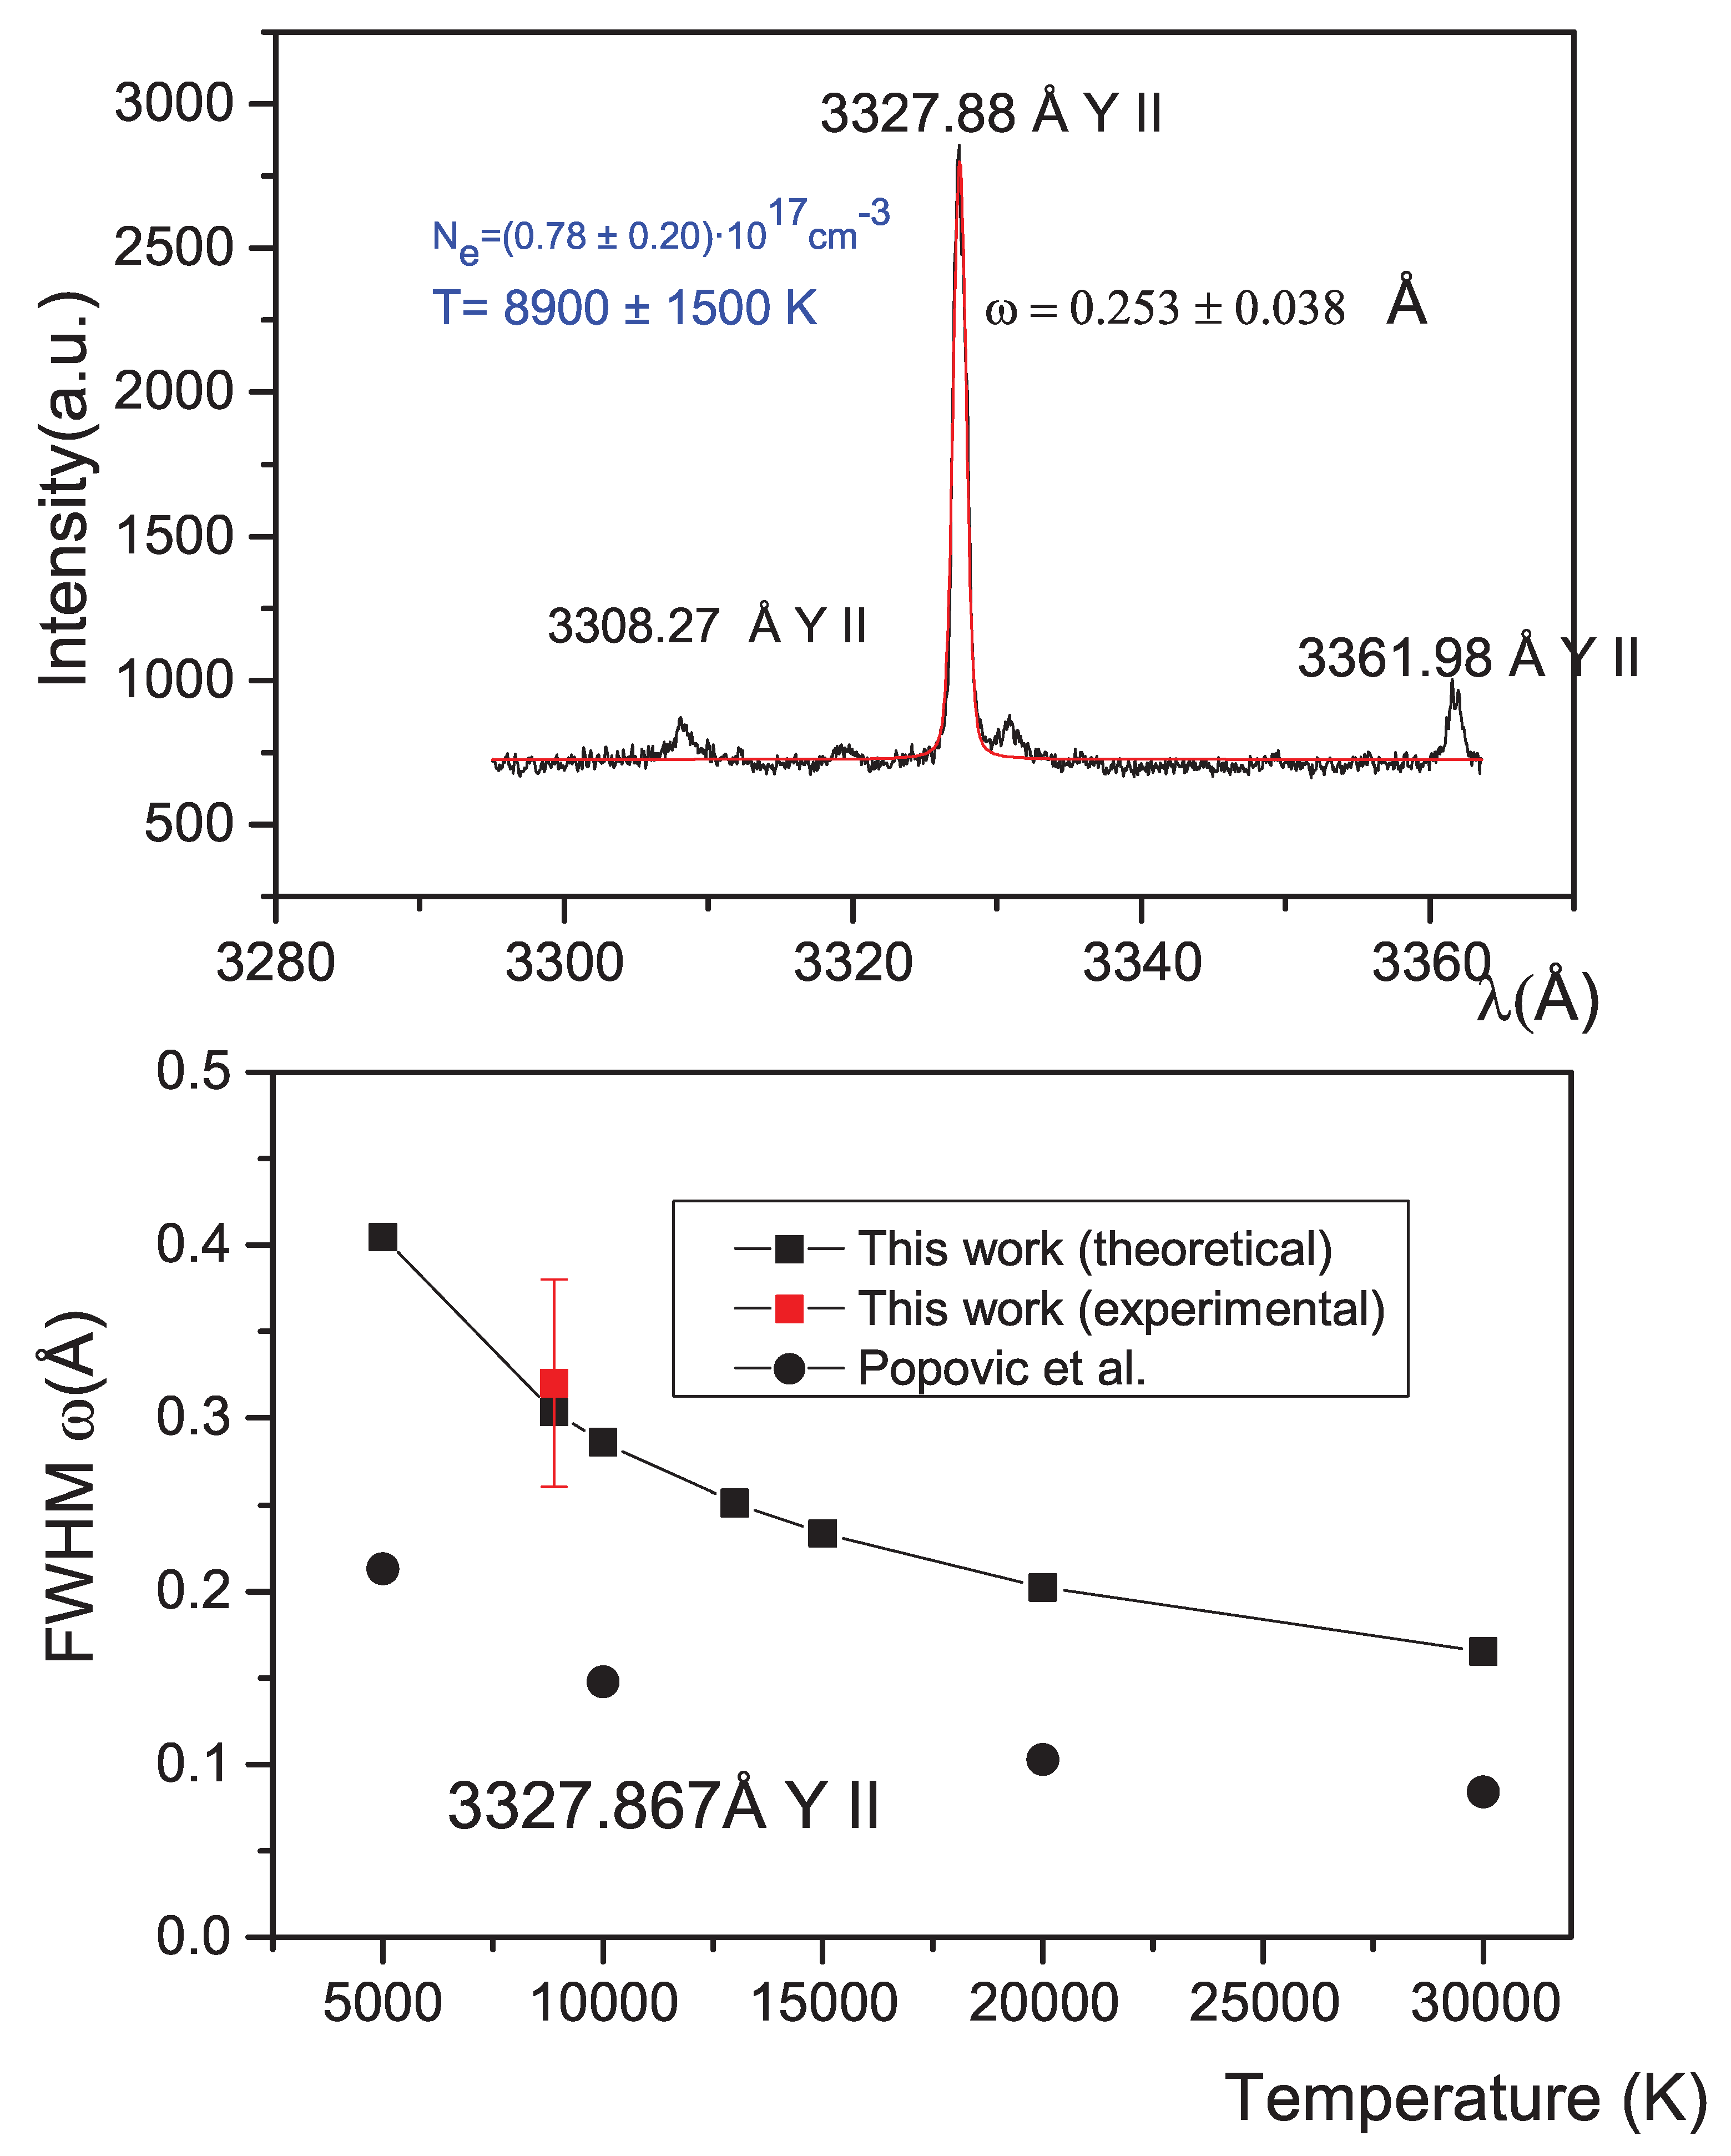

Table 1.
Wavelengths and levels of the 33 lines included in our calculations.
| Wavelength (Å) | Transition | Wavelength (Å) | Transition | ||||
|---|---|---|---|---|---|---|---|
| Upper | Lower | Upper | Lower | ||||
| 1 | 3 242.272 | 4d5p 3Po2 | 4d5s3D3 | 18 | 4900.118 | 4d5p 3Do2 | 4d2 3F3 |
| 2 | 3327.876 | 4d5p 1Fo3 | 4d5s1D2 | 19 | 4982.128 | 4d5p 3Fo4 | 4d2 3F3 |
| 3 | 3361.98 | 5s5p 1Po1 | 4d2 1D2 | 20 | 5087.418 | 4d5p 3Fo4 | 4d2 3F4 |
| 4 | 3496.079 | 4d5p 3Do1 | 5s2 1S0 | 21 | 5119.11 | 4d5p 3Fo3 | 4d2 3F2 |
| 5 | 3549.005 | 4d5p 3Do3 | 4d5s3D2 | 22 | 5123.209 | 4d5p 1Po1 | 4d2 3F2 |
| 6 | 3611.043 | 4d5p 3Do2 | 4d5s3D2 | 23 | 5200.409 | 4d5p 3Fo2 | 4d2 3F2 |
| 7 | 3788.693 | 4d5p 3Fo2 | 4d5s3D1 | 24 | 5205.722 | 4d5p 3Fo3 | 4d2 3F3 |
| 8 | 3950.349 | 4d5p 1Do2 | 4d5s3D1 | 25 | 5289.815 | 4d5p 3Fo2 | 4d2 3F3 |
| 9 | 4124.904 | 4d5p 3Fo3 | 4d5s1D2 | 26 | 5402.773 | 4d5p 1Fo3 | 4d2 1D2 |
| 10 | 4177.528 | 4d5p 3Fo2 | 4d5s1D2 | 27 | 5473.384 | 4d5p 3Po2 | 4d2 3P1 |
| 11 | 4235.727 | 5s5p 1Po2 | 4d5s3D2 | 28 | 5497.405 | 4d5p 3Po2 | 4d2 3P2 |
| 12 | 4374.933 | 4d5p 1Do2 | 4d5s1D2 | 29 | 5544.61 | 4d5p 3Po0 | 4d2 3P1 |
| 13 | 4398.008 | 5s5p 3Po1 | 4d5s3D2 | 30 | 5546.008 | 4d5p 3Po1 | 4d2 3P2 |
| 14 | 4682.321 | 5s5p 3Po2 | 4d5s1D2 | 31 | 6613.731 | 4d5p 3Do3 | 4d2 3P2 |
| 15 | 4823.304 | 4d5p 3Do2 | 4d2 3F2 | 32 | 6795.415 | 4d5p 3Do2 | 4d2 3P1 |
| 16 | 4854.861 | 4d5p 3Do1 | 4d2 3F2 | 33 | 7881.878 | 4d5p 1Po1 | 4d2 1D2 |
| 17 | 4883.682 | 4d5p 3Do3 | 4d2 3F4 | ||||
Table 2.
Stark widths and shifts, (Å) and d (Å), normalized to an electron density of 1017 cm−3obtained in our calculations using the Gaunt factors provided by van Regemorter and Sampson. Our theoretical data are compared, when it is possible, with our experimental values and theoretical values of Popović [25].
| Wavelength (Å) | T (103K) | Regemorter | Sampson | This work | Ref [25] | |||
|---|---|---|---|---|---|---|---|---|
| (Å) | d (Å) | (Å) | d (Å) | (Å) | (Å) | |||
| 1 | 3 242.272 | 5.00 | 1.83 | -0.60 | 0.37 | -0.12 | ||
| 10.00 | 1.29 | -0.43 | 0.27 | -0.09 | 0.15 | |||
| 20.00 | 0.91 | -0.30 | 0.19 | -0.06 | ||||
| 50.00 | 0.58 | -0.19 | 0.17 | -0.04 | ||||
| 2 | 3327.876 | 5.00 | 1.97 | -0.52 | 0.41 | -0.11 | ||
| 8.90 | 0.30 | -0-08 | 0.32±0.15 | |||||
| 10.00 | 1.40 | -0.37 | 0.29 | -0.08 | ||||
| 20.00 | 0.99 | -0.26 | 0.20 | -0.05 | ||||
| 3 | 3361.98 | 50.00 | 0.66 | -0.15 | 0.43 | -0.06 | ||
| 5.00 | 1.45 | -0.56 | 0.30 | -0.12 | ||||
| 8.90 | 0.22 | -0.09 | 0.50±0.20 | |||||
| 10.00 | 1.03 | -0.40 | 0.21 | -0.08 | ||||
| 4 | 3496.079 | 20.00 | 0.73 | -0.28 | 0.16 | -0.06 | ||
| 50.00 | 0.50 | -0.20 | 0.34 | -0.16 | ||||
| 5.00 | 0.76 | -0.16 | 0.16 | -0.03 | ||||
| 8.90 | 0.12 | -0.02 | 0.09±0.06 | |||||
| 5 | 3549.005 | 10.00 | 0.54 | -0.12 | 0.11 | -0.02 | ||
| 20.00 | 0.38 | -0.08 | 0.08 | -0.02 | ||||
| 50.00 | 0.24 | -0.05 | 0.08 | 0.00 | ||||
| 5.00 | 2.14 | -0.55 | 0.44 | -0.11 | ||||
| 8.90 | 0.33 | -0.08 | 0.15±0.10 | |||||
| 6 | 3611.043 | |||||||
| 10.00 | 1.51 | -0.39 | 0.31 | -0.08 | ||||
| 20.00 | 1.07 | -0.27 | 0.22 | -0.06 | ||||
| 50.00 | 0.68 | -0.17 | 0.22 | -0.01 | ||||
| 7 | 3788.693 | 5.00 | 1.79 | -0.51 | 0.37 | -0.10 | ||
| 10.00 | 1.27 | -0.36 | 0.26 | -0.07 | 0.17 | |||
| 20.00 | 0.90 | -0.25 | 0.18 | -0.05 | ||||
| 50.00 | 0.57 | -0.16 | 0.18 | -0.01 | ||||
| 8 | 3950.349 | 5.00 | 1.39 | -0.39 | 0.29 | -0.08 | ||
| 10.00 | 0.99 | -0.28 | 0.20 | -0.06 | ||||
| 20.00 | 0.70 | -0.20 | 0.14 | -0.04 | ||||
| 50.00 | 0.44 | -0.12 | 0.14 | -0.01 | ||||
| 9 | 4124.904 | 5.00 | 1.56 | -0.41 | 0.32 | -0.08 | ||
| 10.00 | 1.10 | -0.29 | 0.23 | -0.06 | ||||
| 20.00 | 0.78 | -0.20 | 0.16 | -0.04 | ||||
| 50.00 | 0.49 | -0.13 | 0.20 | 0.01 | ||||
| 10 | 4177.528 | 5.00 | 2.29 | -0.67 | 0.47 | -0.14 | ||
| 10.00 | 1.62 | -0.48 | 0.33 | -0.10 | ||||
| 20.00 | 1.15 | -0.34 | 0.24 | -0.07 | ||||
| 50.00 | 0.72 | -0.21 | 0.28 | -0.08 | ||||
| (Å) | d (Å) | (Å) | d (Å) | (Å) | (Å) | |||
| 11 | 4235.727 | 5.00 | 1.94 | -0.60 | 0.43 | -0.14 | ||
| 10.00 | 1.37 | -0.43 | 0.30 | -0.10 | 0.21 | |||
| 20.00 | 0.97 | -0.30 | 0.21 | -0.07 | ||||
| 50.00 | 0.61 | -0.19 | 0.20 | -0.03 | ||||
| 12 | 4374.933 | 5.00 | 1.99 | -0.91 | 0.41 | -0.19 | ||
| 10.00 | 1.41 | -0.65 | 0.29 | -0.13 | ||||
| 20.00 | 0.99 | -0.46 | 0.22 | -0.09 | ||||
| 50.00 | 0.64 | -0.28 | 0.18 | -0.05 | ||||
| 13 | 4398.008 | 5.00 | 2.19 | -0.63 | 0.45 | -0.13 | ||
| 10.00 | 1.55 | -0.45 | 0.32 | -0.09 | 0.22 | |||
| 20.00 | 1.09 | -0.32 | 0.22 | -0.07 | ||||
| 50.00 | 0.68 | -0.20 | 0.36 | -0.04 | ||||
| 14 | 4682.321 | 5.00 | 1.75 | -0.81 | 0.36 | -0.17 | ||
| 10.00 | 1.23 | -0.58 | 0.25 | -0.12 | ||||
| 20.00 | 0.87 | -0.41 | 0.19 | -0.08 | ||||
| 50.00 | 0.56 | -0.25 | 0.16 | -0.05 | ||||
| 15 | 4823.304 | 5.00 | 2.25 | -1.02 | 0.46 | -0.21 | ||
| 10.00 | 1.59 | -0.72 | 0.33 | -0.15 | ||||
| 20.00 | 1.12 | -0.51 | 0.25 | -0.10 | ||||
| 50.00 | 0.72 | -0.31 | 0.32 | -0.11 | ||||
| 16 | 4854.861 | 5.00 | 2.51 | -0.56 | 0.51 | -0.12 | ||
| 10.00 | 1.77 | -0.40 | 0.36 | -0.08 | ||||
| 20.00 | 1.25 | -0.28 | 0.26 | -0.06 | ||||
| 50.00 | 0.82 | -0.18 | 0.35 | -0.03 | ||||
| 17 | 4883.682 | 5.00 | 1.78 | -0.47 | 0.37 | -0.10 | ||
| 10.00 | 1.26 | -0.34 | 0.26 | -0.07 | ||||
| 20.00 | 0.89 | -0.24 | 0.18 | -0.05 | ||||
| 50.00 | 0.59 | -0.15 | 0.27 | -0.05 | ||||
| 18 | 4900.118 | 5.00 | 3.86 | -0.94 | 0.79 | -0.19 | ||
| 10.00 | 2.73 | -0.66 | 0.56 | -0.14 | ||||
| 20.00 | 1.93 | -0.47 | 0.40 | -0.10 | ||||
| 50.00 | 1.26 | -0.30 | 0.55 | -0.08 | ||||
| 19 | 4982.128 | 5.00 | 2.85 | -0.71 | 0.58 | -0.15 | ||
| 10.00 | 2.01 | -0.50 | 0.41 | -0.10 | ||||
| 20.00 | 1.42 | -0.36 | 0.29 | -0.07 | ||||
| 50.00 | 0.93 | -0.23 | 0.42 | -0.06 | ||||
| 20 | 5087.418 | 5.00 | 3.70 | -0.97 | 0.76 | -0.20 | ||
| 10.00 | 2.62 | -0.68 | 0.54 | -0.14 | ||||
| 20.00 | 1.85 | -0.48 | 0.38 | -0.10 | ||||
| 50.00 | 1.20 | -0.31 | 0.44 | -0.10 | ||||
| 21 | 5119.11 | 5.00 | 4.14 | -1.15 | 0.85 | -0.24 | ||
| 10.00 | 2.93 | -0.81 | 0.60 | -0.17 | ||||
| 20.00 | 2.07 | -0.57 | 0.42 | -0.12 | ||||
| 50.00 | 1.34 | -0.37 | 0.51 | -0.13 | ||||
| 22 | 5123.209 | 5.00 | 2.98 | -0.76 | 0.61 | -0.16 | ||
| 10.00 | 2.11 | -0.54 | 0.43 | -0.11 | ||||
| 20.00 | 1.49 | -0.38 | 0.31 | -0.08 | ||||
| 50.00 | 0.97 | -0.24 | 0.35 | -0.07 | ||||
| 23 | 5200.409 | 5.00 | 1.91 | -0.57 | 0.39 | -0.12 | ||
| 10.00 | 1.35 | -0.40 | 0.28 | -0.08 | ||||
| 20.00 | 0.95 | -0.29 | 0.20 | -0.06 | ||||
| 50.00 | 0.66 | -0.17 | 0.31 | -0.05 | ||||
| (Å) | d (Å) | (Å) | d (Å) | (Å) | (Å) | |||
| 24 | 5205.722 | 5.00 | 2.44 | -0.65 | 0.50 | -0.13 | ||
| 10.00 | 1.72 | -0.46 | 0.35 | -0.09 | ||||
| 20.00 | 1.22 | -0.33 | 0.25 | -0.07 | ||||
| 50.00 | 0.79 | -0.21 | 0.33 | -0.06 | ||||
| 25 | 5289.815 | 5.00 | 2.74 | -0.80 | 0.69 | -0.19 | ||
| 10.00 | 1.94 | -0.57 | 0.49 | -0.14 | ||||
| 20.00 | 1.37 | -0.40 | 0.35 | -0.10 | ||||
| 50.00 | 0.89 | -0.26 | 0.42 | -0.11 | ||||
| 26 | 5402.773 | 5.00 | 2.83 | -0.83 | 0.58 | -0.17 | ||
| 10.00 | 2.00 | -0.58 | 0.41 | -0.12 | ||||
| 20.00 | 1.41 | -0.41 | 0.29 | -0.09 | ||||
| 50.00 | 0.92 | -0.27 | 0.41 | -0.09 | ||||
| 27 | 5473.384 | 5.00 | 4.73 | -1.13 | 0.97 | -0.23 | ||
| 10.00 | 3.35 | -0.80 | 0.69 | -0.16 | ||||
| 20.00 | 2.37 | -0.56 | 0.49 | -0.12 | ||||
| 50.00 | 1.66 | -0.35 | 1.06 | -0.13 | ||||
| 28 | 5497.405 | 5.00 | 3.33 | -0.79 | 0.68 | -0.16 | ||
| 10.00 | 2.36 | -0.56 | 0.48 | -0.11 | ||||
| 20.00 | 1.66 | -0.39 | 0.35 | -0.09 | ||||
| 50.00 | 1.09 | -0.25 | 0.44 | -0.10 | ||||
| 29 | 5544.61 | 5.00 | 3.72 | -0.98 | 0.76 | -0.20 | ||
| 10.00 | 2.63 | -0.69 | 0.54 | -0.14 | ||||
| 20.00 | 1.86 | -0.48 | 0.41 | -0.12 | ||||
| 50.00 | 1.23 | -0.32 | 0.53 | -0.14 | ||||
| 30 | 5546.008 | 5.00 | 1.11 | -0.38 | 0.23 | -0.08 | ||
| 10.00 | 0.79 | -0.27 | 0.16 | -0.06 | ||||
| 20.00 | 0.56 | -0.19 | 0.13 | -0.04 | ||||
| 50.00 | 0.39 | -0.13 | 0.18 | -0.06 | ||||
| 31 | 6613.731 | 5.00 | 2.63 | -0.77 | 0.54 | -0.16 | ||
| 10.00 | 1.86 | -0.55 | 0.38 | -0.11 | ||||
| 20.00 | 1.31 | -0.38 | 0.30 | -0.10 | ||||
| 50.00 | 0.90 | -0.27 | 0.38 | -0.11 | ||||
| 32 | 6795.415 | 5.00 | 6.22 | -1.29 | 1.28 | -0.27 | ||
| 10.00 | 4.40 | -0.91 | 0.90 | -0.19 | ||||
| 20.00 | 3.10 | -0.64 | 0.68 | -0.16 | ||||
| 50.00 | 2.09 | -0.43 | 0.86 | -0.07 | ||||
| 33 | 7881.878 | 5.00 | 4.52 | -0.89 | 0.93 | -0.18 | ||
| 10.00 | 3.20 | -0.63 | 0.66 | -0.13 | ||||
| 20.00 | 2.26 | -0.45 | 0.48 | -0.10 | ||||
| 50.00 | 1.51 | -0.29 | 0.62 | -0.03 | ||||
Disclaimer/Publisher’s Note: The statements, opinions and data contained in all publications are solely those of the individual author(s) and contributor(s) and not of MDPI and/or the editor(s). MDPI and/or the editor(s) disclaim responsibility for any injury to people or property resulting from any ideas, methods, instructions or products referred to in the content. |
© 2026 by the authors. Licensee MDPI, Basel, Switzerland. This article is an open access article distributed under the terms and conditions of the Creative Commons Attribution (CC BY) license (http://creativecommons.org/licenses/by/4.0/).
Copyright: This open access article is published under a Creative Commons CC BY 4.0 license, which permit the free download, distribution, and reuse, provided that the author and preprint are cited in any reuse.


