Submitted:
20 February 2026
Posted:
25 February 2026
Read the latest preprint version here
Abstract
S. Tomé and Principe (STP) islands have been studied in recent years for their wide range of medicinal plants which exhibit several biological activities of great medicinal interest for some diseases. Experimental planning for optimization of several parameters was carried out by a full factorial of two levels of three factors for secondary metabolite extraction from Tithonia diversifolia leaves by using water and hexane at 25 and 40 ºC and 200 rpm for 0 and 5 days of incubation. The best conditions for highest extraction of phenolic compounds (i.e 72.16 μmoles gallic acid equivalent/g leaves)) was obtained at 40ºC, in H20 and 5 days of incubation. Several phytochemical assays were performed for characterization of these plant extracts and the highest levels for extraction of reducing power, ABTS and DPPH were obtained at 25 ºC, H20 and 5 days of incubation whereas highest levels of SOD activity were extracted at 40ºC, H20 and 5 days of incubation. The present report consists of a novel and intrinsic synchronous fluorescence and phosphorescence characterization of secondary metabolites from this plant extract. Intrinsic and non-destructive synchronous fluorescence was carried out in the range of 250 to 750 nm with a Δλ range of 5–30 nm which exhibited peaks at 290, 320, 345, 400, 490 and 675 nm in hexane plant extracts whereas aqueous extracts revealed only peaks at 490, 560 and 675 nm. On the other hand, intrinsic and non-destructive synchronous phosphorescence was also performed which exhibited peaks at 325, 400, 490, 550, 675 nm and 500 , 560 nm, respectively. 3-D spectra of secondary metabolites confirmed the peaks at 290, 320, 345, 400, 490 and 675 nm in plant extracts. FTIR spectroscopy was selected to investigate the structural properties of secondary metabolites in these plant extracts. Therefore, the present work describes a novel characterization of secondary metabolites by a non-destructive and intrinsic synchronous fluorescence techniques for plant extracts.
Keywords:
Tithonia diversifolia
; plant leaves extracts
; experimental planning
; characterization of secondary metabolites
; antioxidant activity
; Intrinsic synchronous fluorescence and phosphorescence spectroscopy
; 3 -D. fluorescence spetra
; FTIR spectroscopy
1. Introduction
Tithonia diversifolia is native to north and central America but it has also been found in Africa, Australia and Asia [1]. This plant has been widely used in traditional medicine for clinical conditions of diabetes, diarrhoea, menstrual pain, malaria, hematomas, hepatitis, hepatomas, and wound healing among other diseases [2,3]. S. Tomé and Principe (STP) islands in the Gulf of Guinea are very rich in many medicinal plants that are used by the local population with guidance of local traditional healers [4,5]. Several plant extracts of Tithonia diversifolia from STP have been prepared in various solvents such as ethanol, water, dichloromethane, petroleum ether, methanol and ethyl acetate for treatment of several diseases [6,7]. The organic extract of this plant leaves has been successfully used for many decades for treatment of malaria in STP [8]. As far as biological and chemical composition of these plant extracts are concerned, they contain phenolic and flavonoids, terpenoids, proteins, carbohydrates and glycosides as well as antioxidant and scavenging superoxide activities [9,10].
There are some published reports about colorimetric assays for phenolics, flavonoids, antioxidant and superoxide scavenging activities from this plant extract as well as FTIR analysis [11]. Although a lot of research work has been carried out on this plant, there is little data on the chemical and biological composition of these plant extracts. Moreover, to our knowledge, we have not found any published report about experimental planning for extraction of secondary metabolites from these plant leaves. This is an important strategy for optimization of secondary metabolite extractions as it provides useful information about significant factors and the interactions between the variables [12]. Intrinsic synchronous fluorescence and phosphorescence as well as 3-d fluorescence spectroscopy are very useful analytical techniques for identification of secondary metabolites in plant extracts as they are fast, sensitive and non-destructive [13,14]. However, to author’s knowledge, there are no reports in the literature about fluorescence characterization of this plant extract. Therefore, the present work involved experimental planning for optimization of secondary metabolite extraction from plant leaves and some phytochemical parameters were analyzed in these plant extracts. Subsequently, these secondary metabolites were investigated by intrinsic synchronous fluorescence, phosphorescence and 3-d fluorescence spectroscopy as well as by FTIR analysis.
2. Materials and Methods
2.1. Chemicals
Phenazine methosulfate, NADH, nitro blue tetrazolium (NBT), Riboflavin, deuterated water, gallic acid, catechin, Trolox, ascorbic acid, Folin & Ciocalteu, DPPH and ABTS (2,2’-Azino-di [3-ethylbenzthiazoline sulfonate]) were obtained from Sigma-Aldrich (USA). All other reagents were of analytical grade.
2.2. Plant Collection
Plant leaves were collected on the island of S. Tomé, Tithonia Diversifolia (Hmsl.) A. Gray. in the S.Tomé botanical garden, in the interior of the island, at 6 am, with very high humidity and average temperature of 24 °C in January 2018 (GPS coordinates: 0°17’16.0”N 6°38’14.0”E) and they were free of pests and diseases from the same tree. These plants were collected under the guidance of the healers and they were identified at the S.Tomé e Príncipe National Herbarium and STP Agronomical Research Center (CIAT-STP). A voucher specimen of the plant was deposited in the herbarium of S. Tomé (08-01-2018), Voucher Number 001 / 2019 and the samples were cut into small fragments and evenly packed.
2.3. Methods
2.3.1. Preparation of Plant Extract
The plant leaves were properly washed with distilled water, dried overnight in an oven at 40 º C. The dried plant material was ground through a IKA A10 universal grinder and the plants extracts were prepared with 15 grams of ground dry matter from the leaves of Tithonia Diversifolia in either 150 mL of demineralized water or 150 ml of hexane. All plant extracts were transferred to an orbital shaking either at 25ºC or 40 ºC according to experimental planning procedure. The plant extract of day 0 was shaken for 30 min in orbital shaker and centrifuged at 10.000 rpm for 30 min at room temperature, the supernatant was recovered and stored in Eppendorf tubes at -20º C for further analysis. The remaining plant extracts were incubated in orbital shaker at 150 rpm for 5 days at 25 and 40 ºC with either water or hexane. After 5 days, the same procedure was carried out to recover the supernatant in Eppendorf tubes and stored at -20 ºC in dark containers protected from light.
- Phytochemical assays
All phytochemical assays were carried out by using 8 samples from experimental planning design described below
2.3.2. Determination of Total Phenolic Content (TPC)
Phenolic compounds from plant extracts were determined by the Folin-Ciocalteau procedure [15,16,17] with some modifications. In a 96-well microplate, 30 µl of plant extract was added to 150 µl of aqueous Folin-Ciocalteau reagent solution (diluted 1:10, V/V), and finally 120 µl of sodium carbonate (0. 25 mg / mL) was added. After shaking, the microplate was incubated at 40 ° C for 30 min protected from light. Absorbances were read at 765 nm in a microtiter plate reader in triplicates (FLUOstar OPTIMA-BMG Labtec). A calibration curve of gallic acid (0.25mg / mL), (R² = 0.99) was carried out with the following volumes: 0, 5, 10, 15, 20, 25 µL, adjusted to final volume of 30 µL with water. The results of the total phenolic compounds were expressed as micromoles gallic acid equivalent per g of leaves.
2.3.3. Determination of Total Flavonoids Content (TFC)
Flavonoids quantification was carried out by using the colorimetric method described previously [18], with some modifications. A calibration curve was carried out with the catechin standard solution (0.3 mg / mL) by using concentrations in the range of 1.5x10⁻² - 1.0mM, which revealed a R² = 0.9958 and the results were expressed in µmole catechin equivalent / g of leaves. Therefore, a 25 µl aliquot of extracts were diluted with 110 µl demineralized water and 7.5 µl sodium nitrite (5%). 7.5 µL aluminium chloride (10%) were added to the microplate and incubated for 6 minutes at room temperature and protected from light. Subsequently, 100 µl of a sodium hydroxide solution (4%) was added and the reaction mixture was mixed manually and incubated for 15 minutes. The absorbance was measured at 510 nm in a microtiter plate reader (FLUOstar OPTIMA – BMG Labtec and its accompanying software Optima 2.10 R3) and compared with that of a blank reaction mixture which contained deionized water. All assays were carried out in triplicate.
- Antioxidant Activity of plant extracts
2.3.4. DPPH Radical Scavenging Activity
Quantification of DPPH free radical scavenging activity was based on the method described previously [17], with some modifications. An aliquot of plant extract was pipetted (0, 4, 8, 12, 16, 20 µl) to 290 µl of the 0.3 mM DPPH solution which was prepared by using 80:20 methanol: water. The microplate was incubated at room temperature in the dark for 1h and read at 550 nm on a microplate reader (FLUOstar OPTIMA-BMG Labtec). The DPPH scavenging effect was determined as follows:
where Acontrol - the absorbance of the negative control and Asample - the absorbance at 550 nm of the tested samples or standard. The test was performed in triplicate and Trolox was used as standard. The IC50 values for each plant extract were calculated from the graph of DPPH scavenging effect against the concentration of extracts (mg/mL).
DPPH Scavenging Effect (%) = [(Acontrol – Asample)/ Acontrol] × 100
2.3.5. ABTS Scavenging Activity
This assay was carried out as described previously [18,19] with some modifications. The reaction of ABTS (8 mM) and K2S2O8, (2.45 mM) in demineralized water (H2O) was allowed to react for 12 h protected from light. The working solution involved the use of (0.5 mL) stock solution (described above) along with (14.5 mL) 50 mM phosphate buffer pH 7.4. In a 96-dark well microplate, plant extract (16 μL) and ABTS•+ radical solution (280 μL) were added, after manual homogenization, the microplate was incubated for 30 minutes, protected from light. Absorbance was read at 655 nm, all assays were carried out in triplicates and Trolox (0.3 mg/ mL) was used as standard. The following expression was used:
where Acontrol - the absorbance of the negative control and Asample - the absorbance at 655 nm of the tested samples or standard. The IC50 values for each plant extract were calculated from the graph of ABTS scavenging effect against the concentration of plant extracts (mg/mL).
ABTS scavenging effect (%) = [(Acontrol – Asample)/ Acontrol] × 100
2.3.6. Reducing Power
This assay was carried out described previously [18] with some modifications. Different concentrations of plant extracts (25µL) were added to sodium phosphate buffer (25µL, 0.2M pH 6.6), and 1% K3FeCN6 (25µL). The mixture was incubated at 50 ° C for 20 minutes. After incubation 80 µL trichloroacetic acid (10% TCA) was added to the reaction mixture and finally 100 µL of demineralized water (H2O) and 20 µL FeCl3 (0.1%,) and the absorbance was read at 655nm. Trolox (0.3mg / mL) was used as the standard, the results were expressed as µmole Trolox equivalents per g of leaves and the assays were carried out in triplicates.
2.3.7. Superoxide Radical Scavenging Activity
The superoxide radical scavenging activity was carried out as described previously [20] with minor changes. Each sample (25 μL) was mixed with 80 μM phenazine methosulfate (PMS, 25 μL), 625 μM NADH (25 μL), 200 μM nitro blue tetrazolium (NBT, 25 μL) and 100 μL of 100 mM sodium phosphate buffer pH 7.4. After 5 min at room temperature the absorbance was measured at 550 nm (microplate reader Bio-Rad 680). All absorbance measurements were carried out in triplicate and ascorbic acid (0.3mg / mL) was used as standard. The following expression was used:
where Acontrol - the absorbance of the negative control and Asample - the absorbance at 655 nm of the tested samples or standard. The IC50 values for each plant extract were calculated from the graph of Superoxide Radical Scavenging Activity against the concentration of plant extracts (mg/mL).
Superoxide Radical Scavenging Activity (%) = [(Acontrol – Asample)/ Acontrol] × 100
2.3.8. Superoxide Dismutase (SOD) Activity Assay
SOD activity was carried out by NBT method described previously [21] with some modifications. The assay mixture consisted of 70 µl Tris buffer (20 mM, pH 7.8) containing 1 mM EDTA, 10 µl plant extract, 10 µl NBT (2 mM), and 10 µl riboflavin (2mM). The absorbance at time 0 of the reaction mixture was measured at 550 nm (microtiter plate reader Bio-Rad 680) and the reaction mixture was exposed to a 25 W light for 10 min and the absorbance was read again immediately at 550 nm. A negative control (water instead of the sample) and a positive control (commercial SOD) were evaluated at the same time per microtiter plate. One unit of SOD was defined is as the amount of enzyme that provides a 50% inhibition of the riboflavin-mediated initial rate of reduction of NBT, at pH 7.8 and room temperature. All assays were carried out in triplicate.
2.3.9. Experimental Design to Optimize Extraction of Secondary Metabolites
The experimental design was conducted using three factors and two levels with duplicates: extraction temperatures (25 and 40ºC), extraction time (0 and 5 days) and solvents (H20 and hexane). The upper (+) and lower (−) levels were defined based on the preliminary results based on different solvents, temperatures and extraction/incubation time of bioactive compounds. The experimental design matrix was obtained with Design Expert version 10 software, and the results were fitted to the following factorial model equation:
2.3.10. Intrinsic Synchronous Fluorescence Spectroscopy (SFS) of Plant Extracts
The samples containing secondary metabolites were investigated on a spectrofluorometer (JASCO JP-8300, JASCO INTERNATIONAL CO., LTD., Hachioji, Tokyo, Japan) as reported previously [22].
2.3.11. Intrinsic Synchronous Phosphorescence Spectroscopy (SPS) of Plant Extracts
Intrinsic synchronous phosphorescence spectroscopy (SPS) of secondary metabolites was performed in a spectrofluorometer (JASCO JP-8300, JASCO International Co. Ltd. 11-10, Myojin-cho 1-chome. Hachioji, Tokyo 192-0046, Japan) in quartz cuvettes with a 1 cm optical path length. Spectra Manager software ver. 2.5 was obtained for spectral acquisition and processing (Spectra analysis). Synchronous phosphorescence spectra were obtained by using the following parameters: range of measurement λ of 210–750 nm; data intervals of 2 nm; data points of 271; excitation bandwidth of 20 nm; emission bandwidth of 20 nm; very low sensitivity; chopping period of 100 msec; delay time of 10 msec; integration time of 65 msec, variation in delta wavelength (Δλ) of 5, 10, 20 and 30 nm; response of 0.2 s; light source of Xe lamp and scan speed of 10,000 nm/min.
2.3.12. Intrinsic 3D Fluorescence Spectra Measurements of Plant Extracts
Three-dimensional intrinsic fluorescence spectra of of secondary metabolites were performed across a 3D space (excitation λ, emission λ and fluorescence intensity). The samples containing of secondary metabolites were analysed on a spectrofluorometer (JASCO JP-8300) in quartz cuvettes with a 1 cm optical path length. Spectra Manager software was purchased for spectral acquisition and processing (Interval data analysis). Intrinsic 3D fluorescence spectra were obtained by using the following parameters: scan speed of 10,000 nm/min and light source of Xe lamp; measurement range of 260–750 nm; data interval of 0.5 nm; excitation λ of 250.0 nm; emission bandwidth of 5 nm; response of 10 msec; high sensitivity; start at 260 nm and end at 750 nm; data interval of 0.5 nm; data points of 981; interval measurement of λ (nm) points of 98; start at 250 nm and end at 735 nm; interval of 5 nm; mode of emission and excitation bandwidth of 5 nm.
2.3.13. FTIR Analysis of Plant Extracts
The structural information of secondary metabolites was investigated by FTIR analysis as described previously [22].
2.3.14. Statistical Analysis
Correlation and regression analyses were carried out with the Excel software 2024 package (Academic License, Microsoft of Portugal). Sigma Plot 16.0 (2011–2012 Systat Software Inc., Hounslow, Middlesex, UK) was purchased to draw graphs in this manuscript. Experimental results are means of three parallel measurements, and the results are presented as mean values ± standard deviation (SD). Statistical analysis was carried out by using one-way analysis of variance (ANOVA). The significance of the p-value is represented with asterisks (a,b,c,d,e,f) which indicate significance of the p-value less than 0.1,0.05, 0.01, 0.005 and 0.001 respectively.
3. Results and Discussion
3.1. Phytochemical Assays of Plant Extracts
Several phytochemical parameters were analysed in these plant extracts as shown in Table 1. The highest levels of TPC and SOD were obtained with aqueous plant extraction at 40ºC and for 5 days of incubation whereas leaves extraction with water at 25º C for 5 days of incubation revealed highest levels of reducing power, ABTS and DPPH. The levels of TFC and superoxide radical scavenging activity were highest with plant extraction with hexane, 25ºC and 0 days of incubation and with hexane, 25ºC and 5 days of incubation, respectively. The data of phytochemical assays from Tithonia diversifolia plant extracts published in the literature revealed 52 and 59 μmoles/L of aqueous plant extracts for TPC and TFC, respectively [7]. These data are difficult to compare with the data of the present work as the units are different for these phytochemical assays. Similar data on TPC, TFC an antioxidant levels have been published for aqueous extracts of Tithonia diversifolia which are difficult to compare with the data reported in the present work due to differences in units of the results as well as the methodology used [9,23,24].
3.2. Optimization of Extraction of Secondary Metabolites from Plant Extracts
In order to optimize the extraction of secondary metabolites from plant leaves, a systematic study was developed to analyze several factors that affect the extraction of these compounds. The experimental design was conducted using a 23-way full factorial design, with a total of eight duplicate experiments. After the experimental runs, statistical significance, the effect of each variable, and multivariate interactions on extraction of secondary metabolites were evaluated (Table 2).
The data in Table 2 summarized the statistical analysis of variance (ANOVA). The F-value of 2558.67 indicated that the model is significant and that there was only a 0.01% probability of such an F-value being due to noise. The coefficient of determination R2 = 0.9996 indicated that there was a statistical correlation between the response and the variables considered and that only 0.01% of the total variation was not explained by the model. The statistical analysis shows that the significant factors for phenolic compounds extraction are all considered: the temperature (variable A), the time (variable B), the solvent (variable C), and the interactions between the variables AB, AC, BC, and ABC. However, the time, the solvent and the interaction between the temperature and the solvent exhibited the greatest effect. The following empirical equation was obtained to estimate the extraction of phenolic compounds from plant extracts:
where: y is the concentration of phenolic compounds, A is the temperature, B is the time and C is the solvent. This equation was used to facilitate plotting the response surfaces which are represented in Figure 3A,B.
y = 18,88+5,12xA+8,21xB-10,21xC+7,58xAB-9,20xAC-6,33xBC-6,42xABC
Figure 1.
A- Three-dimensional representation of the interaction of extraction/incubation time and temperature of incubation on the extraction of phenolic compounds by using water as solvent. B- Three-dimensional representation of the interaction of extraction/incubation time and temperature of incubation on the extraction of phenolic compounds by using hexane as solvent.
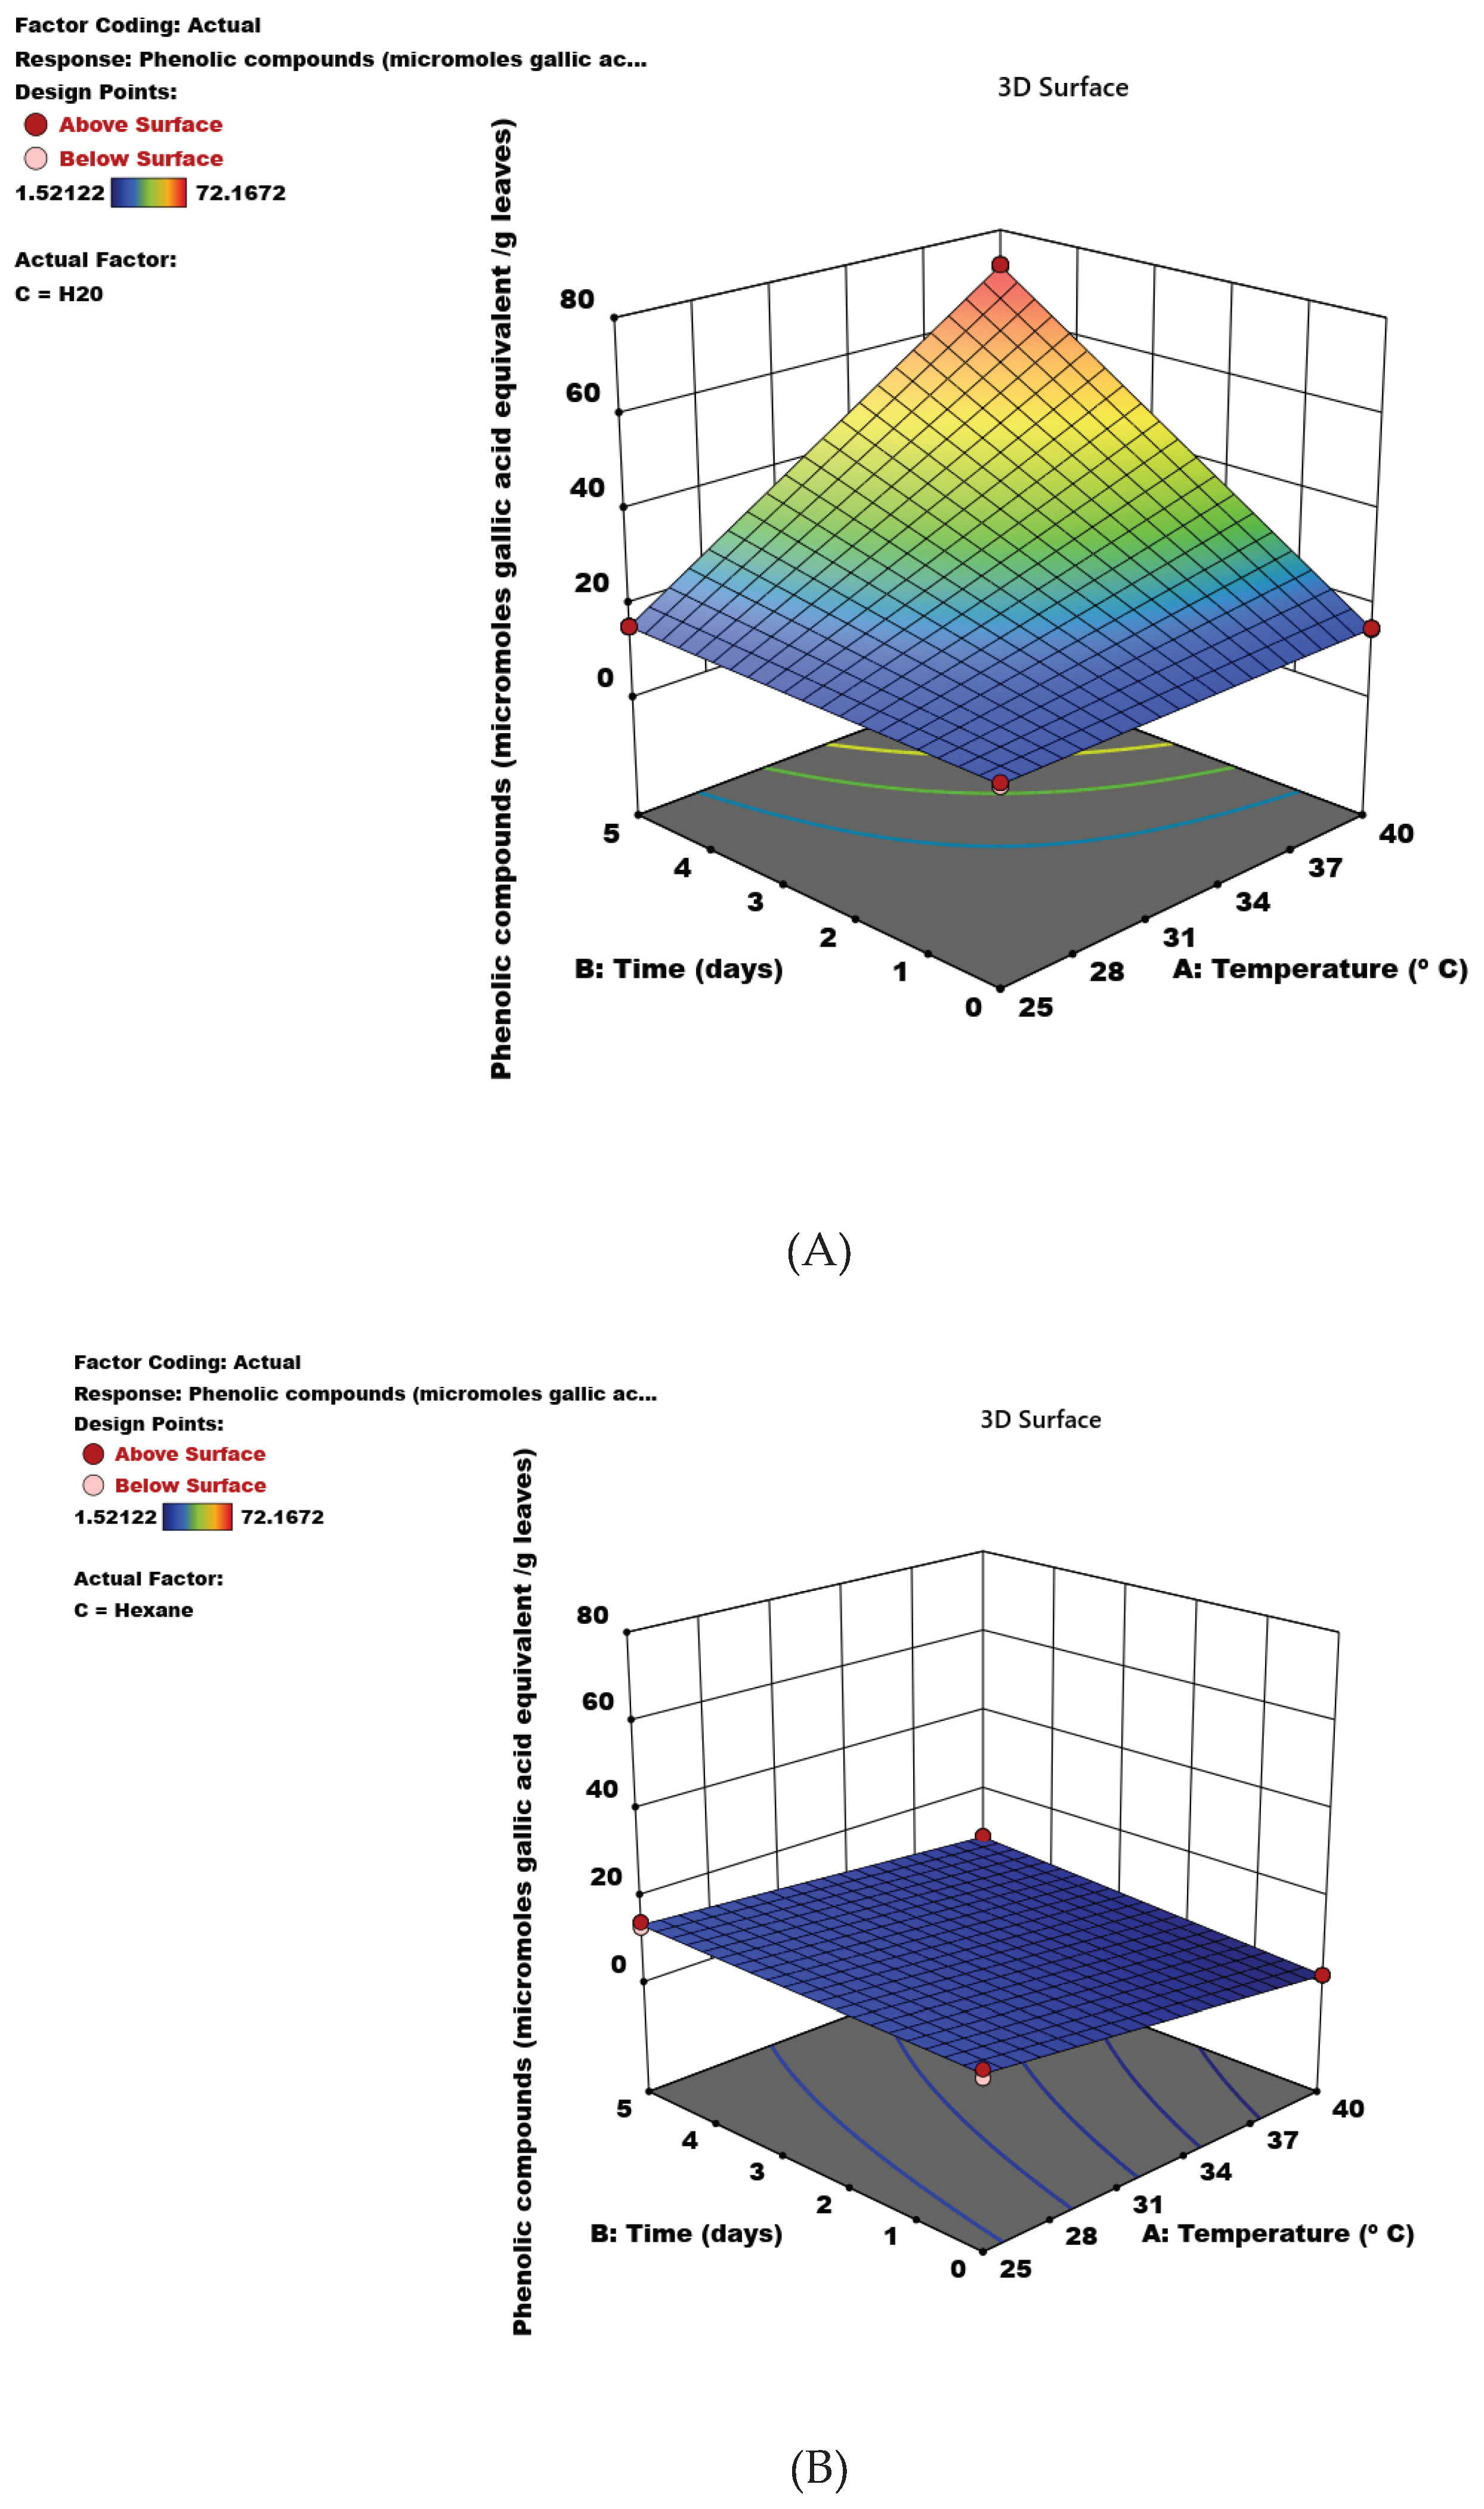
The data in Figure 1A,B exhibited the effect of optimized factors on phenolic compounds extraction from plant extracts. The highest extraction of phenolic compounds (i.e 72.16 μmoles gallic acid equivalent/g leaves)) was obtained at 40ºC, in H20 and 5 days of incubation (Figure 1A). Regarding the experimental planning of secondary metabolite extraction from these plant leaves, there is only one published report in the literature about optimization of extraction by using a 22 factorial design matrix for this plant extract [9]. Therefore, the present data of experimental planning is difficult to compare with published data for TPC and TFC due to different factorial design matrixes as well as different units presented [9],
3.3. Synchronous Fluorescence Spectroscopy (SFS)
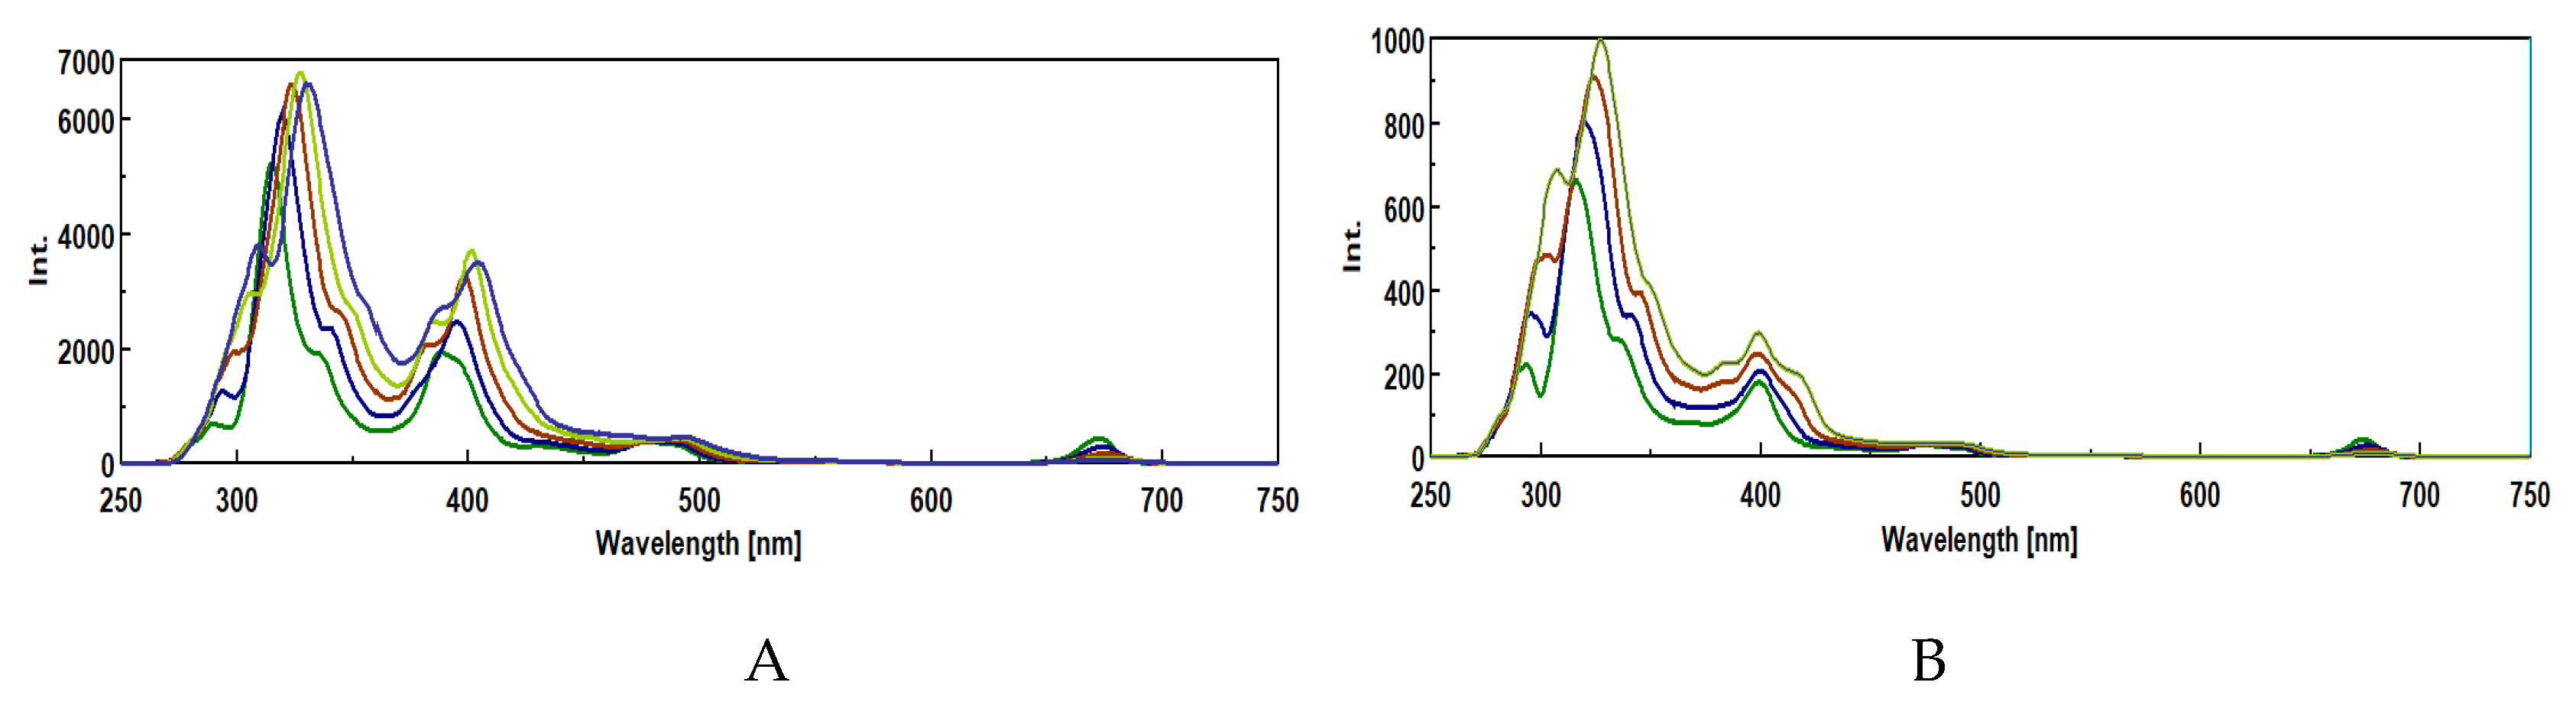
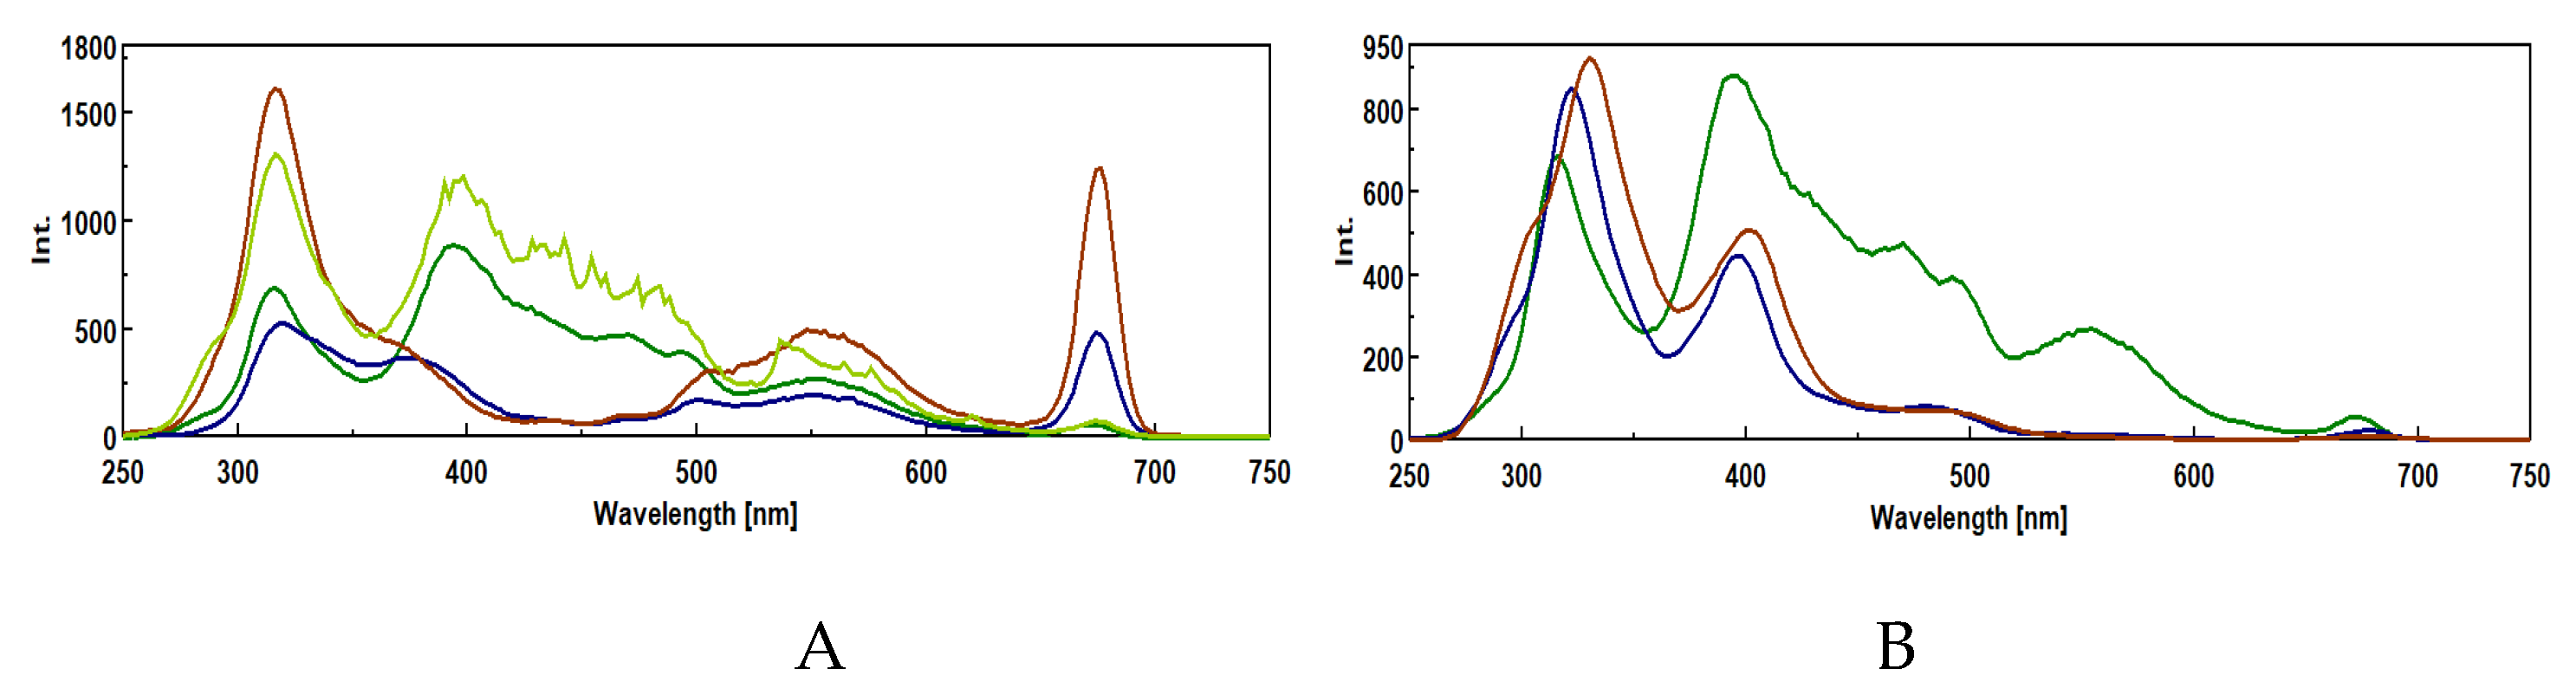
SFS involved simultaneous scans of both the excitation and emission wavelengths of a sample at a constant wavelength difference (Δλ) to produce a simple spectrum. It exhibits sharper and narrower spectra, and it has several advantages over conventional fluorescence spectroscopy such as eliminating light scattering interference, amplifying the small spectral features, enhancing selectivity and improving spectral resolution. The Δλ in SFS is an important parameter to obtain the best resolution, sensitivity and spectral shape for a specific analyte. To the author’s knowledge, there ae no reports in the literature on intrinsic fluorescence spectroscopy of secondary metabolites from Tithonia diversifolia leaves. Moreover, there are very few published reports on fluorescence properties of secondary metabolites in plant leaves extracts in general [13,14]. Therefore, synchronous fluorescence spectroscopy (SFS) of secondary metabolites from this plant extract was investigated in a spectrofluorometer with different Δλ at high and medium sensitivity for leaves extracts with hexane at 25 and 40 ºC, respectively (Figure 2A,B). In both cases, there are several fluorescence peaks at 290, 320, 345, 400, 490 and 675 nm which exhibited an increase in fluorescence as a function of Δλ. The emission peaks in the region of 280–320 nm may be due to the presence of a protein moiety containing aromatic amino acids such as tyrosine and tryptophan residues. As far as the spectral region of 325-450 nm is concerned, these emission peaks may be due to phenolic compounds, hydroxycinnamic acids and stilbenes whereas in the region 500-550 nm, flavanols, flavonoids and alkaloids are apparently responsible for these peaks. Finally, the emission peak at 675 nm is due to the presence of chlorophyll in chloroplasts [25,26]
Figure 2.
-Intrinsic synchronous fluorescence spectra with different Δλ of secondary metabolites from plant extracts. A Plant extract with hexane at 25ºC and 0 days at high sensitivity as follows: ___ 10 nm; ___ 15nm; ___ 20 nm; ___ 25 nm and ___ 30 nm Δλ; B− Plant extract with hexane at 40ºC and 0 days at medium sensitivity as follows: ___ 10 nm; ___ 15nm; ___ 20 nm; and ___ 25 nm.
The data in Figure 3A,B has revealed increase in fluorescence intensity in all emission peaks as a function of Δλ except the chlorophyll peak that has exhibited a decrease in fluorescence. It is important to point out that aqueous extract exhibited a different emission pattern with fluorescence peaks at 490, 560, 675 nm (Figure 3B).
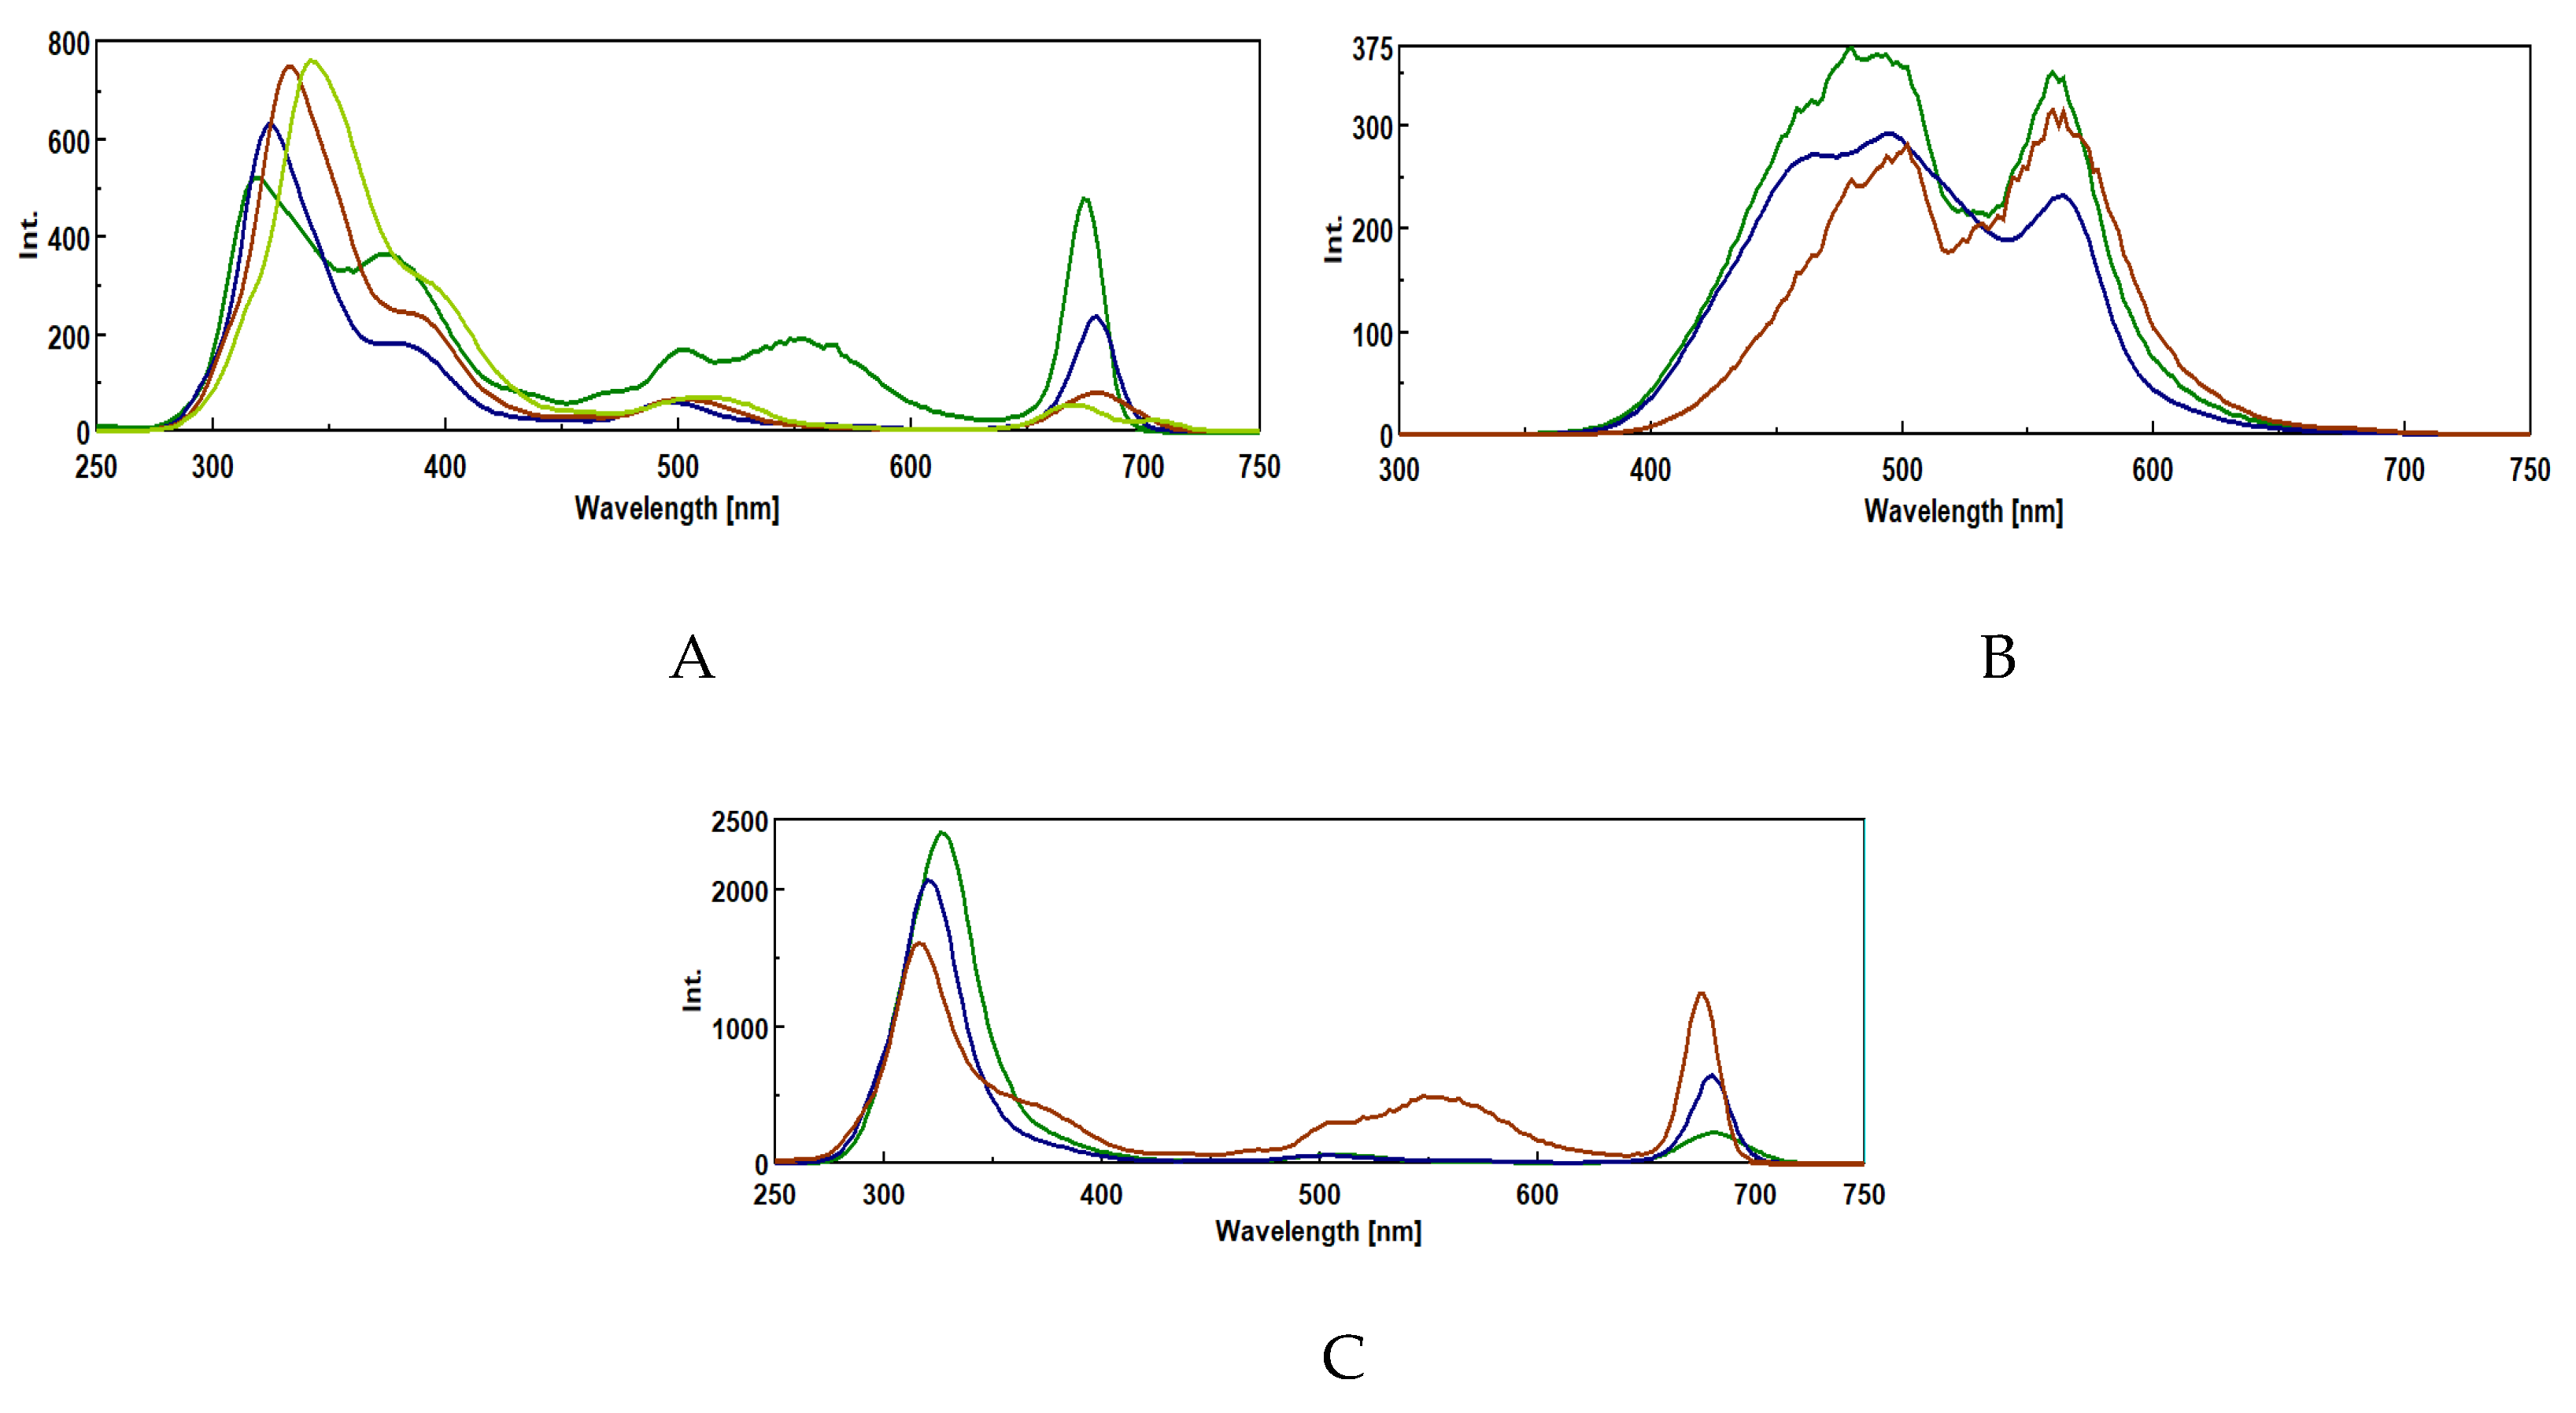
These secondary metabolites were analysed by SFS which were extracted with aqueous and hexane solutions at different temperatures and incubation times as shown in Figure 4. The data in Figure 4A,B exhibited different fluorescence emission profiles of aqueous extracts compared with hexane extracts (Figure 4C) as emission peaks were observed at 490 and 560nm for Figure 4A and 490, 540 and 565 nm for Figure 4B.
Figure 3.
Intrinsic synchronous fluorescence spectra with different Δλ of secondary metabolites from plant extracts. A Plant extract with hexane at 40ºC and 5 days at medium sensitivity as follows: ___ 30 nm; ___ 25nm; ___ 20 nm; ___ 15 nm and ___ 5 nm Δλ; B− Plant extract with H20 at 25ºC and 0 days at high sensitivity as follows: ___ 10 nm; ___ 15nm; ___ 20 nm; and ___ 25 nm and ___ 30 nm Δλ.
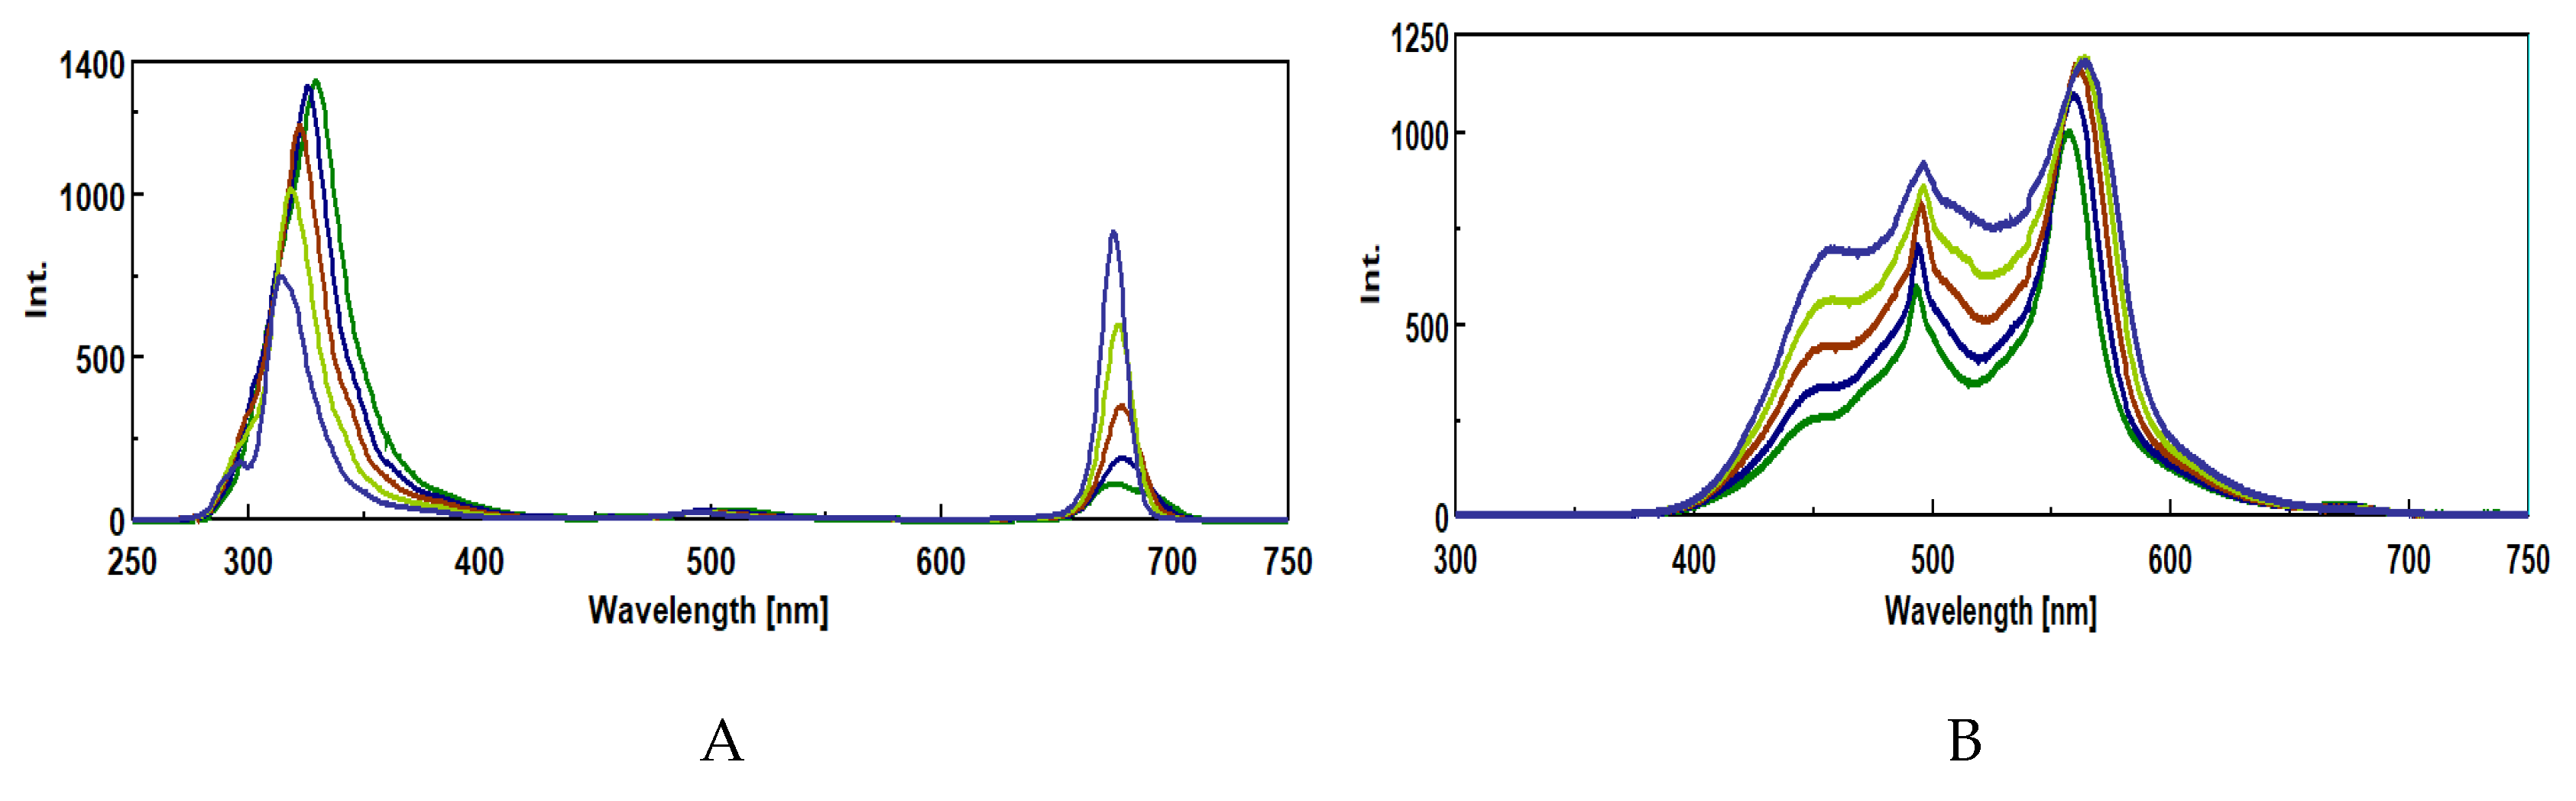
Figure 4.
- Intrinsic synchronous fluorescence spectra with different Δλ of secondary metabolites from plant extracts. A Plant extract with H20 at 40ºC and 0 days at low sensitivity as follows: ___ 10 nm; ___ 15nm; ___ 20 nm; ___ 25 nm and ___ 30 nm ; B− Plant extract with H20 at at medium sensitivity and 5 nm Δλ as follows: ___ 25 ºC and 0 days; ___ 40 ºC and 0 days ; ___ and 40 ºC and 5 days ___ and C- plant extracts with hexane at 10 nm Δλ and medium sensitivity as follows: ___ 25 ºC and 5 days; ___ 40 ºC and 0 days ; ___ 40 ºC and 5 days.
Although there are few reports in the literature about SFS of plant materials, this analytical technique is very useful as a diagnostic tool for detection of physiological conditions of plants, nutrients, phytochemicals, environmental pressures and diseases due to its remarkable high sensitivity and specificity [25,26].
3.3. Intrinsic Synchronous Phosphorescence Spectroscopy (SPS)
Regarding SPS, it involves the delayed and often long-lasting emission of light from a phosphorescent material that takes place after it has been excited by a light source. The main difference between fluorescence and phosphorescence is because the fact that the former is a fast, active measurement technique, whereas synchronous phosphorescence describes a property of slow-decaying light emission.
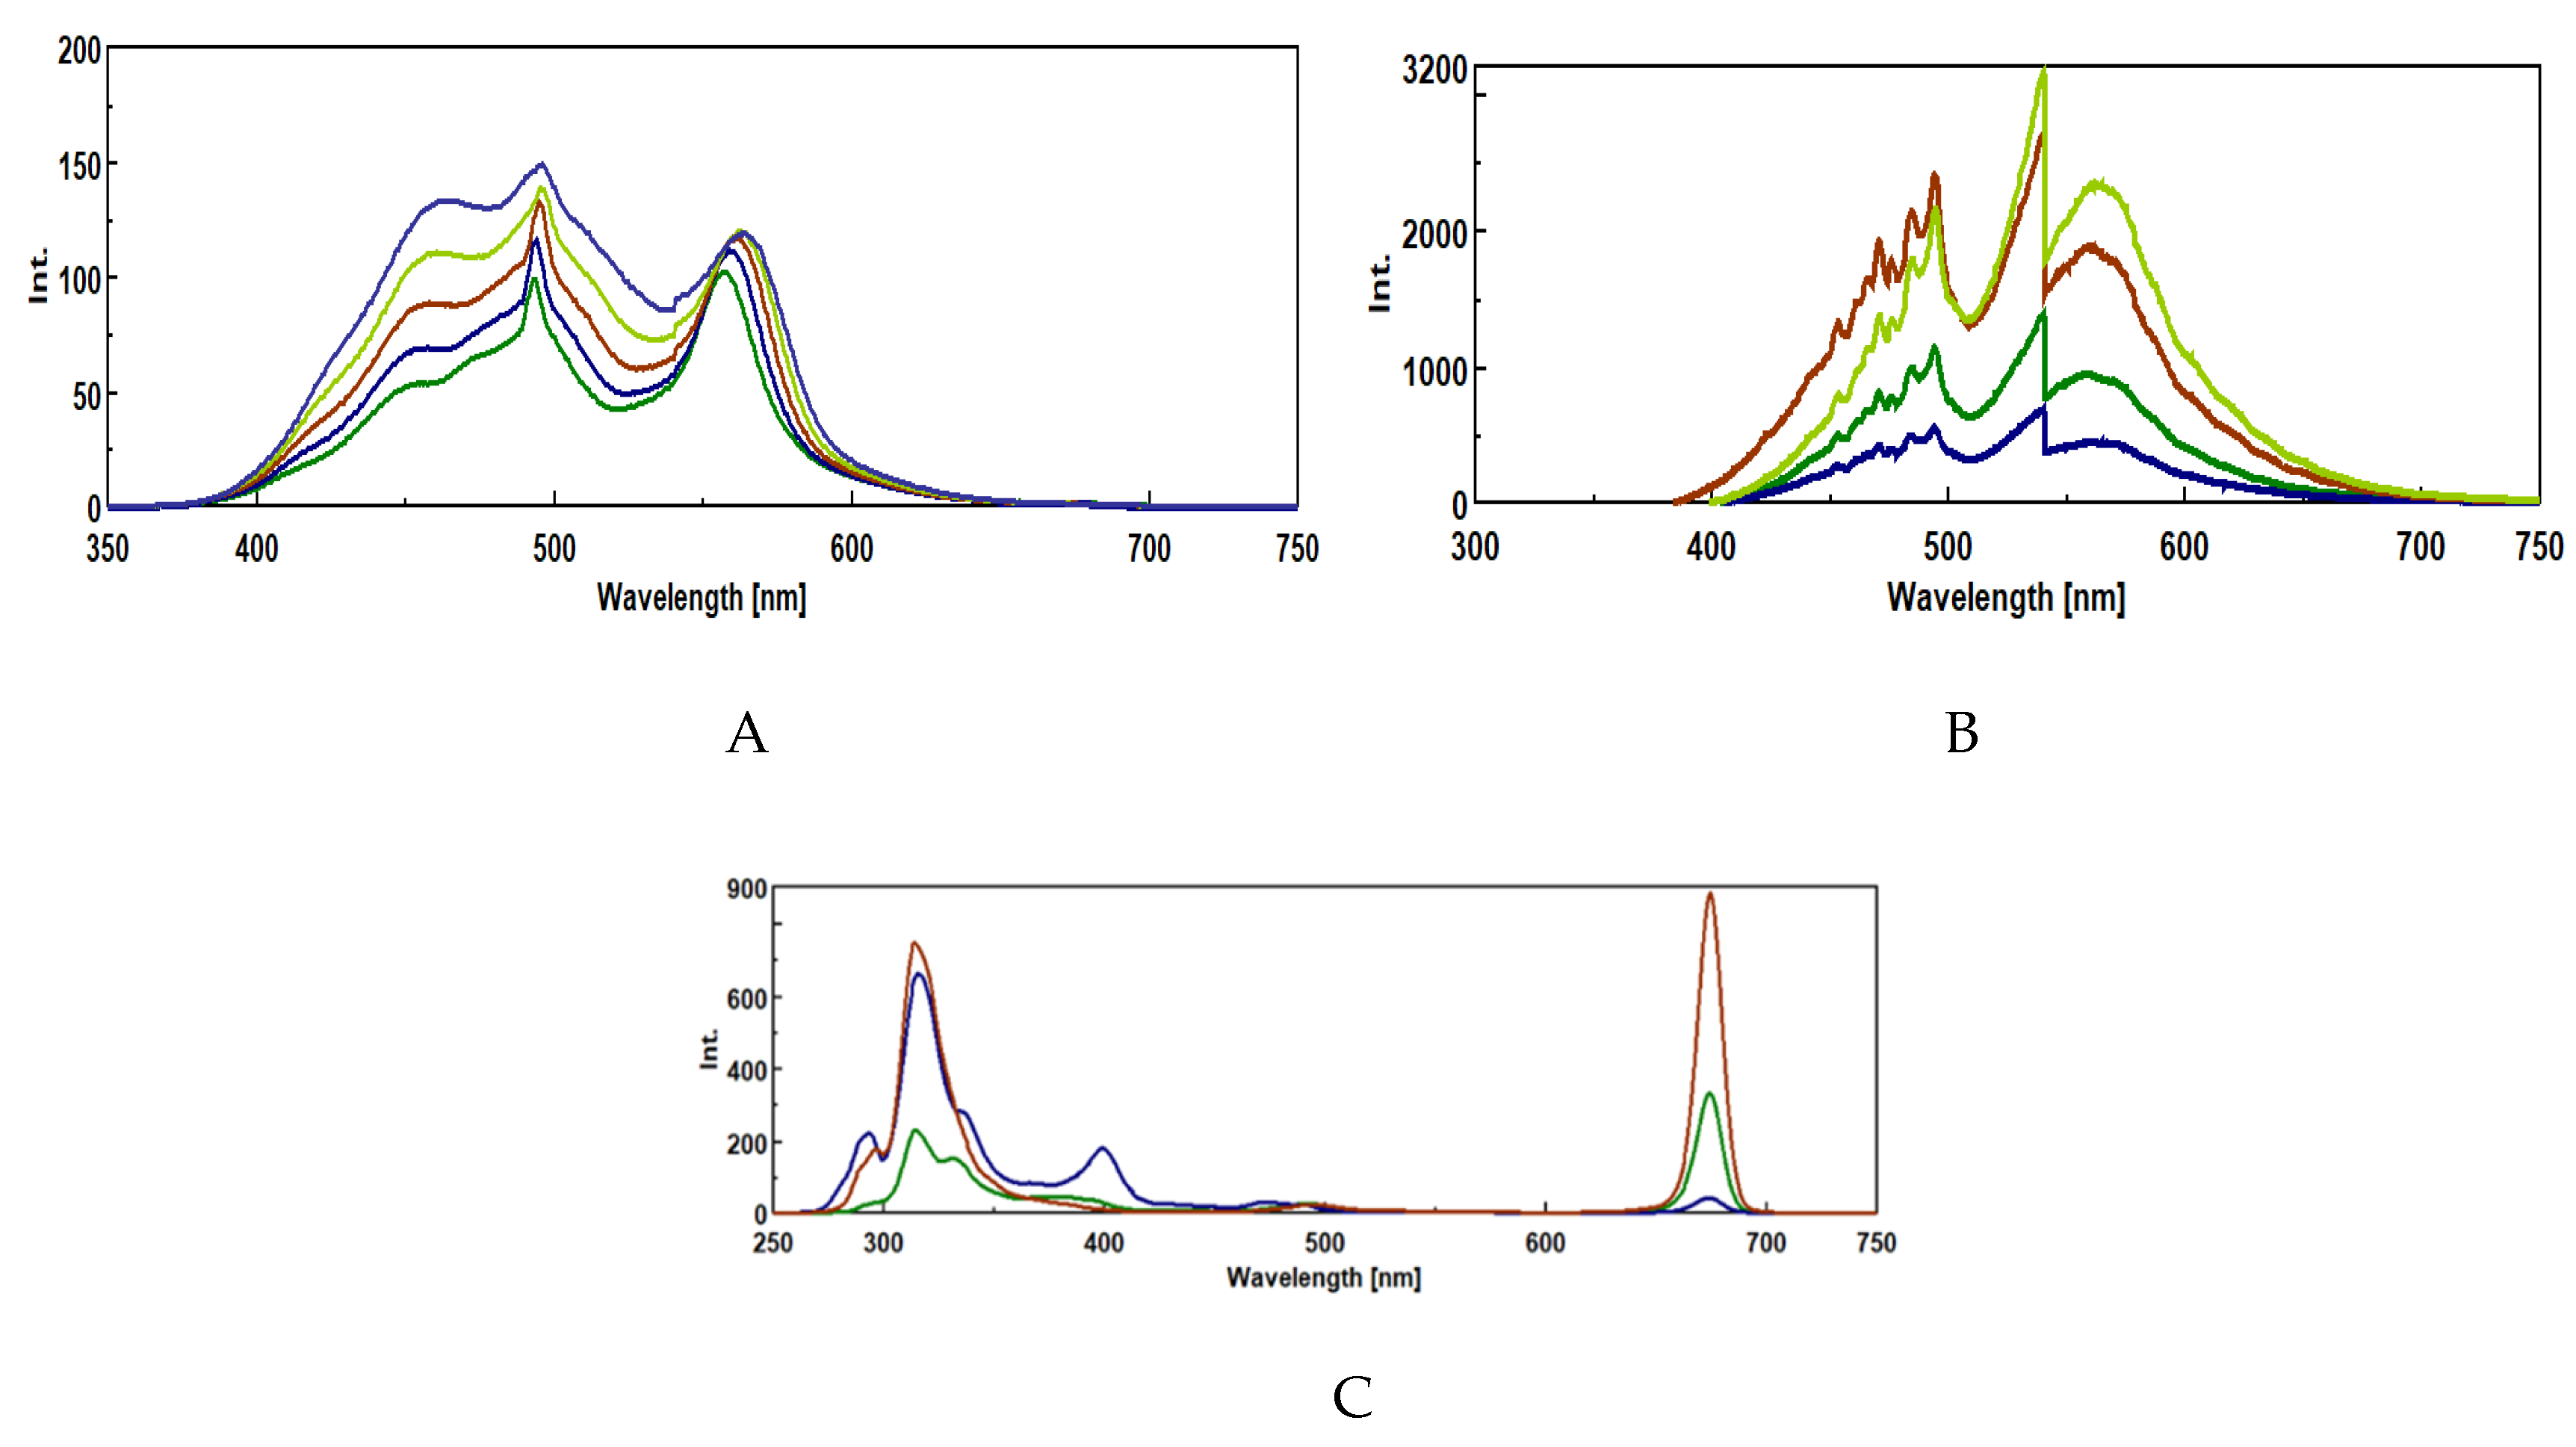
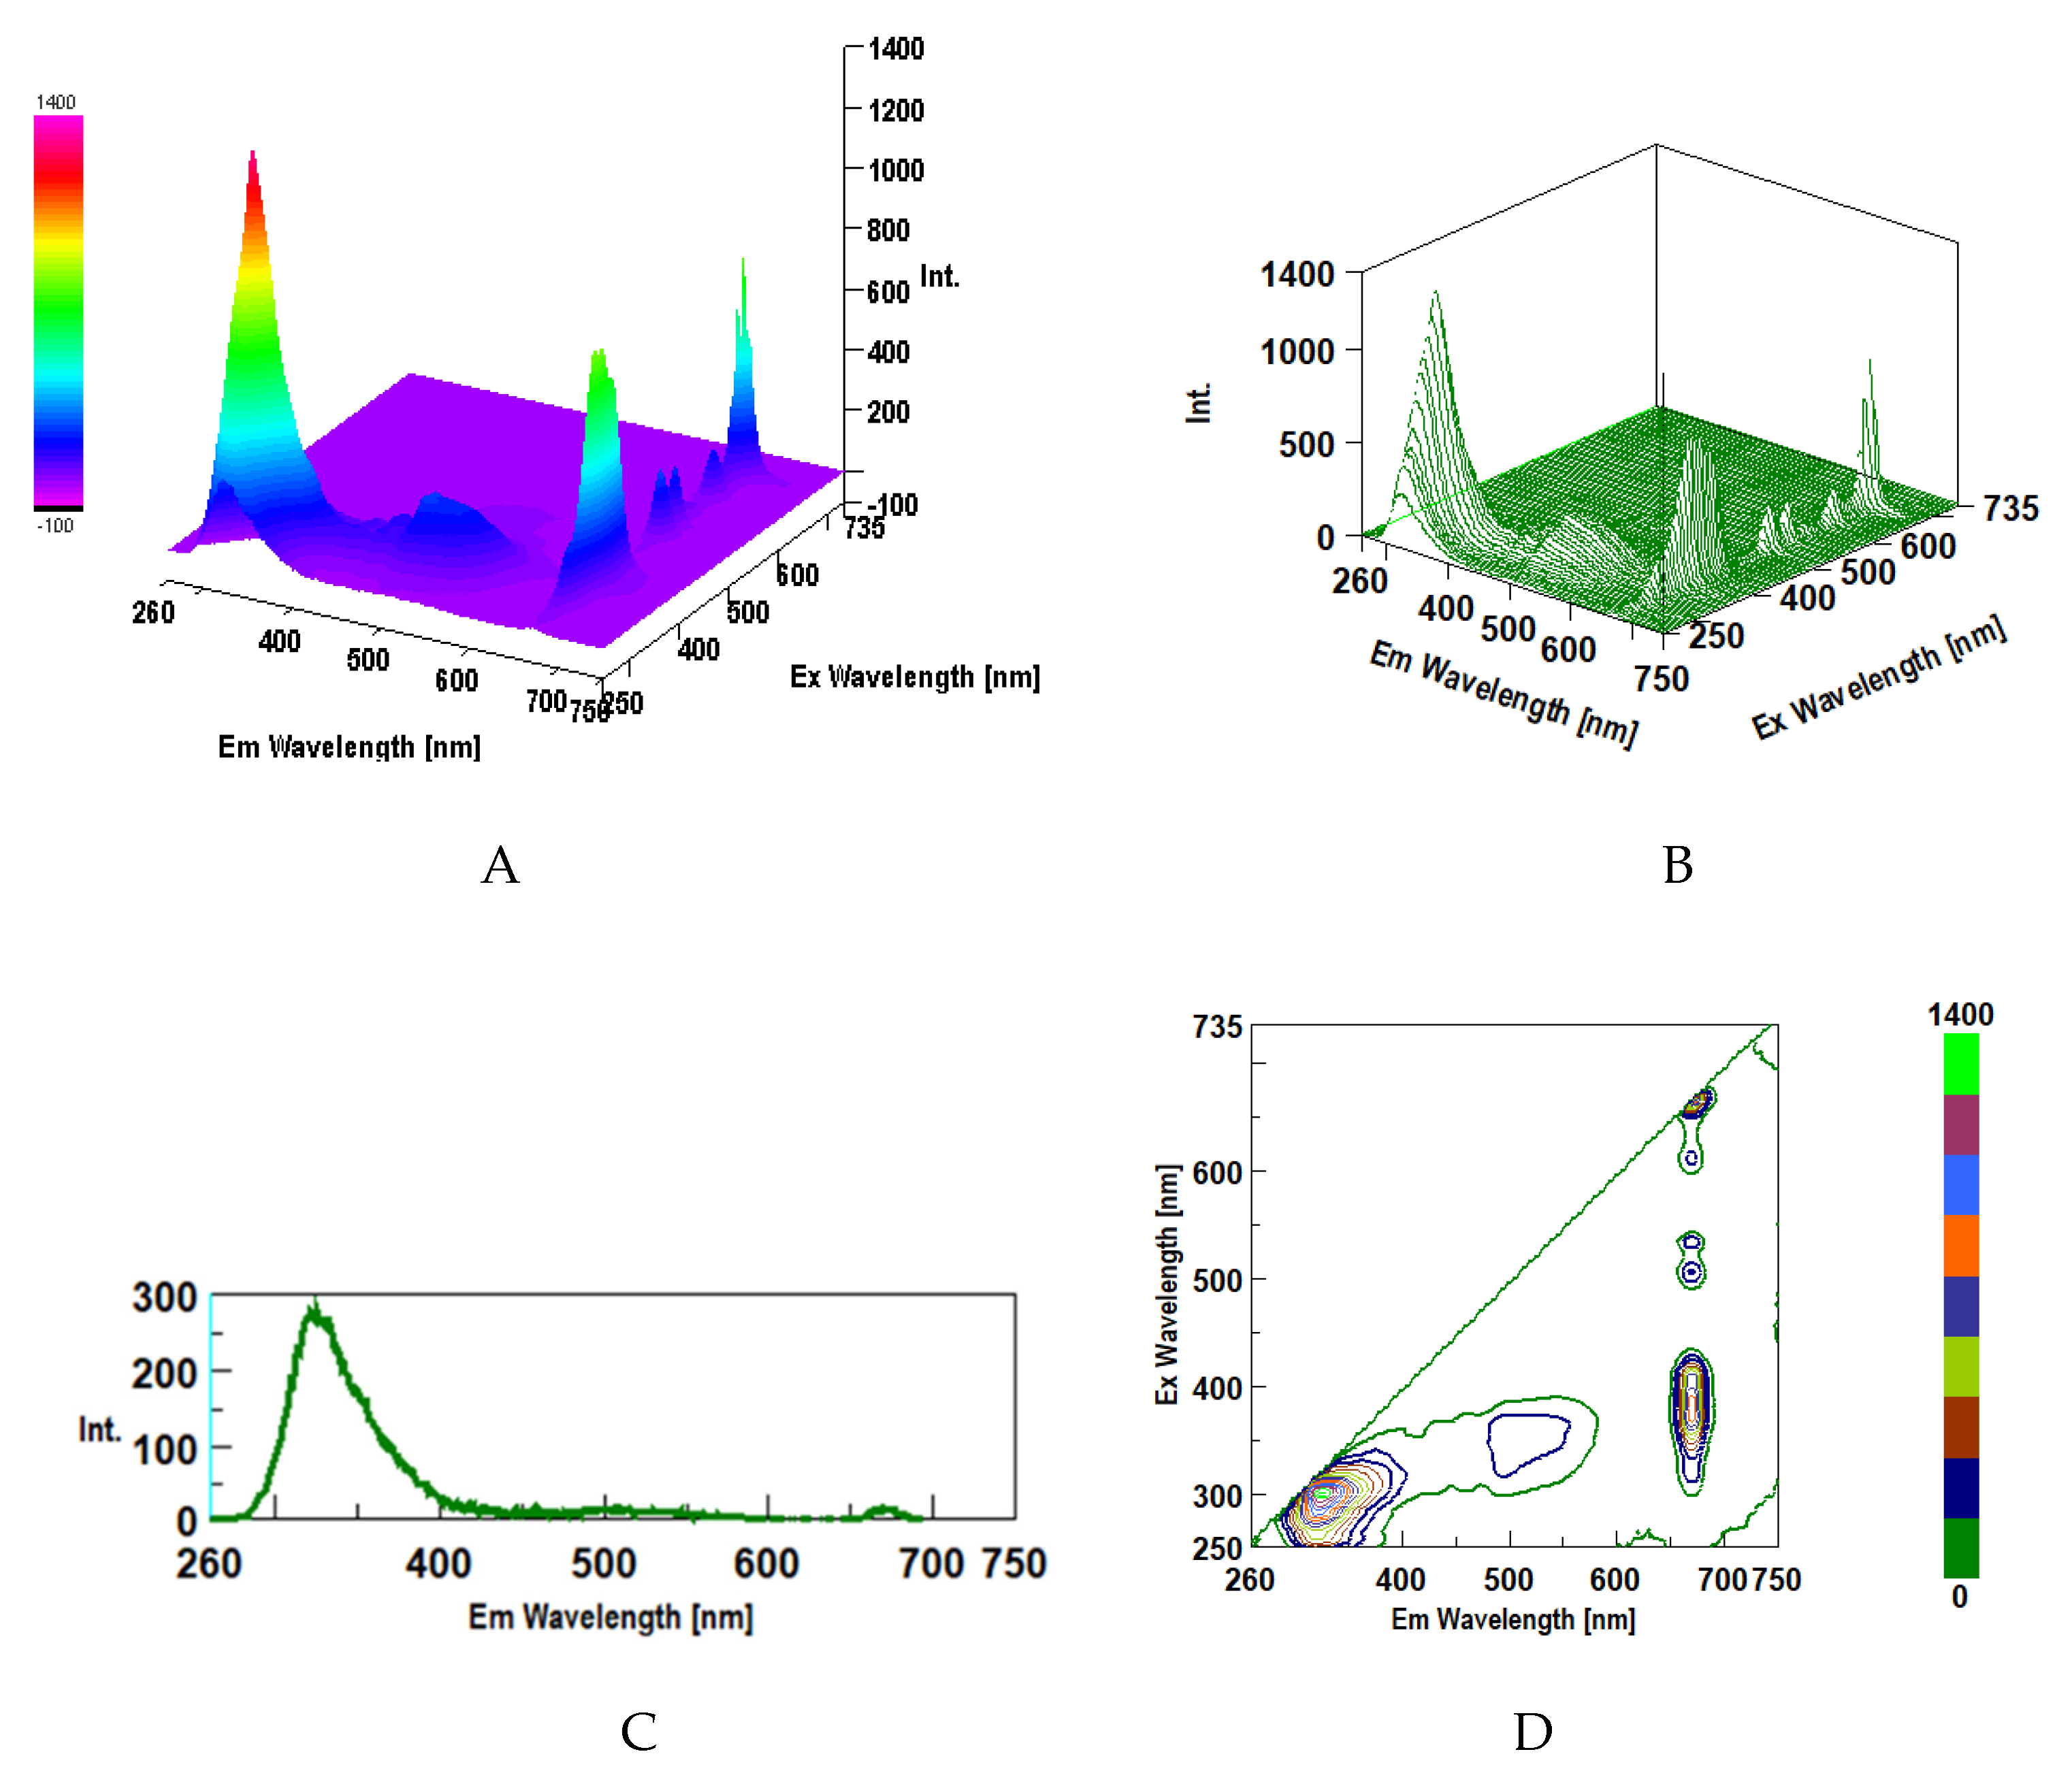
The Δλ in SPS is an important parameter to obtain the best resolution, sensitivity and spectral shape for a specific analyte. Therefore, Figure 5 have revealed several fluorescence peaks of SPS at 325, 390, 490, 550 and 675 nm by using hexane extracts. The data in Figure 5A exhibited several SPF spectra at 10 nm of Δλ for several plant leaves extracts which revealed the highest fluorescence peaks with hexane extract at 40 ºC for 5 days of incubation. On the other hand, the data presented in Figure 5B revealed an increase in fluorescence at low Δλ both at 400 and 675 nm
Figure 5.
Intrinsic synchronous phosphorescence spectra of secondary metabolites from plant extracts. A Plant extracts with hexane at low sensitivity and 10 nm Δλ as follows: ___ 25 ºC and 0 days; ___ ;25 ºC and 5 days ___ 40 ºC and 5 days and ___ 40 ºC and 0 days; B- Plant extracts with hexane at 25 ºC and 0 days as follows: ___ 10 nm Δλ ; ___ 20 nm Δλ and ___ 30 nm Δλ ...
The data in Figure 6 exhibited several SPS spectra for various aqueous and organic plant extracts. It is important to point out that the aqueous extracts revealed only two fluorescence peaks at 500 and 560 nm (Figure 6B) compared with several peaks for hexane extract (Figure 6A,C).
Figure 6.
Intrinsic synchronous phosphorescence spectra of secondary metabolites from plant extracts. A- Plant extracts with hexane at 25 ºC and 5 days at low sensitivity as follows: ___ 10 nm Δλ ; ___ ;20 nm Δλ ___ 30 nm Δλ ___ 40 nm Δλ; B- Plant extracts with H20 at 40 ºC as follows: ___ 0 days and 20 nm Δλ ; ___ 0 days and 30 nm Δλ and ___ 5 days and 20 nm Δλ . C- Plant extracts with hexane at 40 ºC and 5 days at low sensitivity as follows: ___ 30 nm Δλ ; ___ ;20 nm Δλ ___ 10 nm Δλ..
In a similar manner to SFS, the emission peaks in the region of 280–320 nm may be due to the presence of a protein moiety containing aromatic amino acids such as tyrosine and tryptophan residues. As far as the spectral region of 325-450 nm is concerned, these emission peaks may be due to phenolic compounds, hydroxycinnamic acids and stilbenes whereas in the region 500-550 nm, flavanols, flavonoids and alkaloids are responsible for these peaks. Finally, the emission peak at 675 nm is due to chlorophyll in chloroplasts [25,26]. SPS can provide very useful information in plants namely stress detection by identification of photodynamic stress and damage in photosynthetic pigments. Moreover, SPS can be used to obtain useful structural information on the organization of pigment-protein complexes as well as to track changes in chlorophyll biosynthesis [27,28].
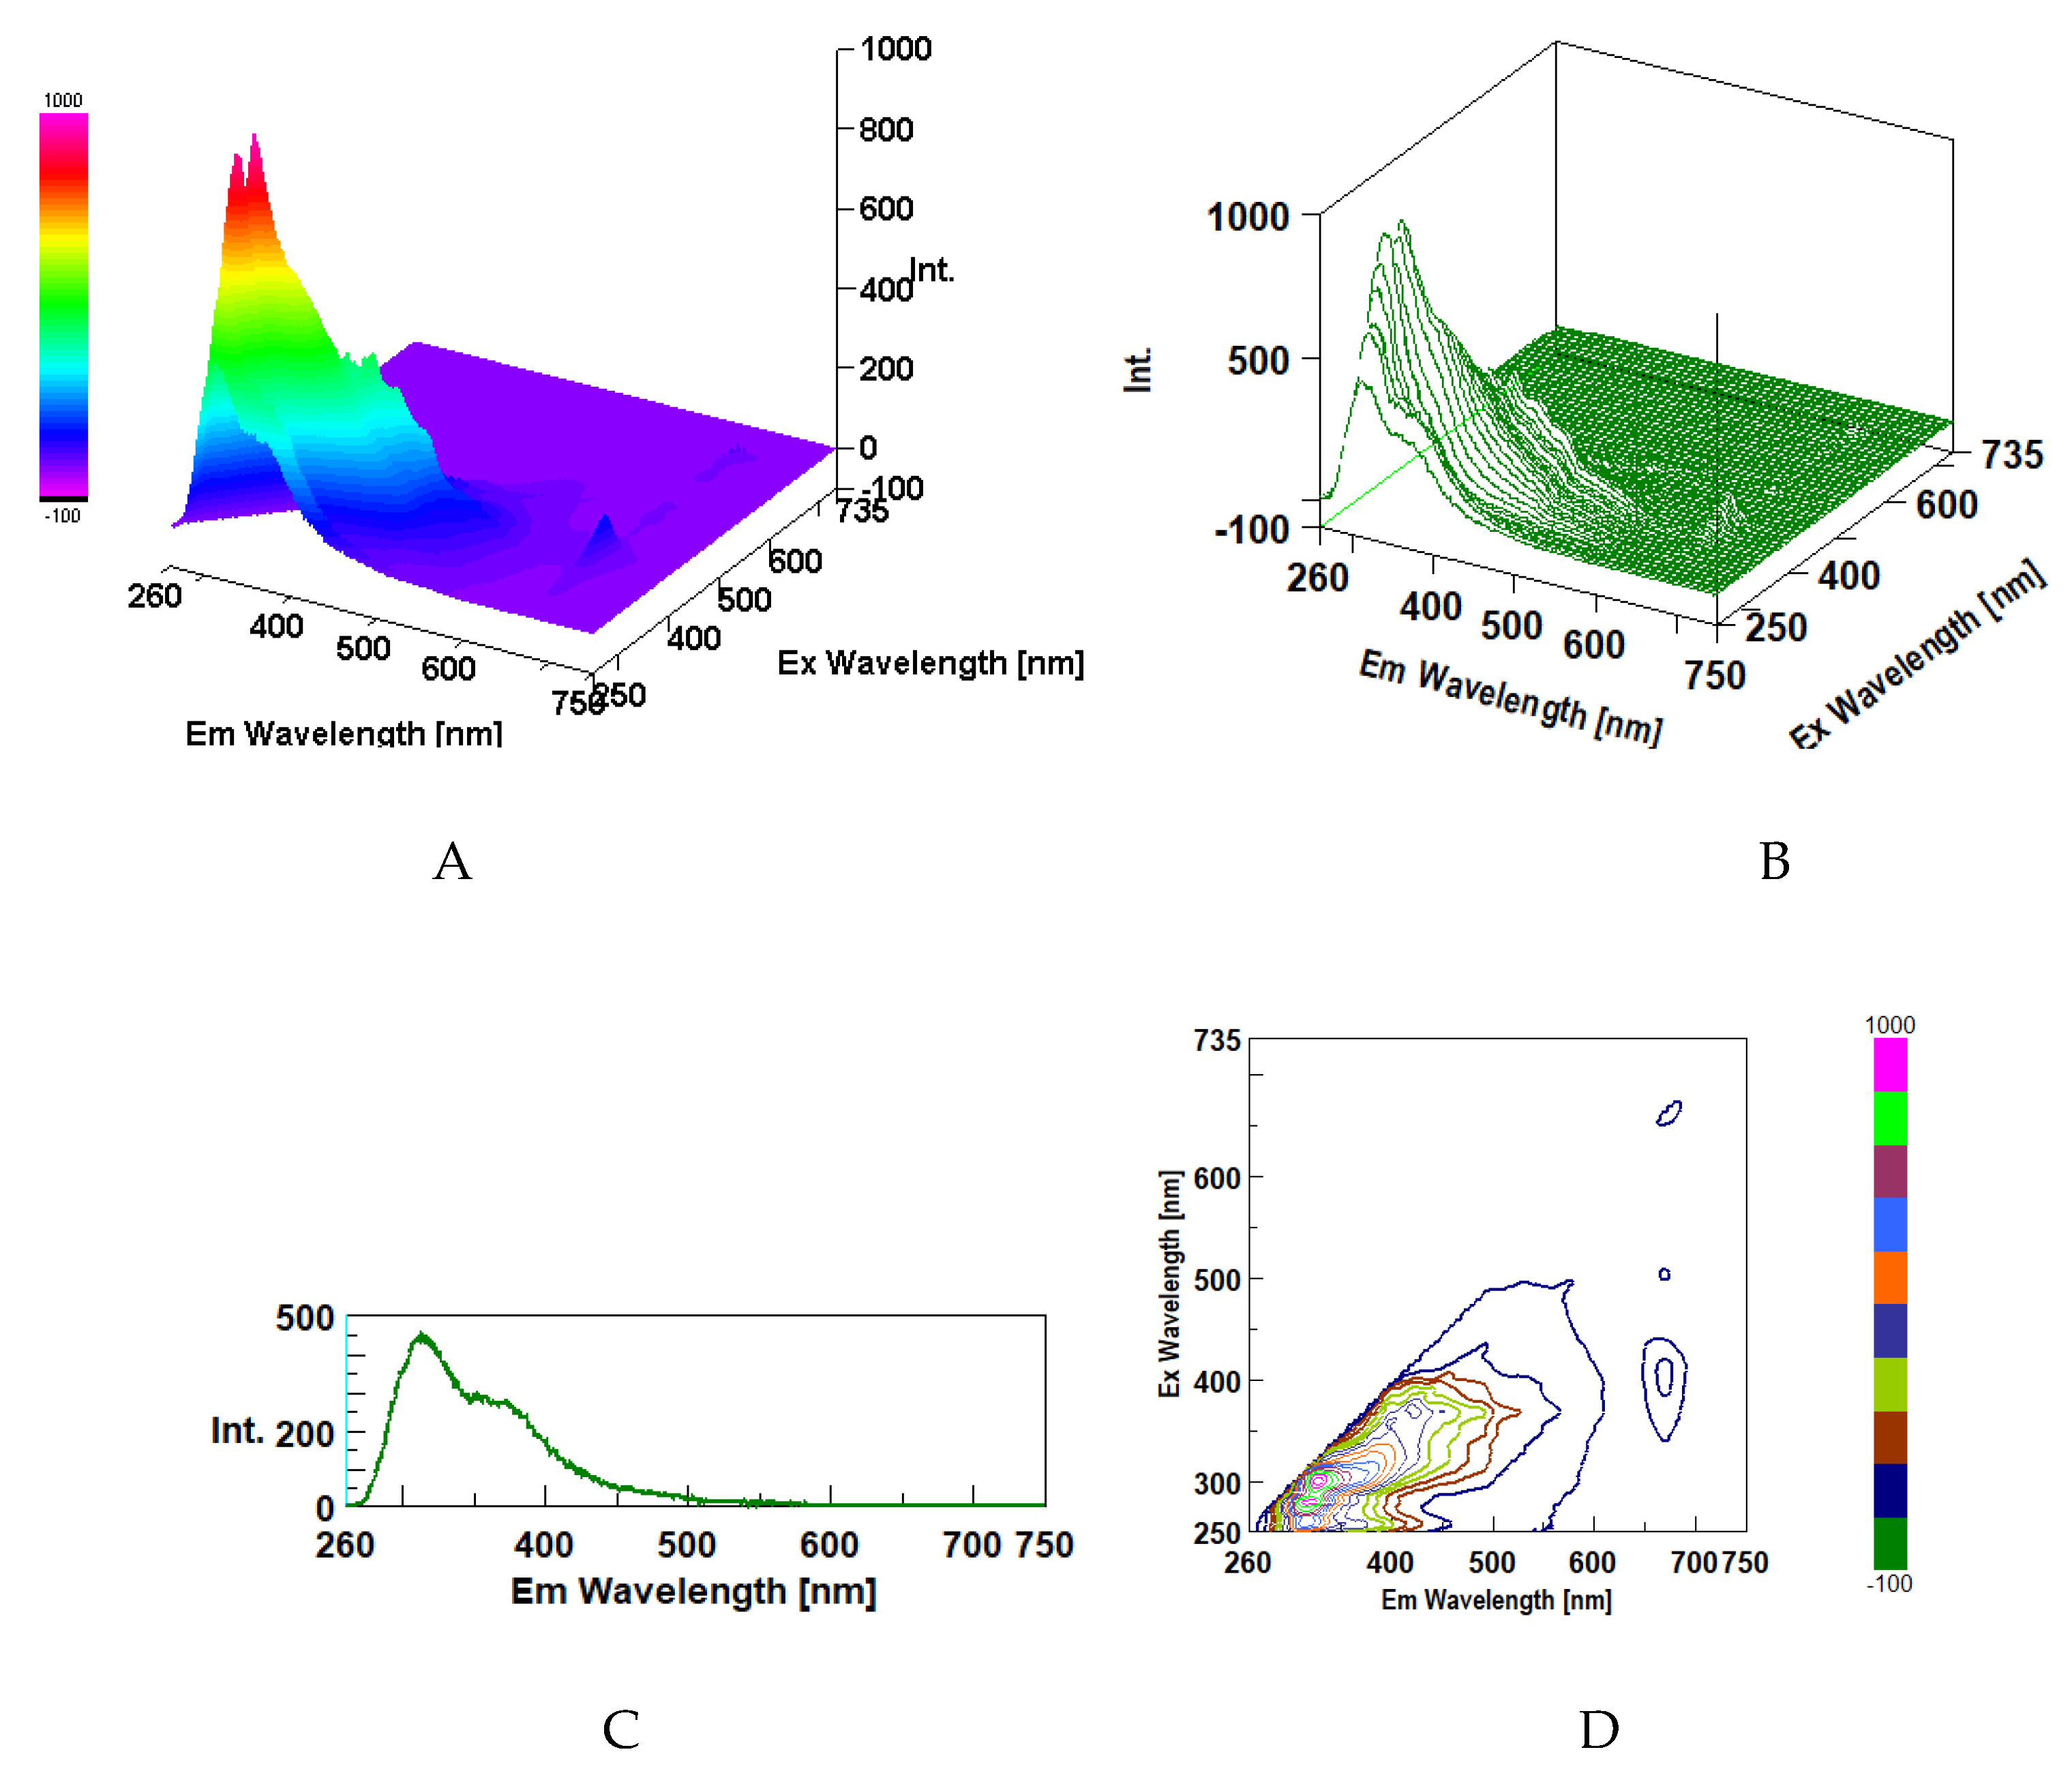
3.5. Intrinsic 3D Fluorescence Spectroscopy
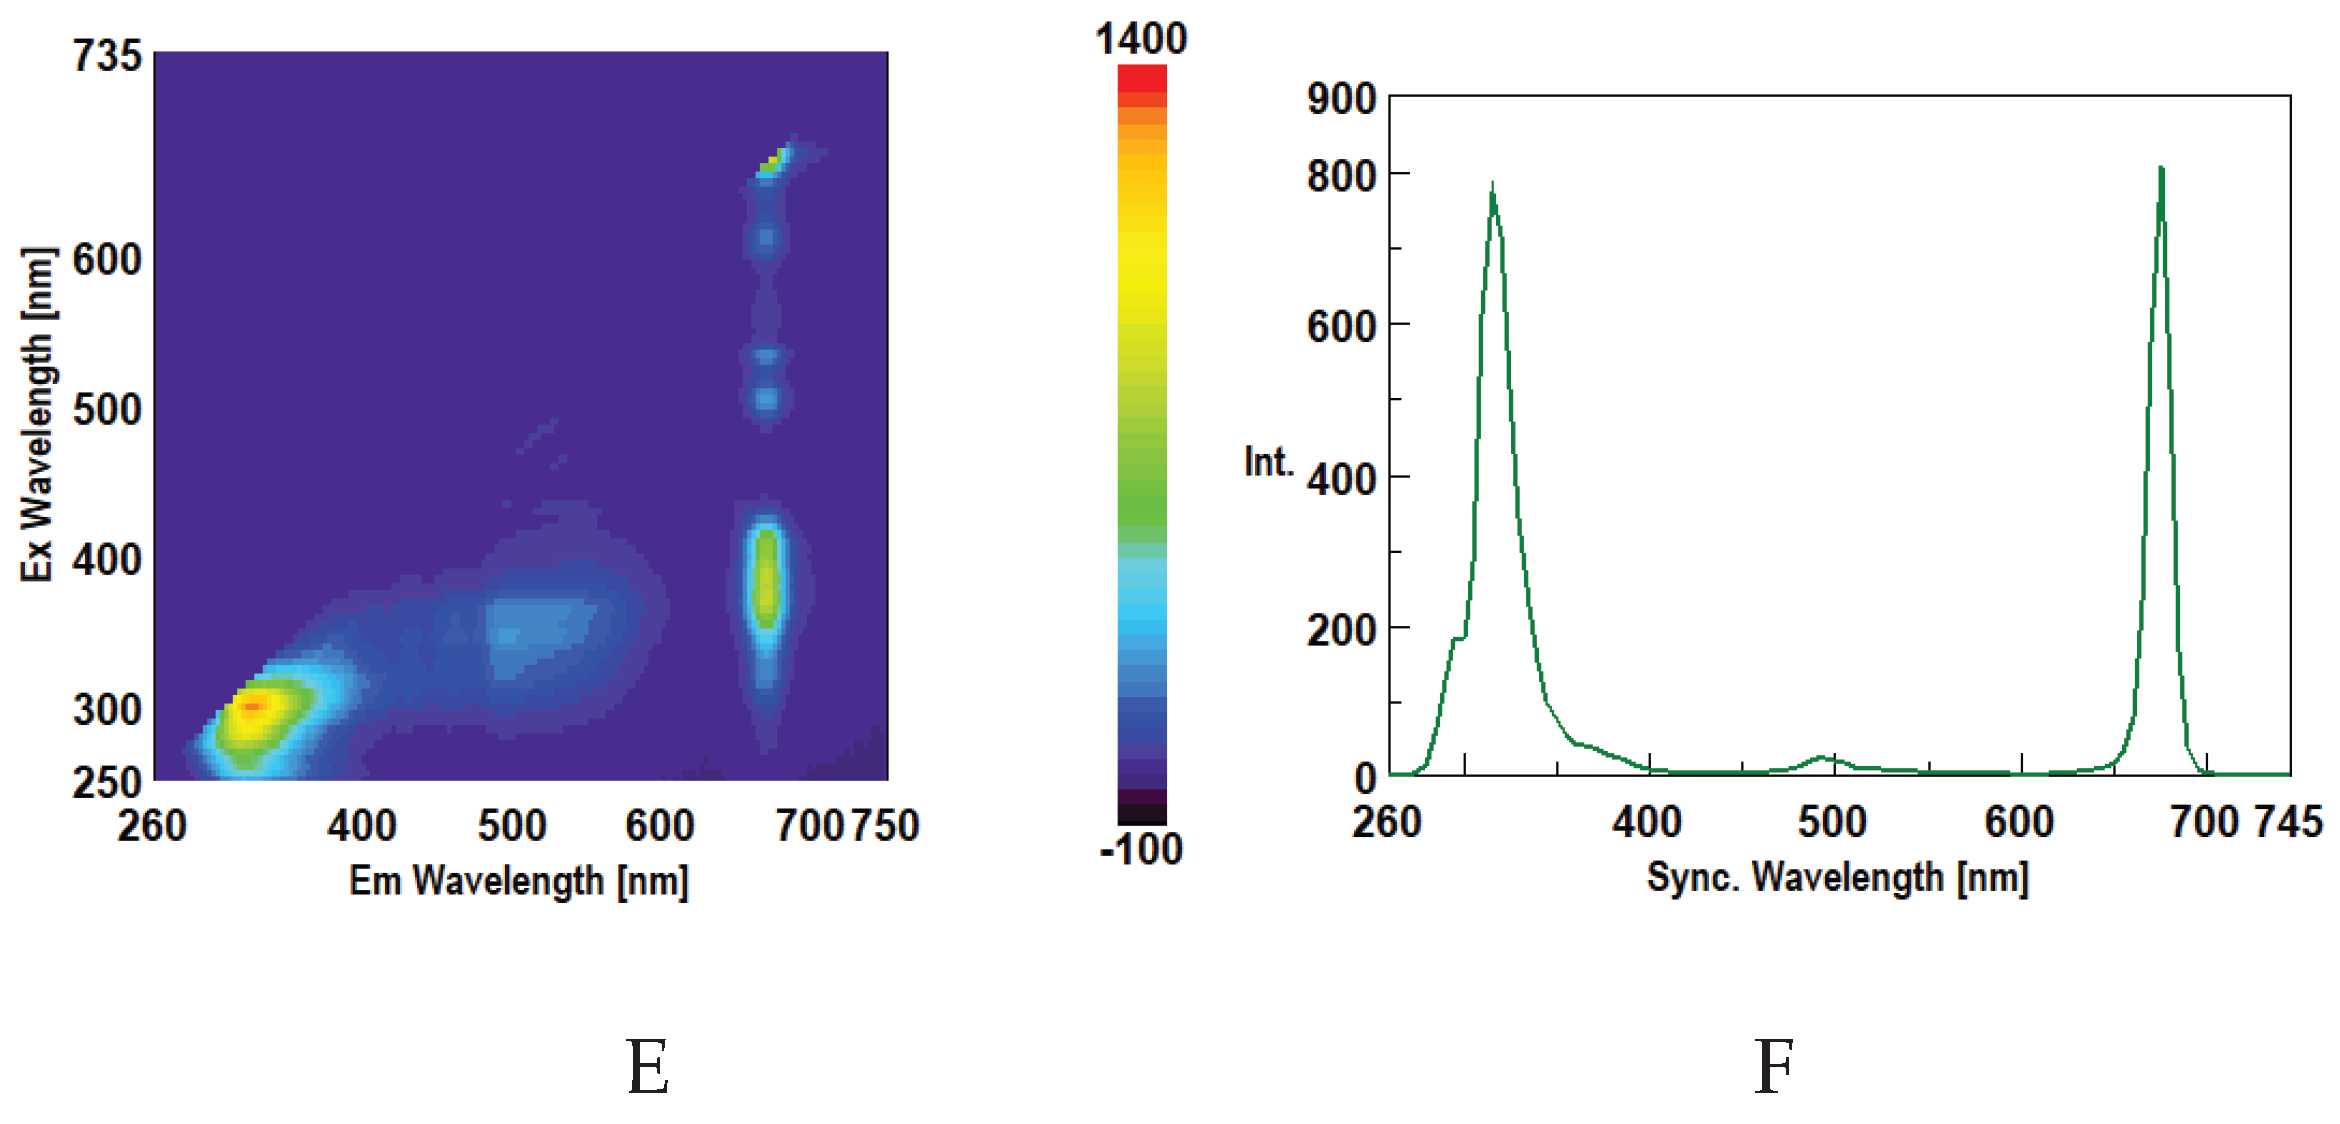
Three-dimensional fluorescence spectra are also emission–excitation matrices (EEM); therefore, by using excitation and emission monochromators successively, it is possible to obtain emission spectra for different excitations λ. Hence, a range of emission spectra at different excitations λ is obtained in this constant step, and EEM exhibited two dimensions: excitation λ and emission λ. Therefore, fluorescence matrices revealed a fluorescence map of all fluorophores present in a sample for their characterization. The data in Figure 7A–F have revealed 3-D spectra in different formats for secondary metabolites from plant extract with hexane at 40 ºC and 5 days of extraction as well as a synchronous 2D spectrum which exhibited fluorescence peaks at 290 and 675 nm as shown in Figure 7 F. The data in Figure 7 related to 3- D spectra exhibited several fluorescence peaks (i.e 290, 320, 345, 550 and 675 nm) which are in agreement with SFS data. However, the chlorophyll peak at 675 nm has been subdivided into 5 peaks with different excitation λ (Figure 7A,B,D,E) which are due to complex, overlapping contributions from different pigment-protein complexes, photosynthetic photosystems as well as their degradation products [29]. Therefore, the 3D spectra of plant extracts behaved as fingerprint region of the photosynthetic system’s state, subdividing the main emission peak at 675 nm into various components which represent different functional and structural parts of the chloroplast [29].
Figure 7.
Secondary metabolites of plant extract with hexane at 40ºC and 5 days with medium sensitivity and 10 nm of Δλ. (A)- Colour 3D view; (B) Three-dimensional spectrum view; (C) 2-D spectrum view; (D) Contour view; E- Colour view; F- Synchronous 2D spectrum.
Figure 7.
Secondary metabolites of plant extract with hexane at 40ºC and 5 days with medium sensitivity and 10 nm of Δλ. (A)- Colour 3D view; (B) Three-dimensional spectrum view; (C) 2-D spectrum view; (D) Contour view; E- Colour view; F- Synchronous 2D spectrum.
In a similar manner to Figure 7, the data in Figure 8 related to 3- D spectra exhibited several fluorescence peaks (i.e 290, 320, 345, 550 and 675 nm) which are in agreement with SFS data. However, these data in Figure 8 are due to hexane extract at 40ºC for 0 days of incubation/extraction which explains a low fluorescence peak of the chlorophyll at 675nm compared to hexane extract at 40ºC for 5 days (Figure 7).
Figure 8.
Secondary metabolites of plant extract with hexane at 40ºC and 0 days with medium sensitivity and 10 nm of Δλ. (A)- Colour 3D view; (B) Three-dimensional spectrum view; (C) 2-D spectrum view; (D) Contour view ; (E) - Colour view; (F)- Synchronous 2D spectrum.
Figure 8.
Secondary metabolites of plant extract with hexane at 40ºC and 0 days with medium sensitivity and 10 nm of Δλ. (A)- Colour 3D view; (B) Three-dimensional spectrum view; (C) 2-D spectrum view; (D) Contour view ; (E) - Colour view; (F)- Synchronous 2D spectrum.
Although the data on the 3D spectra measurement for secondary metabolites from this plant extract have not been reported in the literature, this analytical technique of 3D spectra has been widely used in research areas such as smart agriculture, identification of key bioactive substances, geographical origin of plants , evaluation of anti-oxidant capacity of plant extracts and quality control and authentication of plant-based products in terms of adulteration [29,30,31,32].
3.6. FTIR Analysis
FTIR spectra of some aqueous plant extracts at 40 ºC and incubated at 0 and 5 days were analysed by FTIR, which revealed typical absorption bands of secondary metabolites (Figure 9). The absorption band at 3350 cm-1 is due to the stretching vibration of hydroxyl (O-H) group of alcohols and phenols present in the extract. A weak absorption band at about 2900 – 2950 cm⁻¹ corresponds to C-H stretching vibrations of alkanes and alkyl groups. On the other hand, FTIR spectra exhibited a broad absorption band in the region 2300-2750 cm⁻¹ which can be attributed to N-H stretching in amine hydrochlorides or amino acids. A weak absorption band was observed at 1630- 1680 cm⁻¹ which represents either C=C unsaturated bonds or C=O stretching in carbonyl groups (either amides or ketones). A sharp absorption band at about 1350 – 1450 cm⁻¹ corresponds to C-H bending (alkanes), O-H bending and CH3 stretching of aldehydes and ketones.
Figure 9.
FTIR spectra of selected plant extracts. A- 40 ºC in H20 for 0 days and B- 40 ºC in H20 for 5 days.
Figure 9.
FTIR spectra of selected plant extracts. A- 40 ºC in H20 for 0 days and B- 40 ºC in H20 for 5 days.
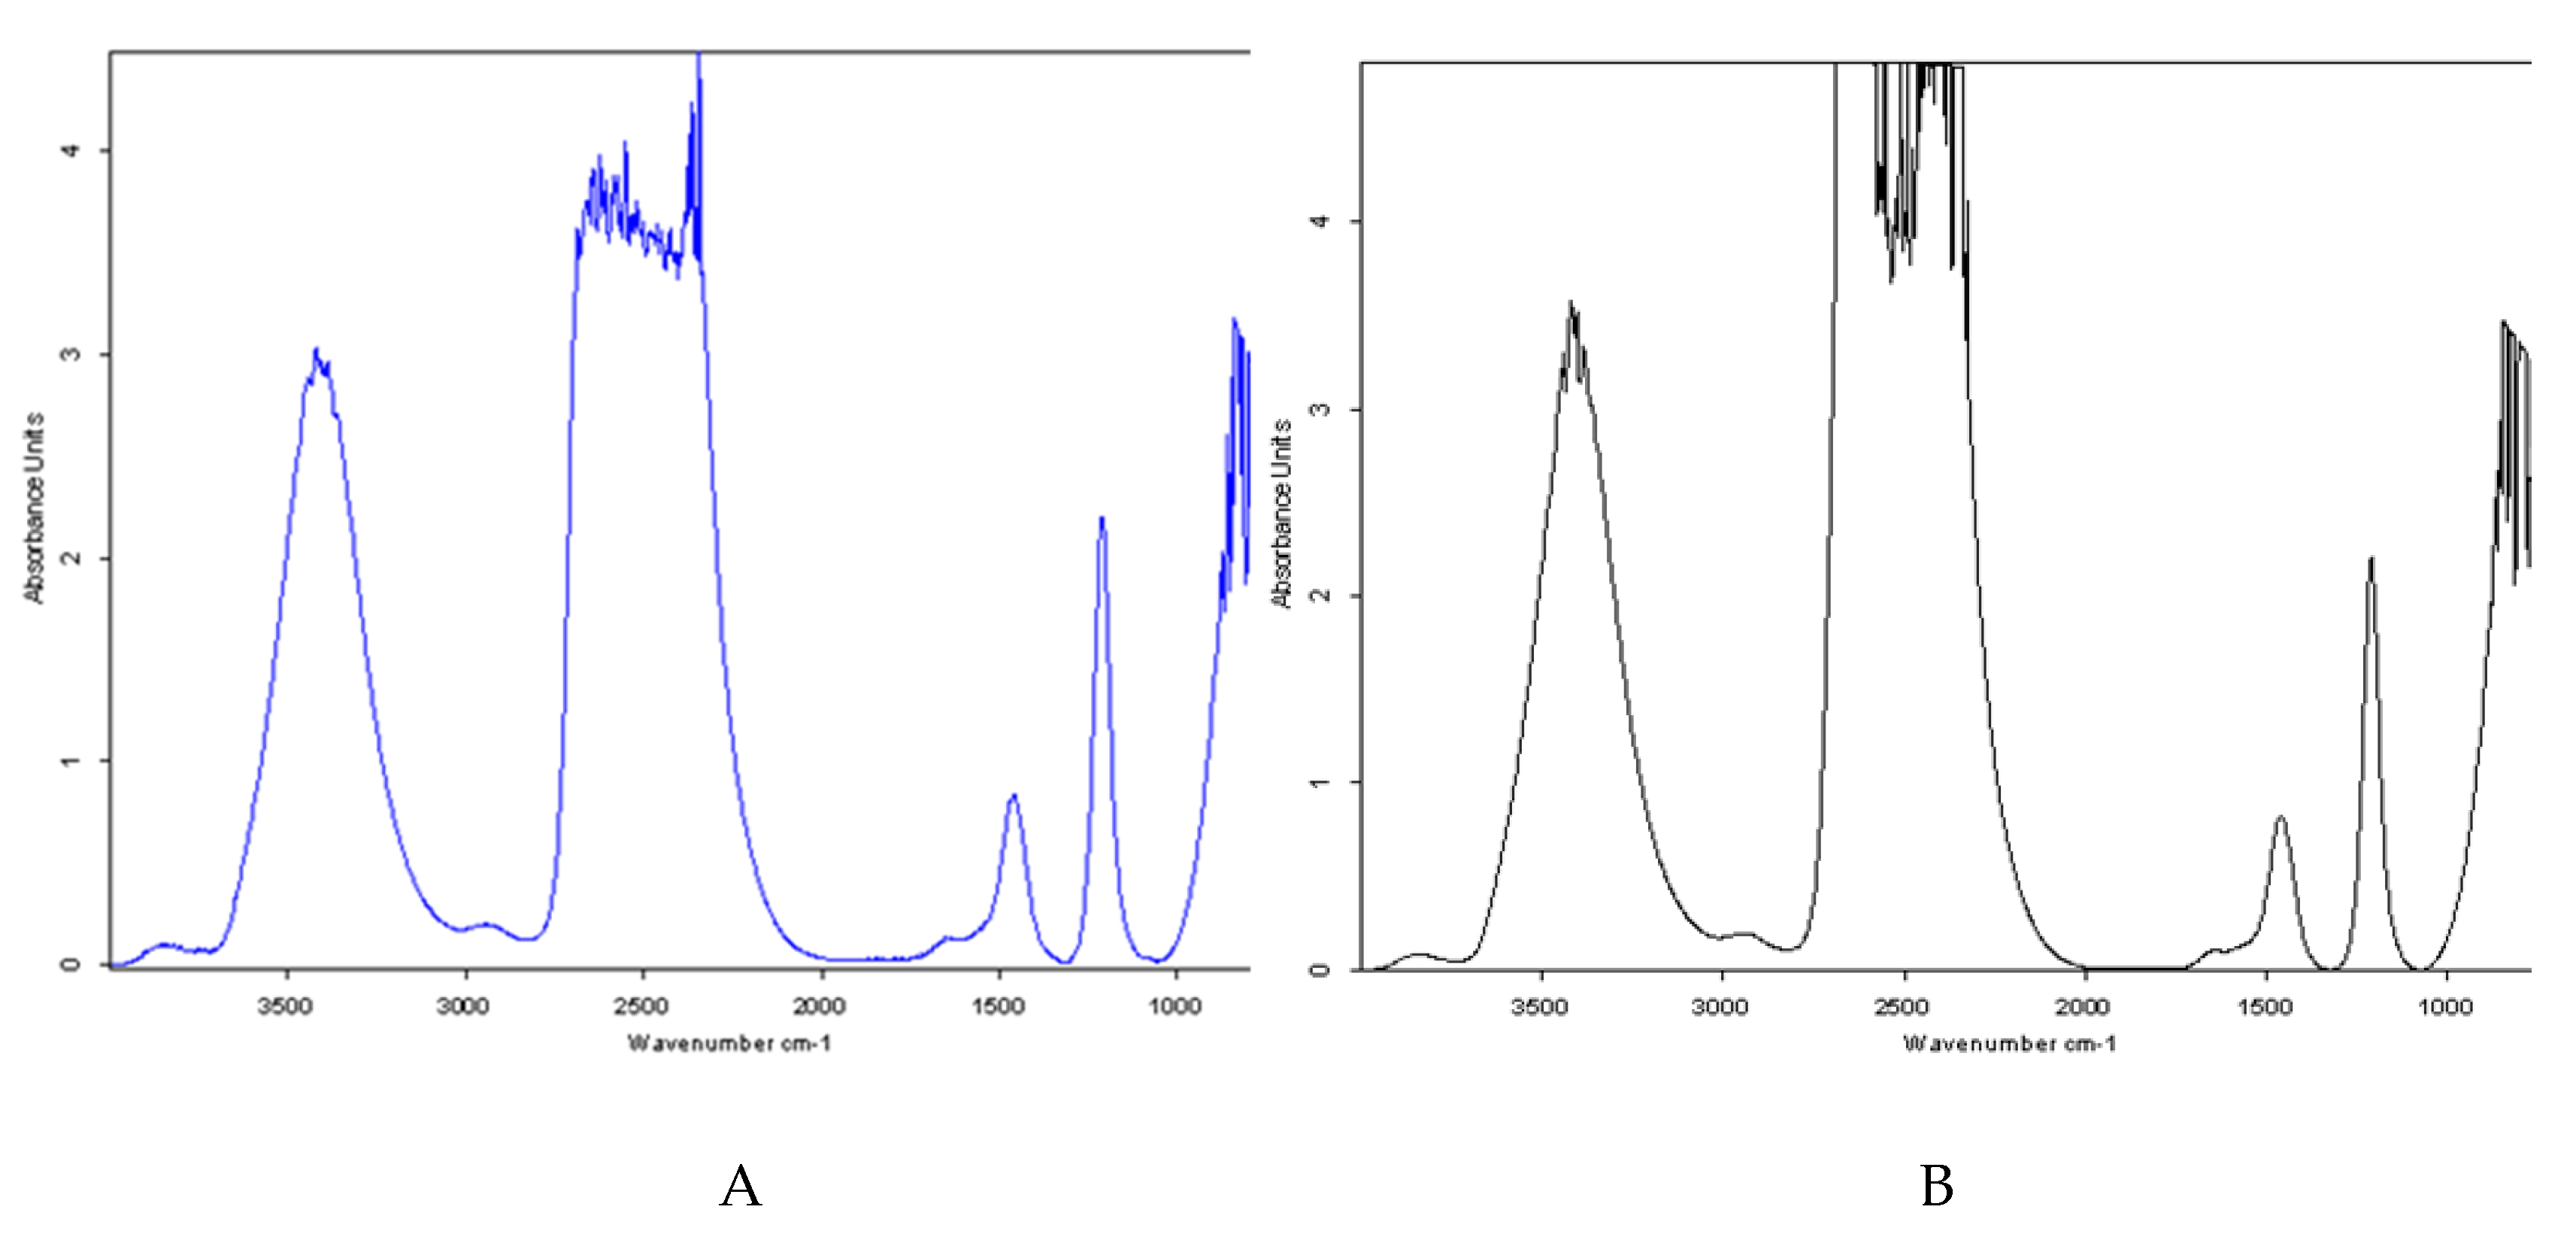
The absorption band at about 1250 cm-1 exhibited O-C stretching of carboxylic acids
and derivatives and a broad band at about 700-900 cm-1 revealed C-H out-of-plane bending (deformation) vibrations of aromatic rings and C-O-C vibrations. These data on FTIR spectra of the present work are in agreement with the data reported in the literature for Tithonia diversifolia plant extracts from FTIR spectra [33]
4. Conclusions
To the author’s knowledge, this is the first report about fluorescence properties of plant leaves extracts, which is based on SFS and SPS as well as the characterization of 3D spectra of secondary metabolites. Moreover, experimental planning was carried out to optimize the extraction of secondary metabolites from plant leaves by analysing three factors (i.e , temperature, nature of solvent and extraction/incubation time). Some phytochemical assays were performed in these plant extracts to investigate their antioxidant, TPC, TFC, reducing power and SOD levels. The data presented in this work revealed that these plant extracts exhibited high levels of phytochemicals which confirmed their biological activities in clinical conditions. The comparative analysis of SFS and SPS strongly suggests that SPS exhibited higher fluorescence intensity for secondary metabolites levels than SFS for these plant leaves extracts. For complex sample matrices of secondary metabolites, SPS and 3D-SFS would provide very useful information compared to SFS in terms of fluorophore identification, simplified spectra, enhanced sensitivity, quantitative analysis, microenvironment and interactions, structural information, conformational changes and sample fingerprinting.
The data presented in this work is novel since a detailed SFS, SPS and 3D-SFS study was carried out to obtain useful structural, qualitative and quantitative information of secondary metabolites from these plant extracts. These analytical techniques are cheap, fast, non-destructive, intrinsic and do not require exogenous fluorophores, high sensitivity and selectivity, very low sample volumes required and fast analysis by high-throughput screening for quality control and authentication. The limitation of this study lies in the need for further investigation of fluorescence properties of secondary metabolites from other sources in terms of selectivity and specificity. Moreover, fluorescence, phosphorescence and time-resolved fluorescence techniques must be used to fully characterize secondary metabolites from several sources in conjunction with chemometric approach. However, the full structural characterization of purified secondary metabolites should be complemented by using NMR, FTIR and fluorescence spectroscopy as well as by HPLC, GC-MS and ELISA combined with a chemometric approach.
Author Contributions
AK designed the research plan and performed experiments on fluorescence properties of plant extracts, KR performed all the remaining experiments and data treatment and AK wrote the MS.
Financial support
Project UID/AGR/04033/2019.
Data Availability Statement
The original contributions presented in this study are included in the article. Further inquiries can be directed to the corresponding author.
Conflicts of Interest
The authors declare that there are no conflicts of interest.
Abbreviations
ABTS – 2,2′-azinobis-3-ethylbenzothiazoline-6-sulphonic acid
DPPH- 2,2-Diphenyl-1-picrylhydrazyl
3D-SFS- 3D synchronous fluorescence spectroscopy
NBT-Nitro blue tetrazolium
PMS- Phenazine methosulfate
SFS- Synchronous Fluorescence Spectroscopy
SOD – Superoxide dismutase
SPS- Synchronous Phosphorescence Spectroscopy
TCA- Trichloroacetic acid
TPC- Total phenolic content
TFC- Total flavonoids content
References
- Ceríaco, LMP; Lima, RF; Melo, M.; Bell, R.C. 2022 Biodiversity of the Gulf of Guinea Oceanic Islands. In Science and Conservation; Publisher Springer Cham. [CrossRef]
- Omokhua, A. G.; Abdalla, M. A.; Van Staden, J.; McGaw, L. J. A comprehensive study of the potential phytomedicinal use and toxicity of invasive Tithonia species in South Africa 06 Biological Sciences 0605 Microbiology. BMC Complementary and Alternative Medicine 2018, 18(1), 1–15. [Google Scholar] [CrossRef]
- Chagas-Paula, D. A.; Oliveira, R. B.; Rocha, B. A.; Da Costa, F. B. Ethnobotany, chemistry, and biological activities of the genus Tithonia (Asteraceae). Chemistry and Biodiversity 2012, 9(2), 210–235. [Google Scholar] [CrossRef]
- Currais, A.; Chiruta, C.; Goujon-Svrzic, M.; Costa, G.; Santos, T.; Batista, M. T.; Maher, P. Screening and identification of neuroprotective compounds relevant to Alzheimer’s disease from medicinal plants of S. Tomé e Príncipe. Journal of Ethnopharmacology 2014, 155(1), 830–840. [Google Scholar] [CrossRef]
- Madureira, M.C; Martins, A.P.; Gomes, M.; Paiva, J.; Cunha, A.P.; Rosario. Antimalarial activity of medicinal plants used in traditional medicine in S. Tomé and Príncipe islands. Journal of Ethnopharmacology 2002, 81, 23–29. [Google Scholar] [CrossRef]
- Ajao, A.A.; Moteetee, A. N. Review Tithonia diversifolia (Hemsl) A. Gray. (Asteraceae: Heliantheae), an invasive plant of significant ethnopharmacological importance. South African Journal of Botany 2017, 113, 396–403. [Google Scholar] [CrossRef]
- Di Giacomo, C; Vanella, L; Sorrenti, V; Santangelo, R; Barbagallo, I; Calabrese, G; et al. Effects of Tithonia diversifolia (Hemsl.) A. Gray Extract on Adipocyte Differentiation of Human Mesenchymal Stem Cells. PLoS ONE 2015, 10(4), e0122320. [Google Scholar] [CrossRef]
- Goffin, E.; Ziemons, E.; De Mol, P.; De Madureira, M. D. C.; Martins, A. P.; Proença da Cunha, A.; Frederich, M. In vitro antiplasmodial activity of Tithonia diversifolia and identification of its main active constituent: Tagitinin C. Planta Medica 2002, 68(6), 543–545. [Google Scholar] [CrossRef] [PubMed]
- Gama, R.M.; Ruggiero, A.A.; Andrade, G.P.; Armando-Junior, J.; Pinhal, M.A.S. Optimizing bioactive compounds extraction and cell viability effect of Tithonia diversifolia (Hemsl.) A. Gray dry flower extracts. Journal of Pharmacy & Pharmacognosy Research 2025, 13(5), 1313–1326. [Google Scholar] [CrossRef]
- John-Dewole, J.-D. Phytochemical and Antimicrobial Studies of Extracts from the Leaves of Tithonia Diversifolia for Pharmaceutical Importance. IOSR Journal of Pharmacy and Biological Sciences 2013, 6(4), 21–25. [Google Scholar] [CrossRef]
- Barboza, B. R.; Da Silva Barros, B. R.; Ramos, B. D. A.; De Moura, M. C.; Napoleão, T. H.; Dos Santos Correia, M. T.; De Melo, C. M. L. Phytochemical bioprospecting, antioxidant, antimicrobial and cytotoxicity activities of saline extract from Tithonia diversifolia (Hemsl) A. Gray leaves. Asian Pacific Journal of Tropical Biomedicine 2018, 8(5), 245–253. [Google Scholar] [CrossRef]
- Marques, L.; Karmali, A. Experimental Planning for Production of β-D-Glucan: Purification and Fluorescence Properties from Basidiomycete Strains. Separations 2025, 12, 336. [Google Scholar] [CrossRef]
- Popescu, S.A.; Peled, A. Optimized RED spectral band Fluorescence of edible plants leaves extracts. Applied Surface Science Advances 2023, 13, 100385. [Google Scholar] [CrossRef]
- Tian, S.; Zhang, Y.; Wang, J.; Zhang, R.; Wu, W.; He, Y.; Wu, X.; Sun, W.; Li, D.; Xiao, Y.; et al. New 3-D Fluorescence Spectral Indices for Multiple Pigment Inversions of Plant Leaves via 3-D Fluorescence Spectra. Remote Sens. 2024, 16, 1885. [Google Scholar] [CrossRef]
- Herald, T.J.; Gadgil, P.; Perumal, R.; Bean, S.R.; Wilson, J.D. High-throughput micro-plate HCl-vanillin assay for screening tannin content in sorghum grain. J. Sci. Food Agric. 2014, 94, 2133–2136. [Google Scholar] [CrossRef]
- Attard, E. A rapid microtitre plate Folin-Ciocalteu method for the assessment of polyphenols. Open Life Sci. 2013, 8, 48–53. [Google Scholar] [CrossRef]
- Bobo-García, G.; Davidov-Pardo, G.; Arroqui, C.; Vírseda, P.; Marín-Arroyo, M.R.; Navarro, M. Intra-laboratory validation of microplate methods for total phenolic content and antioxidant activity on polyphenolic extracts, and comparison with conventional spectrophotometric methods. J. Sci. Food Agric. 2015, 95, 204–209. [Google Scholar] [CrossRef]
- Reis, F.S.; Pereira, E.; Barros, L.; Sousa, M.J.; Martins, A.; Ferreira, I.C.F.R. Biomolecule profiles in inedible wild mushrooms with antioxidant value. Molecules 2011, 16, 4328–4338. [Google Scholar] [CrossRef]
- Khair-ul-Bariyah, S.; Ahmed, D.; Ikram, M. Ocimum basilicum: A review on phytochemical and pharmacological studies. Pak. J. Chem. 2012, 2, 78–85. [Google Scholar] [CrossRef]
- Nishanthini, A.; Mohan, V.R. Antioxidant activites of Xanthosoma sagittifolium Schott using various in vitro assay models. Asian Pacific Journal of Tropical Biomedicine 2, Supplement 2012, S1701–S1706. [Google Scholar] [CrossRef]
- Boonmee, A.; Srisomsap, C.; Karnchanatatc, A.; Sangvanicha, P. An antioxidant protein in Curcuma comosa Roxb. Rhizomes, Food Chemistry 2011, 124, 476–480. [Google Scholar] [CrossRef]
- Karmali, A. Fluorescence and Phosphorescence Assay of β-D Glucans from. Mushrooms Processes 14, 442. [CrossRef]
- Hiransai, P.; Tangpong, J.; Kumbuar, C.; Hoonheang, N.; Rodpech, O.; Sangsuk, P.; Kajklangdon, U.; Inkaow, W. Anti-nitric oxide production, anti-proliferation and antioxidant effects of the aqueous extract from Tithonia diversifolia. Asian Pac J Trop Biomed 2016, 6, 950–956. [Google Scholar] [CrossRef]
- Pulido, K.D.P.; Dulcey, A.J.C.; Martinez, J.H.I. New caffeic acid derivative from Tithonia diversifolia (Hemsl.) A. Gray butanolic extract and its antioxidant activity. Food Chem. Toxicol. 2017. [Google Scholar] [CrossRef]
- Jeevitha, M.; Ravi, P.V.; Subramaniyam, V.; Pichumani, M.; Sripathi, S.K. Exploring the phyto- and physicochemical evaluation, fluorescence characteristics and antioxidant activities of Acacia ferruginea Dc: an endangered medicinal plant. Future Journal of Pharmaceutical Sciences 2021, 7, 228. [Google Scholar] [CrossRef]
- Lang, M.; Stober, F.; Lichtenthaler, H.K. Fluorescence emission spectra of plant leaves and plant constituents. Radiat Environ Biophys 1991, 30, 333–347. [Google Scholar] [CrossRef] [PubMed]
- Krasnovsky, A.A.; Kovalev, Y.V. Review. Spectral and Kinetic Parameters of Phosphorescence of Triplet Chlorophyll a in the Photosynthetic Apparatus of Plants. Biochemistry (Moscow) 2014, 79, 349–361. [Google Scholar] [CrossRef]
- Chen, W.; Zhu, Z. Ultralong luminescence lifetime imaging of edible plant tissue for humidity sensing in food packaging by a smartphone. Food Chemistry 2024, 454, 139778. [Google Scholar] [CrossRef]
- Tian, S.; Zhang, Y.; Wang, J.; Zhang, R.; Wu, W.; He, Y.; Wu, X.; Sun, W.; Li, D.; Xiao, Y.; et al. New 3-D Fluorescence Spectral Indices for Multiple Pigment Inversions of Plant Leaves via 3-D Fluorescence Spectra. Remote Sens. 2024, 16, 1885. [Google Scholar] [CrossRef]
- Kua, Y.G.; Baea, J.H.; Martinez-Ayalac, A.L.; Vearasilp, S.; Namiesnike, J.; Paskof, P.; Katrichh, E.; Gorinstein, S. Efficient three-dimensional fluorescence measurements for characterization of binding properties in some plants. Sensors and Actuators B 2017, 248, 777–784. [Google Scholar] [CrossRef]
- Zhou, T; Fu, Y; Zhang, Y; Meng, Z-Y; Xu, H-D; Tian, RT; et al. Application of three-dimensional fluorescence spectral characterization and chemometrics in the analysis of traceability of Paeoniae Radix Rubra. PLoS One 2025, 20(8), e0328834. [Google Scholar] [CrossRef]
- Ku, Y.G.; Kim, H.C.; Bae, J.H.; Kang, B.S.; Nemirovski, A.; Barasch, D.; Gorinstein, S. Antioxidant capacities and polyphenols in autumn-growing cultivarof Chinese cabbage (Brassica rapa L. ssp. pekinensis cv. Bulam Plus). European Food Research and Technology 2019, 245, 1871–1879. [Google Scholar] [CrossRef]
- Stanley, O.; Uche, C.A.; Chidi, N.; Constance, N. Gas chromatography mass spectrometry/Fourier transform infrared (GC-MS/FTIR) spectral analyses of Tithonia diversifolia (Hemsl.) A. Gray leaves. Journal of Medicinal Plants Research 2017, 11, 345–350. [Google Scholar]

Table 1.
Some phytochemical assays of plant extracts.
| Plant extracts | TPC | TFC | Reducing power | ABTS inhibition | DPPH inhibition | Superoxide radical | SOD activity |
|---|---|---|---|---|---|---|---|
| (mmoles gallic acid | (mmoles catechin | (mmoles TE equivalent/g | IC50 | IC50 | scavenging activity | (Units/g leaves) | |
| equivalent/g leaves) | equivalent/g leaves) | leaves) | (mg extract/mL | (mg extract/mL) | IC50 (mg extract/mL) | ||
| H20,25ºC, 0 days | 14.24±0.52a | 3.41±0.24a | 21.63±2.17b | 0.90±0.01a | 2.20±0.02a | 1.35±0.01a | 1101.95±34.14a |
| H20,25ºC, 5 days | 15.32±0.01a | 5.61±0.93b | 26.63±0.36a | 0.09±0.01c | 1.35±0.02b | 0.90±0.02c | 1107.72±91.15c |
|
Hexane, 25ºC, 12.04±1.31a 0 days |
6.56±0.82a | 4.82±0.15a | 6.63±0.05b | 6.48±0.03b | 1.06±0.01b | 576.47±40.71c | |
|
Hexane,25ºC, 13.46±0.88a 5 days |
3.23±0.15a | 0.39±0.03b | 3.19±0.01c | 2.65±0.09d | 0.65±0.01d | 388.26±25.42c | |
| H20,40ºC, 0 days | 14.87±0.12b | 4.63±0.38c | 0.87±0.20a | 0.52±0.01a | 2.23±0.07c | 1.06±0.01b | 145.62±23.07d |
| H20,40ºC, 5 days | 71.95±0.30c | 6.20±0.31d | 12.13±0.20d | 0.32±0.004d | 1.51±0.07d | 0.92±0.03b | 1249.53±160.04c |
|
Hexane, 40ºC, 1.53±0.02b 0 days |
4.36±0.34b | 2.08±0.15e |
10.87±0.07e | 8.78±0.14c | 9.09±0.02d | 549.05±260.88f | |
|
Hexane, 40ºC, 7.62±0.33c 5 days |
5.22±0.38d | 2.63±0.25e |
4.07±0.04f | 7.61±0.36b | 8.23±0.02d | 237.00±18.37e | |
Statistical analysis via one-way ANOVA: a p < 0.1, b p < 0.05, c p < 0.01, d p < 0.005, e p < 0.001, f p < 0.0001.
Table 2.
ANOVA of the Factorial Design Model Proposed.
| Sum of Squares | Degree of Freedom | Mean Square | F value |
p- value | |
|---|---|---|---|---|---|
| Model | 6740.36 | 7 | 962.91 | 2558.67 | < 0.0001 |
| A-Temperature | 418.77 | 1 | 418.77 | 1112.76 | < 0.0001 |
| B-Time | 1077.58 | 1 | 1077.58 | 2863.39 | < 0.0001 |
| C-Solvent | 1668.91 | 1 | 1668.91 | 4434.70 | < 0.0001 |
| AB | 920.44 | 1 | 920.44 | 2445.83 | < 0.0001 |
| AC | 1354.75 | 1 | 1354.75 | 3599.90 | < 0.0001 |
| BC | 640.57 | 1 | 640.57 | 1702.16 | < 0.0001 |
| ABC | 659.32 | 1 | 659.32 | 1751.98 | < 0.0001 |
| Pure Error | 3.01 | 8 | 0.3763 | ||
| Cor Total | 6743.37 | 15 |
R2= 0,9996; CV= 3,25%; Adequate Precision= 162,32; Contribution of A= 6.21%; Contribution of B= 15.98%; and Contribution of C= 24.75%.
Disclaimer/Publisher’s Note: The statements, opinions and data contained in all publications are solely those of the individual author(s) and contributor(s) and not of MDPI and/or the editor(s). MDPI and/or the editor(s) disclaim responsibility for any injury to people or property resulting from any ideas, methods, instructions or products referred to in the content. |
© 2026 by the authors. Licensee MDPI, Basel, Switzerland. This article is an open access article distributed under the terms and conditions of the Creative Commons Attribution (CC BY) license (http://creativecommons.org/licenses/by/4.0/).
Copyright: This open access article is published under a Creative Commons CC BY 4.0 license, which permit the free download, distribution, and reuse, provided that the author and preprint are cited in any reuse.


