
Submitted:
18 February 2026
Posted:
26 February 2026
You are already at the latest version
Abstract
This article addresses the limitations of traditional petrophysical interpretation and lithofacies analysis methods used in commercial software solutions, such as sub-jectivity, insufficient detail, and reliability, particularly in cases of complex reservoir structures. Accordingly, the development of automated lithofacies analysis tools using Artificial Intelligence (AI) and Machine Learning (ML) is a relevant objective for en-hancing the reliability of geological modeling and reservoir evaluation.
The authors have developed an innovative methodological approach for auto-mated lithofacies classification of well logging data, demonstrated via case study of Gran Field. The methodology is centered on the k-means unsupervised clustering al-gorithm, specifically adapted for comprehensive petrophysical data analysis.
It is demonstrated that the proposed approach effectively partitions the geological section into lithofacies and ensures the reliability of petrophysical interpretation re-sults. The optimal number of clusters (k=3) was determined using the Silhouette Coef-ficient, and the results were visualized using the Principal Component Analysis (PCA) method, confirming that the identified groups correspond to petrophysical patterns. The clustering results, incorporating PCA, showed clear separation into clay, silt-stone, and sandstone lithofacies. The k-means-based approach mitigates the primary limitations of traditional methods reliant on the subjective selection of cut-off values and forms a reliable foundation for building advanced geological and hydrodynamic models.
To facilitate practical application, a Python-based web interface was developed using the Streamlit framework. This application offers a user-friendly interface for preprocessing well-log data, performing clustering, and visualizing results, bridging the gap between advanced ML algorithms and specialists without programming ex-pertise.
Comparative analysis reveals that the k-means algorithm outperforms alternative methods across several key metrics, notably in interpretability and the structural co-herence of the results. Future development prospects include the integration of densi-ty-based clustering algorithms, such as DBSCAN, to increase the system's adaptability in complex geological sections. This will open new possibilities for intelligent analyti-cal systems in the field of reservoir evaluation and resource assessment.
Keywords:
artificial intelligence
; machine learning
; well-logging
; porosity
; gamma-ray logging
; Precaspian depression
; lithofacies
; k-means
1. Introduction
Lithofacies identification serves as a fundamental basis for comprehensive reservoir characterization, providing key information about the state and spatial distribution of hydrocarbons within reservoirs [1,2,3,4]. This analysis allows for a detailed study of the reservoir’s structure and mineralogy, as well as the identification of zones with the highest hydrocarbon recovery potential. The results obtained contribute to more accurate reservoir performance forecasting, enhancing production process management efficiency and increasing hydrocarbon recovery factors.
In the context of increasing hydrocarbon production from fields with complex geological structures, such as the sedimentary cover deposits of the southern part of the Pre-Caspian Depression, the importance of reliable lithofacies interpretation and subsequent mapping is growing. However, traditional methods of interpretation and petrophysical modeling face several challenges, including a limited volume of core material, inconsistent quality of well logging data, and a shortage of qualified specialists for manual interpretation [5]. As a result, optimizing these interpretation processes through advanced data analysis methods represents a significant research objective.
The effectiveness of well-log data interpretation is determined by both objective factors, such as the level of technical equipment, workflow flexibility, and the need for additional programming, and subjective factors, including unrealistic project expectations and the expertise level of the interpreter. These challenges are particularly pronounced when applying machine learning (ML) workflows, as most such approaches prioritize replicating historical expert decisions rather than generating new geological models. Consequently, when utilizing commercial software for well-log data interpretation, it is essential to acknowledge these limitations in order to mitigate errors and enhance the quality of the results [6].
Based on these considerations, the study evaluates artificial intelligence (AI) techniques for automated lithofacies identification, using a hydrocarbon field located in the southern part of the Pre-Caspian Depression as a case study. Furthermore, we provide a rigorous rationale for employing the k-means clustering algorithm as a robust tool for well-log data classification.
To achieve the research objective, the following tasks were accomplished:
Reviewed modern AI methods and tools used in oil and gas exploration for well-log interpretation and lithofacies classification.
Evaluated the effectiveness of AI methods for lithofacies classification using the Gran Field dataset, highlighting their strengths and limitations.
Developed an algorithm for the automated classification of lithofacies using the k-means approach, specifically adapted to the characteristics of the Gran Field dataset.
Created software for integrating the k-means algorithm, aimed at enhancing its usability and accuracy in practical applications.
Tested the algorithm’s performance and conducted a comparative analysis of its effectiveness on Gran Field data using key criteria.
Formulated recommendations for applying the developed software product to optimize the objectives of lithofacies identification and mapping workflows
2. Methods and Definitions
As previously noted, lithofacies are critically important for determining the reservoir properties which directly influence the efficiency of hydrocarbon field development [2,3,4,7,8,9].
Accurate identification of lithofacies helps optimize production techniques and predict fluid saturation dynamics, both of which are essential for successful reservoir management. However, the use of laboratory core analysis and well-log data is often limited by factors such as tool resolution constraints, methodological inconsistencies, and scaling challenges between core and log data.
Given the limitations of traditional methods, modern ML approaches are becoming key tools for improving the accuracy and efficiency of lithofacies analysis. Well-log data, which provide continuous high-resolution measurements throughout the wellbore, represent a critical source of information on petrophysical properties. When integrated with petrophysical and geological data, they form the foundation for robust lithofacies classification, significantly enhancing reservoir characterization [10].
ML algorithms enable the automation and acceleration of lithofacies identification, effectively overcoming the limitations of traditional workflows. Algorithms trained on core samples have proven highly effective at classifying non-cored intervals, as demonstrated by their successful implementation in several fields [11].
The application of ML in integrating and analyzing data from diverse sources significantly enhances prediction accuracy, accelerates data processing, and reduces human error, which is crucial for the efficient and economically viable development of hydrocarbon reservoirs.
Gamma-ray logging (GR), resistivity logging (Rt), neutron porosity logging (NPHI), density logging (RHOB) are the primary methods for lithofacies identification [11].
Maximum effectiveness in lithofacies analysis using AI is achieved through a comprehensive approach that considers data quality requirements, research objectives, available resources, and expected outcomes [6].
A review of the literature [10,12,13] shows that a wide variety of machine learning (ML) algorithms are used for automated lithofacies classification. Among these, artificial neural networks are often compared with traditional classification methods in terms of effectiveness.
However, in cases where the volume of training data is limited, the Support Vector Machine (SVM) method exhibits greater stability, as it requires a smaller amount of data to function correctly [14]. The performance of neural networks, on the other hand, is largely dependent on the composition and volume of input parameters [7].
Despite the large number of studies focusing on the application of individual ML algorithms for lithofacies classification, there is a noticeable gap in comprehensive research comparing various methods, including supervised and unsupervised learning techniques, as well as k-means clustering. This highlights the relevance of further investigation into the potential of k-means for both automated lithofacies classification and reservoir property assessment. This algorithm remains underexplored, despite its ability to uncover hidden patterns without relying on a priori information from core data.
Currently, there are software suites that implement ML methods for reservoir property evaluation and lithofacies clustering. However, commercial software often does not provide full access to statistics and accuracy metrics, limiting opportunities for in-depth analysis and result comparison. Consequently, it is important to conduct a comparative analysis of various approaches to assess their effectiveness and applicability in geological objectives.
This article examines three approaches to lithofacies classification: (1) the traditional cut-off method; (2) ML methods implemented in commercial software; and (3) the k-means clustering method. These analytical findings will not only help identify the strengths and weaknesses of each method, but also assess their capabilities in addressing the objectives of lithofacies identification and mapping based on specific geophysical data.
2.1. Classification of Lithofacies by the Traditional Method (Cut-Off)
The traditional method for determining lithofacies and reservoir properties from well logging data is based on establishing cut-off values for specific petrophysical parameters. This approach is fundamental in petrophysics and widely used due to its simplicity and clarity [15]. The method operates on the assumption that each rock type possesses a unique set of physical properties measurable by well logging tools. The interpreter manually sets specific numerical petrophysical cutoffs on well log curves to distinguish one lithofacies from another.
Cross-plots between GR and Rt parameters are a traditional tool for lithofacies interpretation in clastic formations. GR values primarily reflect the clay fraction, enabling the differentiation of relatively clay-free sandstones from clay-rich rocks. Meanwhile, the interpretation of the Rt parameter is influenced by factors such as fluid saturation, formation water salinity, and the petrophysical properties of the rocks, all of which require a comprehensive analysis of well-log data when utilizing cross-plots [16].
Despite the effectiveness of traditional well logging interpretation methods for lithological characterization, their application to geologically complex reservoirs and large-scale heterogeneous datasets exposes significant methodological limitations. These include difficulties in formalizing interpretation rules, reliance on subjective expert assumptions, and challenges with the reproducibility of results.
These issues underscore the growing interest in machine learning (ML) methods, which offer automated, standardized analysis of well log data [17].
Three primary lithofacies—clays, sandstones, and siltstones—were identified in the Gran Field section using porosity-based cutoffs as the main interpretive criterion. These lithofacies form the fundamental units for subsequent reservoir modeling and comparative analysis with ML-based clustering.
2.2. Classification of Lithofacies Using AI Methods
As part of this study, the “Train Estimation Model” module was employed, which automates well-log data interpretation using machine learning (ML) methods. This approach is essential for processing large volumes of multi-parameter data, enhancing the reproducibility of lithofacies classification, and minimizing the influence of subjective factors in data interpretation [18,19].
In the unsupervised learning mode, clustering of well-log data was carried out without the use of a priori information. This method facilitates the identification of hidden patterns in the distribution of petrophysical parameters and the determination of petrophysical cutoffs in intervals where core data is absent. It is particularly effective for the preliminary interpretation of complex sections and for uncovering structural patterns that might be overlooked with traditional approaches [20,21].
In the supervised learning mode, a neural network was trained on expertly labeled data, enabling the extension of lithofacies interpretation to intervals and wells lacking core data. This approach ensured high objectivity and consistency of results, while also enhancing the scalability of the interpretation process [22].
2.3. Classification of Lithofacies Based on K-Means Clustering
The k-means algorithm is used to group objects into a predefined number of clusters without prior classification. Each object is represented by a feature vector that encapsulates its characteristics. The objective of the algorithm is to assign objects to clusters in such a way that elements within the same cluster are as similar as possible, while minimizing the differences between objects in different clusters [23].
The clustering process begins by selecting initial centroids, typically chosen at random, to represent the clusters. A centroid is defined as the arithmetic mean of all data points within a cluster, though it may not correspond to an actual data point. The Euclidean distance from each point to all centroids is then calculated, and each point is assigned to the cluster with the nearest centroid. The centroids are recalculated as the mean of all points in their respective clusters. This process is repeated iteratively until convergence, ensuring a stable and mathematically optimal partitioning of the data [23].
To facilitate the application of k-means clustering to well-log datasets, a Python-based analytical framework was developed. Using the Streamlit and ML libraries, the application provides an interactive interface for real-time data processing and lithofacies visualization. It integrates the entire workflow, from loading and preprocessing well-log data, through hyperparameter tuning and centroid computation, to visualizing the distribution of data points across clusters and analyzing their petrophysical characteristics.
Figure 1 illustrates the k-means clustering algorithm as implemented in the web application. The diagram outlines the sequence of operations: data preparation and normalization, centroid initialization, iterative assignment of points to clusters, centroid updating until convergence, and the subsequent cluster visualization for lithofacies analysis.
Figure 2 and Figure 3 illustrate our developed web application, which utilizes a modular structure to execute the data processing workflow through the following stages:
- Import and verification of data in LAS format (see Figire 2);
- Preprocessing, including handling missing values and removing statistical outliers;
- Visualization of well-logs with assurance of metrological correctness for units of measurement.
This structured sequence ensures high interpretative efficiency and guarantees the accuracy of petrophysical analysis.
The k-means algorithm was used to automatically partition the dataset into clusters. To enhance accuracy and robustness against outliers (anomalous values), the RobustScaler method was implemented during the feature scaling stage. This approach significantly reduced the algorithm’s sensitivity to extreme values, thereby improving the coherence of the resulting clusters.
After the data were assigned to clusters, an evaluation was performed to assess the success of the partitioning. For this purpose, the Silhouette Coefficient was used, which allowed for evaluation of two fundamental aspects:
- Cohesion – degree of similarity between objects within a single cluster.
- Separation – distinctness of boundaries between different clusters.
The quality of cluster assignment was determined using the Silhouette Coefficient. A value closer to 1 indicates better grouping of objects and clearer separation of clusters. Values approaching -1 could indicate erroneous distribution of objects among clusters.
Accordingly, the Silhouette Coefficient used as a reliable and objective tool for assessing clustering quality, allowing for precise assessment on the correctness and effectiveness of the data partitioning.
The platform’s visualization module offers powerful tools for data analysis, as demonstrated by its successful application to the Gran Field dataset. Synchronized well-log curve profiles with cluster labeling allow for the clear identification of data groups, while scatter plots illustrate relationships between geophysical parameters (see Figure 4). These tools ensure high reproducibility of results, minimize subjectivity in petrophysical interpretation, and significantly reduce the time required compared to traditional analysis methods.
Principal Component Analysis (PCA) plays a key role in this workflow by reducing data dimensionality while preserving the variance and structural relationships inherent in the dataset. This speeds up the identification of hidden dependencies and improves analysis accuracy, which is particularly important for geophysical and lithological characteristics. This approach not only enhances interpretation quality but also facilitates the integration of ML algorithms into the well-log interpretation workflow (see Figure 5).
Furthermore, the ability to generate a lithological column that maps clusters to lithofacies and visualizes them using a color palette significantly improves the clarity of analysis and the accuracy of lithological composition assessment. This integration paves the way for the development of adaptive systems capable of incorporating regional geological features, thereby making field analysis more efficient and flexible (see Figure 4 and Figure 5).
As a result, the application of the developed software to the Gran Field case study demonstrated high effectiveness in lithofacies analysis, ensuring reproducibility of results, minimizing subjective bias, and significantly reducing time required. The integration of machine learning (ML) algorithms into petrophysical analysis opens new opportunities for creating adaptive systems that account for regional geological characteristics. These benefits are achieved through tools such as synchronized well-log curve profiles, PCA, and lithofacies column generation, thereby enhancing both accuracy and efficiency.
3. Input Data
The Gran Field is located on the southwestern board of the Precaspian Depression. Tectonically, it is a two-flanked salt-dome structure.
The nearest oil fields: S. Balgimbayev, located 15 km to the southwest; to the southeast fields Kamyshitovoye, Yugo-Zapadnoye and Zhanatalap, located approximately 10 and 15 km away, respectively.
The drilled wells at the Gran Field (58 exploration and production wells) have penetrated sediments of the Lower Permian, Triassic, Jurassic, Cretaceous, and Neogene-Quaternary systems, with a total thickness of up to 1000 m (Well 4).
Lithological and stratigraphic characteristics
The Lower Permian section (Kungurian Stage) has been penetrated by seven wells and is divided into two units: a lower halogenic unit (rock salt) and an upper sulfate unit (anhydrites, gypsums with interbeds of carbonates and clays) with a maximum thickness of up to 118 m.
Above lie undivided deposits of the Upper Permian and Triassic, represented by an alternation of dense clays and limestones with subordinate interbeds of sandstones and marls, ranging in thickness from 12 to 88 m.
Jurassic deposits (comprising the Lower, Middle, and Upper Series) have been drilled by all wells. The Lower Jurassic consists of well-sorted fine- to medium-grained sands and sandstones (14–60 m). The Middle Jurassic is characterized by alternation of sandy-silty and clayey rocks, with thicknesses ranging from 97 to 372 m. Upper Jurassic deposits are represented by a carbonate-clay complex (limestones, marls, clays) 5–18 m thick, which acts as a regional seal.
Overlying Lower Cretaceous deposits consist predominantly of clay sequences with subordinate interbeds of sandstones and siltstones; their thickness varies from 14–36 m (Neocomian) to 78–295 m (Albian). The Upper Cretaceous is composed of marls with interbeds of chalk and limestone (12–23 m).
Neogene-Quaternary sediments are represented by clayey formations: dense calcareous clays in the lower part and silty clays and sands in the upper part. Their thickness ranges from 140 to 188 m.
Thirteen hydrocarbon-bearing horizons have been identified in the Gran Field: nine are associated with sandy-clayey deposits of the Middle Jurassic, and four are associated with Lower Cretaceous deposits.
The clay-marl sequence of the Upper Jurassic and the clays of the Lower Cretaceous serve as a reliable sealing caprock, while dense impermeable sandstones and clays act as barriers between the horizons.
Hydrocarbon accumulations are stratigraphic, structural, and partially lithologically trapped accumulations, supported by edge water.
The primary pay zones occur within the depth interval of 170–850 m and are associated with clastic reservoirs of the Middle Jurassic and Lower Cretaceous strata. They are characterized by the development of highly porous sands and sandstones, silts and siltstones with varying degrees of clay fraction. The main proven hydrocarbon reserves of the field are concentrated within these specific stratigraphic complexes (see Figure 6 and Figure 7).
Set of well log methods
Between 1970 and 2004, an extensive set of well logging operations was conducted in the drilled wells of the Gran Field. The standard set of logging methods included conventional electrical logs (Spontaneous Potential (SP)), lateral log (LL), and micro-lateral log (LL shallow); radioactive methods – gamma-ray logging (GR) and neutron-gamma logging (NGL); induction logging (IL); caliper logging (CALI); as well as directional survey and temperature logging (TL).
Logging was performed at standard depth scales (1:200, 1:500) using the corresponding equipment of that time, such as KSP-2, TBK-2, SRK, PIK-1M, and others.Starting in 2005, the standard range of logging methods was significantly expanded with the introduction of modern acquisition methods and equipment.
The standard set of logging was augmented with spectroscopy gamma ray logging (SGR), high-resolution induction logging (HRIL), density gamma-gamma logging (RHOB), and thermal neutron logging (TNL). The equipment used (the “-73” series and modern modifications, such as YK-73, IK5-73, SGP, SGK) ensured higher quality and reliability of the acquired data, facilitating more detailed petrophysical interpretation of the sections in newly drilled wells.
Data quality control was performed after data preparation, including the splicing of curves obtained from different wells. Quality assessment was based on the correspondence of the curves to lithological variations in the section and to the readings from shale marker beds. Data normalization was performed as necessary to bring them to a unified standard.
LL and HRIL showed good and satisfactory quality. They were successfully used for reservoir identification, saturation character assessment, and true resistivity determination. LLS provided satisfactory results in most wells, except for wells 9, 11, and 13, where data quality was poor. LL shallow was effectively used in combination with LL for identifying intervals of mud filtrate invasion. IL reliably identified water-saturated zones; however, its resolution is limited in thinly laminated intervals. SP logs are generally of good quality and correlate with lithofacies, although anomalies related to technical conditions or the presence of pyrite were noted in some wells.
Radioactive methods demonstrated variable quality. GR showed weak differentiation in a number of wells and was non-informative in intervals with high natural radioactivity of reservoirs (e.g., in the J₂ horizon). SGR performed in a limited number of wells, provided a good-quality composite curve. NGL in older wells (1968-1970) is characterized by low quality due to the use of outdated equipment (DRST3-90) in unsuitable geophysical conditions.
RHOB conducted in new wells demonstrated good data quality, clearly delineating dense rocks and carbonaceous interbeds. Acoustic Logging (AL) was performed in older wells and is of low quality due to technical issues, but it was used for identifying dense interlayers, gas-saturated reservoirs, and, in combination with other methods, for estimating effective porosity.
Overall, the well logging dataset provides a substantial volume of information for petrophysical interpretation. However, data quality is frequently constrained by acquisition and the equipment used, introducing uncertainty into the results. To achieve a more precise and reliable assessment, the integration of AI and ML is essential. These technologies are capable of processing high-dimensional datasets, revealing hidden dependencies and patterns, and mitigating the impact of technological and instrumental limitations. Such an approach significantly enhances analytical reliability and improves the overall quality of interpretation outcomes.
As part of the research conducted by the authors on the implementation of AI and ML, three types of well-log data were selected as input:
- Gamma-ray (GR) and Spontaneous Potential (SP) logs, which are primary lithological indicators sensitive to the clay fraction.
- Porosity from Neutron-Gamma Logging (NGL), a key parameter for distinguishing reservoir zones.
To ensure reliable lithological control, laboratory-derived total porosity values from core samples were integrated into the Petrel1 software environment and calibrated against the porosity logs.
These steps facilitated the differentiation of lithofacies into sandstones, siltstones, and clays based on the existing historical dataset. This integration facilitated the differentiation of lithofacies.
Figure 8 illustrates fragments of well-log data and their interpretation processed in Techlog1, which served as the primary input data for the AI and ML frameworks.
Before model deployment, a preliminary petrophysical interpretation of the selected curves was performed to assess the clustering potential of the chosen attributes. In the Techlog1 software, intervals with low GR and SP values, along with high effective porosity (PHIE) values, were interpreted as reservoirs (sandstones). Conversely, intervals with high GR and SP values and low PHIE were classified as clay-rich rocks
Consequently, each cluster identified by the algorithm corresponds to a set of intervals with similar lithofacies and reservoir properties, forming the basis for automated lithofacies classification.
Intermediate intervals characterized transitional facies, such as siltstones or shaly sandstones.
For wells 35 and 28, the interpretation workflow in Techlog1 integrated three key parameters to constrain the lithofacies model: volume of clay (VCLAV), hydrocarbon-saturated porosity (CSAT), and composite log-convergence indicator (COLL).
The VCLAV curve estimates the clay mineral content in the rocks: high values indicate the presence of clays and shales, while low values suggest clay-free reservoirs, such as sandstones and siltstones. CSAT provides an estimate of effective porosity, accounting for the formation’s saturation with hydrocarbons or water, and enables the discrimination between pay zones and water-bearing layers. The COLL parameter assesses the consistency between VCLAV and CSAT data in both wells, identifying discrepancies and confirming the reliability of the interpretation.
The joint analysis of these curves using a petrophysical template provided a comprehensive petrophysical characterization of the section, which was necessary for lithofacies identification, reservoir properties evaluation, and more accurate fluid saturation interpretation.
Ultimately, this physics-based preliminary classification guided the selection of GR, SP, and PHIE as the optimal feature set (input neurons/predictors) for the subsequent machine learning workflows.
4. Research Outcomes
4.1. Classification Using Cut-Off Method and AI Methods
Based on the analysis of well logging and core data in the Techlog1 software for the Gran Field, empirical cut-off values for porosity and GR were established, enabling the identification of three main lithofacies: clay, siltstone, and sandstones (see Table 1).
Table 1 shows that in intervals with complex and heterogeneous lithofacies (e.g., heavily clayed sandstones or siltstones with sandy intervals), the boundaries defined using cut-off values were overly simplified. This has led—and continues to lead—to insufficient vertical resolution and classification errors in transitional zones, confirming the necessity of applying more flexible and adaptive methods.
To mitigate the inherent limitations of deterministic workflows, an automated classification was implemented using the “Train Estimation Model” module, which utilized two contrasting computational frameworks:
Supervised Learning: A lithofacies model built using the cut-off method as the training dataset. The neural network successfully replicated the given patterns, showing high consistency with the original model in test intervals. However, this approach also confirmed its key limitation: the model did not identify new patterns but merely automated the existing expert interpretation.
Unsupervised Learning: A clustering algorithm was configured to partition the data into three discrete classes, revealing a different distribution pattern. The clusters largely reflected statistical groupings in the multidimensional space of well-log data. However, the interpretability of the clusters proved challenging due to the algorithm’s “black box” nature and the lack of transparent criteria for correlating them with specific lithofacies, without involving core data.
Figure 9 illustrates the results of the analysis of various approaches to lithofacies classification (using cutoffs, supervised, and unsupervised learning). For each well, the well-log curves and their corresponding lithofacies tracks are visualized, constructed by three independent methods: calculated using the cut-off method, and using ML methods (supervised and unsupervised).
Significant differences in the distribution and thickness of the identified lithofacies are observed between the methods, especially in transitional intervals with complex lithofacies. At the same time, for a number of layers possessing characteristic petrophysical properties, all three methods demonstrate a consistent result. A good example is the interval in Well 5 at a depth of 498-502 m, where all methods identify a clayey lithofacies. This case clearly demonstrates the necessity of applying an objective analysis for validating the obtained data. Results from laboratory core analysis are used as such a standard.
4.2. Classification Based on the K-Means Algorithm
To achieve the research objective, a k-means clustering algorithm was applied to a multidimensional dataset, including GR, SP, and PHIE logs.
For the objective selection of the parameter k, the Silhouette Coefficient was used. For k = 3, it was established that this number of clusters corresponds to the geological model, which includes three main lithofacies: sandstone, clay, and siltstone.
The Silhouette Coefficient for k = 3 was calculated as 0.463, indicating a strong degree of cluster separation and internal cohesion. The choice of k = 3 was further confirmed by analyzing the dependence of clustering quality on the value of k. For k > 3, only a negligible increase in the Silhouette Coefficient was observed, indicating that the model is stable with three clusters.
The clustering results in two-dimensional space presented in Figure 10, where:
- Cluster A (interpreted as “Clay”) – high GR values, high SP values, low PHIE values.
- Cluster B (interpreted as “Sand”) – low GR values, low SP values, medium to high PHIE values.
- Cluster C (interpreted as “Siltstone”) – intermediate GR, SP, and PHIE values.
Figure 10 presents the calculation results from our developed k-means clustering algorithm, illustrating the transition from raw data to the final lithofacies model.
The central track (column) in Figure 9 presents the raw output of the k-means algorithm, where each cluster is assigned a unique color code. This column reflects the direct mathematical result of partitioning the data within a multidimensional feature space. The right column provides the geological interpretation of the clusters. Through correlation with petrophysical analysis and core data validation, specific lithofacies are assigned to each cluster centroid, thereby transforming abstract data groupings into geologically meaningful insights.
To address data dimensionality, we applied Principal Component Analysis (PCA), a widely adopted technique in geological studies where attributes are often intercorrelated due to shared geological structures. PCA identifies the primary directions of variability within the data, minimizing the loss of information.
The first principal component (PC1), associated with the eigenvector of the largest eigenvalue, captures the direction of maximum variability, encompassing the majority of the data’s variance. The second principal component (PC2), with a smaller eigenvalue, is orthogonal to PC1, capturing additional aspects of variability that are not explained by the first component. The use of PCA is justified by its effectiveness in reducing redundancy and enhancing the quality of clustering and subsequent classification.
Figure 11 presents two key machine learning tools used to analyze and verify the results of clustering performed with the k-means algorithm. Panel (a) shows a cross-plot of GR versus PHIE, which serves as a benchmark for assessing cluster integrity. The visualization reveals three distinct clusters with minimal spatial overlap, corresponding to the identified lithofacies. The clear separation of these centroids in the GR-PHIE domain confirms that the algorithm has successfully captured the underlying petrophysical relationships, effectively distinguishing between high-porosity reservoir sandstones and low-porosity, clay-rich intervals.
For an independent evaluation of cluster separation quality, the PCA method was applied, as shown in panel (b). The resulting PCA score plot demonstrates clear spatial partitioning of the three lithofacies, validating the effectiveness of the k-means algorithm and confirming that the identified clusters are both statistically distinct and geologically meaningful.
In summary, the results of the PCA analysis confirm that the identified clusters adequately reflect the multidimensional structure of the data. The projection to the principal components demonstrates the compactness and isolation of the clusters, providing additional confirmation of the k-means algorithm’s effectiveness. These findings verify that the clusters correspond to petrophysical rock types and correctly identify lithofacies that align with the data’s physical and geological characteristics. Visualization in the PCA space clearly illustrates the correctness of the cluster separation.
4.3. Comparative Analysis of Lithofacies Classification
The objective of this research was to conduct a comparative analysis of the effectiveness of various lithofacies recognition frameworks, using the Gran Field as a representative case study. The primary focus was not only on the quantitative assessment of each method’s accuracy but also on analyzing their practical applicability under different geological conditions.
To ensure a robust comparative evaluation, the methods were benchmarked against several multi-criteria parameters: geological validity, objectivity, and the reproducibility of the classification outcomes. Additionally, factors such as labor intensity, interpretation speed, and the flexibility and transparency of the applied methods were considered.
This approach enabled the identification of the strengths and weaknesses of each method, the determination of their optimal application areas, and the confirmation of the advantages of the proposed k-means-based solution for automated lithofacies analysis in conditions of limited a priori information.
Figure 12 presents a comparison of lithofacies models obtained for the same interval in Well 5 (depth 470 – 550 m) using different automated methods.
The spatial distribution of the identified lithofacies exhibits a strong correlation with well-log curves. Specifically, intervals classified as “Clay” align with characteristic peaks on the GR curve and low values on the PHIE curve, confirming that the clusters have both statistical and geological significance.
Notably, the k-means-based workflow operates independently of prior labeling. Classification is performed directly based on the distribution of the original petrophysical parameters, enabling the algorithm to detect natural patterns and gradations in lithofacies. This approach allows the identification of features that may be overlooked when using other methods to construct a training dataset.
5. Discussion
The research conducted by the authors of the article confirmed that the k-means clustering algorithm is an effective and practical tool for the automated identification of lithofacies.
The traditional cut-off method, while transparent, sometimes fails to fully capture the lithological heterogeneity inherent in terrigenous reservoirs, leading to oversimplified, discrete models. Its main limitations include subjectivity in selecting lithofacies boundary values and insensitivity to gradual petrophysical changes.
While machine learning (ML) algorithms, including supervised learning, can automate the process, they can also reproduce the errors and simplifications inherent in the training dataset prepared by an expert or interpreter.
Unlike supervised machine learning frameworks, the k-means clustering approach eliminates the need for labor-intensive and costly prior data labeling. This ensures transparency and reproducibility (Silhouette Coefficient of 0.463 for k=3), while visualization within the parameter space makes the interpretation process both understandable and controllable. This reduces the technical barrier for geologists and geophysicists, facilitating the method’s application and allowing for flexible adaptation to the specific characteristics of a given field.
As shown in Figure 10 and Figure 12, the k-means algorithm not only statistically groups data points but also identifies petrophysically validated patterns. This clear correlation, confirmed by PCA analysis (Figure 11b), where the principal components logically separate the clusters, demonstrates that the method identifies genuine lithofacies with distinct reservoir properties. The developed approach showed higher resolution, identifying thin interbeds and transitional zones, which is critical for constructing accurate reservoir models
For selecting the hyperparameter k (number of clusters) in the k-means algorithm, a quantitative assessment method based on the Silhouette Coefficient was applied. This metric calculates an index for each data point, which is a measure of how well that point fits into its own cluster compared to other clusters [26]. The index is calculated using the formula:
where:
a(i) — the average distance from the i-th point to all other points in the same cluster.
b(i) — the average distance from the i-th point to all points in the nearest neighboring cluster.
The cumulative Silhouette Coefficient for the entire dataset is the average value of s(i) across all points. Its values range from -1 to 1:
- A value close to 1 indicates that the point is located far from neighboring clusters and fits well within its own cluster, which suggests high clustering quality.
- A value close to 0 means the point lies on the boundary between two clusters, which may indicate uncertainty in the partitioning or the need to reconsider the number of clusters.
- A negative value indicates that the point has likely been assigned to the wrong cluster, as it is closer to points in another cluster, which suggests low clustering quality [27].
In the clustering algorithm, each cluster represents a group of objects with similar petrophysical characteristics in the feature space (e.g., GR, PHIE, SP). Each cluster is interpreted as a distinct lithofacies, corresponding to a geologically unique rock type with specific petrophysical properties.
Increasing the value of k leads to a finer division of the data, allowing for the identification of additional subfacies. This can, for instance, distinguish between clay-free and clayey sandstones or differentiate various types of siltstones. Thus, selecting the optimal k involves balancing the geological detail of the model with the statistical validity of the identified groups.
Figure 13 illustrates the relationship between the Silhouette Coefficient and the number of clusters (ranging from 2 to 5) for three different input data scenarios:
- Clustering based only on GR data.
- Clustering based only on PHIE data.
- Clustering based only on SP data.
- Clustering based on the combined use of GR, PHIE and SP data.
The maximum Silhouette Coefficients were obtained for k=2 and k=3, indicating high statistical separation for both configurations. However, for k=3, the number of clusters is geologically justified, as it corresponds to the three main rock types: clay, siltstone, and sandstone. This suggests that dividing the data into three clusters is not only statistically optimal but also logically sound from a geological perspective, as it reflects actual rock types.
Furthermore, with k=3, the clusters are more compact and better differentiated from one another, as confirmed by the high Silhouette Coefficient. Thus, partitioning the data into three clusters represents the most natural and justified solution.
Therefore, the Silhouette Coefficient analysis serves as independent mathematical confirmation of the chosen petrophysical model for describing lithofacies.
The criteria presented in Table 2 provide a practical guide for selecting a lithofacies classification method based on the specific objectives and available resources. The cut-off method is suitable for routine, conservative evaluations when boundary values are known with certainty. Supervised ML tools are appropriate for the rapid initial processing of large data volumes.
At the same time, it is important to note that for objectives requiring high objectivity and detail in the lithofacies model, the k-means method is preferable due to its flexibility and efficiency, making it particularly suitable for scientific research and the creation of reference sections.
To enhance model performance, it is crucial to optimize the number of clusters using methods such as error curve analysis or density assessment, as well as to expand the feature set by including mineralogical composition and density. In cases where k-means has limitations, alternative algorithms—such as Density-Based Spatial Clustering of Applications with Noise (DBSCAN)—can be applied.
Integration with well-log data will allow for cluster validation, while accounting for data uncertainty using statistical methods, such as Bayesian classification, will improve the model’s accuracy. Subsequent post-processing that considers context and cluster interactions will contribute to a deeper interpretation of the results.
In conclusion, the developed approach based on k-means clustering, successfully tested on real data from the Gran Field, has proven its effectiveness, scientific rigor, and practical value. It is a powerful tool that competes effectively with traditional labor-intensive methods and the “black boxes” of commercial platforms, offering geologists an objective, reproducible, and detailed framework for lithofacies analysis. By providing an objective and reproducible method for lithofacies characterization, this approach supports data-driven decision-making throughout the entire reservoir lifecycle.
6. Conclusions
In this study, a methodological approach for automated lithofacies classification using AI techniques was developed and successfully tested, verified on the Gran Field dataset. The primary contribution of this work was the creation of an effective workflow centered around an optimized k-means clustering algorithm for analyzing petrophysical well-log data.
The analysis confirmed that the proposed methodology overcomes the fundamental limitations of the traditional approach, which relies on the subjective selection of cut-off values. It also offers significant improvements in efficiency and interpretability of results compared to supervised machine learning tools.
Specifically, it was demonstrated that a two-dimensional feature space is sufficient for a statistically valid and geologically interpretable division of the section into main lithofacies. The objective selection of the optimal number of clusters (k=3), achieved by maximizing the Silhouette Coefficient, and the subsequent visualization of results using PCA, showed that the groups identified by the algorithm align with petrophysical patterns and reflect the lithological heterogeneity of the pay zones.
To facilitate practical deployment, a dedicated web-based application was developed in Python using the Streamlit framework. This platform provides an interactive environment for end-to-end processing of petrophysical datasets, including automated cleaning, feature scaling, and k-means hyperparameter tuning. The application also integrates real-time visualization modules, such as multivariate cross-plots and lithofacies tracks, and offers quantitative validation through Silhouette coefficient metrics.
The developed web application ensures high efficiency and reproducibility in the interpretation process, making the methodology accessible to geologists and petrophysicists without the need for specialized programming knowledge.
This tool provides a ready-made solution for the rapid identification of lithofacies in new wells or areas and can easily be adapted to solve related problems, such as integrating additional well-log curves or implementing alternative clustering algorithms, including DBSCAN.
In summary, the developed methodology offers a comprehensive, reproducible, and practical framework that not only automates routine interpretation but also significantly enhances the detail and objectivity of lithofacies modeling, forming a reliable foundation for subsequent geological and hydrodynamic modeling.
A comparative analysis was conducted to evaluate the proposed workflow against traditional approaches. The effectiveness of the proposed method was assessed in comparison to the traditional cut-off method and supervised machine learning tools. It was found that the k-means-based approach outperforms the others on key criteria:
- High objectivity;
- High detail (identifies fine-scale heterogeneity);
- Interpretability (direct link between clusters and petrophysical properties);
- Flexibility.
A promising direction for advancing the presented methodology is the investigation and integration of clustering algorithms based on data density, specifically the DBSCAN method. Unlike k-means, DBSCAN does not require a priori specification of the number of clusters; instead, it determines the clusters automatically based on the local density of points in the feature space, with the ability to identify optimal groupings. This approach is particularly relevant for analyzing complex geological sections characterized by an unclear number of lithofacies, the presence of transitional zones with complex morphology, and intervals affected by anomalies such as tectonic disturbances or secondary rock alterations.
The future integration of DBSCAN is expected to significantly enhance the stochastic adaptability of the classification framework, enabling high-resolution partitioning in the presence of inherent reservoir heterogeneities. The combined use of k-means and DBSCAN, along with a comparative analysis of their results on an expanded dataset of well-log data, will pave the way for the development of next-generation intelligent analytical systems to support decision-making in reservoir property assessment and mineral resource estimation.
Author Contributions
Conceptualization, A.A., A.S., Z.K. and Y.T; methodology, A.A.; software, A.S.; validation, A.A., A.S., S.Z and Y.S..; formal analysis, A.S.; investigation, Y.S.; resources, Z.K.; data curation, Y.T.; writing—original draft preparation, A.A.; writing—review and editing, A.S.; visualization, S.Z.; supervision, A.A.; project administration, A.S.; funding acquisition, Z.K. All authors have read and agreed to the published version of the manuscript.
Data Availability Statement
The authors declare that the data supporting the findings of this study are available within the paper.
Conflicts of Interest
The authors declare no conflicts of interest.
Abbreviations
The following abbreviations are used in this manuscript:
| AI | Artificial intelligence |
| AL | Acoustic log |
| CALI | Caliper log |
| COLL | Log curve convergence |
| CSAT | Hydrocarbon-saturated porosity |
| DBSCAN | Density-Based Spatial Clustering of Applications with Noise |
| RHOB | Density gamma-gamma log |
| GR | Gamma-ray log |
| HRIL | High-resolution induction log |
| IL | Induction log |
| LL | Lateral log |
| LLS | Lateral electric sounding |
| ML | Machine learning |
| LL shallow | Micro-lateral log |
| NGL | Neutron-gamma log |
| NPHI | Neutron porosity log |
| PC1 | The first principal component |
| PC2 | The second principal component |
| PCA | Principal Component Analysis |
| PHIE | Porosity |
| RHOB | Density logging |
| Rt | Resistivity log |
| SGR | Spectral gamma-ray log |
| SP | Spontaneous potential log |
| TL | Temperature logging |
| SVM | Support vector machine |
| TNL | Thermal neutron log |
| VCLAV | Volume of clay |
| 1 | Schlumberger |
References
- Yu W., Chen X., Dong J., Wang X., An F., Wang B., Xiao D., Tang Z., Lv L., Liu Y., et al. A New Supervised AI Logging Lithofacies Identification Technique and its Application in K Oilfield in the Middle East // GOTECH Conference : proceedings of the GOTECH Conference held in Dubai, UAE, 7-9 May, 2024, Society of Petroleum Engineers. – SPE-219193-MS. –. [CrossRef]
- Kolbikova E.S. lithofacies analysis and prediction of properties based on geophysical and seismic data using machine learning methods.: Roxar Paradigm – Software and Solutions LLC. Moscow, 2021, 120 p.
- Merembayev T., Kurmangaliyev B., Bekbauov B., Amanbek Ye. A comparison of machine learning algorithms in predicting lithofacies: Case studies from Norway and Kazakhstan. Energies. Vol. 14, No. 7, 2021, p. 1896. [CrossRef]
- Shamaev S.D. Application of artificial intelligence methods in processing and interpretation of geophysical data. Izvestiya UGGU, No. 1 (65), 2022, pp. 86-101.
- Klemens Katterbauer, Abdallah Al Shehri. A Novel Well Log Data Quality Prescriptive Framework for Enhancing Well Log Data Quality Interpretation / Proceedings of the Middle East Oil, Gas and Geosciences Show held in Manama, Bahrain, 19–21 February 2023, Society of Petroleum Engineers. – SPE-213224-MS. –. [CrossRef]
- E. Abetov, A. K. Seitzhanov, Ye. R. Samenov. Application of machine learning methods and neural networks in the objectives of lithofacies mapping and reservoir properties assessment: analysis and selection of methods // ANAS Transactions. Earth Sciences. – 2025. – Vol. 1. – P. 42-51. –. [CrossRef]
- Y. Xie, C. Zhu, W. Zhou, Z. Li, X. Liu, and M. Tu, ‘‘Evaluation of machine learning methods for formation lithology identification: A comparison of tuning processes and model performances, Journal of Petroleum Science and Engineering, vol. 160, pp. 182–193, 2018.
- Mazahir Hussain, Shuang Liu, Umar Ashraf, Muhammad Ali, Wakeel Hussain, Nafees Ali and Aqsa Anees. 2022. Application of Machine Learning for Lithofacies Prediction and Cluster Analysis Approach to Identify Rock Type. Energies 2022, 15, 4501. [CrossRef]
- Dong Yue, Hou Jiagen, Cao Gang, etc. Analysis of lithofacies and reservoir characteristics of nearshore subaqueous fan-- taking Yan227 area of Yanjia oilfield as an example[J]. Lithologic reservoir, 2015, 27(5):60-66.
- P. Avseth and T. Mukerji, Seismic lithofacies classification from well logs using statistical rock physics, Petrophysics-The SPWLA Journal of Formation Evaluation and Reservoir Description, vol. 43, no. 02, 2002.
- A. Lawal, Y. Yang, H. He, N. L. Baisa Machine Learning in Oil and Gas Exploration: A Review / // IEEE Access. – 2024. – Vol. 12. – P. 19035-19058. [CrossRef]
- J. L. Baldwin, R. M. Bateman, and C. L. Wheatley, Application of a neural network to the problem of mineral identification from well logs, The Log Analyst, vol. 31, no. 05, 1990.
- A. Silva, I. A. L. Neto, R. M. Misságia, M. A. Ceia, A. G. Carrasquilla, and N. L. Archilha, Artificial neural networks to support petrographic classification of carbonate-siliciclastic rocks using well logs and textural information, Journal of Applied Geophysics, vol. 117, pp. 118–125, 2015.
- M. A. Sebtosheikh and A. Salehi, Lithology prediction by support vector classifiers using inverted seismic attributes data and petrophysical logs as a new approach and investigation of training data set size effect on its performance in a heterogeneous carbonate reservoir, Journal of Petroleum Science and Engineering, vol. 134, pp. 143–149, 2015.
- M. He, H. Gu, J. Xue, Log interpretation for lithofacies classification with a robust learning model using stacked generalization / Journal of Petroleum Science and Engineering. – 2022. – Vol. 214. – Art. 110541. –. [CrossRef]
- Gu, Y.; Bao, Z.; Song, X.; Patil, S.; Ling, K. Complex lithology prediction using probabilistic neural network improved by continuous restricted Boltzmann machine and particle swarm optimization. J. Pet. Sci. Eng. 2019, 179, 966–978.
- Junlong Zhang, Youbin He, Yuan Zhang, Weifeng Li, and Junjie Zhang. Well-Logging-Based Lithology Classification Using Machine Learning Methods for High-Quality Reservoir Identification: A Case Study of Baikouquan Formation in Mahu Area of Junggar Basin, NW China / Energies. – 2022. – Vol. 15, iss. 10. – Art. 3675. –. [CrossRef]
- Schlumberger. Petrel geophysics seismic visualization and interpretation [Electronic resource]: training course manual. – Electronic data (1 file: 401 p.). – 2013. – (Petrel E&P Software Platform 2013).
- Zakrevsky K.E. Practical guide to geological 3D modeling. Construction of a test model in Petrel 2011. - Moscow, 2012. - 114 p.
- Jing-Rui Chen, Rui-Zhao Yang, Ting-Ting Li, Yun-Di Xu & Zhi-Peng Sun. Reconstruction of well logging well logging data well ogging data using unsupervised machine learning-based outlier detection techniques (UML-ODTs) under adverse drilling conditions. 2025, Applied Geophysics.
- Ahmed, S., Lee, Y. D., Hyun, S. H., et al.,, Unsupervised Machine Learning-Based Detection of Covert Data Integrity Assault in Smart Grid Networks Utilizing Isolation Forest: IEEE Transactions on Information Forensics and Security, 14(10), 2765–2777.
- Zhang J., Liu G., Wei Z., Li S., Zayier Y., Cheng Y. Machine Learning-Based Prediction of Well Logs Guided by Rock Physics and Its Interpretation // Sensors. — 2025. — Vol. 25, no. 3, Art. 836. — P. [1–16]. —. [CrossRef]
- Chopra S., Marfurt K. J. Seismic facies classification using some unsupervised machine learning methods // SEG Technical Program Expanded Abstracts 2018. – 2018. [CrossRef]
- JSC «Embamunaigas», Recalculation of oil and gas reserves of the Gran field of the Atyrau region of the Republic of Kazakhstan as of 01/02/2017 (executor NII «Kaspiymunaygaz».): internal technical report / Atyrau, 2017, In Russian.
- Barnes, A. E., 2007, Redundant and useless seismic attributes: Geophysics, 72, no. 3, P33–P38. [CrossRef]
- Rautenstrauch P., Ohler U. Shortcomings of silhouette in single-cell integration benchmarking // Nature Biotechnology. 2025. https://www.nature.com/articles/s41587-025-02345-4.
- Shahapure K. R., Nicholas C. Cluster Quality Analysis Using Silhouette Score // 2020 IEEE 7th International Conference on Data Science and Advanced Analytics (DSAA): proceedings of the conference, Sydney, Australia, 6–9 October 2020. — Piscataway: IEEE, 2020. —. [CrossRef]
Figure 1.
The process of the k-means clustering method in the developed web application.

Figure 2.
Well Log Analysis Suite platform start interface.
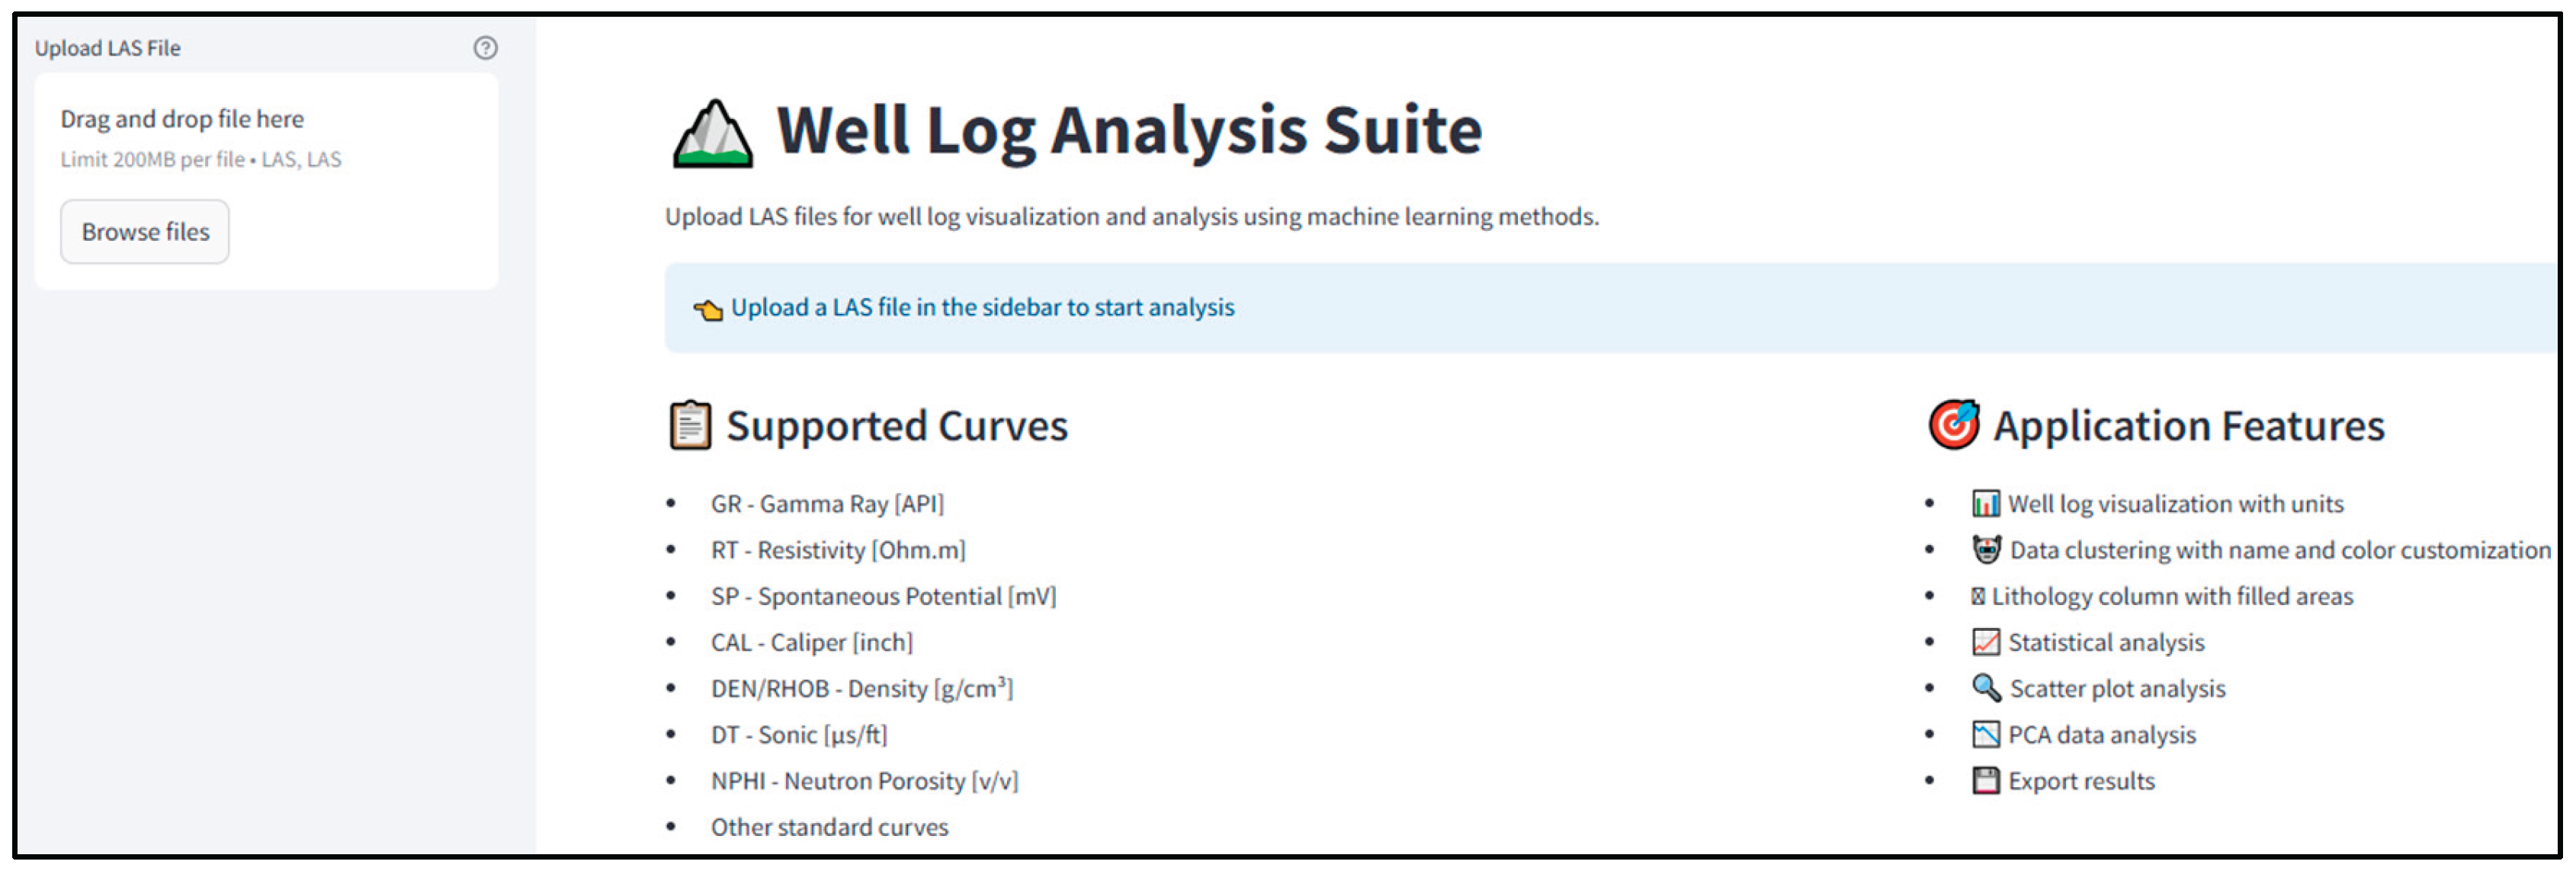
Figure 3.
Setting up clustering parameters and lithofacies group configuration.
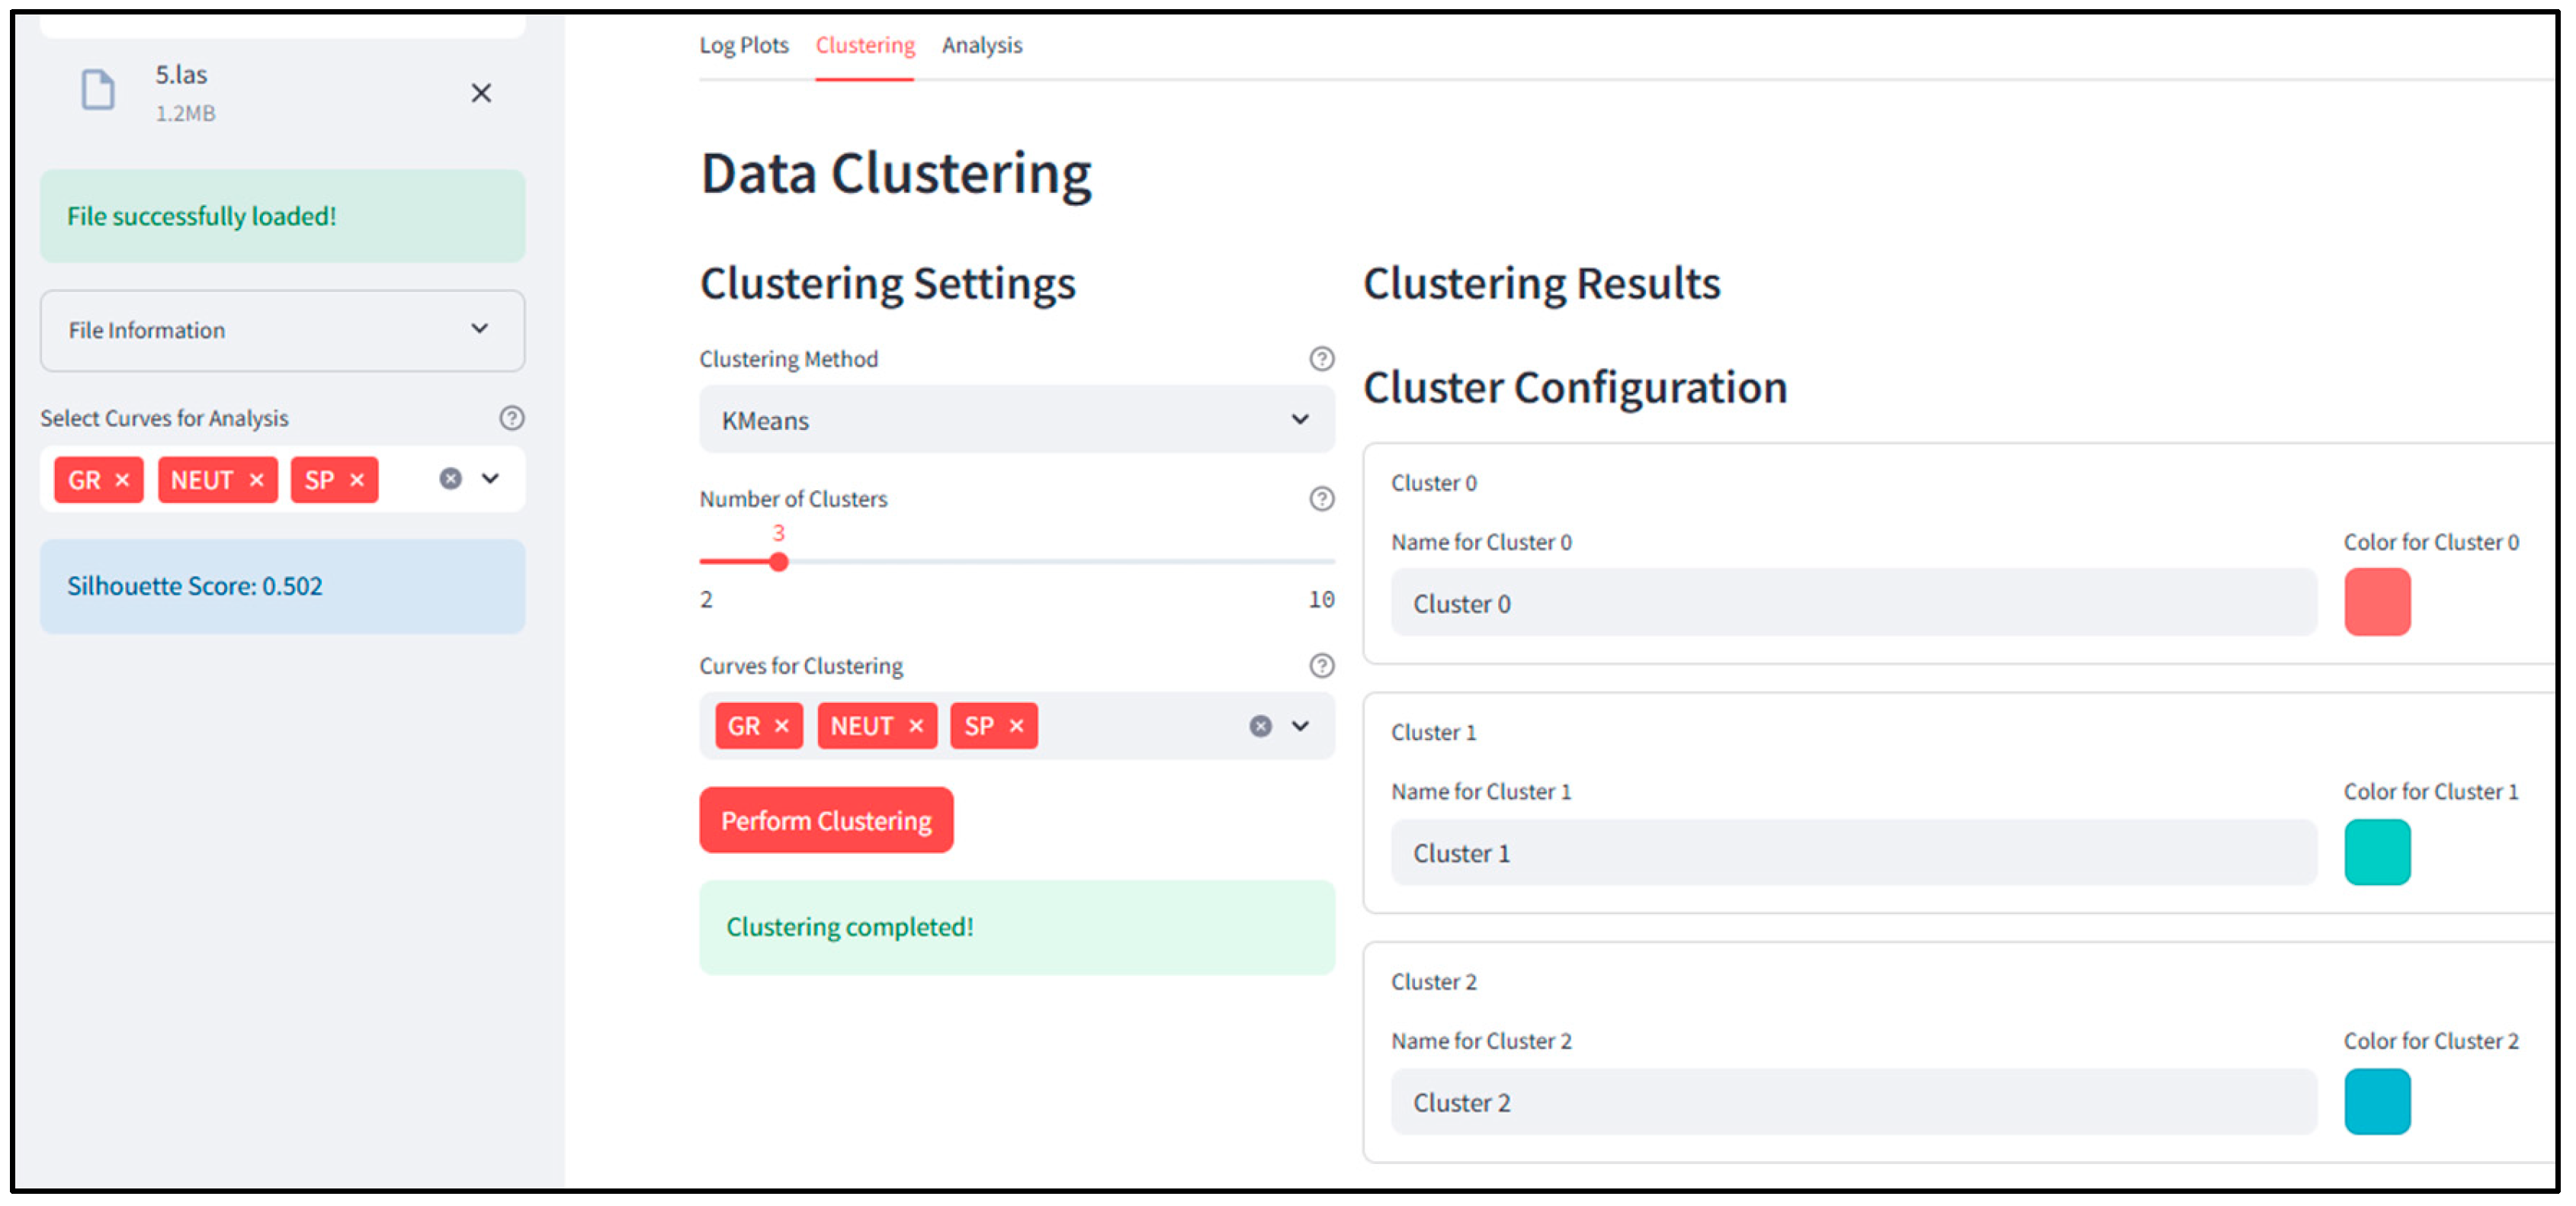
Figure 4.
Results of automated classification of lithofacies.
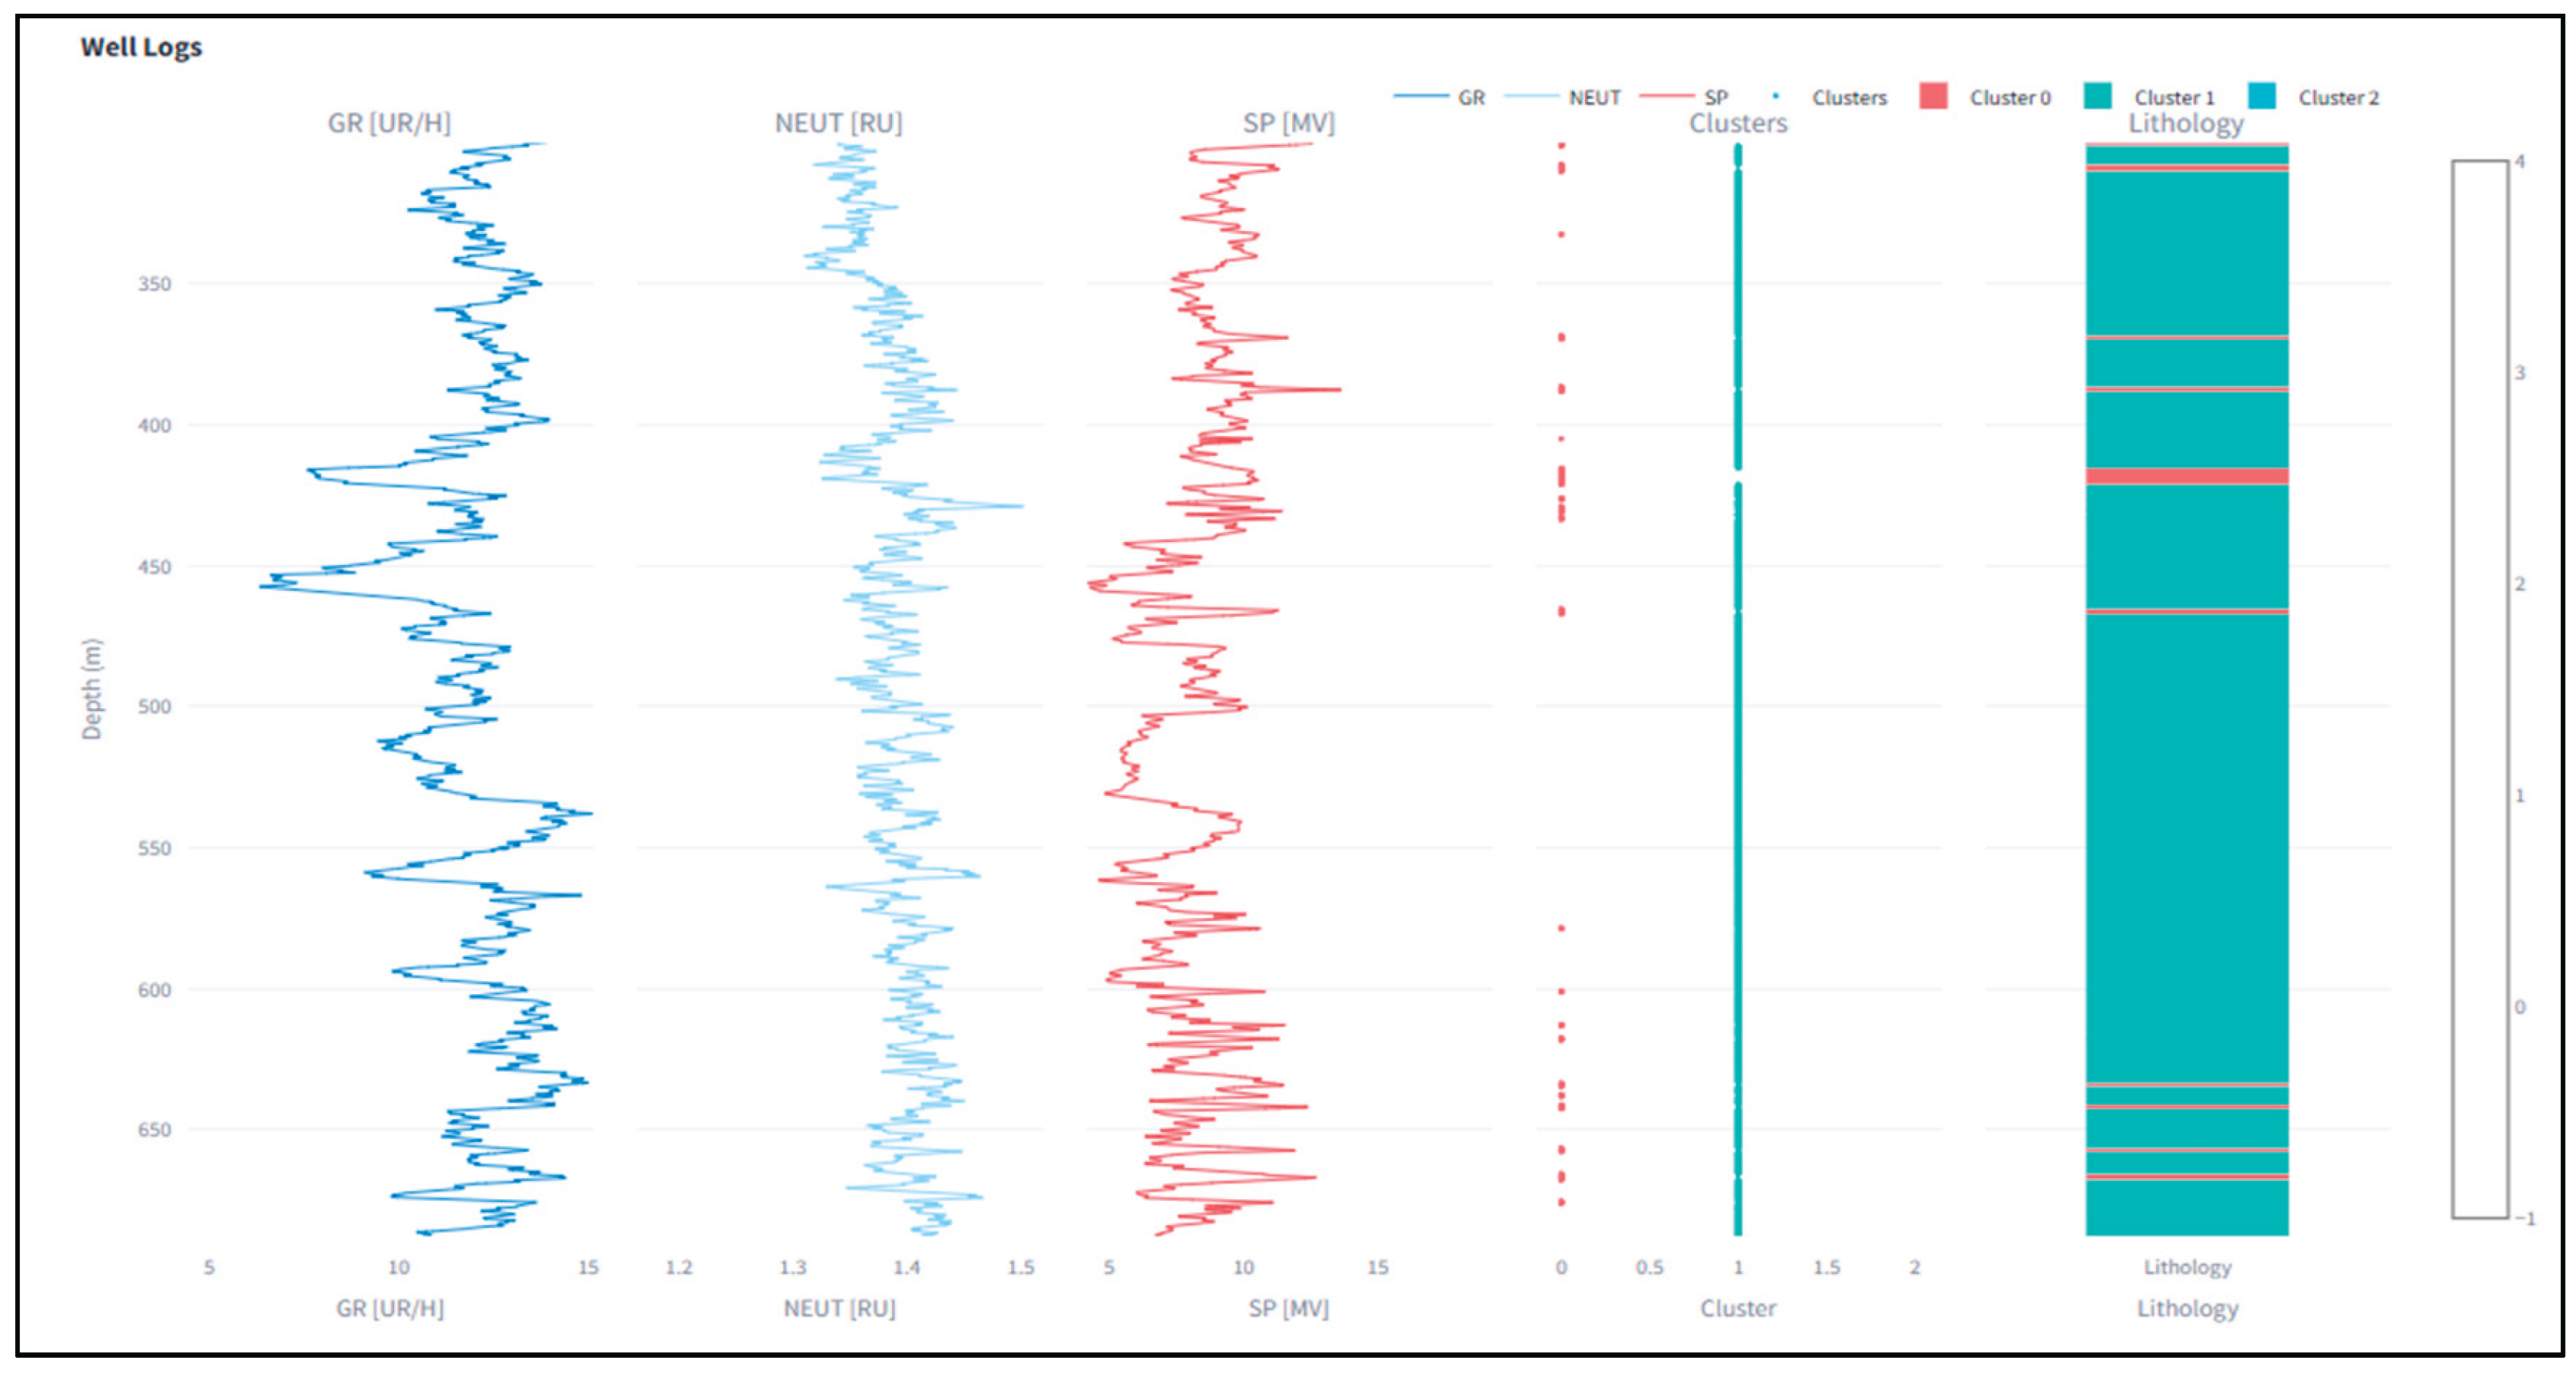
Figure 5.
Visualization of the relationships between well-log parameters and PCA projection.
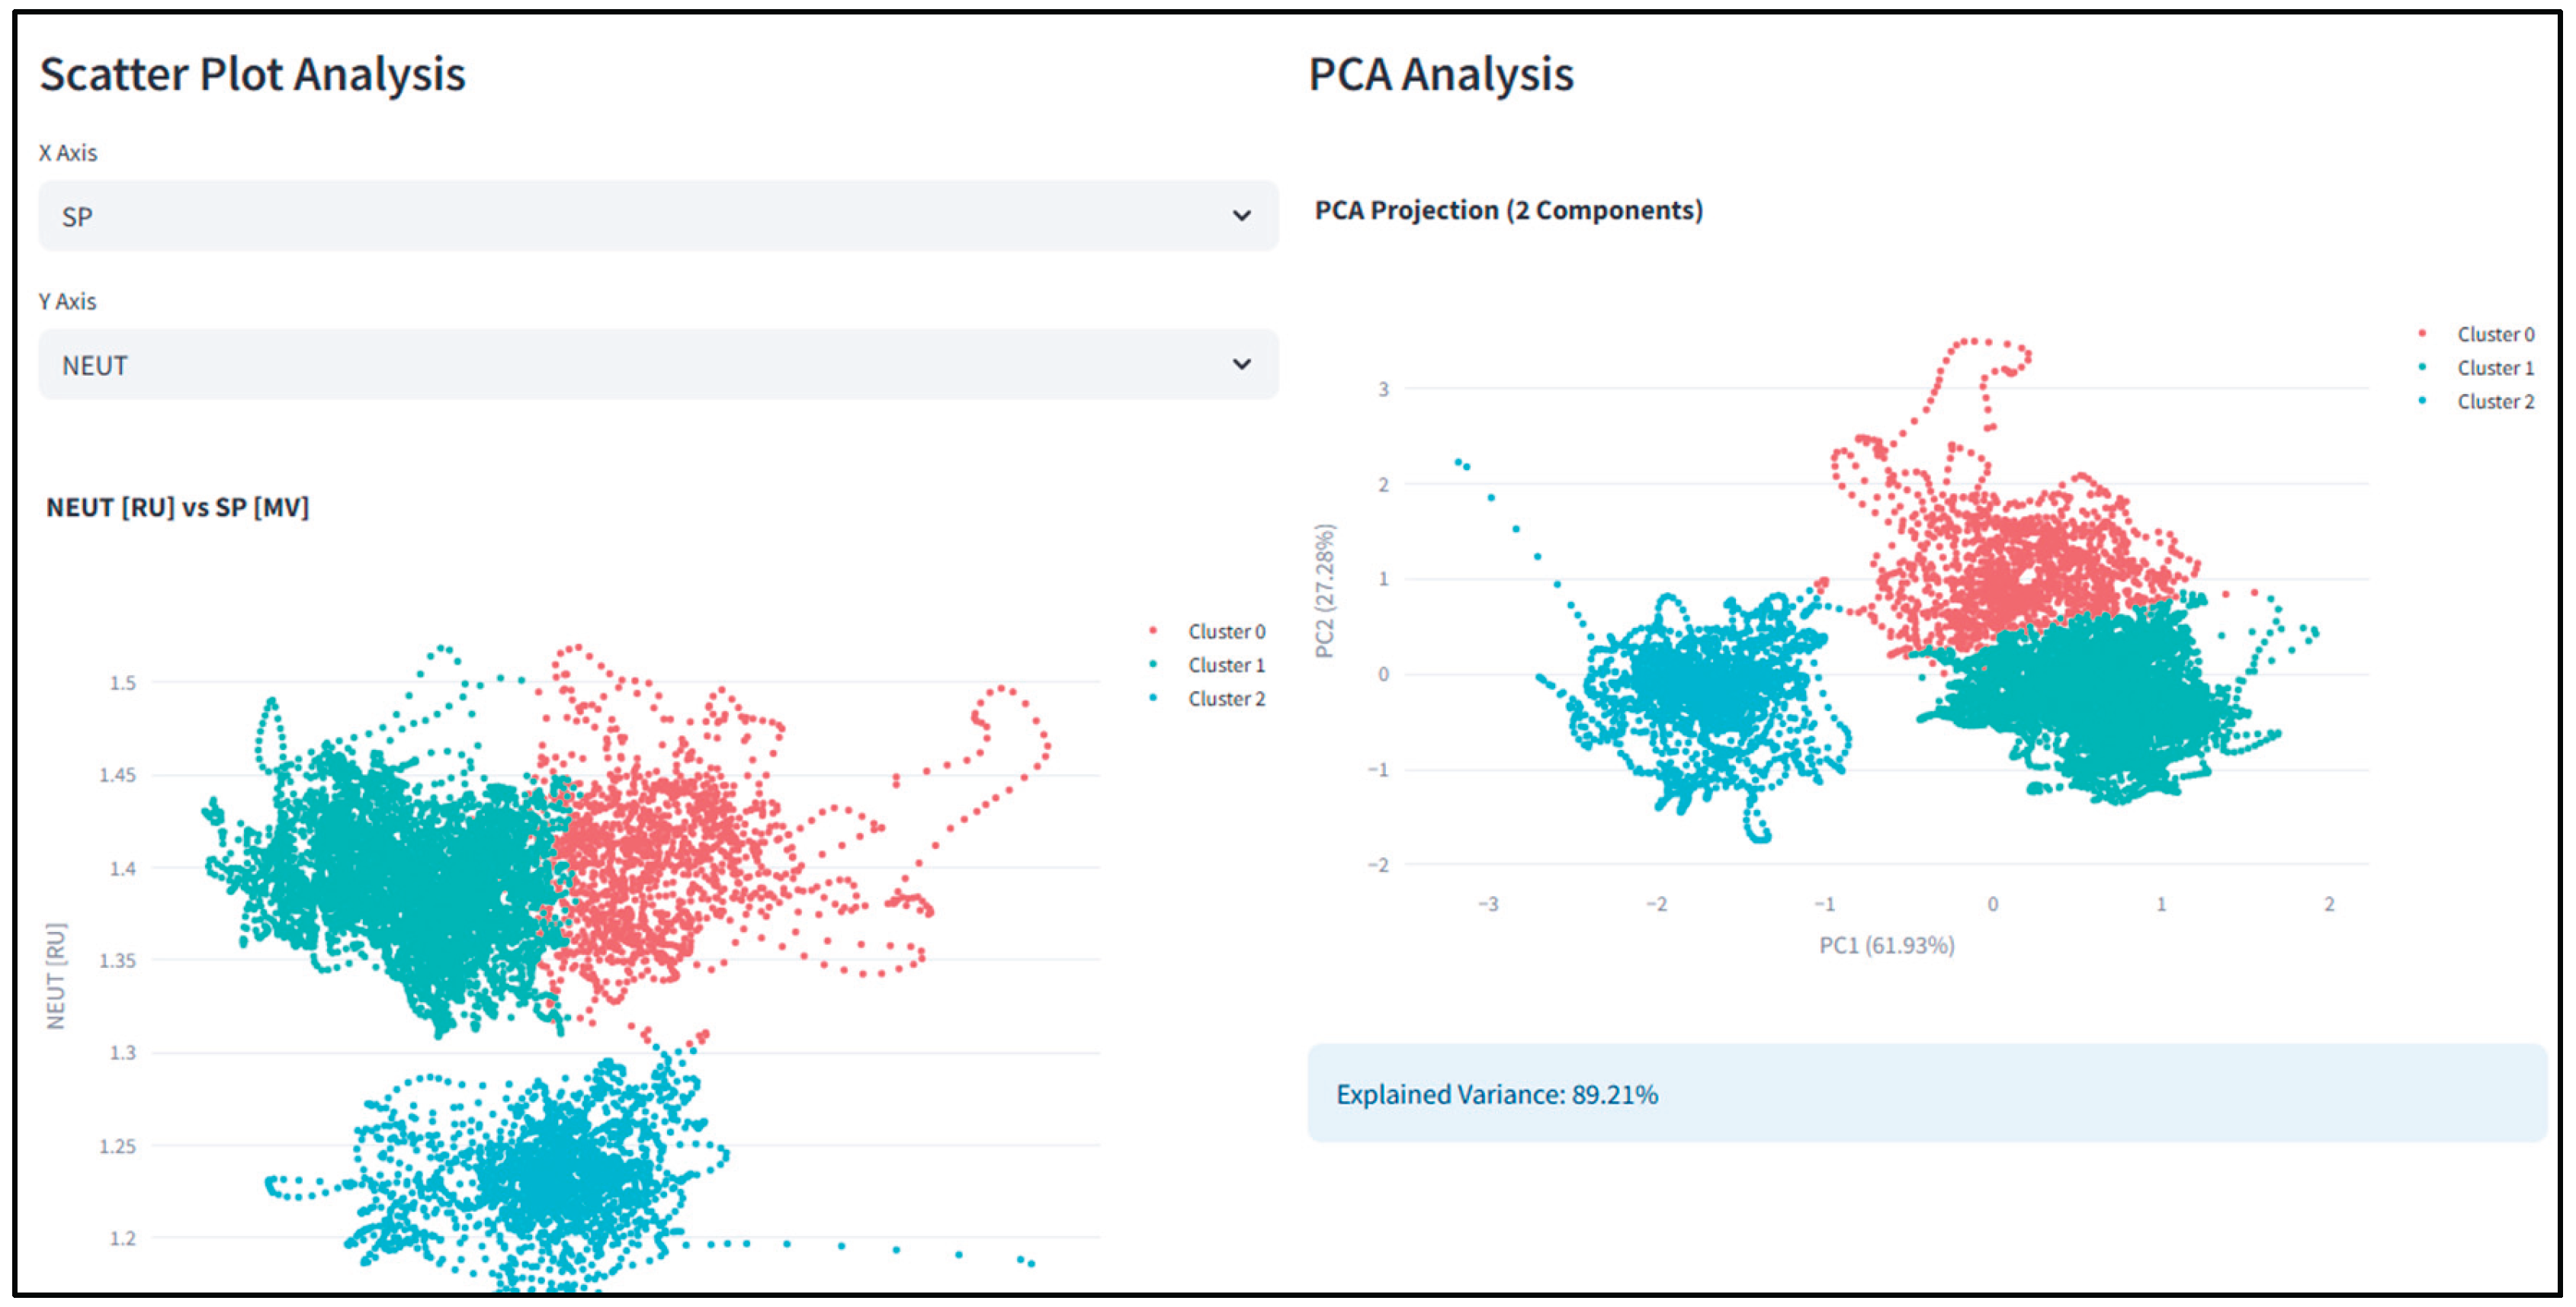
Figure 6.
Structural map of the Gran Field along reflecting horizon III [24].
Figure 6.
Structural map of the Gran Field along reflecting horizon III [24].
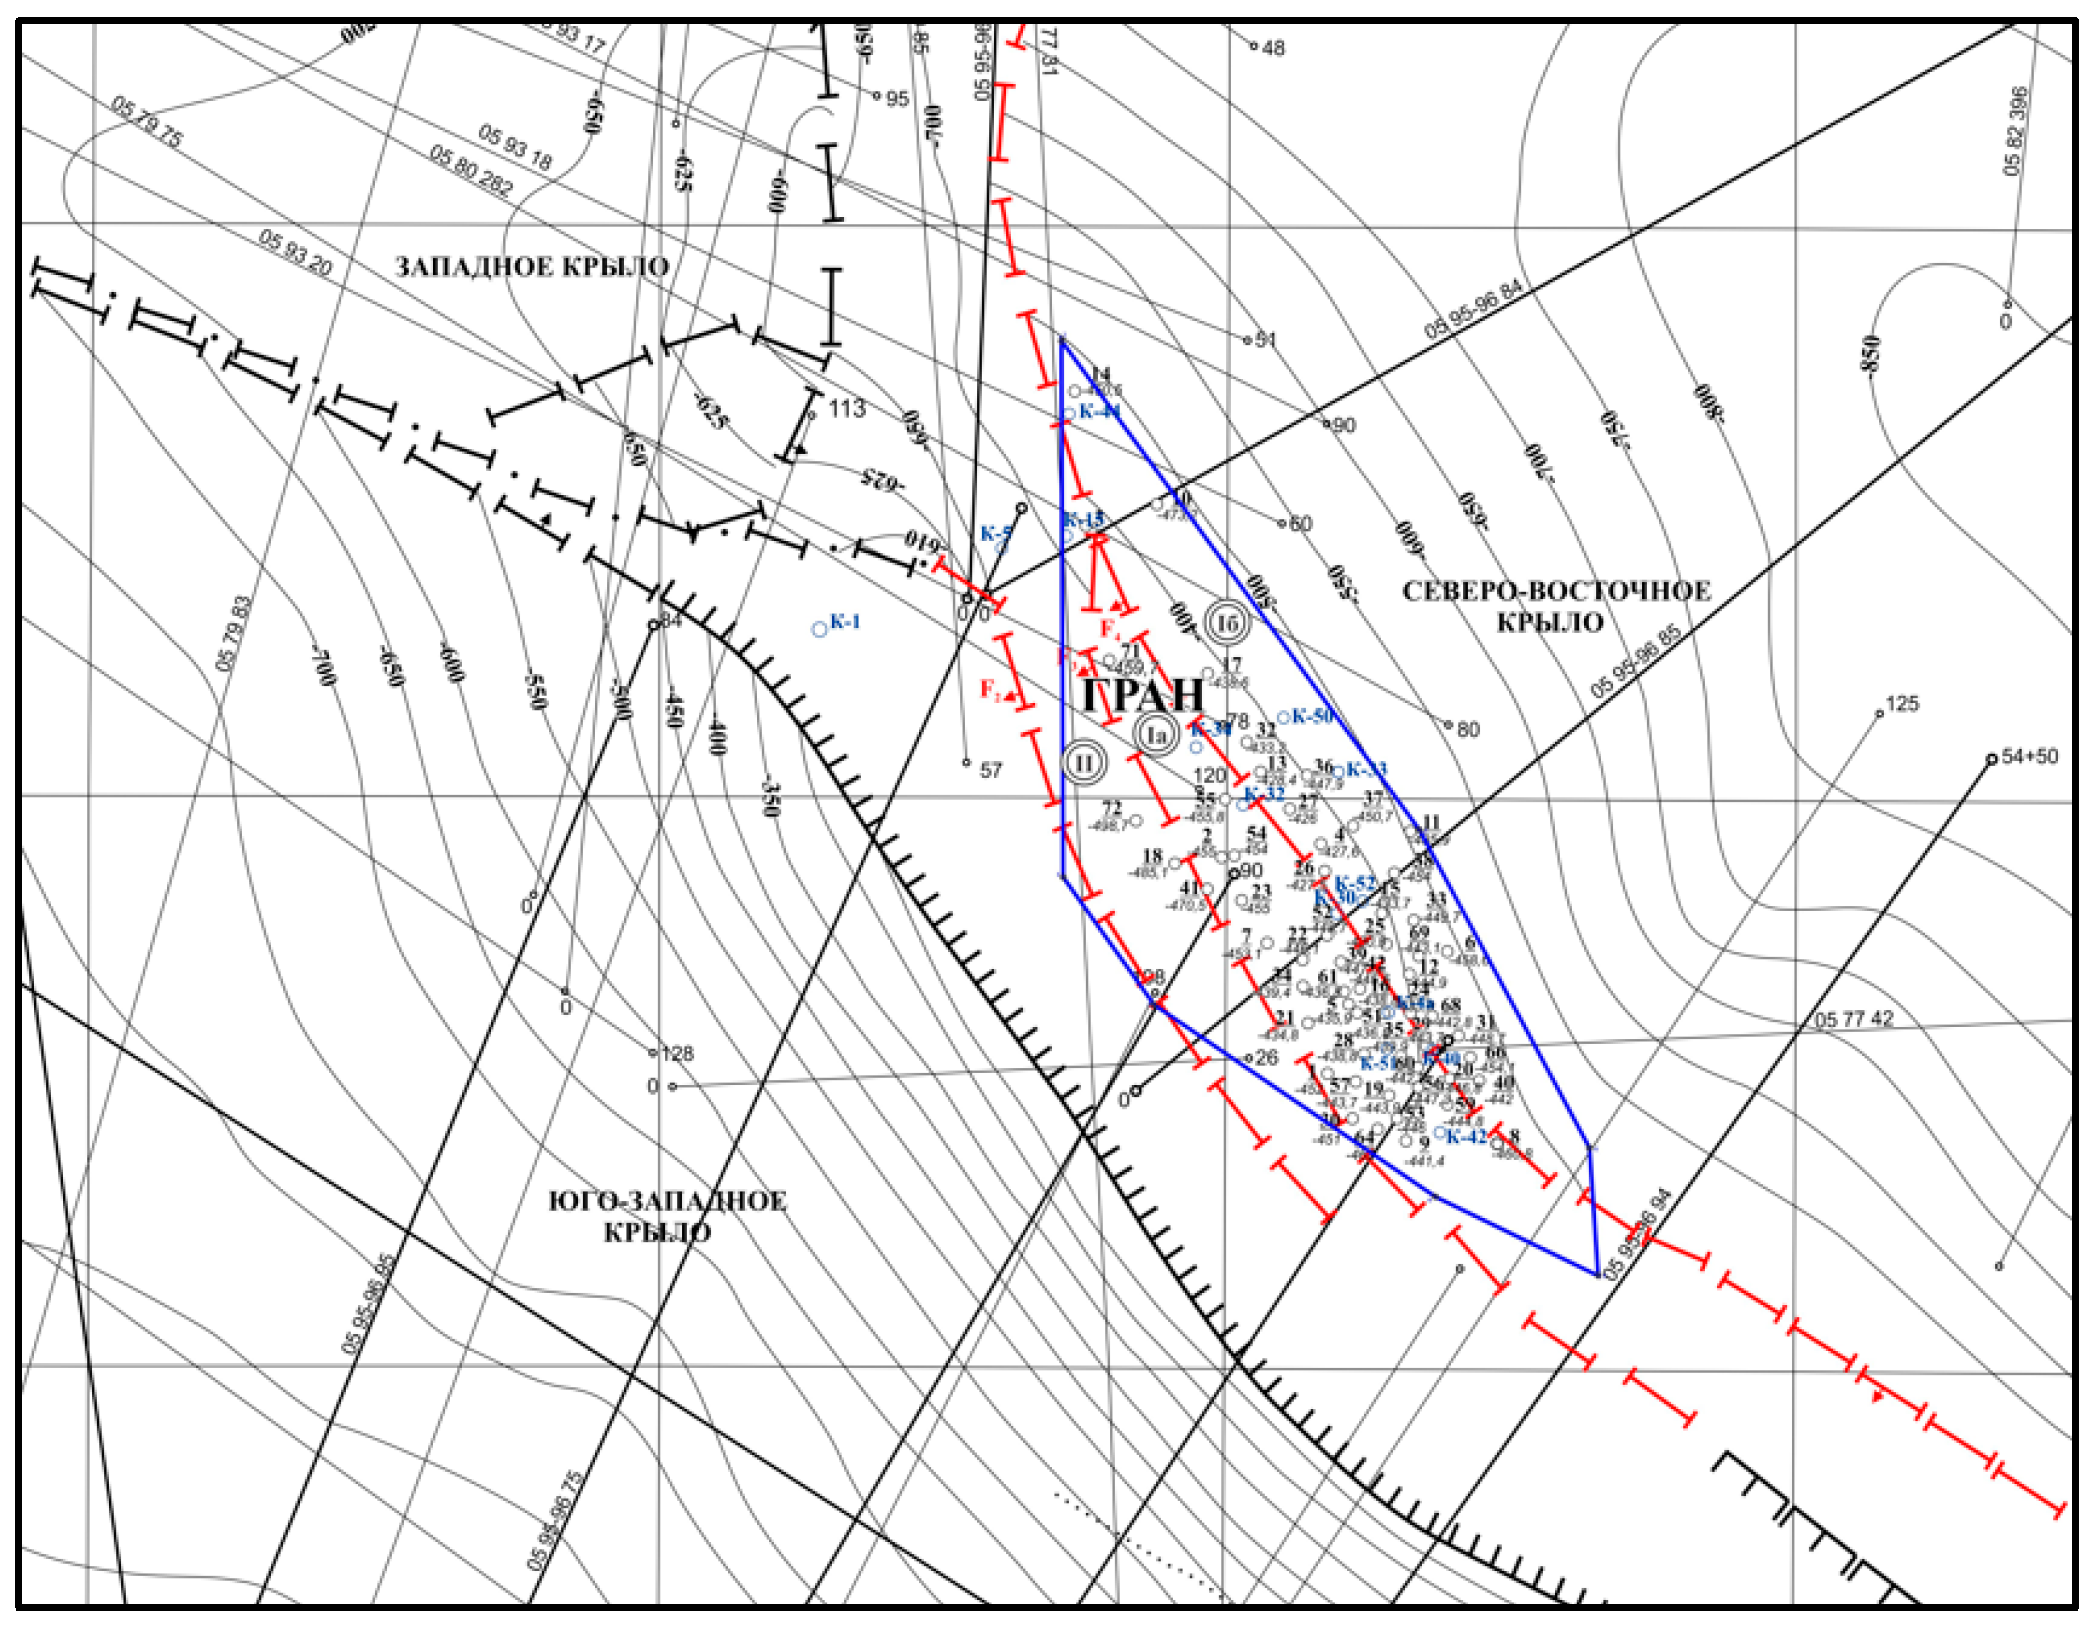
Figure 7.
Geological profile of the Gran deposit along line I-I [24].
Figure 7.
Geological profile of the Gran deposit along line I-I [24].
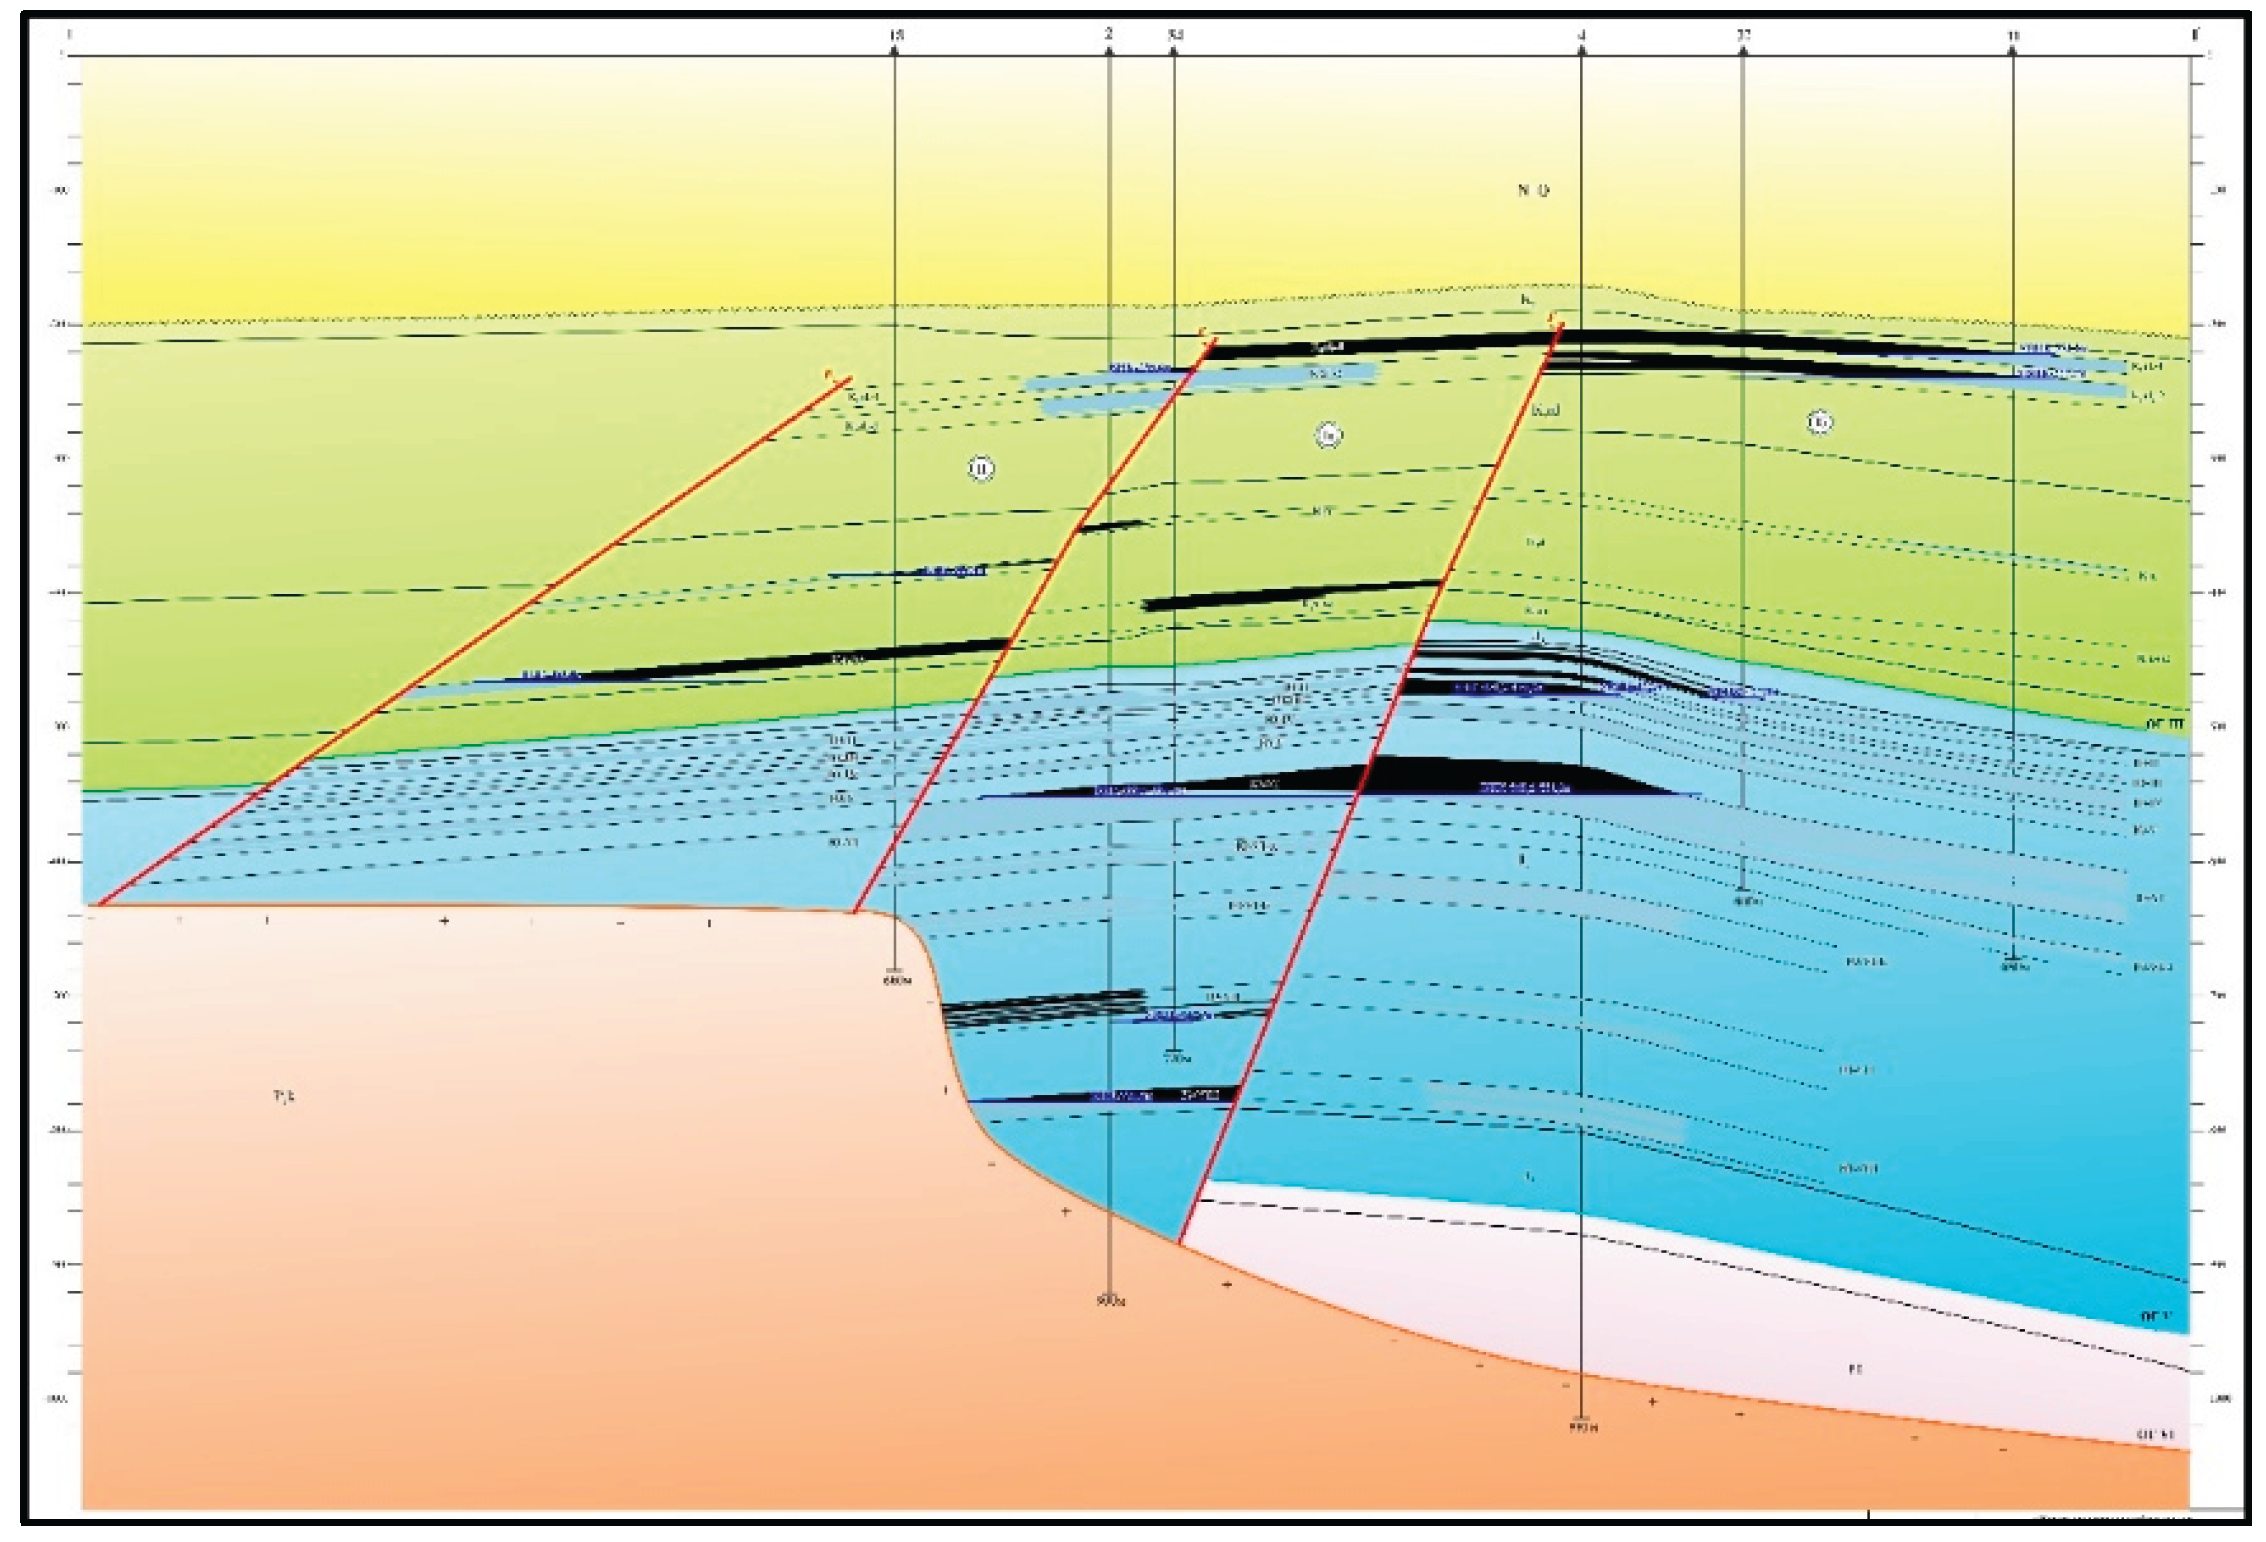
Figure 8.
Logging data for intervals of wells: (a) 35; (b) 28.
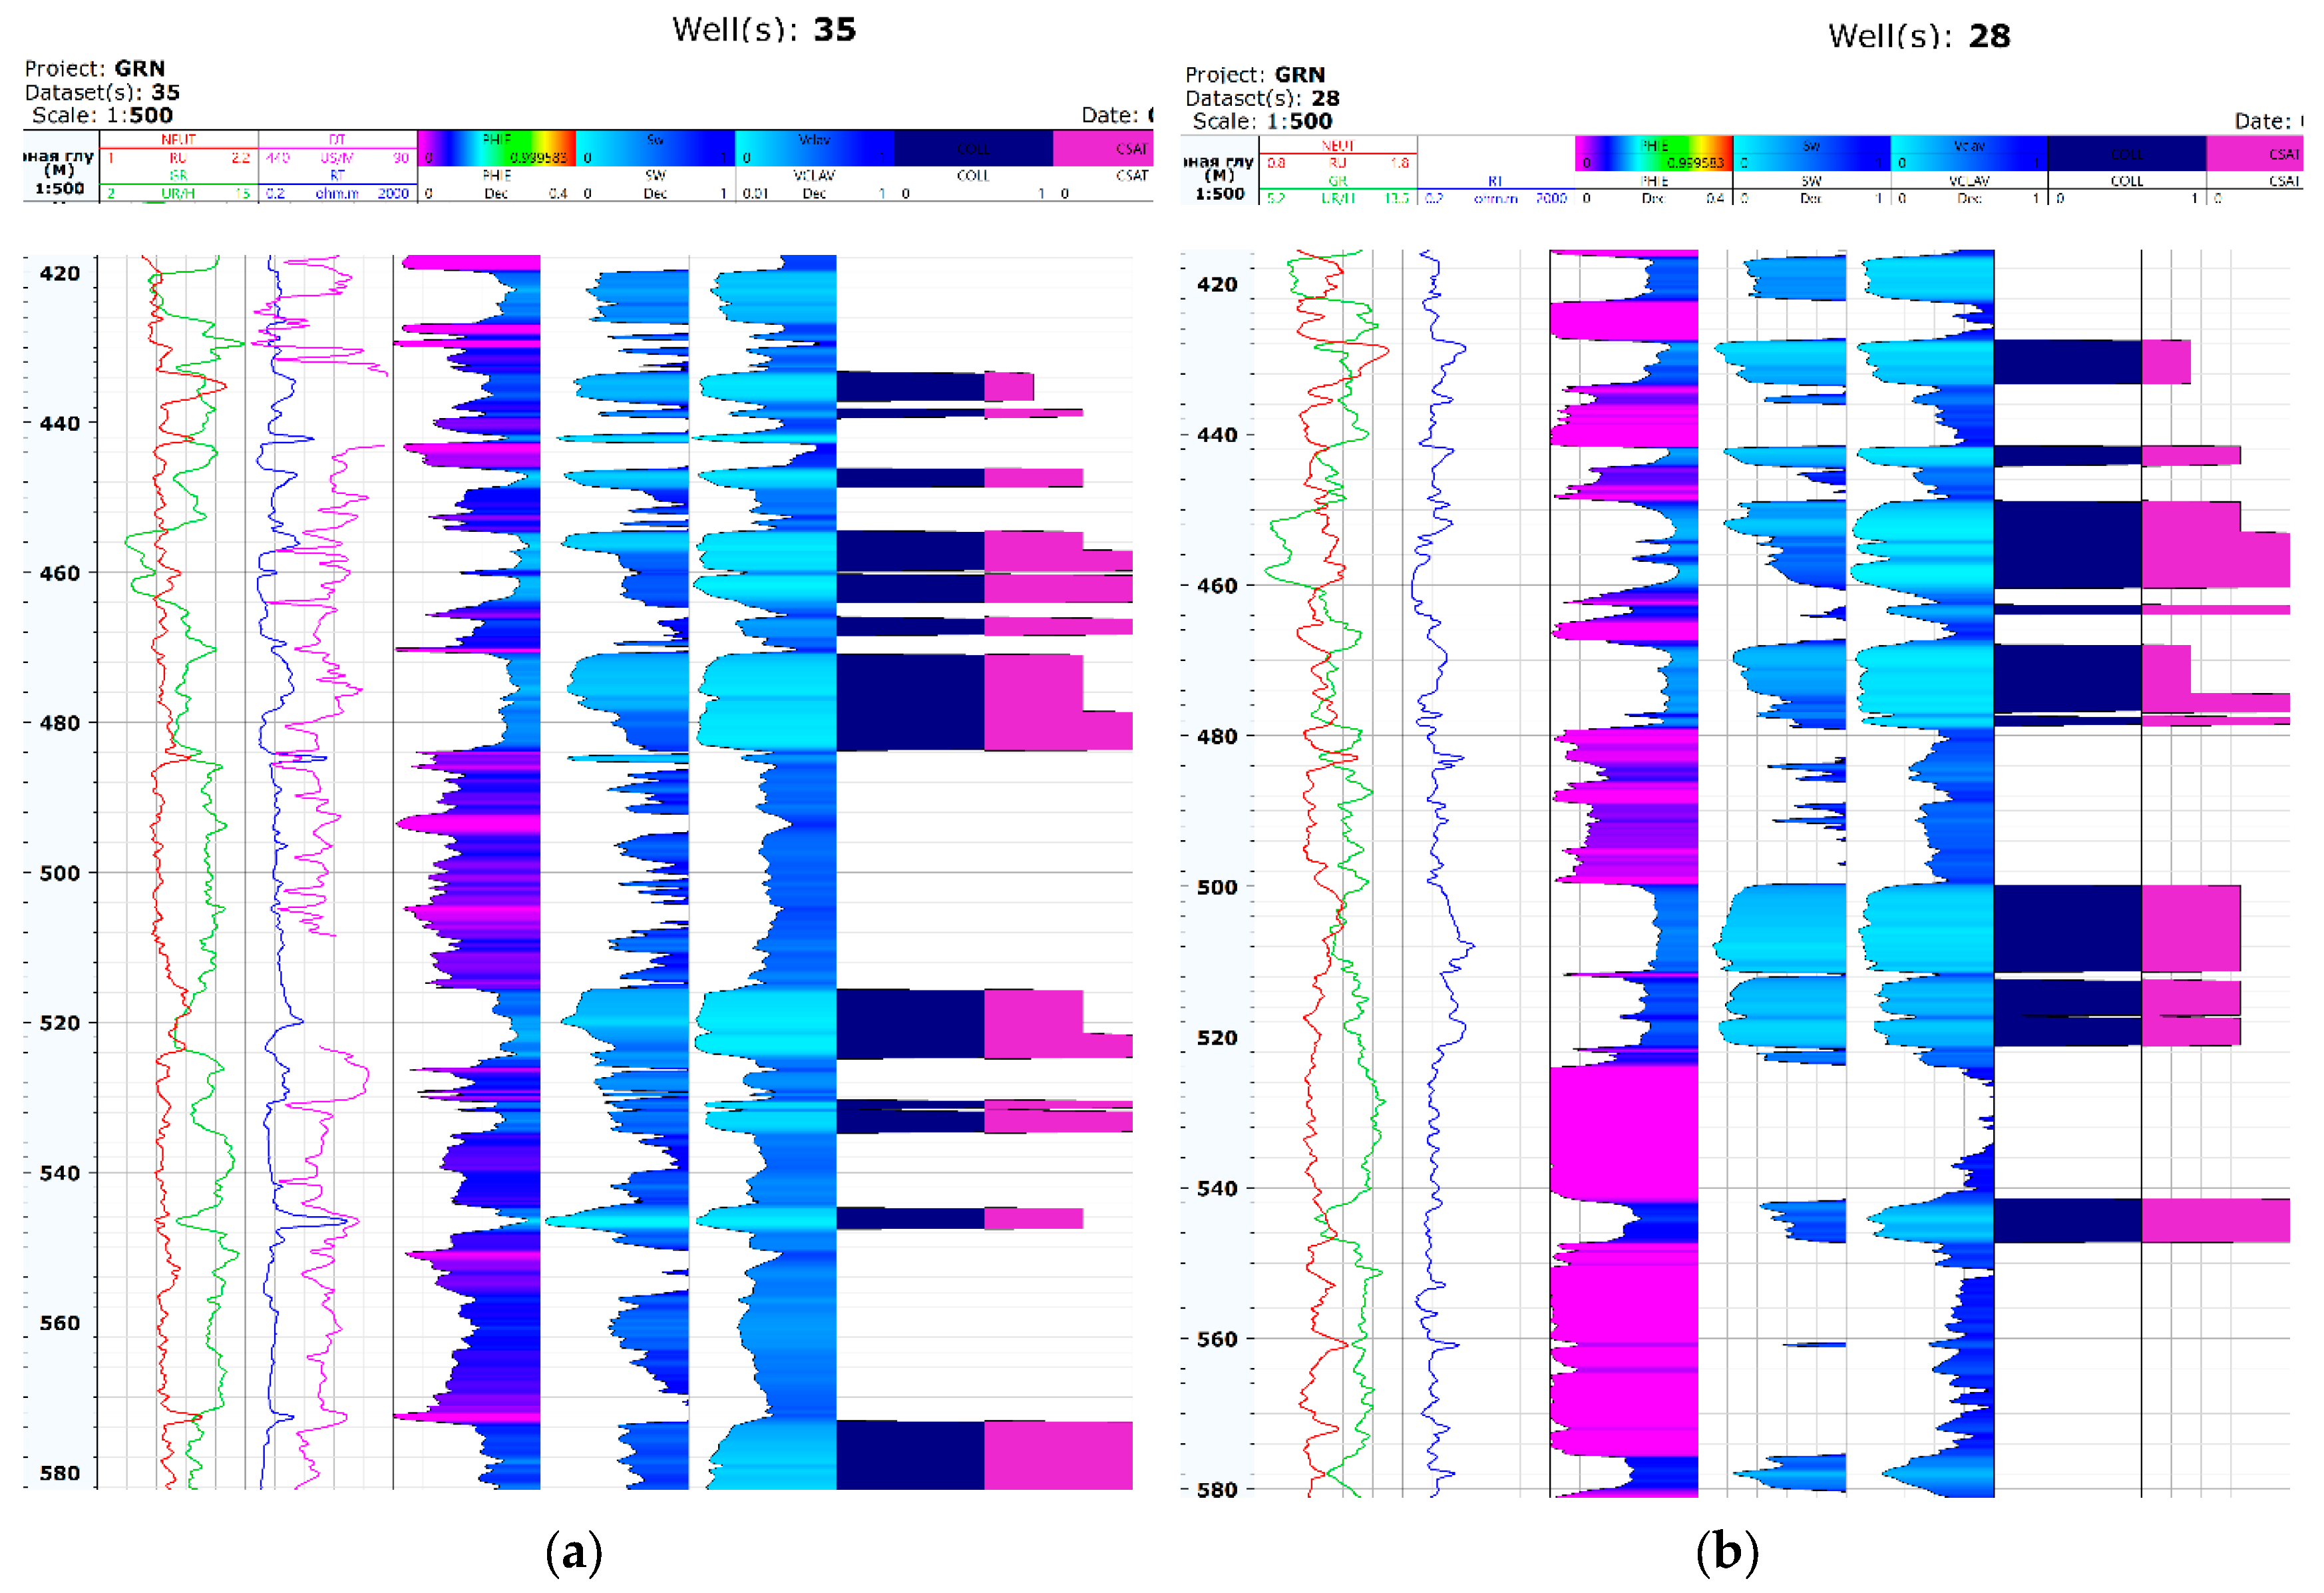
Figure 9.
Results of lithofacies classification based on well-log data with cut-off values, supervised learning, and unsupervised learning. (Legend: GR – gamma-ray; NEUT - neutron porosity; SP - spontaneous potential; Core porosity; PHIE new - porosity from neutron log; SW - water saturation; Facies_cutoff - lithofacies using cut-offs; Supervised AI - supervised learning; Unsupervised AI - unsupervised learning).
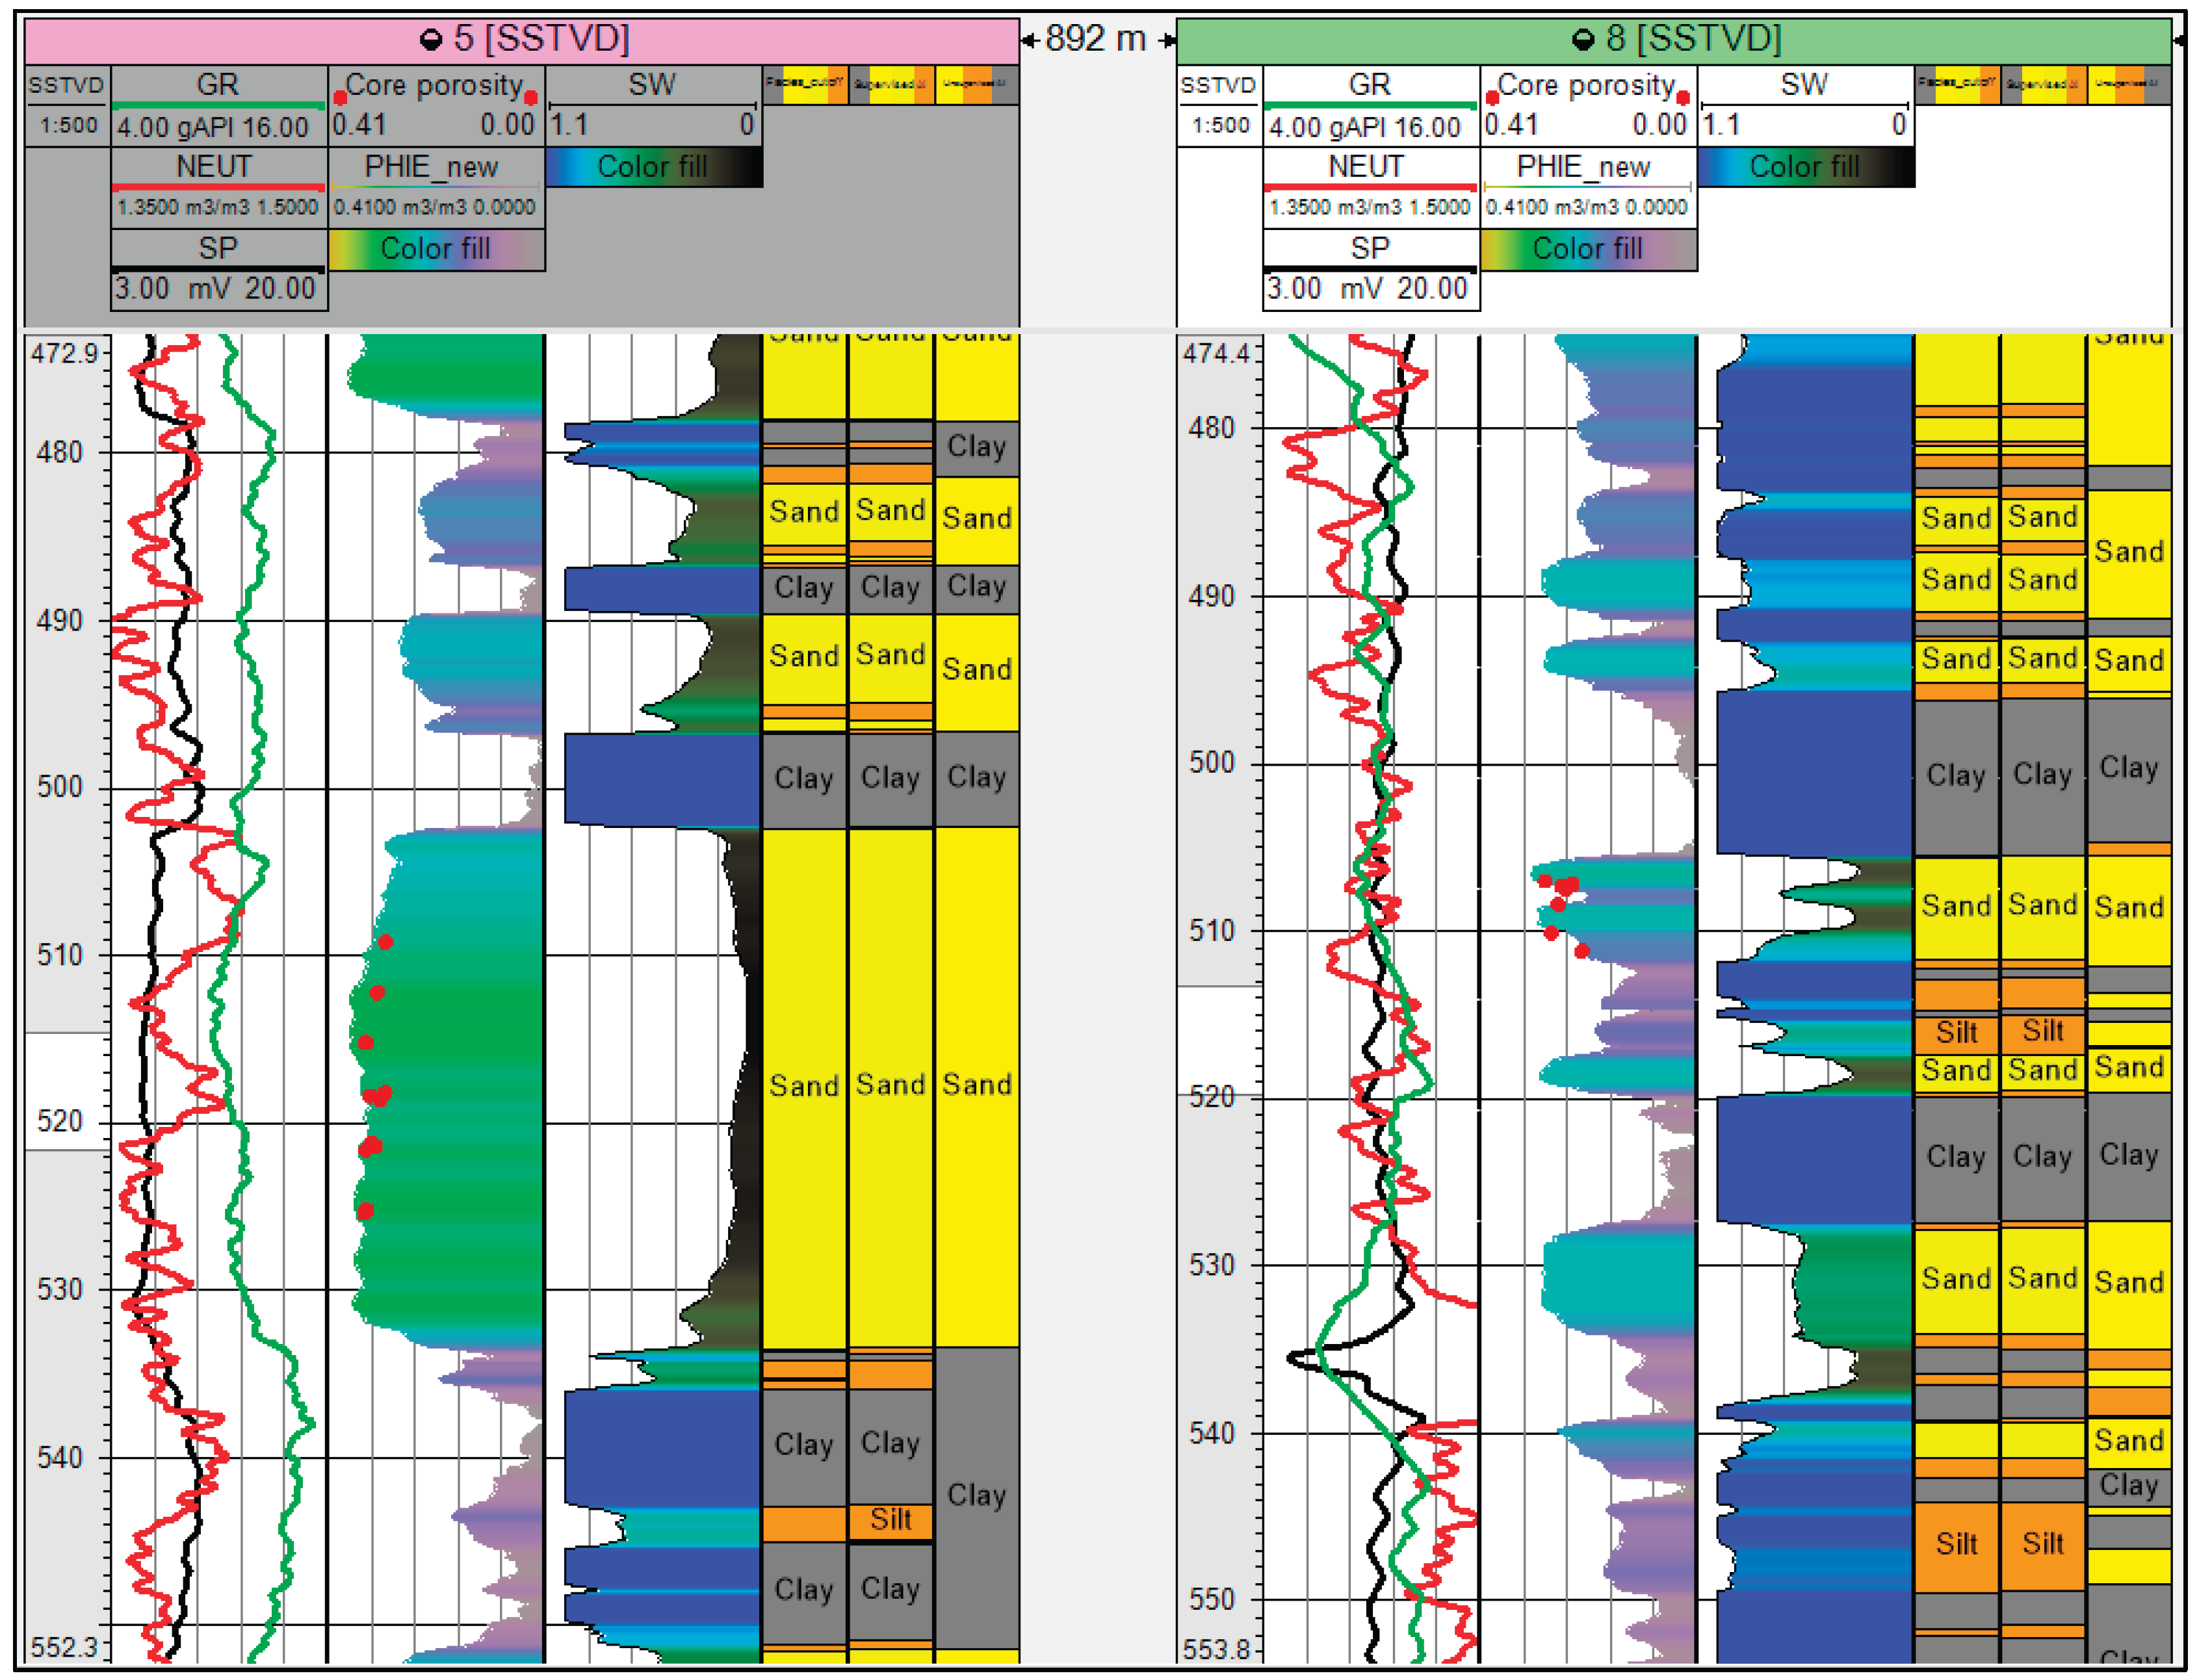
Figure 10.
Results of automated lithofacies classification using the k-means method for Well 31. (Legend: GR - gamma ray; PHIE - porosity from neutron log; SP - spontaneous potential; clusters - clusters).
Figure 10.
Results of automated lithofacies classification using the k-means method for Well 31. (Legend: GR - gamma ray; PHIE - porosity from neutron log; SP - spontaneous potential; clusters - clusters).
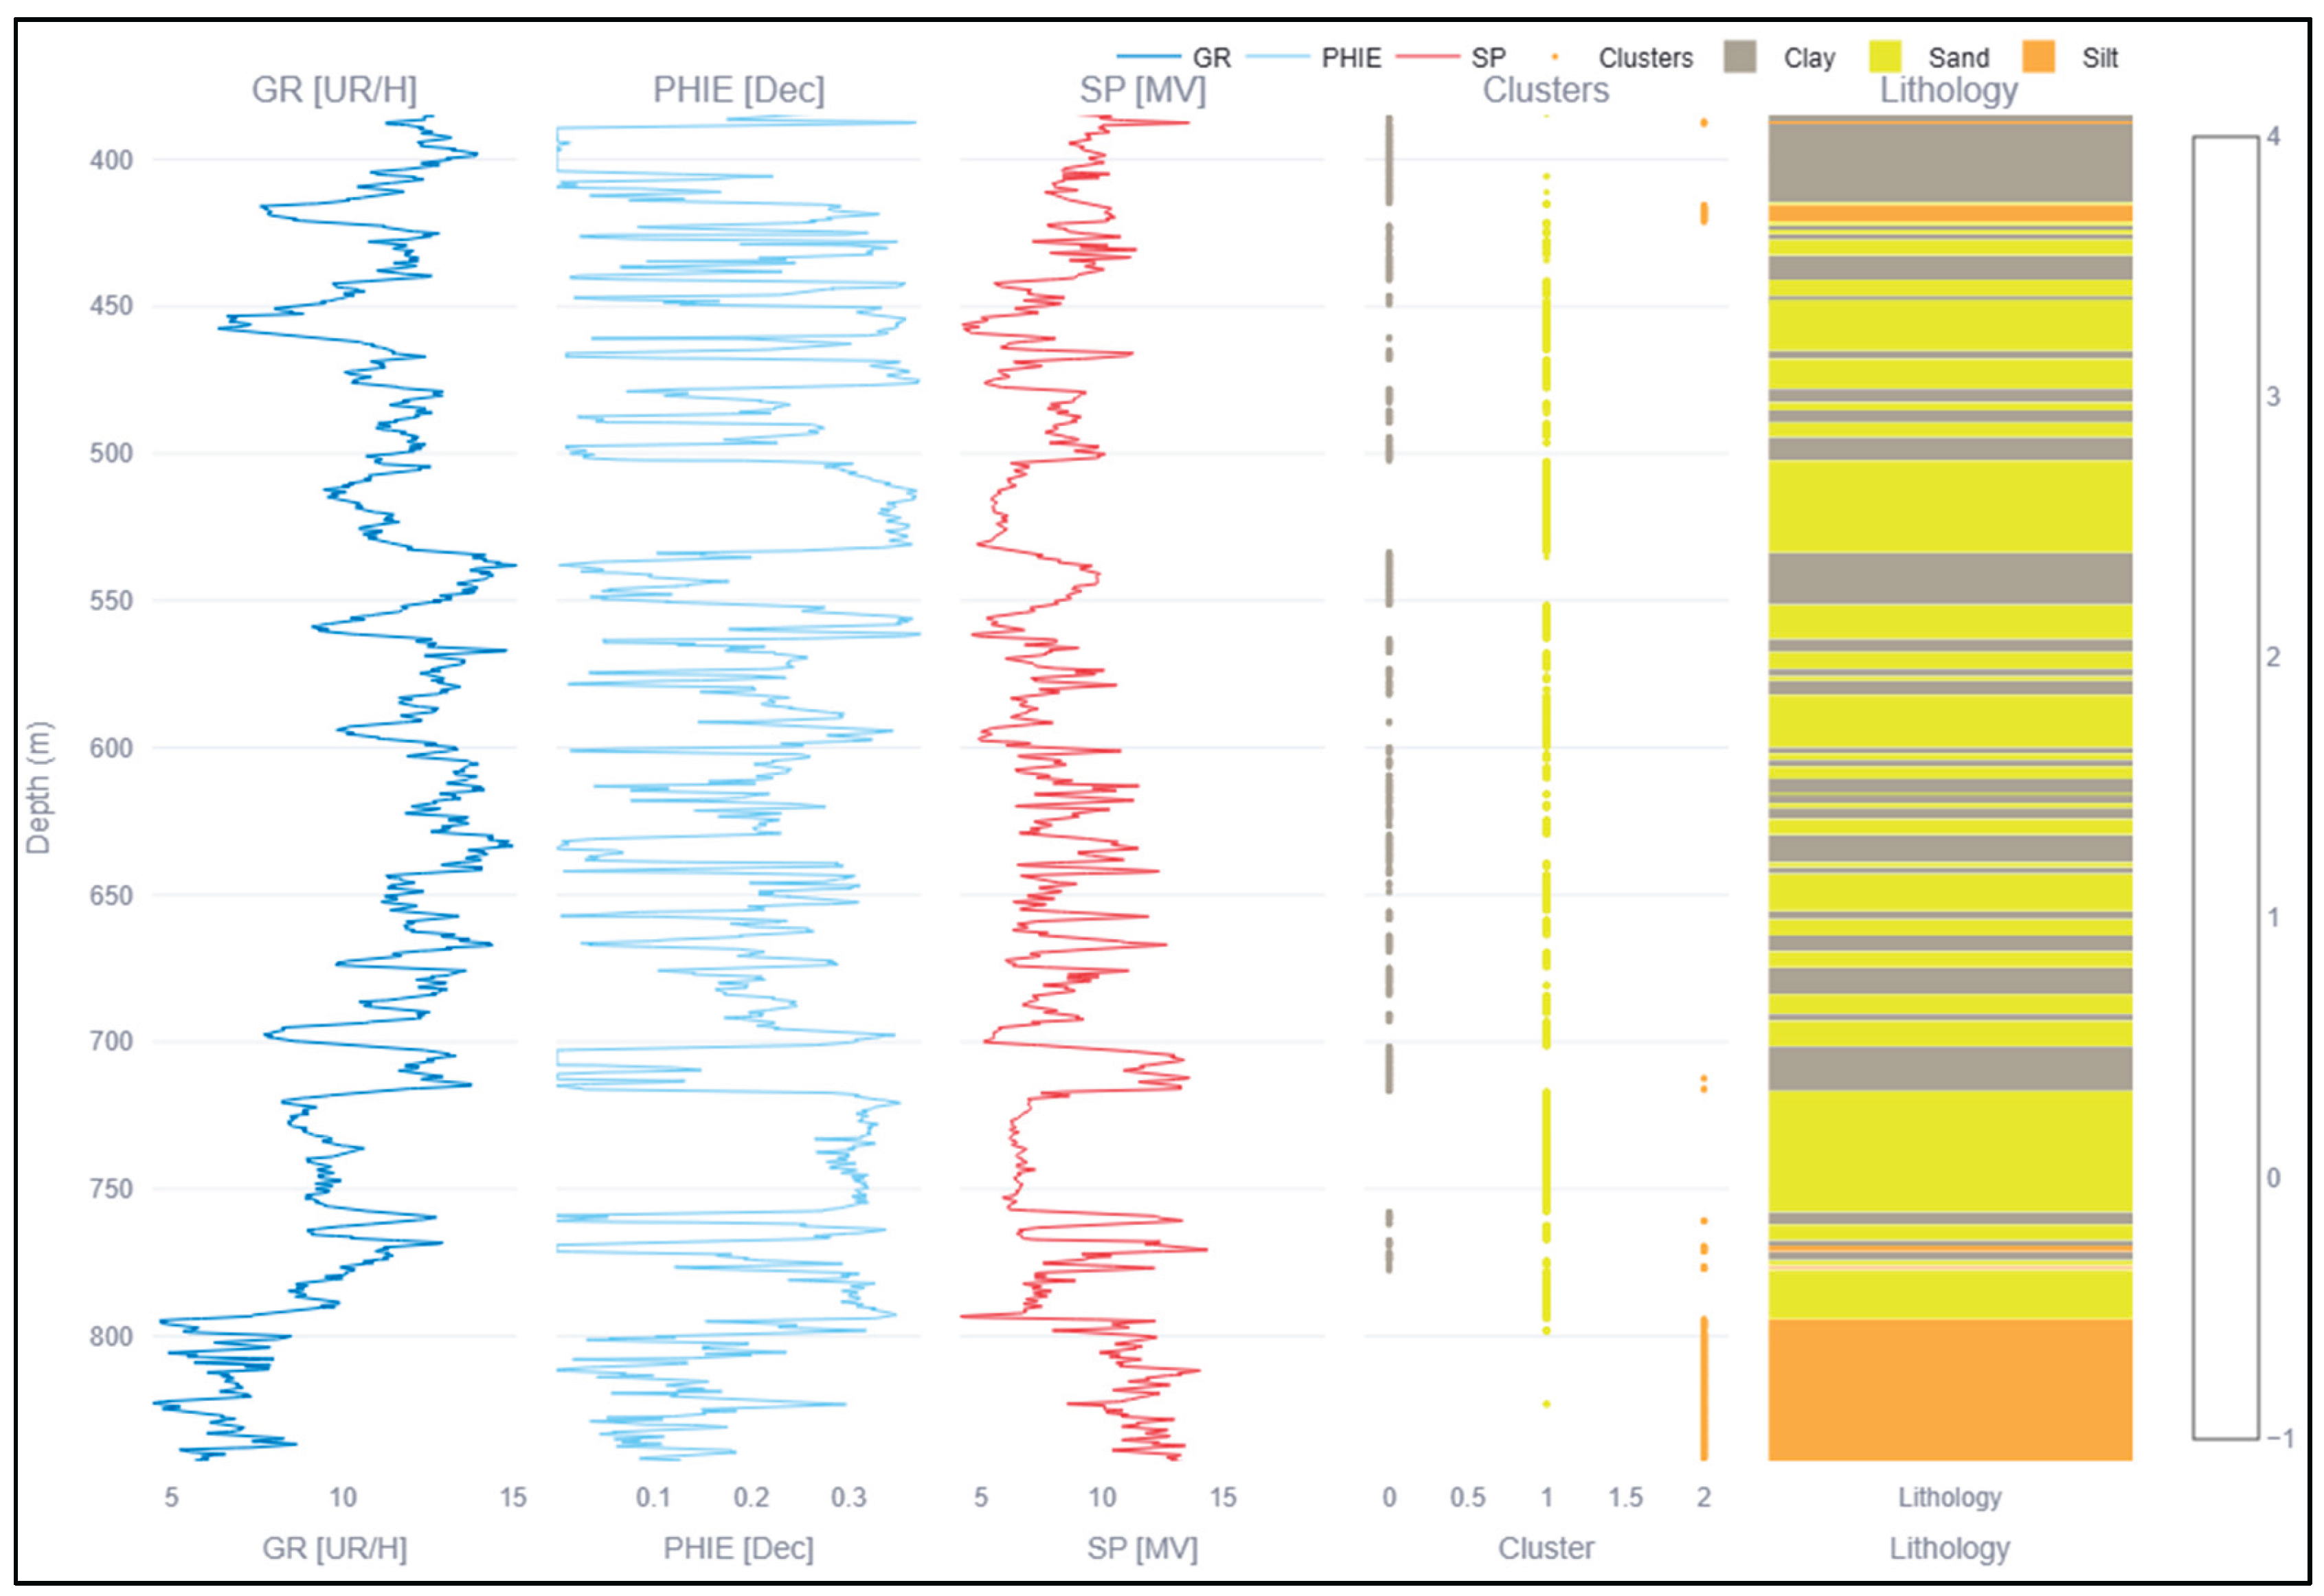
Figure 11.
Analysis of clustering using the k-means ML method: (a) PHIE vs. GR values with lithofacies highlighted; (b) PCA.
Figure 11.
Analysis of clustering using the k-means ML method: (a) PHIE vs. GR values with lithofacies highlighted; (b) PCA.
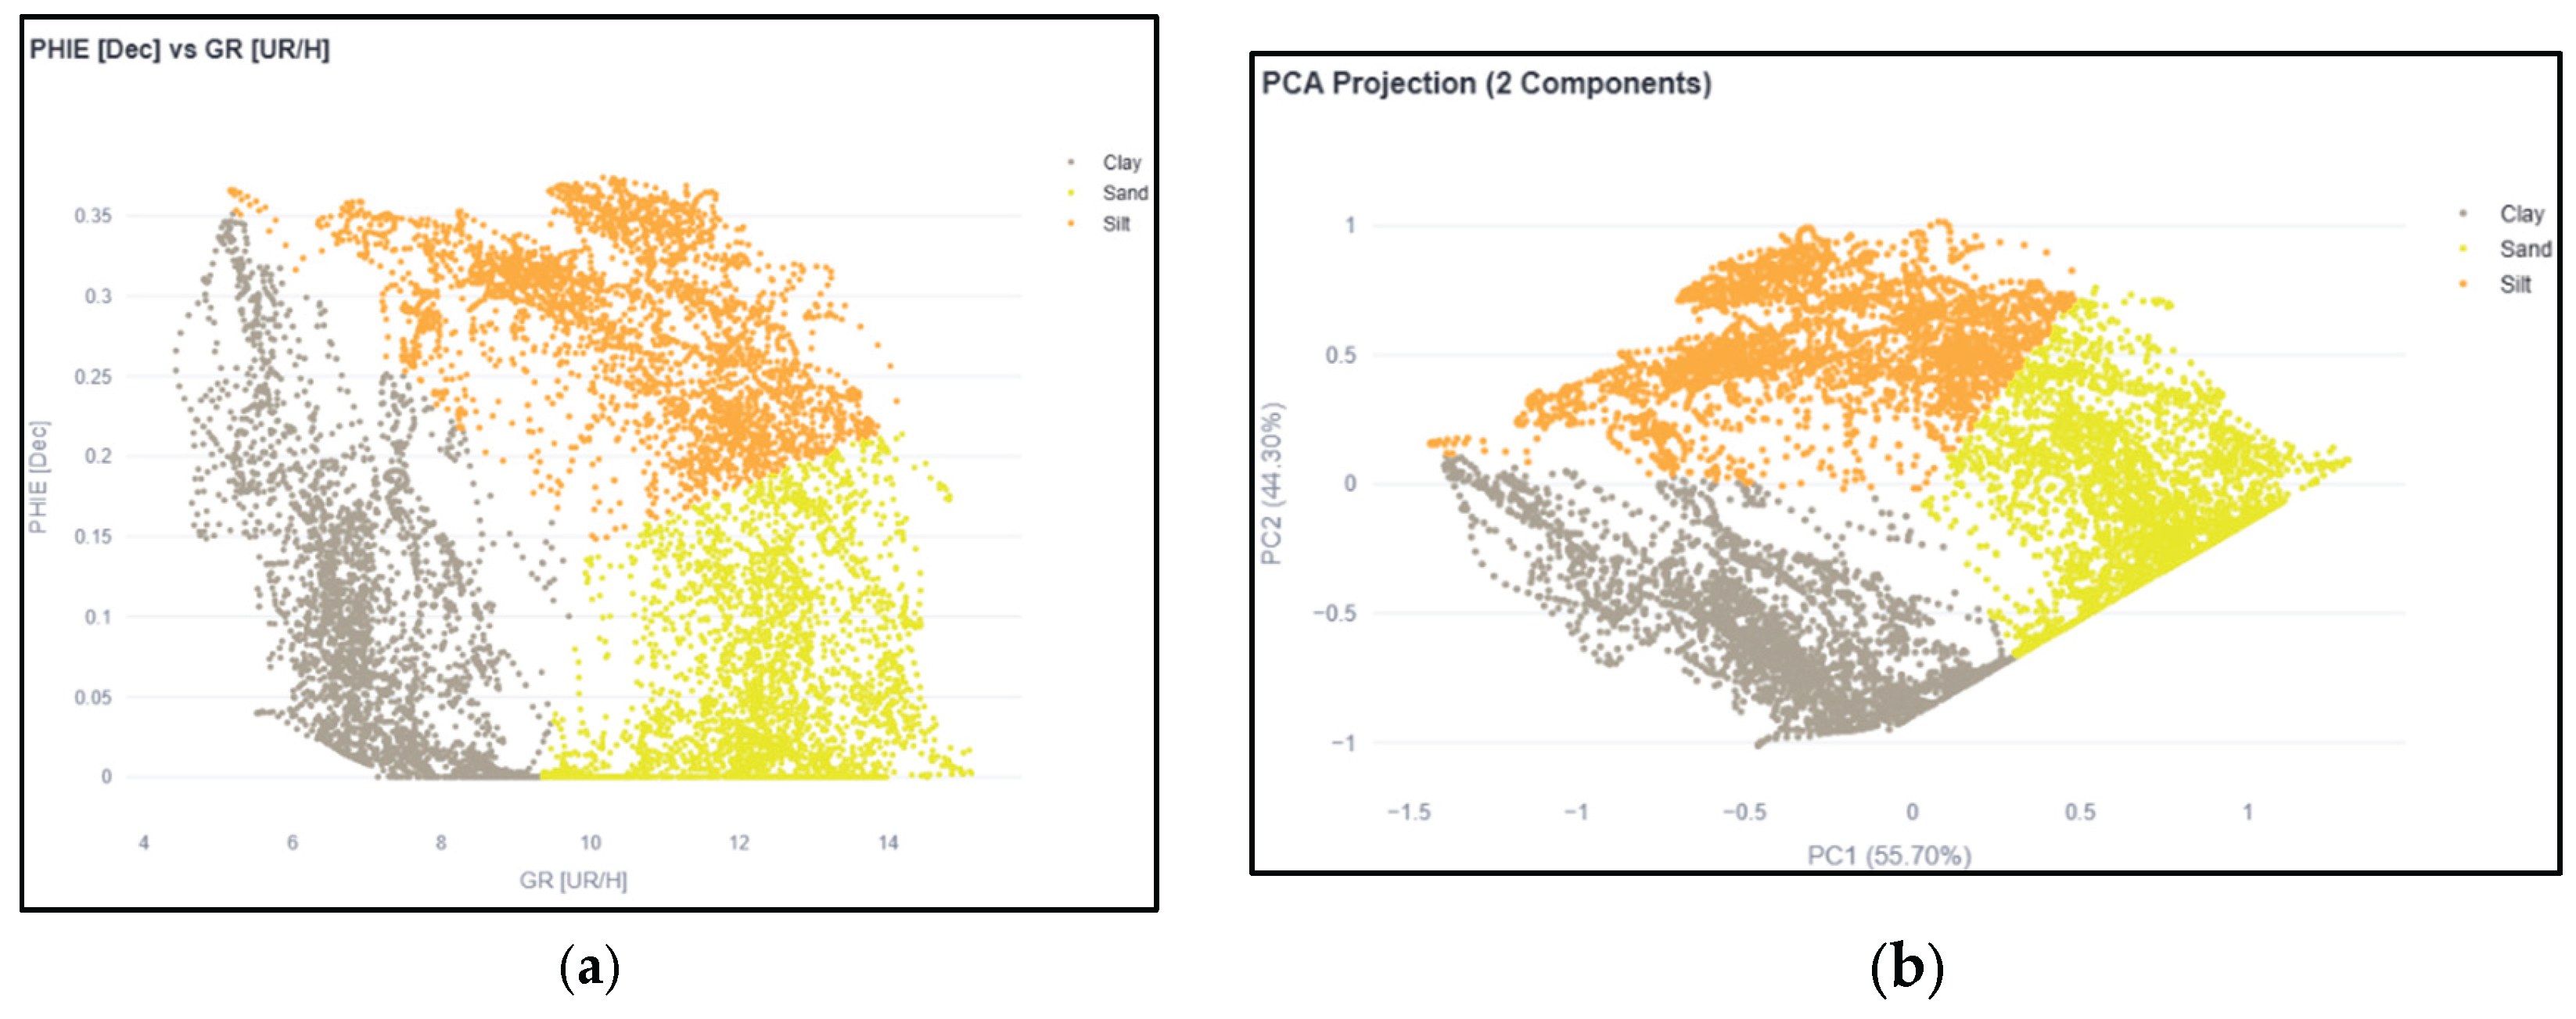
Figure 12.
Fragment of lithofacies interpretation: comparison of results of (a) commercial software and (b) k-means method.
Figure 12.
Fragment of lithofacies interpretation: comparison of results of (a) commercial software and (b) k-means method.
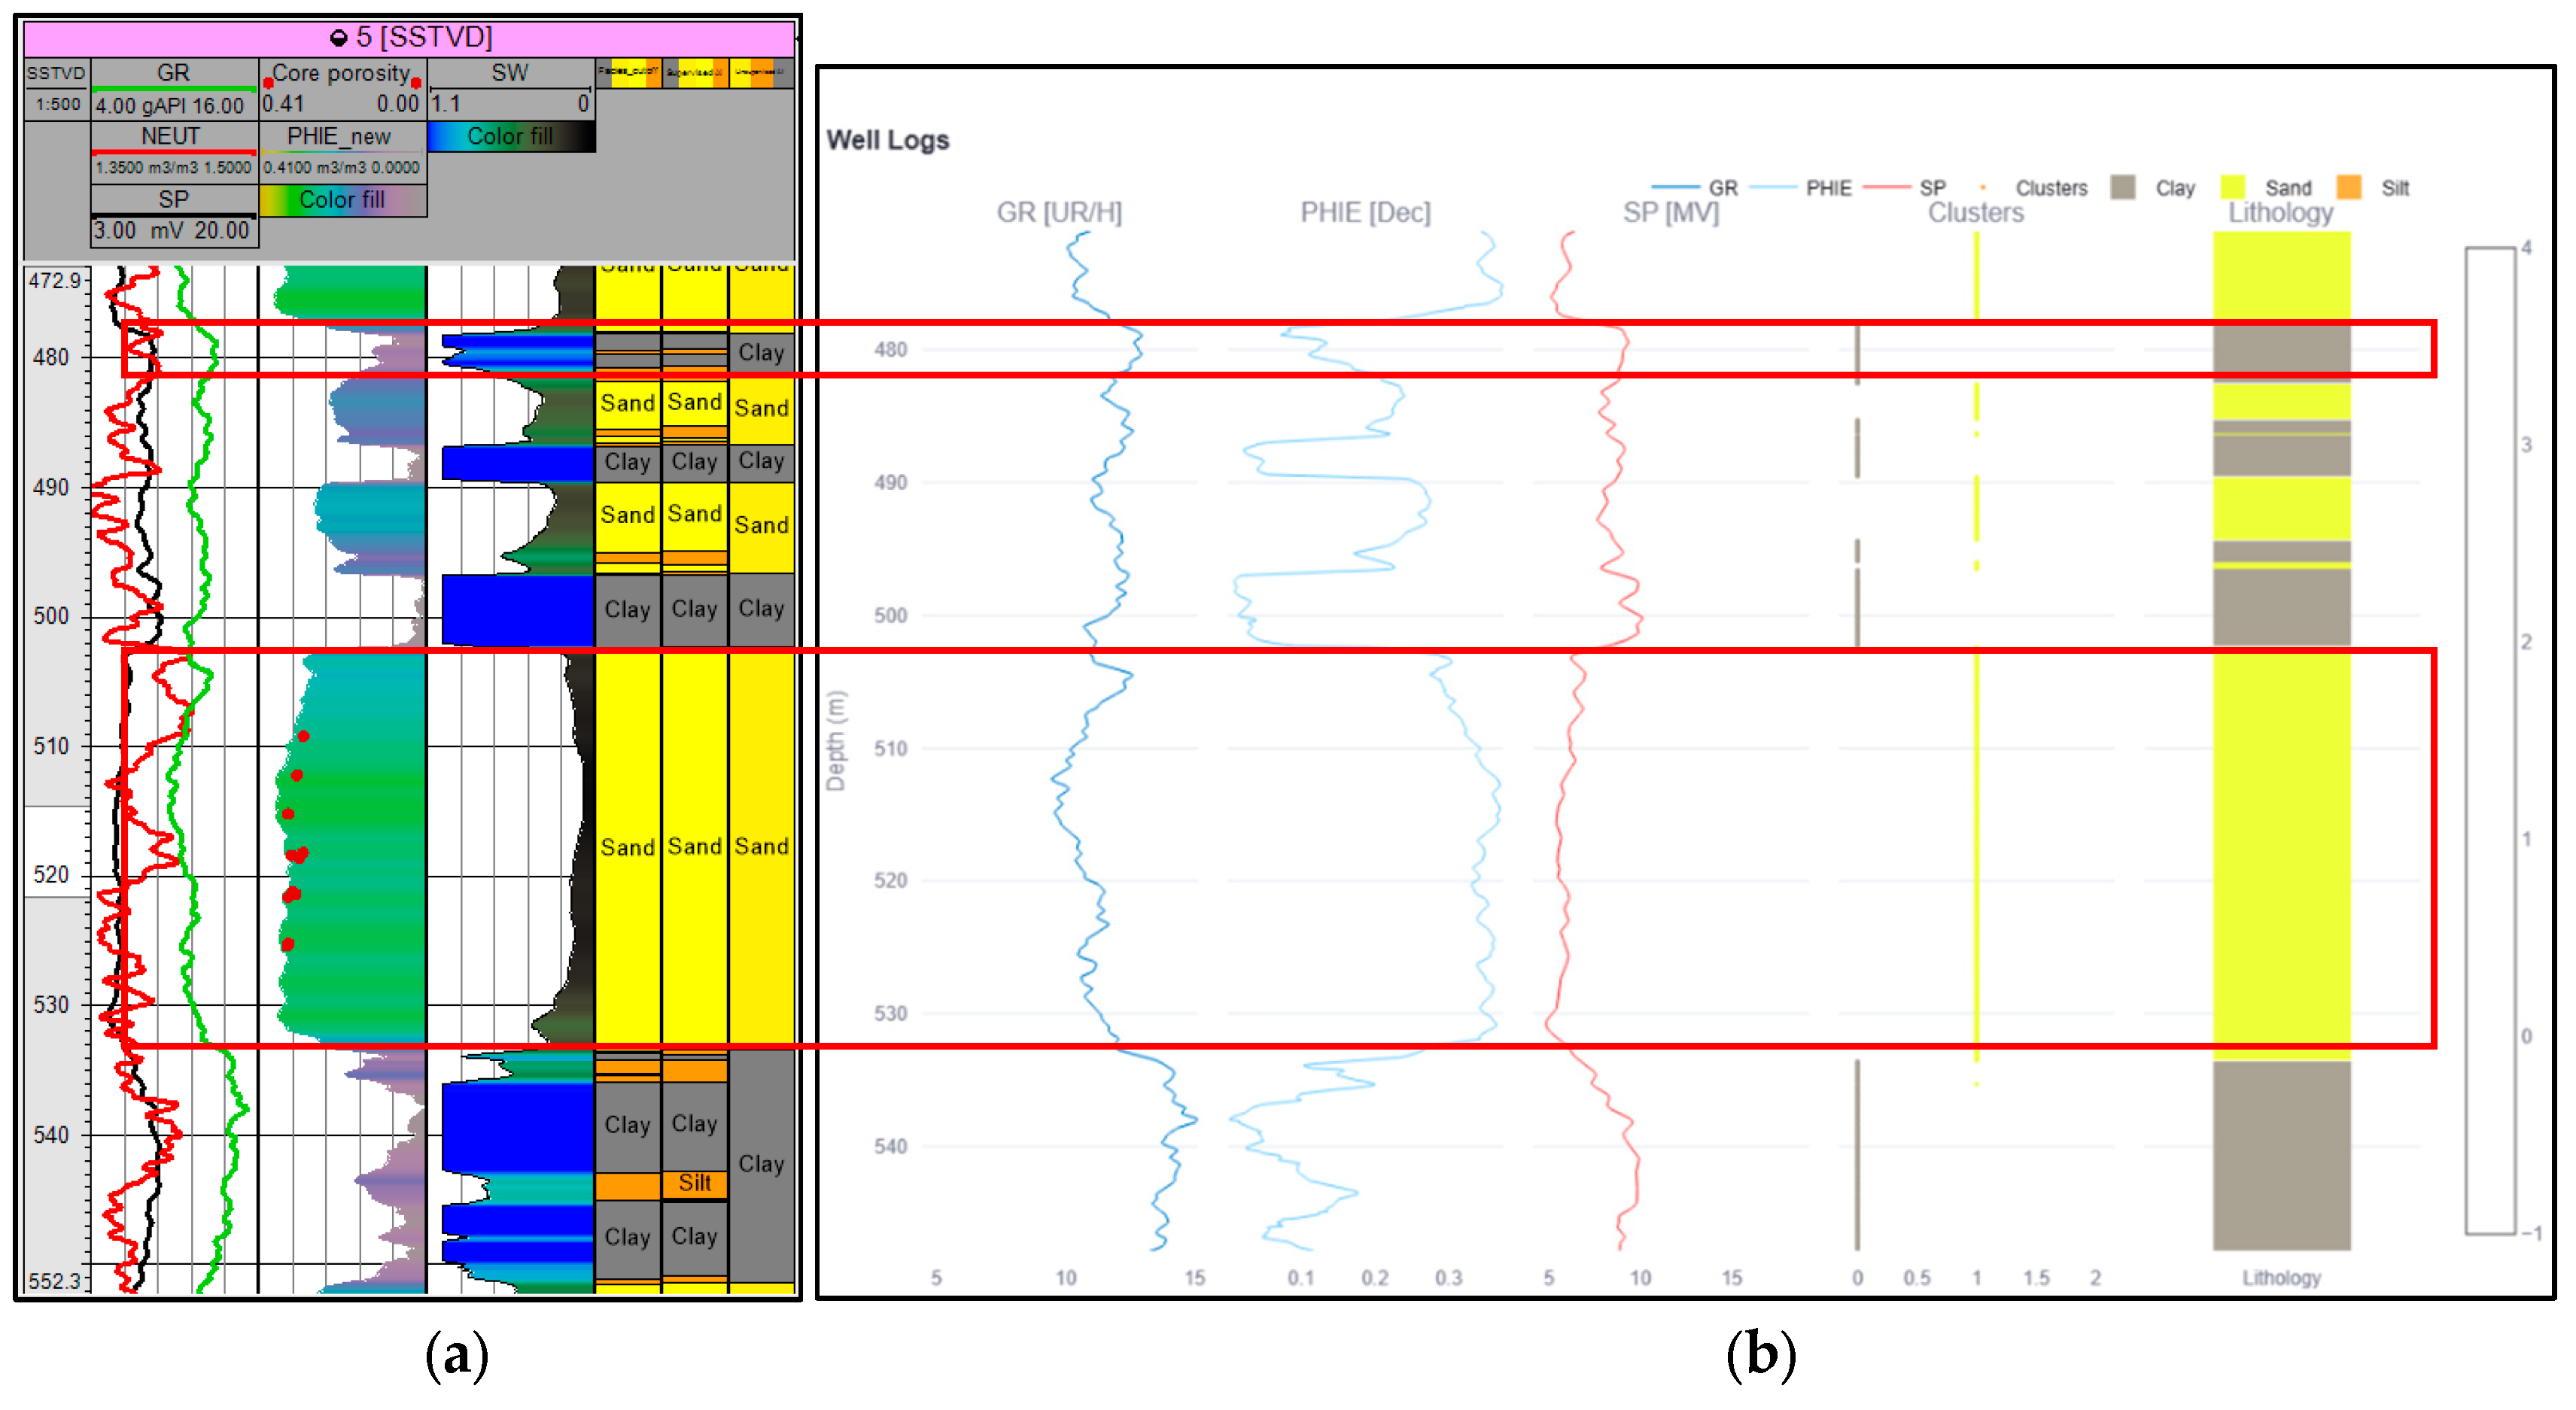
Figure 13.
Impact of number of clusters on Silhouette Coefficient.
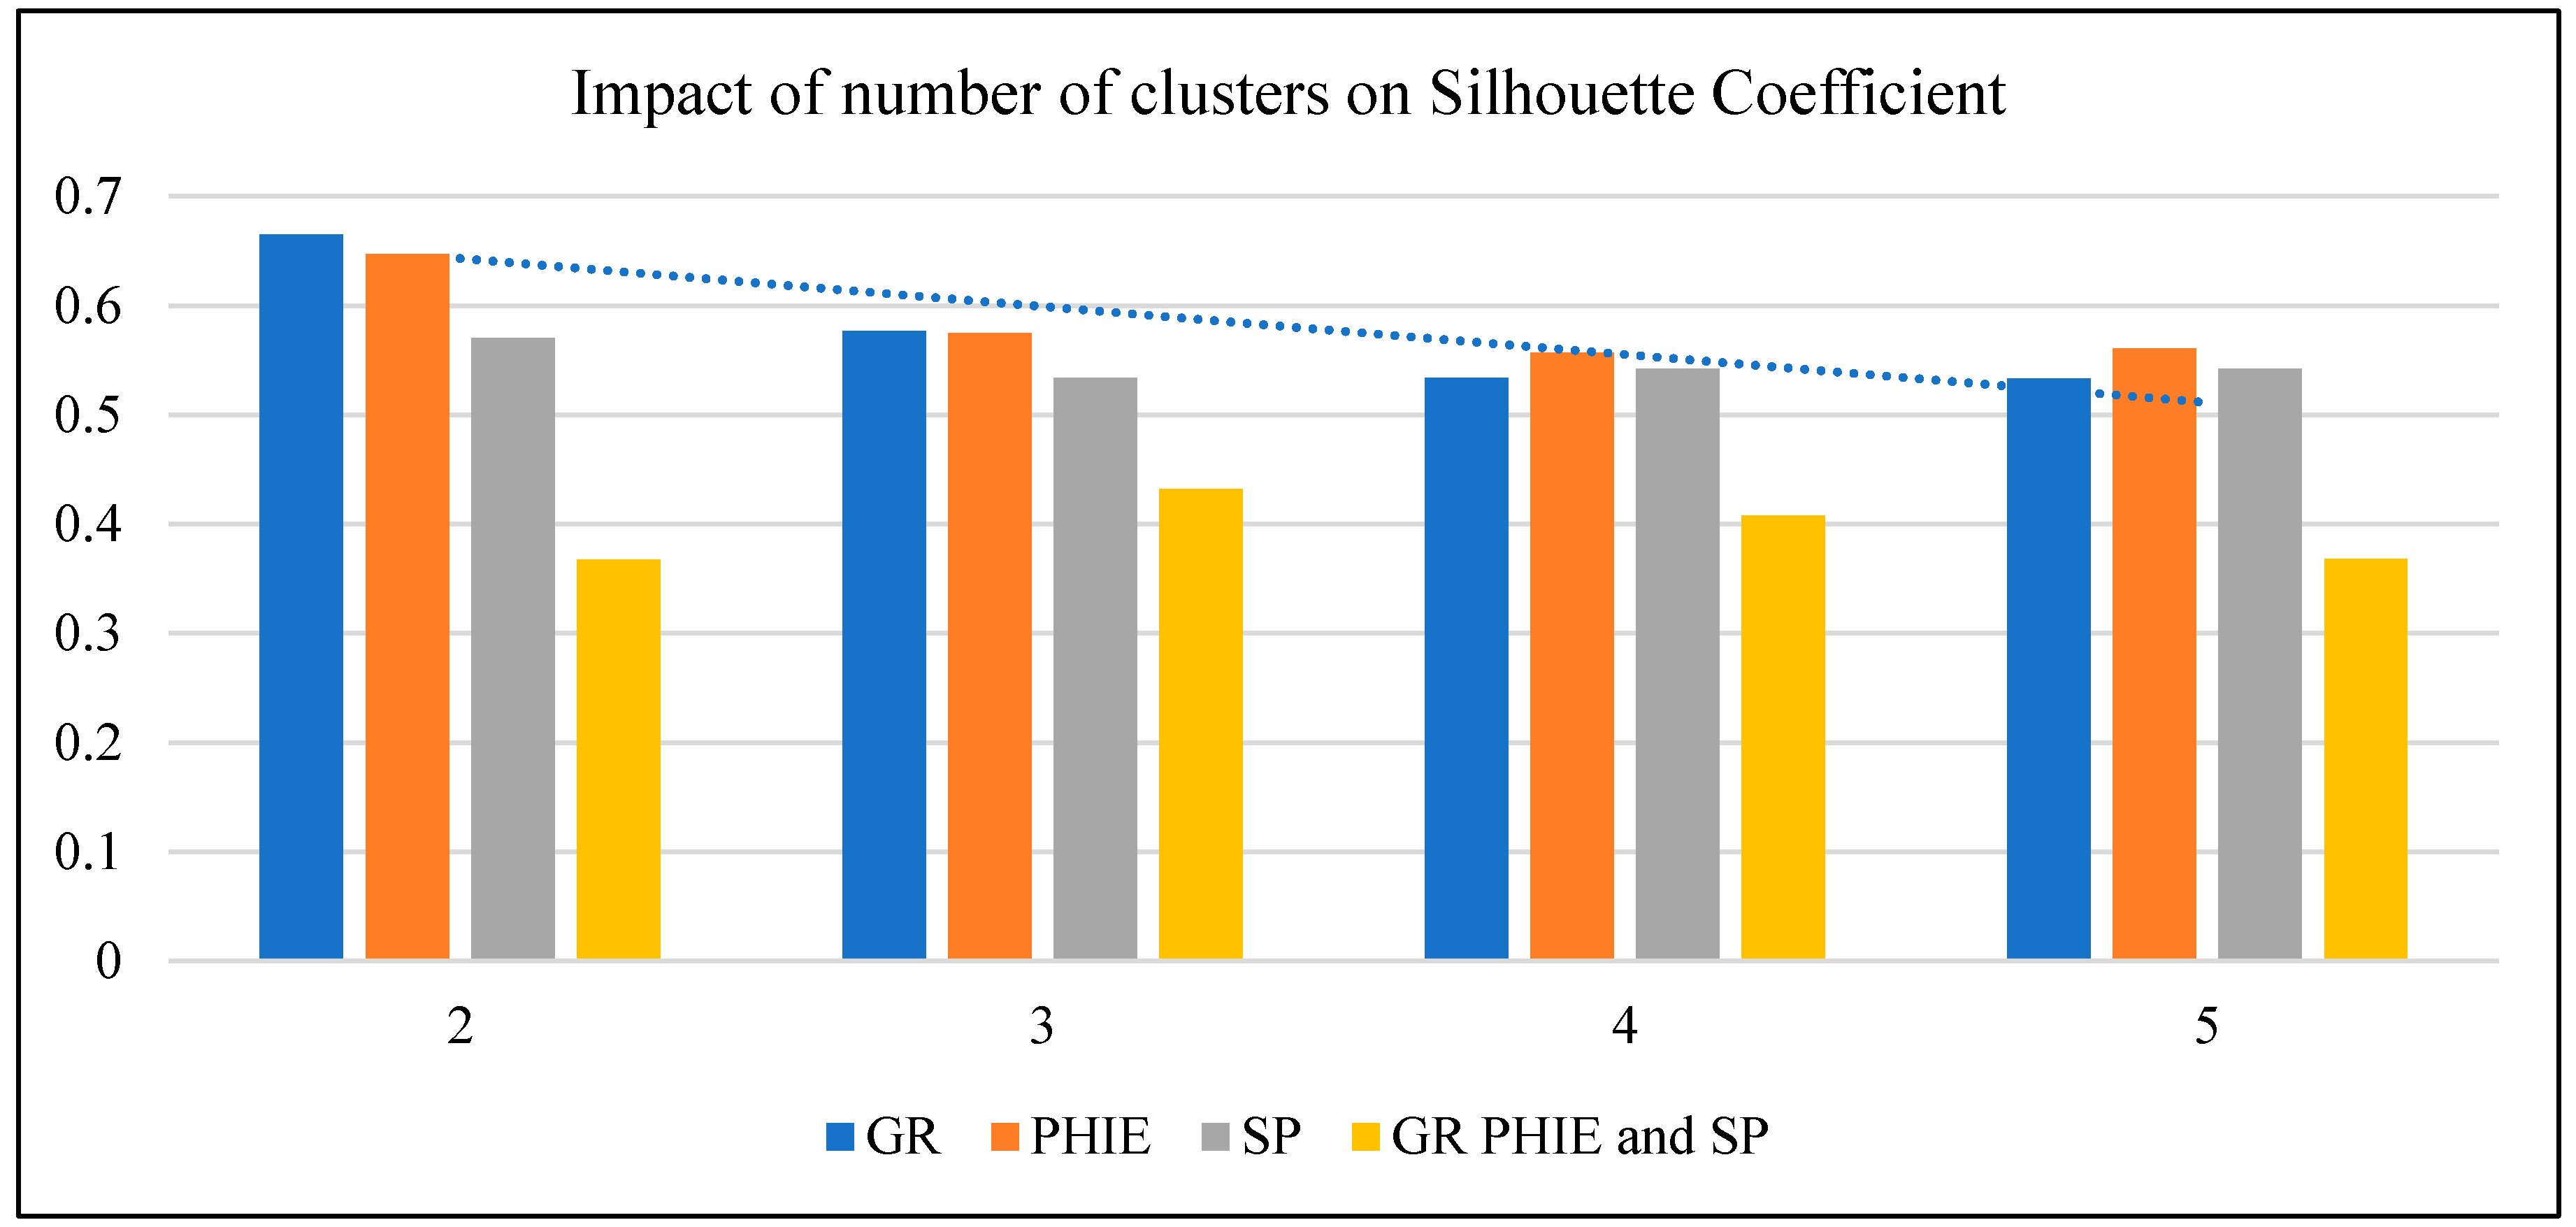

Table 1.
Boundary values of lithofacies.
| № | Lithofacies | Cut-off (for effective porosity) |
|---|---|---|
| 1 | Sandstones | Higher 0.2 |
| 2 | Clays | Lower 0.13 |
| 3 | Siltstones | From 0.13 to 0.2 |
Table 2.
Comparative characteristics of the considered methods of lithofacies classification [assessment of authors].
Table 2.
Comparative characteristics of the considered methods of lithofacies classification [assessment of authors].
| Criteria | Cut-off method | Methods of commercial software (unsupervised) | K-means |
|---|---|---|---|
| Objectivity | Low (subjective choice of cut-off) | Medium | High (formal mathematical criterion) |
| Detail | Low | Medium | High |
| Interpretability | High | Medium | High |
| Speed | Low | High | High |
| Flexibility | Low | Medium | High (easy k tuning, metric choice) |
Disclaimer/Publisher’s Note: The statements, opinions and data contained in all publications are solely those of the individual author(s) and contributor(s) and not of MDPI and/or the editor(s). MDPI and/or the editor(s) disclaim responsibility for any injury to people or property resulting from any ideas, methods, instructions or products referred to in the content. |
© 2026 by the authors. Licensee MDPI, Basel, Switzerland. This article is an open access article distributed under the terms and conditions of the Creative Commons Attribution (CC BY) license (http://creativecommons.org/licenses/by/4.0/).
Copyright: This open access article is published under a Creative Commons CC BY 4.0 license, which permit the free download, distribution, and reuse, provided that the author and preprint are cited in any reuse.