Submitted:
16 February 2026
Posted:
26 February 2026
You are already at the latest version
Abstract
Red blood cell (RBC) deformability is a key determinant of microcirculatory flow and can be altered in hematological disorders such as chronic lymphocytic leukemia (CLL). This study aimed to evaluate RBC deformability under controlled microfluidic flow conditions and to assess the influence of software platform choice on deformability quantification. RBC suspensions from healthy individuals and untreated CLL patients were analyzed using a microfluidic imaging system across a range of shear rates. A dedicated image-processing algorithm was developed and implemented in two software environments (LabVIEW and Python) to automatically detect deformed cells, measure major and minor cell axes, and calculate the deformability index (DI). Both analytical approaches demonstrated a shear-dependent increase in DI in healthy controls, whereas RBCs from CLL patients exhibited reduced deformability and a blunted response to increasing shear rates, particularly at intermediate shear rates. Although LabVIEW produced consistently higher absolute DI values than Python, both platforms showed strong correlation and preserved the same relative trends and group discrimination. These findings demonstrate that microfluidic image flow analysis provides a robust approach for assessing RBC biomechanics and highlight the importance of standardized image-processing workflows for reliable deformability quantification across software platforms.
Keywords:
chronic lymphocytic leukemia
; Red blood cells
; image flow analysis
; LabVIEW software
; Python software
; deformability index
1. Introduction
Red blood cells (RBCs) constitute approximately 45% of total blood volume and are essential for oxygen delivery and carbon dioxide removal. To pass through capillaries narrower than their resting diameter, RBCs undergo significant and reversible deformation. This remarkable deformability of RBCs is determined by the viscoelastic properties of the membrane–cytoskeleton complex, cytoplasmic viscosity, and cells’ unique biconcave geometry [1,2]. The biconcave shape of RBCs is particularly important for deformability, as it minimizes bending energy and facilitates shape adaptation under flow conditions [3]. Alterations in any of these determinants, arising from oxidative and inflammatory stress, or other pathological conditions, reduce RBC flexibility, thereby compromising microvascular blood flow, increasing flow resistance, and diminishing tissue oxygen delivery. Consequently, quantitative evaluation of RBC deformability represents a sensitive biomechanical indicator of blood rheological properties and microcirculatory performance [4].
In health, RBC deformability increases under high shear stress and dynamically adapts to flow conditions, facilitating their passage through capillaries. This adaptability allows RBCs to respond to mechanical forces and maintain functional integrity within the microcirculation. However, reduced deformability is associated with a broad range of diseases. Impaired RBC deformation has been reported in metabolic disorders such as diabetes mellitus and sepsis [5], hereditary hemoglobinopathies, malaria infection, and during blood storage, all of which may compromise microvascular perfusion and manifest as clinically relevant rheological dysfunction [4]. Moreover, RBC deformability influences blood viscosity and flow characteristics at both high and low shear rates, thereby affecting perfusion pressures under physiological and pathological conditions [6]. Such alterations often precede overt clinical manifestations, highlighting the potential diagnostic and prognostic value of deformability measurements [6,7]. Therefore, RBC deformability can be significantly altered in systemic inflammatory diseases, and quantifying these changes may provide valuable prognostic information.
Chronic lymphocytic leukemia (CLL) is a hematological malignancy characterized primarily by the accumulation of monoclonal B lymphocytes. However, there is increasing evidence that CLL also affects the rheology and biophysical behavior of RBCs. Systemic inflammation and oxidative stress, which are already detectable in early-stage CLL patients [8], may induce lipid peroxidation and oxidative damage to membrane proteins, leading to spectrin/ankyrin modifications, cytoskeletal remodeling, and increased membrane stiffness of RBCs [9]. These biophysical changes can modify the rheological properties of RBCs, contributing to impaired microcirculation, increased blood viscosity, and an elevated risk of vascular complications. Our recent studies employing microfluidic flow image analysis have shown that RBC aggregation patterns differ between healthy subjects and patients with CLL [10]. These aggregation differences may be related to underlying changes in RBC biophysical properties, particularly deformability, which governs RBC dynamics, cell–cell interactions, and aggregate stability under microvascular shear conditions. Despite their clinical relevance, alterations in RBC deformability in CLL remain insufficiently characterized, and direct measurements in this context are scarce. However, research on leukemic cells has demonstrated increased stiffness of CLL lymphocytes relative to healthy lymphocytes, suggesting that disease-associated systemic biophysical remodeling may extend beyond leukocytes to other circulating blood cells, including RBCs [11].
Microfluidic technologies emerged as powerful tools for assessing RBC deformability under controlled flow conditions that mimic aspects of the in vivo microenvironment. By subjecting cells to defined shear stresses and capturing their deformation responses, microfluidic assays provide physiologically relevant measurements of cell mechanics. Microfluidic systems received significant attention for studying RBC deformability under physiologically relevant flow conditions. By mimicking microvascular geometries and applying controlled shear stress, these systems enable high-throughput, label-free analysis of individual cells in a flow environment.
Microfluidic devices allow precise control of flow rates that closely mimic physiological conditions in the microvasculature, generating laminar flow with straight and parallel streamlines near the channel surface. This flow profile facilitates the adhesion of flowing erythrocytes (RBCs) to the channel walls [12]. The application of shear flow induces elongation of RBCs anchored at a single point, accompanied by changes in cell curvature. This deformation results from a balance between hydrodynamic forces and the elastic properties of the RBC membrane, including shear and bending elasticity [13].
One of the most widely used indirect measures of RBC elasticity is the change in cell shape, expressed as the Deformability Index (DI = (Lx − Ly)/(Lx + Ly), where Lx and Ly represent the major and minor axes of an approximating ellipse, respectively [12,14,15]. This metric is also commonly referred to as the Aspect Ratio or Elongation Index (EI) [4,16,17]. DI provides a direct quantification of the degree of RBC deformation under a given stress. It can be determined by capturing high-resolution images of RBCs exposed to shear flow, followed by fitting an ellipse to the cell contour and extracting its principal axes [3].
Combined with high-resolution imaging, technology provides a powerful platform for the quantitative assessment of RBC deformability based on dynamic cell behavior [18]. Microfluidic systems offer several advantages over traditional rheological techniques, such as ektacytometry and viscometry, by enabling single-cell resolution, direct visualization, and multiparametric quantification of deformability and morphology [4]. Recent studies have integrated microfluidics with specialized image analysis software [12,16,19] or employed machine learning approaches to automate deformability assessment from cell images, thereby increasing throughput and reproducibility [20]. However, reliable interpretation of such data critically depends on robust image processing algorithms capable of suppressing flow-induced background artifacts and accurately identifying deformed cells.
A major challenge in image-based deformability analysis lies in the variability introduced by different software environments and implementation strategies. Differences in filtering, segmentation, thresholding, and numerical precision may lead to systematic discrepancies in absolute deformability values, complicating cross-study comparisons and reproducibility. To our knowledge, no studies to date have explicitly examined the impact of software platform choice on the quantification of RBC deformability, particularly in clinically relevant settings such as CLL.
In this study, we present a microfluidic-based approach to quantify RBC deformability using image-processing with two software platforms: LABVIEW and Python. A sine window–based filtering strategy was developed to suppress flow-related background variations while preserving RBC contours. Deformability was quantified using a geometrically defined deformability index (DI) derived from ellipsoidal cell shape parameters. By applying identical analytical criteria across platforms, we systematically evaluated inter-platform variability while preserving biological sensitivity.
Using this framework, we compared RBC deformability in healthy donors and CLL patients under flow conditions. Our results demonstrate distinct deformability patterns between the two groups and reveal consistent relative trends across software platforms, despite differences in absolute DI values. These findings highlight both the mechanical alterations of RBCs in CLL and the importance of image analysis methodology in obtaining reliable deformability measurements using microfluidic devices.
2. Materials and Methods
2.1. Study Groups and Ethics Statement
A total of nine untreated patients (mean age 63.9 ± 12.0 years) were included in the study. All patients were diagnosed with CLL at the National Specialized Hospital for Active Treatment of Hematological Diseases, Sofia, Bulgaria. Diagnosis was established according to internationally validated expert recommendations and clinical guidelines of the International Workshop on Chronic Lymphocytic Leukemia (iwCLL) for diagnosis, treatment indication, response assessment, and supportive management of CLL [21,22]. CLL patients with diabetes, renal diseases, autoimmune diseases, or hyperlipidemia were excluded from the study.
The control group comprised 13 healthy individuals (mean age 58.0 ± 7.4 years), with no family history of CLL or other oncohematological diseases.
All participants provided written informed consent before inclusion in the study. The study protocol was approved by the Ethics Committee of the Institute of Biophysics and Biomedical Engineering, Bulgarian Academy of Sciences (permit No. 378ND 26/03/2024) and was conducted in accordance with the Helsinki Principles for Ethical Standards in Research with Human Participation.
2.2. Blood Collection and Sample Preparations
Blood samples were collected by venipuncture into two 6 mL tubes (Vacutainer; Becton Dickinson and Company, Franklin Lakes, NJ, USA) containing K2EDTA. Blood from CLL patients was collected during their routine hospital visits.
RBC isolation was performed according to the protocol previously described by Alexandrova-Watanabe et al. [23]. Briefly, collected blood samples were centrifuged (Universal 320 R centrifuge, Hettich, Germany), after which the supernatant (plasma and white blood cells) was removed. The RBC fraction was resuspended and washed twice in phosphate-buffered saline (PBS; 140 mM NaCl, 2.7 mM KCl, 8 mM Na2HPO4, 1 mM KH2PO4). The hematocrit of the final RBC suspension was adjusted to 40% using a Haematokrit 200 centrifuge (centrifuge Haematokrit 200, Hettich, Germany).
From each blood sample obtained from healthy controls and untreated CLL patients, 10 μL was added to 200 μL of Dextran 70 solution (4 g/dL). This dilution resulted in a final hematocrit of 2% in the RBC suspensions used for all experiments.
2.3. Viscosity Measurements
The viscosity of RBC suspensions diluted in Dextran 70 (prepared as described in Section 2.2) was measured under steady-state flow conditions using a Brookfield DV-II+ Pro programmable rotational viscometer (Brookfield Engineering Laboratories, Inc., Middleboro, MA, USA). The instrument was calibrated with water at 37 °C before measurements. The viscosity of the diluted RBC suspensions in Dextran 70, measured at 37 °C, was 1.12 ± 0.04 mPa·s.
2.4. Description of Microfluidic System
RBC deformation was investigated using an air-pressure-driven BioFlux microfluidic system (Fluxion Biosciences, Oakland, CA, USA), the detailed description of which is provided in Alexandrova-Watanabe et al. (2025) [10]. This system provides a high-quality imaging platform for rheological analyses under flow conditions.
The microfluidic setup consisted of a BioFlux 200 electro-pneumatic flow control pump, a LumaScope 620 inverted fluorescence microscope (Etaluma, San Diego, CA 92123), BioFlux microfluidic plates, and a computer workstation with specialized control software (LumaView). RBC deformability assays were performed using BioFlux 24-well plates (0–20 dyn/cm²), each containing eight microfluidic channels with cross-sectional dimensions of 350 μm in width and 75 μm in height.
2.5. Design of the Experiments
The microfluidic channels were filled with 200 μL of each prepared RBC suspension diluted in Dextran 70. The suspensions were perfused through the channels at a shear stress of 5 dyn/cm² (corresponding to a shear rate of 446 s⁻¹) for 5 min to disperse preexisting RBC aggregates. Thereafter, the flow was abruptly reduced to a low shear stress of 0.1 dyn/cm² (corresponding to a shear rate of 8.9 s⁻¹) and maintained for 15 min to promote adhesion of RBCs to the walls of the microchannels.
Increasing shear stresses of 1, 2, 3, 4, 5, 6, and 7 dyn/cm² (corresponding to shear rates of 89, 178, 268, 357, 446, 535, and 625 s⁻¹, respectively) were sequentially applied to the microchannels. At each shear rate, RBC elongation increased correspondingly. Once maximum cell elongation was reached (approximately 10 s after applying the respective shear stress), at least five images of the deformed RBCs were captured along the visible length of the channel at randomly selected locations.
2.6. Algorithm for Software Image Flow Analysis of RBC Deformability
In this study, an algorithm was developed to evaluate RBC deformability, and two software programs were implemented based on this algorithm. The programs were developed using two different platforms: LabVIEW (commercial software) and Python (open-source software).
Each image of deformed RBCs in the microchannels was processed in parallel using the two developed software programs. The programs automatically identified individual cells while excluding RBCs that overlapped or collided with other cells. For each selected elongated (deformed) cell, the lengths of the major (Lx) and minor (Ly) axes of an equivalent ellipse were measured, and the cell deformability index (DI) was calculated. For each blood sample and at each applied shear rate, all DI values were aggregated, and the mean DI was determined separately by each software program.
2.7. Statistics
Data are presented as mean ± standard deviation (SD). The Shapiro–Wilk test was used to assess the normality of data distribution. Comparisons between independent groups were performed using the non-parametric Mann–Whitney U test. Differences were considered statistically significant at p ≤ 0.05. Pearson correlation analysis was conducted to evaluate the relationship between measurements obtained from the two software platforms. All statistical analyses were performed using OriginPro 2018 (OriginLab Corporation, Northampton, MA, USA).
3. Results
3.1. Clinical and Hematological Characteristics of the CLL Patients and Healthy Individuals
Nine patients with CLL, five of whom were men, were enrolled in this study. Seven patients were classified as having early-stage disease (Rai stage 0). These individuals were asymptomatic or presented only mild clinical manifestations that did not require therapeutic intervention. It should also be noted that two patients in this group were newly diagnosed.
The clinical and hematological characteristics of the studied groups are summarized in Table 1. The control and CLL groups were comparable in age and sex distribution.
RBC parameters remained within the reference ranges in both groups, suggesting the absence of overt anemia in untreated CLL patients. However, a modest increase in red cell distribution width (RDW), together with substantial variability, suggests subtle heterogeneity in erythrocyte size. It is worth noting that RDW values above the reference range were observed in three patients.
Pronounced and statistically significant elevations in white blood cell (WBC) and absolute lymphocyte counts were observed in CLL patients compared with healthy controls (p < 0.05). The wide range of values observed in the untreated CLL group indicates substantial interpatient heterogeneity, characteristic of the disease and reflecting variable levels of lymphocytic expansion.
3.2. Development of a Software Application for the Analysis of Red Blood Cell Deformation under Flow Conditions
To quantitatively assess RBC deformability, a dedicated algorithm was developed to analyze images of cells under dynamic flow. The overall workflow of the algorithm is summarized in a block diagram (Figure 1), highlighting the sequence of image acquisition, preprocessing, cell detection, and deformability index calculation.
The algorithm was implemented in two platforms, i.e., LabVIEW (commercial) and Python (open-source), to allow cross-validation of results.
Digital images of RBCs were acquired using the BioFlux microfluidic system (Figure 2A). For each donor, seven 24-bit grayscale images (ArrayImages = {Image₁, …, Image₇}) were captured, each corresponding to a progressively increasing shear rate.
3.2.1. Software Application using LabVIEW
During image acquisition, flow-induced streaks along the microfluidic channels caused smoothly varying background intensity, predominantly along the horizontal (X) direction. Consequently, a horizontally oriented filtering function is required to blur the background while preserving the contrast of the blood cells. For this purpose, either a Gaussian or a sinusoidal filter could be applied. Because the Gaussian distribution is infinitely wide and therefore requires truncation, a sinusoidal function was chosen for convenience and computational efficiency. Only the positive lobe of the sinusoidal function was used, resulting in a symmetric window with a maximum at its center and decreasing values toward the edges, commonly referred to as a sine window.
During image acquisition, flow-induced background noise, primarily aligned with the microfluidic channel direction, interfered with RBC detection and measurement. Suppression of this noise was a critical step in the image-processing pipeline. To address this, a horizontally oriented sine window filter was applied. Only the positive lobe of a sinusoidal function was used, and the resulting values were squared to further enhance smoothing. The function was then normalized by dividing each element by the sum of all values, ensuring that the total sum equals one. This normalization preserves the relative intensity of the central pixel while maintaining overall image brightness.
The input image was converted into a pixel intensity array, and a single RGB channel was selected (all channels are identical for grayscale images, so selection did not affect results). Convolution of the pixel array with the sine window blurred the background while preserving RBC contrast. Subtracting the filtered image from the original removed the background, leaving RBCs clearly visible for analysis (Figure 2B). The filtered image was then converted into an 8-bit binary image using a pixel intensity threshold, with pixels below the threshold assigned white and the remaining pixels assigned black. Contrast was further enhanced to facilitate object detection. This approach effectively reduces background noise in a manner comparable to a Gaussian distribution, enabling reliable detection and quantitative evaluation of RBC deformation.
Following background suppression, individual ellipsoidal objects (diameter 3–50 pixels) were detected and segmented, and their X–Y coordinates were recorded. For each object, an ellipse was fitted, and the lengths of the major (Lx) and minor (Ly) axes were measured (Figure 2C). Objects were classified as deformed RBCs only if they met the following criteria:
- a)
- Lₓ > Lᵧ
- b)
- Lₓ − Lᵧ ≥ 0.2 × Lₓ
- c)
- Lx and Ly within the ranges 4 ≤ Lx ≤ 9 and 2.5 ≤ Ly ≤ 7 pixels
For each accepted RBC, the deformability index (DI) was calculated as:
DI=
All DI values within an image were summed to obtain the total deformability index (DITotal), and the mean deformability index (DIMean) was computed for each image. DIMean values from all seven images were stored for each donor.
3.1.2. Implementation of the Sine Window Filter
Window functions are widely used in digital filter design. In LabVIEW, the sine window was generated using the Sine Pattern.vi module, which generates a sequence containing a sinusoidal signal. The number of samples was selected to optimize signal smoothing. The sequence was squared and normalized by dividing each element by the sum of all kernel elements.
Convolution was performed using one of the RGB channels (all channels are identical in grayscale images). The convolution matrix (kernel) consists of the squared sine window values, normalized by dividing each element by the sum of all kernel elements. Each image pixel value was multiplied by the corresponding kernel value. This procedure effectively suppressed background noise and flow-induced streaks while preserving the RBC signal, enabling reliable detection and quantitative analysis of RBC deformation.
Figure 3 presents a block diagram illustrating the generation and application of the sine window filter.
3.2.3. Software Application using Python Programming Language
Image processing in Python was implemented to detect elliptical objects that meet the morphological criteria for RBCs (described in Section 3.2.1).
Initially, a 24-bit grayscale image was used as input data. The image was smoothed with two Gaussian filters with different scales (σ₁ = 0.7 and σ₂ = 16). This Difference of Gaussians (DoG) filter acts as a band-pass filter, suppressing slowly changing background lighting while emphasizing small bright structures, such as individual cells. As a result, the cells appeared as localized high-frequency pixel regions.
Next, a top-hat transformation was applied using a linear structuring element of length 45 pixels in length and oriented horizontally. This step removed long horizontal elements (e.g., flow streaks) while preserving small, compact objects such as individual cells.
The top-hat filtered image was then binarized using the Otsu method multiplied by a factor of 1.06 to optimize segmentation. The boundary objects were removed, and objects were retained only if their area fell within the range of 50–130 pixels (Figure 2D).
An object was considered a cell if it satisfied the following additional criteria: (i) the deformation index m ≤ 0.35; and (ii) the inclination of the major axis to the horizontal axis is θ ≤ 45°. These criteria eliminated noise, merged cells, and artifacts with excessive inclination.
The following sequence of image processing steps was applied:
a) Original grayscale image
b) Contrast and brightness adjustment
c) Additional convolution to highlight structural details
d) Logarithmic enhancement of bright regions and attenuation of dark regions
e) Gaussian filtering to smooth the image and remove isolated high-intensity pixels
f) Digital image processing and detection of elliptical objects with diameters from 3 to 50 pixels
g) Extraction and presentation of 2Lₓ and 2Lᵧ for individual cells
For each detected cell, Lₓ and Lᵧ were measured, and the deformability index was calculated using the same formula as in the LabVIEW analysis (Figure 2C). The DI values were then averaged for each image (i.e., for each shear rate) and used for further statistical comparison.
3.3. Limitations and Sources of Inter-Platform Variability
Although the analytical workflow, DI definition, and object selection criteria were harmonized across the LABVIEW and Python implementations, systematic differences in absolute DI values were observed between software platforms. These discrepancies are primarily attributable to platform-specific differences in image processing implementation, including numerical precision, convolution and interpolation methods, thresholding strategies, and object segmentation algorithms. Minor variations in background suppression, kernel normalization, and morphological filtering can lead to differences in estimated cell boundaries, particularly for weakly deformed or partially overlapping cells, thereby affecting the calculated coordinates (Lx and Ly) and the resulting DI values.
In addition, default parameter handling, rounding behavior, and internal optimization routines differ among software environments, which may further contribute to small but consistent offsets in DI measurements. Importantly, despite these differences in absolute values, all platforms demonstrated comparable relative trends and consistent discrimination between healthy donors and patients. Therefore, the observed inter-platform variability should be interpreted as a methodological limitation inherent to cross-software image analysis rather than as a limitation of the deformability metric itself.
3.4. Comparison between Deformability Index Values for Healthy Individuals and Patients with CLL
The obtained data were further analyzed to characterize shear-dependent RBC deformability in healthy controls and untreated CLL patients. Cell deformation was assessed across a shear rate range of 89–625 s⁻¹, and RBC deformability was expressed as the Deformability Index (DI) (Table 2). In both groups, DI generally increased with rising shear stress, indicating a shear-dependent enhancement of RBC deformability. This behavior is consistent with normal erythrocyte biomechanics, as RBCs are expected to exhibit greater deformation under higher shear stress.
3.4.1. Python-Based Analysis
According to Python-based software, across most of the shear rate range (89–625 s⁻¹), DI values were lower in untreated CLL patients compared with healthy controls (Table 2, Figure 4). Statistically significant differences (p < 0.05, Mann–Whitney U test) were observed at intermediate shear rate levels corresponding to 268, 357, and 446 s⁻¹, whereas differences at the lowest and highest shear rates did not reach statistical significance. The largest absolute group differences were observed at intermediate to high shear rates (268, 357, and 446 s⁻¹), suggesting a pronounced impairment of RBC deformability in CLL under these conditions.
In healthy individuals, DI increased steadily up to 446 s⁻¹; beyond this point, it reached a plateau and showed a subtle decline at 535 and 625 s⁻¹. In contrast, RBCs from CLL patients showed a markedly attenuated (blunted) shear-dependent response. After an initial increase between 89 and 178 s⁻¹, DI remained relatively unchanged between 178 and 357 s⁻¹, followed by a modest rise at 446 s⁻¹, after which further increases in shear stress resulted in only minimal changes in DI.
Overall, these findings demonstrate a systematic and significant reduction in RBC deformability in untreated CLL patients and a blunted shear-dependent deformability response compared with healthy controls.
Overall, these findings demonstrate a systematic and significant reduction in RBC deformability in untreated CLL patients and a blunted shear-dependent deformability response compared with healthy controls.
3.4.2. LabVIEW-Based Analysis
Analysis using the LabVIEW-based software revealed a pattern of RBC deformability broadly consistent with the Python-based results, although absolute DI values were systematically higher across all shear rates (Table 2, Figure 4). In healthy controls, LabVIEW-derived DI increased progressively from 0.236 ± 0.029 at 89 s⁻¹ to a peak of 0.307 ± 0.016 at 446 s⁻¹, followed by a slight decrease at higher shear rates (0.291 ± 0.025 at 535 s⁻¹ and 0.293 ± 0.024 at 625 s⁻¹).
In untreated CLL patients, DI values calculated with LabVIEW were consistently lower than those of healthy controls at all shear rates. The increase in DI with rising shear stress was attenuated, reflecting a blunted shear-dependent response. DI rose gradually between 89 s⁻¹ and 446 s⁻¹, followed by a modest increase to 0.254 ± 0.018 at 625 s⁻¹ (Table 2, Figure 4). Compared with healthy RBCs, CLL RBCs exhibited a marked reduction in deformability at intermediate shear rates (178–446 s⁻¹), where differences reached statistical significance (p ≤ 0.05), with the most robust differences observed at 357–446 s⁻¹.
3.4.3. Comparison between Python- and LabVIEW-Based Calculations
In line with the above observations, DI values obtained using LabVIEW-based software were consistently slightly higher than those calculated with the Python-based platform across all shear rates (Table 2, Figure 4). This systematic upward shift in absolute values likely reflects differences in image-processing implementation, filtering strategies, and numerical handling between the two computational environments.
Despite this upward shift in absolute values, both analytical approaches exhibited the same qualitative behavior: (i) an progressive increase in DI with rising shear rate in healthy controls, reaching a plateau at higher shear levels; (ii) lower DI values in untreated CLL patients compared with healthy controls across the measured shear range; and (iii) a diminished (blunted) shear-dependent deformability response in CLL RBCs compared with controls, particularly evident at intermediate shear rates. The most pronounced and statistically significant differences between groups were observed at intermediate shear rates (268–446 s⁻¹), suggesting that these flow conditions may be particularly sensitive for detecting subtle mechanical alterations in RBCs associated with CLL.
Pearson correlation analysis demonstrated a strong positive correlation between the two software platforms. The correlation coefficient was very high in the healthy control group (r = 0.96) and slightly lower in the CLL group (r = 0.78), indicating substantial agreement between platforms in both cohorts. The somewhat reduced correlation in the patient group likely reflects greater biological variability and dispersion of DI values among CLL samples rather than methodological inconsistency.
These findings indicate that although the two computational approaches yield different absolute DI values, they preserve consistent relative trends and intergroup differences. This concordance reinforces the robustness and reproducibility of the observed impairment in RBC deformability in untreated CLL patients, independent of the software platform used for analysis.
4. Discussion
In this study, RBC deformability, determined under controlled flow conditions, was studied using a microfluidic imaging approach combined with harmonized image-analysis pipelines implemented in two software platforms. Deformability was quantified using a geometrically defined DI, enabling both biological comparison between healthy donors and CLL patients and technical comparison across software environments.
4.1. RBC Deformability in Healthy Donors
In healthy donors, DI increased progressively with rising shear rate and approached a plateau at higher shear levels, reflecting the expected biomechanical adaptation of RBCs to hydrodynamic stress. This trend was observed in all software platforms, despite minor differences in absolute DI values. The gradual increase in DI likely reflects shear-induced alignment and elongation of RBCs as they adapt to sustained flow conditions within the microfluidic channel. This response is consistent with the viscoelastic behavior of the RBC membrane–cytoskeletal complex. Under physiologic conditions, the membrane skeleton permits RBCs to undergo marked reversible deformation, reflecting their intrinsic mechanical adaptability under external loading [24]. Such behavior is consistent with established hemorheological principles, whereby healthy RBCs demonstrate enhanced deformability in response to increasing shear rates, facilitating efficient microvascular transit [25].
The progressive increase in DI with increasing shear rate further supports the physiological relevance of the microfluidic model and its ability to capture flow-dependent RBC behavior under controlled conditions. In addition, the consistent response observed across analysis platforms demonstrates that the proposed image-analysis framework is sufficiently sensitive to detect subtle mechanical variations. The preservation of this shear-dependent trend indicates that the deformability index reliably reflects relative changes in cell deformation despite minor implementation-related differences in absolute values.
4.2. Altered Deformability Patterns in CLL Patients
In contrast to healthy donors, RBCs from CLL patients exhibited a reduced slope of DI increase, with irregular and non-monotonic patterns across successive shear conditions. The absence of a consistent trend and the attenuated response indicate heterogeneous or impaired mechanical adaptability to flow. Several pathophysiological mechanisms likely contribute to this altered behavior.
These changes may reflect pathological alterations in RBC membrane properties, cytoplasmic viscosity, or interactions with plasma components characteristic of CLL. The disease is associated with systemic inflammation and increased oxidative stress, detectable even at early stages. For example, Yan et al. reported broadly elevated serum cytokine levels in CLL patients compared with healthy individuals, with some cytokines linked to core disease-associated pathways and others correlating with aggressive disease features [26]. Rozovski et al. further demonstrated that inflammatory cytokines both originate from and reinforce pro-inflammatory signaling within the malignant clone, while interactions with immune cells in the microenvironment sustain a chronic inflammatory state [27]. These findings indicate that persistent inflammatory signaling is a fundamental feature of CLL and contributes to systemic oxidative imbalance. Chronic inflammatory signaling and oxidative stress in CLL may therefore extend beyond the malignant clone and influence circulating RBCs.
Oxidative modifications of membrane lipids and cytoskeletal proteins, such as spectrin and ankyrin, can increase membrane stiffness and reduce elastic resilience, ultimately impairing the cell’s ability to adapt to shear stress. Supporting this mechanism, our recent work demonstrated pronounced nanomechanical alterations in RBCs from CLL patients, indicative of changes in membrane structural integrity and mechanical responsiveness [28]. These nanoscale mechanical changes provide a plausible explanation for the reduced and blunted deformability response observed in the present microfluidic analysis. A quantitative relationship between membrane stiffness and functional deformability was established by correlating Young’s modulus (E), measured in [28], with the deformability index (DI) at a defined shear rate (e.g., 357 s−1). As expected, stiffer RBCs (higher E) exhibited lower DI values, with a strong negative correlation (Pearson r = −0.96), supporting the link between nanomechanical alterations and impaired shear-dependent deformability in CLL.
The observed DI fluctuations in CLL patient samples are consistent with impaired rheological regulation and may contribute to microcirculatory dysfunction and elevated vascular resistance, as reduced RBC deformability is known to hinder capillary flow and increase hemodynamic burden in the microvasculature [29].
An important finding of our study is that the largest DI differences between healthy and CLL RBCs occurred at intermediate shear rates. At low shear rates, the absence of a statistically significant difference in DI between control and CLL groups may reflect insufficient deformation forces to fully reveal the underlying mechanical deficits in CLL RBCs. Under these conditions, even cells with impaired membrane or cytoskeletal integrity can maintain near-normal or comparable to healthy state shape, thereby masking subtle defects in deformability. This phenomenon is strongly influenced by the level of applied shear stress and by cellular mechanical heterogeneity. As discussed by Nermi L. Parrow et al., deformability measurements are strongly dependent on applied shear stress, and low-stress conditions may underestimate mechanical heterogeneity within RBC populations [30]. Similarly, Yujin Heo et al. demonstrated that erythrocyte deformability profiles vary markedly with shear stress, with mechanical differences becoming more evident only under sufficiently high deformation forces [31].
In contrast, intermediate shear levels generate adequate mechanical stress to expose heterogeneity in mechanical responses, highlighting the reduced elasticity and adaptability of CLL RBCs. At very high shear rates, RBC elongation approaches a mechanical limit, reducing the relative contrast between the two groups. This interpretation is consistent with the parameterization of elongation index–shear stress curves described by Baskurt et al., showing that RBC elongation progressively approaches a maximal value (EImax) at high shear stress, where additional increases in shear result in only minimal changes in deformation [32]. Intermediate shear conditions, therefore, appear to represent a dynamic range in which membrane–cytoskeleton coupling and viscoelastic adaptation are most critical, thereby unmasking subtle impairments in CLL RBCs.
It should be noted that these altered deformability patterns were consistently detected across both analytical platforms. This reproducibility strengthens the conclusion that the observed mechanical alterations are biological in origin rather than methodological artifacts.
The reduced and mechanically inconsistent RBC deformability may impair microvascular perfusion and tissue oxygen delivery, particularly under conditions requiring dynamic adaptation to variable flow. Although anemia is not typical in early-stage CLL, subclinical rheological alterations may still contribute to microcirculatory dysfunction. Thus, microfluidic deformability assessment may provide additional insight into disease-associated systemic alterations beyond conventional hematological parameters.
Collectively, these findings indicate that untreated CLL is associated with measurable impairment in RBC mechanical adaptability under shear stress, characterized not only by reduced deformability but also by an altered shear-response pattern. This altered biomechanical signature may represent a subtle but clinically relevant manifestation of systemic disease activity.
4.3. Cross-Platform Comparison and Methodological Implications
A main aim of this study was to assess the impact of software platform selection on deformability quantification. While LABVIEW consistently yielded higher absolute DI values compared to Python, both platforms demonstrated concordant relative trends and preserved discrimination between healthy donors and CLL patients. This finding underscores that absolute DI values are sensitive to implementation-specific processing, whereas relative changes and group-level patterns remain robust and biologically informative.
Systematic differences in DI values likely arise from variations in convolution implementation, thresholding strategies, numerical precision, and segmentation algorithms. In particular, small variations in estimated cell boundaries can propagate into measurable differences in Lₓ and Lᵧ, and consequently in DI. These results emphasize the importance of harmonized analytical criteria of image-processing steps to enable reliable comparison of deformability measurements across studies.
4.4. Clinical and Methodological Relevance
The ability to distinguish healthy and pathological deformability patterns using a microfluidic DI-based approach highlights the potential of this methodology for clinical applications. While the present study is not intended as a diagnostic validation, the observed deformability alterations in CLL patients suggest that RBC mechanics may serve as a complementary indicator reflecting disease-related systemic effects. Moreover, the demonstrated sensitivity of DI to both biological condition and analytical implementation highlights the need for standardized deformability metrics if such approaches are to be integrated into clinical studies.
5. Conclusions
In this study, a microfluidic image flow approach was applied to quantify RBC deformability and to compare healthy individuals with untreated CLL patients. The results demonstrated reduced deformability and a blunted shear-dependent response of RBCs in CLL, particularly at intermediate shear rates, indicating altered biomechanical behavior under flow conditions.
Implementation of the analysis algorithm in both LabVIEW and Python showed that, despite systematic differences in absolute DI values, both developed software applications preserved consistent relative trends and group discrimination. This confirms that the observed deformability alterations are robust and biologically relevant, while highlighting the influence of image-processing implementation on absolute measurements.
Overall, the presented workflow combines microfluidic experimentation with automated image analysis to provide a reproducible method for assessing RBC mechanics. Further standardization of analysis pipelines and validation in larger cohorts may support broader application of this approach for studying hemorheological alterations in different diseases.
Author Contributions
Conceptualization, S.T.; methodology and investigation, A.A.-W., T.T.; software, T.T. and A.I.; sample collection, L.G., and M.G.; clinical data, L.G., and M.G.; RBCs preparation, M.I., A.A.-W., and A.L.; microfluidic experiments, A.A.-W., M.I., and A.L.; data analysis and interpretation, S.T., A.A.-W.; writing—original draft preparation, S.T.; writing— review and editing, A.A.-W., S.K., E.A., and S.T.; funding acquisition, S.T. All authors have read and agreed to the published version of the manuscript.
Funding
This work is supported by Grant KP-06-H73/3, competition for financial support for basic research projects—2023, Bulgarian National Science Fund.
Institutional Review Board Statement
The study was conducted according to the guidelines of the Declaration of Helsinki and approved by the Ethics Committee of the Institute of Biophysics and Biomedical Engineering, Bulgarian Academy of Sciences (approval No 378НД 26/03/2024).
Informed Consent Statement
Informed consent was obtained from all subjects involved in the study.
Data Availability Statement
All data are contained within the manuscript and available upon request.
Acknowledgments
This work was realized by the Center of Competence for Mechatronics and Clean Technologies “Mechatronics, Innovation, Robotics, Automation and Clean Technologies” – MIRACle, with the financial support of contract No. BG16RFPR002-1.014-0019-C01, funded by the European Regional Development Fund (ERDF) through the Programme “Research, Innovation and Digitalisation for Smart Transformation” (PRIDST) 2021–2027.
Conflicts of Interest
The authors declare no conflicts of interest.
References
- Chen, M.; Leng, Y.; He, C.; et al. Red blood cells: a potential delivery system. J. Nanobiotechnol. 2023, 21, 288. [Google Scholar] [CrossRef] [PubMed]
- Jiang, H.; Li, X.; Liu, Z.; Luo, S.; Huang, J.; Chen, C.; Chen, R.; Li, F. A microfluidic approach for assessing the rheological properties of healthy versus thalassemic red blood cells. Micromachines 2025, 16, 957. [Google Scholar] [CrossRef] [PubMed]
- Mehendale, N.; Mitra, D.; Paul, D. A fast microfluidic device to measure the deformability of red blood cells. bioRxiv 2019, 644161. [Google Scholar] [CrossRef]
- Liang, M.; Ming, D.; Zhong, J.; Shannon, C.S.; Rojas-Carabali, W.; Agrawal, K.; Ai, Y.; Agrawal, R. Pathophysiological associations and measurement techniques of red blood cell deformability. Biosensors 2025, 15, 566. [Google Scholar] [CrossRef]
- Moutzouri, A.G.; Athanassiou, G.A.; Dimitropoulou, D.; Skoutelis, A.T.; Gogos, C.A. Severe sepsis and diabetes mellitus have additive effects on red blood cell deformability. J. Infect. 2008, 57, 147–151. [Google Scholar] [CrossRef]
- Shin, S.; Ku, Y.; Park, M.S.; et al. Deformability of red blood cells: A determinant of blood viscosity. J. Mech. Sci. Technol. 2005, 19, 216–223. [Google Scholar] [CrossRef]
- Alexy, T.; Detterich, J.; Connes, P.; Toth, K.; Nader, E.; Kenyeres, P.; Arriola-Montenegro, J.; Ulker, P.; Simmonds, M.J. Physical properties of blood and their relationship to clinical conditions. Front. Physiol. 2022, 13, 906768. [Google Scholar] [CrossRef]
- Ortín, X.; Giralt, M.; Romeu, M.; Lejeune, M.; Nogues, M.R.; Sanchez-Martos, V.; Rodriguez-Luaces, M.; Sansa, T.; Font, L. Oxidative stress in patients with early stage chronic lymphocytic leukemia: Assessment and correlation with prognostic factors. J. Hematol. 2012, 1, 77–88. [Google Scholar] [CrossRef]
- D'Alessandro, A.; Zolla, L. Proteomic analysis of red blood cells and the potential for the clinic: What have we learned so far? Expert Rev. Proteomics 2017, 14, 243–252. [Google Scholar] [CrossRef]
- Alexandrova-Watanabe, A.; Abadjieva, E.; Gartcheva, L.; Langari, A.; Ivanova, M.; Guenova, M.; Tiankov, T.; Strijkova, V.; Krumova, S.; Todinova, S. The impact of targeted therapies on red blood cell aggregation in patients with chronic lymphocytic leukemia evaluated using software image flow analysis. Micromachines 2025, 16, 95. [Google Scholar] [CrossRef]
- Zheng, Y.; Wen, J.; Nguyen, J.; Cachia, M.A.; Wang, C.; Sun, Y. Decreased deformability of lymphocytes in chronic lymphocytic leukemia. Sci. Rep. 2015, 5, 7613. [Google Scholar] [CrossRef]
- Alapan, Y.; Little, J.; Gurkan, U. Heterogeneous red blood cell adhesion and deformability in sickle cell disease. Sci. Rep. 2014, 4, 7173. [Google Scholar] [CrossRef] [PubMed]
- Artmann, G.M. Microscopic photometric quantification of stiffness and relaxation time of red blood cells in a flow chamber. Biorheology 1995, 32, 553–570. [Google Scholar] [PubMed]
- Boas, L.V.; Faustino, V.; Lima, R.; Miranda, J.M.; Minas, G.; Fernandes, C.S.V.; Catarino, S.O. Assessment of the deformability and velocity of healthy and artificially impaired red blood cells in narrow PDMS microchannels. Micromachines 2018, 9, 384. [Google Scholar] [CrossRef] [PubMed]
- Cluitmans, J.C.; Chokkalingam, V.; Janssen, A.M.; Brock, R.; Huck, W.T.; Bosman, G.J. Alterations in red blood cell deformability during storage: A microfluidic approach. Biomed. Res. Int. 2014, 764268. [Google Scholar] [CrossRef]
- Edwin, C.E.; Masnok, K.; Sawa, M.; Ibrahim, M.D.; Roslan, L.; Watanabe, N. Comparison between actual and theoretical ellipsoidal shape of human erythrocyte in modulated shear flow. J. Biorheol. 2025, 39, 10–24. [Google Scholar] [CrossRef]
- Žura, N.; Vince, S.; Perić, P.; Vilić, M.; Malarić, K.; Rimac, V.; Golubić Ćepulić, B.; Vajdić, M.; Jurak, I.; Milinković Tur, S.; et al. Short-Term In Vitro Exposure of Human Blood to 5G Network Frequencies: Do Sex and Frequency Additionally Affect Erythrocyte Morphometry? Biomedicines 2025, 13, 478. [Google Scholar] [CrossRef]
- Guo, Q.; Duffy, S.P.; Matthews, K.; Santoso, A.T.; Scott, M.D.; Ma, H. Microfluidic analysis of red blood cell deformability. J. Biomech. 2014, 47, 1767–1776. [Google Scholar] [CrossRef]
- Vdovin, A.; Muravyov, A.V.; Pevzner, A.A. Aggregometer-deformometer of human blood cells. South Sib. Sci. Bull. 2012, 2, 99–103. [Google Scholar]
- Lamoureux, E.S.; Islamzada, E.; Wiens, M.V.J.; Matthews, K.; Duffy, S.P.; Ma, H. Assessing red blood cell deformability from microscopy images using deep learning. Lab Chip, 2022. [Google Scholar]
- Hallek, M.; Cheson, B.D.; Catovsky, D.; et al. iwCLL guidelines for diagnosis, indications for treatment, response assessment, and supportive management of CLL. Blood 2018, 131, 2745–2760. [Google Scholar] [CrossRef]
- Hallek, M.; Cheson, B.D.; Catovsky, D.; et al. Guidelines for the diagnosis and treatment of chronic lymphocytic leukemia. Blood 2008, 111, 5446–5456. [Google Scholar] [CrossRef]
- Alexandrova-Watanabe, A.; Abadjieva, E.; Giosheva, I.; Langari, A.; Tiankov, T.; Gartchev, E.; Komsa-Penkova, R.; Todinova, S. Assessment of red blood cell aggregation in preeclampsia by microfluidic image flow analysis. Int. J. Mol. Sci. 2024, 25, 3732. [Google Scholar] [CrossRef] [PubMed]
- Mohandas, N.; Chasis, J.A.; Shohet, S.B. The influence of membrane skeleton on red cell deformability. Semin. Hematol. 1983, 20, 225–242. [Google Scholar] [PubMed]
- Meram, E.; Yilmaz, B.D.; Bas, C.; Atac, N.; Yalcin, O.; Meiselman, H.J.; Baskurt, O.K. Shear stress-induced improvement of red blood cell deformability. Biorheology 2013, 50, 165–176. [Google Scholar] [CrossRef] [PubMed]
- Yan, X.-J.; Dozmorov, I.; Li, W.; et al. Identification of outcome-correlated cytokine clusters in chronic lymphocytic leukemia. Blood 2011, 118, 5201–5210. [Google Scholar] [CrossRef]
- Rozovski, U.; Keating, M.J.; Estrov, Z. Targeting inflammatory pathways in chronic lymphocytic leukemia. Crit. Rev. Oncol. Hematol. 2013, 88, 655–666. [Google Scholar] [CrossRef]
- Strijkova, V.; Katrova, V.; Ivanova, M.; Langari, A.; Gartcheva, L.; Guenova, M.; Alexandrova-Watanabe, A.; Taneva, S.G.; Krumova, S.; Todinova, S. Nanomechanical and thermodynamic alterations of red blood cells in chronic lymphocytic leukemia. Int. J. Mol. Sci. 2026, 27, 353. [Google Scholar] [CrossRef]
- Baskurt, O.K.; Meiselman, H.J. Blood rheology and hemodynamics. Semin. Thromb. Hemost. 2003, 29, 435–450. [Google Scholar] [CrossRef]
- Parrow, N.L.; Violet, P.C.; Tu, H.; et al. Measuring deformability and red cell heterogeneity in blood by ektacytometry. J. Vis. Exp. 2018, 56910. [Google Scholar]
- Heo, Y.; Jung, H.; Shin, S. Osmotic deformability of erythrocytes at various shear stresses. Clin. Hemorheol. Microcirc. 2015, 59, 211–218. [Google Scholar] [CrossRef]
- Baskurt, O.K.; Hardeman, M.R.; Uyuklu, M.; et al. Parameterization of red blood cell elongation index–shear stress curves obtained by ektacytometry. Scand. J. Clin. Lab. Invest. 2009, 69, 777–788. [Google Scholar] [CrossRef]
Figure 1.
Block diagram of the algorithm for the analysis of RBC deformation. The workflow illustrates the main steps: image acquisition from the BioFlux microfluidic system, detection and segmentation of individual RBCs, ellipse fitting to determine cell axes, and calculation of the deformability index (DI) for each cell.
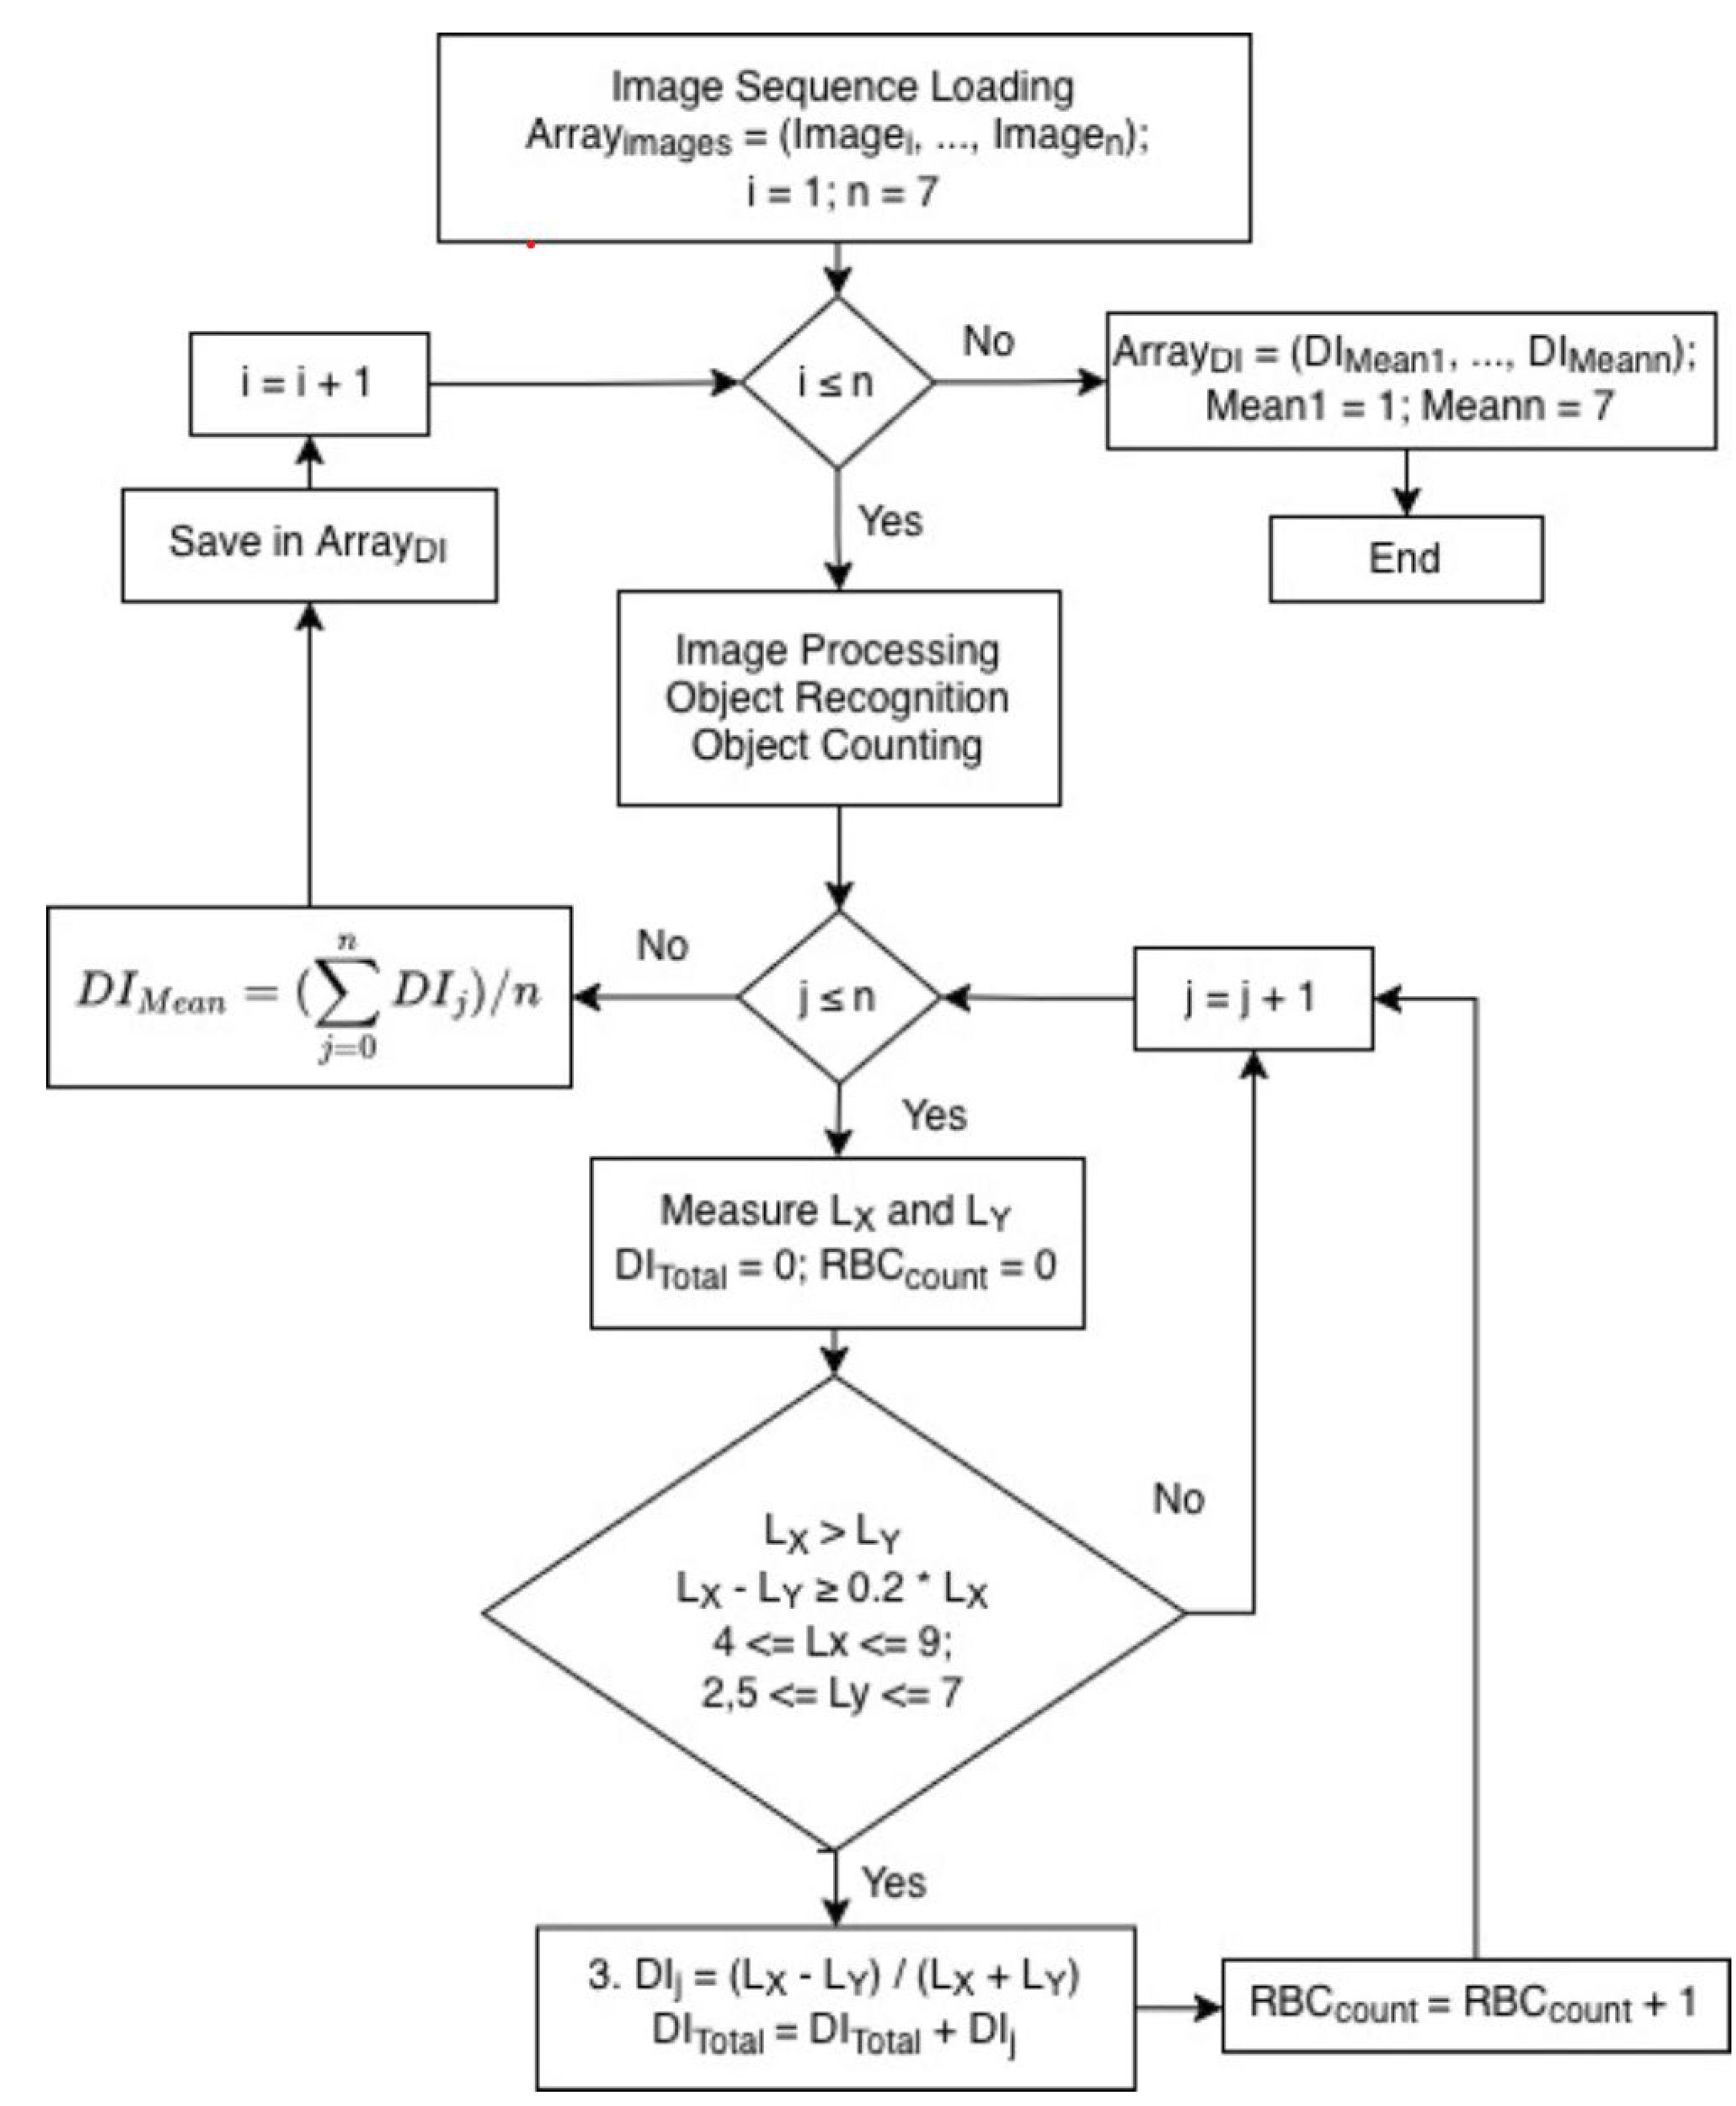
Figure 2.
Main image-processing steps implemented in two platforms, LabVIEW and Python. (A) Original 24-bit grayscale image acquired from the BioFlux microfluidic system. (B) Image processed in LabVIEW after background smoothing using a Gaussian filter to reduce intensity variations and remove isolated high-intensity pixels. (C) Detection and segmentation of elliptical objects (RBCs) with the major (Lx) and minor (Ly) axes indicated for a representative cell, used for calculation of the deformability index (DI) in LabVIEW. (D) Image processed in Python after application of a band-pass filter, a Top-Hat transformation with a linear structuring element (length 45 pixels, horizontal orientation), and Otsu binarization of the Top-Hat result. (E) Detection and segmentation of elliptical objects (RBCs) with the major (Lx) and minor (Ly) axes for a representative cell, used for calculation of the deformability index (DI) in Python. Scale bar: 50 µm in panels A, B, and D; 5 µm in panels C and E.
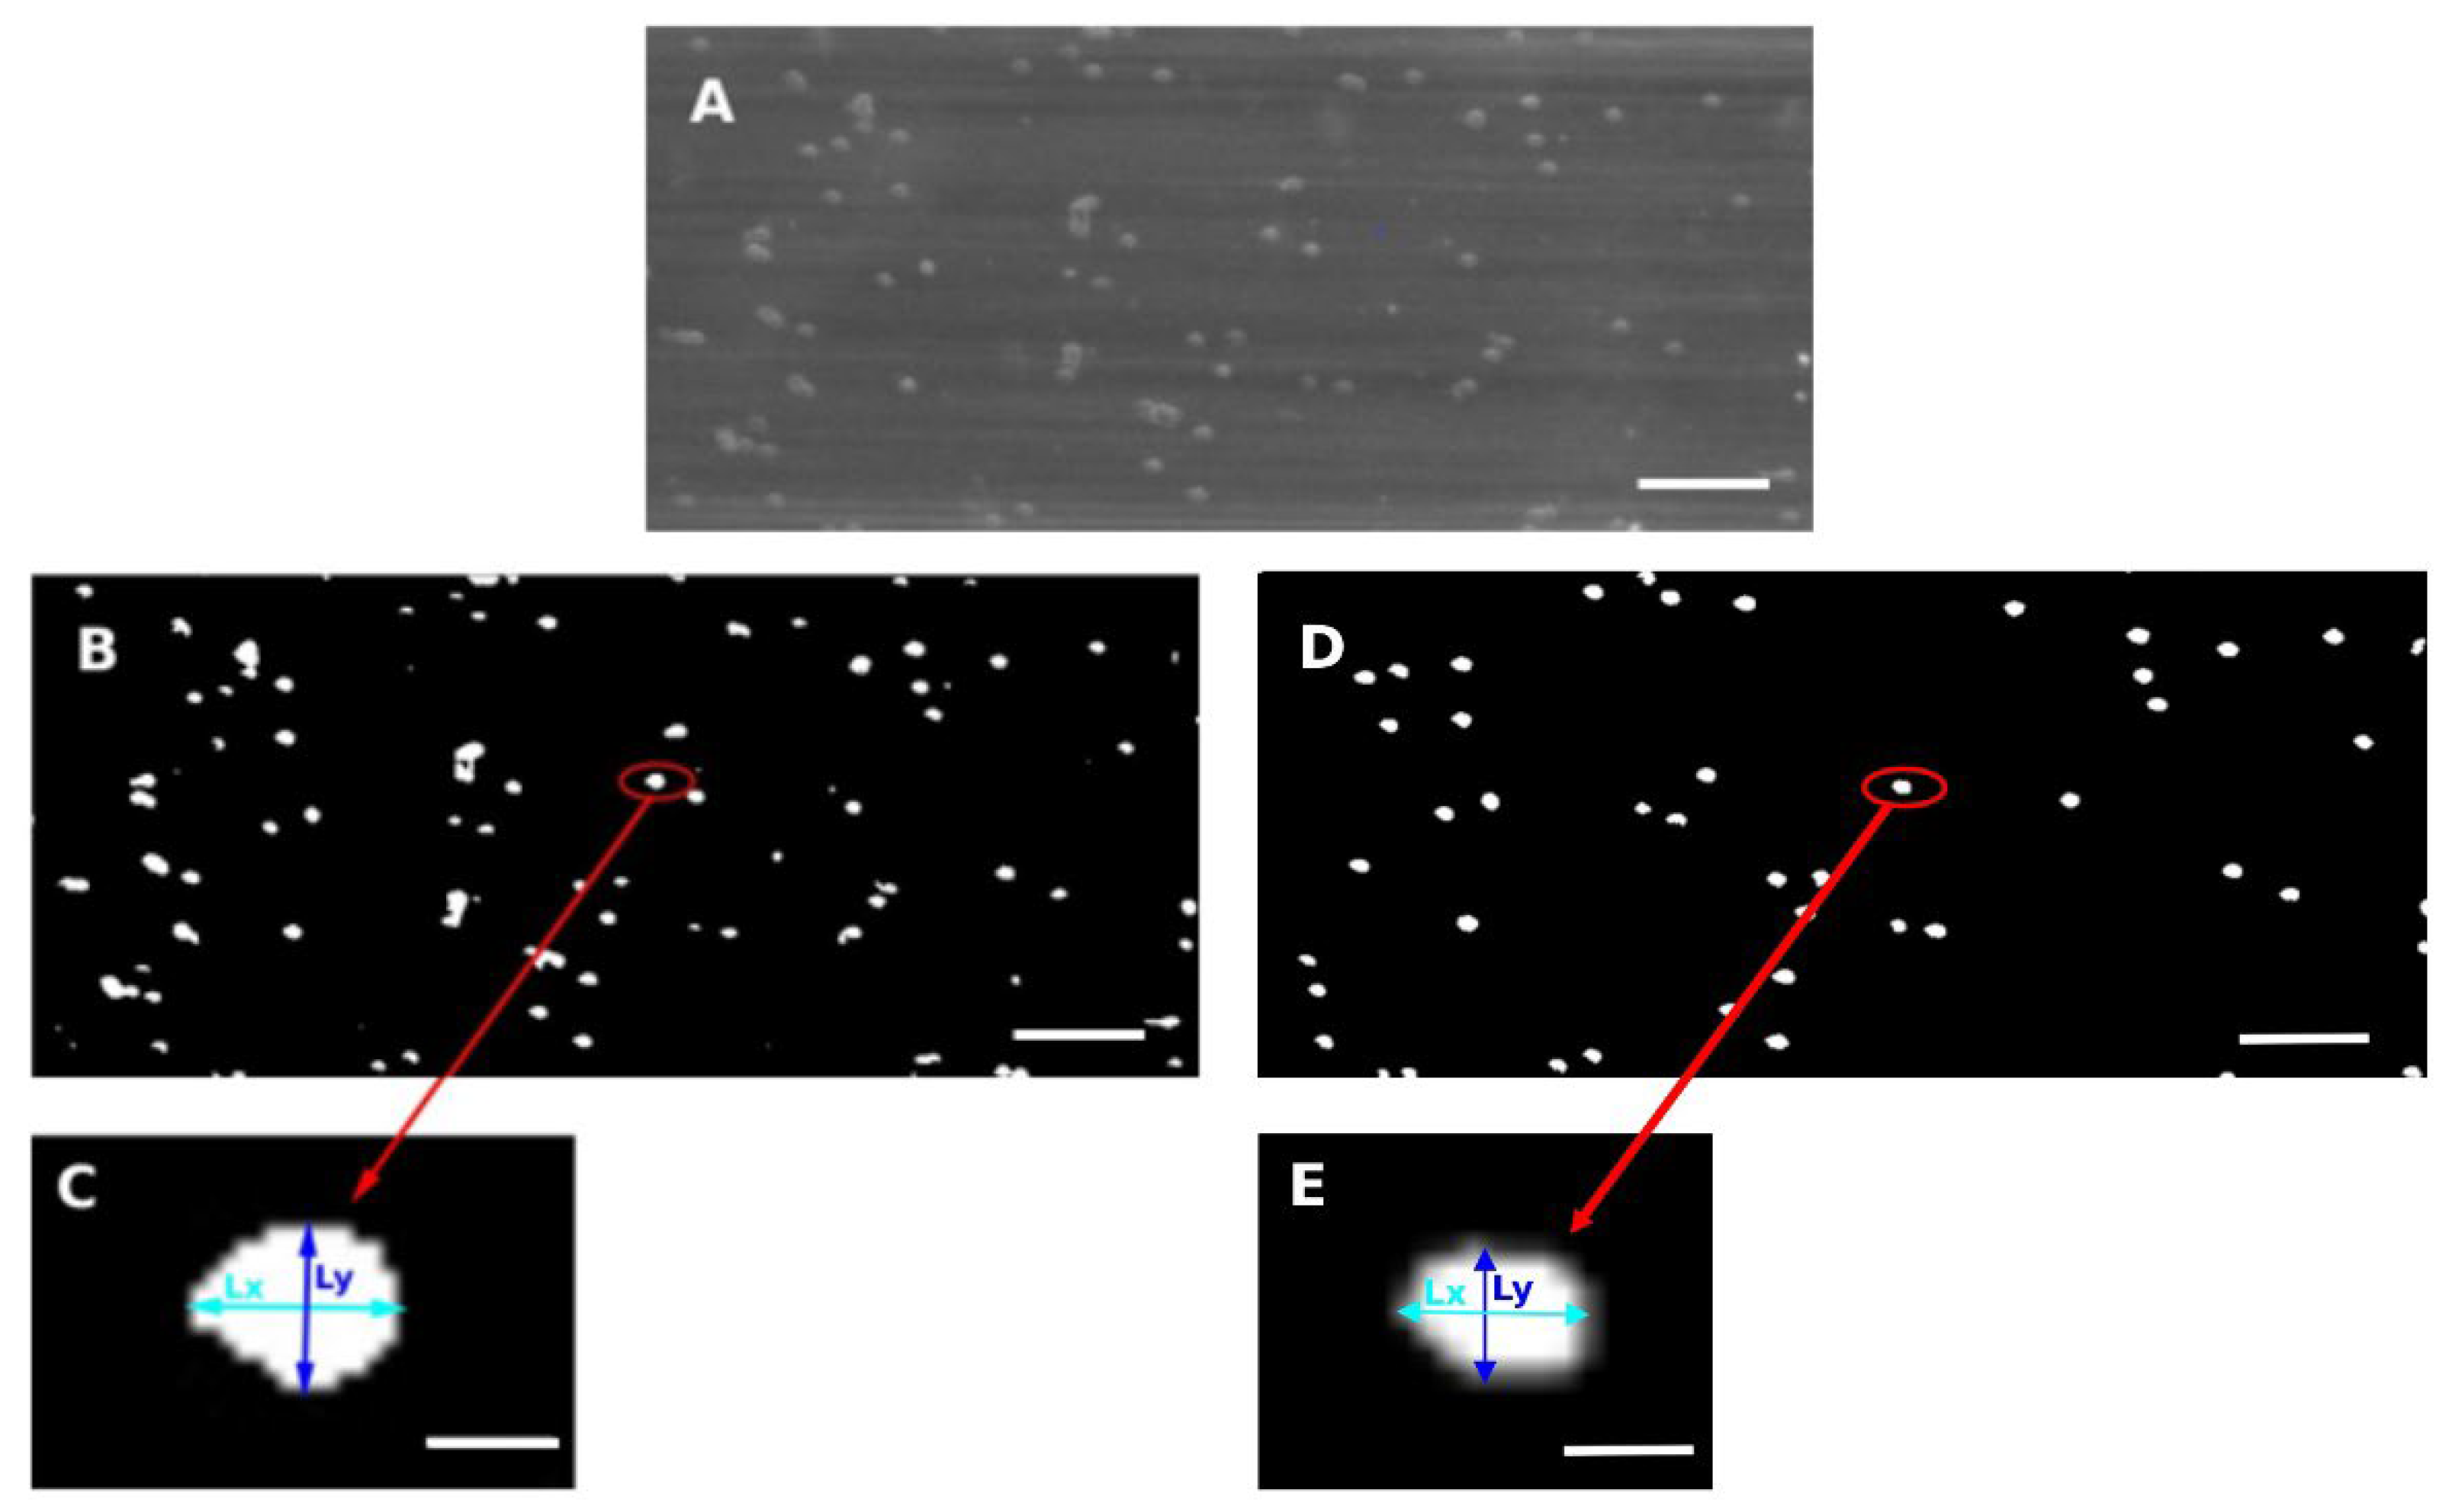
Figure 3.
Diagram with a half sine window model applied to images with extremely high background noise.
Figure 3.
Diagram with a half sine window model applied to images with extremely high background noise.
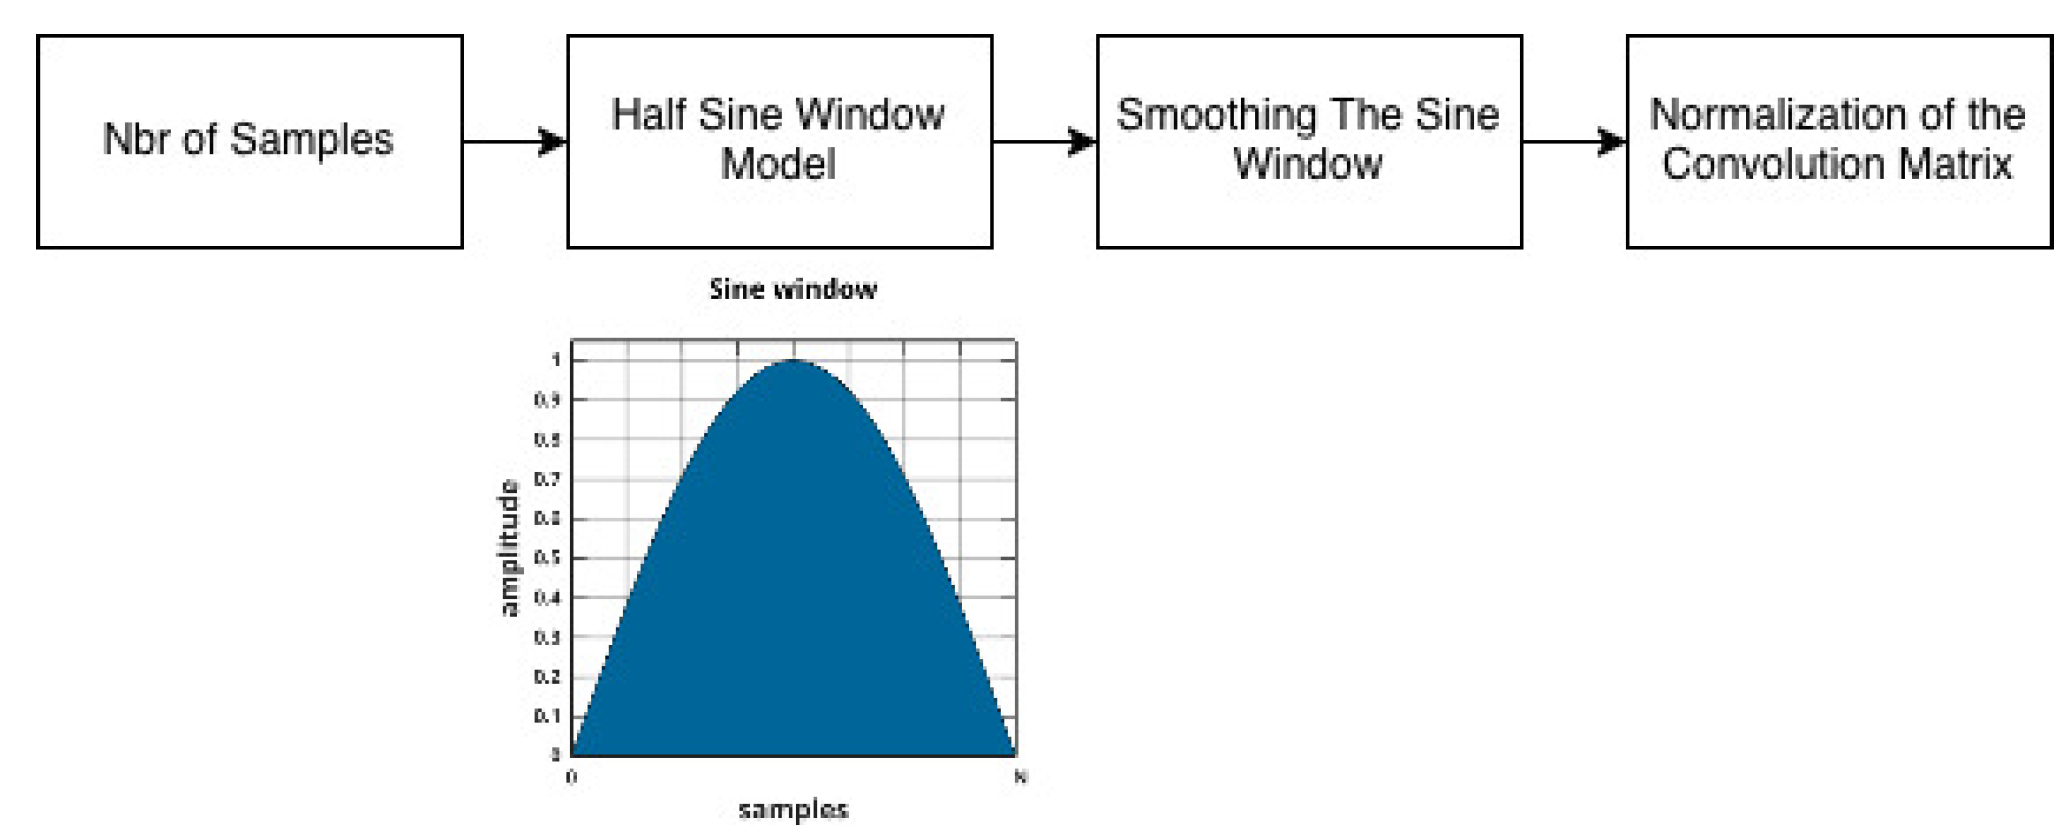
Figure 4.
A) Dependence of deformation index (mean ± standard error) on shear stress for RBCs isolated from healthy individuals (blue circles) and untreated CLL patients (red circles) obtained using Python; B) Dependence of deformation index (mean ± standard error) on shear stress for RBCs isolated from healthy individuals (light blue circles) and untreated CLL patients (orange circles) obtained using LabVIEW-based software.
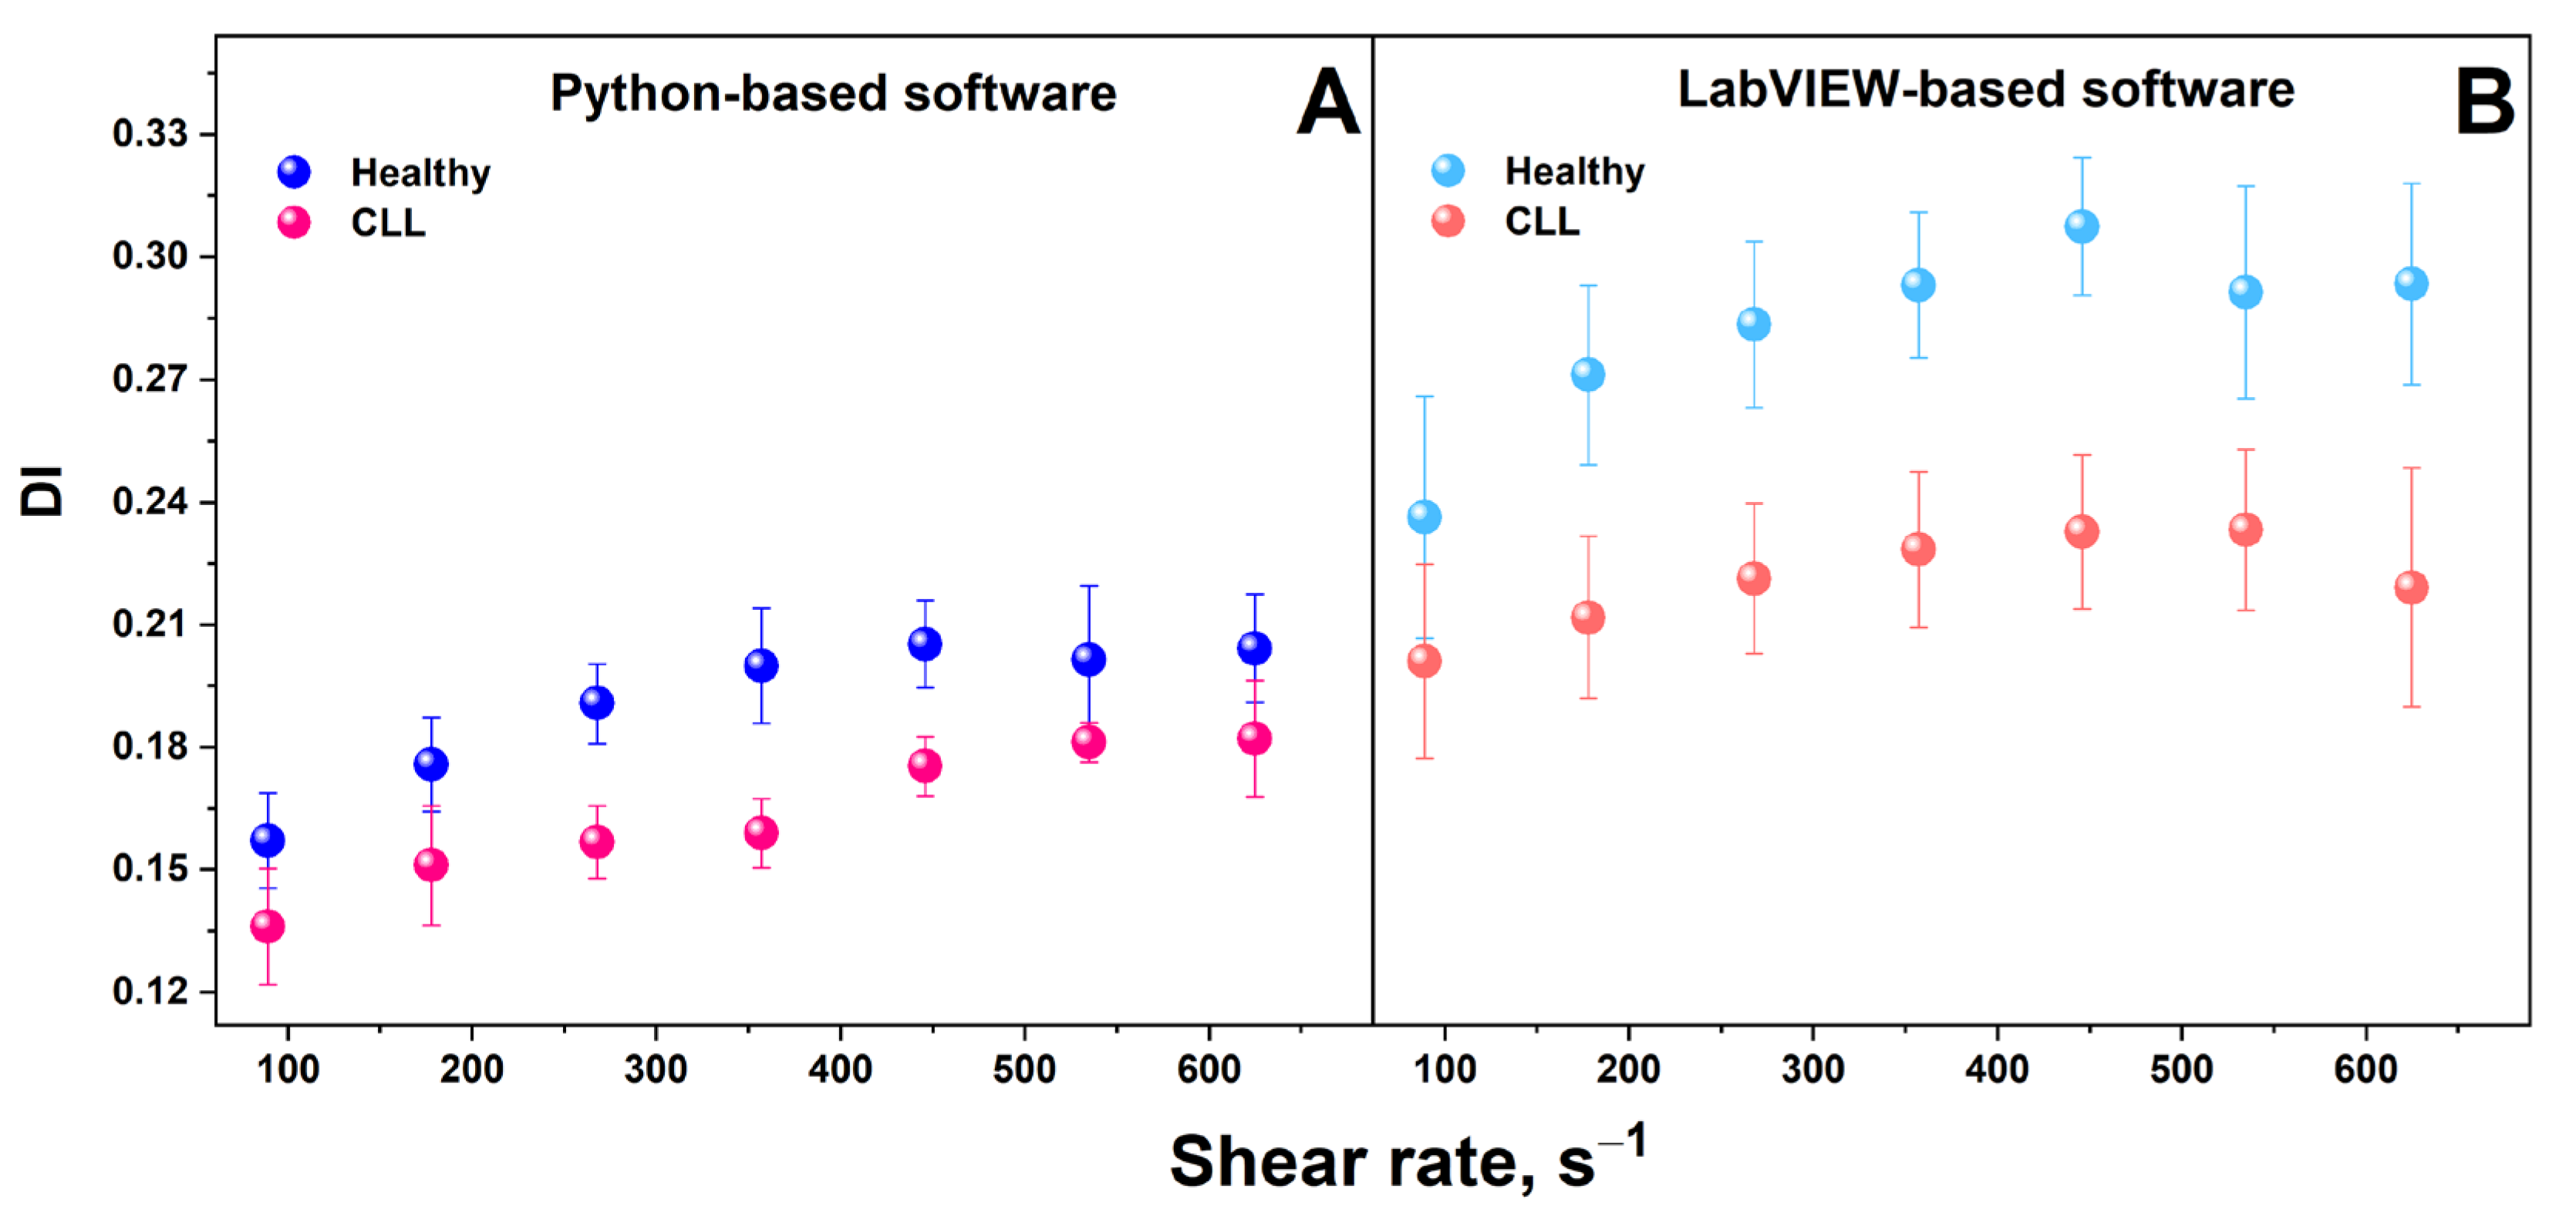

Table 1.
Clinical (age, gender, and Rai stage) and hematological indices (RBC count; hemoglobin, Hb; hematocrit, Ht; mean corpuscular volume, MCV; mean corpuscular hemoglobin, MCH; mean corpuscular hemoglobin concentration, MCHC; red blood cell distribution width, RDW; white blood cell count, WBC and lymphocyte count) determined for healthy controls and CLL patients. Data are presented as mean ± standard deviation (SD).
| Parameters | Reference Value | Studied Groups | |
|
Healthy controls (n = 13) |
Untreated CLL Patients (n = 9) |
||
| Age (years) | - | 58.00 ± 7.4 | 63.89 ± 12.01 |
| Gender (F/M) | 8/5 | 4/5 | |
| Rai stage | 0 – 1 | ||
| RBC count (T/L) | 4.60–6.20 | 4.97 ± 0.23 | 4.98 ± 0.39 |
| Hb (g/L) | 140.00–180.00 | 161.40 ± 8.09 | 146.44± 11.86 |
| Ht (L/L) | 0.40–0.54 | 0.48 ± 0.01 | 0.44 ± 0.03 |
| MCV (fl) | 80.00–95.00 | 89.10 ± 3.74 | 87.93 ± 5.01 |
| MCH (pg/L) | 27.00–32.00 | 30.55 ± 1.33 | 29.43 ± 1.69 |
| MCHC (g/L) | 320.00–360.00 | 344.75 ± 4.15 | 335.00 ± 8.62 |
| RDW % | 11.60–14.80 | 13.88 ± 0.80 | 14.50 ± 1.32 |
| WBC | 3.50–10.50 | 6.3 ± 1.1 | 11.7 ÷ 157.5 * |
| Lymphocytes (ABS) | 1.10–3.80 | 1.91 ± 0.17 | 6.70 ÷ 144.28 * |
* Indicates statistically significant difference (p < 0.05) in the values of laboratory indices for CLL patient groups compared with the control values.
Table 2.
Deformability Index (DI) of RBCs from healthy individuals and untreated CLL patients at different shear rates, calculated using Python-based software and LabVIEW-based software. Data are presented as mean ± standard deviation. * Indicates a statistically significant difference at p < 0.05 according to the Mann–Whitney U test.
| Shear rate (s⁻¹) | Python-based software | LabVIEW-based software | ||||
| Healthy controls | Untreated CLL patients | p | Healthy controls | Untreated CLL patients | p | |
| 89 | 0.157 ± 0.011 | 0.136 ± 0.014 | 0.18 | 0.236 ± 0.029 | 0.201 ± 0.023 | 0.074 |
| 178 | 0.176 ± 0.011 | 0.151 ± 0.014 | 0.20 | 0.271 ± 0.022 | 0.212 ± 0.020* | 0.046 |
| 268 | 0.191 ± 0.010 | 0.156 ± 0.009* | 0.015 | 0.284 ± 0.020 | 0.221 ± 0.018* | 0.016 |
| 357 | 0.200 ± 0.014 | 0.159 ± 0.008* | 0.031 | 0.293 ± 0.017 | 0.228 ± 0.019* | 0.012 |
| 446 | 0.205 ± 0.010 | 0.175 ± 0.007* | 0.039 | 0.307 ± 0.016 | 0.233 ± 0.019* | 0.014 |
| 535 | 0.202 ± 0.018 | 0.181 ± 0.005 | 0.19 | 0.291 ± 0.025 | 0.233 ± 0.020* | 0.022 |
| 625 | 0.204 ± 0.013 | 0.182 ± 0.014 | 0.14 | 0.293 ± 0.024 | 0.219 ± 0.029* | 0.035 |
Disclaimer/Publisher’s Note: The statements, opinions and data contained in all publications are solely those of the individual author(s) and contributor(s) and not of MDPI and/or the editor(s). MDPI and/or the editor(s) disclaim responsibility for any injury to people or property resulting from any ideas, methods, instructions or products referred to in the content. |
© 2026 by the authors. Licensee MDPI, Basel, Switzerland. This article is an open access article distributed under the terms and conditions of the Creative Commons Attribution (CC BY) license (http://creativecommons.org/licenses/by/4.0/).
Copyright: This open access article is published under a Creative Commons CC BY 4.0 license, which permit the free download, distribution, and reuse, provided that the author and preprint are cited in any reuse.


