

Submitted:
12 March 2026
Posted:
17 March 2026
You are already at the latest version
Abstract
This article addresses a current point of contention in the field of single molecule/single particle tracking, as well as relevant literature, and supplements it with some published cell-based experiments to illustrate our conclusions and known theorems. We attempt to explain the controversy surrounding the differing biophysical and cell biological results of studies on the individual molecule and those “at the single-molecule level” as well as at the level of many molecules in such a way that even readers who are unfamiliar with the subject can understand it without having to read all the mathematical, physical, and biophysical references. Given this abundance of studies in the literature, it is obvious that genuine single-molecule studies are urgently needed, i.e., single-molecule studies that focus on increasing the sensitivity of the temporal resolution of single-molecule measurements and not just on spatial resolution.
Keywords:
translational diffusion
; spectroscopy
; imaging
; super-resolution microscopy
; single molecule
; single-molecule tracking
; single-particle tracking
; individual molecule
; selfsame molecule
; thermodynamic temporal single-molecule limits in diffraction-limited and diffraction-unlimited optical systems
; hardware
1. Introduction
From a physical point of view, “particle” is a general term that covers atoms, ions, and molecules, while a molecule is a specific type of particle made up of two or more covalently bonded atoms. Chemically speaking, a molecule is a type of particle. A molecule is a precise chemical structure (bonded atoms), while a particle is a broader, more general term for a single, discrete unit or object, which can range from electrons to microscopic dust particles to larger aggregates. In many biological contexts, these terms are used synonymously in microscopy (SMT/SPT) to describe the tracking of movements within cells, as both techniques now enable multiparametric 3D tracking. Here, we use the term commonly used in biochemistry, namely that molecules are particles. SMT or SPT representing transformative tools in the field of life sciences and offering unparalleled insights into the dynamic behaviors of biomolecules within live cells. By capturing the movement, interaction, and localization of single molecules, SMT has revolutionized our understanding of cellular mechanisms at the nanoscale. This article provides an in-depth exploration into the principles, methodologies, applications, challenges, and future directions of SMT for live cell research.
Understanding cellular processes at the molecular level is key to unravelling the complexities of life. Unlike traditional ensemble-based methods that average behaviors across populations, SMT may uniquely captures the individuality and heterogeneity of biomolecular dynamics. The implications of these observations extend beyond fundamental biology into medical research, drug discovery, and synthetic biology, where molecular-level insights dictate advancements.
As the field evolves, SMT continues to integrate interdisciplinary approaches from mathematics, physics, chemistry, biochemistry, computer science, engineering and cell biology making it an indispensable tool for life scientists. This detailed overview seeks to unravel the theoretical underpinnings, technical advancements, and transformative applications of SMT, while critically examining existing challenges and providing a glimpse into future innovations.
The paper also serves to provide a basic understanding of highly sophisticated measuring instruments and methods for evaluating measurement data or evaluation algorithms independent of the manufacturers and software developers or providers, which is important for cell biologists and molecular biologists who are not primarily trained in physics and optics (see section 3. Some Challenges in Single-Molecule Tracking).
Since the topic is too broad for a single article, we hope that this paper will convey the excitement surrounding the very latest achievements in the field of single-molecule tracking for live cells.
What are the key findings of the latest literature summarized in this article?
- Single-Molecule/Single-Particle Tracking are quantitative and non-invasive tools for monitoring biomolecules within living cells. The tools have been extended to study the temporal dynamics.
- Single-Molecule Localization Microscopy improves the spatial resolution capability of optical imaging to examine length scales below the diffraction limit of light. The lateral resolution is typically in the range of ∼30-20 nm. Newer SMLM-based methods such as MinFlux achieve a 3D spatial resolution of 1–3 nm.
What are the implications of the key findings of the latest literature?
- Some authors consider SMT to be a subset/subfield or example of SMLM techniques.
- Single-molecule studies do not always refer exclusively to details of the individual molecule or interpret each single molecule in the context of the bulk phase. The bridge is built by combining approaches “at the single-molecule level” with ensemble averages, which, as shown here, leads to stimulating and challenging outcomes and could differ from those obtained at the level of many molecules.
Most publications in the literature either contain no statements at all or, as a rule, only superficial statements on the theory of measuring a single molecule/a single molecule without immobilization or hydrodynamic focusing, whereby the thermodynamic jitter (variability) of individual molecules/single molecules due to Brownian motion is neglected. Almost all so-called single-molecule studies in living cells and diluted solutions without immobilization or fixed binding to artificial membranes such as cover slips or to natural membranes are hampered, which is in line with the timely mainstream in this field. These studies do not provide any evidence for the measurement of a single molecule that is an individual molecule or particle but instead measure many molecules that they do not specify. So, it makes theoretically no sense to refer to those studies in all the details. Instead, we also offer unbiased readers access to the primary literature for our well-known conclusions and theorems. We are aware that this may lead to further polarization in the field or at least enable it.
In this article, we present some figures relating to our collaboration with one of the world's leading manufacturers of fluorescence and biomedical instruments, ISS Inc. This is not intended as promotional material for a specific platform. Rather, it clearly and vividly underscores our scientific conclusions and previously published theorems for a broader audience, rather than in abstract terms intended only for mathematicians and theoretical physicists.
2. Fundamentals of Single-Molecule Tracking
2.1. What Is SMT?
The SMT involves the visualization and analysis of single molecules within living systems. SMT reveals rare events at the molecular level. It leverages advanced optical tools and computational methods to follow the trajectory of single molecules over time. At its core, SMT provides quantitative metrics, such as diffusion coefficients, binding rates, and molecular dwell times, which are crucial for understanding dynamic processes. This method solves longstanding questions regarding molecular interactions, localization, and their role in cellular function. For instance, SMT allows to deconstruct the stochastic movement of receptors on cellular membranes or analyze protein transport within the cytoskeleton framework.
2.2. Historical Context
The concept of tracking individual molecules emerged in the late 20th century, driven by advancements in fluorescence microscopy and biophysics. Milestones include the introduction of fluorescent tagging and high-resolution detectors. The physical diffraction limit itself still applies. However, super-resolution techniques circumvent this spatial limitation by determining the position of individual emitters with precision higher than the diffraction limit.
Foundational work by Albert Einstein on Brownian motion laid the theoretical groundwork for understanding molecular dynamics [1]. However, it was not until the advent of fluorescence-based techniques, such as fluorophore tagging and Förster resonance energy transfer (FRET), that scientists could directly observe single molecules. Early pioneers, such as W. E. Moerner and E. Betzig, revolutionized the field by demonstrating single-molecule fluorescence in biological systems, earning them the Nobel Prize in Chemistry [2,3].
In 1989, W. E. Moerner became the first scientist to measure the light absorption of a single molecule at liquid helium temperatures (1.6 Kelvin corresponding to -257.15 degree Celsius) [4]. In this case, it was a pentacene molecule in a p-terphenyl host crystal and the first optical detection and spectroscopy of single molecules in the condensed phase.
In 1997, W. E. Moerner spread a variant of GFPs all over a gel. The distance between the individual proteins after immobilization was greater than Abbe’s diffraction limit of 0.2 µm [5]. The protein emitted fluorescence at an excitation wavelength of 488 nm. After some time, the fluorescence decreased. Light with a wavelength of 405 nm reactivated the protein, whereupon it fluoresced again at an excitation wavelength of 488 nm. Because the protein molecules were only sparsely distributed, the glow of individual molecules could be observed with an optical microscope. The fluorescence of individual molecules was controlled, thus solving a problem that Eric Betzig had formulated in 1995 [6]. In 2006, Eric Betzing excited proteins to fluorescence by means of a laser pulse. Because the pulse was very weak, only a fraction of the proteins began to fluorescence. Due to their small number, almost all protein molecules were located at a distance greater than the Abbe diffraction limit of 0.2 μm. This allowed the position of each glowing protein to be determined very precisely under the microscope. After a certain time, the fluorescence faded, and a new subset of proteins was excited by a laser pulse. This procedure was then repeated. The images taken were superimposed and a super-resolution image of the lysosome membrane was obtained far better than Abbe’s diffraction limit [3]. In the biological and medical sciences, single molecules are one of the cutting-edge technologies in methodologies and far-reaching applications. Single molecule tracking and single molecule analysis, respectively, revolutionized how researchers view problems such as molecular motor diseases, protein folding diseases and enzymatic kinetics just to name a few.
Stefan Hell, who also received the Nobel Prize in Chemistry, theoretically proposed a method called stimulated emission depletion (STED) in 1994 [7]. One light pulse excited all fluorescent molecules, while another light pulse quenched the fluorescence of all molecules except those in a nanometer-sized volume in the center and the fluorescence of this volume was recorded. By scanning the sample and continuously measuring the light intensity, a comprehensive image was obtained. The smaller the volume that fluoresces at a given time, the higher the spatial resolution of the resulting image. Therefore, optical microscopes were no longer inherently limited by a spatial resolution limit. In 2000, Stefan Hell proved that his ideas worked in practice [8].
Earlier studies relied on brighter signals due to limited detector sensitivity [2]. Therefore, larger scattering particles (e.g., gold nanoparticles) or labels containing multiple fluorophores were often used. The search for ways to utilize the optical signals of individual molecules began in the three research groups through the application of single-molecule fluorescence. However, the beginning of the investigation of single molecules is primarily attributed to Professor W. Moerner. Based on the discoveries of these three research groups, we can now study biochemistry “at the single-molecule level” without immobilization on biological or artificial surfaces (e.g., cover slips) and without hydrodynamic focussing [9]. Biochemistry and chemistry traditionally deal with large quantities of molecules and their effects. Most research groups neglect the thermodynamic jitter of molecules/particles in their so-called single-molecule or single-particle studies, or in their studies “at the single-molecule level” in dilute liquids or living cells without immobilization or hydrodynamic flow. The time resolution of translational diffusion for a single molecule/particle (an individual molecule/particle) in dilute liquids and living cells, including membranes, is also referred to as “meaningful time Tm” in order to separate the single molecule/particle in time from another single molecule/particle of the same kind without immobilizing it on solid phases or membranes and without hydrodynamic flow [10]. The temporal resolution of freely difussing individual molecules (single molecules) in dilute solutions (liquids), membranes of live cells depends on the concentration of molecules of the same kind in the bulk phase [10,11]; it is the reference measure for all time-resolved calculations/algorithms based upon parameter sets of (specific) measurement techniques, for example, photon counting statistics, Nyquist limit, ‘single-molecule FRET’, etc., in order to ultimately justify whether or not a single molecule/particle (individual molecule/particle, self-same molecule/particle) was measured during the observation/detection time [11,12]. To be clear, this work in the field of single-molecule biophysics deals with the observation and analysis of the individual molecule, meaning one and the same molecule, in solutions and membranes as well as in living cells without immobilization or hydrodynamic focusing. For this reason, the concept of the “re-entries” into the detection/observation volume and the concept of the “meaningful time Tm” were introduced to analyze specifically the behavior of the individual molecule over longer periods of time when it repeatedly re-enters the detection/observation volume [13]. In other words: Only one and the same molecule diffuses into and out of the detection/observation volume during the meaningful time Tm, which must be the measurement time. These original articles emphasize the study of individual molecules in their natural state, without the need for surface immobilization or the use of external forces like hydrodynamic focusing. The articles developed theoretical frameworks for detecting individual molecules, including the use of the thermodynamic signature of a single molecule or particle (thermodynamic jitter) in dilute liquids and living cells [14]. Thus, they laid the foundation for single-molecule biophysics and biochemistry based on the stochastic nature of diffusion (thermodynamic jitter). These articles suggested that the light (photons) we perceive from individual molecules is not just a simple quantum emission but also reflects the random thermal motion (thermodynamic jitter) of these molecules in their environment, making photon statistics a secondary “epiphenomenon” of the fundamental molecular motion. Essentially, the irregular motion of the individual molecule changes its position relative to the detector or light field, thereby influencing when and how photons are emitted or detected, making the photon signal an indicator of the underlying thermodynamic fluctuations [11]. However, nearly all single-molecule studies in dilute solutions or living cells without immobilization on surfaces or hydrodynamic focusing are not based exclusively on facts about the individual molecules or puzzle out each single molecule (individual molecule) within the surrounding phase (bulk phase). Combining single-molecule methods with ensemble averages yields interesting results. Bridging approaches utilizing ensemble averages are currently being implemented.
2.3. Key Techniques
Two opposing views can be found in both recent and older articles. One focuses on fluctuations in molecular motion and concludes that, for example, no significant thermodynamic jitter occurs at -233 °C (see above). The other view, which corresponds to the prevailing opinion, ignores thermodynamic jitter such as Brownian motion when it comes to the temporal resolution of measurement or investigation methods, or their calculation [15]. Therefore, single-molecule studies do not always refer exclusively to details of the individual molecules or interpret each molecule in the context of the bulk phase [13], which is particularly true for single-molecule/single-particle tracking experiments. The bridge between these two perspectives is built by combining approaches ‘at the single molecule level’ with ensemble averages, which, as shown here, leads to stimulating and challenging outcomes and could differ from those obtained at the level of many molecules [16].
SMT/SPT are quantitative and non-invasive tools for monitoring the movement and interactions of labeled protein molecules within living cells. SMT/SPT is not limited to proteins; lipids are also frequently tracked. SMT/SPT have been extended to study the temporal dynamics. SMLM improves the spatial resolution capability of optical imaging to examine length scales below the diffraction limit of light. It comprises techniques of super-resolution imaging that enable visualizing the distribution of proteins with high precision. Currently, the lateral resolution is typically in the range of ∼30-20 nm, compared to the resolution limit of ∼250 nm in conventional microscopy. Nanometer-scale precision was already achieved in early single-molecule tracking studies in the early 2000s (e.g., [17]). Newer SMLM-based methods such as MinFlux achieve a 3D spatial resolution of 1–3 nm [18,19,20].
SMT and SMLM generate point clouds of spatial data points. These point clouds consist of highly precise coordinates representing the positions of single molecules within a biological sample. This point cloud data format is a fundamental feature of these techniques, enabling an unprecedented visualization of molecular organization and dynamics that is not possible with conventional microscopy. In the latest literature, some authors consider SMT to be a subset/subfield or example of SMLM techniques [21]. But SMLM is rarely used to track molecules over time. Instead, the temporal dimension in techniques such as STORM or PALM is mainly used to separate fluorophore blinking or activation events from each other. Even if photoactivated molecules are subsequently tracked, the terminology used in the literature would typically continue to refer to SMT rather than SMLM.
2.4. Core Principles
We keep coming across the same questions: What is the meaning of single-molecule approaches and their core principles? Are they just another tool? Is it only about specific concepts such as anomalous diffusion or non-ergodicity? What is the motivation for readers new to SMT/SPT? Given the abundance of so-called single-molecule studies in the literature, it is obvious that true single-molecule studies are urgently needed, i.e., single-molecule studies that focus on increasing the sensitivity of the temporal resolution of single-molecule measurements and not just on spatial resolution. Current technologies in dilute solutions or living cells without immobilization or hydrodynamic focusing can only measure biological mechanisms as an average of a molecular population, since only their combined effect can be detected. This simplification ignores the fact that biological macromolecules oscillate between different states of activity and are subject to numerous levels of regulation. The ability to study the behavior of each individual molecule in a population to fully understand molecular mechanisms and their regulation in the cell will open completely new perspectives for molecular medicine and diagnostic technology. Research into single-molecule detection will provide insights into molecular mechanisms and their pathology.
A conceptual framework for thinking about crowded environment like biological cells and their compartments is that anomalous subdiffusive motions of macromolecules can occur due to geometric and/or energetic disorder [22,23]. The motions of proteins, RNAs or DNA can be hindered either by molecular crowding modeled by spatial, geometric restraints of fractals or by chemical binding represented by continuous-time random walks with heavy tails [24]. This has been coined a coexistence of an ergodic anomalous diffusion and a nonergodic process of dynamics of macromolecules in living cells and their complex environment. Deciphering the molecular nature of the coexistence of ergodic anomalous process and nonergodic behavior constitutes an important quest of the field. In principle, widely used experimental methods such as fluorescence fluctuation spectroscopy and imaging like fluorescence correlation spectroscopy reveal only apparent values of the diffusion coefficients [25].
- (i)
- Fluorescent Labeling
Various methods for fluorophore labeling have been developed, such as fluorescent proteins, fluorophore-labeled ligands or nanobodies, and self-labeling protein tags such as HaloTag or SNAP-Tag (see [26]). The development of advanced fluorophores has dramatically enhanced SMT capabilities [26,27]. Organic dyes, quantum dots, and genetically encoded fluorescent proteins offer brightness and photostability, critical for tracking in dynamic environments.
Quantum dots have revolutionized SMT due to their superior photostability and brightness [28]. The nanoscale semiconductor particles enable prolonged imaging sessions, allowing researchers to monitor molecular dynamics spanning several minutes or hours.
Moreover, genetically encoded fluorescent proteins, such as mCherry and eGFP, provide specificity, enabling the tagging of intracellular targets without altering their native function.
Site-specific, bio-orthogonal dye-labeling of proteins in vivo is used for SMT due to their superior photophysical properties compared to fluorescent proteins [29].
So far, we have only discussed the advantages of the individual labeling techniques. However, we believe that a more in-depth discussion of the limitations (e.g., labeling efficiency, activity, permeability for intracellular structures) would be necessary for a general audience. We therefore refer to the following paragraphs or subsections of this overview: Two-Color Single-Molecule Tracking, Photobleaching and Phototoxicity, Data Analysis Bottlenecks, Multi-Color SMT, and Non-Labeling Methods.
- (ii)
- High-resolution Microscopy
Techniques like TIRF microscopy and confocal microscopy are utilized for precision imaging (see [30,31]). These methods reduce background noise and improve spatial resolution. Super-resolution techniques, such as STORM and PALM, have pushed the boundaries of spatial resolution, enabling the visualization of subcellular structures [21].
Wide-field microscopy illuminates the whole sample simultaneously, capturing a broad 2D view. It is ideal for thin samples such as cell cultures and uses either transmitted light (brightfield, phase contrast) or fluorescence light (fluorophores absorb and emit light). It is simple, fast, and excellent for live-cell microscopy and SMT [32].
Recent innovations in light-sheet microscopy have further enhanced SMT by providing three-dimensional spatial resolution while minimizing phototoxicity [33]. These methods allow researchers to track molecules in thicker samples, such as organoids or tissue slices, expanding SMT applications beyond single cells.
- (iii)
- Two-Color Single-Molecule Tracking
Two-color SMT is a fluorescence microscopy-based method for detecting and quantifying specific protein-protein interactions at the single-molecule level, which offers high sensitivity to heterogeneities and rare events [34,35]. Proteins may co-localize during protein-protein interactions. Ideally, the proteins shall be labeled with dyes that have minimal spectral overlapping to prevent the bleed-through effect. However, if dyes have certain amount of spectral overlapping the bleed-through can be corrected. One possibility is physical correction between two fluorophores with similar emission patterns but different decay times [36] and exemplified in the section 3. Some Challenges in Single-Molecule Tracking. Another approach is typically based on crosstalk and cross-excitation/cross-emission, which can be calculated and minimized by the experimenter using easily measurable parameters of the absorption/emission scenario for single labels and multiple labels bound to or incorporated into the two-color molecules. Relevant formulas for quantifying the number of molecules under different experimental conditions with significant extinction of the two-color molecules, such as single labels and multiple labels bound to or incorporated into the two-color molecules, as well as high-density labeling of two-color molecules with multiple green labels and one red label, are summarized in [37].
- (iv)
- Tracking Algorithms
Computational methods are employed to extract trajectories from noisy data and stochastic movement. Advanced algorithms account for drift correction, localization precision, and trajectory mapping [38]. Single-molecule tracking algorithms identify and link the positions of single particles in different image sequences to reconstruct their motion. This is crucial for analyzing protein/DNA dynamics in live cells. Important steps include, for example, image enhancement (wavelet filtering), localization using 2D Gaussian adjustment, and linking the motion paths.
- (v)
- Machine Learning Integration
Artificial intelligence and machine learning algorithms are increasingly used to analyze SMT datasets [39]. These tools improve the accuracy of high-precision coordinates (point cloud, trajectory mapping) of proteins or other labelled targets in a sample and uncover patterns that were previously undetectable in SMLM [40]. Machine learning plays a pivotal role in distinguishing signal from noise in SMT experiments [41]. Neural networks trained on experimental datasets can identify molecular trajectories, classify movement patterns, and predict cellular interactions. These computational advancements streamline the analysis process and open avenues for mining large-scale SMT data [42].
3. Some Challenges in Single-Molecule Tracking
Currently, most research groups use devices that enable direct tracking for SMT. This approach is described in the literature as superior to other methods and offers a flexible tool, as generally shown in Figure 1. The setup shown schematically in Figure 1 is an active particle tracking system, since a relatively simple wide-field or TIRF microscope is insufficient for many MT/SPT experiments in dilute solutions or living cells.From a biophysical perspective, quantitative single-molecule applications with a time resolution of currently up to 40 ms are possible in a laboratory that is not specialized in photophysics and electronics, as shown in Figure 2, which is generally independent of the device manufacturer.
In the literature, trajectories of single molecules are initially analyzed in a manner like that described in [43], but the particle motion is considered in three dimensions [44] rather than two. The equations consider normal (Brownian) diffusion in three dimensions [45]. For the Brownian motion of the spheres (see Figure 2), a D value of (apparent diffusion coefficient) was estimated, which was certainly overestimated; this example is intended to illustrate a problem in the literature with quantitative measurements, namely when the Brownian molecular motion is superimposed by other physical motions (here superdiffusion). Turbulent flow occurred when the particle solution was injected into the sample-well or when attempting to mix it using pipettes by infusion/withdrawal. The turbulent flow was even visible to eyes in the binocular image.
Since the start and end points of 16 consecutive tracks were close together (see Figure 2), they were usually combined into a single track, as shown in Figure 3. The individual tracks represented independent measurements. The Figure 3 clearly shows the entire path from start to finish as a single path. In the subsequent analysis step, different lengths of random walks for the total single track were generated and average over n = 1000, where n is the number of different lengths in the calculation (see in the literature [46]). We processed the measurement data in the original units (μm). To check the assumption of a Brownian particle the mean quadratic deviation of a track is calculated in the literature [46], which means the average
where is the origin and is the end point of a track [43]. The datasets were subsequently assembled and sorted. This yielded 261 data points, which are depicted in Figure 4.
Figure 4 does not show an MDS-time lag plot; the y-values are defined by the equation (1), and the x-axis represents he number of different lengths in the calculation (see in the literature [46], as explained in the legend to Figure 4 and in the main text to Figure 3; reference is made to the corresponding original work. The graph of Figure 4 demonstrates the various observations, as explained in the legend. In our example illustrating conclusions on the data evaluation of Brownian motion in the current literature (see also Section 4.1. Protein dynamics), we divided the data into groups according to certain features [47]. To be clear, the experimentally obtained data were used and statistical averaging with variation in the “step length” was performed as described in [46], i.e., in a very traditional way. No simulation of the path was performed; instead reference is made exclusively to the measurements provided. The statistical averaging and calculation of the “standard deviation” yielded the diffusion coefficient as the slope in a mathematical least squares method. When converting per unit of time, taking superdiffusion (β = 1.06 in Figure 4) into account, a value of was estimated. It is in the order of magnitude of the D value calculated without correction for turbulent flow but is a better apparent estimate than the distorted value of (a Bayesian optimized parameter selection). For diameter beads (radius ), the calculation using the Stokes-Einstein equation with low Reynolds number yields a diffusion coefficient of approximately in deionized water at room temperature (approximately 300 Kelvin or 27 °C, see also [48]).
The highest temporal resolutions achieved to date in single-molecule fluorescence imaging, which were photon-limited by the photophysics of the fluorophores, are 33 and 100 µs with a single-molecule localization accuracy of 34 and 20 nm, respectively, for Cy3, the optimal fluorophore we identified [49]. Using theoretical frameworks developed for the analysis of single-molecule trajectories in the plasma membrane, this camera was able to detect the fast hop diffusion of membrane molecules in the plasma membrane, which was previously only detectable in the apical plasma membrane with less suitable 40 nm gold probes. The camera enabled simultaneous data acquisition for PALM/dSTORM at a rate of up to 1 kHz and a localization accuracy of 29/19 nm in a 640 × 640 pixel field of view. Key performance metrics of photonic sensors for single-molecule detection are given in [50].
Individual molecules/particles may undergo various motion types, including free diffusion, confinement, subdiffusion and directed motion [51]. Different motion behaviours reflect different microenvironments, activity states, kinetics and interaction partners [52]. There is valuable criticism regarding the application of improvements in spatial resolution in SMT alone, without taking the time domain into account. Based on theoretical work regarding single-molecule tracking and fluorescence fluctuation spectroscopy, the "distance in the time domain" relates to the meaningful time required to observe a single molecule as it moves into, out of, and re-enters a sub-femtoliter detection volume. How far apart do two molecules / two particles have to be in the time domain so that the required degree of separation between the two individual molecules / the two individual particles can be quantified at the molecular scale to distinguish them as separate entities without immobilization or hydrodynamic flow? Since mathematics provides a way to answer questions about the thermodynamic jitter in a clear, rational manner, with evidence to support it, mathematics is the reliable method necessary to get the best information on the movement of a single molecule / a single particle at the molecular scale in dilute liquids and live cells without immobilization or hydrodynamic flow. It is the Theory of Single-Molecule Biophysics & Biochemistry Based On the Stochastic Nature of Diffusion that gives the answers: Can we be sure of measuring just one molecule, i.e., the self-same molecule, during the measurement time/observation /detection time? [1,14] “A theory has only the alternative of being right or wrong; a model has a third possibility, it may be right but irrelevant.” (Manfred Eigen, Nobel Prize winner). The above models for tracking individual particles in dilute solutions of living cells without immobilization or hydrodynamic forces are a simplified representation of a system developed to answer specific questions. The models may be mathematically or logically correct (they work), but if they do not address the essential question or are not applicable to the real problem being studied, their accuracy is irrelevant.
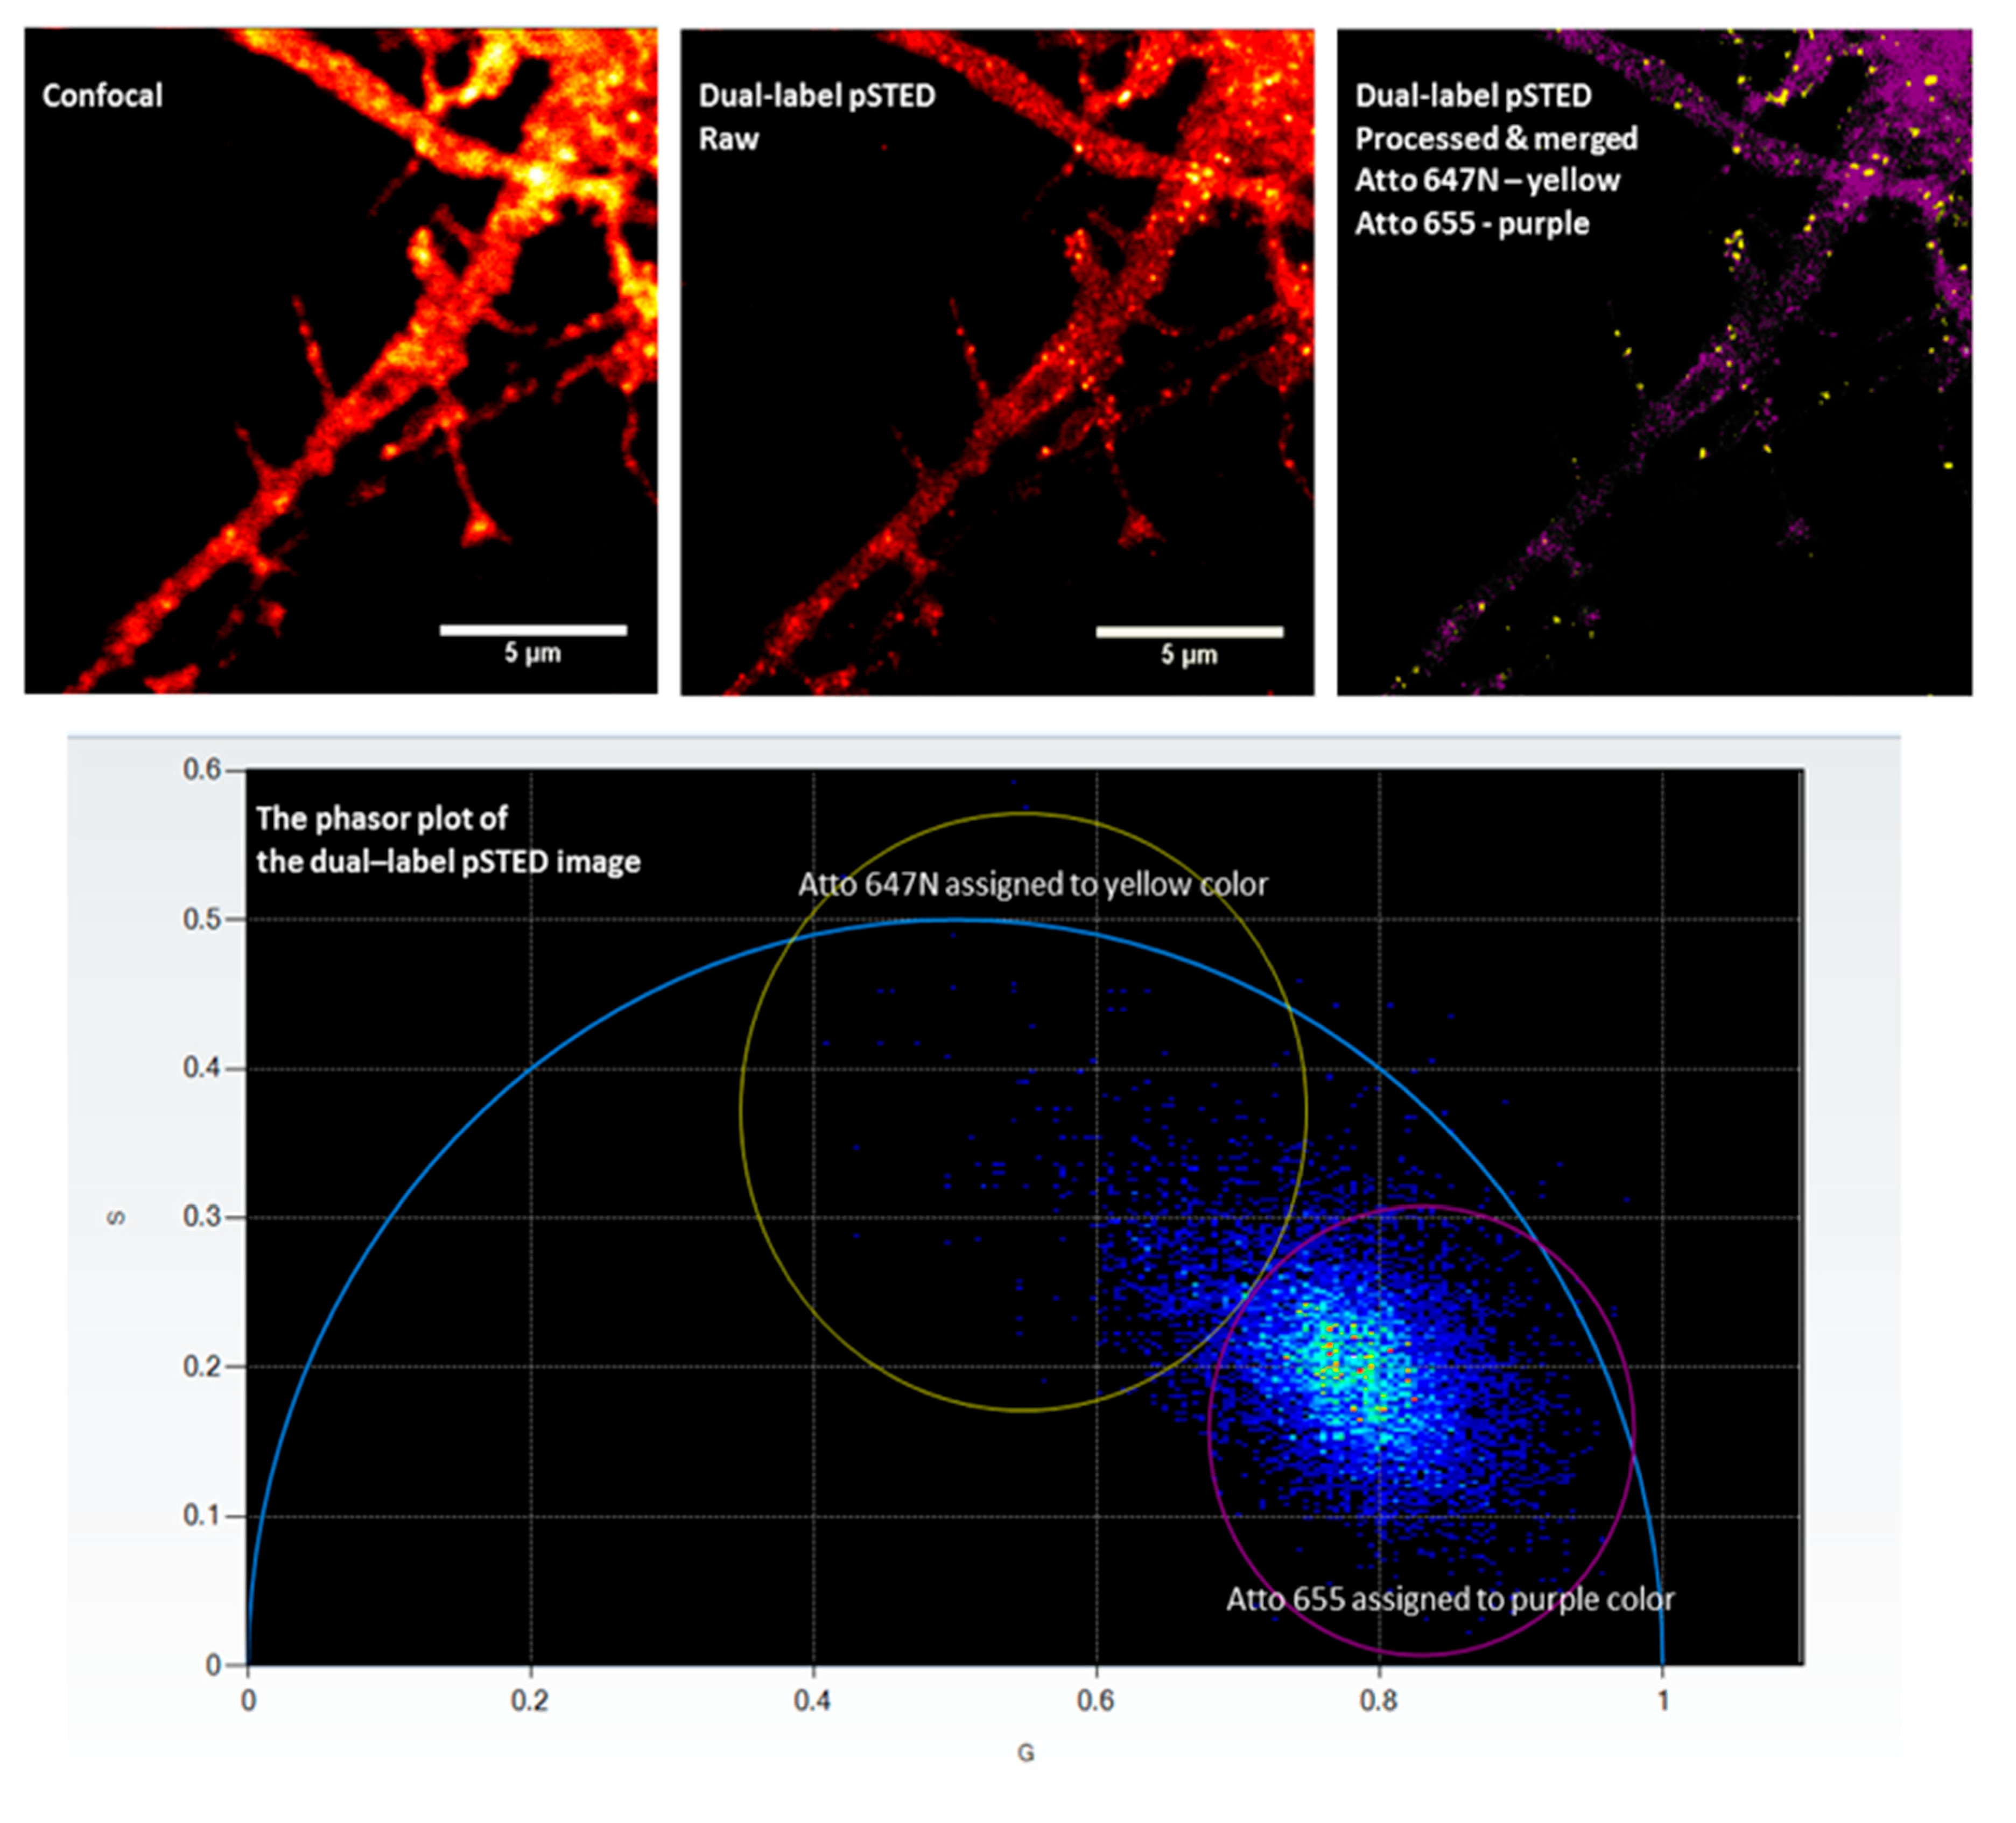
An additional increase on the spatial resolution is provided by STED as illustrated for this review in Figure 5 and the lifetime information acquired through the digital frequency domain lifetime imaging (FastFLIM) and the phasor plot (see [53]). The photons emitted by the fluorophores are separated from the photons of the fluorophores with shorter decay time partially or fully activated by the STED excitation laser. A spatial resolution of 30 nm was measured on standard samples. The combination of the pSTED and the lifetime analysis using phasor diagrams enables dual labeling excitation (see Figure 6). This means that it is possible to distinguish between two fluorophores with similar emission patterns but different decay times [36]. An optimal balance between the spatial and temporal resolution of STED imaging is particularly important for observing molecular dynamics in living cells. Furthermore, the imaging conditions and the choice of fluorescent dye must be optimized to enable the simultaneous tracking of many single molecules over a suitable period of time, since in the current literature some authors consider SMT as a subset/subfield or an example of SMLM techniques [21], although SMLM is currently rarely used for the temporal tracking of molecules.
4. Applications of Single-Molecule Tracking Techniques in Live Cells
4.1. Protein Dynamics
SMT has been pivotal in elucidating protein-protein interactions, conformational changes, and their role in signaling pathways [54]. For example, studies on kinase activation have provided insights into signal transduction mechanisms at nanometer resolution [55]. Another example is the study of the dynamics of epidermal growth factor receptor (EGFR) dynamics, where SMT revealed heterogeneity in receptor activation and their clustering patterns on cell membranes [56]. Such insights are critical for understanding cancer biology and potential therapeutic targets. The detection of moving particles using the likelihood ratio and subsequent subpixel localization in living cells by SMT revealed how biomolecules move in crowded intracellular environments; most tracking software programs assume Brownian motion, an approximation that fails in the case of anomalous diffusion [57].
4.2. Membrane Transport
Tracking single molecules has shed light on vesicular trafficking, endocytosis, and exocytosis (see [58]). SMT has revealed the stochastic nature of vesicle docking and fusion events. Additionally, SMT research on the dynamics of synaptic vesicles has elucidated the mechanisms of neurotransmitter release and recycling, thus contributing to a deeper understanding of neuronal communication (see [60], to mention only the most recent results).
4.3. Drug Discovery
By observing the binding and dissociation of drug molecules to their targets in real-time, SMT contributes to the development of novel therapeutic agents. For example, SMT has been used in recent literature to investigate the binding of smaller molecules to nuclear ribonucleoproteins, thereby improving the pharmacological profile of drug candidates by analyzing an endogenous regulatory network in living cells [54].
4.4. RNA Dynamics
SMT has uncovered the movement and localization of mRNA within the cellular cytoplasm, providing a deeper understanding of translation regulation. Recent studies using SMT have explored how RNA granules move within neuronal cells, shedding light on their role in synaptic plasticity and learning [61]. There is probably still enormous potential slumbering here.
5. Present Demands in Single-Molecule Tracking
5.1. Photobleaching and Phototoxicity
The fluorescence labeling required for SMT can lead to photobleaching of dyes and cellular damage, limiting observation time [62]. Minimizing laser intensity or developing novel fluorophores with reduced photobleaching properties represents an active area of research. Fluorescence-regenerative markers represent a promising solution to this problem, but they impose stricter requirements on signal contrast and labeling kinetics. The systematic development of fluorogenicity and reversible binding has created a template for the development of an innovative, bright, and regenerative array marker that has been used in STED nanoscopy and SMT on living cells [63]. In in-vitro fluorescent imaging assay, an oxygen scavenger system (e.g. PCA/PCD, Trolox) is typically used to suppress the photobleaching. This oxygen scavenger system is also reported for imaging cells [64]. The technique visualizes 3D structures and molecular patterns of different mRNA species in the nucleus and cytoplasm, providing insights into the regulatory mechanisms of gene expression. Trolox acts as a water-soluble, chain-breaking antioxidant that mimics vitamin E (tocopherol) to neutralize reactive oxygen species (ROS) and free radicals and protect cells from oxidative stress. It acts by donating a hydrogen atom from its phenolic hydroxyl group to free radicals, transforming them into more stable, non-reactive forms preventing lipid peroxidation and protecting biological membranes, proteins, and DNA from oxidative damage. However, it can modulate cellular stress responses, such as acting through the Nrf2/HO-1 and NF-κB pathways to reduce inflammation and promote healing can inhibit specific smooth muscle contractions, possibly by impacting calcium influx [65]. So, oxygen scavenger system may hinder some cellular activity.
5.2. Complexity of Cellular Systems
The dense and heterogeneous environment of live cells poses challenges for molecule identification and trajectory reconstruction [25,66]. Strategies such as multi-color imaging [67] and deconvolution algorithms [68] have emerged to address these complexities, providing a clearer representation of molecular interactions in crowded cellular environments (see [69,70]). Computational modeling was used for kinetic Monte Carlo simulations after image processing and data anlaysis in the SMT application of interferometric scattering microscopy [71].
5.3. Data Analysis Bottlenecks
FCS and FCCS are highly sensitive optical techniques for measuring the dynamics and interactions of single particles or single molecules in solution or living cells. Although they are “single-molecule sensitive,” they typically differ from traditional single-particle tracking in that they analyze statistical fluctuations rather than directly mapping a particle’s trajectory in space and time. However, Tracking- FCS or Tracking-FCCS involve moving the laser focus to follow a single particle while simultaneously performing FCS to resolve fast internal fluctuations. They are also called “hybride-techniques”. The acquisition of information from fluctuations due to the passage of single molecules in the observation volume (single-point FCS) up to the detection of molecules at different locations has been further developed [72]. Fluorescence from single molecules can be distinguished from the small background associated with a femtoliter of solvent [73]. At a solution concentration of approximately 1 nM and less at room temperature, the probability that an analyte molecule is in the probe volume is less than one [74,75]. However, we have pointed out that fluorescence correlation spectroscopy (FCS) or two-color (dual color) fluorescence cross-correlation spectroscopy (FCCS), with today’s temporal resolution and sensitivity, is only suitable for measuring individual molecules/particles, i.e., for measuring the same molecule/particle, with measurement times of only a few milliseconds [10,76]. Although the fluorescence of individual molecules can be detected, in the case of fluorescence fluctuations spectrometry, the autocorrelation and two-color (dual color) cross-correlation functions are recorded and analyzed [77]. FCS/two-color (dual collor) FCCS provide averaged data, and the conclusions apply only to systems with multiple molecules (many molecules). Properties of a single molecules (an individual molecule) are not obtained [1]. We have called for increased sensitivity in the time domain of measurements [14].
Processing large amounts of SMT data requires sophisticated algorithms and computational power, which can be resource intensive. Cloud-based solutions and parallel computing frameworks are being integrated into SMT workflows to handle high-throughput data analysis efficiently [7].
5.4. Plasmonic Platforms
DNA-based plasmonic nanostructures have established themselves as powerful tools for the optical signal detection of single molecules due to their unique self-organization properties and their excellent optical performance (see [79]). Plasmonic effects during electrochemical reactions were recently studied by single-molecule electrochemiluminescence microscopy [80]. A time-resolved deep-UV confocal microscope for autofluorescence correlation spectroscopy (UV-FCS) was developed [81]. Aluminium zero-mode waveguides, UV horn antennas, and resonant rhodium dimer nanoslit antennas were used to enhance protein autofluorescence by integrating these nanophotonic techniques with antioxidants and background reduction [82]. A multiplex biosensor that enables continuous monitoring using plasmon-enhanced single-molecule fluorescence was investigated at the single-molecule level [83]. While many highly sensitive plasmonic studies are performed in vitro or on fixed cells, there is a growing body of research focusing on imaging living cells using plasmonics and mitigating the associated heating effects [84].
6. Future Directions
6.1. Multi-Color SMT
New strategies allow for simultaneous tracking of multiple types of molecules, enabling the study of complex interactions in space and time [85]. This advancement will enable researchers to observe molecular networks and signaling cascades in real-time, providing holistic insights into cellular functionality. SMT in three (and potentially more) colors using spectrally similar fluorophores and single laser excitation reliably extracted trajectories of each species with minimal crosstalk [86].
6.2. Non-Labeling Methods
Emerging label-free imaging techniques, such as scattering-based methods, may reduce phototoxicity and offer new avenues for SMT (see [87]). Techniques such as Raman scattering and holographic imaging present promising paths forward, eliminating the need for external labels while preserving molecular integrity. Interferometric imaging on a microfiber surface to provide near-field illumination broadens the applications of label-free methods [88].
6.3. Integration with Systems Biology
SMT combined with omics data can provide a holistic view of cellular functions, bridging the gap between molecular and systems-level understanding (see [89]). The integrative approach will drive discoveries in synthetic biology, tissue engineering, and personalized medicine [90]. Here too, the integration of systems biology is only just beginning at the “single-molecule level” versus the level of ”many molecules ”.
7. Conclusions
The manuscript reviews the technical background and challenges of single-molecule applications for live cells. The manuscript is concise but covers all the important aspects related to this topic. What are the most important findings from the current literature summarized in this article, and what conclusions can be drawn from these findings?
SMT has emerged as a cornerstone technology in life sciences, offering unprecedented insights into live-cell dynamics. By overcoming technical challenges and integrating cutting-edge innovations, SMT continues to expand our scientific horizons. The implications of this technology extend from fundamental biology to clinical applications, promising breakthroughs in the quest to decode the complexities of life. Here, we show a way through the maze that surrounds individual molecules/particles interpretations in living cells. We attempt to flesh out the controversy so that the uninitiated reader can understand it without having to go and read all the references. We reiterate our call to end the inflationary use of the terms “at the single-molecule level” or “single-molecule studies” by referring to the theory based on the stochastic nature of diffusion (thermodynamic jitter).
Supplementary Materials
The following supporting information can be downloaded at: https://www.youtube.com/watch?v=MkdPAGxfI14, Video S1: Fixed HeLa cell, Mitochondria labeled with Atto 647N.
Author Contributions
Conceptualization, Z.F.-P.; methodology, Z.F.-P, G.B., B.B., S.-C.L.; writing—original draft preparation, Z.F.-P.; writing—review and editing, Z.F.-P., G.B., S.-C.L., B.B; supervision, Z.F.-P., G.B., S.-C.L., B.B. All authors have read and agreed to the submitted version of the manuscript.
Funding
This research received no external funding.
Institutional Review Board Statement
Not applicable.
Informed Consent Statement
Not applicable.
Data Availability Statement
No new data are presented in the review article. The Figures are from the ISS laboratory and illustrate our known conclusions or theorems.
Conflicts of Interest
The authors declares no conflict of interest. Authors Dr. Liao (Research Scientist) and Dr. Barbieri (CEO) were employed by the company ISS Inc., Fluorescence & Biomedical Instrumentation, 1602 Newton Drive, Champaign, IL 61822, U.S.A.. The remaining authors declare that the research was conducted in the absence of any commercial or financial relationships that could be construed as a potential conflict of interest.
Abbreviations
The following abbreviations are used in this article:
| SMT | Single-Molecule Tracking |
| SPT | Single-Particle Tracking |
| SMLM | Single-Molecule Localization Microscopy |
| STORM | Stochastic Optical Reconstruction Microscopy |
| PALM | Photo-Activated Localization Microscopy |
| MinFlux | Minimal photon Flux |
| FRET | Förster Resonance Energy Transfer |
| TIRF | Total Internal Reflection Fluorescence microscopy |
| FLIM | Fluorescence Lifetime Microscopy |
| FCS | Fluorescence Correlation Spectroscopy |
| FCCS | Fluorescence Cross-Correlation Spectroscopy |
| SPSM-FCS | Single-Phase Single-Molecule Fluorescence Correlation Spectroscopy (autocorrelation and two-color (dual color) cross-correlation) |
| UV | Ultraviolet |
| IR | Infrared |
| NIR | Near-Infrared |
| KHz | Kilohertz, a unit of frequency, representing 1,000 cycles or oscillations per second |
| MSD | Mean Squared Displacement |
| D | Diffusion coefficient |
| 3D | Three dimensional |
| 2D | Two dimensional |
| EGFR | Epidermal Growth Factor Receptor |
| mCherry | Member of the mFruits family of monomeric red fluorescent proteins |
| eGFP | Enhanced Green Fluorescent Protein |
| DNA | Deoxyribonucleic Acid |
| RNA | Ribonucleic Acid |
| mRNA | Messenger Ribonucleic Acid |
References
- Földes-Papp, Z.; Baumann, G.; Kinjo, M.; Tamura, M. Single-Phase Single-Molecule Fluorescence Correlation Spectroscopy (SPSM-FCS). Distinguished article entry. In Encyclopedia of Medical Genomics & Proteomics; Fuchs, J., Podda, M., Eds.; Taylor & Francis: New York, USA, 2005; pp. 1–7. [Google Scholar]
- Moerner, W. E. Nobel Lecture: Single-molecule spectroscopy, imaging, and photocontrol. Reviews of Modern Physics 2015, 87, 1183–1212. [Google Scholar] [CrossRef]
- Betzig, E.; Patterson, G. H.; Sougrat, R.; Lindwasser, O. W.; Olenych, S.; Bonifacino, J. S.; Davidson, M. W.; Lippincott-Schwartz, J.; Hess, H. F. Imaging intracellular fluorescent proteins at nanometer resolution. Science 2006, 313, 1642–1645. [Google Scholar] [CrossRef]
- Moerner, W.E.; Kador, L. Optical detection and spectroscopy of single molecules in a solid. Physical Reviews Letters 1989, 62, 2535–2538. [Google Scholar] [CrossRef] [PubMed]
- Dickson, R. M.; Cubitt, A. B.; Tsien, R. Y.; Moerner, W. E. On/Off blinking and switching behavior of single molecules of green fluorescent protein. Nature 1997, 388, 355–358. [Google Scholar] [CrossRef] [PubMed]
- Betzig, E. Proposed Method for molecular optical imaging. Optics Letters 1995, 20, 237–239. [Google Scholar] [CrossRef]
- Hell, S. W.; Wichmann, J. Breaking the diffraction resolution limit by stimulated emission: stimulated-emission-depletion fluorescence microscopy. Optic Letters 1994, 19, 780–782. [Google Scholar] [CrossRef] [PubMed]
- Klar, T. A.; Jakobs, S.; Dyba, M.; Egner, A.; Hell, S. Fluorescence microscopy with diffraction resolution barrier broken by stimulated emission. Proceedings of the National Academy of Sciences 2000, 97, 8206–8210. [Google Scholar] [CrossRef]
- Földes-Papp, Z. Individual macromolecule motion in a crowded living cell. Current Pharmaceutical Biotechnology 2015, 16, 1–2. [Google Scholar] [CrossRef]
- Földes-Papp, Z. Fluorescence Fluctuation Spectroscopic Approaches to the Study of a Single Molecule Diffusing in Solution and a Live Cell without Systemic Drift or Convection: A Theoretical Study. Current Pharmaceutical Biotechnology 2007, 8, 261–273. [Google Scholar] [CrossRef]
- Földes-Papp, Z. Single-molecule time resolution in dilute liquids and live cells at the molecular scale: Constraints on the measurement time. American Journal of Translational Medicine 2021, 5, 154–165. [Google Scholar]
- Földes-Papp, Z. The thermodynamic signature of a single molecule or a single particle in dilute liquids and live cells: Single-Molecule Biophysics & Biochemistry based on the stochastic nature of diffusion. American Journal of Translational Medicine 2023, 7, 74–77. [Google Scholar]
- Földes-Papp, Z. Measurements of Single Molecules in Solution and Live Cells Over Longer Observation Times Than Those Currently Possible: The Meaningful Time. Current Pharmaceutical Biotechnology 2013, 14, 441–444. [Google Scholar] [CrossRef]
- Baumann, G.; Földes-Papp, Z. Single-Molecule Tracking in Live Cell without Immobilization or without Hydrodynamic Flow by Simulations: Thermodynamic Jitter. Biophysica 2024, 3, 442–452. [Google Scholar] [CrossRef]
- Baumann, G.; Földes-Papp, Z. Study on Single-Molecule Biophysics and Biochemistry in dilute liquids and live cells without immobilization or significant hydrodynamic flow: The thermodynamic Single-Molecule DEMON. Current Pharmaceutical Biotechnology 2022, 23, 1750–1757. [Google Scholar] [PubMed]
- Tang, W.; Fuentenebro Navas, D.; Vermeer, B.; Schmid, S. Disentangling a Complex Biomolecular World with Singel-Molecule Resolution. Chimia 2025, 79, 770–779. [Google Scholar] [CrossRef] [PubMed]
- Kim, H.; Ha, T. Single-molecule nanometry for biological physics. Reports on Progress in Physics 2013, 76, 016601. [Google Scholar] [CrossRef] [PubMed]
- F. Balzarotti, F.; Eilers, Y.; Gwosch, K. C.; Gynna, A. H.; Westphal, V.; Stefani, F. D.; Elf, J.; Hell, S. W. Nanometer resolution imaging and tracking of fluorescent molecules with minimal photon fluxes. Science 2017, 355, 606–612. [Google Scholar] [CrossRef]
- Gwosch, G. K.; Pape, J. K.; Balzarotti, F.; Hoess, P.; Ellenberg, J.; Ries, J.; Hell, S. W. Minflux nanoscopy delivers 3d multicolor nanometer resolution in cells. Nature Methods 2020, 17, 217–224. [Google Scholar] [CrossRef]
- Schultze, S.; Grubmüller, H. Bayesian MINIFLUX localization microscopy. Cornell University 2025, arXiv:2510.25654, 1–5. [Google Scholar]
- Driouchi, A.; Bretan, M.; Davis, B. J.; Heckert, A.; Seeger, M.; Silva, M. B.; Forrest, W.S.R.; Hsiung, J.; Tan, J.; Yang, H.; McSwiggen, D.T.; Song, L.; Sule, A.; Abaie, B.; Chen, H.; Chhun, B.; Conroy, B.; Elliott, L. A.; Gonzalez, E.; Ilkov, F.; Isaacs, J.; Labaria, G.; Lagana, M.; Larsen, D. D.; Margolin, B.; Nguyen, M. K.; Park, E.; Rine, J.; Tang, Y.; Vana, M.; Wilkey, A.; Zhang, Z.; Basham, S.; Ho, J..J; Johnson, S.; Klammer, A. A.; Lin, K.; Darzacq, X.; Betzig, E.; Berman, R.T.; Anderson, D.J. Oblique line scan illumination enables expansive, accurate and sensitive single-protein measurements in solution and in living cells. Nature Methods 2025, 22, 559–568. [Google Scholar] [CrossRef]
- Meroz, Y.; Sokolov, I.M.; Klafter, J. Subdiffusion of mixed origins: When ergodicity and nonergodicity coexist. Physical Review E 2010, 81, 0101001. [Google Scholar] [CrossRef]
- Földes-Papp, Z.; Baumann, G.; Li, L.-C. Visualization of subdiffusive sites in a live single cell. Journal of Biological Methods 2021, 8, e142. [Google Scholar] [CrossRef] [PubMed]
- Földes-Papp, Z.; Baumann, G. Fluorescence molecule counting for single-molecule studies in crowded environment of living cells without and with broken ergodicity. Current Pharmaceutical Biotechnology 2011, 12, 824–833. [Google Scholar] [CrossRef] [PubMed]
- Baumann, G.; Place, R. F.; Földes-Papp, Z. Meaningful interpretation of subdiffusive measurements in living cells (crowded environment) by fluorescence fluctuation microscopy. Current Pharmaceutical Biotechnology 2010, 11, 527–543. [Google Scholar] [CrossRef]
- Catapano, C.; Dietz, M. S.; Kompa, J.; Jang, S.; Freund, P.; Johnsson, K.; Heilemann, M. Long-Term Single-Molecule Tracking in Living Cells using Weak-Affinity Protein Labeling. Angewandte Chemie International Edition 2025, 64, e202413117. [Google Scholar] [CrossRef]
- König, A. I.; Sorkin, R.; Alon, A.; Nachmias, D.; Dhara, K.; Brand, G.; Yifrach, O.; Arbely, E.; Roichman, Y.; Elia, N. Live cell single molecule tracking and localization microscopy of bioorthogonally labeled plasma membrane proteins. Nanoscale 2020, 12, 3236–3248. [Google Scholar] [CrossRef]
- Sakuragi, S.; Kato, N.; Uchida, T.; Katagiri, T.; Enomoto, M.; Kato, R.; Yoshimura, H.; Oyama, C.; Katayama, I.; Chikuma, A.; Teramura, Y.; Bannai, H. Oligo DNA-based quantum dot (QD) single-particle tracking for multicolor single-molecule imaging. bioRxv 2025, preprint. [Google Scholar] [CrossRef]
- Ilievski, F.; Wikström, L.; Borg, A.; Volkov, I. L.; Brandis, G.; Johansson, M. Optimization of the genetic code expansion technology for intracellular labelling and single-molecule tracking of proteins in genomically re-coded E. coli. RSC Chemical Biology 2026. [Google Scholar] [CrossRef]
- Bjerneld, E. J.; Földes-Papp, Z.; Käll, M.; Rigler, R. Single-molecule surface-enhanced Raman and fluorescence correlation spectroscopy of horseradish peroxidase. Journal of Physical Chemistry B 2002, 106, 1213–1218. [Google Scholar] [CrossRef]
- Földes-Papp, Z.; Liao, S.-C.; Barbieri, B.; Gryczynski, K.; Luchowski, R.; Gryczynski, Z.; Gryczynski, I.; Borejdo, J.; You, T. Single actomyosin motor interactions in skeletal muscle. Biochimica et Biophysica Acta 2011, 1813, 856–866. [Google Scholar] [CrossRef]
- Steves, M. A.; Xu, K. Direct microsecond wide-field single-molecule tracking and super-resolution mappimg via CCD vertical shift. Nature Communications 2025, 16, 10503. [Google Scholar] [CrossRef] [PubMed]
- Cabillic, M.; Forriere, H.; Bettarel, L.; Butler, C.; Neuhaus, A.; Idrissi, I.; Sambrano-Lopez, M. E.; Rossbroich, J.; Müller, L.-R.; Ries, J.; Grenci, G.; Viasnoff, V.; Levet, F.; Sibarita, J.-B.; Galland, R. In-depth single molecule localization microscopy using adaptive optics and single objective light-sheet microscopy. Nature Communications 2025, 16, 8362. [Google Scholar] [CrossRef]
- Ruprecht, V.; Brameshuber, M.; Schütz, G. J. Two-color single molecule tracking combined with photobleaching for the detection of rare molecular interactions in fluid biomembranes. Soft Matter 2010, 6, 568–581. [Google Scholar] [CrossRef]
- Hänselmann, S.; Herten, D. P. Two-Color Single-Molecule Tracking in Live Cells. Methods Molecular Biology 2017, 1663, 127–138. [Google Scholar]
- Sun, Y.; Tortarolo, G.; Teng, K.-W.; Ishitsuka, Y.; Coskun, U. C.; Liao, S.-C. J.; Diaspro, A.; Vicidomini, G.; Selvin, P.R.; Barbieri, B. A novel pulsed STED microscopy method using FastFLIM and the phasor plots. Proceedings SPIE 10069, Proceedings volume: Multiphoton Microscopy in the Biomedical Sciences XVII, San Francisco, California, United States of America, 21 February 2017; p. 100691C. [Google Scholar] [CrossRef]
- Földes-Papp, Z. How the Molecule Number Is Correctly Quantified in Two-Color Fluorescence Cross-Correlation Spectroscopy: Corrections for Cross-Talk and Quenching in Experiments. Current Pharmaceutical Biotechnology 2005, 6, 437–444. [Google Scholar] [CrossRef]
- Saavedra, L. A.; Barrantes, F. J. Temporal convolutional networks work as general feature extractions for single-particle diffusion analysis. Journal of Physics: Photonics 2025, 7, 025017. [Google Scholar]
- Umney, O.; Slaney, H.; Williams, C. J. M.; Quirke, P.; Peckham, M.; Curd, A. P. ClusterNet: Classifying Single-Molecule localization Microscopy Datasets with Graph-Based Deep Learning of Supracluster Structure. Small Science 2025, e202500255. [Google Scholar] [CrossRef]
- Pineda, J.; Masó-Orriols, S.; Masoliver, M.; Bertran, J.; Golsör, M.; Volpe, G.; Manzo, C. Enhanced spatial clustering of single-molecule localizations with graph neural networks. Nature Communications 2025, 16, 9693. [Google Scholar] [CrossRef] [PubMed]
- Saguy, A.; Xiao, D.; Narayanasamy, K. K.; Nakatani, Y.; Saliba, N.; Gagliano, G.; Gustavsson, A.-K.; Heilemann, M.; Shechtman, Y. One-click reconstruction in single-molecule localization microscopy via experimental parameter-aware deep learning. npj Imaging 2025, 3, 61. [Google Scholar] [CrossRef] [PubMed]
- Khater, I. M.; Nabi, I. R.; Hamarneh, G. HDCluster: High-Degree Graph Clustering for Robust Analysis of Single Molecule Localization Microscopy. bioRxiv [Preprint] 2025 (Oct 24), 2025.10.23.684134.
- Saxton, M. J.; Jacobson, K. Single-particle tracking: applications to membrane dynamics. Annual Review of Biophysics and Biomolecular Structure 1997, 26, 373–399. [Google Scholar] [CrossRef]
- Jeon, J.-H.; Leijnse, N; Odderschede, L. B.; Metzler, R. Anomalous diffusion and power-law relaxation of the time averaged mean squared displacement in worm-like micellar solution. New Journal of Physics 2013, 15, 045011. [Google Scholar] [CrossRef]
- Ghosal, A.; Wang, Y.-H.; Nguyen, N.; Troyer, L.; Kim, S. Practical considerations for accurate estimation of diffusion parameters from single-particle tracking in living cells. The Journal of Physical Chemistry 2025, 163, 134202. [Google Scholar] [CrossRef]
- Baumann, G.; Gryczynski, I.; Földes-Papp, Z. Anomalous behavior in length distributions of 3D random Brownian walks (three dimensional random Brownian walks) and measured photon count rates within observation volumes of single-molecule trajectories in fluorescence fluctuation microscopy. Optics Express 2010, 18, 17883–17896. [Google Scholar] [CrossRef] [PubMed]
- Lanza, A.; Martinez-Martin, I.; Tapia-Rojo, R.; Bo, S. Measuring irreversibility in stochastic systems by categorizing single-molecules displacements. Cornell University 2025, arXiv:2511.09183v1, 1–12. [Google Scholar]
- Khrapak, S.; Khrapak, A. Stokes–Einstein Relation in Different Models of Water. Molecules 2024, 29, 5587. [Google Scholar] [CrossRef]
- Fujiwara, T.K.; Takeuchi, S.; Kalay, Z.; Nagai, Y.; Tsunoyama, T.A.; Kalkbrenner, T.; Iwasawa, K.; Ritchie, K.P.; Suzuki, K.G.N.; Kusumi, A. Development of ultrafast camera-based single fluorescent-molecule imaging for cell biology. Journal of Cell Biology 2023, 222, e202110160. [Google Scholar] [CrossRef]
- Butt, M.A.; Akca, B. I.; Mateos, M. Next-generation photonic sensors for single-molecule detection: Challenges overcome and horizons ahead. Chip 2025, 100174. [Google Scholar] [CrossRef]
- Simon, F.; Weiss, L.E.; van Teeffelen, S. A guide to single-particle tracking. Nature Review Methods Primers 2024, 4, 66. [Google Scholar] [CrossRef]
- Nguyen, T.D.; Chen, Y.-I.; Chen, L. H.; Hsin-Chih; Yeh, H.-C. Recent Advances in Single-Molecule Tracking and Imaging Techniques. Annual Review of Analytical Chemistry 2023, 16, 253–284. [Google Scholar] [CrossRef]
- Földes-Papp, Z.; Liao, S.-C. J.; You, T.; Barbieri, B. Reducing Background Contributions in Fluorescence Fluctuation Time-Traces for Single-Molecule Measurements in Solution. Current Pharmaceutical Biotechnology 2009, 10, 532–542. [Google Scholar] [CrossRef]
- McSwiggen, D. T.; Liu, H.; Tan, R.; Puig, S. A.; Akella, L. B.; Berman, R.; Bretan, M.; Chen, H.; Darzacq, X.; Ford, K.; Godbey, R.; Gonzalez, E.; Hanuka, A.; Heckert, A.; Ho, J. J.; Johnson, S. L.; Kelso, R.; Klammer, A.; Krishnamurthy, R.; Li, J.; Lin, K.; Margolin, B.; McNamara, P.; Meyer, L.; Pierce, S. E.; Sule, A.; Stashko, C.; Tang, Y.; Anderson, D. J.; Beck, H. P. A high-throughput platform for single-molecule tracking identifies drug interaction and cellular mechanisms. eLife 2023, 12, RP93183. [Google Scholar] [CrossRef]
- Liu, J.; Zhang, X.; Zhao, B.; Ling, H.; Li, Y.; Sun, K.; Chen, S.; Zhang, Y.; Zhai, T.; Zhang, Y.; Li, F.; Liu, Q. In Situ Monitoring of Membrane Protein Dynamics Using High-Throughput Red-Light-Activated Single-Molecule Tracking. ACS Nano 2025, 19, 13466–13478. [Google Scholar] [CrossRef] [PubMed]
- Watanabe, D.; Hiroshima, M.; Yasui, M.; Ueda, M. Single molecule tracking based drug screening. Nature Communication 2024, 15, 8975. [Google Scholar] [CrossRef] [PubMed]
- Park, J.; Sokolovska, N.; Cabriel, C.; Kobayashi, A.; Corsin, E.; Garcia-Fernandez, F.; Izeddin, I.; Miné-Hattab, J. Novel estimation of memory in molecular dynamics with extended and comprehensive single-molecule tracking software: FreeTrace. bioRxiv 2026. preprint. [Google Scholar] [CrossRef]
- Zalejski, J.; Sun, J.; Sharma, A. Unravelling the Mystery inside Cells by Using Single-Molecule Fluorescence Imaging. Journal of Imaging 2023, 9, 192. [Google Scholar] [CrossRef]
- Park, C.; Jung, S.; Park, H. Single vesicle tracking for studying synaptic vesicle dynamics in small central synapses. Current Opinion in Neurobiology 2022, 76, 102596. [Google Scholar] [CrossRef]
- Graham, T. G. W.; Dugast-Darzacq, C.; Dailey, G. M.; Weng, B.; Anantakrishnan, S.; Darzacq, X.; Tjian, R. Single-molecule live imaging of subunit interactions and exchange within cellular regulatory complexes. Molecular Cell 2025, 85, 2854–2868. [Google Scholar] [CrossRef]
- Bühler, B.; Sunbul, M. Single-Molecule RNA Imaging in Live Cells with an Avidity-Based Fluorescent Light-Up Aptamer biRhoBAST. Methods in Molecular Biology 2024, 2822, 87–100. [Google Scholar]
- Hou, S.; Exell, J.; Welsher, K. Real-time 3D single molecule tracking. Nature Communication 2020, 11, 3607. [Google Scholar] [CrossRef] [PubMed]
- Si, D.; Dong, Z.; Xing, G.; Yao, L.; Lu, J.; Ma, M.; Yuan, Y.; Zhao, H.; Dong, B.; Li, C.; Yuan, L.; Chen, Z.; Wang, L. A bright and regenerative array tag with fluorogenic ligands for long-term live-cell nanoscopy and single-molecule tracking. Nature Communications 2026, 17, 576. [Google Scholar] [CrossRef]
- Passera, A.; Welzl, P.; Gomez-Segalas, A.; Plaschka, C.; Balzarotti, F. Super-resolved imaging of mNA ultrastucture in cells. bioRxiv (Preprint). 2026. [Google Scholar] [CrossRef]
- Ma, T.-L.; Chen, J.-X.; Zhu, P.; Zhang, C.-B.; Zhou, Y.; Duan, J.-X. Focus on ferroptosis regulation: Exploring novel mechanisms and applications of ferroptosis regulator. Life Sciences 2022, 307, 120868. [Google Scholar] [CrossRef] [PubMed]
- Place, R. F; Noonan, E. J.; Földes-Papp, Z.; Li, L.-C. Defining Features and Exploring Chemical Modifications to Manipulate RNAa Activity. Current Pharmaceutical Biotechnology 2010, 11, 518–526. [Google Scholar] [CrossRef] [PubMed]
- Butler, C.; Saraceno, G.E.; Kechkar, A.; Bénac, N.; Studer, V.; Dupuis, J.P.; Groc, L.; Galland, R.; Sibarita, J.-B. Multi-Dimensional Spectral Single Molecule Localization Microscopy. Frontiers in Bioinformatics 2022, 2, 813494. [Google Scholar] [CrossRef] [PubMed]
- Rabiee, N.; Lan, X. Advancing Multicolor Super-Resolution Volume Imaging: Illuminating Complex Cellular Dynamics. Journal of the American Chemical Society Au 2025, 5, 2388–2419. [Google Scholar] [CrossRef]
- Gebhardt, C. M. Single-molecule Tracking and Kinetic Analysis in Living Cells and Multicellular Organisms. Journal of Molecular Biology 2026, 438, 169308. [Google Scholar] [CrossRef]
- Kim, K.; Jang, J.; Cho, J.; Ahn, Y.; Jeong, S.; Shin, J.; Yea, K.; Lee, W. J.; Seo, D. Reconciling a Kinetic Model for Dimerization of the EGFR Using Single-Molecule Tracking in Living Cells. The Journal of Physical Chemistry B 2025, 129, 9567–957. [Google Scholar] [CrossRef]
- Mondal, S.; Bonventre, E.; Hancock, W.O.; Rice, L.M. Single-molecule microtubule dynamics measurements reveal an intermediate state and clarify the role of nucleotide. Nature Communications 2026, 17, 559. [Google Scholar] [CrossRef]
- Digman, M.A.; Gratton, E. Lessons in fluctuation correlation spectroscopy. Annual Review of Physical Chemistry 2011, 62, 645–668. [Google Scholar] [CrossRef]
- Földes-Papp, Z. What it means to measure a single molecule in a solution by fluorescence fluctuation spectroscopy. Experimental and Molecular Pathology 2006, 80, 209–218. [Google Scholar] [CrossRef]
- Földes-Papp, Z; Rigler, R. Quantitative Two-Color Fluorescence Cross-Correlation Spectroscopy in the Analysis of Polymerase Chain Reaction. Biological Chemistry 2001, 382, 473–478. [Google Scholar] [CrossRef]
- Földes-Papp, Z; Demel, U.; Tilz, G. P. Ultrasensitive detection and identification of fluorescent molecules by FCS: Impact for immunobiology. Proceedings of the National Academy of Sciences of the United States of America 2001, 98, 11509–11514. [Google Scholar] [CrossRef]
- Földes-Papp, Z. True’ single-molecule molecule observations by fluorescence correlation spectroscopy and two-color fluorescence cross-correlation spectroscopy. Experimental and Molecular Pathology 2007, 82, 147–155. [Google Scholar] [CrossRef]
- Földes-Papp, Z. How the molecule number is correctly quantified in two-color fluorescence cross-correlation spectroscopy: corrections for cross-talk and quenching in experiments. Current Pharmaceutical Biotechnology 2005, 6, 437–444. [Google Scholar]
- Muñoz-Gil, G.; Bachimanchi, H.; Pineda, J.; Midtvedt, B.; Fernández-Fernández, G.; Requena, B.; Ahsini, Y.; Asghar, S.; Bae, J.; Barrantes, F. J.; Bender, S. W. B.; Cabriel, C.; Conejero, J. A.; Escoto, M.; Feng, X.; Haidari, R.; Hatzakis, N. S.; Huang, Z.; Izeddin, I.; Jeong, H.; Jiang, Y.; Kæstel-Hansen, J.; Miné-Hattab, J.; Ni, R.; Park, J.; Qu, X.; Saavedra, L. A.; Sha, H.; Sokolovska, N.; Zhang, Y.; Volpe, G.; Lewenstein, M.; Metzler, R.; Krapf, D.; Volpe, G.; Manzo, C. Quantitative evaluation of methods to analyze motion changes in single-particle experiments. Nature Communication 2025, 16, 6749. [Google Scholar] [CrossRef]
- Niu, R.; Shao, J.; Wu, M.; Liu, C.; Chao, J. Single-Molecule Detection of Optical Signals Using DNA-Based Plasmonic Nanostructures. Biosensors 2025, 15, 398. [Google Scholar] [CrossRef]
- Huang, X.; Shi, Q.; Lu, Y.; Li, B.; Ning, Y.; Feng, L.; Sojic, N.; Jiang, D.; Liu, B. Single-Molecule Electrochemiluminescence Imaging of Plasmonic Hot Spot Reactivity. Angewandte Chemie International Edition 2025, 64, e202508266. [Google Scholar] [CrossRef]
- Wenger, J. UV plasmonics to enhance protein autofluorescence detection at the single molecule level. In Proceedings of the SPIE PC1358, Proceedings volume: UV and Higer Energy Photonics: From Materials to Applications 2025, San Diego, California, United States of America, 19 September 2025; p. PC135830A. [Google Scholar] [CrossRef]
- Barulin, A.; Roy, P.; Claude, J.B.; Wenger, J. Ultraviolet optical horn antennas for label-free detection of single proteins. Nature Communications 2022, 13, 1842. [Google Scholar] [CrossRef]
- Nooteboom, S.W.; Lamberti, V.; Schellekens, T.; Zijlstra, P. Multiplexed and continuous single-molecule biosensing by spectral demixing of plasmon-enhanced fluorescence. Biosensors and Bioelectronics 2026, 298, 118384. [Google Scholar] [CrossRef]
- Ansaryan, S.; Liu, Y.C.; Li, X.; Economou, A.M.; Eberhardt, C. S.; Jandus, C.; Altung, H. High-throughput spatiotemporal monitoring of single-cell secretions via plasmonic microwell arrays. Nature Biomedecal Engineering 2023, 7, 943–958. [Google Scholar] [CrossRef]
- Ito, Y.; Sakata-Sogawa, K.; Tokunaga, M. Multi-color single-molecule tracking and subtrajectory analysis for quantification of spatiotemporal dynamics and kinetics upon T cell activation. Scientific Reports 2017, 7, 6994. [Google Scholar] [CrossRef]
- Huang, T.; Phelps, C.; Wang, J.; Lin, L.J; Bittel, A.; Scott, Z.; Jacques, S.; Gibbs, S.L.; Gray, J.W.; Nan, X. Simultaneous Multicolor Single-Molecule Tracking with Single-Laser Excitation via Spectral Imaging. Biophysical Journal 2018, 114, 301–310. [Google Scholar] [CrossRef] [PubMed]
- Fujita, H.; Zhong, C.; Arai, S.; Suzuki, M. Bright Dots and Smart Optical Microscopy to Probe Intracellular Events in Single Cells. Frontiers in Bioengineering and Biotechnology 2019, 6, 204. [Google Scholar] [CrossRef] [PubMed]
- Li, G.; Gong, C. High-Contrast Interferometric Imaging of Single-Molecule Dynamics on Optical Fibers. Cornell University 2025, arXiv:2510.10061v1, 1–19. [Google Scholar]
- Dahal, L.; Walther, N.; Tjian, R.; Darzacq, X.; Graham, T. G. W. Single-molecule tracking (SMT): a window into live-cell transcription biochemistry. Biochemical Society Transactions 2023, 51, 557–569. [Google Scholar] [CrossRef] [PubMed]
- Kamarulzaman, L.; Kim, S.; Hidaka, T.; Tsuchida, M.; Taniguchi, Y. Comprehensive molecular profiling of single-cell proteome via gel electrophoresis and 3D single-molecule imaging. bioRxiv preprint. 2026, 1–30. [Google Scholar] [CrossRef]
Figure 1.
The particle tracking used the Scanning Mirrors to circulate the laser beam around the particle, with a value for the z-position up and down to find the new locations to track (see legend of Figure 2). UV: Ultraviolet, VIS: Visible. NIR: Near-Infrared, M1: Mirror 1, D1: Dichroic 1, D2: Dichroic 2, H: Halfwave Plate, P: Polarizer, SC: Scanning Lens, M2: Mirror 2, MDW: Multi-Dichroic Wheel, FL: Focal Lens, VP: Variable Pinhole, S: Shutter, PMT: Photomultiplier-Tube. This figure is from the ISS laboratory and illustrates our known conclusions or theorems; the main text refers to the corresponding original work.
Figure 1.
The particle tracking used the Scanning Mirrors to circulate the laser beam around the particle, with a value for the z-position up and down to find the new locations to track (see legend of Figure 2). UV: Ultraviolet, VIS: Visible. NIR: Near-Infrared, M1: Mirror 1, D1: Dichroic 1, D2: Dichroic 2, H: Halfwave Plate, P: Polarizer, SC: Scanning Lens, M2: Mirror 2, MDW: Multi-Dichroic Wheel, FL: Focal Lens, VP: Variable Pinhole, S: Shutter, PMT: Photomultiplier-Tube. This figure is from the ISS laboratory and illustrates our known conclusions or theorems; the main text refers to the corresponding original work.
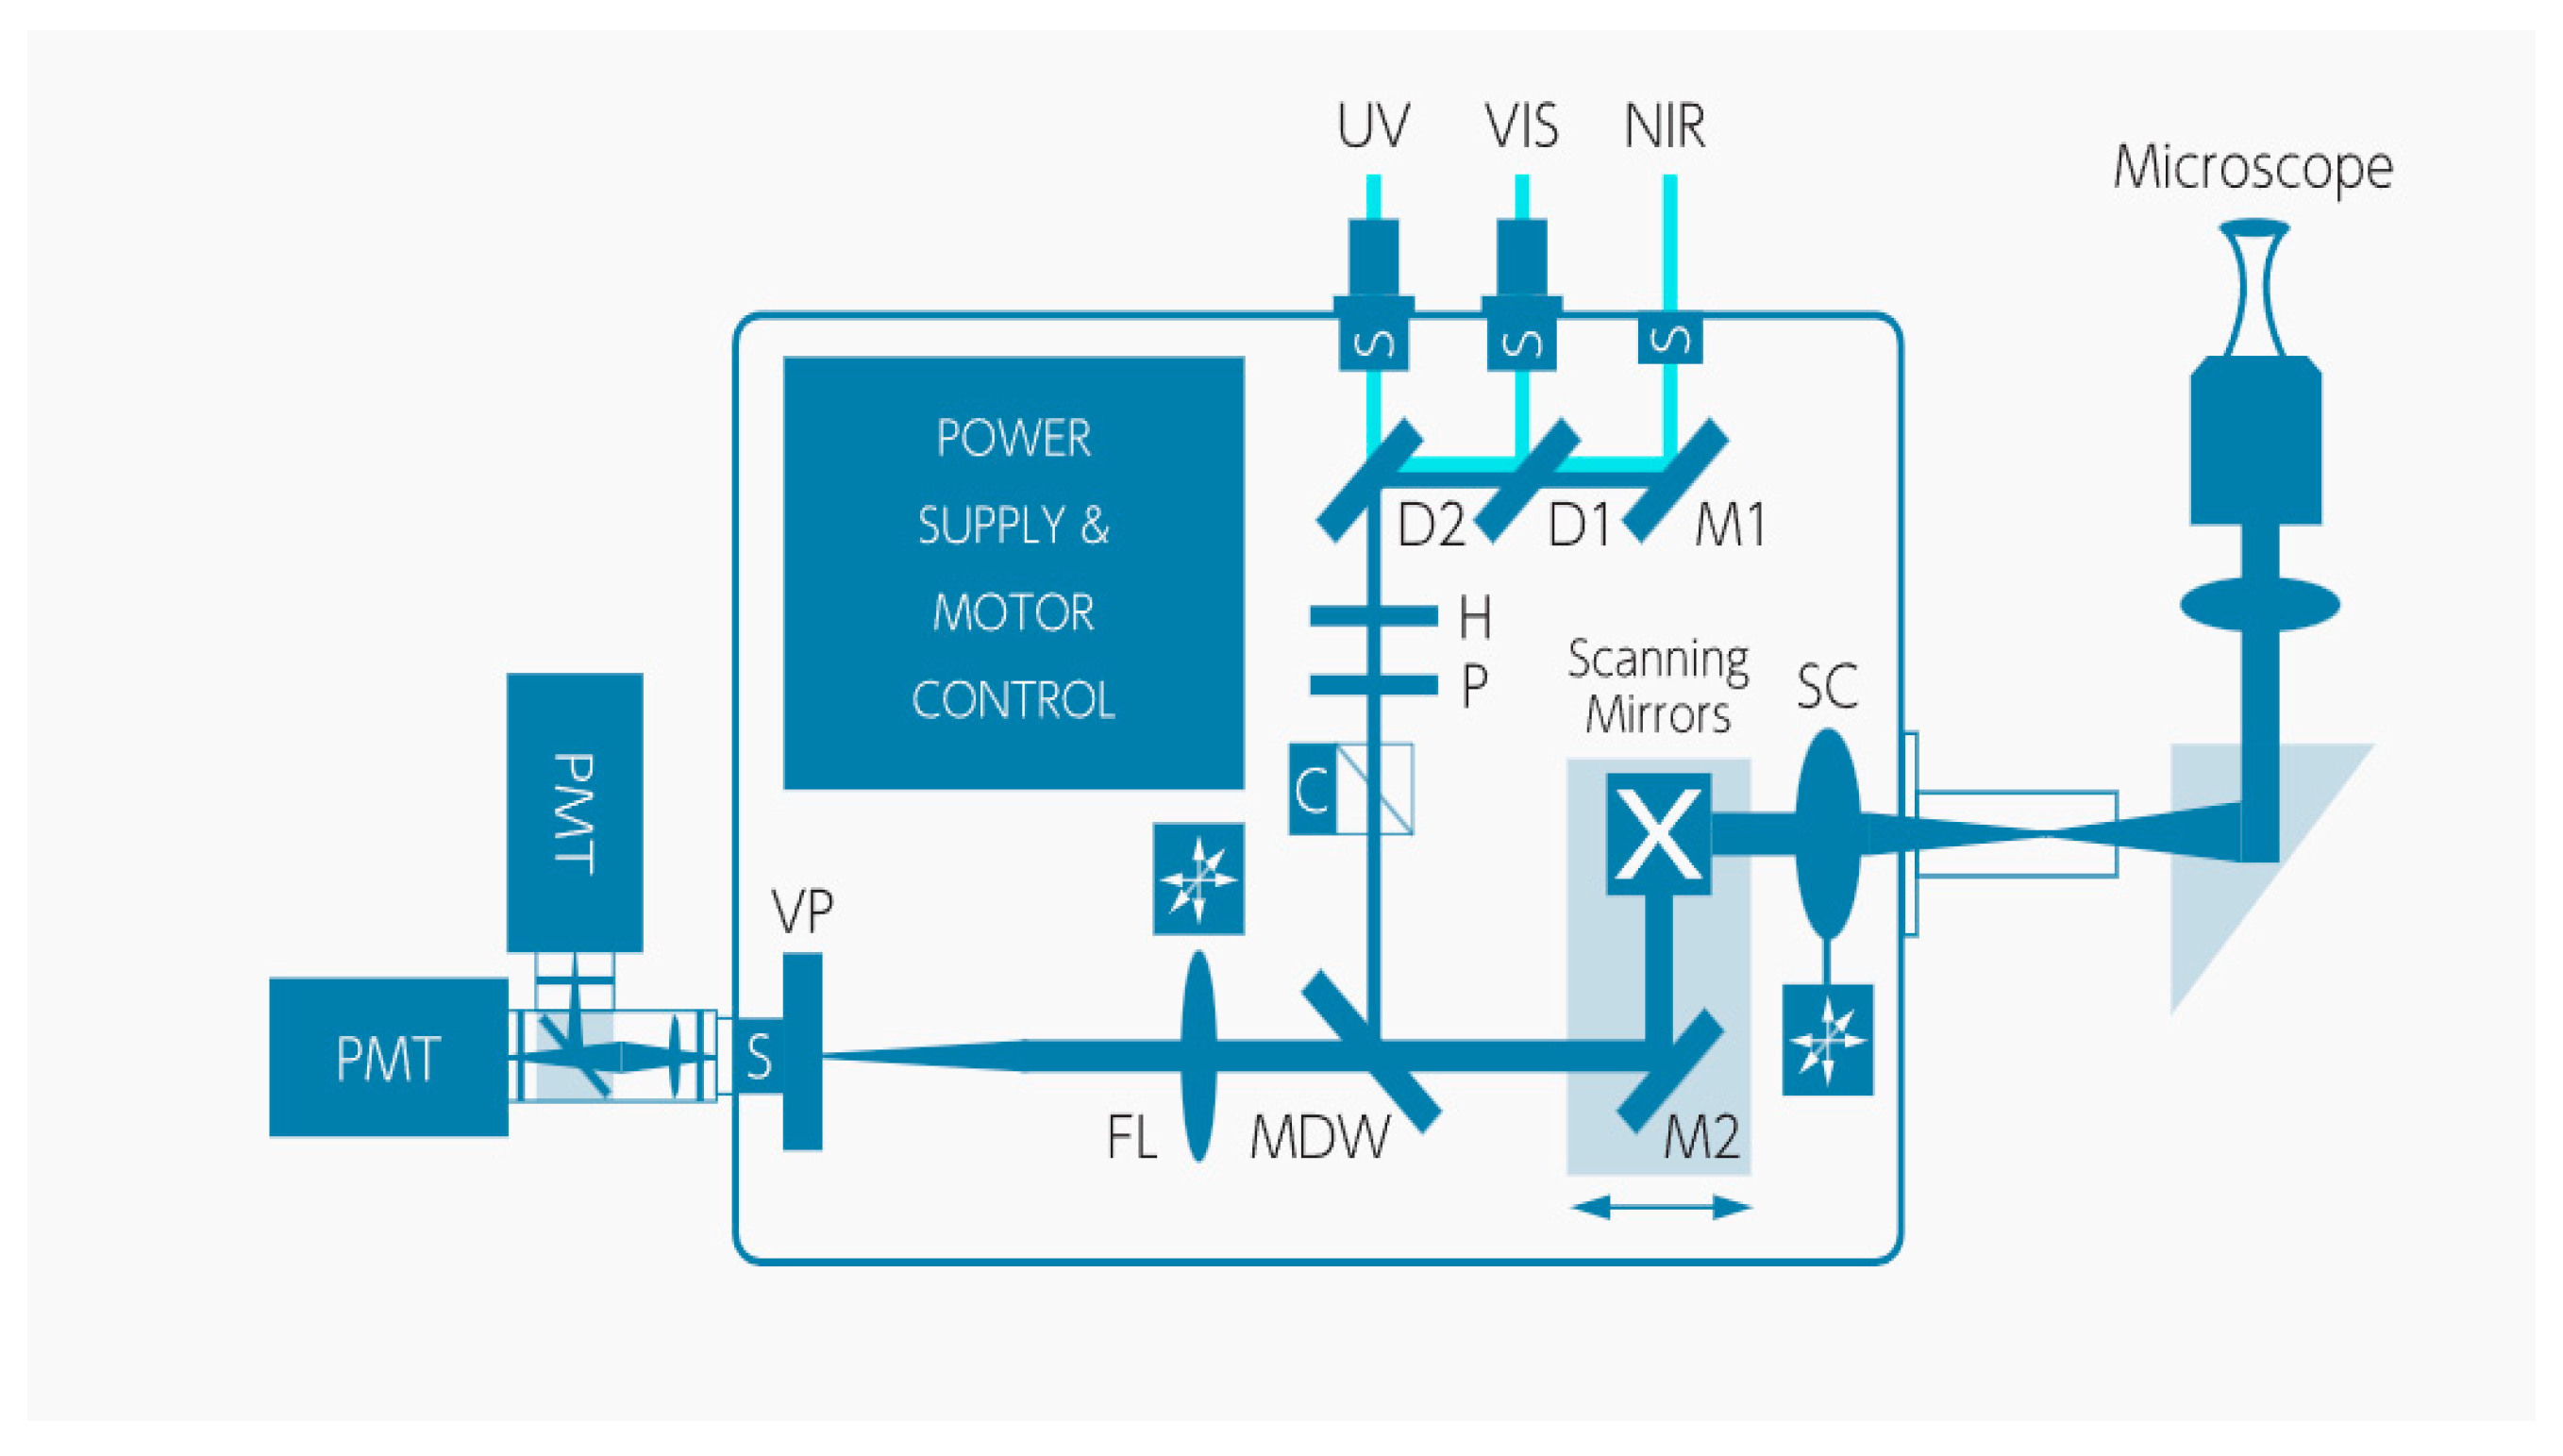
Figure 2.
The concentration of the 0.5 μm beads was 0.1 nM in distilled water at room temperature. The beads were purchased from Duke Scientific Corp., cat. no. G500, diameter 0.499 µm, 15 ml polymer microspheres, green fluorescing 1% solids. IOTech3001 PCI board was used to perform the 3D particle tracking. The 488 nm laser was applied for excitation and green fluorescence of single beads was tracked at 535 nm. The scanning mirror circled the bead and Fourier transformed to indicate a direction of the bead’s next move and followed. The z-direction was tracked up and down of this circled xy-direction pattern and determined which direction the bead’s next z-direction moved. The units in the x-pos, y-pos and z-pos were in micrometer. The full tracking time was 500 seconds. This figure is from the ISS laboratory and illustrates our known conclusions or theorems; the main text refers to the corresponding original work.
Figure 2.
The concentration of the 0.5 μm beads was 0.1 nM in distilled water at room temperature. The beads were purchased from Duke Scientific Corp., cat. no. G500, diameter 0.499 µm, 15 ml polymer microspheres, green fluorescing 1% solids. IOTech3001 PCI board was used to perform the 3D particle tracking. The 488 nm laser was applied for excitation and green fluorescence of single beads was tracked at 535 nm. The scanning mirror circled the bead and Fourier transformed to indicate a direction of the bead’s next move and followed. The z-direction was tracked up and down of this circled xy-direction pattern and determined which direction the bead’s next z-direction moved. The units in the x-pos, y-pos and z-pos were in micrometer. The full tracking time was 500 seconds. This figure is from the ISS laboratory and illustrates our known conclusions or theorems; the main text refers to the corresponding original work.
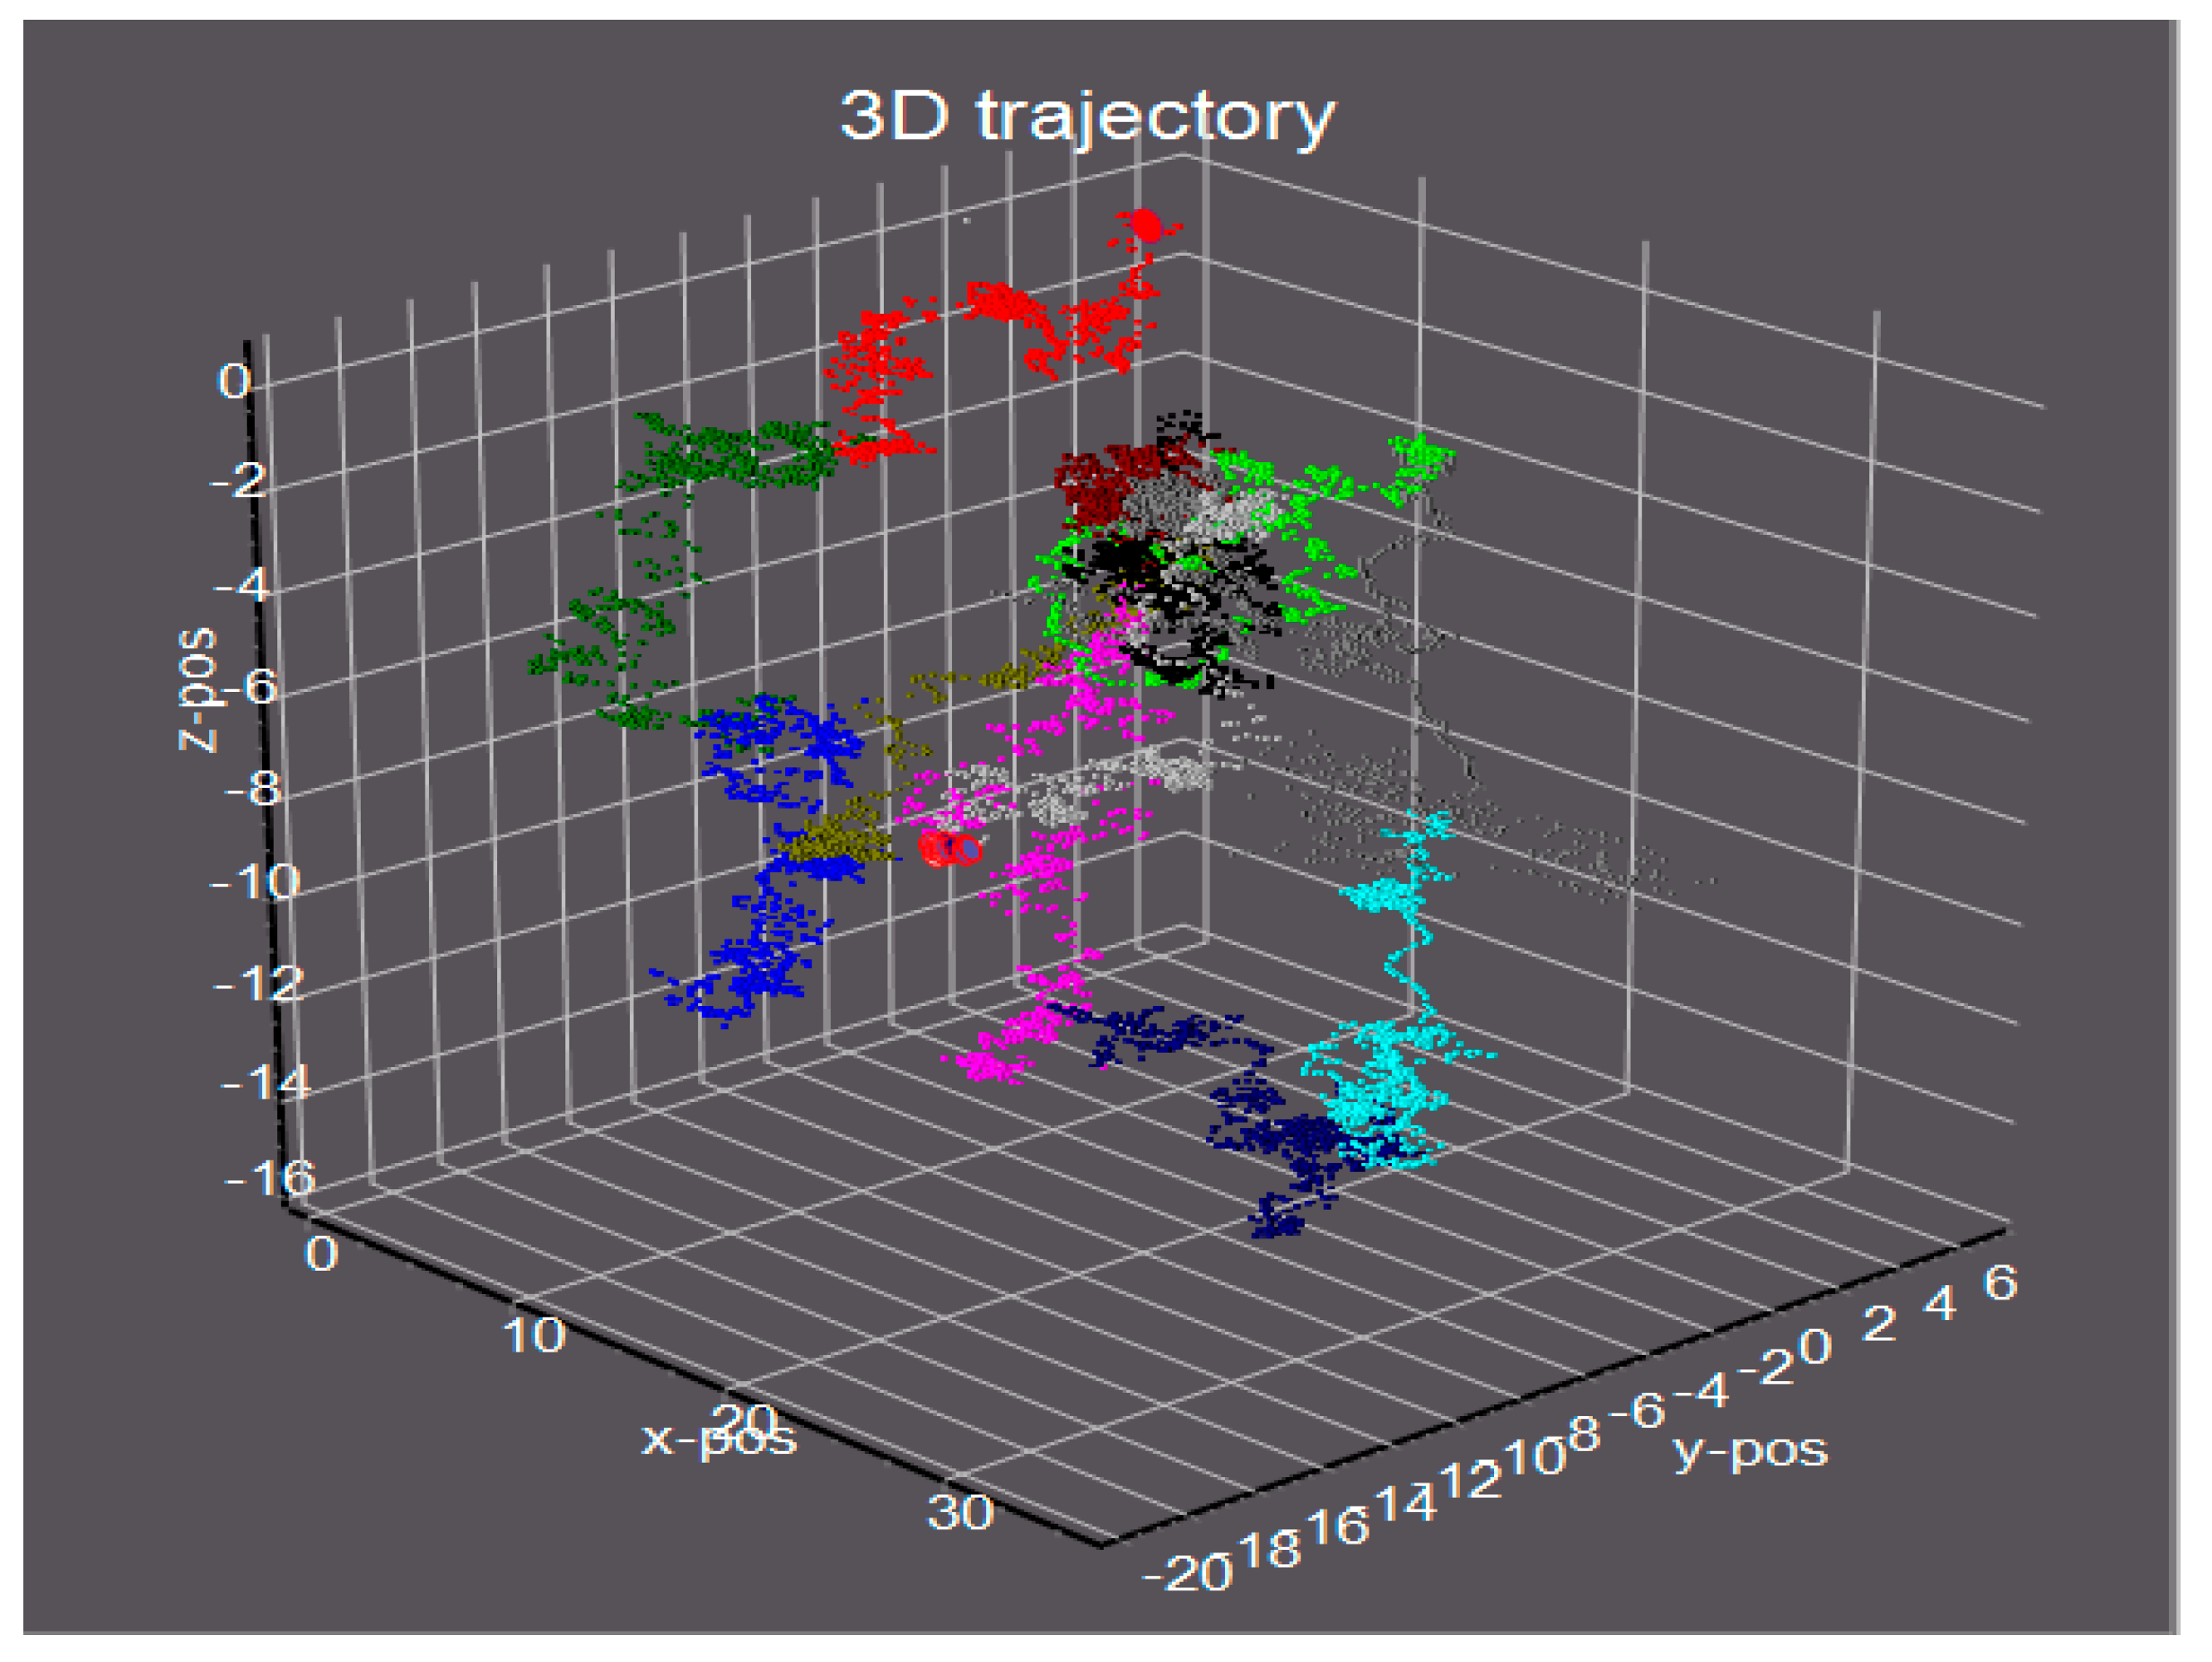
Figure 3.
The graph shows the single total track. A blue dot marks the track’s starting and ending points. This figure is from the ISS laboratory and illustrates our known conclusions or theorems; the main text refers to the corresponding original work.
Figure 3.
The graph shows the single total track. A blue dot marks the track’s starting and ending points. This figure is from the ISS laboratory and illustrates our known conclusions or theorems; the main text refers to the corresponding original work.
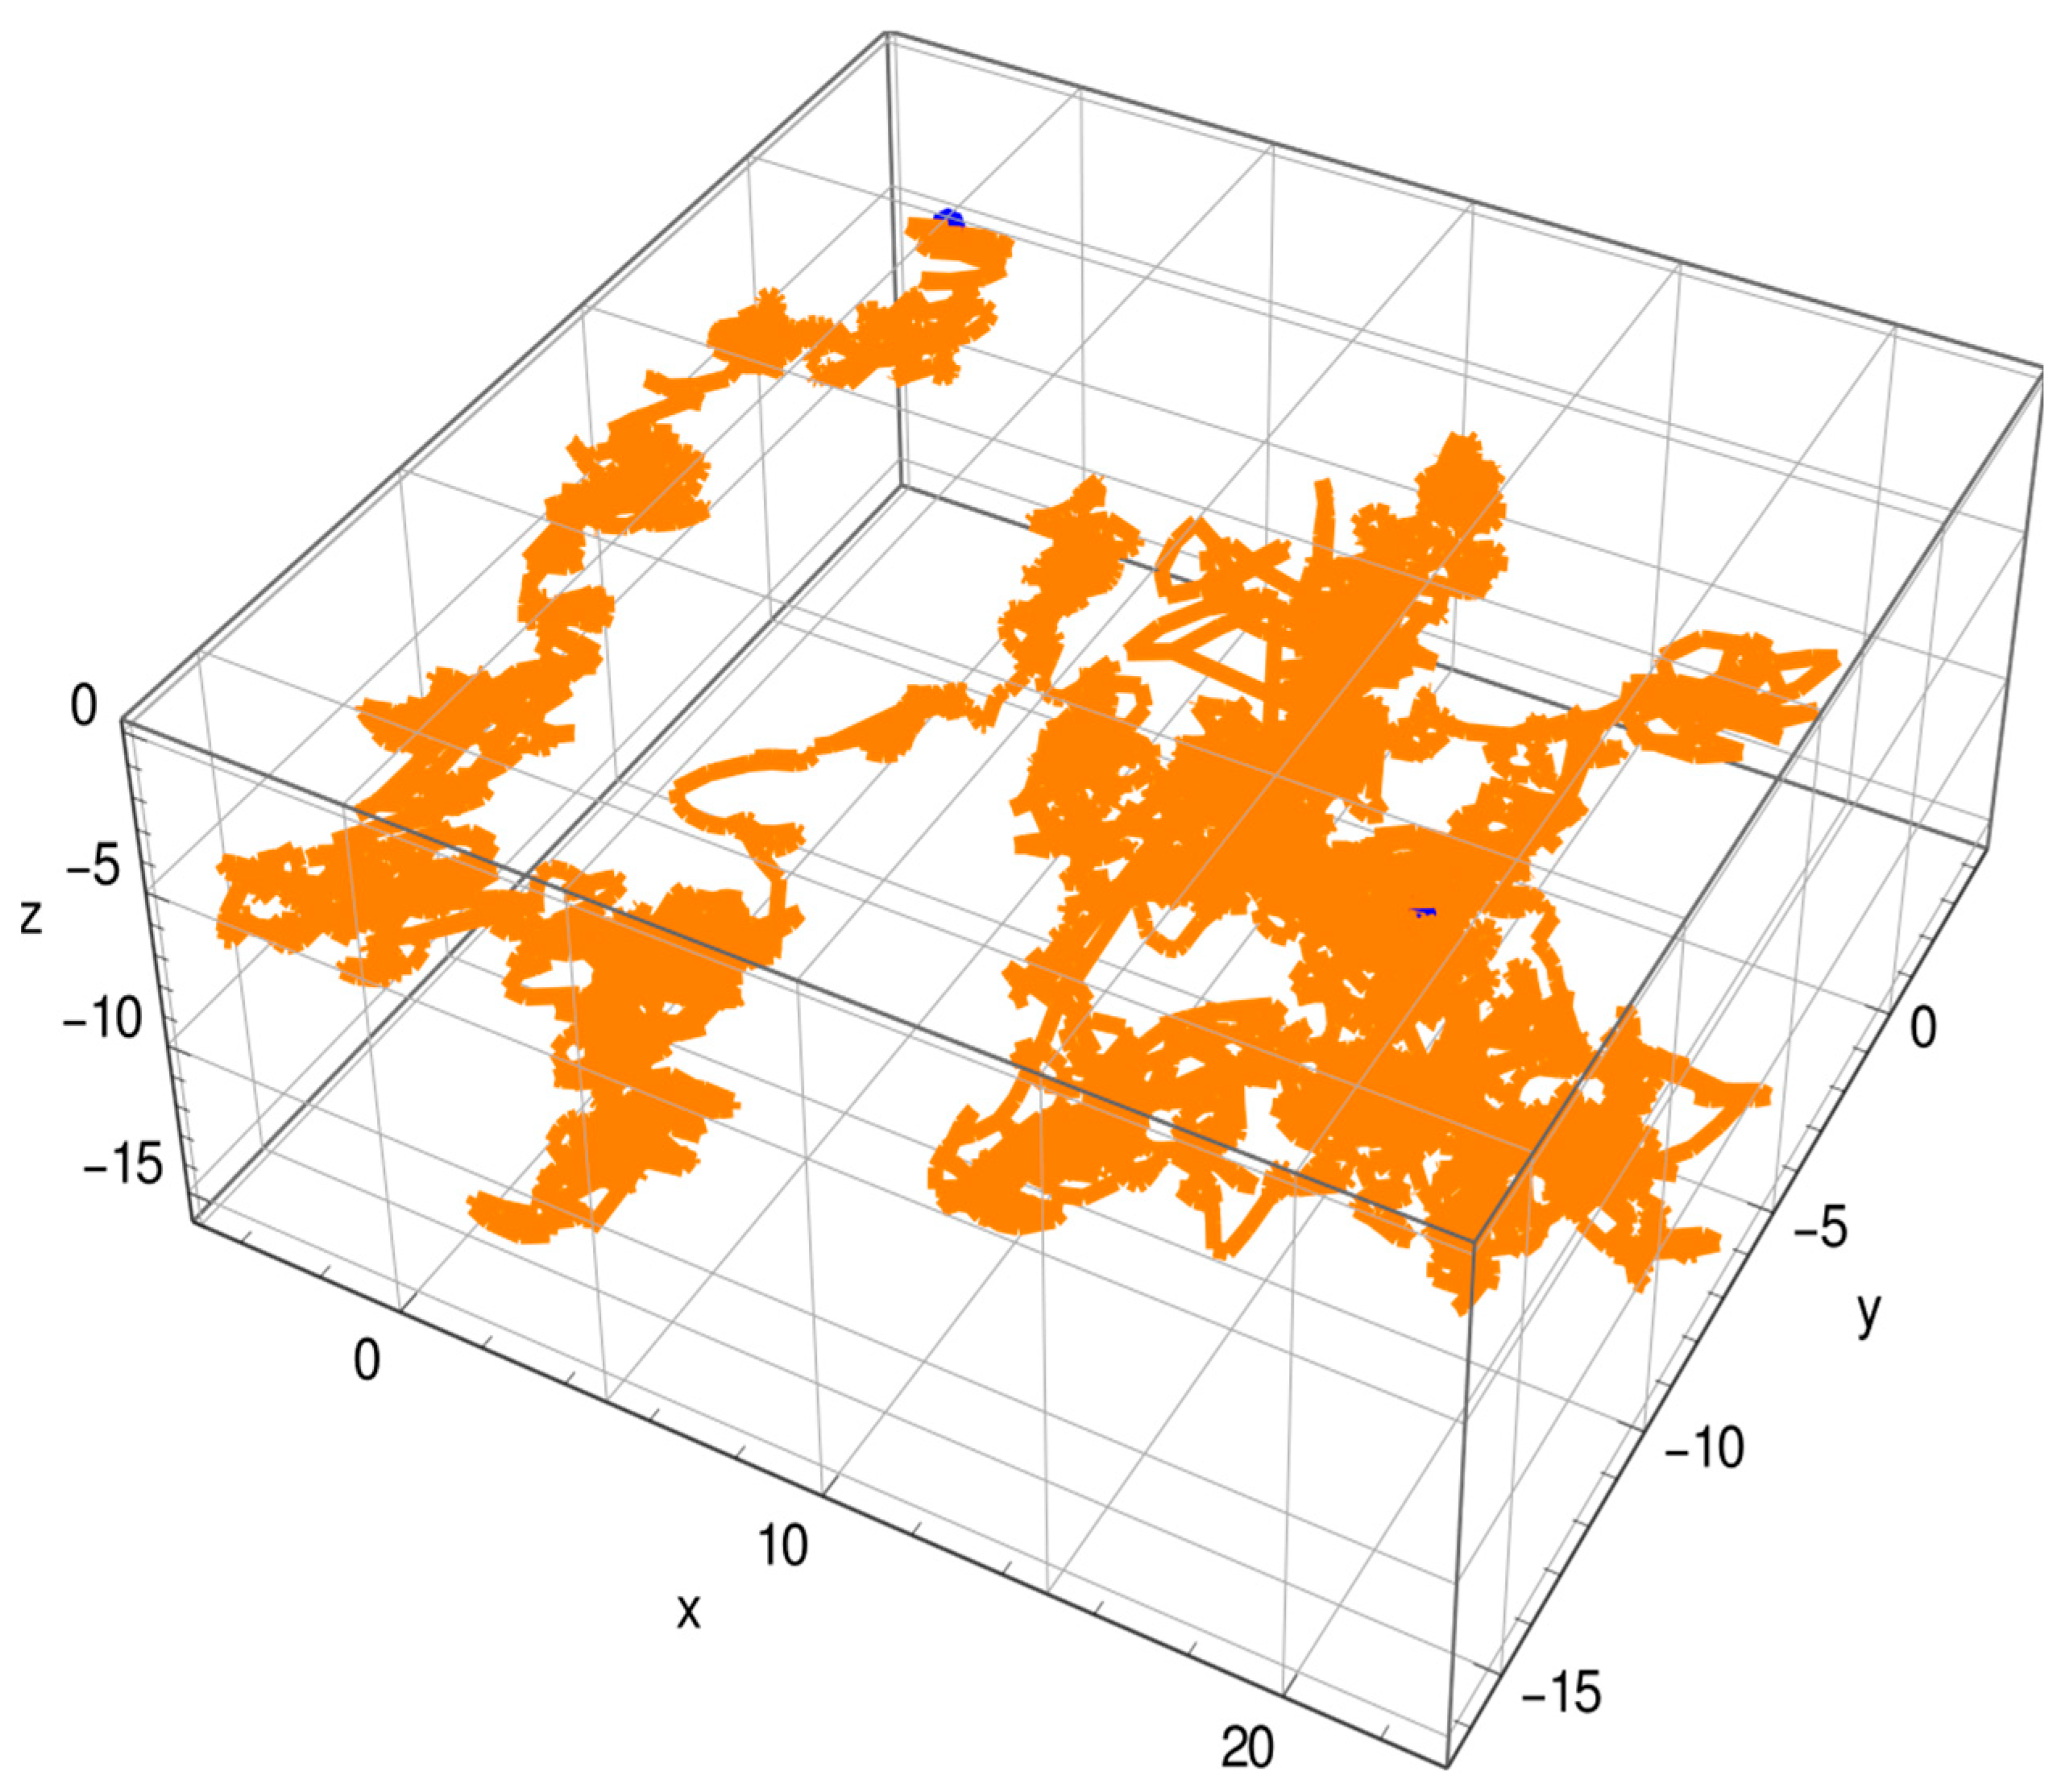
Figure 4.
The dataset depicts two areas with linear increases. The first interval stretches from n ∈ (0, 400), whereas the second interval runs from n ∈ (500, 900). The slopes for these intervals are α = 0.071 and α = 0.085, respectively. Fitting the whole interval n ∈ (0, 900) with produces α = 0.048, β = 1.06 with a time unit of 40 ms, indicating that there was another physical process in addition to diffusion. Since the first interval controled Brownian motion, it is assumed that stands for the diffusion coefficient with a time unit of 40 ms. This figure is from the ISS laboratory and illustrates our known conclusions or theorems; the main text refers to the corresponding original work.
Figure 4.
The dataset depicts two areas with linear increases. The first interval stretches from n ∈ (0, 400), whereas the second interval runs from n ∈ (500, 900). The slopes for these intervals are α = 0.071 and α = 0.085, respectively. Fitting the whole interval n ∈ (0, 900) with produces α = 0.048, β = 1.06 with a time unit of 40 ms, indicating that there was another physical process in addition to diffusion. Since the first interval controled Brownian motion, it is assumed that stands for the diffusion coefficient with a time unit of 40 ms. This figure is from the ISS laboratory and illustrates our known conclusions or theorems; the main text refers to the corresponding original work.
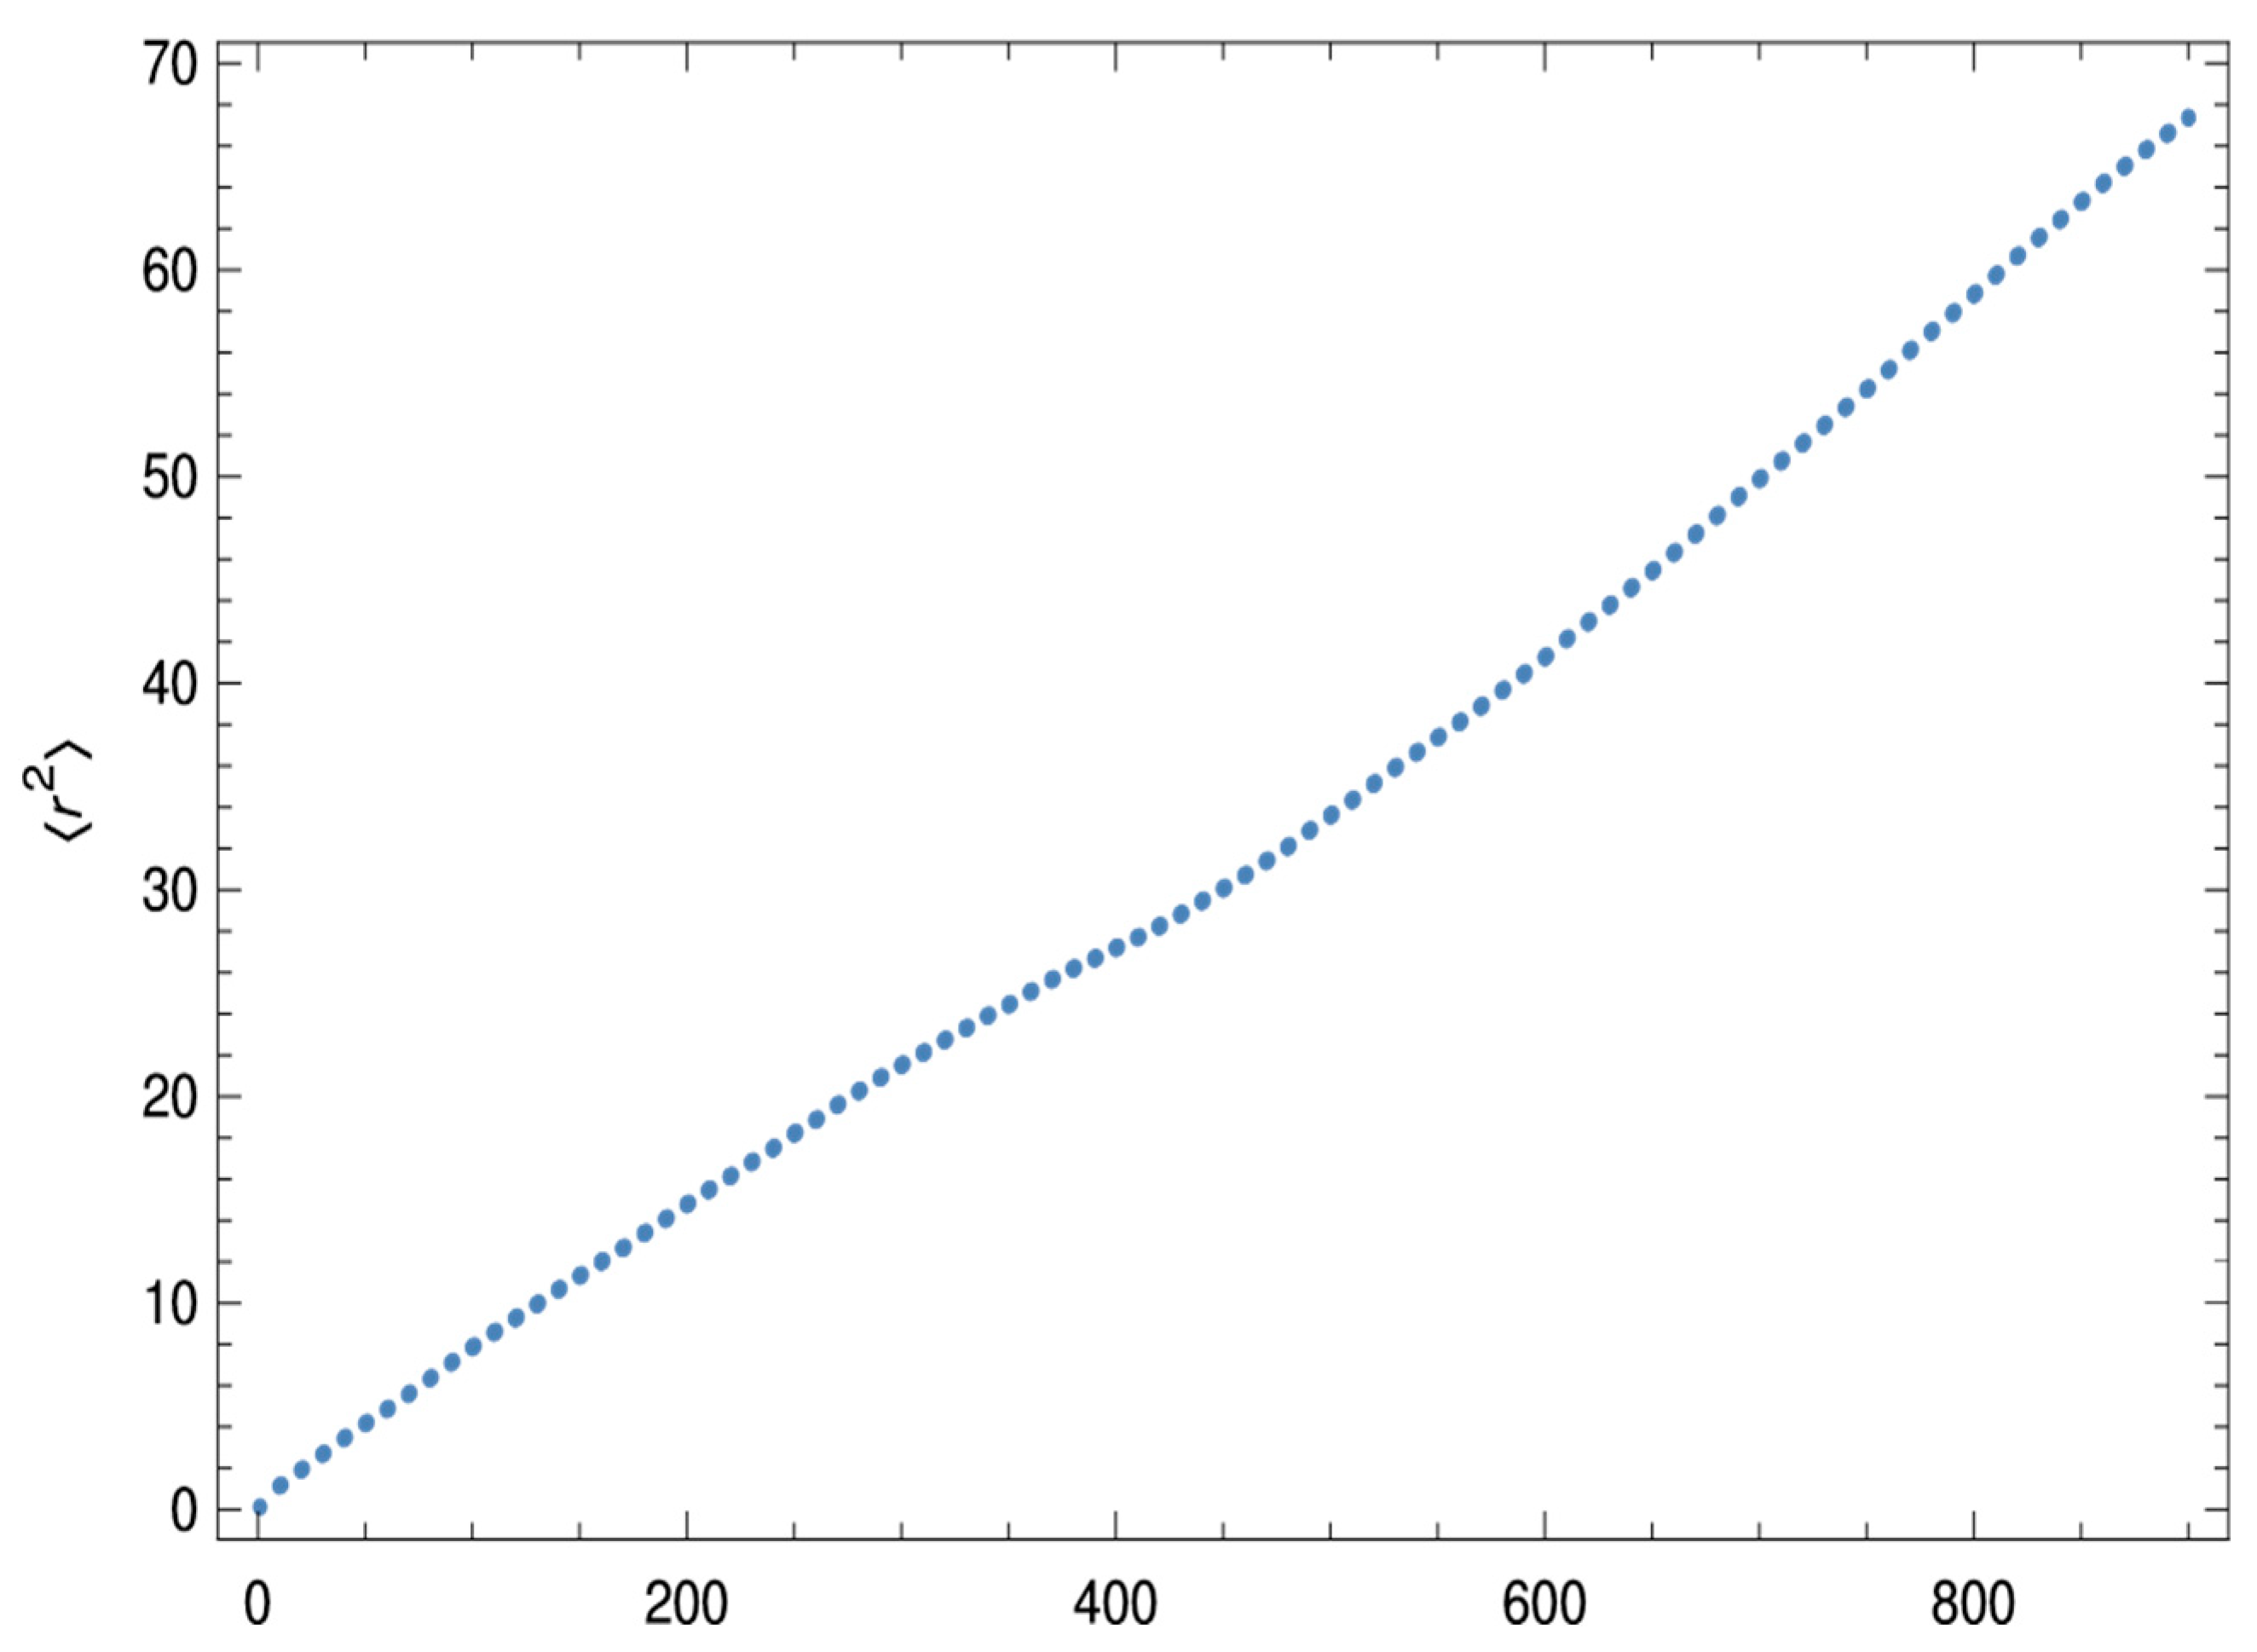
Figure 5.
Fixed HeLa cell, mitochondria labeled with Atto 647N and imaged by STED. The figure is shown with the permission of ISS com. STED z-stack, 34 x 34 x 1.2 µm3,1024 x 1024 x 10 voxels. This figure is from the ISS laboratory and illustrates our known conclusions or theorems; the main text refers to the corresponding original work. See also our website of ISS Inc. and https://www.youtube.com/watch?v=MkdPAGxfI14.
Figure 5.
Fixed HeLa cell, mitochondria labeled with Atto 647N and imaged by STED. The figure is shown with the permission of ISS com. STED z-stack, 34 x 34 x 1.2 µm3,1024 x 1024 x 10 voxels. This figure is from the ISS laboratory and illustrates our known conclusions or theorems; the main text refers to the corresponding original work. See also our website of ISS Inc. and https://www.youtube.com/watch?v=MkdPAGxfI14.
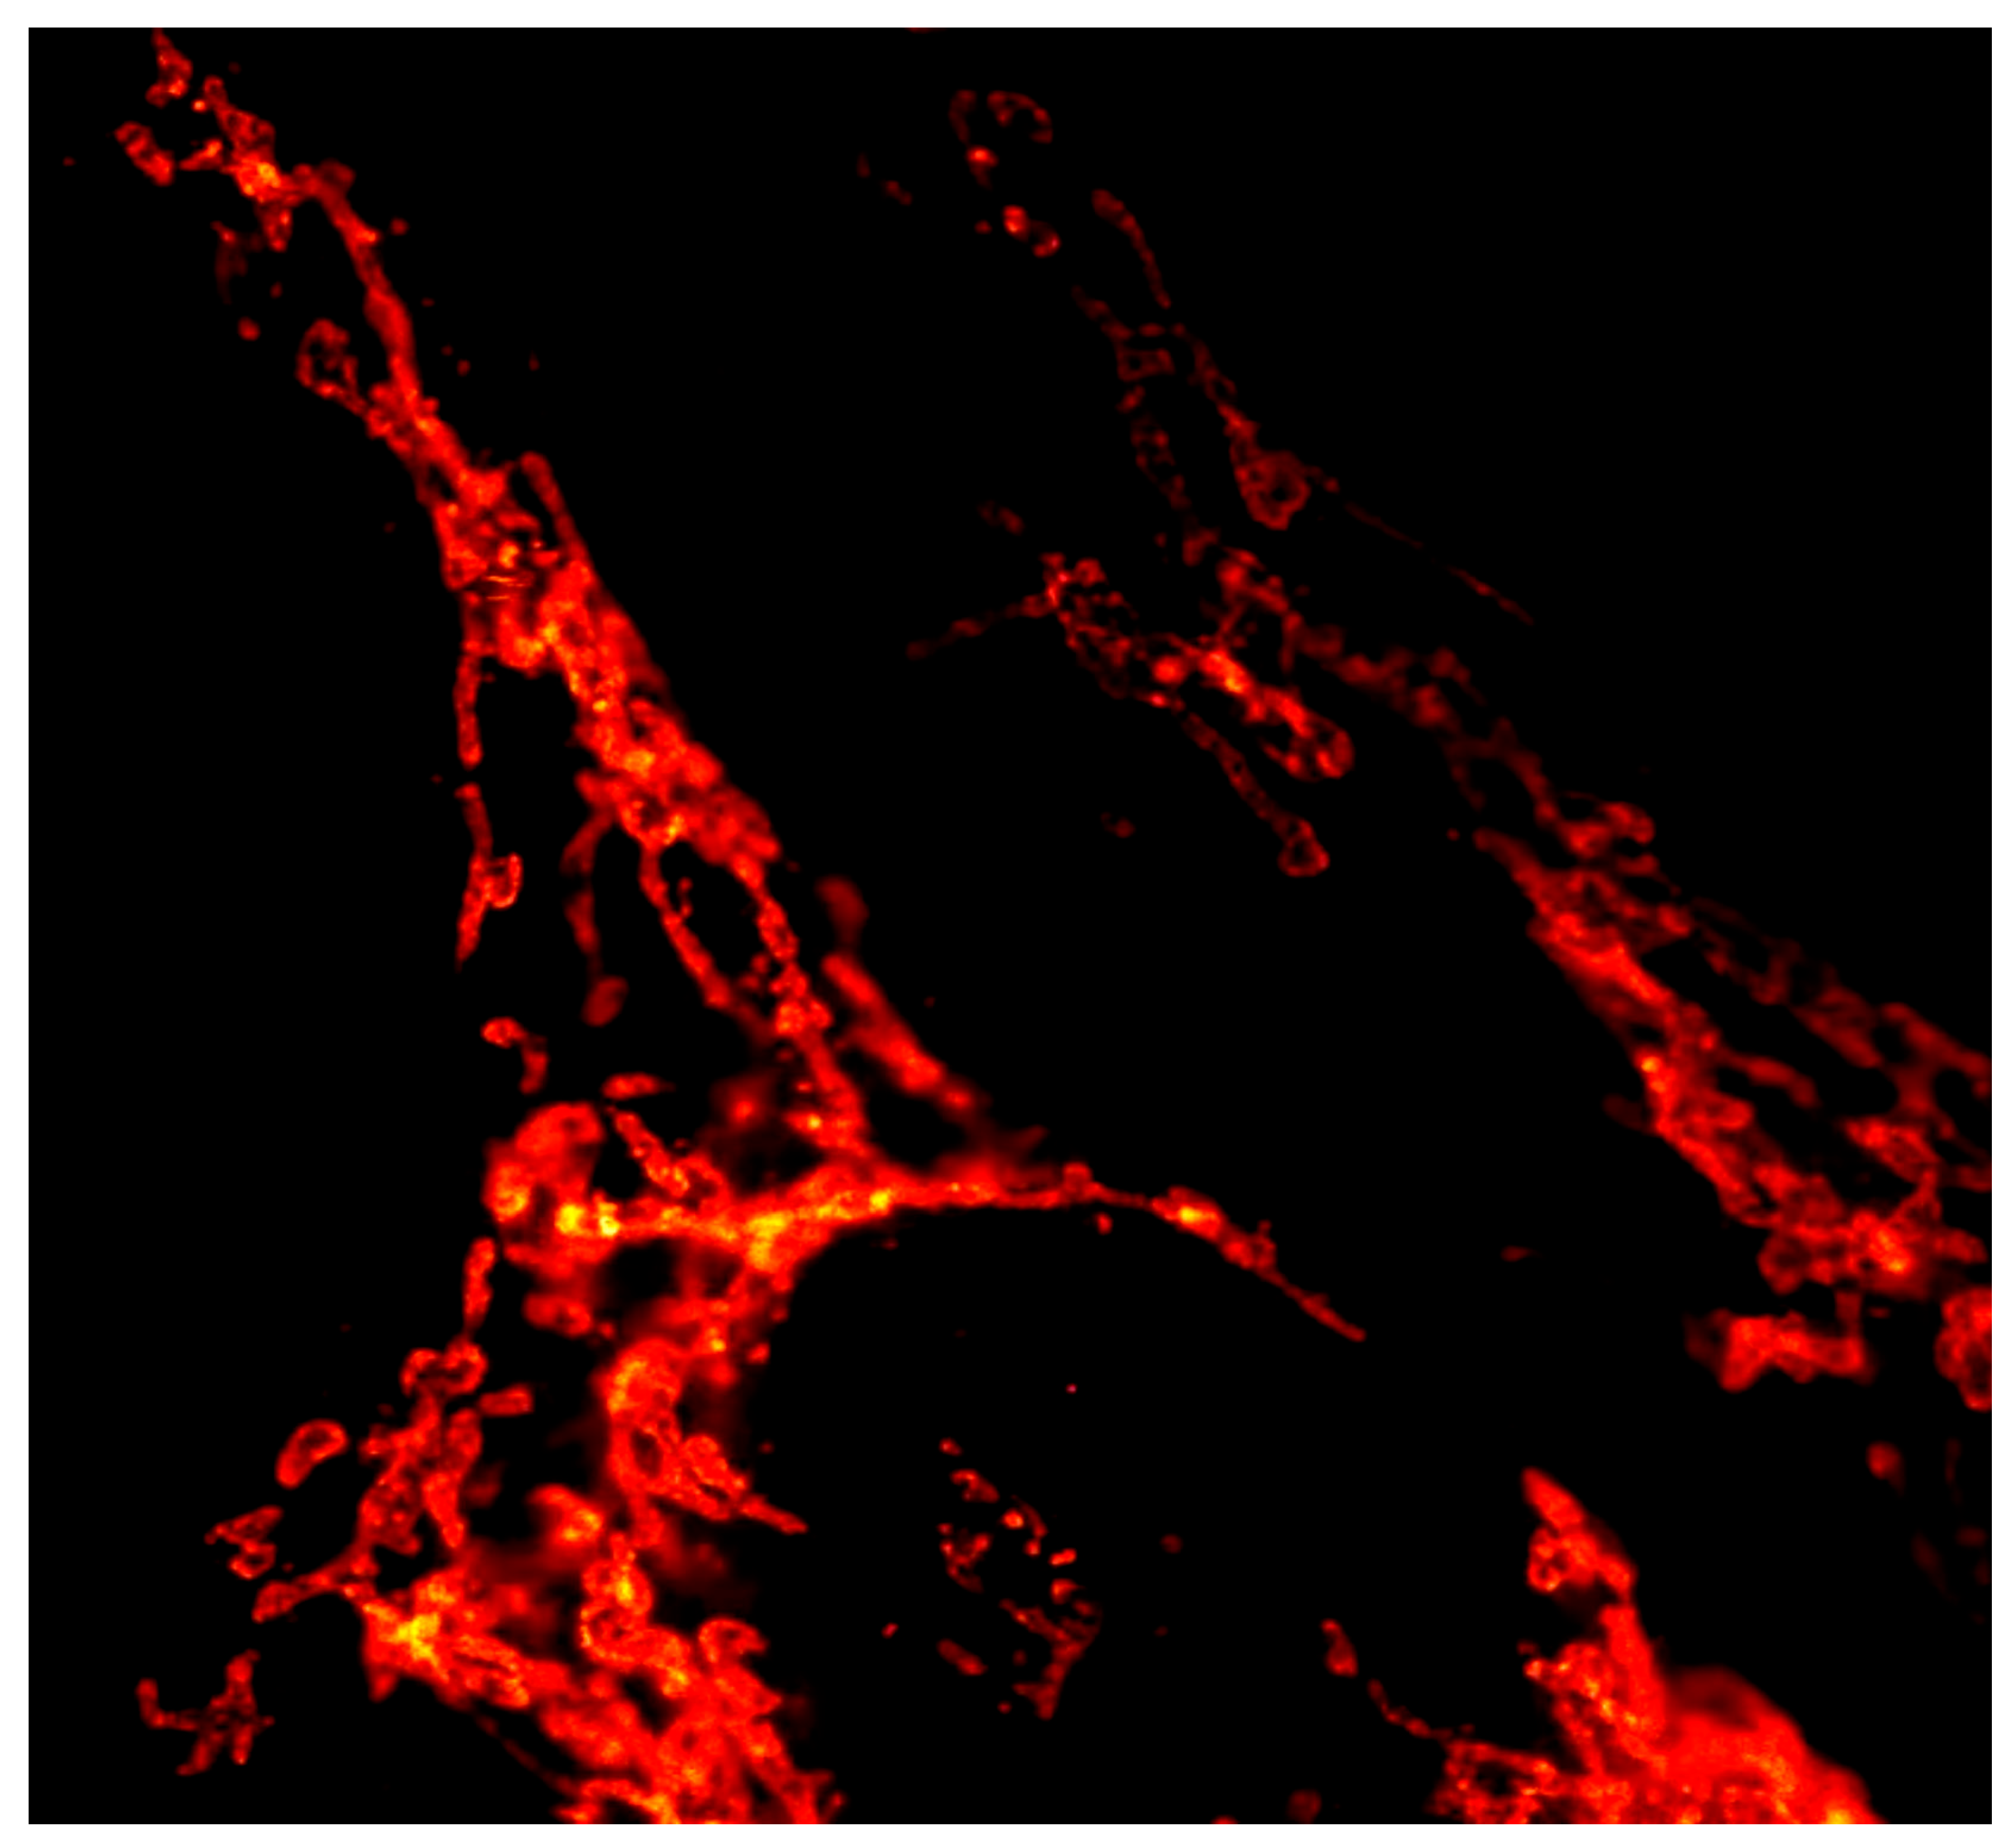
Figure 6.
Live Hela cell microtubule labeled with Atto 647N and Atto 655. Both makers (labels) were excited with a 640 nm laser, separated by pSTED and FastFLIM and then displayed with two different ‘false’ colors. Atto 647N is depicted in yellow and Atto 655 is depicted in violet to generate the processed and fused pSTED image of the two markers. The figure is shown with the permission of ISS com (see also our website of ISS com) and illustrates our known conclusions or theorems; the main text refers to the corresponding original work.
Figure 6.
Live Hela cell microtubule labeled with Atto 647N and Atto 655. Both makers (labels) were excited with a 640 nm laser, separated by pSTED and FastFLIM and then displayed with two different ‘false’ colors. Atto 647N is depicted in yellow and Atto 655 is depicted in violet to generate the processed and fused pSTED image of the two markers. The figure is shown with the permission of ISS com (see also our website of ISS com) and illustrates our known conclusions or theorems; the main text refers to the corresponding original work.
Disclaimer/Publisher’s Note: The statements, opinions and data contained in all publications are solely those of the individual author(s) and contributor(s) and not of MDPI and/or the editor(s). MDPI and/or the editor(s) disclaim responsibility for any injury to people or property resulting from any ideas, methods, instructions or products referred to in the content. |
© 2026 by the authors. Licensee MDPI, Basel, Switzerland. This article is an open access article distributed under the terms and conditions of the Creative Commons Attribution (CC BY) license (http://creativecommons.org/licenses/by/4.0/).
Copyright: This open access article is published under a Creative Commons CC BY 4.0 license, which permit the free download, distribution, and reuse, provided that the author and preprint are cited in any reuse.


