Submitted:
13 February 2026
Posted:
14 February 2026
You are already at the latest version
Abstract
Background: Lipoprotein(a) [Lp(a)] is a casual and independent risk factor for atherosclerotic cardiovascular disease (ASCVD) and is largely genetically determined. However, recent studies indicate significant intra-individual variability, particularly among patients with intermediate Lp(a) levels (30–50 mg/dL). Yet, data on long-term variability are limited, and acute coronary syndrome (ACS) may further influence Lp(a) levels, questioning the optimal timing of assessment after ACS.
Methods: We studied 235 ACS patients across two follow-up cohorts. Baseline Lp(a) was measured 24 hours before hospital discharge. Cohort A had follow-up measurements at 4 months, and 8 months; Cohort B at 5 years. Clinically meaningful intra-individual variability was defined as ≥20 mg/dL or ≥25% change.
Results: A total of 57.9% patients exhibited clinically significant Lp(a) variability. Changes in risk category occurred in 15.3% of patients in the baseline high-risk group, 60.6% of patients in the intermediate-risk group, and 5.5% of patients in the baseline low-risk group. At multivariable analysis incomplete revascularization was an independent predictor of high Lp(a) variability (OR 2.22; 95% CI 1.14-4.31; p 0.02) while female sex, and age-adjusted menopause showed a trend (OR 1.92; 95% CI 0.93-4.00; p 0.08 and OR 11.18; 95% CI 0.79-157.58; p 0.07, respectively) without reaching formal statistical significance. The median absolute changes from baseline to 4-month and from baseline to 5-years follow-up were 7.9 mg/dL (IQR 3.0-18.9) and 10.7 mg/dL (IQR 3.0-21.7), respectively. Concordance between 4- and 8-month Lp(a) measurements was excellent.
Conclusions: Early post-ACS intra-individual variability in Lp(a) is common, mainly affecting risk reclassification in intermediate-risk patients. In those patients, early targeted repeat Lp(a) measurement may improve cardiovascular risk stratification, whereas mid- to long-term reassessment appears unnecessary.
Keywords:
lipoprotein (a)
; intra-individual variability
; acute coronary syndrome
; reclassification
; long-term follow-up
1. Introduction
Lipoprotein(a) [Lp(a)] is a molecule of low-density lipoprotein cholesterol (LDL-C) with an apolipoprotein(a) [Apo(a)] covalently bound by a disulfide bridge to apolipoprotein B-100 (apoB-100). Several mechanisms are involved in its pathogenesis, including proatherogenic, proinflammatory, and prothrombotic effects [1,2,3].
Lp(a) levels are associated with atherosclerotic cardiovascular disease (ASCVD), calcific aortic valve stenosis, peripheral artery disease, abdominal aortic aneurysm, and major adverse limb events [1,2,3,4,5,6,7,8]. Moreover, Lp(a) concentrations are associated with an increased risk of both all-cause and cardiovascular mortality in the general population as well as in individuals with established ASCVD [9,10].
The association between Lp(a) levels and ASCVD risk is continuous and linear, as demonstrated in an observational study of over 500,000 individuals with a median follow-up of 11.2 years, encompassing both primary and secondary prevention populations [4]. Consequently, thresholds used to define elevated Lp(a) vary across studies, reflecting the absence of a universally accepted cutoff for risk stratification: while guidelines commonly adopt a pragmatic threshold of 50 mg/dL (≈125 nmol/L), randomized cardiovascular outcome trials often use higher cutoffs (70–90 mg/dL; ≈175–225 nmol/L) to identify higher-risk populations [11,12,13,14,15,16,17,18].
Lp(a) concentrations are largely genetically determined (≈70–90%), primarily by the LPA gene encoding apo(a), and have traditionally been considered stable over time. [1,2,3].
Population studies demonstrate Lp(a) variability across racial and ethnic groups, with the highest levels observed in Black individuals, followed by those of South Asian descent [17]. Lp(a) levels also increase significantly in postmenopausal women, likely related to decreased estrogen, although it remains unclear whether this reflects aging or menopause itself [19,20,21].
Yet, recent large-scale studies have reported significant intra-individual variability in approximately 20-25% of patients, with the highest reclassification rates observed in individuals with borderline Lp(a) levels (30-50 mg/dL). However, long-term data are still limited. Despite these findings, the magnitude of these fluctuations and their impact on cardiovascular adverse outcomes remains unclear [22,23,24,25,26,27,28,29,30,31].
Furthermore, intra-individual variability in Lp(a)—and the most reliable timing for its assessment to refine secondary prevention risk stratification after acute coronary syndrome (ACS)—remain poorly characterized. Recent studies have reported significant fluctuations in Lp(a) concentrations during the acute phase of ACS, underscoring both the limitations of relying on a single measurement and the importance of defining the optimal timing of assessment to improve risk stratification [32,33,34,35].
To address this evidence gap, we evaluated long-term intra-individual variability in Lp(a) and its clinical impact on reclassification across Lp(a) risk categories in two prospective cohorts of patients with ACS, and we explored predictors of clinically meaningful variability and the optimal timing for Lp(a) assessment.
2. Materials and Methods
2.1. Study Population and Design
We conducted a study comprising two distinct follow-up cohorts. The first was derived from the Optimize Risk Prediction after Myocardial Infarction through Artificial Intelligence and Multidimensional Evaluation (ORACLE) program, a prospective, observational, multicenter study that consecutively enrolls patients with high-risk ACS. The second cohort included consecutive ACS patients admitted to a tertiary-level hospital scheduled for long-term follow-up. Detailed criteria for inclusion and exclusion are provided in the Appendix A. In both cohorts, patients were enrolled during the index hospitalization following percutaneous coronary revascularization (PCI).
In Cohort A, Lp(a) levels were measured at study inclusion and repeated at 4-month, and at 8-month follow-ups. In Cohort B, Lp(a) was assessed at study inclusion and repeated at 5-year of follow-up. In both cohorts, the baseline measurement was assessed 24 hours before discharge. Lp(a) measurements were performed according to standard method at the centralized laboratory of Hospital Virgen de la Victoria (Málaga, Spain). The immunoturbidimetric assay was employed, utilizing a polyclonal antibody against apo (a) to minimize isoform bias. Results were reported in mg/dL.
Lp(a) risk categories were established in accordance with the European Atherosclerosis Society guidelines: high-risk (≥50 mg/dL), intermediate-risk (30–50 mg/dL), and low-risk (<30 mg/dL) [36]. Clinically significant Lp(a) variability was defined as an absolute change of ≥20 mg/dL or a relative change of ≥25%. Although previous studies have frequently used a lower absolute threshold (≥25 nmol/L ≈ 10 mg/dL), cut-off values are not clearly established and show considerable heterogeneity across studies, with some defining high variability only based on an absolute change ≥10 mg/dL and others incorporating a relative change ≥25% [20,21,22,23,24,25,26,27,28,29]. We therefore selected a more conservative threshold to minimize the impact of technical variability inherent to serial Lp(a) measurements, particularly in the context of long-term follow-up and potential Lp(a) fluctuations related to the acute-phase response following ACS. The absolute threshold of ≥20 mg/dL was also used by Deshotels et al. to define high Lp(a) variability in their long-term analysis, which had a median follow-up of 15 years. By applying a higher absolute threshold while maintaining the relative change criterion, we aimed to identify sustained and potentially clinically meaningful changes in Lp(a) concentrations.
Demographic, clinical and analytical data were collected at baseline and during follow-up visits, according to the study protocol. Major Adverse Cardiovascular Events (MACE) was defined as a composite outcome of cardiovascular mortality, all-cause mortality, myocardial infarction (MI), stroke, and unplanned revascularization. The study has been approved by the local Institutional Review Board and an Informed Consent Form was signed by the patient or the legal guardian before study inclusion. The study was conducted according to the ethical principles of the Declaration of Helsinki and the protocol was prospectively registered in a public repository (ClinicalTrials.gov – NCT06993415).
2.2. Statistical Analyses
The distribution of continuous variables was assessed using the Shapiro–Wilk or Kol-mogorov–Smirnov tests, complemented by visual inspection of histograms and Q–Q plots. Based on the results of these normality assessments, parametric or non-parametric statistical tests were selected as appropriate. Continuous variables were expressed as mean ± standard deviation for normally distributed variables or as median with (Q1–Q3) for non-normally distributed variables. Categorical variables were ex-pressed as number (percentage).
Comparisons between groups were performed using Student’s t-test or one-way ANOVA for normally distributed variables, Mann–Whitney U test or Kruskal–Wallis test for non-normally distributed variables and Chi-square test for categorical variables
Absolute and relative variability between baseline and first follow-up (4 months and 5 years) were compared using the Mann–Whitney U test. In the subgroup with paired measurements at 4 and 8 months, intraindividual variability was assessed using the Wilcoxon signed-rank test. Agreement between risk categories was assessed using weighted Cohen’s kappa, with interpretation according to conventional thresholds.
For the regression analysis, univariate analyses were first performed to identify clinical and biochemical variables associated with high Lp(a) variability. Variables with clinical relevance or a univariate p-value <0.20 were considered for inclusion in multivariable logistic regression models.
Age was forced into the multivariable models due to its clinical relevance as a potential confounder. Analyses involving menopausal status were restricted to female patients. Multivariable models were constructed using logistic regression, and results were re-ported as odds ratios (OR) with 95% confidence intervals (CI).
All statistical analyses were performed using IBM SPSS Statistics (IBM Corp., Armonk, NY, USA). A two-sided p-value <0.05 was considered statistically significant.
3. Results
3.1. Baseline Characteristics
A total of 235 patients has been included, 143 from Cohort A with measures at baseline, 4 and 8 months, and 92 from Cohort B with measures at baseline and 5 years-follow-up (Table 1). Clinical characteristics within the two study cohorts are presented in Supplementary Table B1 (Appendix B). Median age was 61.1 (55.0-70.6), 79.1% were man. With respect to cardiovascular risk factors; 63% had hypertension, 74% had dyslipidemia, and 35.7% had diabetes mellitus. Additionally, 21.3% of the patients had previous MI, and 18.3% had undergone further prior PCI. Median baseline Lp(a) was 34.7 mg/dL (14.8–79.0), with approximately one-third of patients (36.2%) showing elevated baseline Lp(a). Clinical characteristics of Cohort A and Cohort B and patient categorization according to baseline and follow-up Lp(a) levels are provided in Supplementary Table B2 (Appendix B).
3.2. Intra-Individual Lipoprotein(a) Variability and Clinical Characteristics Stratified by Lp(a) Variability
Overall, 57.9% of patients had significant Lp(a) variability, exhibiting intra-individual variability ≥25% or ≥20 mg/dL. Baseline characteristics were comparable between the high and low Lp(a) variability groups (Table 2). Patients with high Lp(a) variability showed a trend toward a worse lipid profile compared with those with low variability, although none of the evaluated parameters reached statistical significance. Notably, despite similar baseline Lp(a) levels, a trend toward lower mean Lp(a) levels during follow-up was observed in the high-variability group, despite similar baseline Lp(a) levels.
Statistically significant differences were observed only in the prevalence of postmenopausal women (23.5% vs. 12.1%, respectively; p = 0.034) and in the prevalence of incomplete revascularization (31.6% vs 18.2%, respectively; p = 0.020), both of which were more prevalent in patients with high Lp(a) variability.
3.3. Transition Between Lp(a) Categories
The majority of patients remained in the same risk category during follow up (81.3%). Among the 44 patients who transitioned between categories, 68.2% transitioned from a higher to a lower risk category at follow-up, whereas 31.8% transitioned from a lower to a higher risk category at follow-up (Figure 1).
Significant Lp(a) variability (≥25% or ≥20 mg/dL) was observed in 54.1% of patients with normal baseline Lp(a) levels, 58.5% of those with intermediate baseline Lp(a) concentrations, and 55.3% of patients with high baseline Lp(a) levels, with no statistically significant differences in variability based on the baseline status (Figure 2).
When analyzing each specific risk category, in the normal Lp(a) category at baseline 94.5% remained in the same category, and 5.5% shifted to the intermediate category, while none shifted to a high risk category.
Among patients in the intermediate Lp(a) category at baseline, 39% remained in the same category, 41.5% shifted to the normal category, and 19.5% transitioned to the high-risk group.
Among patients in the high-risk Lp(a) category at baseline, 84.7% remained in the same category, 10.6% shifted to the intermediate-risk category, and 4.7% shifted to the low-risk category.
Detailed data on patient reclassification across Lp(a) risk categories and intra-individual variability are provided in Appendix B.
3.4. Multivariable Logistic Regression Analysis of Factors Independently Associated with High Lp(a) Variability
Univariable and multivariable logistic regression for factors associated with high Lp(a) variability is presented in Table 4. On multivariable logistic regression, incomplete revascularization (OR 2.22; 95% CI 1.14-4.31; p 0.02) was an independent predictor of high Lp(a) variability. Female sex (OR 1.92; 95% CI 0.93-4.00; p 0.08) and age-adjusted menopause (OR 11.18; 95% CI 0.79-157.58; p 0.0.7) showed a trend toward association with high Lp(a) variability, without reaching formal statistical significance.
3.5. Variability of Lipoprotein(a) According to the Timing of Determination
Lp(a) variability between baseline and follow-up measurements was compared among patients assessed at 4 month, 8 months and 5 years follow-up (Figure 3). In cohort A, median absolute variability from baseline to 4-month follow-up was 7.9 mg/dL [interquartile range (IQR) 3.0-18.9], whereas in Cohort B, median absolute variability from baseline to 5-years follow-up was 10.7 mg/dL (IQR 3.0-21.7). Median relative change in Lp(a) values was 25.0% (IQR 12.5-45.7) from baseline to 4-month follow-up, and 32.7% (IQR 10.5-54.6) from baseline to 5-month follow-up. No significant difference in Lp(a) values were observed between 4-month and 8-month follow-up.
Change in categories among patients with repeated Lp(a) assessment at 4-month, 8-month or 5 years is presented in Figure 4. Agreement between baseline and follow-up values was strong for baseline to 4-month follow-up risk (weighted Cohen’s kappa = 0.81; 95% CI 0.74–0.88; p < 0.001); 4-month to 8-month follow-up (weighted Cohen’s kappa 0.88; 95% CI 0.79–0.96; p < 0.01), and baseline to 5-years (weighted Cohen’s kappa = 0.75; 95% CI 0.64–0.85; p < 0.01).
Reclassification figures appeared largely superimposable among patients reevaluated at 4-months or longer-term follow-up (Figure 4).
4. Discussion
The main results of this study that evaluated for the first time the prospective variability of Lp(a) at short- and long-term after ACS could be summarized as follows:
- Substantial intra-individual variability in Lp(a) is common after ACS, affecting nearly six in ten patients when using clinically relevant variability thresholds. Incomplete revascularization, female sex and sex-adjusted menopause were observed as potential predictors of high Lp(a) variability.
- Despite this variability, most patients remain within the same Lp(a) risk category over time, with reclassification concentrated in those with intermediate baseline Lp(a) levels, whereas patients starting in the low-risk range were essentially never reclassified at high risk.
- Reclassification patterns were broadly comparable across reassessment timepoints after ACS, with similarly high category concordance and similar proportions of patients changing risk category whether Lp(a) was remeasured early or at longer-term follow-up.
Lp(a) is a lipid particle whose plasma concentrations are generally considered stable over time, largely due to its strong genetic determination [1,2,3]. However, multiple recent studies have reported clinically significant longitudinal intra-individual variability in approximately 20–25% of patients, which might affect risk classification and related prevention strategies [22,23,24,25,26,27,28,29,30,31].
In our ACS population, clinically meaningful intra-individual variability in Lp(a) was observed in 57.9% of patients; however, risk-category changes occurred predominantly among those classified as intermediate risk at baseline, with more than half being reclassified during follow-up, whereas patients initially classified as low risk were never reclassified.
These findings are consistent with previous studies, conducted outside the ACS setting, in which approximately 50% of individuals with baseline intermediate Lp(a) levels were reclassified during follow-up. Deshotels et al. reported that in a cohort of 4,734 outpatient individuals, 58.1% of those with baseline Lp(a) levels of 30–50 mg/dL reached levels ≥50 mg/dL after a median follow-up of 15 years [24]. Similarly, Awad et al. showed that among the 51.2% of individuals with borderline baseline Lp(a) who changed risk category, 27.9% moved to normal risk category whereas 23.3% worsened to high-risk [25]. Joo et al. reported that patients with intermediate Lp(a) levels, 22.5% transitioned to low-risk, while 29.3% progressed to high-risk [26].
These studies mostly included data from a general population in an outpatient clinic setting, while evidence in patients with established cardiovascular disease remains limited. We confirmed that also among patients included for ACS, a similar pattern in classification was present among different reevaluation timelines.
During acute events such as hospitalization for ACS, substantial metabolic and inflammatory perturbations may occur, potentially resulting in clinically meaningful changes in measured Lp(a) levels. Several interleukin-6–responsive elements within the LPA gene may contribute to fluctuations in Lp(a) concentrations during states of acute or chronic inflammation. Nevertheless, Lp(a) does not behave as a classic acute-phase reactant in ACS, as its temporal trajectory does not correlate with changes in high-sensitivity C-reactive protein (hsCRP) or other inflammatory markers [32,33,34,37,38,39]. In a prior smaller study, Ziogos et al. evaluated 108 patients with acute MI and reported an increase in Lp(a) levels at 6 months compared with measurements within 24 hours of hospital admission (p = 0.02), with an increase >25 nmol/L observed in more than 20% of patients, which was independent of hsCRP levels [32]. Similarly, a pre-specified analysis of the randomized controlled trials Evolocumab in Acute Coronary Syndrome (EVACS I; ClinicalTrials.gov, NCT03515304) and Evolocumab in Patients With STEMI (EVACS II; ClinicalTrials.gov Identifier: NCT04082442) reported that, in placebo-treated patients, Lp(a) levels increased from measurements obtained within 24 hours of hospital admission to hospital discharge and to 30 days [34]. Similar findings—suggesting a potential rise in Lp(a) from the in-hospital phase to follow-up—have been reported in other ACS cohorts, supporting consideration of repeat Lp(a) measurement to ensure accurate risk assessment [33,35].
Notably, another key finding of our study was the excellent agreement between Lp(a) risk categories at 4 and 8 months, suggesting that most intra-individual variability in Lp(a) levels after ACS occurs early, with no meaningful changes thereafter. These results, in line with prior studies, might suggest that intra-individual Lp(a) might cluster during the initial phase after the acute event, and remain largely stable afterwards, potentially informing the optimal timing of Lp(a) reevaluation in individuals in which is deemed necessary [32,33,34,35].
Our long-term follow-up cohort captured Lp(a) values after stabilization, reflecting potential true intra-individual variability rather than the transient acute-phase response.
Yet, whether risk reclassification translates into a higher risk of MACE remains to be clarified. An individual patient-data-meta-analysis of statin outcome trials demonstrated that both baseline and on-statin treatment Lp(a) levels ≥50 mg/dL were associated with a higher incidence of cardiovascular events [hazard ratio (HR) 1.31; 95% CI 1.08–1.58 and HR 1.43; 95% CI 1.15–1.76, respectively] [40]. In contrast, Trinder et al., in a cohort of patients without coronary artery disease (CAD), did not observe statistically significant associations between Lp(a) variability and incident CAD, regardless of baseline Lp(a) levels or the magnitude and direction of change [23]. Therefore, further studies are needed to evaluate the short- and long-term clinical impact of Lp(a) variability.
In our study, baseline characteristics were largely similar between patients with and without high Lp(a) variability, yet incomplete revascularization, female sex and age-adjusted menopause were observed as potential predictors of high Lp(a) variability during follow-up. In this setting, incomplete revascularization may represent a proxy for more diffuse and severe CAD, which may impact the patient risk profile and the metabolic variability. In line with this hypothesis, large cross-sectional studies of MI patients observed that Lp(a) levels were independently associated with markers of severe CAD, including a high Gensini score (≥100), left main disease, and three-vessel disease [41]. Similarly to our cohort, systematic review and meta-analysis reported higher Lp(a) levels in postmenopausal women, in line with the finding of a potential effect of hormone replacement therapy with estrogen and progesterone in postmenopausal women [19,20,21]. Hence our results suggest that these factors may not only affect absolute levels of Lp(a) but also their variability over time.
Finally, although risk-category reclassification was common in our cohorts, it appeared to be largely an early post-ACS phenomenon. We observed excellent concordance between risk categories assigned at 4 and 8 months, indicating that once Lp(a) is reassessed after the acute phase, subsequent short-term measurements are unlikely to materially change classification. Importantly, to our knowledge this is the first study to report Lp(a) reassessment in ACS patients at long-term follow-up up to 5 years, enabling estimation of the frequency and potential clinical implications of Lp(a) variability over time and informing long-term secondary prevention strategies. In this context, reclassification proportions were broadly similar regardless of whether follow-up occurred early (4–8 months) or at longer-term timepoints up to 5 years, suggesting limited incremental yield from routine mid- or long-term repeat testing once a stable post-ACS value has been established.
Taken together, these data support a targeted repeat Lp(a) measurement early after the index ACS event, particularly in patients with intermediate baseline Lp(a), in whom reclassification is most clinically relevant. By contrast, additional long-term repeat measurements may be unnecessary, especially in patients for whom a change in risk category is unlikely despite potential variability.
Several limitations of this study should be acknowledged. First, mid–short-term and long-term follow-up were evaluated in two separate cohorts; therefore, direct within-patient comparisons of the magnitude of Lp(a) variability and risk-category reclassification across short- and long-term time horizons cannot be firmly established. Nevertheless, the excellent concordance observed between 4- and 8-month assessments supports the concept that most clinically relevant reclassification may occur early after ACS.
Second, generalizability may be limited considering the high-risk cohort included. The study population was predominantly male and included patients with a high prevalence risk factors and comorbidities. Accordingly, results may not extrapolate to lower risk cohorts.
Third, selection and attrition bias cannot be excluded, as analyses were restricted to patients with available follow-up that allowed repeated Lp(a) determinations. Nevertheless, follow-up was standardized for the overall population and attempts for study retention were performed to reduce follow-up loss.
Fourth, long-term follow-up provide an important perspective, but a survivor bias associated to patient that remained alive at long-term follow-up cannot be excluded.
Finally, the sample size and event rate limited statistical power to robustly evaluate the prognostic impact of Lp(a) variability and reclassification on clinical outcomes, and to precisely estimate associations for some candidate predictors. Further studies in larger ACS cohorts are needed to address this issue.
5. Conclusions
Substantial intra-individual variability in Lp(a) is common in patients after ACS. While none of the patients initially classified as low risk was reclassified to a the high risk category, more than half of those in the intermediate-risk category experienced a clinically meaningful shift in risk classification. Incomplete revascularization, female sex and menopause emerged as potential predictors of subsequent variability in Lp(a). Moreover, our data provide no evidence that mid- to long-term reassessment offers incremental value over early post-ACS remeasurement.
Therefore, given the potential role of Lp(a) in risk stratification and its growing relevance for secondary prevention, an early, targeted repeat Lp(a) measurement may be considered in selected patients after ACS, especially if classified at intermediate risk at baseline.
Author Contributions
Conceptualization, N.G.-A., J.I.L.-V., R.F.-H. and F.C.; methodology, N.G.-A. and F.C.; investigation, N.G.-A., J.I.L.-V., R.F.-H., A.P.-L., A.D.-E., V.G.-R., F.P.-R., Ó.B.-A., F.C.-C., A.D.-F., A.R.-S., J.R.-C., A.P.-C., M.M., F.J.P.-M., J.J.G.-D., M.J.-N. and F.C.; writing-original draft preparation, N.G.-A, R.F.-H., J.I.L.-V., and F.C.; writing—review and editing, N.G.-A., J.I.L.-V., R.F.-H., A.P.-L., A.D.-E., V.G.-R., F.P.-R., Ó.B.-A., F.C.-C., A.D.-F., A.R.-S., J.R.-C., A.P.-C., M.M., F.J.P.-M., J.J.G.-D., M.J.-N. and F.C..; visualization: N.G.-A., J.I.L.-V., R.F.-H., A.P.-L., A.D.-E., V.G.-R., F.P.-R., Ó.B.-A., F.C.-C., A.D.-F., A.R.-S., J.R.-C., A.P.-C., M.M., F.J.P.-M., J.J.G.-D., M.J.-N. and F.C.; supervision, M.J.-N. and F.C All authors have read and agreed to the published version of the manuscript.
Funding
Funded by the European Union through the European Research Council (ERC) under the Horizon Europe programme (ERC-2023-STG-101117469). Views and opinions expressed are however those of the author(s) only and do not necessarily reflect those of the European Union or the European Research Council. Neither the European Union nor the granting authority can be held re-sponsible for them.
Institutional Review Board Statement
The study was conducted in accordance with the Declaration of Helsinki.
Informed Consent Statement
Informed consent was obtained from all subjects involved in the study.
Data Availability Statement
The data presented in this study are available on reasonable request from the corresponding author. The data are not publicly available due to privacy or ethical restrictions.
Conflicts of Interest
The authors declare no conflicts of interest with respect to the current manuscript.
Abbreviations
The following abbreviations are used in this manuscript:
| Lp(a) | Lipoprotein(a) |
| LDL-C | Low-Density Lipoprotein Cholesterol |
| Apo(a) | Apolipoprotein(a) |
| ApoB-100 | Apolipoprotein B-100 |
| ASCVD | Atherosclerotic Cardiovascular Disease |
| ACS | Acute Coronary Syndrome |
| PCI | Percutaneous Coronary Intervention |
| MACE | Major Adverse Cardiovascular Events |
| MI | Myocardial Infarction |
| OR | Odds Ratio |
| CI | Confidence Interval |
| IQR | Interquartile Range |
| hsCRP | High-Sensitivity C-Reactive Protein |
| HR | Hazard Ratio |
| CAD | Coronary Artery Disease |
Appendix A
Appendix A.1 Inclusion and Exclusion Criteria
Inclusion criteria in Cohort A were ACS patients in whom at least two of the following criteria were present: age > 65 years, diabetes mellitus, multivessel CAD, peripheral artery disease, chronic kidney disease, prior stroke (anytime) or prior transient ischemic attack in the last 6 months, prior MI, complex PCI, prior PCI or coronary artery bypass grafting, heart failure, body mass index > 27 kg/m2, anticipated long-term use of an oral anticoagulant, hemoglobin < 11 g/dL, spontaneous bleeding requiring hospitalization or transfusion in the past 12 months, bleeding diathesis, active malignancy, or previous spontaneous intracranial hemorrhage.
Inclusion criteria in Cohort B were patients aged <75 years who were admitted for ACS between 2019 and 2020.
Exclusion criteria were the same in both cohorts and comprised: age < 18 years, low life expectancy (< 1 year) in the judgement of the treating physician, pregnant or breastfeeding women, evidence at coronary angiography of non-significant coronary artery disease (< 30% stenosis in the left main stem or < 50% in other coronary segments).
Appendix B

Table B1.
Baseline characteristics of Cohort A and Cohort B. Continuous variables are reported as mean ± standard deviation when normally distributed, and as median (interquartile range) when non-normally distributed. Categorical variables are reported as n (%).
Table B1.
Baseline characteristics of Cohort A and Cohort B. Continuous variables are reported as mean ± standard deviation when normally distributed, and as median (interquartile range) when non-normally distributed. Categorical variables are reported as n (%).
| Cohort A (N = 143) | Cohort B (N = 92) | |
| Age, years | 67.0 (58.4-74.9) | 56.0 (52.0-60.0) |
| Male sex | 111 (77.6) | 75 (81.5) |
| Diabetes mellitus | 62 (43.7) | 22 (23.9) |
| Hypertension | 99 (69.2) | 49 (53.3) |
| Dyslipidemia | 108 (75.5) | 66 (71.7) |
| Menopausal status | 31 (32) | 13 (17) |
| Body mass index, kg/m² | 27.6 (25.3-30.9) | 28.4 (25.5-31.8) |
| Stroke | 7 (4.9) | 1 (1.1) |
| Transient ischemic attack | 2 (1.4) | 1 (1.1) |
| Peripheral artery disease | 12 (8.4) | 1 (1.1) |
| Prior MI | 40 (28.0) | 10 (10.9) |
| Prior PCI | 39 (27.3) | 4 (4.3) |
| Chronic kidney disease | 106 (74.1) | 12 (13.0) |
| Smoking status (Former or Current) | 103 (73) | 76 (82.6) |
| Alcohol consumption (Former or Current) | 14 (9.8) | 8 (8.7) |
| STEMI presentation | 76 (53.1) | 50 (54.3) |
| Number of treated lesions | 2.0 (1.1) | 1.8 (1.0) |
| Left main treated | 12 (8.4) | 3 (3.3) |
| Number of treated vessels | 1.7 (0.8) | 1.7 (0.9) |
| Incomplete revascularization | 24 (16.8) | 37 (40.2) |
| High-intensity statin | 141 (98.6) | 92 (100) |
| Ezetimibe | 85 (59.4) | 27 (29.3) |
| Total cholesterol, mg/dL | 145.0 (113.5-179.0) | 180.0 (150.5-211.5) |
| HDL-C, mg/dL | 34.0 (31.0-39.0) | 37.5 (32.0-42.5) |
| LDL-C, mg/dL | 83.0 (55.5-114.5) | 112.5 (89.5-138.0) |
| Non–HDL-C, mg/dL | 109.0 (83.0-143.0) | 142.5 (114.0-164.5) |
| Remnant-C, mg/dL | 25.0 (20.0-33.0) | 28.0 (22.0-37.0) |
| TG, mg/dL | 140.0 (110.0-185.5) | 139.0 (108.0-178.0) |
| VLD, mg/dL | 28.0 (22.0-37.1) | 27.8 (21.6-35.6) |
| TC/HDL ratio | 4.3 (3.3-5.1) | 4.7 (4.2-5.5) |
| LDL/ApoB-100 ratio | 1.0 (0.8-1.1) | 1.1 (0.9-1.2) |
| LDL/HDL ratio | 2.4 (1.6-3.2) | 2.9 (2.3-3.6) |
| TG/HDL ratio | 4.3 (2.9-5.5) | 3.7 (2.9-4.9) |
| ApoB-100, mg/dL | 83.0 (67.0-111.5) | 103.5 (83.0-123.0) |
| Baseline Lp(a) | 36.5 (15.6-83.1) | 30.6 (11.3-62.4) |
| Follow-up Lp(a) | 31.8 (10.0-75.0) | 18.2 (5.4-62.1) |
| Glucose, mg/dL | 111.0 (91.5-155.0) | 111.5 (91.0-154.5) |
| HbA1c, % | 6.0 (5.6-6.8) | 5.9 (5.5-6.3) |
| Creatinine, mg/dL | 1.0 (0.9-1.2) | 0.9 (0.8-1.0) |
| eGFR, mL/min/1.73 m² | 75.0 (58.5-85.0) | 89.0 (80.0-90.0) |
| Urea, mg/dL | 43.0 (37.0-56.0) | 36.5 (31.5-45.0) |
| Uric acid, mg/dL | 5.9 (4.8-7.4) | 6.6 (5.2-7.8) |
| MACE | 7 (4.9) | 20 (21.7) |
MI: myocardial infarction; PCI: percutaneous coronary intervention; STEMI: ST-elevation myocardial infarction; HDL-C: high-density lipoprotein cholesterol; LDL-C: low-density lipoprotein cholesterol; TG: triglycerides; VLDL: very-low-density lipoprotein; ApoB-100: apolipoprotein B-100; Lp(a): lipoprotein(a); HbA1c: hemoglobin A1c; eGFR: estimated glomerular filtration rate; MACE: major adverse cardiovascular events.
Table B2.
Patient characteristics according to baseline and follow-up lipoprotein(a) risk category.
| Baseline Lp(a) risk category | Normal (< 30 mg/dL) | Intermediate (30–49 mg/dL) | High (≥ 50 mg/dL) | p-value | ||||||
| N (%) | 109 (46.4) | 41 (17.4) | 85 (36.2) | |||||||
| Follow-up Lp(a) risk category | Normal | Intermediate | High | Normal | Intermediate | High | Normal | Intermediate | High | |
| N (%) | 103 (94.5) | 6 (5.5) | 0 | 17 (41.5) | 16 (39.0) | 8 (19.5) |
4 (4.7) | 9 (10.6) | 72 (84.7) |
|
| Age, years, median (IQR) | 59.8 (12.8) | 68.0 (12.4) | - | 64.5 (15.9) | 61.6 (20.9) | 62.0 (9.3) | 56.5 (10.8) | 67.4 (16.9) | 61.0 (22.9) | 0.59 |
| Male sex, n (%) | 82 (79.6) | 4 (66.7) | - | 14 (82.4) | 15 (93.8) | 6 (75.0) | 3 (75.0) | 6 (66.7) | 56 (77.8) | 0.80 |
| Diabetes mellitus, n (%) | 36 (35.0) | 2 (33.3) | - | 10 (58.8) | 7 (46.7) | 3 (37.5) | 0 | 4 (44.4) | 22 (30.6) | 0.32 |
| Hypertension, n (%) | 59 (57.3) | 5 (83.3) | - | 11 (64.7) | 10 (62.5) | 6 (75.0) | 1 (25.0) | 5 (55.6) | 51 (70.8) | 0.37 |
| Dyslipidemia, n (%) | 73 (70.9) | 5 (83.3) | - | 11 (64.8) | 11 (68.8) | 8 (100) | 3 (75.0) | 7 (77.8) | 56 (77.8) | 0.64 |
| Menopausal status, n (%) | 20 (95.2) | 2 (100) | - | 3 (100) | 1 (100) | 2 (100) | 1 (100) | 3 (100) | 12 (75.0) | 0.56 |
| Body mass index, kg/m2, median (IQR) | 28.1 (5.6) | 29.1 (8.7) | - | 28.4 (6.2) | 28.1 (4.2) | 29.2 (5.9) | 25.5 (3.6) | 26.7 (8.0) | 27.6 (7.2) | 0.74 |
| Stroke, n (%) | 0 | 0 | - | 1 (5.9) | 1 (6.3) | 1 (12.5) | 0 | 0 | 5 (6.9) | 0.20 |
| Transient ischemic attack, n (%) | 1 (1.0) | 0 | - | 1 (5.9) | 0 | 0 | 0 | 0 | 1 (1.4) | 0.84 |
| Peripheral artery disease, n (%) | 4 (3.9) | 0 | - | 0 | 0 | 0 | 0 | 8 (11.1) | 0.30 | |
| Previous MI, n (%) | 22 (21.4) | 1 (16.7) | - | 3 (17.6) | 3 (18.8) | 2 (25.0) | 1 (25.0) | 2 (22.2) | 16 (22.2) | 0.99 |
| Previous PCI, n (%) | 19 (18.4) | 0 | - | 3 (17.6) | 2 (12.5) | 2 (25.0) | 1 (25.0) | 2 (22.2) | 14 (19.4) | 0.95 |
| Chronic kidney disease, n (%) | 50 (48.5) | 5 (83.3) | - | 5 (29.4) | 6 (37.5) | 5 (62.5) | 1 (25.0) | 6 (66.7) | 40 (55.6) | 0.19 |
| Previous smoking, n (%) | 79 (77.5) | 3 (50.0) | - | 14 (82.4) | 14 (93.3) | 6 (75.0) | 4 (100) | 8 (88.9) | 51 (70.8) | 0.3 |
| Previous alcoholism, n (%) | 12 (11.7) | 0 | - | 3 (17.6) | 0 | 1 (12.5) | 0 | 1 (11.1) | 5 (6.9) | 0.6 |
| STEMI, n (%) | 55 (53.4) | 2 (33.3) | - | 14 (82.4) | 8 (50.0) | 6 (75.0) | 2 (50.0) | 4 (44.4) | 35 (48.6) | 0.24 |
| Number of treated lesions, mean (SD) | 1.83 (1.0) | 1.83 (1.0) | - | 1.88 (0.9) | 2.13 (1.3) | 3.13 (1.6) | 2.0 (1.2) | 1.67 (0.7) | 2.03 (1.0) | 0.08 |
| Left main trated, n (%) | 3 (2.9) | 0 | - | 1 (5.9) | 1 (6.3) | 1 (12.5) | 0 | 1 (11.1) | 8 (11.1) | 0.51 |
| Number of treated vessels, mean (SD) | 1.61 (0.8) | 1.5 (0.6) | - | 1.65 (0.9) | 1.63 (0.9) | 2.25 (0.9) | 1.5 (1.0) | 1.56 (0.5) | 1.75 (0.8) | 0.52 |
| Incomplete revacularization, n (%) | 26 (25.2) | 2 (33.3) | - | 4 (23.5) | 1 (6.3) | 6 (75.0) | 4 (100.0) | 2 (22.2) | 16 (22.2) | <0.001 |
| Statin, n (%) | 102 (99.0) | 6 (100.0) | - | 17 (100.0) | 16 (100.0) | 8 (100.0) | 4 (100.0) | 8 (88.9) | 72 (100.0) | 0.09 |
| Ezetimibe, n (%) | 42 (40.8) | 3 (50.0) | - | 8 (47.1) | 10 (62.5) | 4 (50.0) | 2 (50.0) | 4 (44.4) | 39 (54.2) | 0.7 |
| Total cholesterol, median (IQR) | 156.0 (57.0) | 166.5 (62.0) | - | 133.0 (38.0) | 160 (108.0) | 179.0 (50.0) | 207.5 (27.0) | 137.5 (90.0) | 159 (82.0) | 0.58 |
| HDL-C, median (IQR) | 34 (7.0) | 41 (11.0) | - | 31.5 (12.0) | 33 (13.0) | 32.5 (7.0) | 39.0 (11.0) | 32.0 (16.0) | 36.0 (12.0) | 0.24 |
| LDL-C, median (IQR) | 97 (58.0) | 105.5 (66.0) | - | 74.5 (44.0) | 91.0 (93.0) | 113.0 (40.0) | 134.5 (14.0) | 81.0 (84.0) | 92.5 (60.0) | 0.54 |
| Non-HDL-C, median (IQR) | 122.0 (57.0) | 130.0 (66.0) | - | 98.0 (54.0) | 125.0 (101.0) | 141.0 (54.0) | 164.5 (24.0) | 109.5 (85.0) | 118.5 (71.0) | 0.51 |
| Remnant-C, median (IQR) | 25 (12.0) | 31.5 (12.0) | - | 23.5 (8.0) | 30.0 (15.0) | 26.5 (57.0) | 26.0 (17.0) | 27.0 (17.0) | 27.0 (14.0) | 0.99 |
| TG, median (IQR) | 141.0 (78.0) | 118.0 (115.0) | - | 118.5 (37) | 139.0 (81.0) | 153.5 (262.0) | 146.5 (54.0) | 133.5 (43.0) | 146.0 (83.0) | 0.84 |
| VLDL, median (IQR) | 28.2 (15.6) | 23.6 (22.9) | - | 23.7 (7.4) | 27.8 (16.2) | 30.7 (52.4) | 29.3 (10.8) | 26.7 (8.6) | 29.2 (16.5) | 0.84 |
| TC/HDL ratio, median (IQR) | 4.4 (0.9) | 4.2 (1.8) | - | 4.0 (1.5) | 4.6 (2.8) | 4.8 (2.5) | 5.3 (0.7) | 4.5 (2.7) | 4.3 (1.7) | 0.46 |
| LDL/ApoB-100 ratio, median (IQR) | 1.0 (0.2) | 1.1 (0.4) | - | 0.9 (0.1) | 1.0 (0.3) | 1.0 (0.3) | 1.1 (0.2) | 0.9 (0.2) | 1.0 (0.3) | 0.31 |
| LDL/HDL ratio, median (IQR) | 2.6 (1.7) | 2.7 (1.7) | - | 2.2 (1.1) | 2.8 (2.7) | 3.1 (1.5) | 3.5 (0.8) | 2.5 (2.8) | 2.6 (1.4) | 0.64 |
| TG/HDL ratio, median (IQR) | 3.9 (2.7) | 3.2 (3.7) | - | 3.2 (2.1) | 3.7 (2.3) | 4.7 (9.4) | 4.2 (2.0) | 4.4 (2.4) | 4.3 (2.1) | 0.82 |
| ApoB-100, median (IQR) | 87.0 (42.0) | 88.0 (38.0) | - | 75.0 (37.0) | 98.0 (51.0) | 114.5 (33.0) | 120.0 (25.0) | 85.0 (58.0) | 90.5 (49.0) | 0.45 |
| Baseline Lp(a), median (IQR) | 12.3 (13.8) | 23.4 (3.9) | - | 36.6 (9.9) | 39.7 (6.8) | 39.4 (6.4) | 60.4 (33.6) | 60.4 (28.4) | 102.5 (44.4) | <0.001 |
| Follow-up Lp(a), median (IQR) | 8.7 (10.5) | 36.5 (4.4) | - | 16.3 (12.1) | 42.4 (13.3) | 61.8 (28.1) | 19.7 (15.3) | 37.7 (13.8) | 105.5 (55.3) | <0.001 |
| Glucose, median (IQR) | 115.0 (64.0) | 100.0 (37.0) | - | 129.0 (67.0) | 110.0 (74.0) | 159.0 (87.0) | 88.5 (69.0) | 101.0 (124.0) | 111.0 (58) | 0.78 |
| HbA1c, median (IQR) | 6.0 (1.3) | 5.7 (0.9) | - | 6.6 (2.2) | 6.3 (0.7) | 5.9 (1.5) | 5.7 (0.7) | 6.2 (1.5) | 5.9 (0.9) | 0.45 |
| Creatinine, median (IQR) | 0.91 (0.3) | 0.98 (0.3) | - | 0.98 (0.3) | 0.85 (0.3) | 1.0 (0.5) | 0.9 (0.2) | 1.0 (0.3) | 1.0 (0.4) | 0.10 |
| eGFR, median (IQR) | 82.0 (17.0) | 77.0 (16.0) | - | 78.5 (25.0) | 90.0 (18.0) | 78.5 (29.0) | 90.0 (11.0) | 77.0 (30.0) | 77.0 (33.0) | 0.02 |
| Urea, median (IQR) | 41.0 (13.0) | 36.0 (11.0) | - | 40.5 (22.0) | 36.0 (13) | 42.0 (43.0) | 43.5 (32.0) | 47.5 (26.0) | 43.5 (15) | 0.15 |
| Uric acid, median (IQR) | 6.3 (2.9) | 6.3 (1.9) | - | 5.7 (2.8) | 4.8 (2.7) | 7.5 (2.7) | 4.6 (5.4) | 5.7 (2.4) | 6.3 (2.5) | 0.14 |
| MACE, n (%) | 8 (18.2) | 0 | - | 4 (33.3) | 2 (33.3) | 0 | 0 | 0 | 13 (46.4) | 0.15 |
| High Lp(a) variability, n (%) | 59 (57.3) | 6 (100.0) | - | 15 (88.2) | 1 (6.3) | 8 (100.0) | 4 (100.0) | 7 (77.8) | 36 (50.0) | <0.01 |
Lp(a): lipoprotein(a); MI: myocardial infarction; PCI: percutaneous coronary intervention; STEMI: ST-elevation myocardial infarction; HDL-C: high-density lipoprotein cholesterol; LDL-C: low-density lipoprotein cholesterol; TG: triglycerides; VLDL: very-low-density lipoprotein; ApoB-100: apolipoprotein B-100; HbA1c: hemoglobin A1c; eGFR: estimated glomerular filtration rate; MACE: major adverse cardiovascular events.
Table B3.
Reclassification of patients across lipoprotein (a) risk categories and intra-individual variability.
Table B3.
Reclassification of patients across lipoprotein (a) risk categories and intra-individual variability.
| Baseline Lp(a) risk category | Follow-up Lp(a) Risk, N (%) | Lp(a) variability | N (%) |
|---|---|---|---|
| Low-risk (109), Low | Low-risk, 103 (94.5) | High | 59 (57.3) |
| variability 50 (45.9%), High | Low | 44 (42.7) | |
| variability 59 (54.1%) | Intermediate-risk, 6 (5.5) | High | 0 (0.0) |
| Low | 6 (100.0) | ||
| High-risk, 0 (0%) | High | 0 (0.0) | |
| Low | 0 (0.0) | ||
| Intermediate-risk (41), Low | Low-risk, 17 (41.5) | High | 15 (88.2) |
| variability 17 (41.5%), High | Low | 2 (11.8) | |
| variability 24 (58.5%) | Intermediate-risk, 16 (39) | High | 1 (6.3) |
| Low | 15 (93.7) | ||
| High-risk, 8 (19.1) | High | 8 (100) | |
| Low | 0 (0.0) | ||
| High-risk (85), Low | Low-risk, 4 (4.7) | High | 4 (100.0) |
| variability 38 (44.7%), High | Low | 0 (0.0) | |
| variability 47 (55.3%) | Intermediate-risk, 9 (10.6) | High | 7 (77.8) |
| Low | 2 (22.2) | ||
| High-risk, 72 (84.7) | High | 36 (50.0) | |
| Low | 36 (50.0) |
References
- Nordestgaard, B.G.; Langsted, A. Lipoprotein(a) and cardiovascular disease. Lancet 2024, 404, 1255–1264. [Google Scholar] [CrossRef] [PubMed]
- Volgman, A.S.; Koschinsky, M.L.; Mehta, A.; Rosenson, R.S. Genetics and Pathophysiological Mechanisms of Lipoprotein(a)-Associated Cardiovascular Risk. J. Am. Heart Assoc. 2024, 13, e033654. [Google Scholar] [CrossRef] [PubMed]
- Greco, A.; Finocchiaro, S.; Spagnolo, M.; Faro, D.C.; Mauro, M.S.; Raffo, C.; Sangiorgio, G.; Imbesi, A.; Laudani, C.; Mazzone, P.M.; et al. Lipoprotein(a) as a Pharmacological Target: Premises, Promises, and Prospects. Circulation 2025, 151, 400–415. [Google Scholar] [CrossRef]
- Patel, A.P.; Wang, M.; Pirruccello, J.P.; Ellinor, P.T.; Ng, K.; Kathiresan, S.; Khera, A.V. Lp(a) (Lipoprotein[a]) concentrations and incident atherosclerotic cardiovascular disease: New insights from a large national biobank. Arterioscler. Thromb. Vasc. Biol. 2021, 41, 465–474. [Google Scholar] [CrossRef]
- Kim, A.-R.; Ahn, J.-M.; Kang, D.-Y.; Jun, T.J.; Sun, B.J.; Kim, H.J.; Kim, J.B.; Kim, D.-H.; Park, D.-W.; Kim, Y.-H.; et al. Association of Lipoprotein(a) With Severe Degenerative Aortic Valve Stenosis. JACC Asia 2024, 4, 751–760. [Google Scholar] [CrossRef]
- Arsenault, B.J.; Loganath, K.; Girard, A.; Botezatu, S.; Zheng, K.H.; Tzolos, E.; Abdoun, K.; Tastet, L.; Capoulade, R.; Côté, N.; et al. Lipoprotein(a) and calcific aortic valve stenosis progression: A systematic review and meta-analysis. JAMA Cardiol. 2024, 9, 835–842. [Google Scholar] [CrossRef]
- Thomas, P.E.; Vedel-Krogh, S.; Nielsen, S.F.; Nordestgaard, B.G.; Kamstrup, P.R. Lipoprotein(a) and risks of peripheral artery disease, abdominal aortic aneurysm, and major adverse limb events. J. Am. Coll. Cardiol. 2023, 82, 2265–2276. [Google Scholar] [CrossRef]
- Romero-Trevejo, J.L.; Fernández-Romero, L.; Delgado, J.; Muñoz-García, E.; Sánchez-Pérez, A.; Murri, M.; Gutiérrez-Bedmar, M.; Jiménez-Navarro, M.F. Choroidal thickness and granulocyte colony-stimulating factor in tears improve the prediction model for coronary artery disease. Cardiovasc. Diabetol. 2022, 21, 103. [Google Scholar] [CrossRef]
- Langsted, A.; Kamstrup, P.R.; Nordestgaard, B.G. High lipoprotein(a) and high risk of mortality. Eur. Heart J. 2019, 40, 2760–2770. [Google Scholar] [CrossRef]
- Amiri, M.; Raeisi-Dehkordi, H.; Verkaar, A.J.C.F.; Wu, Y.; van Westing, A.C.; Berk, K.A.; Bramer, W.M.; Aune, D.; Voortman, T. Circulating lipoprotein(a) and all-cause and cause-specific mortality: A systematic review and dose–response meta-analysis. Eur. J. Epidemiol. 2023, 38, 485–499. [Google Scholar] [CrossRef]
- Bhatia, H.S.; Wandel, S.; Willeit, P.; Lesogor, A.; Bailey, K.; Ridker, P.M.; Nestel, P.; Simes, J.; Tonkin, A.; Schwartz, G.G.; et al. Independence of lipoprotein(a) and low-density lipoprotein cholesterol–mediated cardiovascular risk: A participant-level meta-analysis. Circulation 2025, 151, 312–321. [Google Scholar] [CrossRef] [PubMed]
- Mach, F.; Koskinas, K.C.; Roeters van Lennep, J.E.; Tokgözoğlu, L.; Badimon, L.; Baigent, C.; Binder, C.J.; Catapano, A.L.; De Backer, G.; Delgado, V.; et al. 2025 focused update of the 2019 ESC/EAS guidelines for the management of dyslipidaemias: lipid modification to reduce cardiovascular risk. Eur. Heart J. 2025, 46, 4359–4378. [Google Scholar] [CrossRef] [PubMed]
- Grundy, S.M.; Stone, N.J.; Bailey, A.L.; Beam, C.; Birtcher, K.K.; Blumenthal, R.S.; Braun, L.T.; de Ferranti, S.; Faiella-Tommasino, J.; Forman, D.E.; et al. 2018 AHA/ACC Guideline on the management of blood cholesterol. Circulation 2019, 139, e1082–e1143. [Google Scholar] [CrossRef] [PubMed]
- Greco, A.; Finocchiaro, S.; Spagnolo, M.; Faro, D.C.; Mauro, M.S.; Raffo, C.; Sangiorgio, G.; Imbesi, A.; Laudani, C.; Mazzone, P.M.; et al. Lipoprotein(a) as a Pharmacological Target: Premises, Promises, and Prospects. Circulation 2025, 151, 400–415. [Google Scholar] [CrossRef]
- OCEAN(a) Investigators. Olpasiran Trials of Cardiovascular Events and Lipoprotein(a) Reduction (OCEAN(a)) - Outcomes Trial. ClinicalTrials.gov 2025, NCT05581303. Sponsor: Amgen. Available online: https://clinicaltrials.gov/ct2/show/NCT05581303 (accessed on 27 January 2026).
- Cho, L.; Nicholls, S.J.; Nordestgaard, B.G.; Landmesser, U.; Tsimikas, S.; Blaha, M.J.; Leitersdorf, E.; Lincoff, A.M.; Lesogor, A.; Manning, B.; et al. Design and rationale of Lp(a)HORIZON trial: assessing the effect of lipoprotein(a) lowering with pelacarsen on major cardiovascular events in patients with CVD and elevated Lp(a). Am. Heart J. 2025, 287, 1–9. [Google Scholar] [CrossRef]
- Volgman, A.S.; Navar, A.M.; Virani, S.S.; Michos, E.D.; Blaha, M.J.; Martin, S.S.; Ballantyne, C.M.; Virani, S.; Khera, A.V.; Orkaby, A.R.; et al. Genetics and Pathophysiological Mechanisms of Lipoprotein(a)-Associated Cardiovascular Risk. J. Am. Heart Assoc. 2024, 13, e033654. [Google Scholar] [CrossRef]
- Jiménez-Salva, M.; Carmona-Segovia, A.; Molina-Ramos, A.I.; García-Rodríguez, L.; Puyol-Ruiz, F.; Doncel-Abad, V.; Romero-Cuevas, M.; Serrano, A.; Muñoz-García, A.; Flores-López, M.; et al. Older adults with acute coronary syndrome: The impact of frailty and nutritional status on in-hospital complications. Eur. J. Cardiovasc. Nurs. 2025, zvaf006. [Google Scholar] [CrossRef]
- Anagnostis, P.; Antza, C.; Trakatelli, C.; Lambrinoudaki, I.; Goulis, D.G.; Kotsis, V. The effect of menopause on lipoprotein(a) concentrations: A systematic review and meta-analysis. Maturitas 2022, 164, 1–11. [Google Scholar] [CrossRef]
- Jenner, J.L.; Ordovas, J.M.; Lamon-Fava, S.; Schaefer, M.M.; Wilson, P.W.; Castelli, W.P.; Schaefer, E.J. Effects of age, sex, and menopausal status on plasma lipoprotein(a) levels: The Framingham Offspring Study. Circulation 1993, 87, 1135–1141. [Google Scholar] [CrossRef]
- Shlipak, M.G.; Kooperberg, C.; Psaty, B.M.; Furberg, C.D.; Siscovick, D.S.; Rutan, G.H.; Cornoni-Huntley, J.; Robbins, J.A.; Harris, T.B.; Newman, A.B.; et al. Estrogen and progestin, lipoprotein(a), and the risk of recurrent coronary heart disease events after menopause. JAMA 2000, 283, 1845–1852. [Google Scholar] [CrossRef]
- Nakajima, K.; Hata, Y. Intraindividual Variations in Lipoprotein(a) Levels and Factors Related to These Changes. J. Atheroscler. Thromb. 1996, 2, 96–106. [Google Scholar] [CrossRef]
- Trinder, M.; Paruchuri, K.; Haidermota, S.; Bernardo, R.; Zekavat, S.M.; Gilliland, T.; Januzzi, J.L., Jr.; Natarajan, P. Repeat Measures of Lipoprotein(a) Molar Concentration and Cardiovascular Risk. J. Am. Coll. Cardiol. 2022, 79, 617–628. [Google Scholar] [CrossRef]
- Deshotels, M.R.; Sun, C.; Nambi, V.; Virani, S.S.; Matsushita, K.; Yu, B.; Ballantyne, C.M.; Hoogeveen, R.C. Temporal Trends in Lipoprotein(a) Concentrations: The Atherosclerosis Risk in Communities Study. J. Am. Heart Assoc. 2022, 11, e026762. [Google Scholar] [CrossRef]
- Awad, K.; Mahmoud, A.K.; Abbas, M.T.; Alsidawi, S.; Ayoub, C.; Arsanjani, R.; Farina, J.M. Intra-individual variability in lipoprotein(a) levels: findings from a large academic health system population. Eur. J. Prev. Cardiol. 2025, 32, 716–721. [Google Scholar] [CrossRef]
- Joo, H.J.; Yun, S.G.; Park, J.H.; Hong, S.J.; Yu, C.W.; Shin, S.Y.; Kim, E.J. Predictors of lipoprotein(a) variability in clinical practice and their impact on cardiovascular risk. Lipids Health Dis. 2025, 24, 250. [Google Scholar] [CrossRef]
- Sung, D.E.; Lee, M.Y.; Kwon, M.J.; Sung, K.C. Longitudinal changes and borderline reclassification of Lipoprotein(a) compared with conventional lipids in over 230,000 adults. Atherosclerosis. 2025, 410, 120524. [Google Scholar] [CrossRef] [PubMed]
- Harb, T.; Ziogos, E.; Blumenthal, R.S.; Gerstenblith, G.; Leucker, T.M. Intra-individual variability in lipoprotein(a): the value of a repeat measure for reclassifying individuals at intermediate risk. Eur. Heart J. Open. 2024, 4, oeae064. [Google Scholar] [CrossRef] [PubMed]
- Zhang, S.S.; Hu, W.Y.; Li, Y.J.; Yu, J.; Sang, S.; Alsalman, Z.M.; Xie, D.Q. Lipoprotein(a) variability is associated with mean follow-up C-reactive protein in patients with coronary artery disease following percutaneous coronary intervention. World J. Clin. Cases. 2022, 10, 12909–12919. [Google Scholar] [CrossRef]
- Matta, M.G.; Schreier, L.; Lavalle-Cobo, A.; Garcia-Zamora, S.; Ferraresi, A.; Madsen, A.; Bellini, S.; Ramos, G.; Roubicek, P.; Corral, P. Temporal variability of Lp(a) in clinically stable patients: implications for cardiovascular risk assessment. Med. Clin. (Barc). 2024, 163, 436–441. [Google Scholar] [CrossRef] [PubMed]
- Gaba, P.; Rosenson, R.S.; López, J.A.G.; Watts, G.F.; Leucker, T.M.; Kuder, J.F.; Im, K.; Kassahun, H.; Wang, H.; Wu, Y.; et al. Intraindividual variability in serial lipoprotein(a) concentrations among placebo-treated patients in the OCEAN(a)-DOSE trial. J. Am. Coll. Cardiol. 2025, 85, 550–553. [Google Scholar] [CrossRef]
- Ziogos, E.; Vavuranakis, M.A.; Harb, T.; Foran, P.L.; Blaha, M.J.; Jones, S.R.; Lai, S.; Gerstenblith, G.; Leucker, T.M. Lipoprotein(a) concentrations in acute myocardial infarction patients are not indicative of levels at six month follow-up. Eur. Heart J. Open 2023, 3, oead035. [Google Scholar] [CrossRef]
- Saeki, Y.; Sawaguchi, J.; Akita, S.; Takamura, T.A.; Fujibayashi, K.; Wakasa, M.; Akao, H.; Kitayama, M.; Kawai, Y.; Kajinami, K. Initial decrease in the lipoprotein(a) level is a novel prognostic biomarker in patients with acute coronary syndrome. World J. Cardiol. 2024, 16, 329–338. [Google Scholar] [CrossRef]
- Vavuranakis, M.A.; Jones, S.R.; Ziogos, E.; Blaha, M.J.; Williams, M.S.; Foran, P.; Schindler, T.H.; Lai, S.; Schulman, S.P.; Gerstenblith, G.; et al. The trajectory of lipoprotein(a) during the peri- and early postinfarction period and the impact of proprotein convertase subtilisin/kexin type 9 inhibition. Am. J. Cardiol. 2022, 171, 1–6. [Google Scholar] [CrossRef]
- Sourij, C.; Aziz, F.; Krappinger, S.; Praschk, A.; Metzner, T.; Kojzar, H.; Zirlik, A.; Stojakovic, T.; Pätzold, D.; von Lewinski, D.; et al. Changes in lipoprotein(a) levels in people after ST elevation myocardial infarction—The STEMI-Lipids Study. Int. J. Mol. Sci. 2023, 24, 15531. [Google Scholar] [CrossRef] [PubMed]
- Kronenberg, F.; Mora, S.; Stroes, E.S.G.; Ference, B.A.; Arsenault, B.J.; Berglund, L.; Dweck, M.R.; Koschinsky, M.; Lambert, G.; Mach, F.; et al. Lipoprotein(a) in atherosclerotic cardiovascular disease and aortic stenosis: A European Atherosclerosis Society consensus statement. Eur. Heart J. 2022, 43, 3925–3946. [Google Scholar] [CrossRef] [PubMed]
- Tsimikas, S.; Marcovina, S.M. Ancestry, lipoprotein(a), and cardiovascular risk thresholds: JACC Review Topic of the Week. J. Am. Coll. Cardiol. 2022, 80, 934–946. [Google Scholar] [CrossRef]
- Dzobo, K.E.; Kraaijenhof, J.M.; Stroes, E.S.G.; Nurmohamed, N.S.; Kroon, J. Lipoprotein(a): An underestimated inflammatory mastermind. Atherosclerosis 2022, 349, 101–109. [Google Scholar] [CrossRef]
- Mooser, V.; Berger, M.M.; Tappy, L.; Cayeux, C.; Marcovina, S.M.; Darioli, R.; Nicod, P.; Chioléro, R. Major reduction in plasma Lp(a) levels during sepsis and burns. Arterioscler. Thromb. Vasc. Biol. 2000, 20, 1137–1142. [Google Scholar] [CrossRef]
- Willeit, P.; Ridker, P.M.; Nestel, P.J.; Simes, J.; Tonkin, A.M.; Pedersen, T.R.; Schwartz, G.G.; Olsson, A.G.; Colhoun, H.M.; Kronenberg, F.; et al. Baseline and on-statin treatment lipoprotein(a) levels for prediction of cardiovascular events: Individual patient-data meta-analysis of statin outcome trials. Lancet. 2018, 392, 1311–1320. [Google Scholar] [CrossRef] [PubMed]
- Wang, Z.; Xiao, S.; Liu, N. Association of lipoprotein(a) with coronary severity in patients with new-onset acute myocardial infarction: A large cross-sectional study. Clin. Chim. Acta 2023, 540, 117220. [Google Scholar] [CrossRef]
Figure 1.
Baseline-to-follow-up lipoprotein(a) trajectories in patients who changed risk category. Each line represents a single patient, and the color indicates the category to which the patient transitions. Dashed horizontal lines indicate lipoprotein(a) risk-category thresholds.
Figure 1.
Baseline-to-follow-up lipoprotein(a) trajectories in patients who changed risk category. Each line represents a single patient, and the color indicates the category to which the patient transitions. Dashed horizontal lines indicate lipoprotein(a) risk-category thresholds.
Figure 2.
Lipoprotein (a) risk reclassification in high-variability and low-variability patients by baseline risk category.
Figure 2.
Lipoprotein (a) risk reclassification in high-variability and low-variability patients by baseline risk category.
Figure 3.
Absolute and relative variability of lipoprotein(a) at 4-month and 5-year follow-up. Box plots show the distribution of absolute (A) and relative (B) lipoprotein(a) variability measured at 4 months and 5 years of follow-up. The central line represents the median, boxes indicate the interquartile range, and whiskers represent the 1.5 interquartile range. Individual points represent outliers.
Figure 4.
Reclassification across follow-up time points: (a) baseline vs. 4 months; (b) 4 months vs. 8 months; (c) baseline vs. 5 years. The horizontal axis (x-axis) shows Lp(a) category at the initial time point, whereas the vertical axis (y-axis) shows Lp(a) category at the corresponding follow-up assessment.
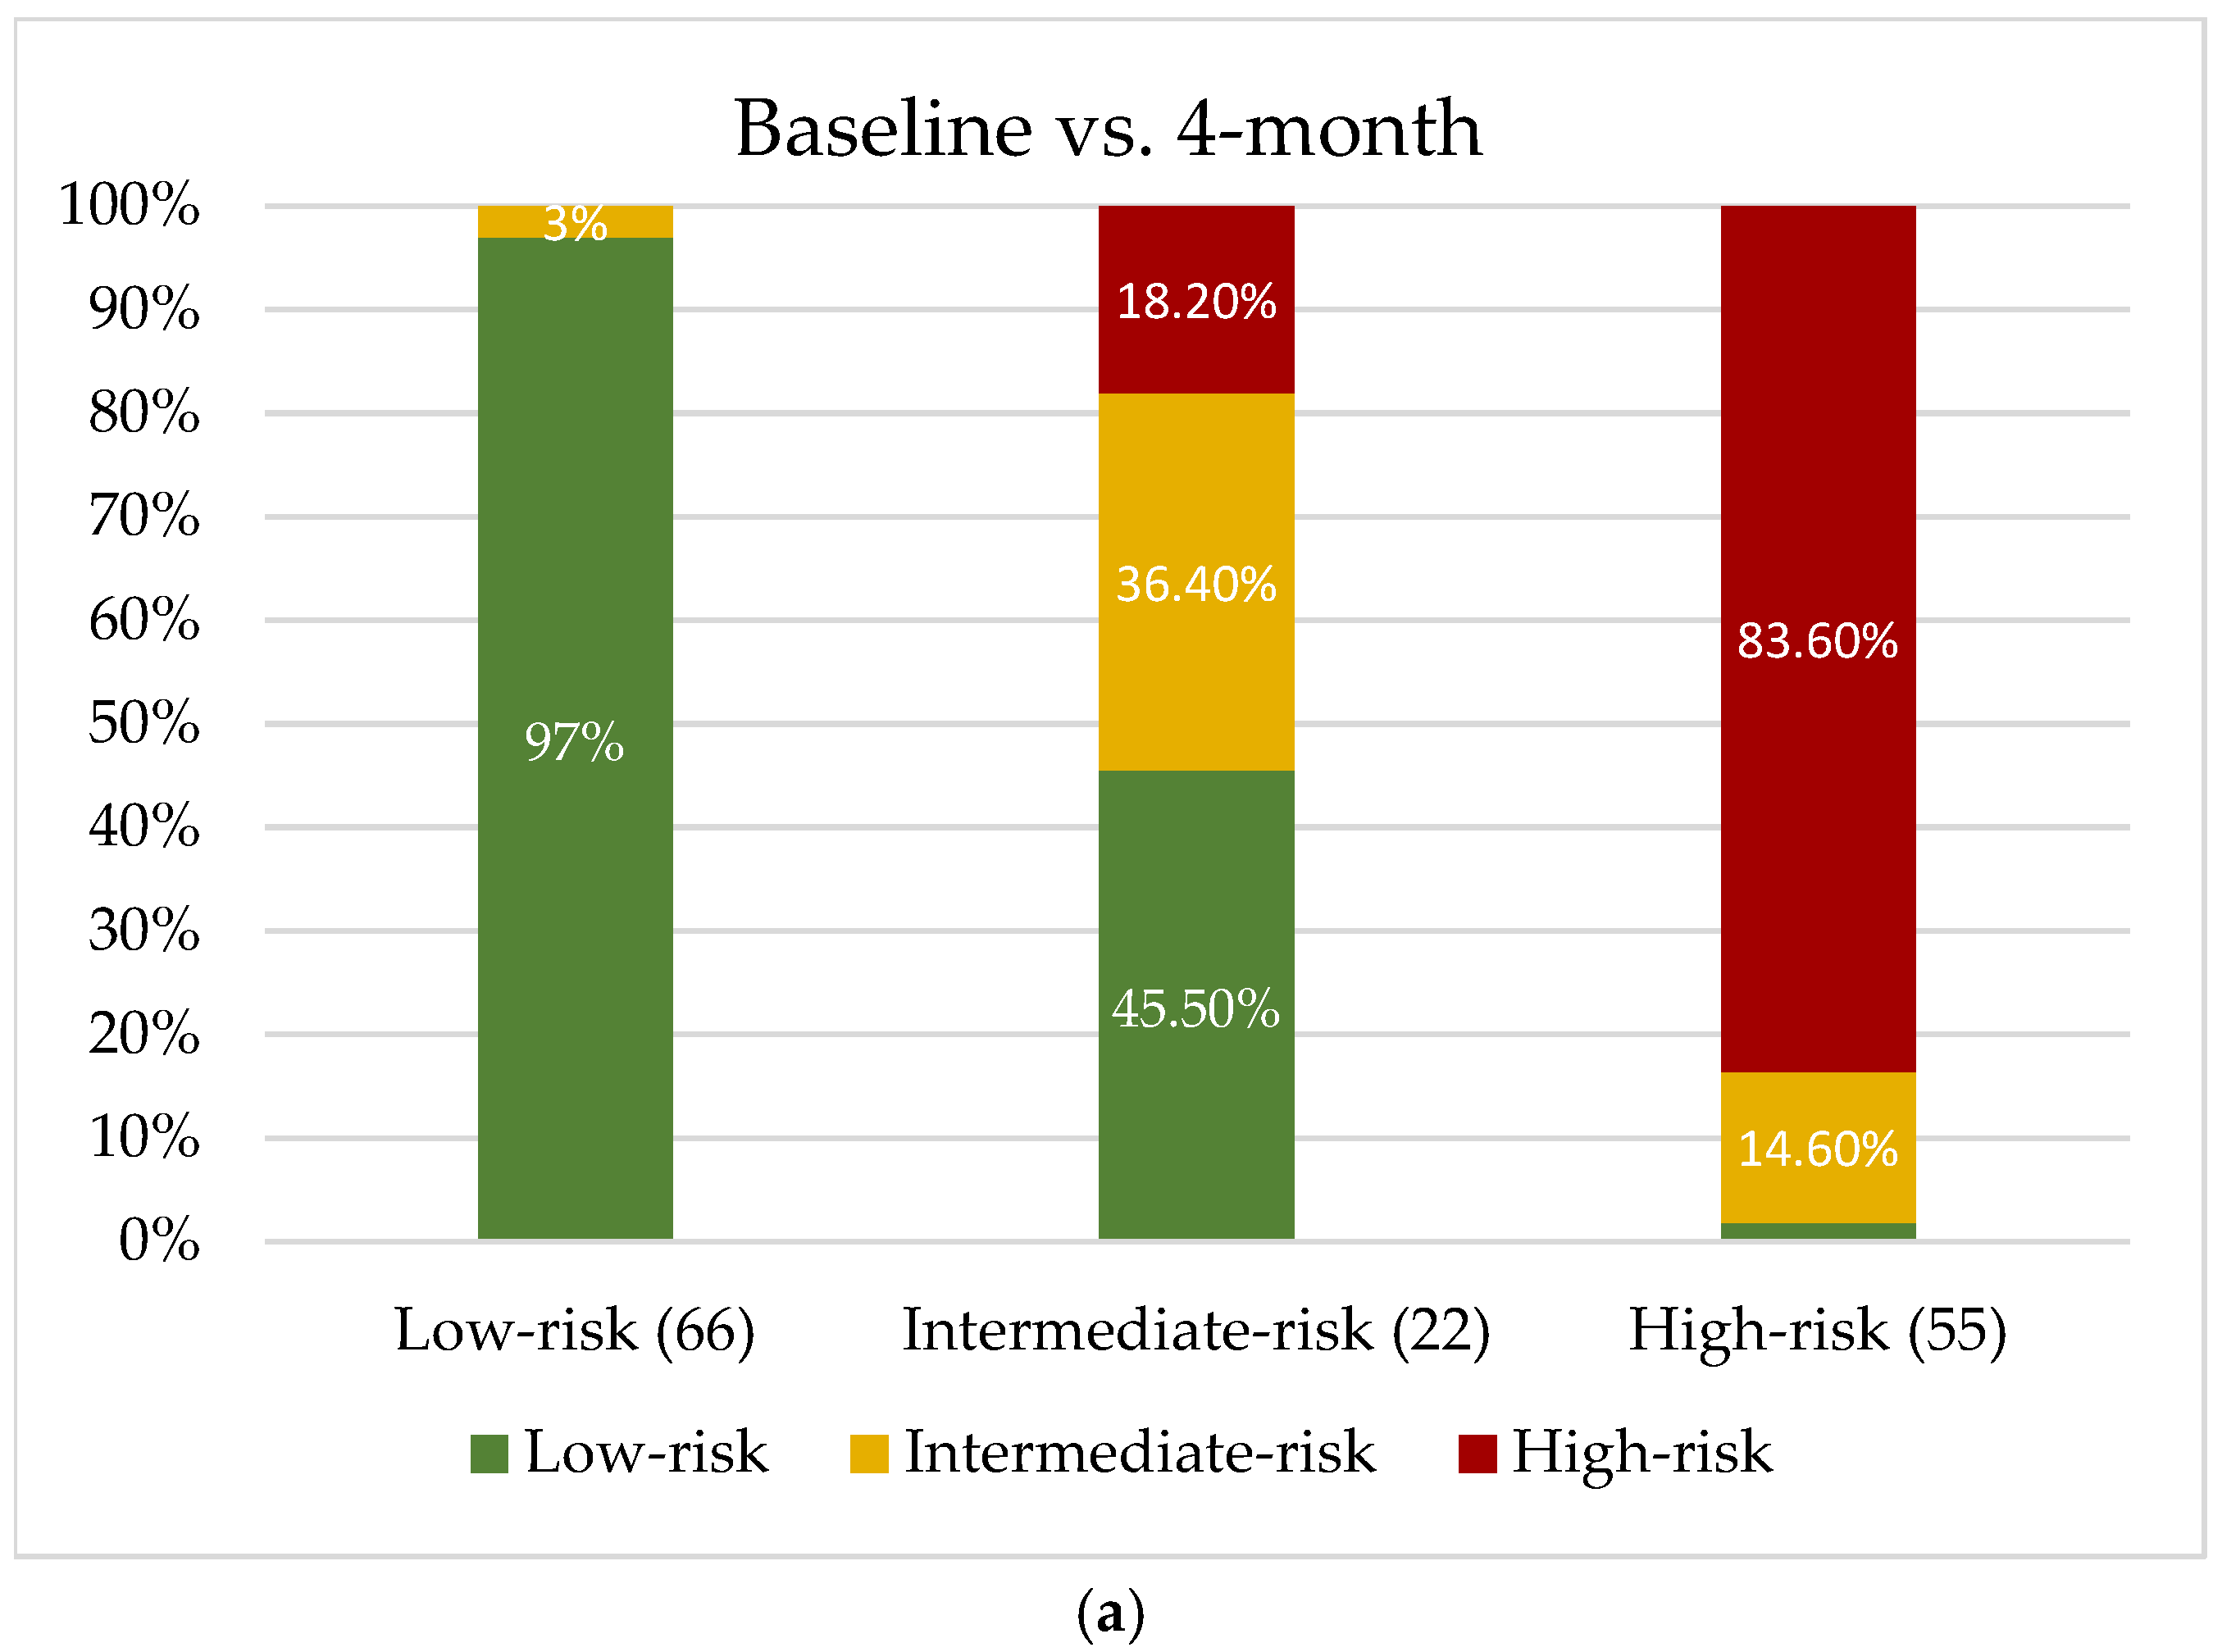
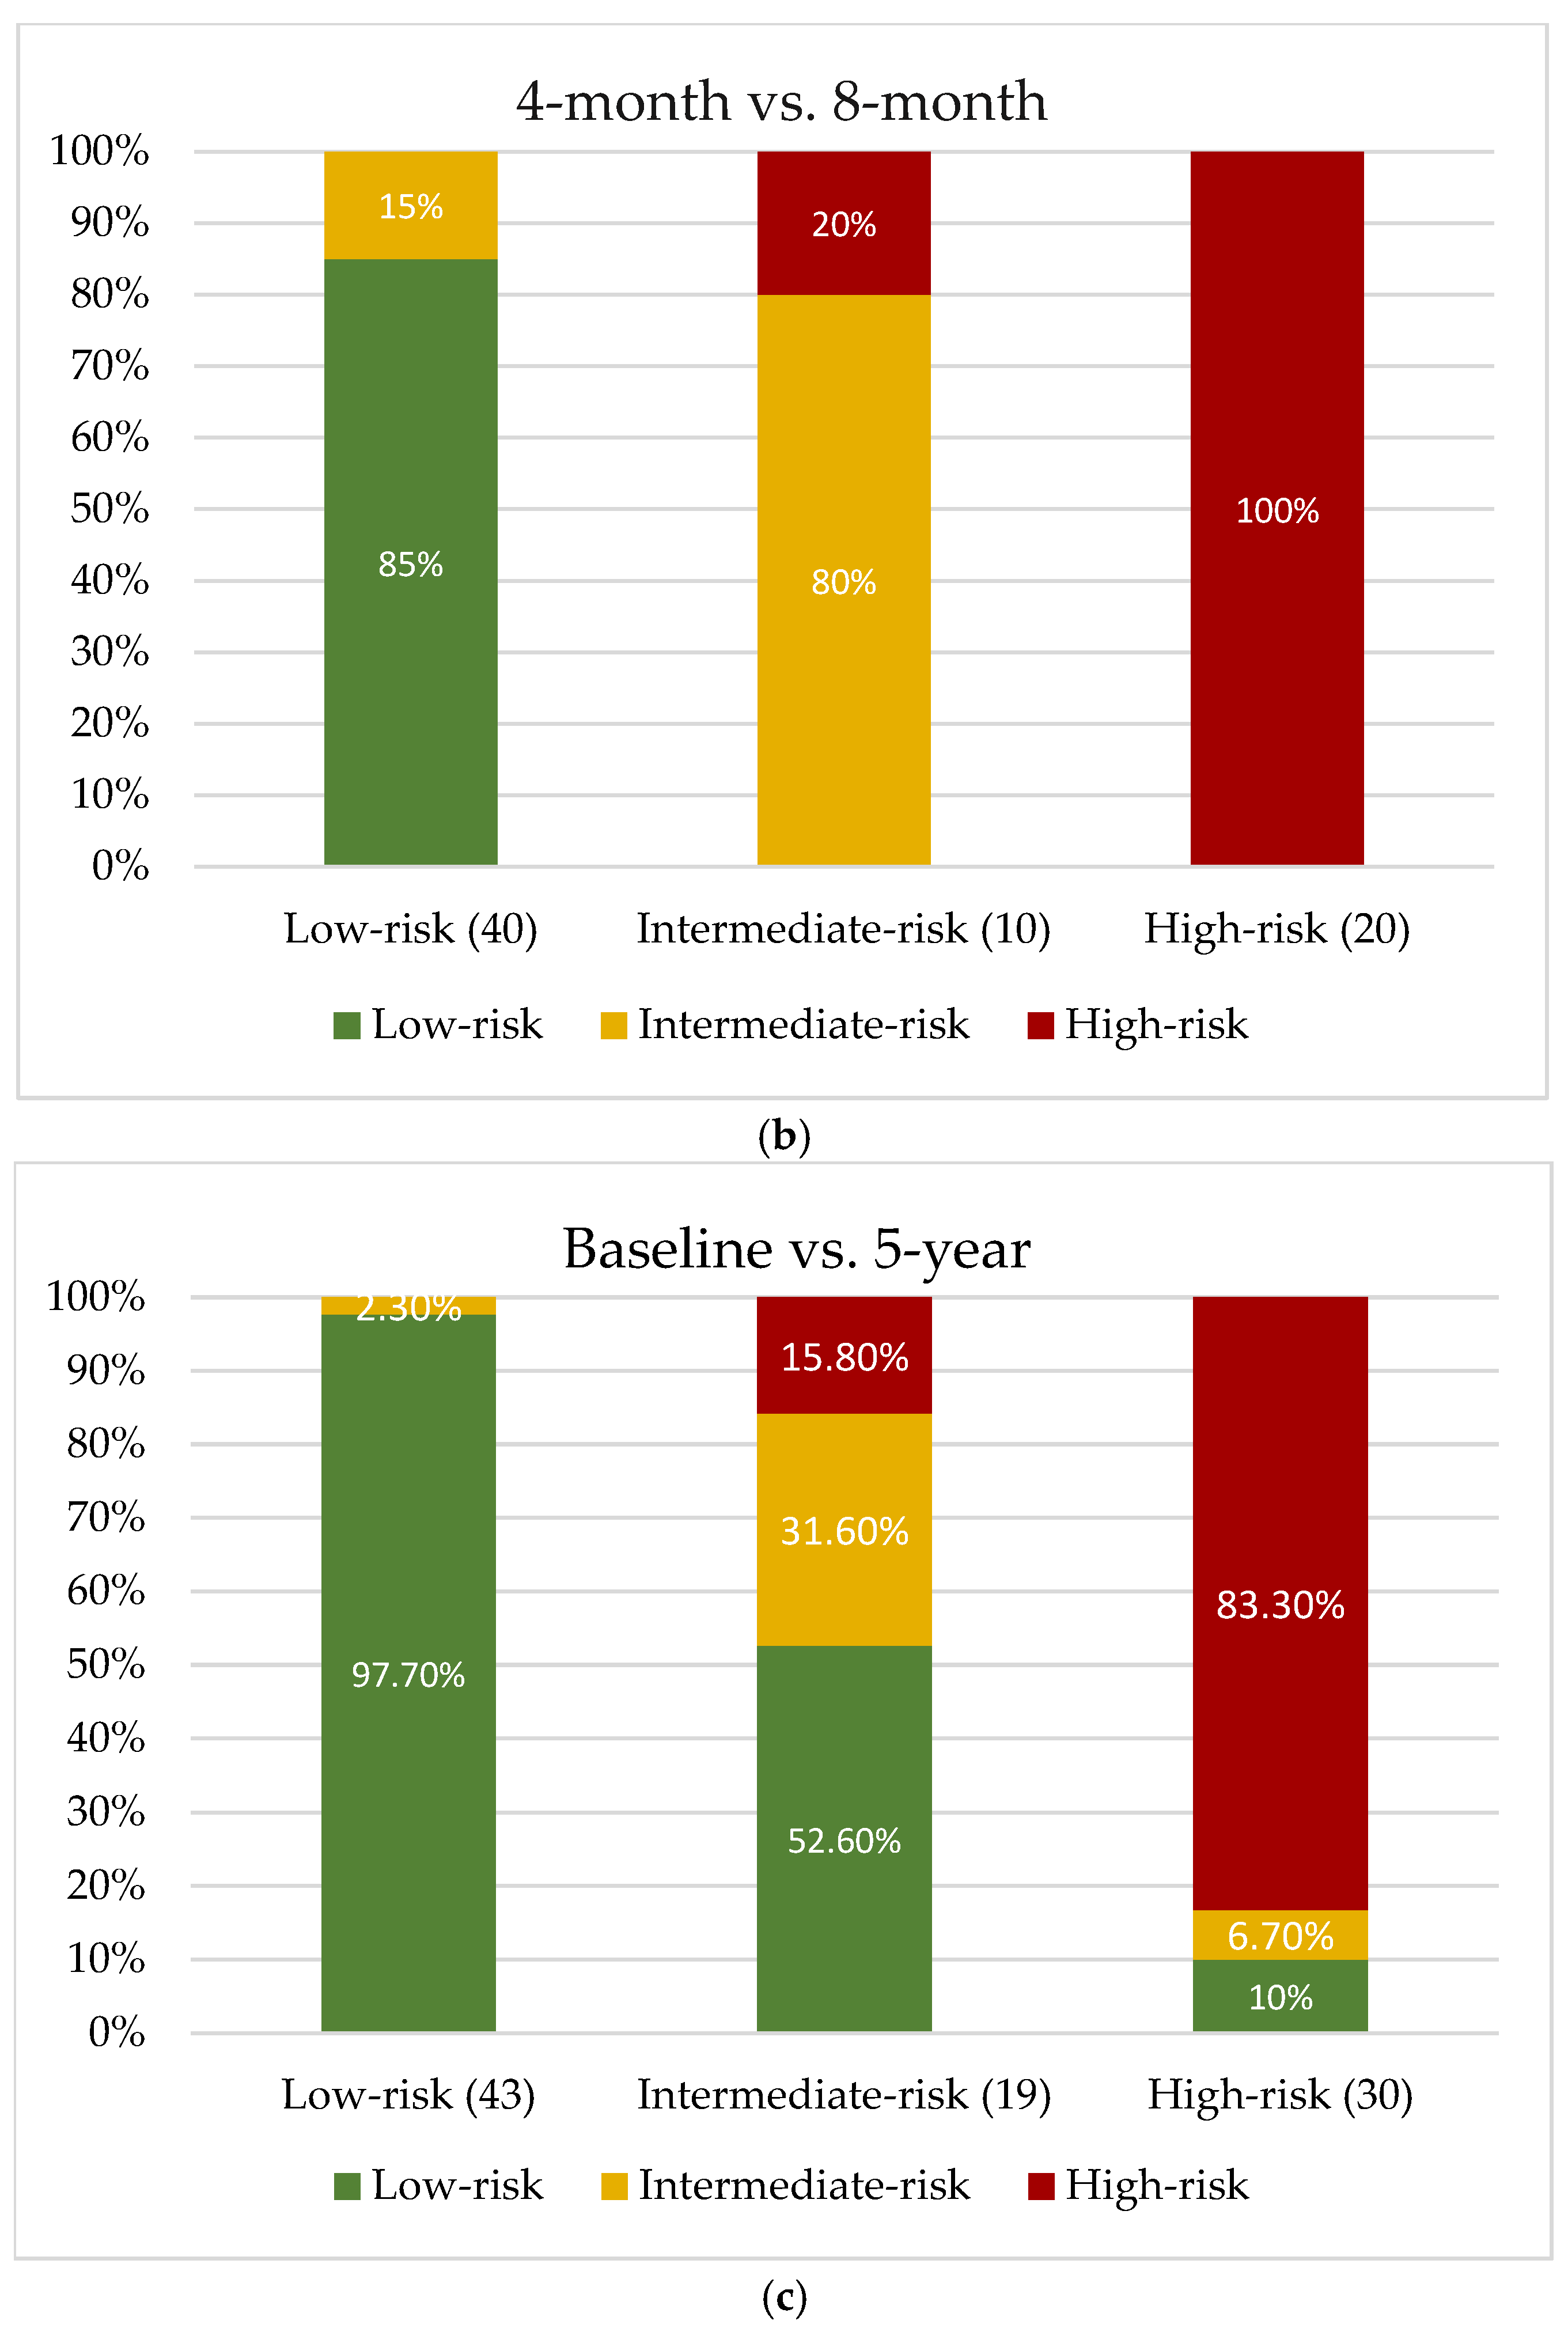
Table 1.
Baseline characteristics. Continuous variables are reported as mean ± standard deviation when normally distributed, and as median (interquartile range) when non-normally distributed. Categorical variables are reported as n (%).
Table 1.
Baseline characteristics. Continuous variables are reported as mean ± standard deviation when normally distributed, and as median (interquartile range) when non-normally distributed. Categorical variables are reported as n (%).
| Characteristic | N = 235 |
|---|---|
| Age, years | 61.1 (55.0-70.6) |
| Male sex | 186 (79.1) |
| Diabetes mellitus | 84 (35.7) |
| Hypertension | 148 (63.0) |
| Dyslipidemia | 174 (74.0) |
| Menopausal status | 44 (89.8) |
| Body mass index, kg/m² | 27.9 (25.3-31.0) |
| Stroke | 8 (3.4) |
| Transient ischemic attack | 3 (1.3) |
| Peripheral artery disease | 13 (5.5) |
| Prior MI | 50 (21.3) |
| Prior PCI | 43 (18.3) |
| Chronic kidney disease | 118 (50.2) |
| Smoking status (Never / Former / Current) | 54 (23) / 90 (38.3) / 89 (37.9) |
| Alcohol consumption (Never / Former / Current) | 213 (90.6) / 17 (7.2) / 5 (2.1) |
| STEMI presentation | 126 (53.6) |
| Number of treated lesions | 2.0 (1.1) |
| Left main treated | 15 (6.4) |
| Number of treated vessels | 1.7 (0.8) |
| Incomplete revascularization | 61 (26) |
| High-intensity statin | 233 (99.1) |
| Ezetimibe | 112 (47.7) |
| Total cholesterol, mg/dL | 158.0 (124.5-191.0) |
| HDL-C, mg/dL | 34.5 (31.0-40.0) |
| LDL-C, mg/dL | 93.0 (61.8-123.3) |
| Non–HDL-C, mg/dL | 121.0 (91.8-156.0) |
| Remnant-C, mg/dL | 26.0 (21.0-33.0) |
| TG, mg/dL | 139.0 (108.0-183.0) |
| VLDL, mg/dL | 27.8 (21.6-36.6) |
| TC/HDL ratio | 4.4 (3.5-5.4) |
| LDL/ApoB-100 ratio | 1.0 (0.9-1.1) |
| LDL/HDL ratio | 2.7 (1.8-3.5) |
| TG/HDL ratio | 4.1 (2.9-5.3) |
| ApoB-100, mg/dL | 90.0 (69.8-115.0) |
| Baseline Lp(a) | 34.7 (14.8-79.0) |
| Glucose, mg/dL | 111.0 (91.0-155.3) |
| HbA1c, % | 6.0 (5.6-6.7) |
| Creatinine, mg/dL | 0.9 (0.8-1.1) |
| eGFR, mL/min/1.73 m² | 80.0 (67.5-90.0) |
| Urea, mg/dL | 41.0 (35.0-50.0) |
| Uric acid, mg/dL | 6.1 (4.8-7.5) |
| MACE | 27 (11.5) |
MI: myocardial infarction; PCI: percutaneous coronary intervention; STEMI: ST-elevation myocardial infarction; HDL-C: high-density lipoprotein cholesterol; LDL-C: low-density lipoprotein cholesterol; TG: triglycerides; VLDL: very-low-density lipoprotein; ApoB-100: apolipoprotein B-100; Lp(a): lipoprotein(a); HbA1c: hemoglobin A1c; eGFR: estimated glomerular filtration rate; MACE: major adverse cardiovascular events.
Table 2.
Clinical characteristics of patients between high and low lipoprotein(a) variability. *Age-adjusted.
Table 2.
Clinical characteristics of patients between high and low lipoprotein(a) variability. *Age-adjusted.
| Characteristic | High Lp(a) Variability (N = 136) | Low Lp(a) Variability (N = 99) | Adjusted P Value |
|---|---|---|---|
| Age, years | 61.4 (11.1) | 61.9 (11.5) | 0.720 |
| Male sex | 103 (75.7) | 83 (83.8) | 0.131 |
| Diabetes mellitus | 53 (39.0) | 31 (31.6) | 0.248 |
| Hypertension | 85 (62.5) | 63 (63.6) | 0.859 |
| Dyslipidemia | 104 (76.5) | 70 (70.7) | 0.320 |
| Menopausal status* | 32 (23.5) | 12 (12.1) | 0.034 |
| Body mass index, kg/m² | 28.1 (5.8) | 27.8 (6.2) | 0.795 |
| Stroke | 4 (2.9) | 4 (4.0) | 0.646 |
| Transient ischemic attack | 1 (0.7) | 2 (2.0) | 0.386 |
| Peripheral artery disease | 5 (3.7) | 8 (8.1) | 0.145 |
| Prior MI | 30 (22.1) | 20 (20.2) | 0.731 |
| Prior PCI | 25 (18.4) | 18 (18.2) | 0.969 |
| Chronic kidney disease | 69 (50.7) | 49 (49.5) | 0.851 |
| Smoking status (Never / Former / Current) | 34 / 45 / 56 | 20 / 45 / 33 | 0.150 |
| Alcohol consumption (Never / Former / Current) | 124 / 10 / 2 | 89 / 7 / 3 | 0.715 |
| STEMI presentation | 76 (55.9) | 50 (50.5) | 0.414 |
| Number of treated lesions | 2 (2) | 2 (2) | 0.628 |
| Left main treated | 8 (5.9) | 7 (7.1) | 0.713 |
| Number of treated vessels | 1.5 (1) | 1 (1) | 0.596 |
| Incomplete revascularization | 43 (31.6) | 18 (18.2) | 0.020 |
| High-intensity statin | 135 (99.3) | 98 (99.0) | 0.821 |
| Ezetimibe | 67 (49.3) | 45 (45.5) | 0.564 |
| Total cholesterol, mg/dL | 160.0 (61.0) | 155.5 (73.0) | 0.236 |
| HDL-C, mg/dL | 35.0 (11.0) | 34.5 (9.0) | 0.955 |
| LDL-C, mg/dL | 100.0 (57.0) | 90.0 (64.0) | 0.279 |
| Non–HDL-C, mg/dL | 128.0 (45.8) | 120.3 (44.9) | 0.203 |
| Remnant-C, mg/dL | 27 (13) | 26 (12) | 0.113 |
| TG, mg/dL | 147 (80) | 134 (58) | 0.087 |
| VLDL, mg/dL | 29.4 (15.9) | 26.8 (11.6) | 0.087 |
| TC/HDL ratio | 4.6 (2.2) | 4.3 (1.4) | 0.110 |
| LDL/ApoB-100 ratio | 0.98 (0.3) | 0.99 (0.2) | 0.501 |
| LDL/HDL ratio | 2.8 (1.9) | 2.5 (1.3) | 0.135 |
| TG/HDL ratio | 4.4 (2.4) | 3.7 (2.5) | 0.085 |
| ApoB-100, mg/dL | 94 (45) | 86.5 (44) | 0.078 |
| Baseline Lp(a) | 30.95 (51.4) | 38.1 (65.1) | 0.930 |
| Follow-up Lp(a) | 18.7 (64.0) | 32.9 (61.7) | 0.180 |
| Glucose, mg/dL | 116 (73) | 109.5 (53) | 0.302 |
| HbA1c, % | 5.9 (1.4) | 6.0 (0.9) | 0.895 |
| Creatinine, mg/dL | 0.96 (0.3) | 0.95 (0.3) | 0.969 |
| eGFR, mL/min/1.73 m² | 80 (23) | 82 (22) | 0.719 |
| Urea, mg/dL | 42 (18) | 40 (14) | 0.215 |
| Uric acid, mg/dL | 6.1 (2.9) | 6.2 (2.9) | 0.375 |
| MACE | 15 (11.0) | 12 (12.1) | 0.616 |
MI: myocardial infarction; PCI: percutaneous coronary intervention; STEMI: ST-elevation myocardial infarction; HDL-C: high-density lipoprotein cholesterol; LDL-C: low-density lipoprotein cholesterol; TG: triglycerides; VLDL: very-low-density lipoprotein; ApoB-100: apolipoprotein B-100; Lp(a): lipoprotein(a); HbA1c: hemoglobin A1c; eGFR: estimated glomerular filtration rate; MACE: major adverse cardiovascular events.
Table 4.
Univariable and multivariable logistic regression analysis of independently predictors of high lipoprotein(a) variability. *Age-adjusted.
Table 4.
Univariable and multivariable logistic regression analysis of independently predictors of high lipoprotein(a) variability. *Age-adjusted.
| Univariable | Multivariable | |||
|---|---|---|---|---|
| OR (CI 95%) | P | OR (CI 95%) | P | |
| Age, years | 0.99 (0.97-1.02) | 0.72 | 1.00 (0.98-1.03) | 0.97 |
| Female sex | 1.67 (0.85-3.22) | 0.13 | 1.92 (0.93-4.00) | 0.08 |
| Diabetes mellitus | 1.38 (0.80-2.39) | 0.25 | ||
| Hypertension | 0.95 (0.56-1.63) | 0.86 | ||
| Dyslipidemia | 1.35 (0.75-2.42) | 0.32 | ||
| Menopausal status* | 10.67 (1.10-105.30) | 0.04 | 11.18 (0.79-157.58) | 0.07 |
| Body mass index | 1.01 (0.95-1.07) | 0.87 | ||
| Stroke | 0.72 (0.18-2.95) | 0.65 | ||
| Transient ischemic attack | 0.36 (0.03-4.12) | 0.41 | ||
| Peripheral artery disease | 0.43 (0.14-1.37) | 0.15 | 0.44 (0.12-1.61) | 0.21 |
| Prior MI | 1.12 (0.59-2.11) | 0.73 | ||
| Prior PCI | 1.01 (0.52-1.98) | 0.97 | ||
| Chronic kidney disease | 1.05 (0.63-1.76) | 0.85 | ||
| Previous smoking | 1.05 (0.75-1.48) | 0.77 | ||
| Previous alcoholism | 0.82 (0.42-1.62) | 0.57 | ||
| STEMI presentation | 1.24 (0.74-2.09) | 0.41 | ||
| Number of treated lesions | 1.06 (0.83-1.36) | 0.64 | ||
| Left main treated | 0.82 (0.29-2.35) | 0.71 | ||
| Number of treated vessels | 1.07 (0.78-1.49) | 0.67 | ||
| Incomplete revascularization | 2.08 (1.11-3.89) | 0.02 | 2.22 (1.14-4.31) | 0.02 |
| Statin | 1.38 (0.08-22.29) | 0.82 | ||
| Ezetimibe | 1.16 (0.69-1.96) | 0.56 | ||
| Total cholesterol | 1.00 (0.99-1.01) | 0.22 | ||
| HDL-C | 0.99 (0.97-1.03) | 0.89 | ||
| LDL-C | 1.00 (0.99-1.01) | 0.35 | ||
| Non-HDL-C | 1.00 (0.99-1.01) | 0.20 | ||
| Remnant-C | 1.01 (0.99-1.03) | 0.31 | ||
| TG | 1.00 (0.99-1.01) | 0.21 | ||
| VLDL | 1.01 (0.99-1.03) | 0.21 | ||
| TC/HDL ratio | 1.13 (0.94-1.36) | 0.18 | ||
| LDL/ApoB-100 ratio | 0.55 (0.17-1.73) | 0.30 | ||
| LDL/HDL ratio | 1.18 (0.94-1.48) | 0.15 | 0.98 (0.66-1.45) | 0.98 |
| TG/HDL ratio | 1.08 (0.97-1.20) | 0.17 | ||
| ApoB-100 | 1.01 (0.99-1.02) | 0.07 | 1.01 (0.99-1.02) | 0.25 |
| Baseline Lp(a) | 1.00 (0.993-1.005) | 0.80 | ||
| Follow-up Lp(a) | 1.00 (0.994-1.004) | 0.63 | ||
| Glucose | 1.00 (0.99-1.01) | 0.15 | 1.00 (0.99-1.01) | 0.36 |
| HbA1c | 1.02 (0.83-1.24) | 0.89 | ||
| Creatinine | 1.11 (0.43-2.87) | 0.82 | ||
| eGFR | 0.99 (0.98-1.01) | 0.72 | ||
| Urea | 0.99 (0.99-1.01) | 0.65 | ||
| Uric acid | 1.05 (0.94-1.18) | 0.38 | ||
| MACE | 0.79 (0.33-2.95) | 0.62 |
MI: myocardial infarction; PCI: percutaneous coronary intervention; STEMI: ST-elevation myocardial infarction; HDL-C: high-density lipoprotein cholesterol; LDL-C: low-density lipoprotein cholesterol; TG: triglycerides; VLDL: very-low-density lipoprotein; ApoB-100: apolipoprotein B-100; Lp(a): lipoprotein(a); HbA1c: hemoglobin A1c; eGFR: estimated glomerular filtration rate; MACE: major adverse cardiovascular events.
Disclaimer/Publisher’s Note: The statements, opinions and data contained in all publications are solely those of the individual author(s) and contributor(s) and not of MDPI and/or the editor(s). MDPI and/or the editor(s) disclaim responsibility for any injury to people or property resulting from any ideas, methods, instructions or products referred to in the content. |
© 2026 by the authors. Licensee MDPI, Basel, Switzerland. This article is an open access article distributed under the terms and conditions of the Creative Commons Attribution (CC BY) license (http://creativecommons.org/licenses/by/4.0/).
Copyright: This open access article is published under a Creative Commons CC BY 4.0 license, which permit the free download, distribution, and reuse, provided that the author and preprint are cited in any reuse.


