
Submitted:
13 February 2026
Posted:
13 February 2026
You are already at the latest version
Abstract
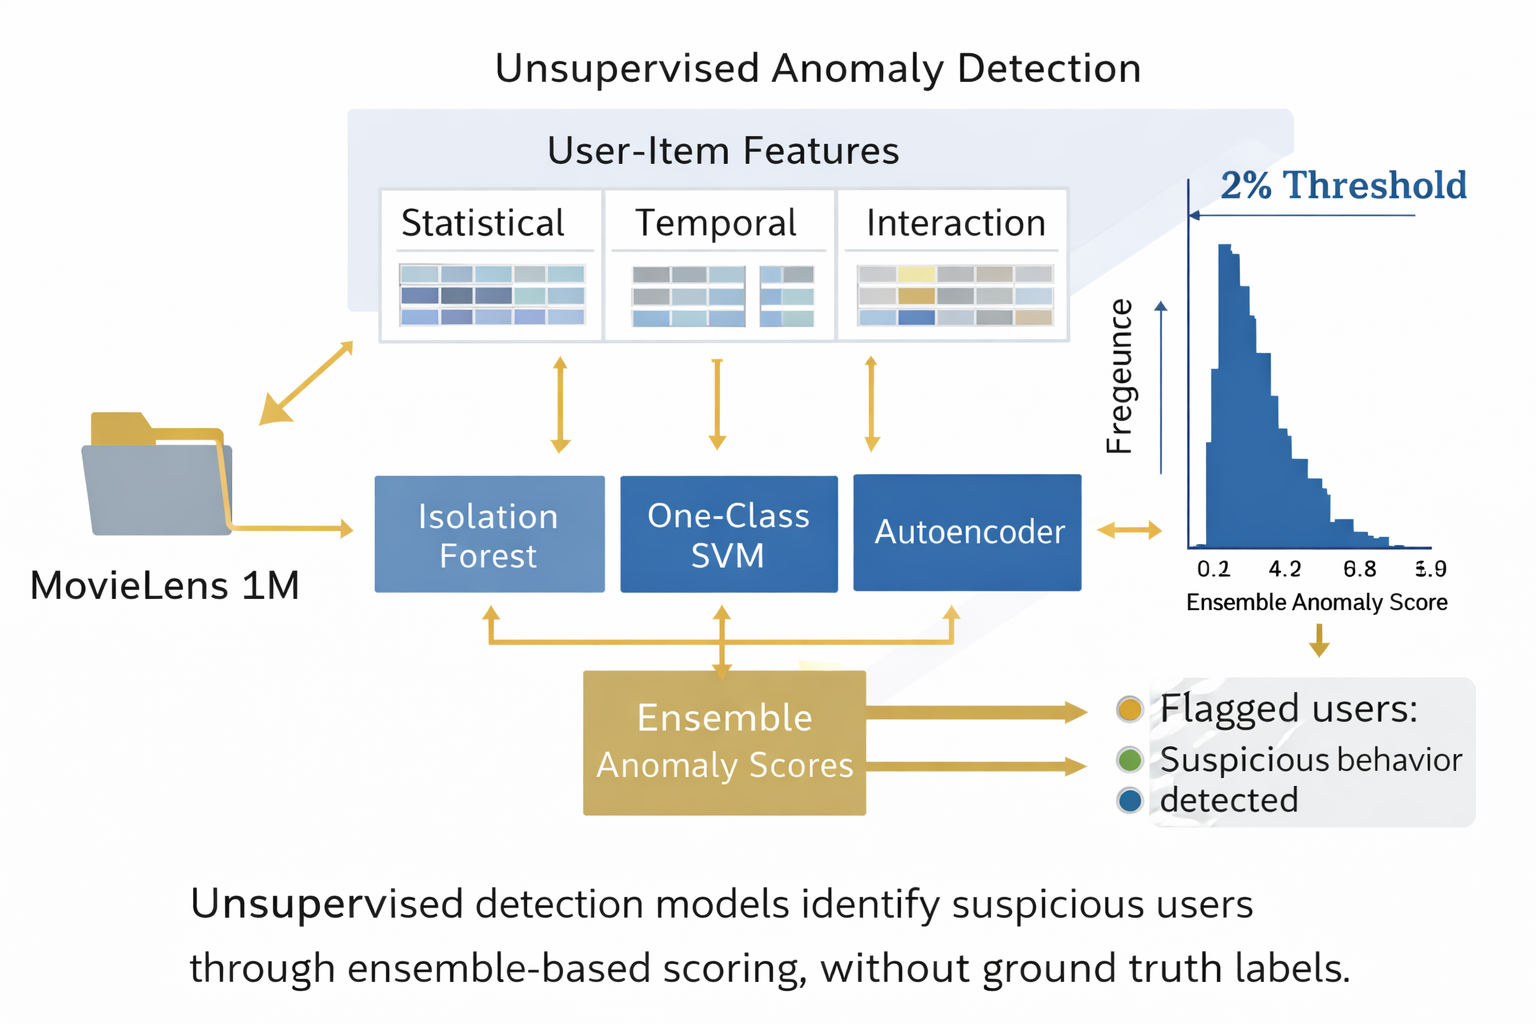
Recommender systems are increasingly exposed to anomalous user behavior that can distort recommendation outcomes and compromise system reliability. In real-world settings, explicit labels identifying malicious activity are rarely available, motivating the adoption of unsupervised detection approaches. This study presents a comparative analysis of classical machine learning and deep learning techniques for anomaly detection in recommender systems. Using the MovieLens 1M dataset, we construct a user-level behavioral representation based on statistical, temporal, and interaction-based features derived from explicit rating data. Three unsupervised detection models are evaluated: Isolation Forest, One-Class Support Vector Machine, and an autoencoder-based neural network. To address the absence of ground truth labels, evaluation is conducted using label-free protocols, including score distribution analysis, percentile-based thresholding, and inter-model agreement. Results indicate that individual models capture complementary aspects of anomalous behavior, exhibiting low to moderate agreement. An ensemble scoring strategy improves ranking stability and provides a consistent mechanism for identifying highly deviant user profiles. The findings suggest that ensemble-based unsupervised detection constitutes a practical and interpretable first-layer screening approach for recommender system monitoring.
Keywords:
recommender systems
; anomaly detection
; unsupervised learning
; ensemble methods
; user behavior analysis
1. Introduction
Recommender systems have become a foundational component of modern digital ecosystems, shaping user experiences across e-commerce platforms, streaming services, social networks, and online marketplaces [1]. By leveraging historical user–item interaction data, these systems aim to provide personalized recommendations that enhance engagement, satisfaction, and platform retention. As recommender systems increasingly influence user decisions and market visibility, their robustness and trustworthiness have become critical concerns.
However, the widespread adoption of recommender systems has also exposed them to adversarial manipulation. One of the most extensively studied threats is the presence of malicious or strategic users who attempt to influence recommendation outcomes by injecting biased interactions, commonly referred to as shilling or profile injection attacks [2,3]. Such attacks can distort ranking algorithms, unfairly promote specific items, and degrade the reliability of collaborative filtering models. Early empirical studies demonstrated that even a small fraction of malicious profiles can significantly alter recommendation outputs, particularly in sparse data environments [2,4]. These findings established the vulnerability of collaborative recommender systems and motivated the development of defensive mechanisms.
Traditional countermeasures against shilling attacks have primarily relied on rule-based heuristics or supervised classification approaches that assume the availability of labeled attack data [4]. While these methods can be effective in controlled experimental settings, they face substantial limitations in real-world deployments. Explicit annotations identifying malicious users are rarely available, attack strategies evolve over time, and adversarial behavior often overlaps with legitimate but atypical user activity [3]. These challenges highlight the difficulty of maintaining static defense mechanisms in dynamic recommendation environments.
In response, anomaly detection has emerged as a promising paradigm for recommender system security [5,6]. Rather than modeling predefined attack classes, anomaly detection approaches conceptualize malicious behavior as deviations from typical interaction patterns. Tree-based, kernel-based, and neural network–based unsupervised models have demonstrated the ability to capture irregular rating distributions, abnormal temporal activity, and unusual interaction patterns without requiring labeled training data [5]. Nevertheless, much of the existing literature evaluates detection techniques in isolation or under synthetic attack injection scenarios, limiting understanding of how heterogeneous detection paradigms compare and interact under consistent feature representations.
A further challenge arises from the absence of ground truth labels. In unsupervised settings, traditional performance metrics such as precision and recall cannot be computed directly. Researchers must instead rely on indirect evaluation indicators, including score distributions, threshold stability, and inter-model agreement [3]. This methodological constraint underscores the importance of comparative and ensemble-based analyses to assess robustness and reduce model-specific biases in label-free environments.
Motivated by these challenges, this study conducts a systematic comparative analysis of unsupervised machine learning and deep learning techniques for anomaly detection in recommender systems. Using the MovieLens 1M dataset as a representative benchmark, we construct a user-level behavioral representation derived from statistical, temporal, and interaction-based features. We evaluate three widely adopted detection paradigms—Isolation Forest, One-Class Support Vector Machine, and an autoencoder-based neural network—and investigate their individual and collective behavior through an ensemble scoring strategy.
The contributions of this work are threefold: (1) we provide a unified comparative evaluation of classical and deep unsupervised detection models under a consistent behavioral feature representation; (2) we introduce a label-free evaluation framework based on score distribution analysis, threshold stability, and inter-model agreement; and (3) we demonstrate that ensemble-based anomaly scoring improves ranking stability and mitigates model-specific sensitivities in the absence of ground truth labels.
The remainder of this paper is organized as follows. Section 2 reviews related work on recommender system security and anomaly detection. Section 3 describes the materials and methods, including the dataset, preprocessing strategy, feature engineering pipeline, and unsupervised detection models. Section 4 presents the experimental setup, including hyperparameter configuration and label-free evaluation protocols. Section 5 reports the experimental results, while Section 6 discusses their implications. Section 7 concludes the paper and outlines directions for future research.
2. Related Work
Research on security in recommender systems has primarily focused on the detection and mitigation of shilling or profile injection attacks, where malicious users attempt to manipulate recommendation outcomes by injecting biased ratings. Early foundational work by Lam and Riedl [2] demonstrated that collaborative filtering systems are vulnerable even to relatively small numbers of injected profiles. Subsequent studies expanded on attack modeling and defensive strategies, including feature-based classification approaches for identifying malicious users [3,4]. These works established the fundamental taxonomy of attack models and defensive mechanisms in collaborative recommender systems.
Several surveys have systematically analyzed vulnerabilities and countermeasures in recommender systems. Gunes et al. [7] provided a comprehensive overview of shilling attacks and detection strategies, highlighting the limitations of rule-based and heuristic methods. Similarly, Wu et al. [8] examined attack models and defense techniques, emphasizing the evolving nature of adversarial behavior and the difficulty of maintaining robust detection mechanisms in dynamic environments. These studies collectively indicate that attack strategies continuously adapt, reducing the effectiveness of static detection rules.
Traditional attack detection methods often rely on supervised learning frameworks, assuming the availability of labeled attack data [4]. However, in real-world deployments, explicit ground truth labels identifying malicious users are rarely accessible. Moreover, legitimate users may exhibit behavioral patterns similar to attack profiles, further complicating classification. This limitation has motivated the exploration of anomaly detection approaches that treat malicious behavior as deviations from normal user activity rather than predefined classes.
Anomaly detection in recommender systems has been explored using statistical and machine learning methods. Yang et al. [9] proposed detecting abnormal user behavior through feature-based modeling of rating patterns. More broadly, unsupervised anomaly detection techniques have been extensively studied in the data mining literature [10,11], including tree-based methods such as Isolation Forest [12], kernel-based approaches such as One-Class Support Vector Machines [13], and neural network models such as autoencoders [14,15]. While these models have demonstrated effectiveness in general anomaly detection tasks, comparative evaluations within recommender system contexts remain limited.
Recent advances have also considered ensemble-based detection strategies to improve robustness. Ensemble approaches aim to aggregate heterogeneous anomaly signals and mitigate model-specific biases [16]. However, most existing studies either focus on synthetic attack injection scenarios or evaluate a single detection paradigm in isolation. Comparative analyses of classical machine learning and deep learning approaches under a unified behavioral representation remain relatively scarce.
In contrast to prior work that assumes labeled attacks or synthetic injection experiments, this study adopts a purely unsupervised perspective and evaluates multiple detection paradigms under a consistent feature extraction framework. By analyzing model agreement, threshold stability, and ensemble integration without relying on ground truth labels, this work contributes to bridging the gap between theoretical attack modeling and practical anomaly detection in real-world recommender system settings.
3. Materials and Methods
3.1. Dataset Description
The experiments conducted in this study are based on the MovieLens 1M dataset, a widely used benchmark in recommender systems research [17]. The dataset was released by the GroupLens Research Group and contains explicit user–item rating interactions collected from the MovieLens online platform.
MovieLens 1M consists of approximately one million ratings provided by 6,040 users on 3,706 movies, using a discrete rating scale from 1 to 5. Each rating is associated with a timestamp, enabling the analysis of temporal activity patterns in addition to rating distributions. The dataset also includes basic user metadata and item information; however, this study focuses exclusively on interaction data to ensure that the proposed detection framework relies only on observable behavioral signals commonly available in real-world recommender system deployments.
The MovieLens dataset is particularly suitable for the analysis of anomalous behavior due to its sparsity characteristics and heterogeneous user activity levels. While the dataset does not contain explicit labels identifying malicious or attack-driven users, it provides a realistic setting for unsupervised anomaly detection, where suspicious behavior must be inferred from deviations in rating, temporal, and interaction patterns rather than predefined attack annotations.
Prior to feature extraction, minimal filtering was applied to remove users and items with extremely low interaction counts, as such profiles do not provide sufficient information for stable behavioral characterization. This step improves the reliability of statistical and temporal features without altering the intrinsic distributional properties of the dataset.
Overall, the MovieLens 1M dataset serves as a representative and reproducible benchmark for evaluating unsupervised detection models in recommender systems, enabling meaningful comparison with prior work while reflecting practical constraints encountered in real-world scenarios.
3.2. Preprocessing and Feature Engineering
3.2.1. Filtering Strategy:
To ensure the robustness and stability of the extracted behavioral features, a minimal filtering strategy was applied to the MovieLens 1M dataset. Specifically, users and items with extremely low interaction counts were removed prior to feature extraction. Users with fewer than 20 ratings and items with fewer than 20 received ratings were excluded from the analysis.
This filtering step aims to mitigate the impact of highly sparse user profiles and rarely rated items, which may introduce noise and unreliable statistical estimates in user-level behavioral features. Very short interaction histories can lead to unstable estimates of rating distribution statistics, temporal activity patterns, and item popularity measures, thereby negatively affecting the performance and interpretability of detection models.
The chosen thresholds follow common practices in recommender systems research and anomaly detection studies, where a minimum level of interaction is required to ensure meaningful behavioral characterization. Importantly, this filtering does not alter the underlying rating distributions of the dataset, but rather improves the reliability of user representations used for subsequent detection tasks.
3.2.2. Feature Extraction Pipeline
Detection-Oriented Feature Engineering Pipeline After preprocessing and filtering, a detection-oriented feature extraction pipeline was applied at the user level. Each user profile was represented as a fixed-length feature vector capturing statistical, temporal, and interaction-based characteristics derived exclusively from observed rating behavior.
First, rating-based statistical features were extracted, including the number of ratings, mean and standard deviation of ratings, minimum and maximum ratings, rating entropy, and the proportion of extreme ratings. These features aim to capture abnormal rating patterns, such as overly polarized behavior or low-diversity rating distributions, which are commonly associated with malicious or anomalous users.
Second, temporal activity features were computed using rating timestamps. These include inter-arrival time statistics, profile time span, rating frequency, and burstiness indicators. Temporal features are particularly relevant for detecting suspicious behavior characterized by unusually dense rating activity within short time intervals.
Third, item interaction features were derived based on item popularity statistics. For each user, the average, minimum, maximum, and variance of the popularity of interacted items were computed. These features capture tendencies toward interacting with highly popular or niche items, which may reflect manipulation or coordinated behavior.
All feature groups were subsequently merged into a unified user-level representation. Missing values were handled conservatively by zero imputation, and numerical features were standardized prior to model training to ensure compatibility with both machine learning and deep learning models.
3.2.3. Rationale for Minimum Interaction Threshold
A minimum interaction threshold was applied to both users and items in order to ensure statistically reliable behavioral representations. Specifically, users and items with fewer than 20 ratings were removed prior to feature extraction. The use of minimum interaction thresholds is a common and well-established practice in recommender systems research. Previous studies have shown that very sparse user profiles lead to unstable estimates of rating distributions and temporal activity patterns, which can negatively impact downstream learning tasks, including classification and anomaly detection [18,19]. Koren et al. [18] demonstrated that collaborative filtering models and derived behavioral representations become increasingly unreliable when trained on extremely short user histories, as sparsity amplifies noise and biases model learning. Similarly, Ricci et al. [19] highlight that users with very limited interaction histories provide insufficient information to characterize preferences or behavioral patterns in a meaningful way. From an anomaly detection perspective, Chandola et al. [10] emphasize that reliable detection of abnormal behavior requires a sufficient number of observations per entity to establish a baseline of normal behavior. In the context of recommender systems, user profiles with very few ratings do not provide enough evidence to distinguish between genuine variability and anomalous activity. Empirically, several studies using the MovieLens dataset adopt minimum thresholds ranging from 10 to 20 interactions per user to balance data coverage and representation stability [20]. Following these established practices, a threshold of 20 ratings was selected as a conservative compromise that preserves the majority of users while ensuring robust feature estimation. Importantly, this filtering step does not modify the intrinsic characteristics of the dataset, but rather improves the reliability of user-level feature extraction by excluding profiles for which statistical and temporal features would be poorly defined.
3.3. Unsupervised Detection Models
Given the absence of ground-truth labels indicating malicious or attack-driven behavior in the MovieLens 1M dataset, this study adopts unsupervised learning approaches for attack detection. Unsupervised models are particularly suitable for this setting, as they aim to identify deviations from normal user behavior without requiring explicit annotations, which are rarely available in real-world recommender system datasets.
In this context, the detection task is formulated as a user-level anomaly detection problem, where each user is represented by a feature vector capturing rating statistics, temporal activity patterns, and item interaction characteristics. Users whose behavioral profiles significantly deviate from the majority are considered suspicious.
3.3.1. Isolation Forest
Isolation Forest was employed as a tree-based unsupervised anomaly detection method. Unlike distance-based techniques, Isolation Forest isolates anomalies by recursively partitioning the feature space using randomly selected features and split values. Anomalous instances are expected to be isolated more quickly than normal instances, resulting in shorter average path lengths [12].
This method is particularly well-suited for high-dimensional behavioral feature spaces and has been widely adopted in anomaly detection tasks due to its computational efficiency and robustness to irrelevant features. In the context of recommender systems, Isolation Forest enables the identification of users exhibiting unusual rating distributions or abnormal temporal activity without imposing assumptions about data distribution.
3.3.2. One-Class Support Vector Machine
One-Class Support Vector Machine (OC-SVM) was also considered as a classical unsupervised baseline. OC-SVM aims to learn a decision boundary that encloses the majority of normal data points in the feature space, treating observations outside this boundary as anomalies [13].
Although sensitive to feature scaling and kernel selection, OC-SVM remains a widely used benchmark in anomaly detection research. Its inclusion in this study provides a strong baseline for evaluating the effectiveness of tree-based and neural approaches under identical feature representations.
3.3.3. Autoencoder-Based Anomaly Detection
To incorporate deep learning–based detection, an autoencoder model was employed. Autoencoders are neural networks trained to reconstruct their input data by learning a compressed latent representation. When trained primarily on normal behavioral patterns, the model achieves low reconstruction error for typical users, while anomalous users exhibit significantly higher reconstruction errors [14,15].
In this study, a fully connected autoencoder architecture was trained on standardized user-level features. The reconstruction error, measured as the mean squared error between the input and reconstructed output, was used as the anomaly score. This approach enables the model to capture non-linear relationships between behavioral features that may not be detected by classical methods.
3.3.4. Unified Detection Framework
All detection models were applied to the same standardized user-level feature representation to ensure methodological consistency and fair comparison. Anomaly scores were computed independently by each model under identical data preprocessing conditions.
3.4. Ensemble Scoring Strategy
Given that different unsupervised detection models capture distinct structural properties of user behavior, an ensemble scoring strategy was adopted to integrate heterogeneous anomaly signals into a unified ranking. Ensemble approaches are commonly used in anomaly detection to reduce model-specific bias and improve robustness by aggregating complementary detection perspectives [16].
In this study, anomaly scores produced by Isolation Forest, One-Class SVM, and the autoencoder were first normalized to a common scale using min–max normalization. This step ensures comparability across models whose raw score distributions may differ in magnitude and dispersion.
The ensemble anomaly score for each user was computed as the arithmetic mean of the normalized scores across models. Formally, let denote the normalized anomaly score assigned to user i by model . The ensemble score is defined as:
where corresponds to the number of detection models.
This simple aggregation strategy was intentionally selected to maintain interpretability and avoid introducing additional hyperparameters. More complex ensemble mechanisms, such as weighted averaging or stacking, were not considered in order to preserve the unsupervised and label-free nature of the framework.
By combining tree-based, kernel-based, and neural anomaly signals, the ensemble approach aims to identify users consistently exhibiting abnormal behavior across multiple detection paradigms, while mitigating the influence of model-specific sensitivities.
4. Experimental Setup
All experiments were conducted on the MovieLens 1M dataset using a user-level representation derived from explicit rating interactions. Following the preprocessing and filtering steps described in the previous section, each user was represented by a fixed-length feature vector capturing rating statistics, temporal activity patterns, and item popularity characteristics.
The experimental procedure followed the methodological framework described in the previous section. All detection models were applied to the standardized user-level feature representation derived from the MovieLens 1M dataset.
Three unsupervised detection models were evaluated: Isolation Forest, One-Class Support Vector Machine, and an autoencoder-based neural network. All models were trained on the same standardized feature set to ensure comparability across methods. Feature standardization was applied using z-score normalization, which is particularly important for distance- and kernel-based models such as One-Class SVM, as well as for neural network optimization [11].
4.1. Hyperparameter Configuration
Model hyperparameters were selected based on commonly adopted values in the anomaly detection literature. For Isolation Forest, the contamination parameter was used to control the expected fraction of anomalous users. Similarly, the parameter nu in One-Class SVM was configured to reflect the same expected anomaly rate, ensuring a fair alignment between methods [12,13].
The contamination parameter was aligned with the 2% percentile-based threshold to maintain consistency between model calibration and alerting strategy.
The autoencoder architecture consisted of fully connected layers with a symmetric encoder–decoder structure and was trained to minimize reconstruction error using mean squared error loss.
Table 1 summarizes the hyperparameter settings used for all detection models. To ensure reproducibility and avoid dataset-specific overfitting, commonly adopted values from the literature and default configurations were used without extensive tuning.
4.2. Evaluation Protocol Without Ground Truth
Since no ground truth labels are available, traditional supervised evaluation metrics such as accuracy, precision, and recall cannot be computed. Instead, the evaluation focuses on label-free indicators that are commonly employed in unsupervised anomaly detection settings.
First, score distribution analysis was conducted to examine the separation between typical users and high-scoring anomalous users. Heavy-tailed score distributions and clear upper-score regions provide evidence of model discrimination capability.
Second, agreement analysis across models was performed using Jaccard similarity over the top-K ranked users. High overlap between different detection methods suggests consistent identification of anomalous behavior, whereas low overlap may indicate model-specific biases [16].
Third, stability analysis was conducted by measuring the overlap of flagged users across different percentile thresholds (1%, 2%, 5%). Stable detection across thresholds supports the robustness of the anomaly scoring process.
Finally, a qualitative inspection of selected high-scoring users was performed by analyzing their original rating timelines and interaction patterns. This step provides interpretability and empirical validation, allowing the identification of behaviors such as rating bursts, extreme rating distributions, or unusually dense interaction profiles, which are often associated with suspicious activity in recommender systems.
4.3. Thresholding Strategy
Each detection model produces a continuous anomaly score for every user, where higher scores indicate a greater degree of deviation from typical behavior. To facilitate cross-model comparison, anomaly scores were normalized to a common scale using min–max normalization.
In the absence of labeled data, a thresholding strategy based on top-percentile selection was adopted. Specifically, users were ranked according to their anomaly scores, and the top . This approach is widely used in unsupervised anomaly detection and reflects practical alerting or inspection budgets in real-world systems [10,20].
Using multiple values of p enables the assessment of detection stability and sensitivity with respect to the assumed anomaly rate. Rather than claiming definitive identification of attacks, flagged users are interpreted as candidates exhibiting suspicious or anomalous behavioral patterns.
4.3.1. Reproducibility Considerations
All preprocessing steps, feature extraction procedures, model configurations, and evaluation protocols were implemented using reproducible Jupyter notebooks. Intermediate artifacts, including feature matrices and anomaly scores, were stored in CSV format to facilitate transparency and reuse. This design enables straightforward replication of the experiments and supports extensibility to additional datasets or detection models.
5. Results
5.1. Anomaly Score Distributions
The distribution of ensemble anomaly scores across users is illustrated in Figure 1. The score distribution exhibits a clear heavy-tailed pattern, where a relatively small subset of users receives substantially higher anomaly scores compared to the majority of the population.
The concentration of users at lower anomaly score values is consistent with the expected behavior of unsupervised anomaly detection models, where most instances correspond to normal behavioral patterns. The presence of a distinct upper-score tail indicates that the proposed framework effectively differentiates highly deviant profiles without relying on labeled attack data.
Similar skewed distributions were observed for individual detection models, although differences in score dispersion were noticeable, motivating the subsequent integration of heterogeneous anomaly signals through ensemble scoring.
5.2. Threshold-Based Detection and Alerting Rates
To operationalize anomaly detection in the absence of ground truth labels, a percentile-based thresholding strategy was adopted. Table 2 reports the anomaly score thresholds corresponding to the top 1%, 2%, and 5% of users ranked by the ensemble anomaly score.
As visualized in Figure 2, threshold values decrease smoothly as the alerting percentile increases, indicating stable ranking behavior across operating points.
The high concentration of users at lower anomaly score values does not indicate score saturation; rather, it reflects the model’s ability to assign similar low scores to typical users while preserving a distinct tail for highly deviant profiles. Importantly, users identified at stricter thresholds are largely contained within broader thresholds, demonstrating coherent ranking stability.
5.3. Behavioral Characteristics of Flagged Users
To further characterize detected anomalies, aggregate feature analyses were conducted. Figure 3 and Figure 4 illustrate the relationship between ensemble anomaly scores and representative behavioral indicators.
Users with higher anomaly scores frequently exhibit elevated proportions of extreme ratings, unusually dense rating activity, or increased temporal burstiness. However, these behavioral signatures are not uniformly present across all flagged users. The observed variability indicates that anomalous behavior manifests across multiple behavioral dimensions rather than through a single dominant feature.
5.4. Model Agreement Analysis
The consistency of detection results across models was evaluated using Jaccard similarity over the top-K ranked users. Table 3 reports pairwise agreement between detection methods.
Agreement between individual models ranges from low to moderate, indicating that different detection paradigms capture partially distinct aspects of anomalous behavior. The ensemble exhibits consistently higher agreement with each individual model, suggesting improved stability in the integrated ranking.
6. Discussion
6.1. Heterogeneity of Anomalous Behavior
The results demonstrate that anomalous user behavior in recommender systems is inherently heterogeneous. Flagged users do not form a homogeneous group characterized by a single statistical property; instead, deviations emerge across multiple behavioral dimensions, including rating extremity, temporal density, and interaction patterns.
This heterogeneity explains the limited pairwise agreement observed between individual detection models. Tree-based, kernel-based, and neural approaches emphasize different structural properties of the feature space, leading to complementary anomaly rankings.
6.2. Effectiveness of Ensemble Integration
The ensemble scoring strategy mitigates model-specific sensitivities by aggregating heterogeneous anomaly signals. The observed increase in agreement between the ensemble and individual models indicates that aggregation enhances ranking stability without enforcing strict consensus.
The use of simple arithmetic averaging preserves interpretability while avoiding additional hyperparameter tuning. This design choice is particularly relevant in unsupervised settings, where labeled validation data are unavailable.
6.3. Practical Implications for Recommender System Monitoring
From a practical standpoint, the percentile-based thresholding strategy aligns with realistic operational scenarios in which monitoring capacity or manual inspection budgets are limited. By allowing flexible control over the proportion of flagged users, the framework can be adapted to different deployment constraints.
Although the absence of labeled attack data prevents definitive validation of malicious behavior, the consistent identification of statistically deviant user profiles suggests that unsupervised ensemble-based detection can serve as an effective first-layer screening mechanism in recommender systems.
6.4. Limitations
Several limitations of this study should be acknowledged.
First, the analysis was conducted using a single publicly available dataset with explicit feedback. Although MovieLens 1M provides a widely accepted benchmark in recommender systems research, the absence of labeled attack data prevents definitive validation of detected anomalies as malicious or adversarial behavior. The proposed framework identifies statistically deviant user profiles rather than confirmed attacks.
Second, the detection approach operates at the user level and does not explicitly model relational structures such as user–user similarity networks or item co-rating graphs. Consequently, coordinated or group-based manipulation strategies may not be fully captured by the current feature representation.
Third, the ensemble scoring strategy employs simple arithmetic averaging without adaptive weighting. While this choice preserves interpretability and avoids additional hyperparameter tuning, more sophisticated aggregation strategies could potentially improve detection sensitivity under certain conditions.
Finally, the evaluation protocol relies on label-free indicators such as score distribution analysis and model agreement metrics. Although these methods are appropriate for unsupervised settings, they cannot provide quantitative measures of detection accuracy in the absence of ground truth annotations.
These limitations suggest that the proposed framework should be interpreted as a robust anomaly screening mechanism rather than a definitive attack detection solution.
7. Conclusions
This study proposed an unsupervised framework for detecting anomalous user behavior in recommender systems using behavioral features derived exclusively from explicit rating interactions. By combining statistical, temporal, and interaction-based representations, the framework transforms raw user–item data into a structured feature space suitable for label-free anomaly detection.
The comparative evaluation of Isolation Forest, One-Class Support Vector Machine, and an autoencoder-based model demonstrated that no single detection paradigm consistently captures all forms of behavioral deviation. Instead, the findings highlight the inherently heterogeneous nature of anomalous behavior in recommender systems, where different detection models emphasize complementary structural properties of user activity. The ensemble-based scoring strategy effectively integrates these heterogeneous signals, resulting in a more stable and consistent ranking of suspicious users.
The adoption of percentile-based thresholding further enables practical deployment by aligning anomaly detection with realistic inspection capacities. The observed stability of anomaly rankings across multiple threshold levels supports the robustness of the proposed approach under label-free conditions.
Overall, the results suggest that ensemble-based unsupervised detection constitutes a viable and interpretable first-layer screening mechanism for monitoring user behavior in recommender systems.
7.1. Future Research Directions
Future research may extend this framework in several directions. First, evaluating the approach on additional datasets, including implicit-feedback environments, would strengthen external validity. Second, integrating graph-based representations could enable detection of coordinated or group-based manipulation strategies that are not explicitly modeled in the current user-level formulation. Third, semi-supervised and weakly supervised approaches may offer improved sensitivity when limited labeled examples become available.
Finally, incorporating temporal evolution modeling may enhance the capacity to detect emerging anomalous patterns and support early-warning mechanisms in dynamic recommender system deployments.
Author Contributions
Conceptualization, R.B.; methodology, R.B. and M.O.; software, R.H. and M.A.; validation, R.B., M.O., R.H and M.A.; formal analysis, R.B.; investigation, R.B., R.H. and M.A; data curation, R.B.; writing—original draft preparation, R.B.; writing—review and editing, R.B., R.H. and M.A. All authors have read and agreed to the published version of the manuscript.
Funding
This research received no external funding
Data Availability Statement
The dataset analyzed in this study is publicly available. MovieLens 1M was obtained from the GroupLens Research Group at the University of Minnesota and can be accessed at: https://grouplens.org/datasets/movielens/1m/. The source code, experimental notebooks, and processed artifacts supporting the reported results are publicly available at: https://github.com/Rodolfoxbc/RS-Anomaly-Detection. No new raw data were created in this study.
Conflicts of Interest
The authors declare no conflicts of interest.
References
- Chalco, C.I.; Chasi, R.B.; Ortiz, R.H. Hierarchical Clustering for Collaborative Filtering Recommender Systems. In Proceedings of the Advances in Artificial Intelligence, Software and Systems Engineering; Ahram, T.Z., Ed.; Cham, 2019; pp. 346–356. [Google Scholar]
- Lam, S.K.; Riedl, J. Shilling recommender systems for fun and profit; 2004; pp. 393–402. [Google Scholar] [CrossRef]
- Mobasher, B.; Burke, R.; Bhaumik, R.; Williams, C. Toward trustworthy recommender systems: An analysis of attack models and algorithm robustness. ACM Trans. Internet Technol. 2007, 7, 23–es. [Google Scholar] [CrossRef]
- Burke, R.; Mobasher, B.; Williams, C.; Bhaumik, R. Classification features for attack detection in collaborative recommender systems; 2006; pp. 542–547. [Google Scholar] [CrossRef]
- Zhang, K.; Cao, Q.; Sun, F.; Wu, Y.; Tao, S.; Shen, H.; Cheng, X. Robust Recommender System: A Survey and Future Directions. ACM Comput. Surv. 2025, 58. [Google Scholar] [CrossRef]
- Rahmatikargar, B.; Zadeh, P.M.; Kobti, Z. Enhancing Recommender Systems with Anomaly Detection: A Graph Neural Network Approach. In Proceedings of the Complex Networks & Their Applications XIII; Cherifi, H., Donduran, M., Rocha, L.M., Cherifi, C., Varol, O., Eds.; Cham, 2025; pp. 16–28. [Google Scholar]
- Gunes, I.I.; Kaleli, C.; Bilge, A.; Polat, H. Shilling Attacks against Recommender Systems: A Comprehensive Survey. Artificial Intelligence Review 2014, 42, 767–799. [Google Scholar] [CrossRef]
- Wu, Z.D.; Wu, J.L.; He, J. A Survey of Attacks and Defense Techniques for Recommender Systems. Information Sciences 2010, 180, 4600–4619. [Google Scholar]
- Yang, Z.; Xie, Y.; Zeng, Y.; Zhang, Z.; Yang, J. Detecting abnormal profiles in collaborative filtering recommender systems. Journal of Intelligent Information Systems 2016, 47, 211–234. [Google Scholar] [CrossRef]
- Chandola, V.; Banerjee, A.; Kumar, V. Anomaly detection: A survey. ACM Comput. Surv. 2009, 41. [Google Scholar] [CrossRef]
- Aggarwal, C.C. An Introduction to Outlier Analysis; Springer International Publishing: Cham, 2017; pp. 1–34. [Google Scholar] [CrossRef]
- Liu, F.T.; Ting, K.M.; Zhou, Z.H. Isolation Forest. In Proceedings of the 2008 Eighth IEEE International Conference on Data Mining, 2008; pp. 413–422. [Google Scholar] [CrossRef]
- Schölkopf, B.; Platt, J.C.; Shawe-Taylor, J.; Smola, A.J.; Williamson, R.C. Estimating the Support of a High-Dimensional Distribution. Neural Computation 2001, 13, 1443–1471. [Google Scholar] [CrossRef] [PubMed]
- Hinton, G.E.; Salakhutdinov, R.R. Reducing the Dimensionality of Data with Neural Networks. Science 2006, 313, 504–507. [Google Scholar] [CrossRef] [PubMed]
- Chalapathy, R.; Chawla, S. Deep Learning for Anomaly Detection: A Survey. CoRR 2019, abs/1901.03407, [1901.03407].
- Guilherme O., C.; Arthur, Z.; Jörg, S.; Ricardo J. G. B., C.; Barbora, M.; Erich, S.; Ira, A.; Michael E., H. On the evaluation of unsupervised outlier detection: measures, datasets, and an empirical study. Data Mining and Knowledge Discovery 2016, 30, 891–927. [Google Scholar] [CrossRef]
- Harper, F.M.; Konstan, J.A. The MovieLens Datasets: History and Context. ACM Trans. Interact. Intell. Syst. 2015, 5. [Google Scholar] [CrossRef]
- Koren, Y.; Bell, R.; Volinsky, C. Matrix Factorization Techniques for Recommender Systems. Computer 2009, 42, 30–37. [Google Scholar] [CrossRef]
- Ricci, F.; Rokach, L.; Shapira, B. Recommender Systems Handbook; Springer US, 2015. [Google Scholar]
- Aggarwal, C.C. Recommender Systems: The Textbook; Computer Science, Springer International Publishing, 2016. [Google Scholar]
Figure 1.
Distribution of ensemble anomaly scores across users in the MovieLens 1M dataset. The heavy-tailed shape indicates that a small subset of users receives substantially higher anomaly scores.
Figure 1.
Distribution of ensemble anomaly scores across users in the MovieLens 1M dataset. The heavy-tailed shape indicates that a small subset of users receives substantially higher anomaly scores.
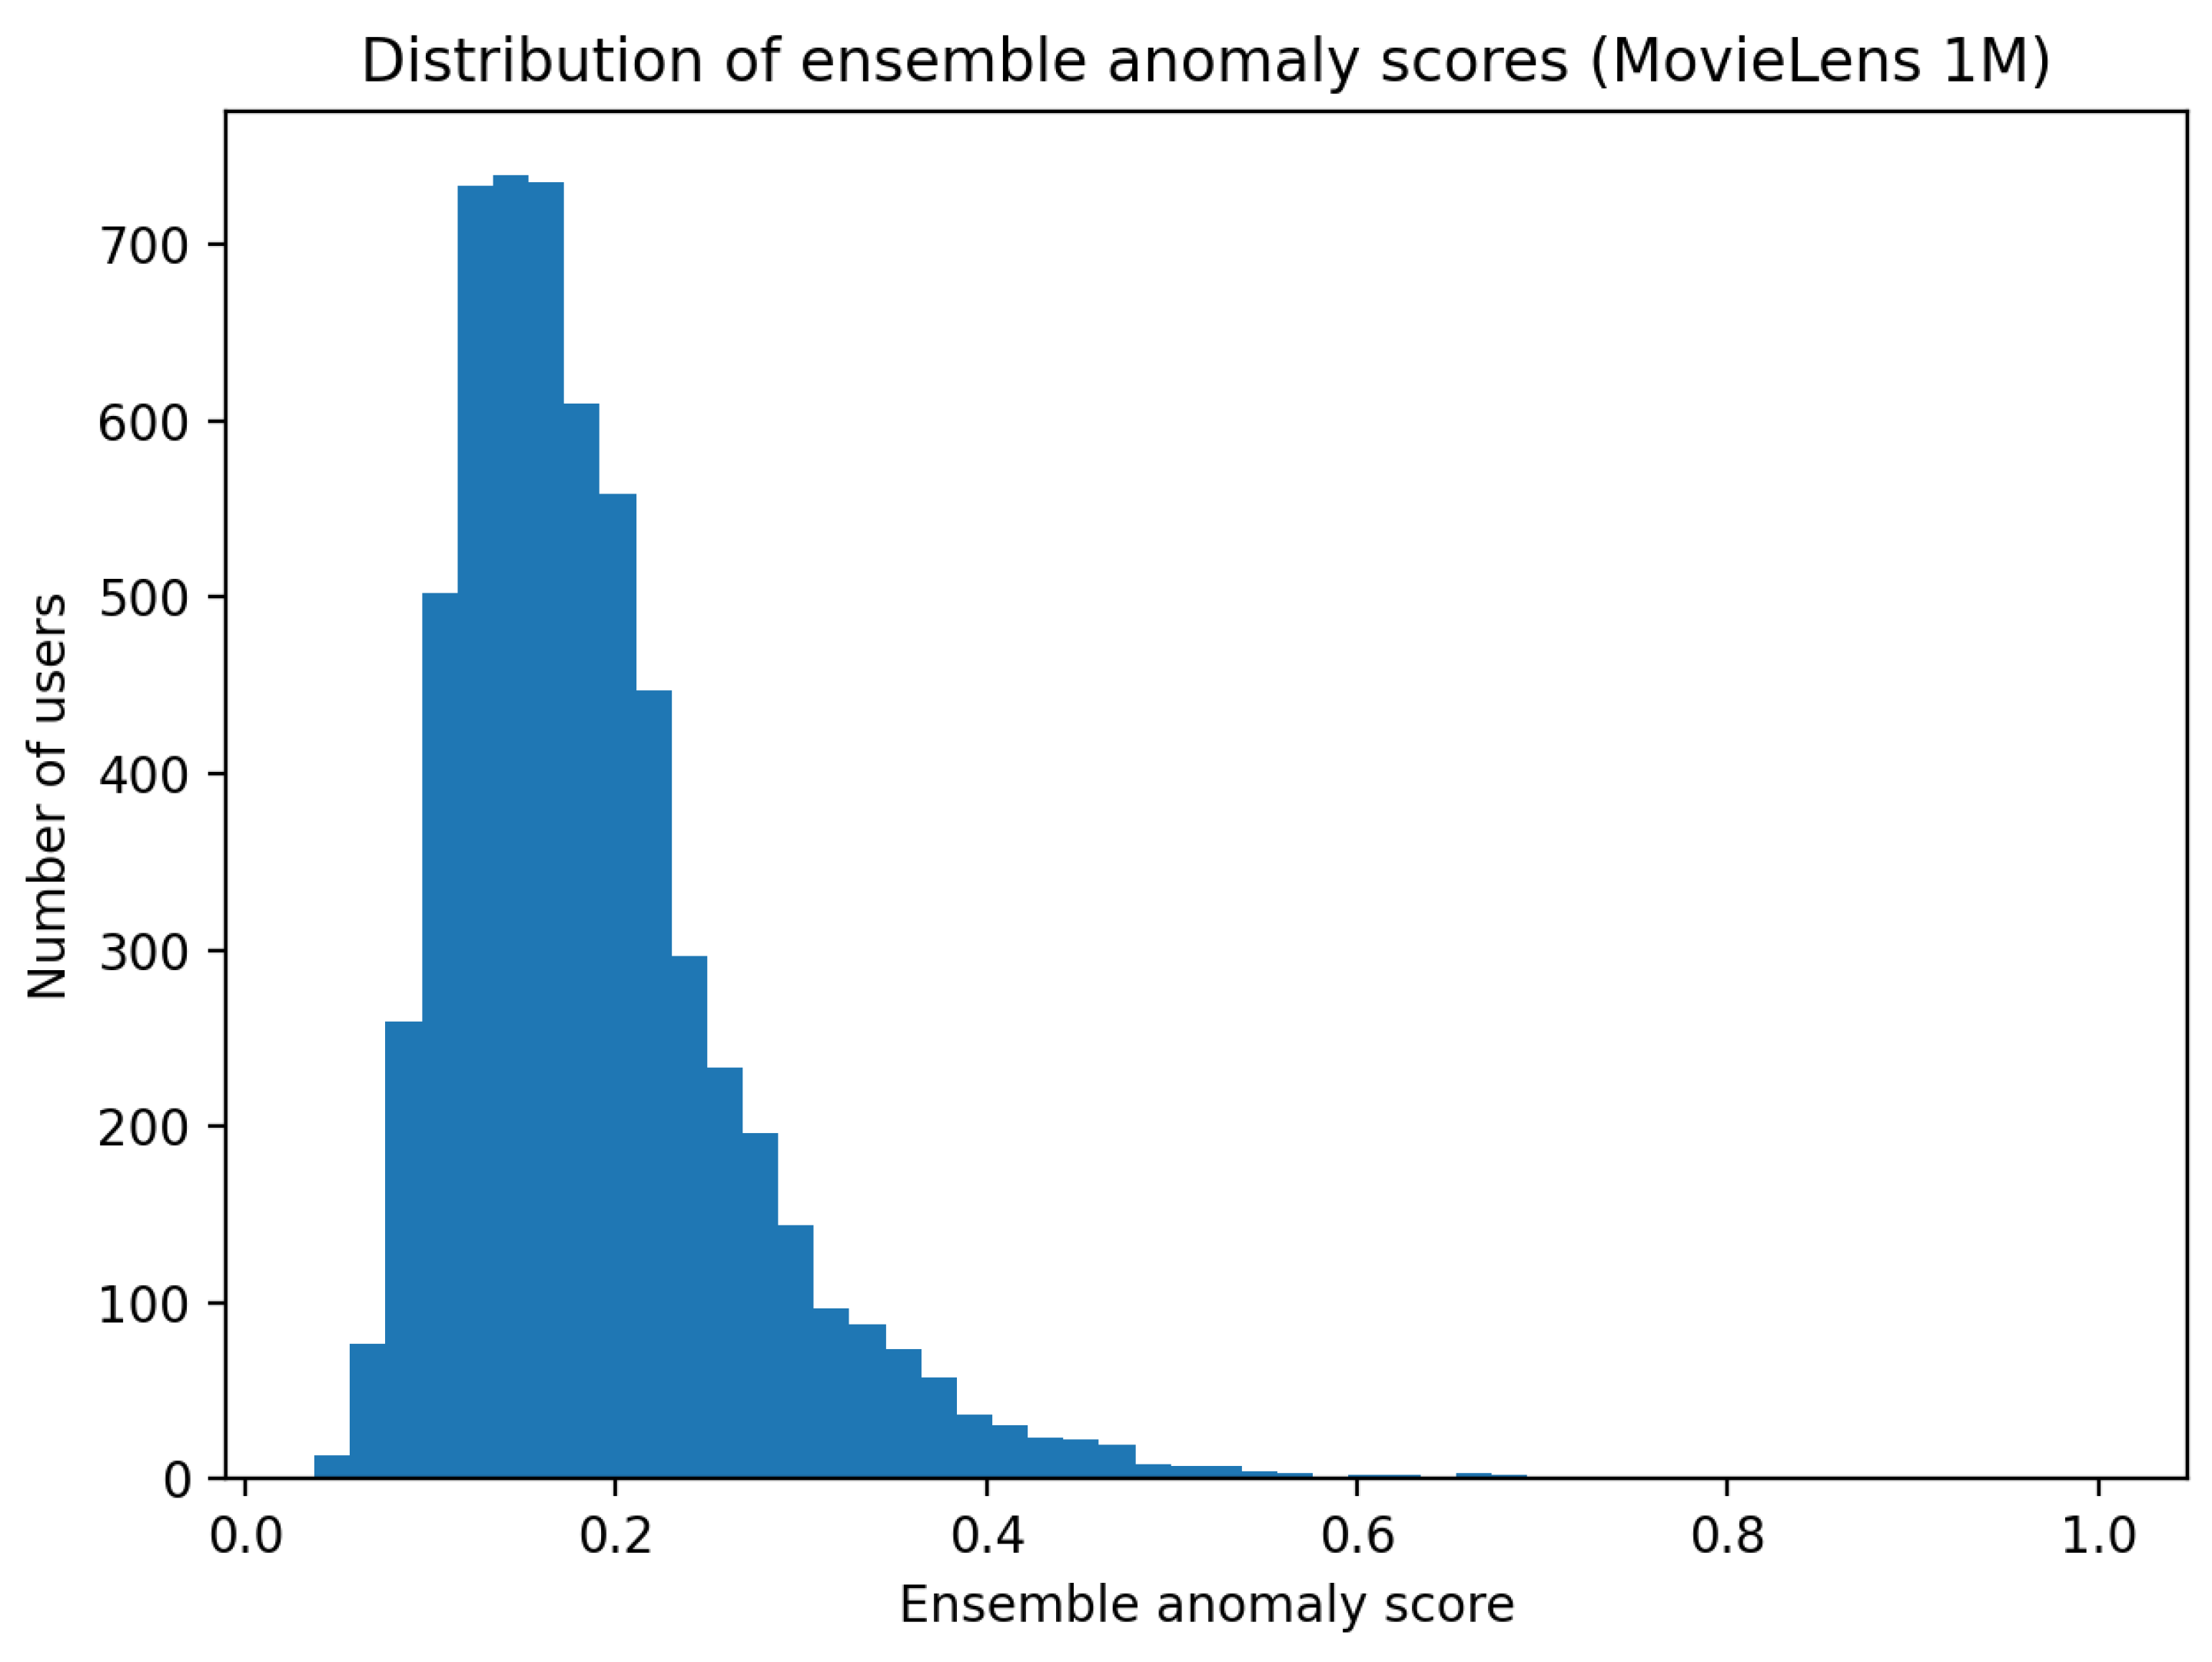
Figure 2.
Ensemble anomaly score distribution with percentile-based thresholds for different alerting rates. The smooth progression of thresholds highlights the stability of the anomaly scoring process.
Figure 2.
Ensemble anomaly score distribution with percentile-based thresholds for different alerting rates. The smooth progression of thresholds highlights the stability of the anomaly scoring process.
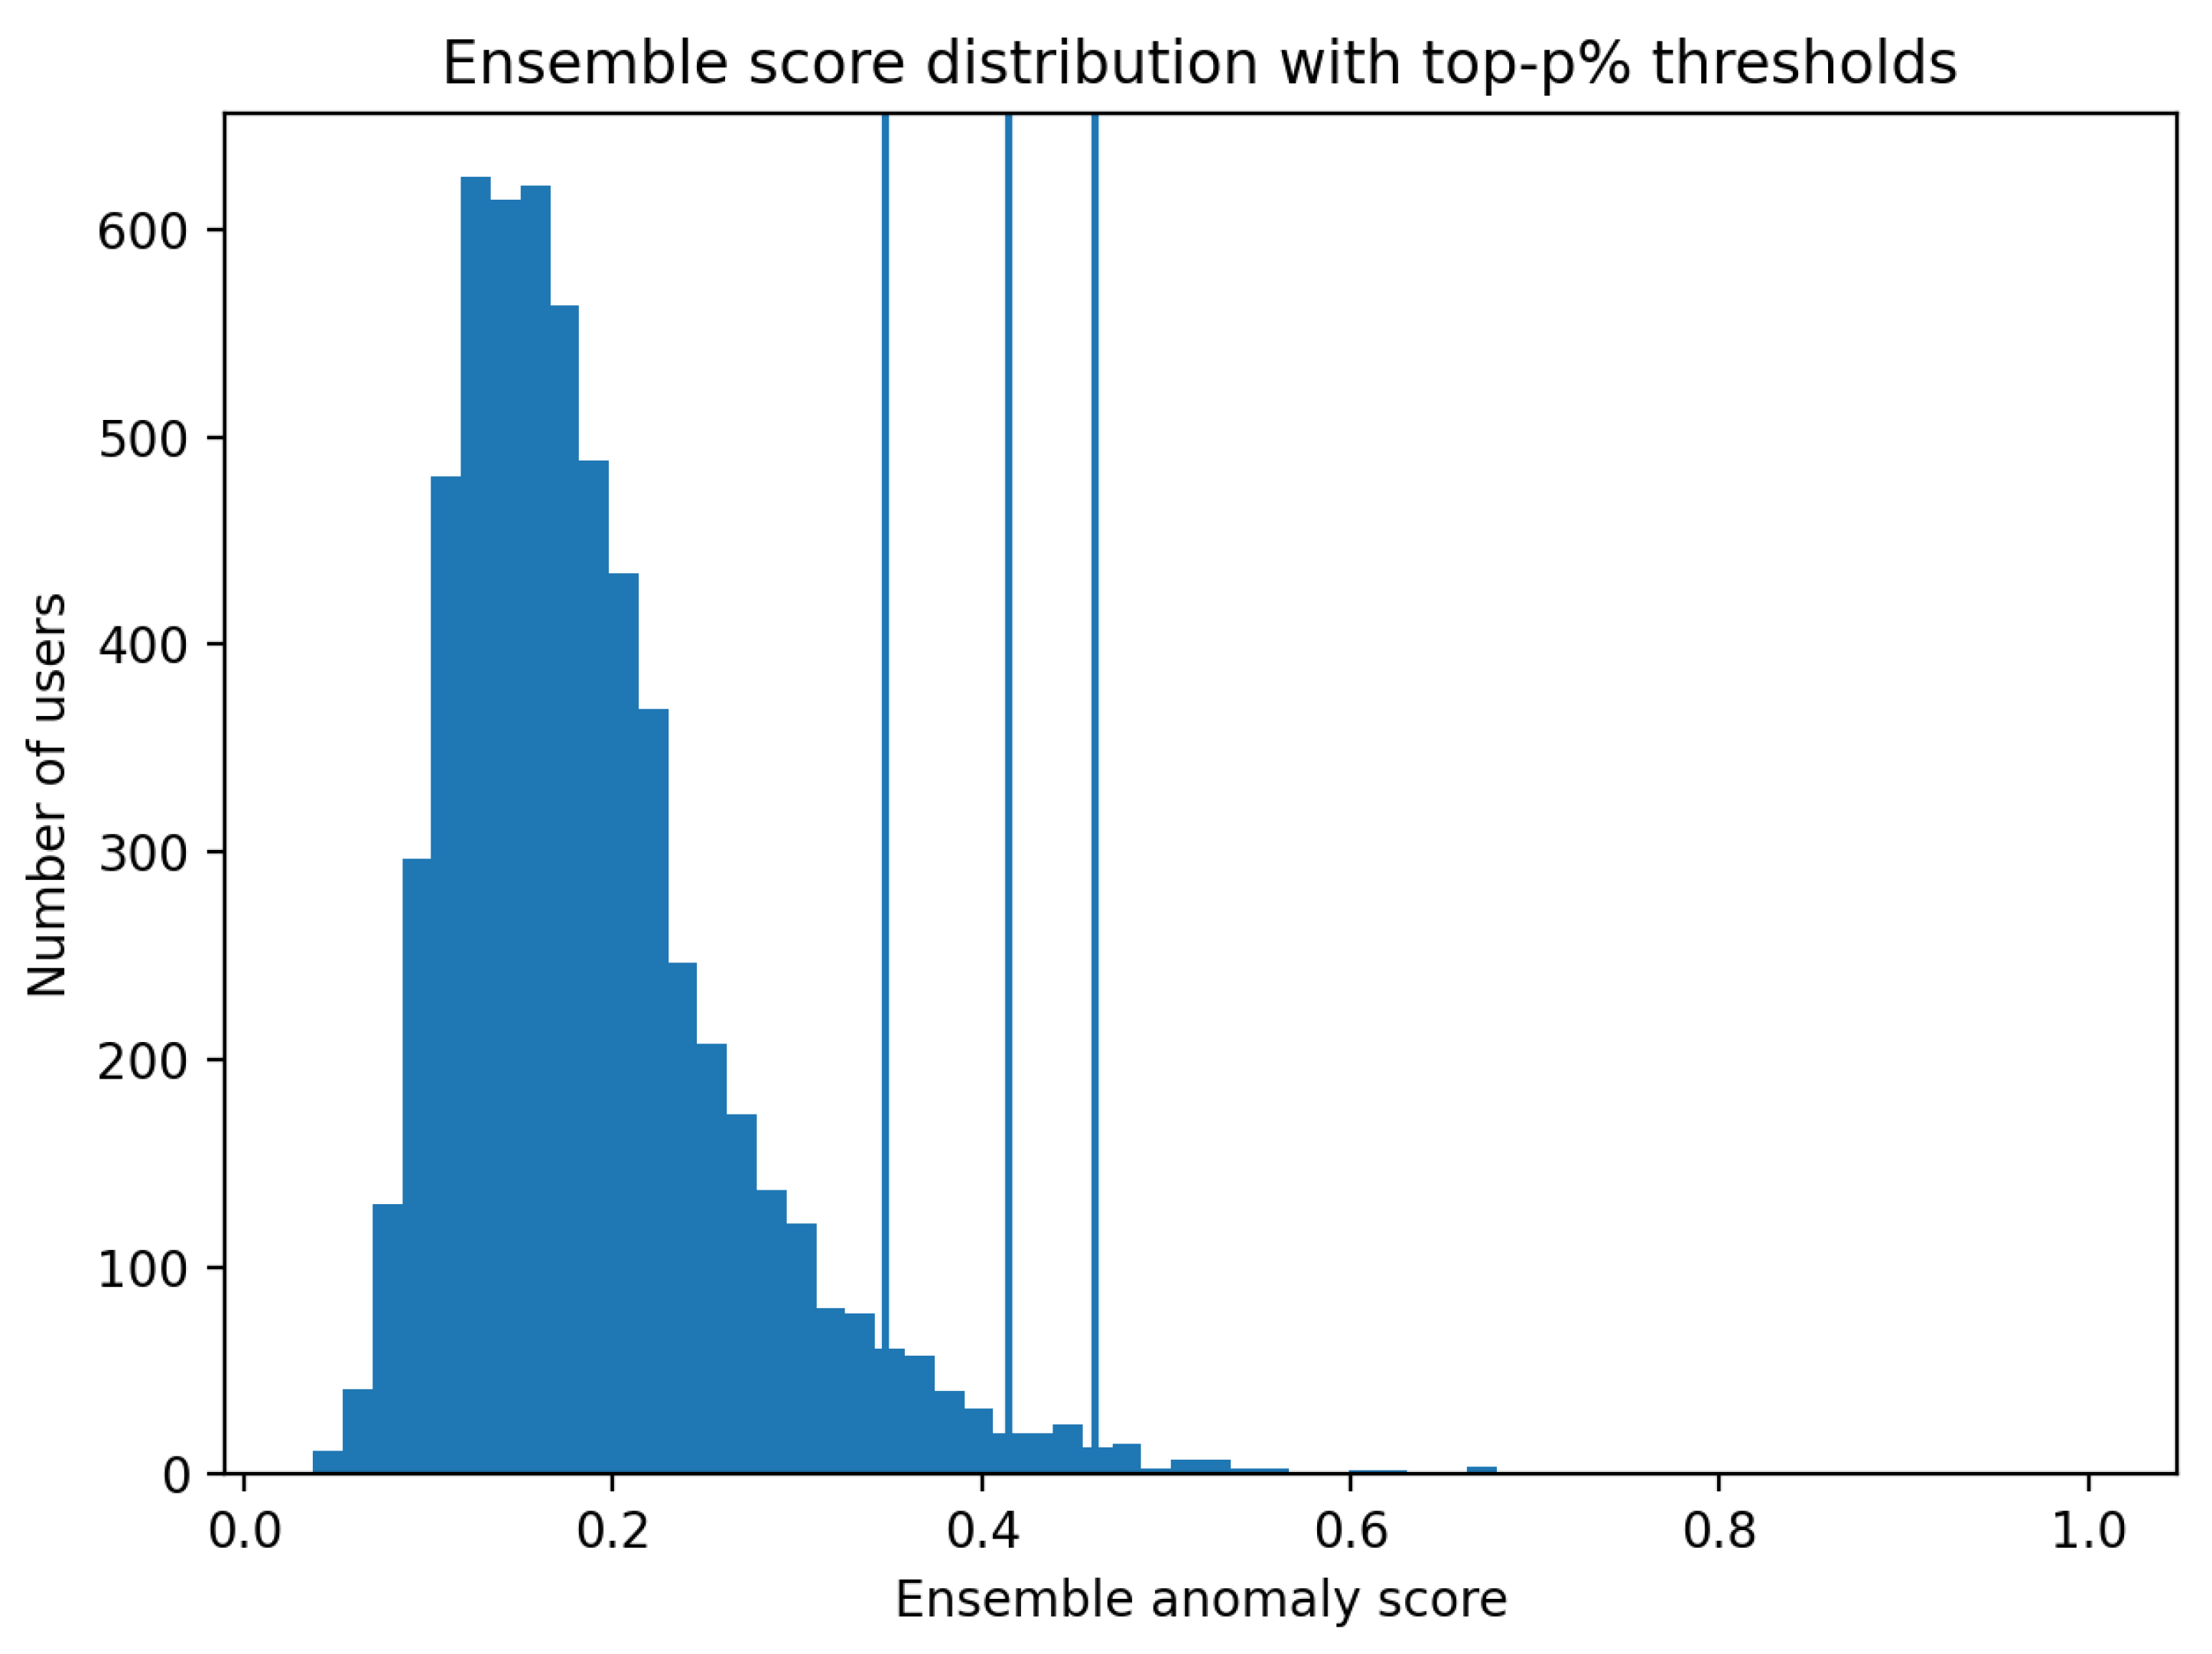
Figure 3.
Relationship between extreme rating behavior and ensemble anomaly scores.
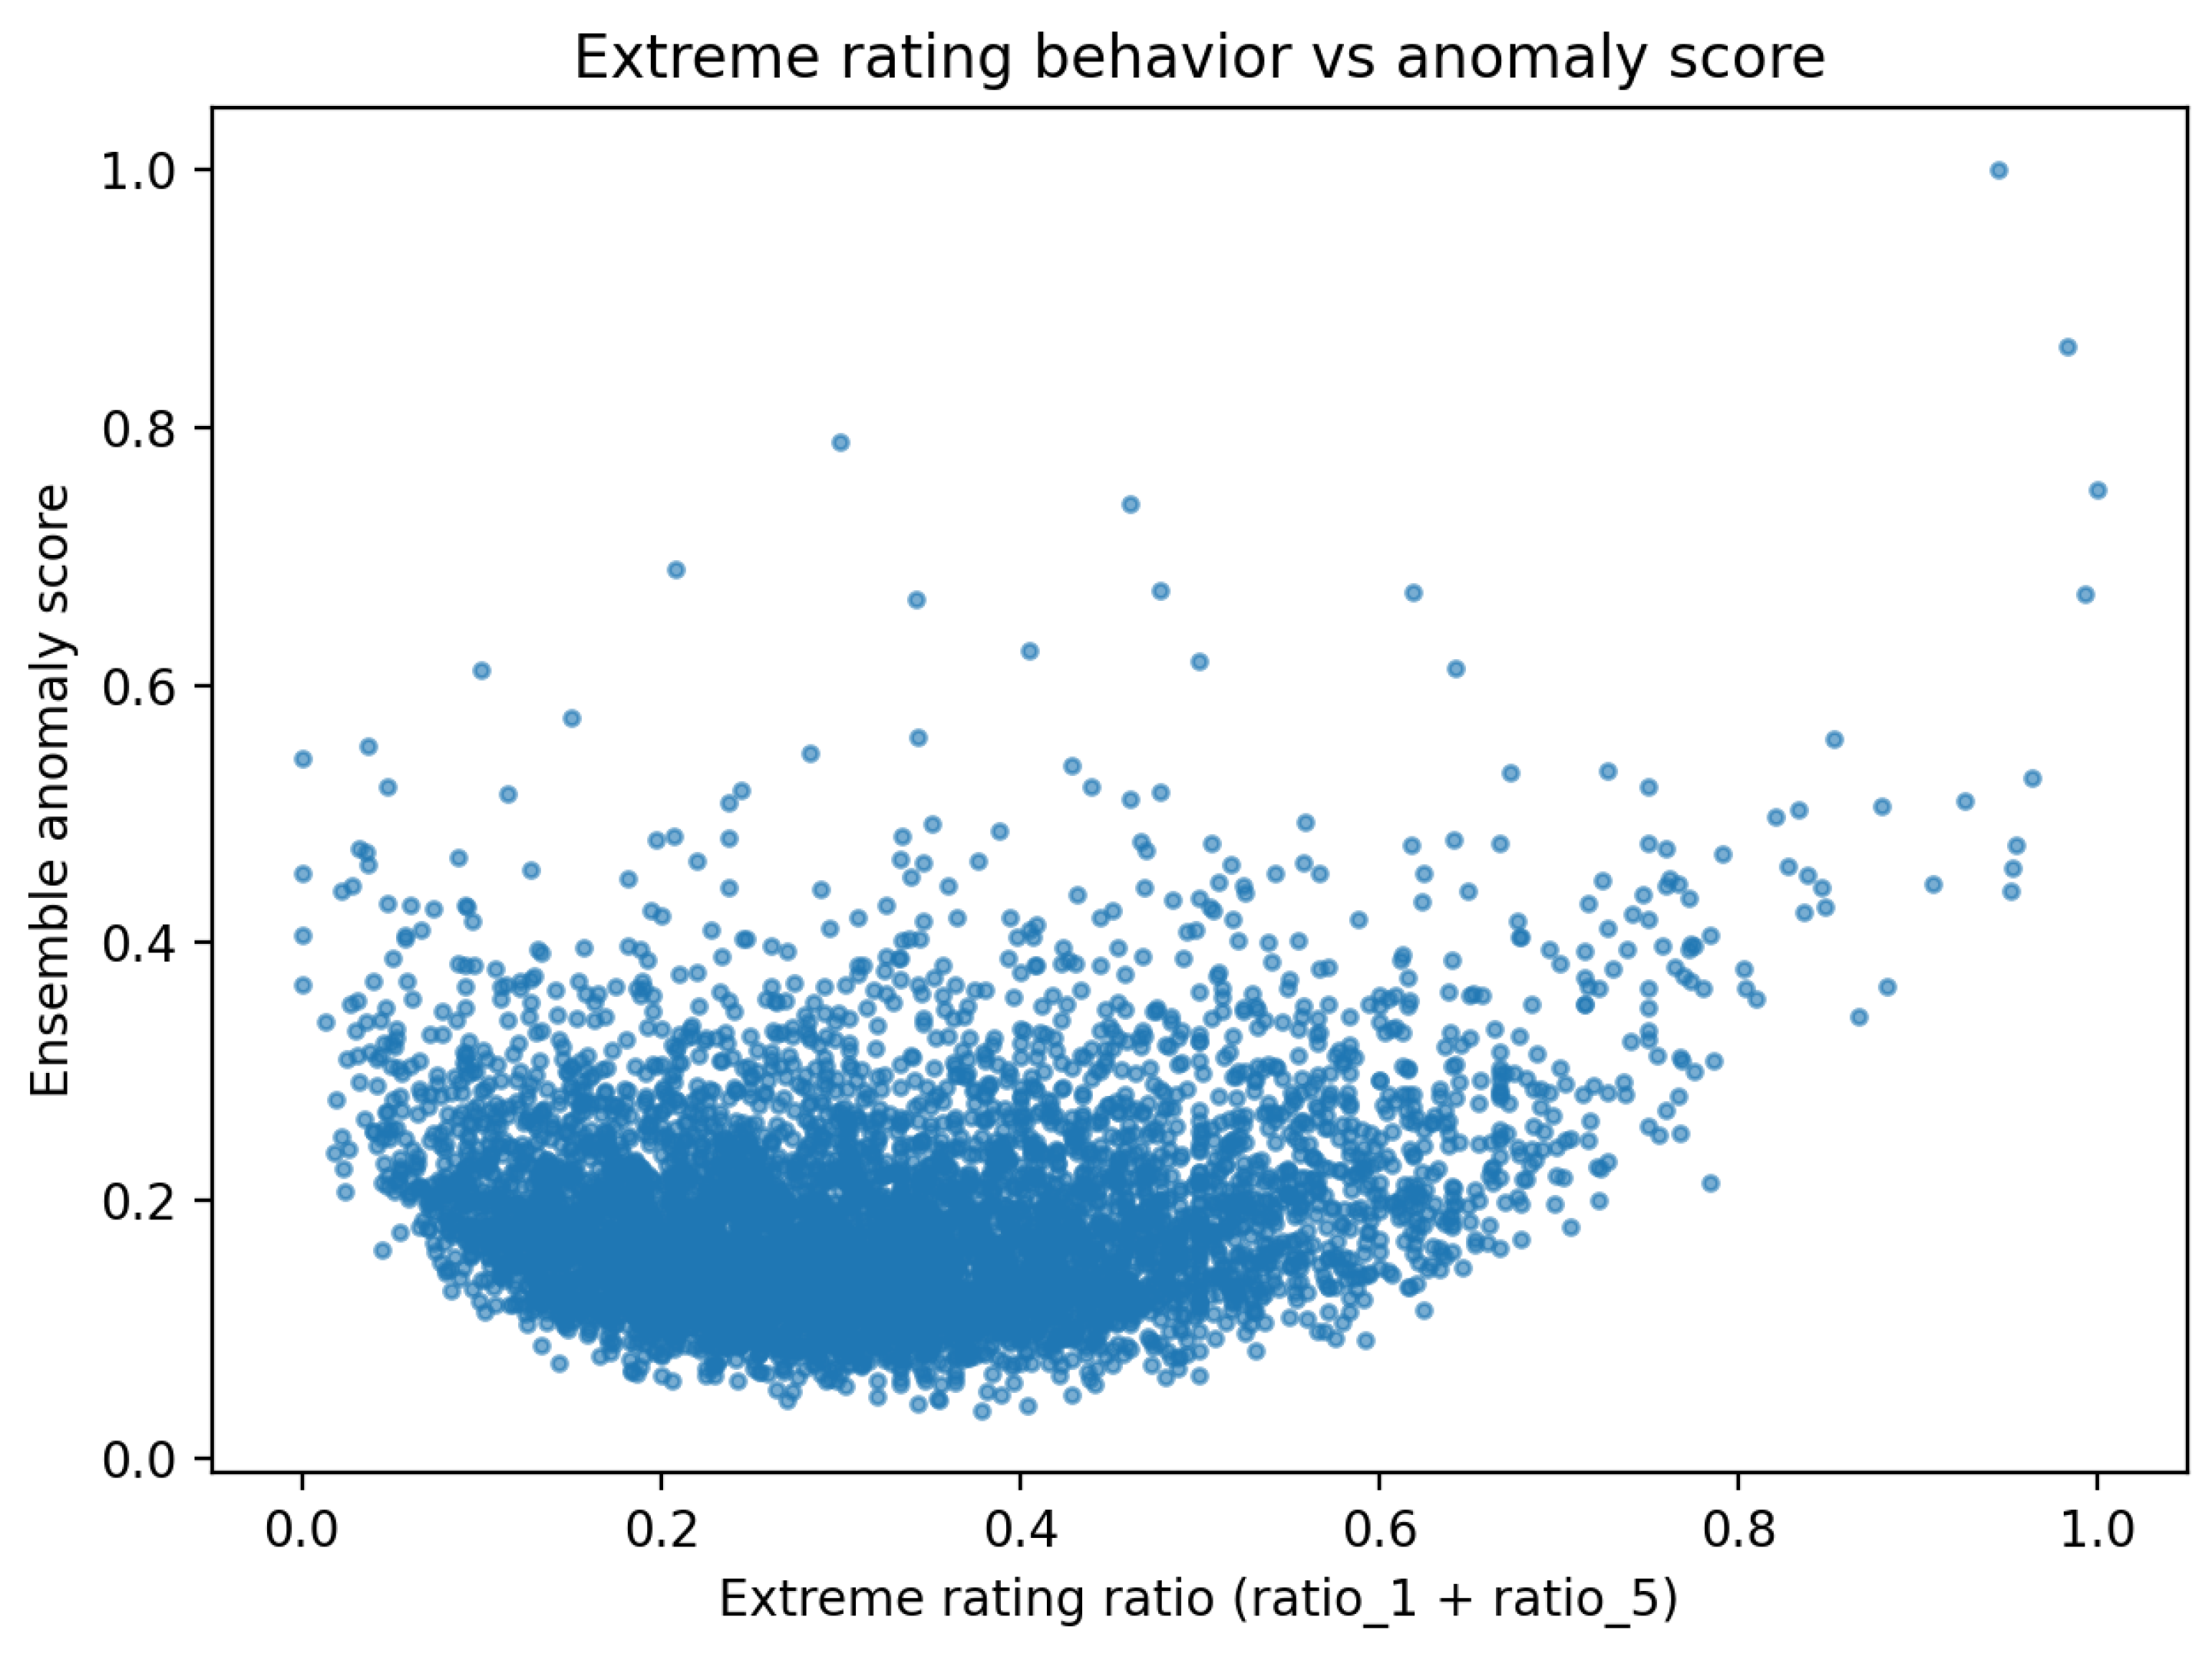
Figure 4.
Relationship between temporal burstiness and ensemble anomaly scores.
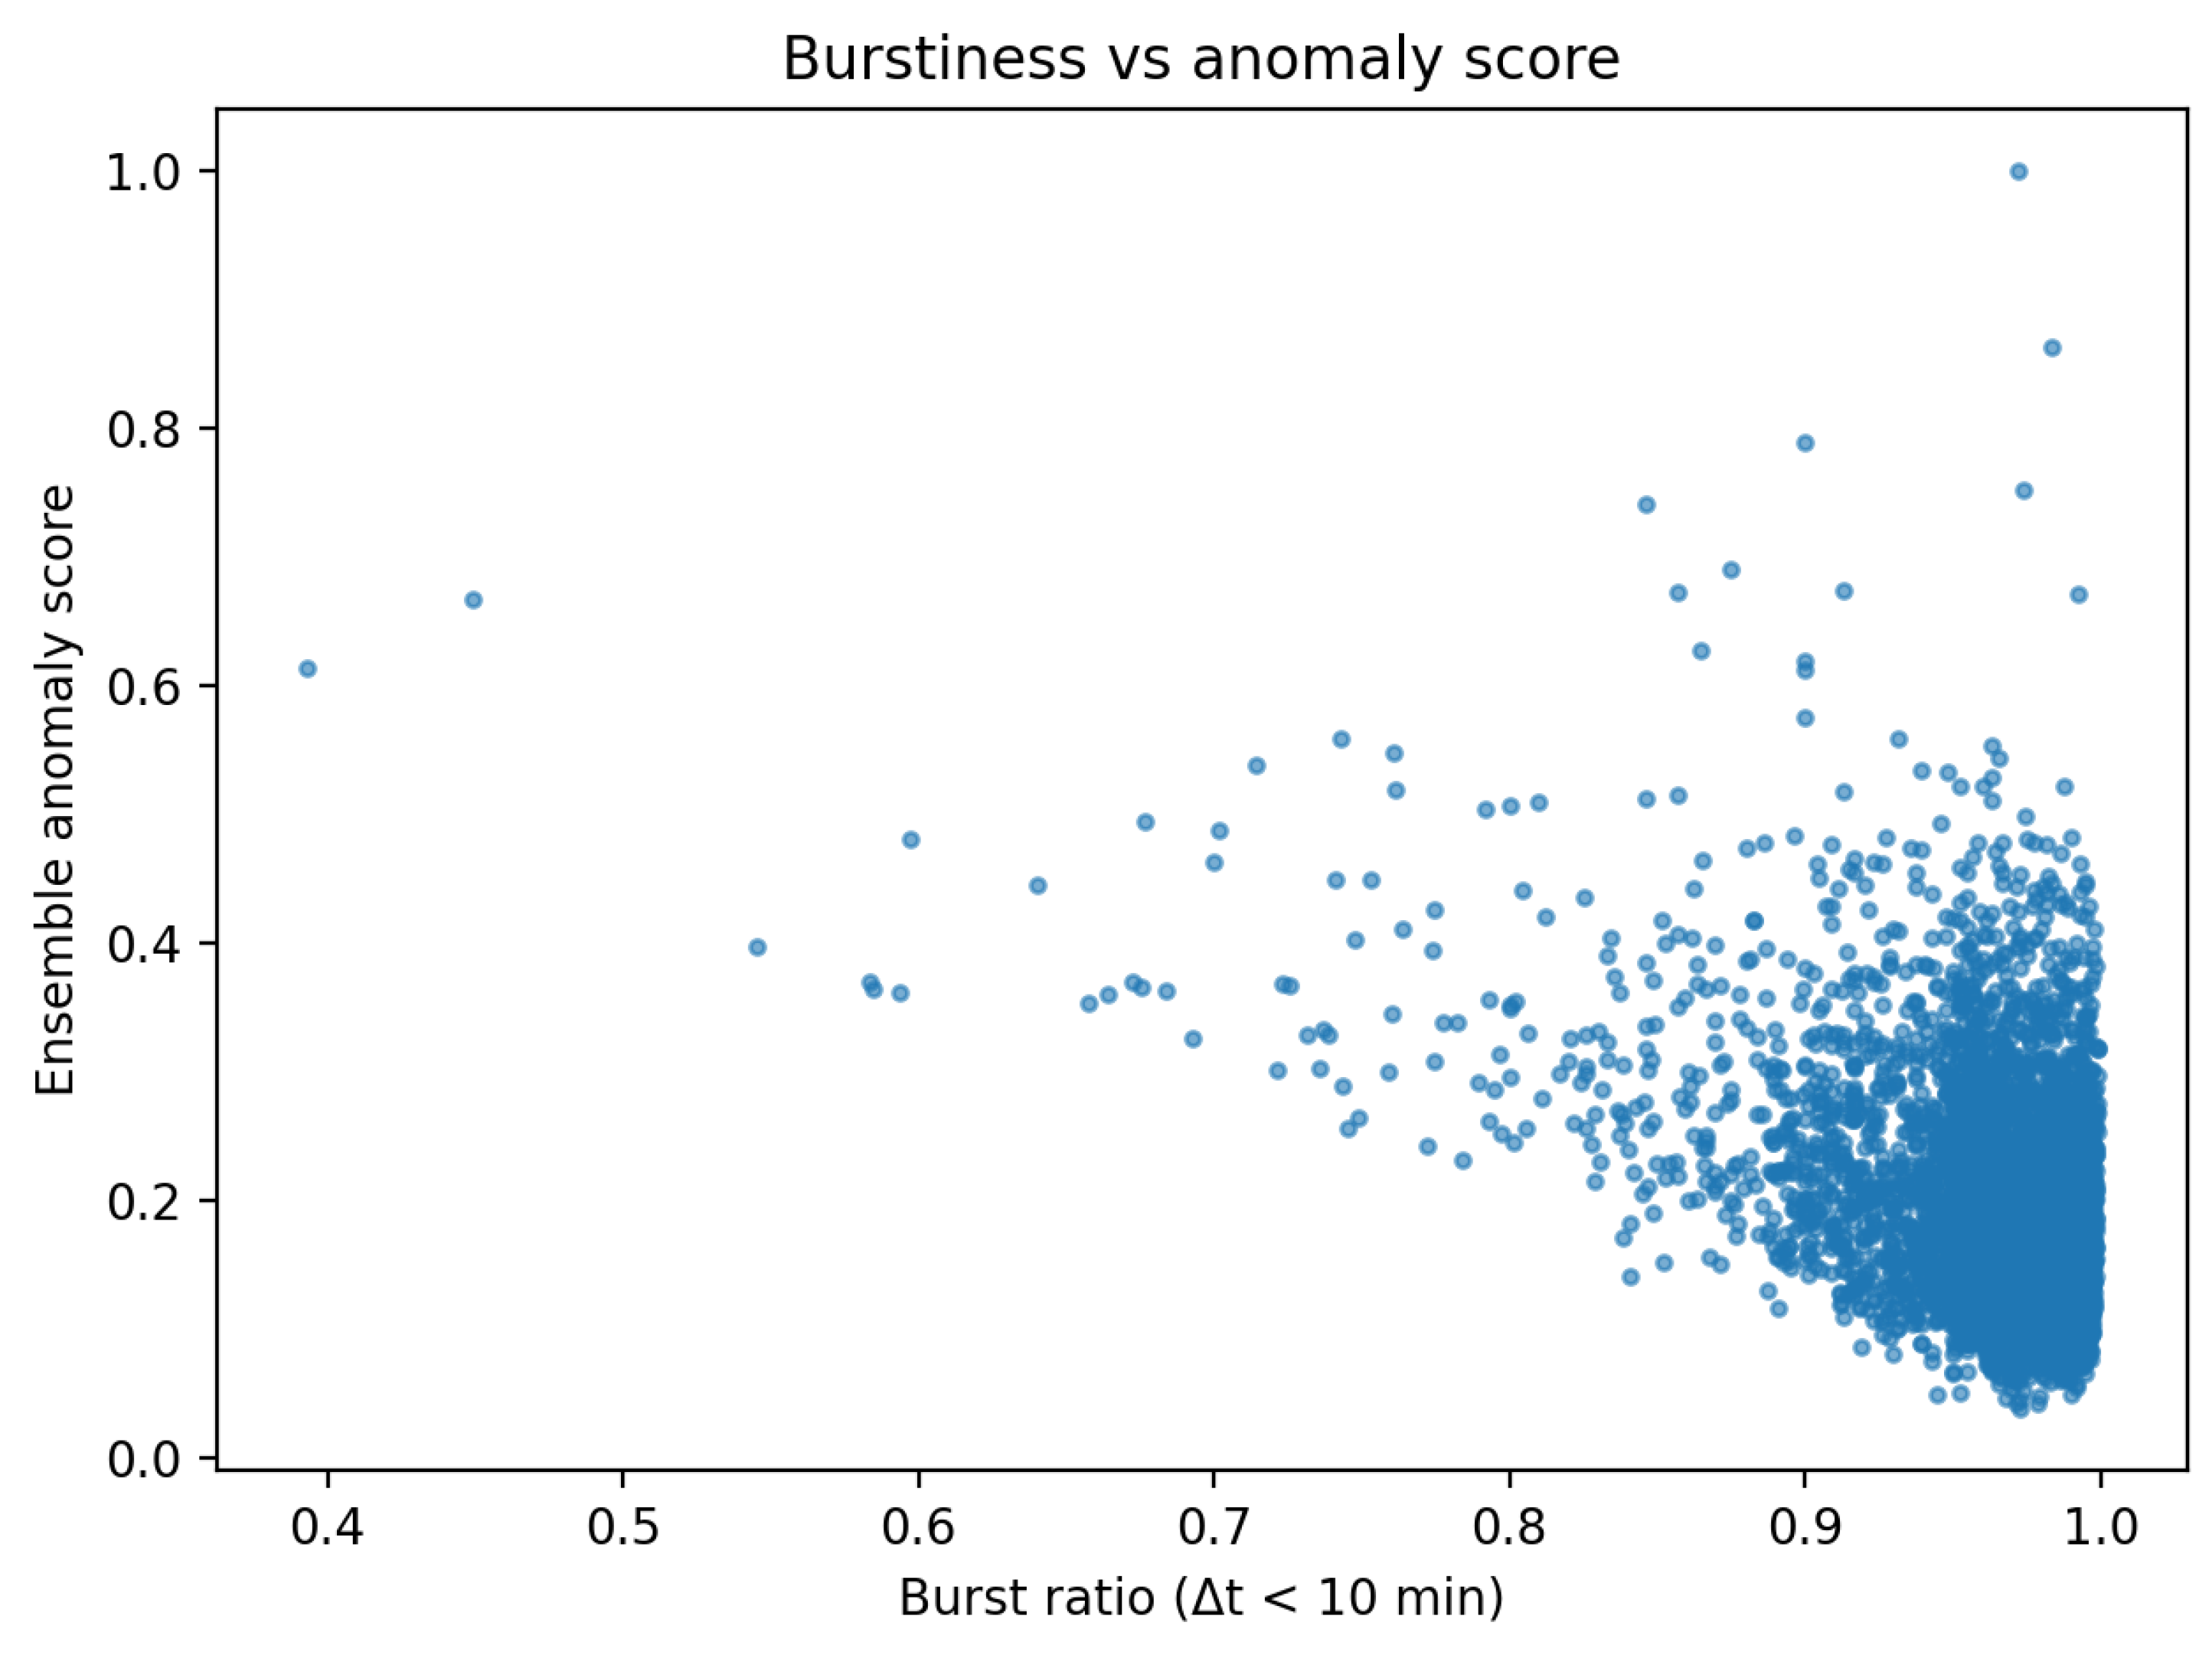

Table 1.
Hyperparameter settings for the unsupervised detection models.
| Model | Hyperparameter | Value |
| Isolation Forest | Number of trees () | 300 |
| Subsample size () | auto | |
| Contamination rate | 0.02 | |
| Parallel jobs () | -1 | |
| Random seed | 42 | |
| One-Class SVM | Kernel | RBF |
| (upper bound on anomalies) | 0.02 | |
| scale | ||
| Shrinking | True | |
| Autoencoder | Encoder layers | [, 64, 16] |
| Decoder layers | [16, 64, ] | |
| Activation function | ReLU | |
| Loss function | MSE | |
| Optimizer | Adam | |
| Learning rate | ||
| Training epochs / batch size | 25 / 256 |
Table 2.
Percentile-based anomaly score thresholds using the ensemble model.
| Top percentile (%) | Threshold value | Flagged users |
| 1 | 0.4617 | 61 |
| 2 | 0.4149 | 121 |
| 5 | 0.3477 | 302 |
Table 3.
Agreement between unsupervised detection models measured by Jaccard similarity on the top-K ranked users.
Table 3.
Agreement between unsupervised detection models measured by Jaccard similarity on the top-K ranked users.
| Model pair | Jaccard similarity |
| Isolation Forest vs One-Class SVM | 0.282 |
| Isolation Forest vs Autoencoder | 0.163 |
| One-Class SVM vs Autoencoder | 0.282 |
| Ensemble vs Isolation Forest | 0.471 |
| Ensemble vs One-Class SVM | 0.449 |
| Ensemble vs Autoencoder | 0.408 |
Disclaimer/Publisher’s Note: The statements, opinions and data contained in all publications are solely those of the individual author(s) and contributor(s) and not of MDPI and/or the editor(s). MDPI and/or the editor(s) disclaim responsibility for any injury to people or property resulting from any ideas, methods, instructions or products referred to in the content. |
© 2026 by the authors. Licensee MDPI, Basel, Switzerland. This article is an open access article distributed under the terms and conditions of the Creative Commons Attribution (CC BY) license (http://creativecommons.org/licenses/by/4.0/).
Copyright: This open access article is published under a Creative Commons CC BY 4.0 license, which permit the free download, distribution, and reuse, provided that the author and preprint are cited in any reuse.


