Submitted:
12 February 2026
Posted:
13 February 2026
You are already at the latest version
Abstract
Control charts are widely used in the industrial world to monitor the average and variability of production processes. Max-Half-Mchart is a multivariate control chart that is less effective in handling many outliers. This research aims to develop a control chart that is more resistant to outliers by using Minimum Regularized Covariance Determinant (MRCD). MRCD is a development of the MCD method which is better at dealing with 'fat data', namely situations where the number of variables is greater than the number of observations. The performance evaluation of the robust Max-Half-Mchart control chart based on MRCD using Average Run Length (ARL) against shifts in process mean, process variance, and simultaneous shifts. In addition, a comparison is made of the outlier detection accuracy between the robust Max-Half-Mchart based on MRCD and the standard Max-Half-Mchart. The research results show that the MRCD-based Robust Max-Half-Mchart provides better accuracy and Area Under Curve (AUC) in detecting outliers compared to the traditional Max-Half-Mchart, especially at outlier levels of 10%, 20%, 30%, and 40%. Application of this method to cement quality data also shows superiority in detecting outliers.
Keywords:
robust multivariate
; simultaneous control chart
; Max-Half- M-chart
; minimum regularized covariance determinant
1. Introduction
Product quality control is an action to ensure that products meet predetermined standards. Statistical Process Control (SPC) is a critical approach to quality management in the modern industrial world [1]. One of the essential tools in Statistical Process Control (SPC) used to graphically depict the quality characteristics of a product or process is the control chart [2]. The control chart was first conceived by Walter A. Shewhart in 1924, and it is also known as the Shewhart control chart [3]. These control charts are used to monitor process quality characteristics to identify specific causes of variability in univariate data [4]. The Shewhart control chart had shortcomings in dealing with small shifts, so control charts were developed Exponentially Weighted Moving Average (EWMA) [5] and Cumulative Sum (CUSUM) [6] which are good for detecting small shifts in process parameters.
In various subsequent studies, control charts were developed into several types according to the type of data used. Multivariate control charts are a type of control chart that is capable of monitoring data with several characteristics [7]. The first research on multivariate control charts involved Hotteling, a control chart used to detect the average vector of a process [3]. Control charts have also been developed to observe the covariance matrix of a process, such as generalized variance control charts [8] and successive diference charts [9].
Along with the development of industrial needs in maintaining product quality, control charts are needed that are able to handle multivariate data simultaneously for both subgroup and individual observations [10]. There are three types of simultaneous control charts that have been successfully developed, namely Exponentially Weighted Moving Average (EWMA) type charts [11], Cumulative Sum (CUSUM) [12,13] and Shewhart [14,15]. The Maximum Multivariate Exponentially Weighted Moving Average (Max-MEWMA) chart is a robust simultaneous control chart for a multivariate normal distribution, but can only be used to monitor subgroup observations [16]. The use of Max-MEWMA statistics on subgroups can be considered as a calculation that reflects the maximum value calculated from a combination of historical data and future observations [17]. The Maximum Multivariate Cumulative Sum (Max-MCUSUM) chart is a simultaneous control chart that can be used to monitor individual and subgroup observations, but the observation data must meet the assumption of a multivariate normal distribution and is a control chart that is sensitive to small process shifts [18]. Then, Khusna [19] developed Max-MCUSUM for data containing autocorrelation. The Maximum Multivariate Control Chart (Max-Mchart) chart is a Shewhart type multivariate control chart that combines Hotelling statistics and generalized variance statistics to be able to simultaneously monitor process variability and averages for large shifts [20]. Sabahno [21] developed a novel scheme to simultaneously monitor the mean and variability of multivariate normal processes. However, the distribution used for process variability in cases with more than two dimensions follows a gamma distribution, which, when the number of dimensions exceeds two, is unknown but can be approximately modeled with specific parameters [22].
The development of the Max-Mchart chart uses a half-normal distribution approach known as the Maximum Half-Normal Multivariate Control Chart (Max-Half-Mchart) control chart [23]. This modification was made because, in certain cases, the probability value of the Chi-square distribution is close to 0 so that the quantile value of the standard normal distribution has a large negative absolute value and will be detected as an out of control signal on the Max-Mchart chart. A half-normal distribution approach that has original values from 0 to ∞ avoids negative values in calculating quantile values so that it is able to overcome this problem. The Successive Difference statistic was chosen to replace the Generalized Variance statistic so that the Max-Half-Mchart can be applied to individual data. Based on the simulation results, it was found that the Max-Half-Mchart control chart was able to detect small or large shifts in the average and covariance matrix. The Max-Half-Mchart statistic is also consistent with Hotelling statistics and Successive Difference statistics [23].
In Max-Half-Mchart, a high percentage of outliers can reduce the effectiveness of the control chart in identifying and detecting data that is outside the control limits . This can be overcome by improving the estimation of the mean vector and covariance matrix so that the control chart can work well. Maleki [24] showed that control charts with robust mean vector estimators and covariance matrices have much better performance than classical estimators when there are outliers. Minimum Covariance Determinant (MCD) is a well-known robust estimator method [25]. MCD has better accuracy than other robust estimator methods [26], [27]. The way MCD works is by estimating the location and distribution matrix using a subset of a certain size (h) with the lowest sample covariance determinant. Although MCD was introduced in 1984, this method is still rarely used because there are several shortcomings in it, therefore several developments have been made to the MCD method which is able to overcome these problems. Reweighted Minimum Covariance Determinant (RMCD) is an extension of the Minimum Covariance Determinant (MCD) that incorporates generalizations by applying weights based on the ranking of Mahalanobis distances, allowing it to effectively handle intermediate outliers [18]. Fast Minimum Covarinace Determinant (Fast-MCD) [28] uses a new algorithm that is able to obtain robust estimators more quickly than the MCD method. Deterministic Minimum Covariance Determinant (Det-MCD) [29] uses the same iteration steps as Fast-MCD but does not draw random subsets and uses a deterministic algorithm to estimate the location and distribution matrix which is usually faster than Fast-MCD.
To get a good estimator accuracy value using the MCD method, it is recommended to use the number of observations () 5 times greater than the number of variables () [29]. This creates limitations on existing estimators in dealing with “fat data”, namely data with a small number of observations () compared to the number of variables (). Minimum Regularized Covariance Determinant (MRCD) is the result of the development of the MCD method which is able to overcome this problem [30]. MRCD replaces subset-based covariance with estimates of covariance on regularized data [31]. The MRCD estimator is able to provide good results even when the numbers [32].
Based on several ideas explained previously, this research aims to develop a Max-Half-Mchart control chart based on a robust Minimum Regularized Covariance Determinant (MRCD) estimator. This is expected to increase the robustness of the control chart in dealing with outliers in the data and be able to handle cases with a small number of observations compared to a large number of observations. The performance of the proposed MRCD-based Max-Half-Mchart robust control chart is compared with the performance of the Max-Half-Mchart control chart in the application of simulation data and cement quality characteristics data at PT Semen Tonasa.
2. Material and Methods
2.1. Maximum Half-Normal Multivariate Control Chart (Max-Half-Mchart)
The Max-Half-Mchart is developed by combining the statistics of the Hotelling’s control chart and Generalized Variance with the half-normal distribution approach. The Chi-square distribution is only relevant for positive values. When the probability is very low, the quantiles generated from the standard normal distribution tend to become large negative numbers [23]. The approach using the half-normal distribution is employed to shift the domain to positive values, thus addressing this issue. The control chart developed from Max-Mchart using the half-normal distribution is called the Maximum Half-Normal Multivariate Control Chart (Max Half-Mchart). The statistics for process mean and variability for individual observations as follows:
and
where is the cumulative distribution function of the standard half-normal random variable. is the cumulative distribution function of the chi-square random variable with degrees of freedom.
Thus, the statistics for the Max-Half-Mchart for individual observations are obtained, which is the maximum value of the mean and variability statistics as follows:
2.2. Minimum Regularized Covariance Determinant (MRCD)
Minimum Regularized Covariance Determinant (MRCD) is a robust estimator method resulting from the development of the MCD method introduced by Boudt [32]. The MRCD estimator was created to overcome the problem of the inability of the MCD estimator to deal with “fat data”. The way MRCD works is by replacing the subset-based covariance of MCD with a subset-based regularized covariance estimator which makes all determinants smallest.
The first stage in obtaining an MRCD estimator is to standardize the observation data becomes , which is a collection of as in the following equation:
where a constant factor and , where which is close to the value of half the number of observations, that is, the -th value is taken from the ordered statistics of distance between points with . When the standardized data has been obtained, it is continued by searching for a subset of observations . The next step is to define the covariance matrix with size subsample from data as in the following equation:
is obtained by finding the smallest determinant of the covariance matrix in each in the following equation
In this way, the average vector and covariance matrix of the MRCD estimator for the observation data are obtained as follows:
2.3. Average Run Length (ARL)
The performance of a control graph can be measured by how quickly the control graph can detect signals that indicate a process shift that is out of control [33]. The ability to detect shifts quickly indicates the level of sensitivity of the control chart to changes in the process. To measure this performance, a method called Average Run Length (ARL) [4].
Run length, in this context, is a random variable that refers to the number of sample data points that need to be plotted on a control chart before the first signal indicating an out-of-control condition is detected. ARL is the average value of this run length. In situations where the process is in control, we want a high ARL value, which indicates that the control graph produces few false alarms. However, when the process is considered to be out of control, and changes in average characteristics or variability occur that do not match targets, relatively low ARL values are desired. ARL itself can be divided into two types, ARL0 (ARL when the process is in control) and ARL1 (ARL when the process is out of control). ARL0 is an in-control ARL obtained by a simulation process from 1000 normally distributed data samples [23].
The previous equation refers to type I error, which is the probability of detecting an out-of-control signal on the control graph but the process is still in control. The value is very important in quality control because it measures the level of risk of receiving a false alarm that can cause unnecessary action on a process that is actually still running well. In many applications, a commonly used value of when three-sigma control limits are used is = 0,0027. Meanwhile, ARL1 is obtained by adding a shift of to the mean and to the variance . ARL1 measures how many observations are expected before a signal out of control limits is received. Good performance in quality control will result in lower ARL1 values, indicating faster detection of changes in the production process that could threaten product quality.
2.4. Outlier Detection
One important component of a control chart is the provision of control limits, which determine the limits for acceptable variation in a process. When outliers are correctly identified in a control chart, it indicates that the monitoring system is functioning properly and can provide relevant information [34]. The level of accuracy or error level is used to measure the accuracy of a classification method. Precision can be divided into two types: First, True Positives (TP), when the control chart detects an outlier and it is true that there is an outlier. Second, True Negatives (TN), a condition when the control chart detects no outliers and it is true that there are no outliers [35].
The errors that may occur can be divided into two types: Firstly, False Positives (FP), errors in conditions where the control chart detects an outlier that actually does not exist. Second, False Negatives (FN), errors in conditions where the control chart fails to detect outliers that actually exist.
The levels of precision used are accuracy, FP rate, FN rate, and AUC, so you can see how good the classification results are. Firstly, accuracy is the most known calculation in classification modeling. Accuracy is the percentage of numbers predicted correctly over all data. The mathematical equation can be written in the equation (10) [5].
Both FP Rate and FN Rate, there are two types of errors, namely FP rate and FN rate. FP rate can be calculated with the following equation.
Meanwhile, the FN rate can be calculated using the following equation.
Third, Area Under Curve (AUC), AUC is a method for calculating the value of the area under the Receiver Operating Characteristic (ROC) curve. A higher AUC value indicates that the classification method is better. The AUC equation can be written as follows.
2.5. MRCD-Based Max-Half-Mchart
This study modifies the classic estimators of mean vectors and covariance matrix from equation (1) and (2) by replacing them with estimated values derived from robust estimators of the mean vector and covariance matrix. The statistics for process mean and variability based on MRCD for individual observations are defined as follows:
and
Thus, the statistics for the Max-Half-Mchart based on MRCD for individual observations are obtained as follows:
Since , the Max-Mchart only has an Upper Control Limit (UCL). The UCL for the Max-Half-Mchart is determined using a bootstrap approach. The steps to obtain the statistics and control limits for the robust Max-Half-Mchart are calculated using Algorithm 1.
| Algorithm 1 Bootstrap Control Limit | |
| Step 1. | Calculating the estimator value of the mean vector and the covariance matrix using equations (7) and (8). |
| Step 2. | Calculate the and |
| Step 3. | Find the statistical value of equation (16) using and which were obtained in step 2. |
| Step 4. | Carry out sampling by returning l bootstrap samples from the statistic on n observations, l=1,2,…,1000. |
| Step 5. | Calculates the percentile 100(1-α) for each statistic |
| Step 6. | Calculating bootstrap-based UCL using equation which produces ≅ 370. |
The evaluation of the Robust MRCD-Based Max-Half-Mchart againts process shift is conducted using the Average Run Length (ARL) criterion. The steps are divided into two main categories as follows.
| Algorithm 2 Performance Evaluation ARL | |
| Step 1. | Generate data and labeled 0, with which is a vector of size p × 1 where p = 5; 10, and where ρ = 0.3;0.5;0.7. |
| Step 2. | Calculate and in the MRCD estimator using equations (3) and (4). |
| Step 3. | Calculate the values of and values using equations (14) and (15). |
| Step 4. | Find the statistical value of equation (16) using and that have been obtained previously. |
| Step 5. | Set the UCL as calculated by Algorithm 1 |
| Step 6. | Record the run length, which is the number of observations until the first out-of-control signal occurs, using the UCL value from step 5. |
| Step 7. | Repeat steps 1-6 1000 times. |
| Step 10. | Calculate |
The steps for evaluating the performance of MRCD-based Max-Half-Mchart robust control charts against outliers are calculated using Algorithm 3.
| Algorithm 3 Performance Evaluation against Outliers | |
| Generate data and labeled 0, with which is a vector of size p × 1 where p = 5; 10, and where ρ = 0.3;0.5;0.7. | |
| Step 2. | Generate data with p = 5;10 and set according to the desired scenario. are 5%, 10%, 20%, and 40% of the total data. |
| Step 3. | From , is the combination of and |
| Step 4. | Forming is data data that has been randomized. |
| Step 5. | Performs step 1-6 on Algorithm 2. |
| Step 9. | Label 1 as outlier for stochastic and label 0 for non-outliers. |
| Step 10. | Comparing the category results based on robust Max-Half-Mchart with the initial category, then forming a confusion matrix and calculating accuracy, FP rate, FN rate, and AUC |
| Step 11. | Perform the loop 1000 times. |
3. Results
3.1. Performance of Robust MRCD-Based Max-Half-Mchart in Process Shift
The performance of the proposed MRCD-Based Max-Half-Mchart robust control chart is evaluated using the Average Run Length (ARL) criterion. A smaller ARL value indicates that the control chart is responsive and can signal as quickly as possible after a deviation occurs. In this study, the ARL calculation involves three types of shifts: shifts in the process mean, process variance, and shifts in both. The ARL calculation for the robust Max-Half-Mchart control chart is performed following the steps outlined in Algorithm 2. Table 1, Table 2 and Table 3 show the evaluation results of the proposed control chart’s ARL with variations in the number of variables () and correlation levels between variables ().
Table 1, Table 2 and Table 3 present the ARL values for 12 shifts occurring in the process mean, variance, and both (mean and variance). The smallest ARL value is found in Table 3, which involves simultaneous shifts in both the mean and variance of the process. The ARL value for the variance shift in Table 2 is higher compared to the ARL value in Table 3 (mean and variance shifts), although the difference is not significant. The MRCD-based Max-Half-Mchart robust control chart shows high sensitivity to shifts in both variance and the combined mean and variance, as evidenced by the large differences in Table 2 and Table 3 for shifts 0 and 1. Table 1, which highlights shifts in the process mean, shows the highest ARL value among the three tables. Therefore, the MRCD-based Max-Half-Mchart robust control chart has the highest sensitivity when shifts occur simultaneously in both the variance and the mean of the process. The sensitivity to shifts in variance is almost the same as that for simultaneous shifts in both variance and mean. The chart proposed in this study is more sensitive to changes occurring in the process variance compared to the process mean.
The quality characteristics also affect the performance of the chart. In this study, two variations of and were used, with correlation levels between variables adjusted to , , and . Based on Table 1, the ARL values indicate that the proposed robust Max-Half-Mchart control chart with consistently detects process mean shifts faster than with . The difference in ARL between and is not significant when the shifts reach to . Subsequently, Table 2 shows the comparison of ARL between and when a shift occurs in the process variance. The proposed control chart with detects the shifts faster compared to . However, the ARL results show similarities when to . Based on these results, it can be concluded that the number of characteristic variables used in the Robust Max-Half-Mchart has an impact on the speed of detecting process shifts.
Moreover, Table 1, Table 2 and Table 3 show that the correlation level affects the ARL values of process shifts for and . The ARL evaluation results consistently indicate that always yields the lowest value, while always gives the highest value among the three. These results suggest that the correlation level between variables influences the sensitivity of the robust Max-Half-Mchart in detecting shifts in the process mean. The lower the value, the faster the detection of process mean shifts. In contrast, for process variance shifts, when , the ARL value for is the lowest, while yields the highest ARL. However, once the process variance shift reaches , the ARL values obtained for each tend to converge. Therefore, the higher the value, the faster the detection of process variance shifts.
3.1. Performance of Robust MRCD-Based Max-Half-Mchart Againts Outlier
The robust Max-Half-Mchart chart of individual observations in this study is a development of the Max-Half-Mchart chart with modifications to the mean and covariance estimators used. The modification using the MRCD estimator is able to increase the robustness of the control chart to the presence of outliers with a large percentage.
Outliers are identified when the observation values exceed the specified control limits. A significant number of outliers can be an indicator of a serious problem in the production process. In this study, a comparison of the performance of outlier detection tests on the MRCD-based robust Max-Half-Mchart chart with Max-Half-Mchart chart was conducted. Observations were made by giving several variations, namely the number of characteristic variables () and the level of correlation between variables ().
The detail results of the comparison of outlier detection on both charts are shown in the following table.
Table 4 shows the results of outlier detection using the MRCD-based Robust Max-Half-Mchart Outlier method with data dimension . The effect of varying the proportion of outliers (%out) and the value of correlation parameter and on five evaluation metrics, namely accuracy, false positive rate (FP Rate), false negative rate (FN Rate), and area under curve (AUC). In general, the higher the percentage of outliers, the accuracy and AUC tend to decrease, while the FN Rate increases, indicating a decrease in detection performance. Higher values of also appear to affect model performance, especially in extreme outlier conditions (e.g %out ≥ 3).
Table 5 shows the results of outlier detection with the MRCD-based Robust Max-Half-Mchart Outlier method for dimensionals data. The evaluation was conducted at three levels of correlation between variables (, and ) and five levels of outlier proportion levels ranging from 5% to 40%. The metrics used include accuracy, false positive rate (FP Rate), false negative rate (FN Rate), and area under curve (AUC). In general, an increase in the proportion of outliers leads to a decrease in accuracy and AUC, and an increase in FN Rate. Meanwhile, at higher , the performance of the method also tends to decrease, indicating that the correlation between variables and the level of data contamination have a significant effect on the effectiveness of outlier detection. The highest AUC value was found in the condition of and low %out, indicating the best performance of the model in the condition of less contaminated data and moderate correlation.
3.1.1. Comparison of Outlier Detection Performance Accuracy Levels
The accuracy level of the control chart indicates its ability to detect changes or deviations in the process. The higher accuracy rate means the better performance of the control chart in detecting outliers. In this section, a comparison of the outlier detection accuracy of MRCD-based Max-Half-Mchart robust charts with Max-Half-Mchart is carried out. Visualization is done based on the correlation level () used, which is 0.3, 0.5, and 0.7. The results of the outlier detection performance comparison based on the accuracy level are shown in Figure 1.
When the percentage of outliers is between 5% and 10%, the accuracy of the three charts shows similar results. However, when the percentage of outliers is above 10%, the MRCD-based Max-Half-Mchart robust chart consistently shows a higher accuracy rate than the Max-Half-Mchart chart for each number of characteristic variables (). This shows that MRCD-based Max-Half-Mchart robust charts have better accuracy than Max-Half-Mchart charts when the percentage of outliers is large. The accuracy results of Max-Half-Mchart robust charts ( and ) at 5-10% outlier percentage are not much different. The difference in accuracy starts to become apparent when the percentage of outliers is 20%-40%, where consistently shows higher accuracy than . These results show that MRCD-based Max-Half-Mchart robust charts have better accuracy with a large number of characteristic variables.
The variation of correlation level () does not seem to affect the accuracy of the Max-Half-Mchart chart. The difference in accuracy results at each correlation level is shown by the MRCD-based Max-Half-Mchart robust chart at a large percentage of outliers. The MRCD robust chart of shows the lowest accuracy, while shows the highest accuracy.
3.1.2. Comparison of Outlier Detection Performance Based on False Positive Rate
False positive rate (FP rate) on a control chart indicates the error rate in providing warning signals or corrective actions when there is no actual change or deviation in the process. In other words, the system does not give false alarms or unnecessary actions. By having a low false positive value, the control chart becomes more reliable and efficient as it only provides signals when needed. In this subsection, a visualization of the false positive rate (FP rate) comparison of outlier detection between MRCD-based Max-Half-Mchart robust charts and Max-Half- Mchart is conducted. Visualization is done based on the correlation level () used, which is 0.3, 0.5, and 0.7. The results of the outlier detection FP rate comparison on both charts are shown in Figure 2.
At outlier percentages of 5%–10%, the three charts exhibit comparable FP rates. When the percentage of outliers exceeds 10%, the MRCD-based Max-Half-Mchart robust chart produces higher FP rates than the Max-Half-Mchart for both values of the characteristic variables . This indicates that the MRCD-based Max-Half-Mchart robust chart is more more sensitive to the presence of outliers, while the Max-Half-Mchart remains relatively stable. For the MRCD-based Max-Half-Mchart robust chart, the FP rates for and are similar at low outlier levels (5%-10%). The difference in FP rate starts to become apparent when the percentage of outliers is 20%–40%, where consistently results in a higher FP rate. This suggests that increasing the number of characteristic variables leads to a higher FP rate in the MRCD-based Max-Half-Mchart robust chart.
The variation of the correlation level does not seem to affect the FP rate of the Max-Half-Mchart chart. However, for the MRCD-based robust chart, differences across correlation levels become evident at higher outlier percentages, with yielding the lowest FP rate and the highest.
3.1.3. Comparison of Outlier Detection Performance Based on False Negative Rate
False negative rate (FN rate) on a control chart occurs when there is a change or deviation in the process, but the control system does not provide a warning signal. A high FN rate indicates that the system is increasingly unresponsive to actual changes in the process. A good control chart has a low FN rate. In this section, a visualization of the comparison of the FN rate of outlier detection between MRCD-based Max-Half-Mchart and Max-Half-Mchart robust charts is conducted. Visualization is done based on the correlation level () used, which is 0.3, 0.5, and 0.7. The results of outlier detection performance comparison based on FN rate are shown in Figure 3.
Figure 3 shows that the FN rate of the MRCD-based robust Max-Half-Mchart chart is always smaller than the FN rate of the Max-Half-Mchart chart for the same number of characteristic variables (). The FN rate on the chart shows a high increase in value as the percentage of outliers increases. While the robust MRCD chart shows a difference that is not too far at each increase in the percentage of outliers given. In the three visualizations above, it is found that consistently gives a lower FN rate than in both types of charts. MRCD-based Max-Half-Mchart robust charts show differences in FN rate at each correlation level. The results of the variation in the level of correlation between the characteristic variables above show that the more increases, the higher the FN rate.
3.1.4. Comparison of Outlier Detection Performance Based on Area Under Curve Value
Area under curve (AUC) is used to measure the extent to which the system can distinguish between normal and abnormal situations in a process. The greater the AUC value, the better the system performance in distinguishing between normal and abnormal conditions. In this section, we visualize the comparison of the AUC value of outlier’s detection of MRCD-based Max-Half-Mchart and Max-Half-Mchart robust charts. Visualization is done based on the level of correlation () used, namely 0.3, 0.5, and 0.7. The results of the outlier detection performance comparison based on the AUC value are shown in Figure 4.
Figure 4 indicates that the AUC level of the MRCD-based robust Max-Half-Mchart chart is consistently higher than that of the Max-Half-Mchart chart for the same number of characteristic variables . The AUC level in the chart shows a clear increase as the percentage of outliers increases. Meanwhile, the MRCD-based robust chart shows relatively stable differences at each increase in the percentage of outliers.
From the three visualizations, it is observed that consistently results in a higher AUC level than in both the MRCD-based robust Max-Half-Mchart chart and the Max-Half-Mchart chart. The MRCD-based robust Max-Half-Mchart charts also exhibit differences in AUC level at each correlation level. The variation in the correlation level between the characteristic variables shows that as increases, the AUC level also increases.
3.3. Application of Max-Half-Mchart Robust Control Charts Based on MRCD for Cement Quality Characteristics Data
The application of control charts was carried out using multivariate data in a cement manufacturing company. The data measurements made include 47 observations (=47) with 10 quality characteristics (=10). The quality characteristics monitored in this study are presented in Table 6.
Before plotting the control charts, it is important to ensure that the variables used in the multivariate analysis are not significantly interdependent. A dependency test is performed to identify the relationship or dependency between the variables. The results of the dependency test are shown in Table 7.
The chi-square value with α=5% and 45 free degrees is 64.279. When compared to X2 count as in Table 5 of 183.937, it can be decided that reject 0 because the X2count > X2table value is 183.937 > 64.279. So, it is concluded that there is a relationship between quality characteristics.
The data plot using MRCD-based robust Max-Half-Mchart is compared with the plot using Max-Half-Mchart shown in Figure 5.
Figure 5 shows the robust Max-Half-Mchart chart detecting 14 out-of-control signals. Eight of these out-of-control signals were identified as B++ because a shift in process mean was detected. Three out-of-control signals were identified as V++ because a shift in process variability was detected, while the other three signals were identified as M++ because a shift in process mean and process variability occurred simultaneously. Meanwhile, the Max- Half-Mchart charts did not detect any out-of-control signals as shown in Figure 5. The results of the output comparison of the two control charts are presented in Table 8.
Based on Table 8, it can be seen that the MRCD-based Robust Max-Half-Mchart control chart has a better ability to detect out-of-control points compared to the standard Max-Half-Mchart. The MRCD method detects 14 out-of-control points, whereas the Max-Half-Mchart method detects none. Three points are caused by mean shifts, three by variability shifts, and eight by a combination of both. In addition, the upper control limit (UCL) value of the MRCD method is higher (3.438) than that of the standard method (3.18), which indicates that the MRCD method is more robust to outliers and is able to detect changes in the process more sensitively, whether in terms of average, variability, or a combination of both.
4. Conclusions
The comparative evaluation of outlier detection performance of MRCD-based Max-Half-Mchart robust charts with Max-Half-Mchart is as follows. First, higher accuracy is obtained by MRCD-based Max-Half-Mchart robust charts, especially when the percentage of outliers is large. The larger the number of characteristic variables (), the better the accuracy. Second, the lower FP rate is obtained by the Max-Half-Mchart chart. However, the MRCD-based Max-Half-Mchart robust chart still maintains a relatively low FP rate at a large percentage of outliers. The larger the number of characteristic variables (), the higher the FP rate. The third, smaller FN rate is obtained by the MRCD-based Max-Half-Mchart robust chart. The greater the number of characteristic variables (), the lower the FN obtained, and the better AUC obtained by the MRCD-based Max-Half-Mchart robust chart. The greater the number of characteristic variables (), the better the AUC obtained. In the application to cement quality data, the MRCD-based Max- Half-Mchart robust chart is more sensitive by detecting 14 outlier data while Max-Half-Mchart is unable to detect outliers at all. Therefore, PT Semen Tonasa is advised to adopt robust methods such as MRCD in the quality monitoring system, to support a more effective quality control process and be responsive to potential production problems.
For future research, it is recommended to make more diverse variations to the number of characteristic variables, vary the level of correlation between variables in phase two, compare the performance of MRCD-based Max-Half-Mchart robust control charts with other robust methods[36,37] , modify the approach to handle subgroup observation data, and apply this method to other data cases to test its consistency and reliability in various contexts. different contexts. Also, combination with machine learning can be applied to the proposed chart [38,39,40]
Author Contributions
Conceptualization, M.A. and F.F.; methodology, M.A. and M.M.; software, F.F. and R.N.A ; validation, D.A.S., M.H.L. and M.A.; formal analysis, M.M. and D.A.S.; investigation, M.A. and M.M.; resources, F.F.; data curation, D.A.S; writing—original draft preparation, M.A.; writing—review and editing, D.A.S.; visualization, F.F.; supervision, M.A. and M.H.L. All authors have read and agreed to the published version of the manuscript.
Funding
This research was funded by the Ministry of Higher Education, Science, and Technology, through Grant Number 038/E5/PG.02.00.PL/2024 and local Grant Number 1766/PKS/ITS/2024.
Institutional Review Board Statement
Not applicable.
Informed Consent Statement
Not applicable.
Data Availability Statement
The data presented in this study is available on request from the corresponding author. The data is not publicly available due to privacy.
Acknowledgments
The authors gratefully acknowledge financial support from the Ministry of Higher Education, Science, and Technology for this work under grant number 038/E5/PG.02.00.PL/2024.
Conflicts of Interest
The authors declare no conflict of interest.
References
- M. Alım and S. E. Kesen, “Statistical process control (SPC) and quality management,” in Smart and Sustainable Operations and Supply Chain Management in Industry 4.0, CRC Press, 2023, pp. 117–136.
- J. Oakland and J. S. Oakland, Statistical process control. Routledge, 2007.
- H. Hotelling, “Economic Control of Quality of Manufactured Product,” J. Am. Stat. Assoc., vol. 27, no. 178, pp. 215–236, Jun. 1932. [CrossRef]
- D. C. Montgomery, Introduction to Statistical Quality Control, 8th ed. New York: John Wiley & Sons, 2020.
- S. W. Roberts, “Control Chart Tests Based on Geometric Moving Averages,” Technometrics, vol. 1, no. 3, pp. 239–250, 1959. [CrossRef]
- E. S. Page, “Cumulative Sum Schemes Using Gauging Cumulative,” Technometrics, vol. 4, no. 1, pp. 97–109, 1962. [CrossRef]
- S. Bersimis, S. Psarakis, and J. Panaretos, “Multivariate statistical process control charts: an overview,” Qual. Reliab. Eng. Int., vol. 23, no. 5, pp. 517–543, 2007. [CrossRef]
- T. 117 Anderson and R. P. Mentz-Stanford, “The Generalized Variance of a Stationary Autoregressive Process,” J. Multivar. Anal., vol. 7, pp. 584–588, 1977. [CrossRef]
- M. B. C. Khoo and S. H. Quah, “Multivariate control chart for process dispersion based on individual observations,” Qual. Eng., vol. 15, no. 4, pp. 639–642, Jun. 2003. [CrossRef]
- H. Khusna, M. Mashuri, M. Ahsan, S. Suhartono, and D. D. Prastyo, “Bootstrap-based maximum multivariate CUSUM control chart,” Qual. Technol. Quant. Manag., vol. 17, no. 1, pp. 52–74, 2020. [CrossRef]
- K. A. F. Rifki, M. Ahsan, and M. Mashuri, “SIMULATION STUDIES PERFORMANCE OF EWMA-MAX MCHART BASED ON SYNTHETIC DATA,” BAREKENG: Jurnal Ilmu Matematika dan Terapan, vol. 19, no. 2, pp. 1353–1364, 2025. [CrossRef]
- S. W. Cheng and K. Thaga, “Multivariate max-CUSUM chart,” Qual. Technol. Quant. Manag., vol. 2, no. 2, pp. 221–235, 2005. [CrossRef]
- H. Khusna, M. Mashuri, Suhartono, D. D. Prastyo, M. H. Lee, and M. Ahsan, “Residual-based maximum MCUSUM control chart for joint monitoring the mean and variability of multivariate autocorrelated processes,” Prod. Manuf. Res., vol. 7, no. 1, pp. 364–394, 2019. [CrossRef]
- I. M. P. Loka, M. Ahsan, and W. Wibawati, “Comparing the performance of Max-Mchart, Max-Half-Mchart, and kernel-based Max-Mchart for individual observation in monitoring cement quality,” in AIP Conference Proceedings, AIP Publishing LLC, 2025, p. 050012.
- F. S. Cahyaningrum, M. Mashuri, and M. Ahsan, “Max-X¯ Stn control chart for monitoring mean and variability process,” in AIP Conference Proceedings, AIP Publishing, 2023.
- C. A. Lowry, W. H. Woodall, C. W. Champ, and S. E. Rigdon, “A Multivariate Exponentially Weighted Moving Average Control Chart,” Technometrics, vol. 34, no. 1, pp. 46–53, 1992, [Online]. Available: http://www.jstor.orgURL:http://www.jstor.org/stable/1269551.
- C. Zhou, C. Zou, Y. Zhang, and Z. Wang, “Nonparametric control chart based on change-point model,” Statistical Papers, vol. 50, no. 1, pp. 13–28, Jan. 2009. [CrossRef]
- S. W. Cheng and K. Thaga, “Multivariate Max-CUSUM Chart,” Qual. Technol. Quant. Manag., vol. 2, no. 2, pp. 221–235, 2005. [CrossRef]
- H. Khusna, M. Mashuri, Suhartono, D. D. Prastyo, M. H. Lee, and M. Ahsan, “Residual-based maximum MCUSUM control chart for joint monitoring the mean and variability of multivariate autocorrelated processes,” Prod. Manuf. Res., vol. 7, no. 1, pp. 364–394, Jan. 2019. [CrossRef]
- K. Thaga and L. Gabaitiri, “Multivariate Max-Chart,” Economic Quality Control, vol. 21, no. 1, pp. 113–125, 2006. [CrossRef]
- H. Sabahno, A. Amiri, and P. Castagliola, “A new adaptive control chart for the simultaneous monitoring of the mean and variability of multivariate normal processes,” Comput. Ind. Eng., vol. 151, Jan. 2021. [CrossRef]
- A. K. McCracken and S. Chakraborti, “Control charts for joint monitoring of mean and variance: an overview,” Qual. Technol. Quant. Manag., vol. 10, no. 1, pp. 17–36, 2013. [CrossRef]
- R. Kruba, M. Mashuri, and D. D. Prastyo, “The effectiveness of Max-half-Mchart over Max-Mchart in simultaneously monitoring process mean and variability of individual observations,” Qual. Reliab. Eng. Int., vol. 37, no. 6, pp. 2334–2347, Oct. 2021. [CrossRef]
- F. Maleki, S. Mehri, A. Aghaie, and H. Shahriari, “Robust T2 control chart using median-based estimators,” Qual. Reliab. Eng. Int., vol. 36, no. 6, pp. 2187–2201, Oct. 2020. [CrossRef]
- P. J. Rousseeuw, “Least Median of Squares Regression,” J. Am. Stat. Assoc., vol. 79, no. 388, pp. 871–880, 1984. [CrossRef]
- M. Hubert and K. Van Driessen, “Fast and robust discriminant analysis,” 2004. [Online]. Available: www.elsevier.com/locate/csda.
- P. J. Rousseeuw and K. Van Driessen, “A fast algorithm for the minimum covariance determinant estimator,” Technometrics, vol. 41, no. 3, pp. 212–223, 1999. [CrossRef]
- G. Willems, G. Pison, P. J. Rousseeuw, and S. Van Aelst, “A robust Hotelling test,” Metrika, vol. 55, pp. 125–138, 2002. [CrossRef]
- M. Hubert, P. J. Rousseeuw, and T. Verdonck, “A deterministic algorithm for robust location and scatter,” Journal of Computational and Graphical Statistics, vol. 21, no. 3, pp. 618–637, 2012. [CrossRef]
- S. Zahariah and H. Midi, “Minimum regularized covariance determinant and principal component analysis-based method for the identification of high leverage points in high dimensional sparse data,” J. Appl. Stat., vol. 50, no. 13, pp. 2817–2835, 2023. [CrossRef] [PubMed]
- J. Oguamalam, U. Radojičić, and P. Filzmoser, “Minimum regularized covariance trace estimator and outlier detection for functional data,” Technometrics, vol. 66, no. 4, pp. 588–599, 2024. [CrossRef]
- K. Boudt, P. J. Rousseeuw, S. Vanduffel, and T. Verdonck, “The minimum regularized covariance determinant estimator,” Stat. Comput., vol. 30, no. 1, pp. 113–128, 2020. [CrossRef]
- B. J. Hoopes and K. P. Triantis, “Efficiency performance, control charts, and process improvement: Complementary measurement and evaluation,” IEEE Trans. Eng. Manag., vol. 48, no. 2, pp. 239–253, 2001. [CrossRef]
- M. Ahsan, M. Mashuri, H. Kuswanto, D. D. Prastyo, and H. Khusna, “Outlier detection using PCA mix based T2 control chart for continuous and categorical data,” Commun. Stat. Simul. Comput., vol. 50, no. 5, pp. 1496–1523, May 2021. [CrossRef]
- I. K. Prasetya, M. Ahsan, and M. Mashuri, “Simulation studies for evaluating performance of bootstrap based robust T 2 control chart in detecting highly outlier contaminated data,” in AIP Conference Proceedings, AIP Publishing LLC, 2025, p. 050013.
- P. Babu and P. Stoica, “CellMCD+: An improved outlier-resistant cellwise minimum covariance determinant method,” Stat. Probab. Lett., vol. 220, p. 110366, 2025. [CrossRef]
- J. Raymaekers and P. J. Rousseeuw, “The cellwise minimum covariance determinant estimator,” J. Am. Stat. Assoc., vol. 119, no. 548, pp. 2610–2621, 2024. [CrossRef]
- N. Sulistiawanti, M. Ahsan, and H. Khusna, “Multivariate Exponentially Weighted Moving Average (MEWMA) and Multivariate Exponentially Weighted Moving Variance (MEWMV) Chart Based on Residual XGBoost Regression for Monitoring Water Quality.,” Engineering Letters, vol. 31, no. 3, 2023.
- M. Ahsan, R. W. Indarsanto, K. A. F. Rifki, and M. H. Lee, “Residual-based multivariate exponentially weighted moving average control chart for statistical process control of water quality in Surabaya city utilizing generative adversarial network,” MethodsX, p. 103504, 2025. [CrossRef] [PubMed]
- H. Khusna, M. Mashuri, S. Suhartono, D. D. Prastyo, and M. Ahsan, “Multioutput least square SVR-based multivariate EWMA control chart: The performance evaluation and application,” Cogent Eng., vol. 5, no. 1, p. 1531456, 2018. [CrossRef]
Figure 1.
Accuracy Level of Outlier Detection (a) ρ = 0.3, (b) ρ = 0.5, and (c) ρ = 0.7.
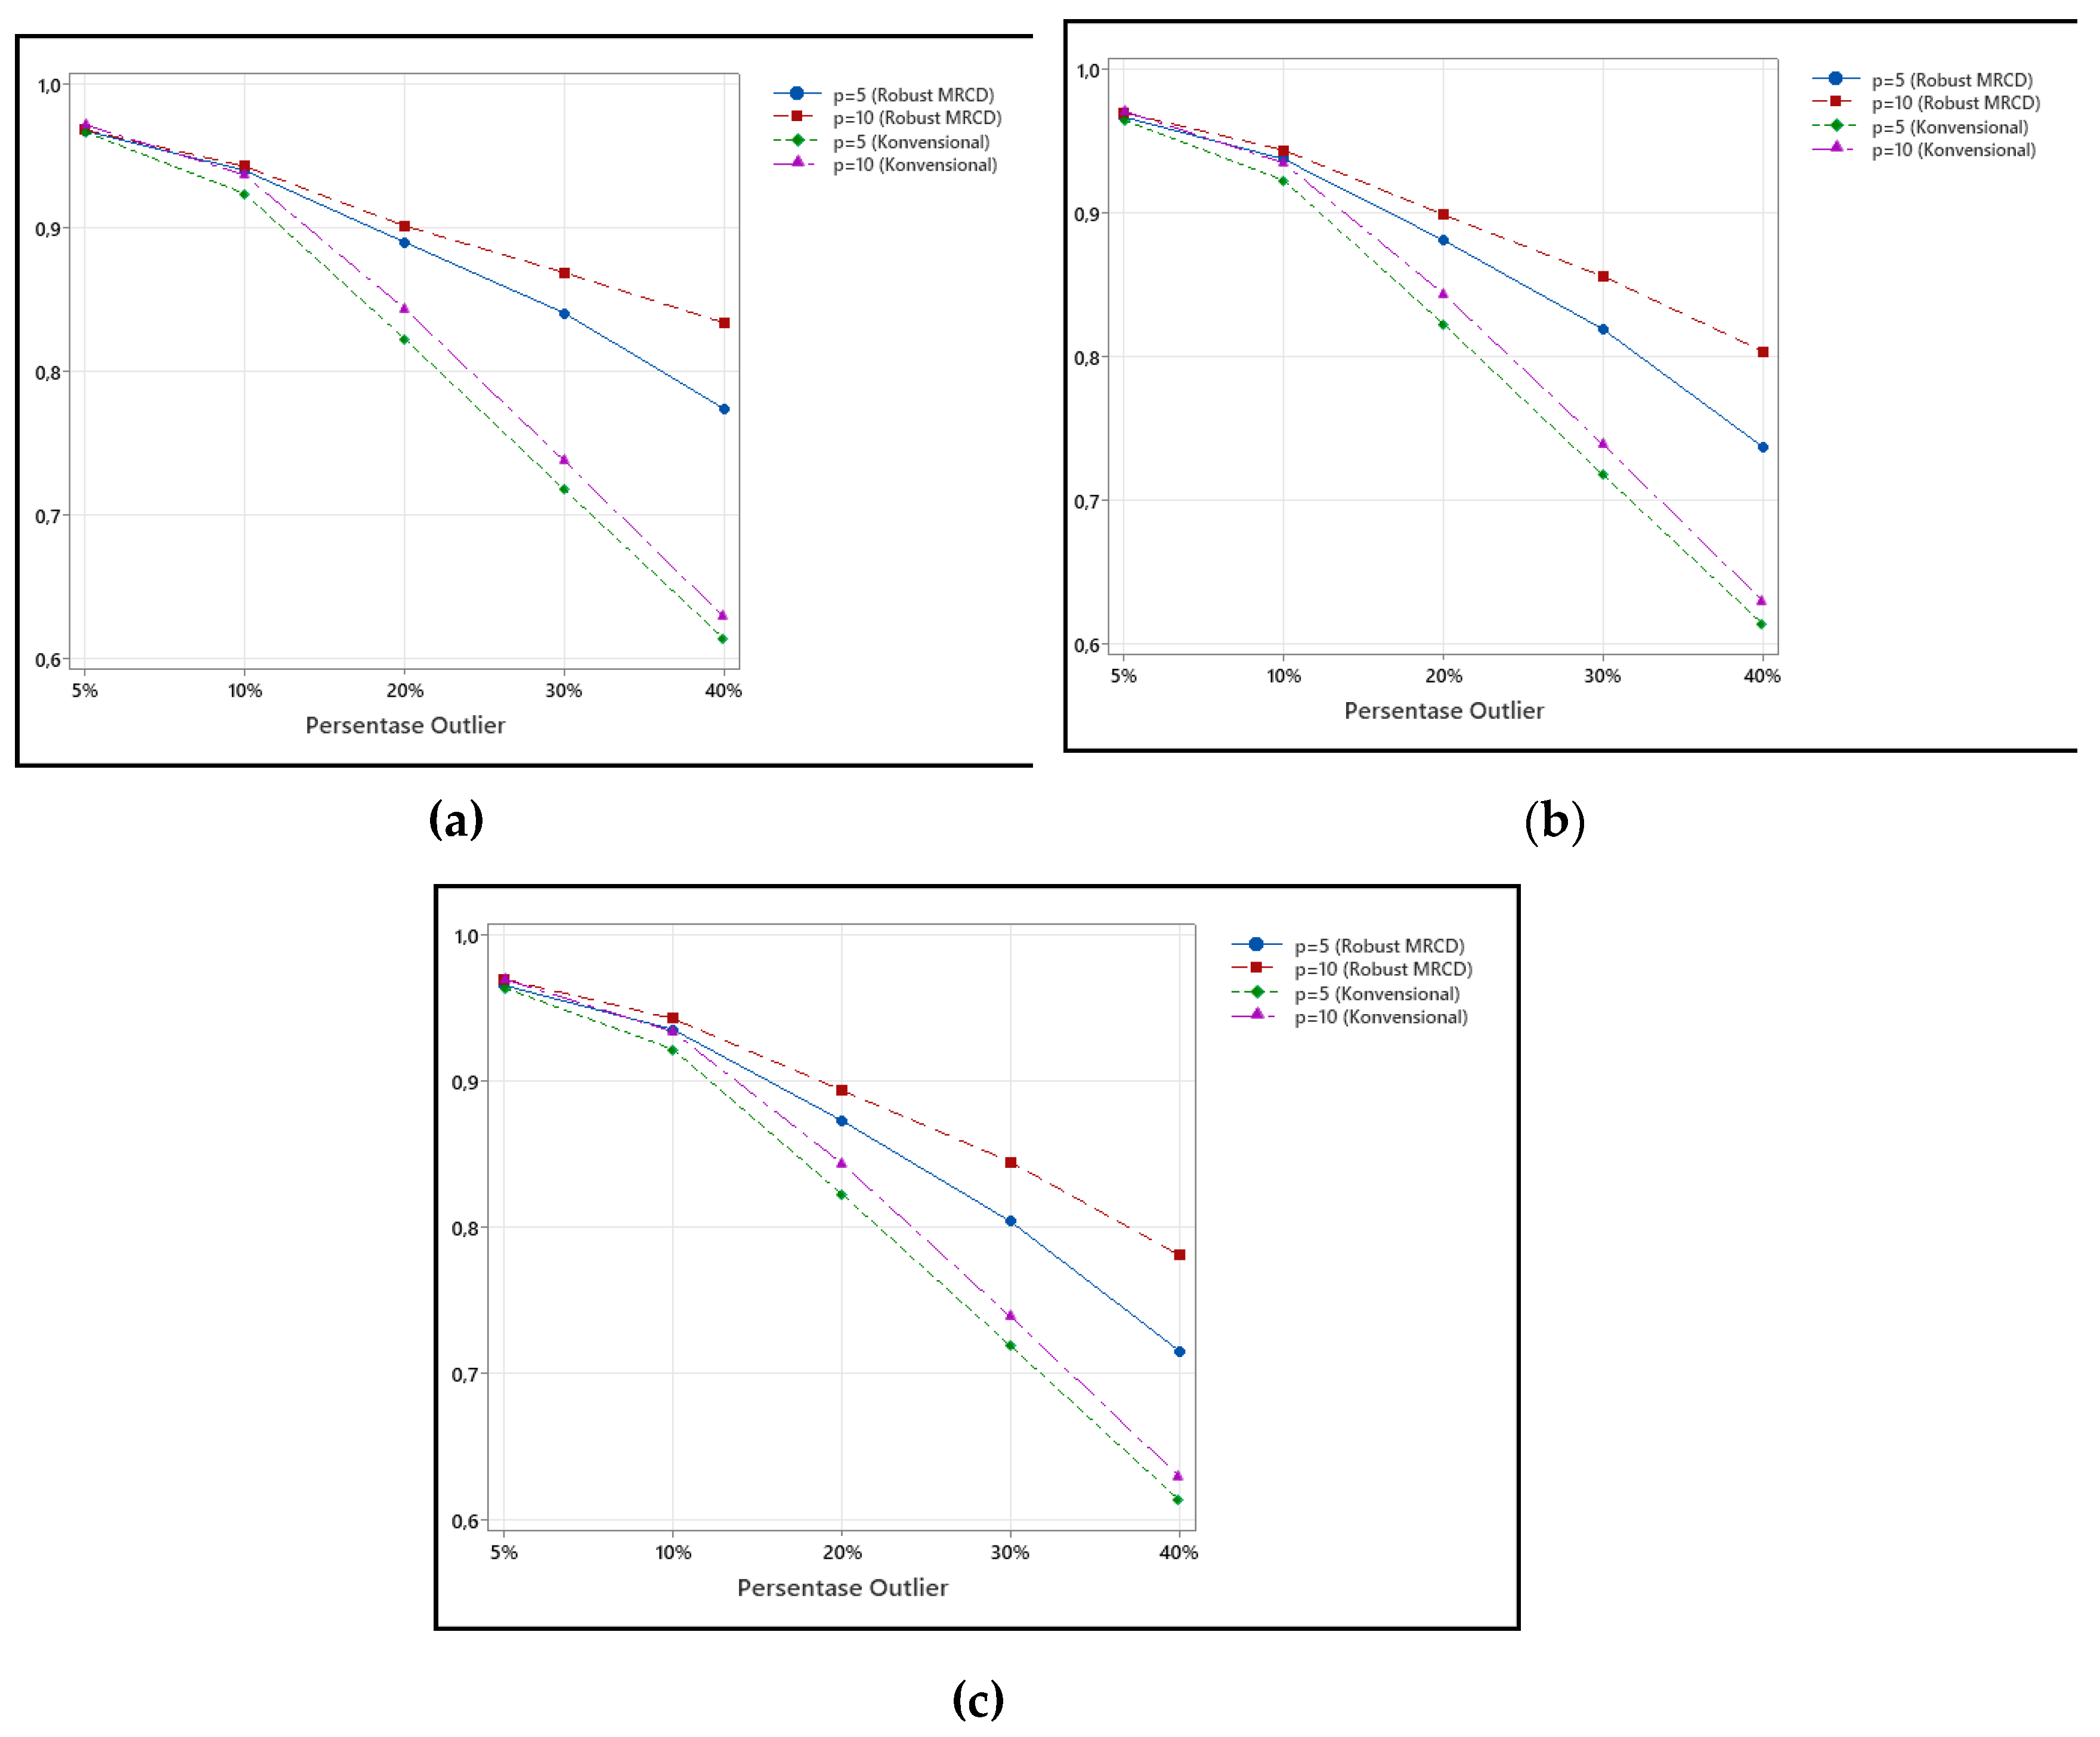
Figure 2.
False Positive Rate of Outlier Detection on (a) ρ = 0.3, (b) ρ = 0.5, and (c) ρ = 0.7.
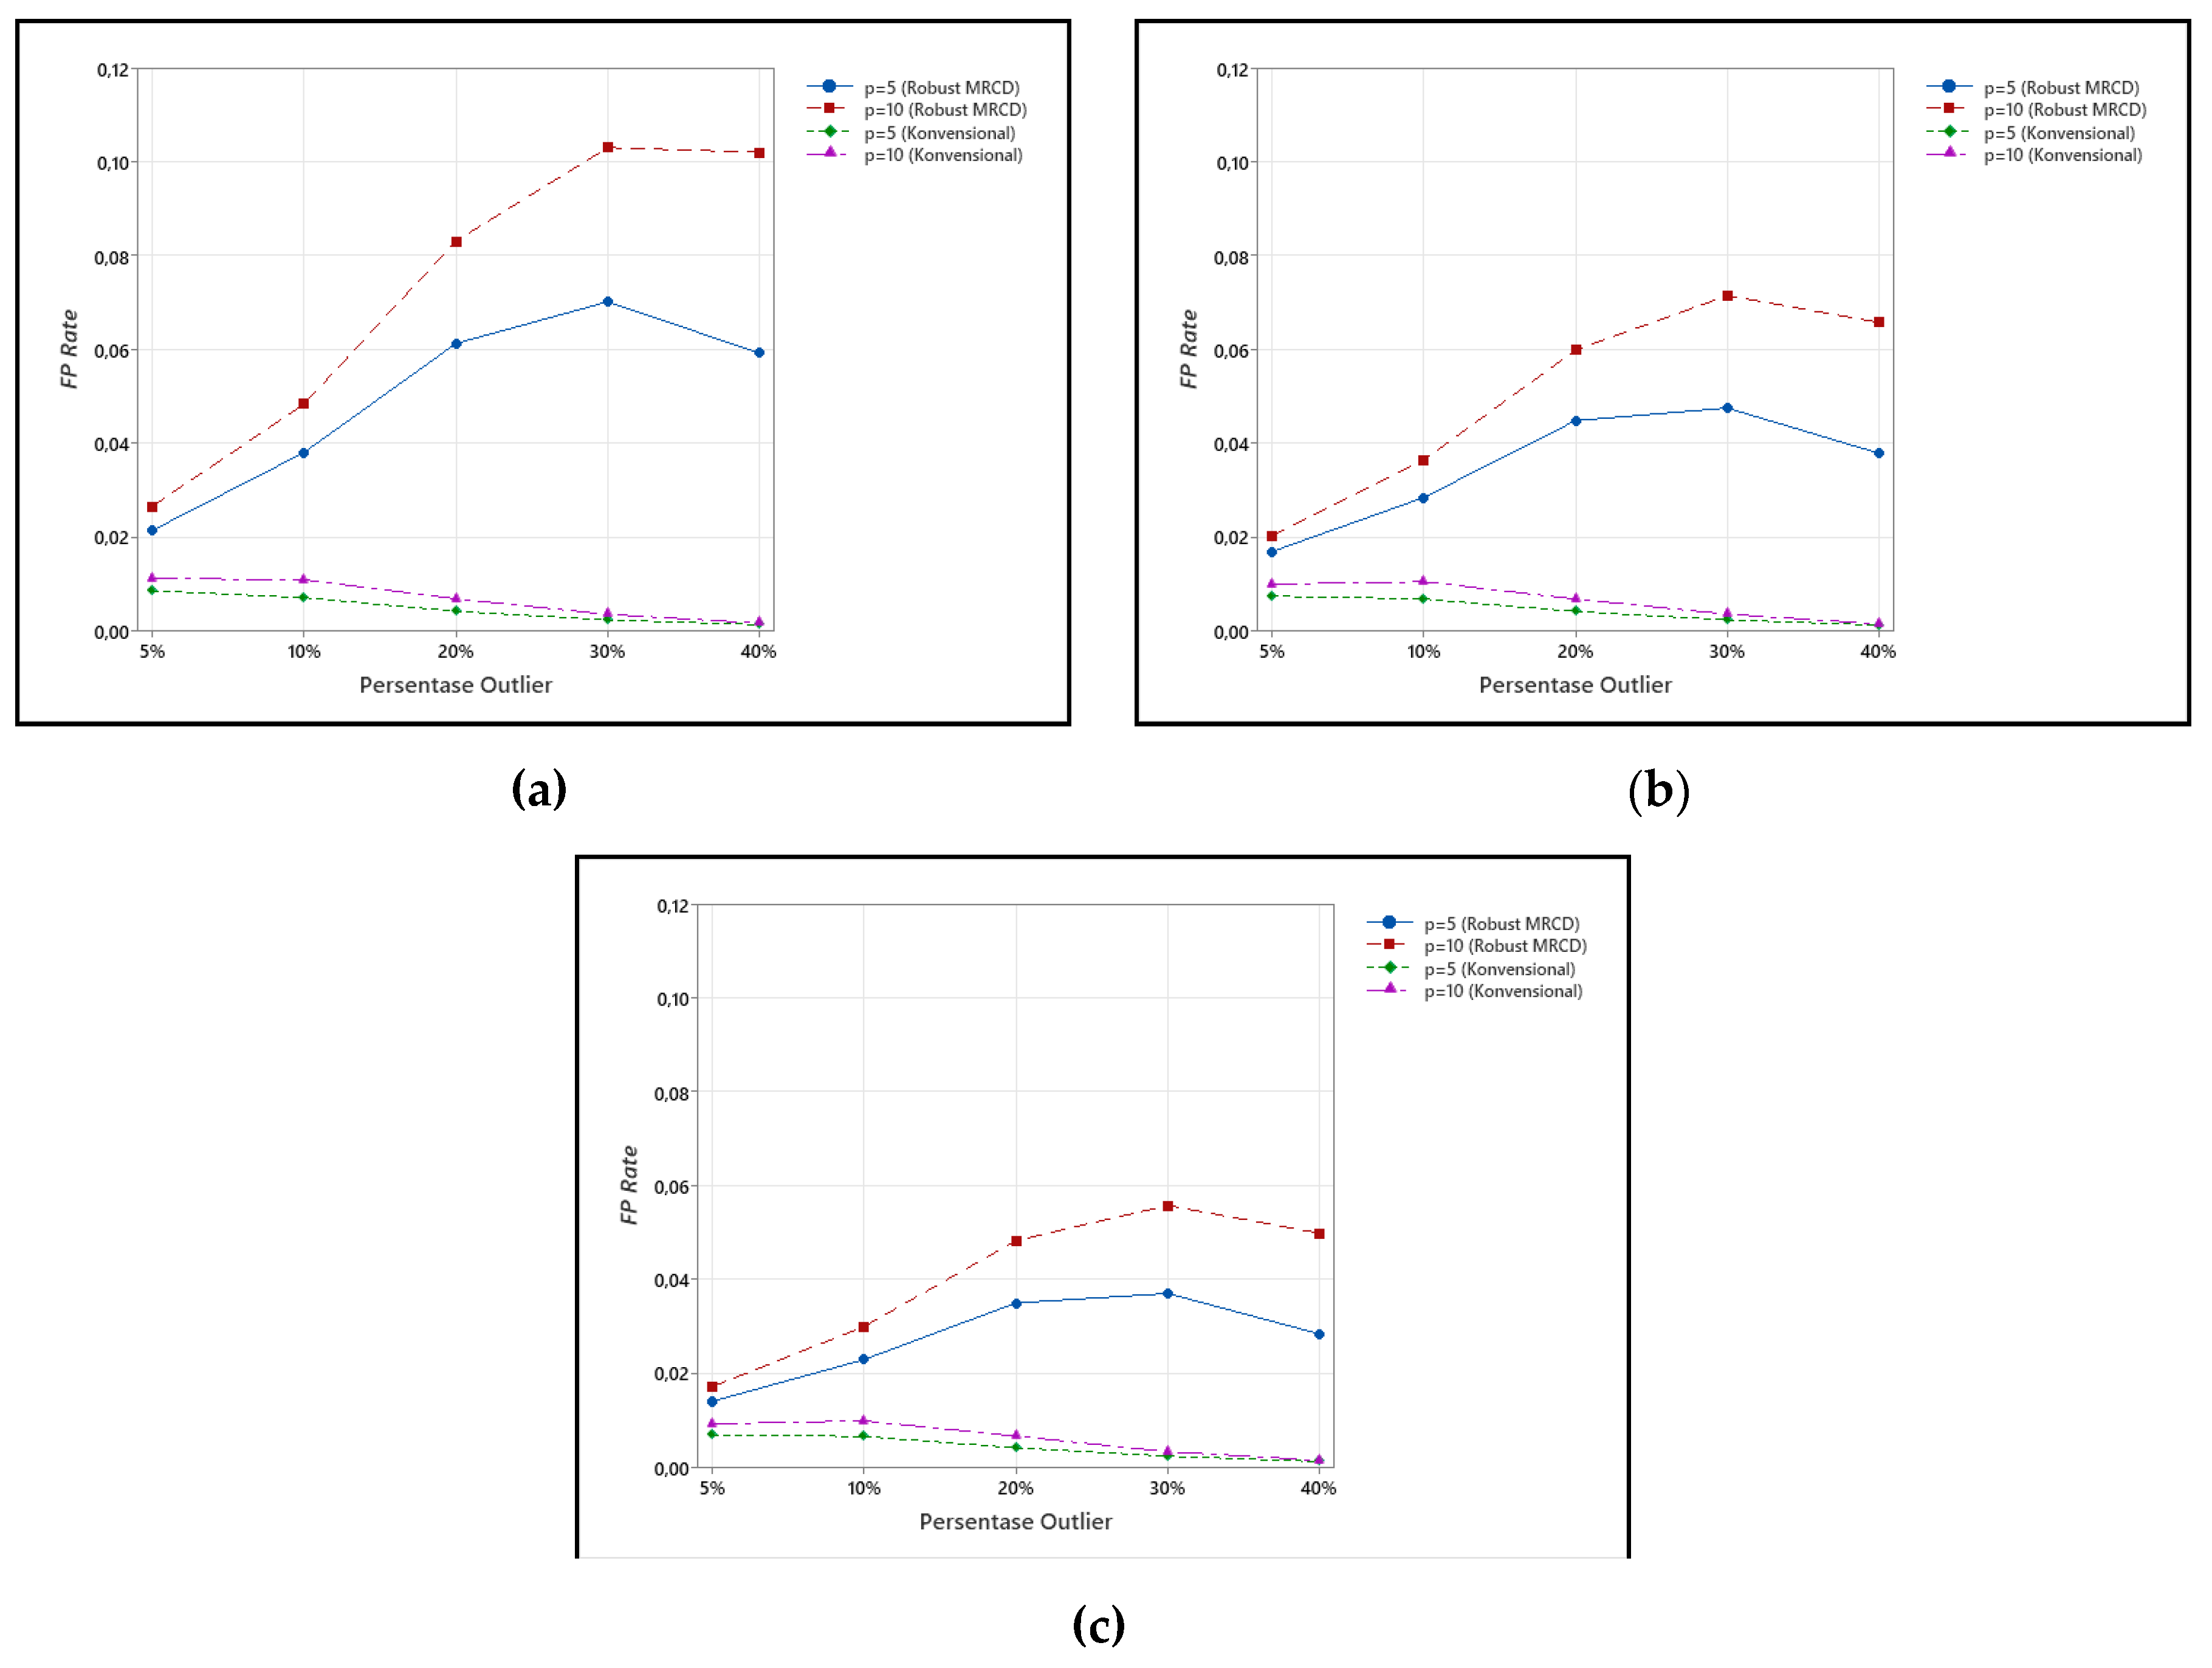
Figure 3.
False Negative Rate of Outlier Detection (a) ρ = 0.3, (b) ρ = 0.5, and (c) ρ = 0.7.
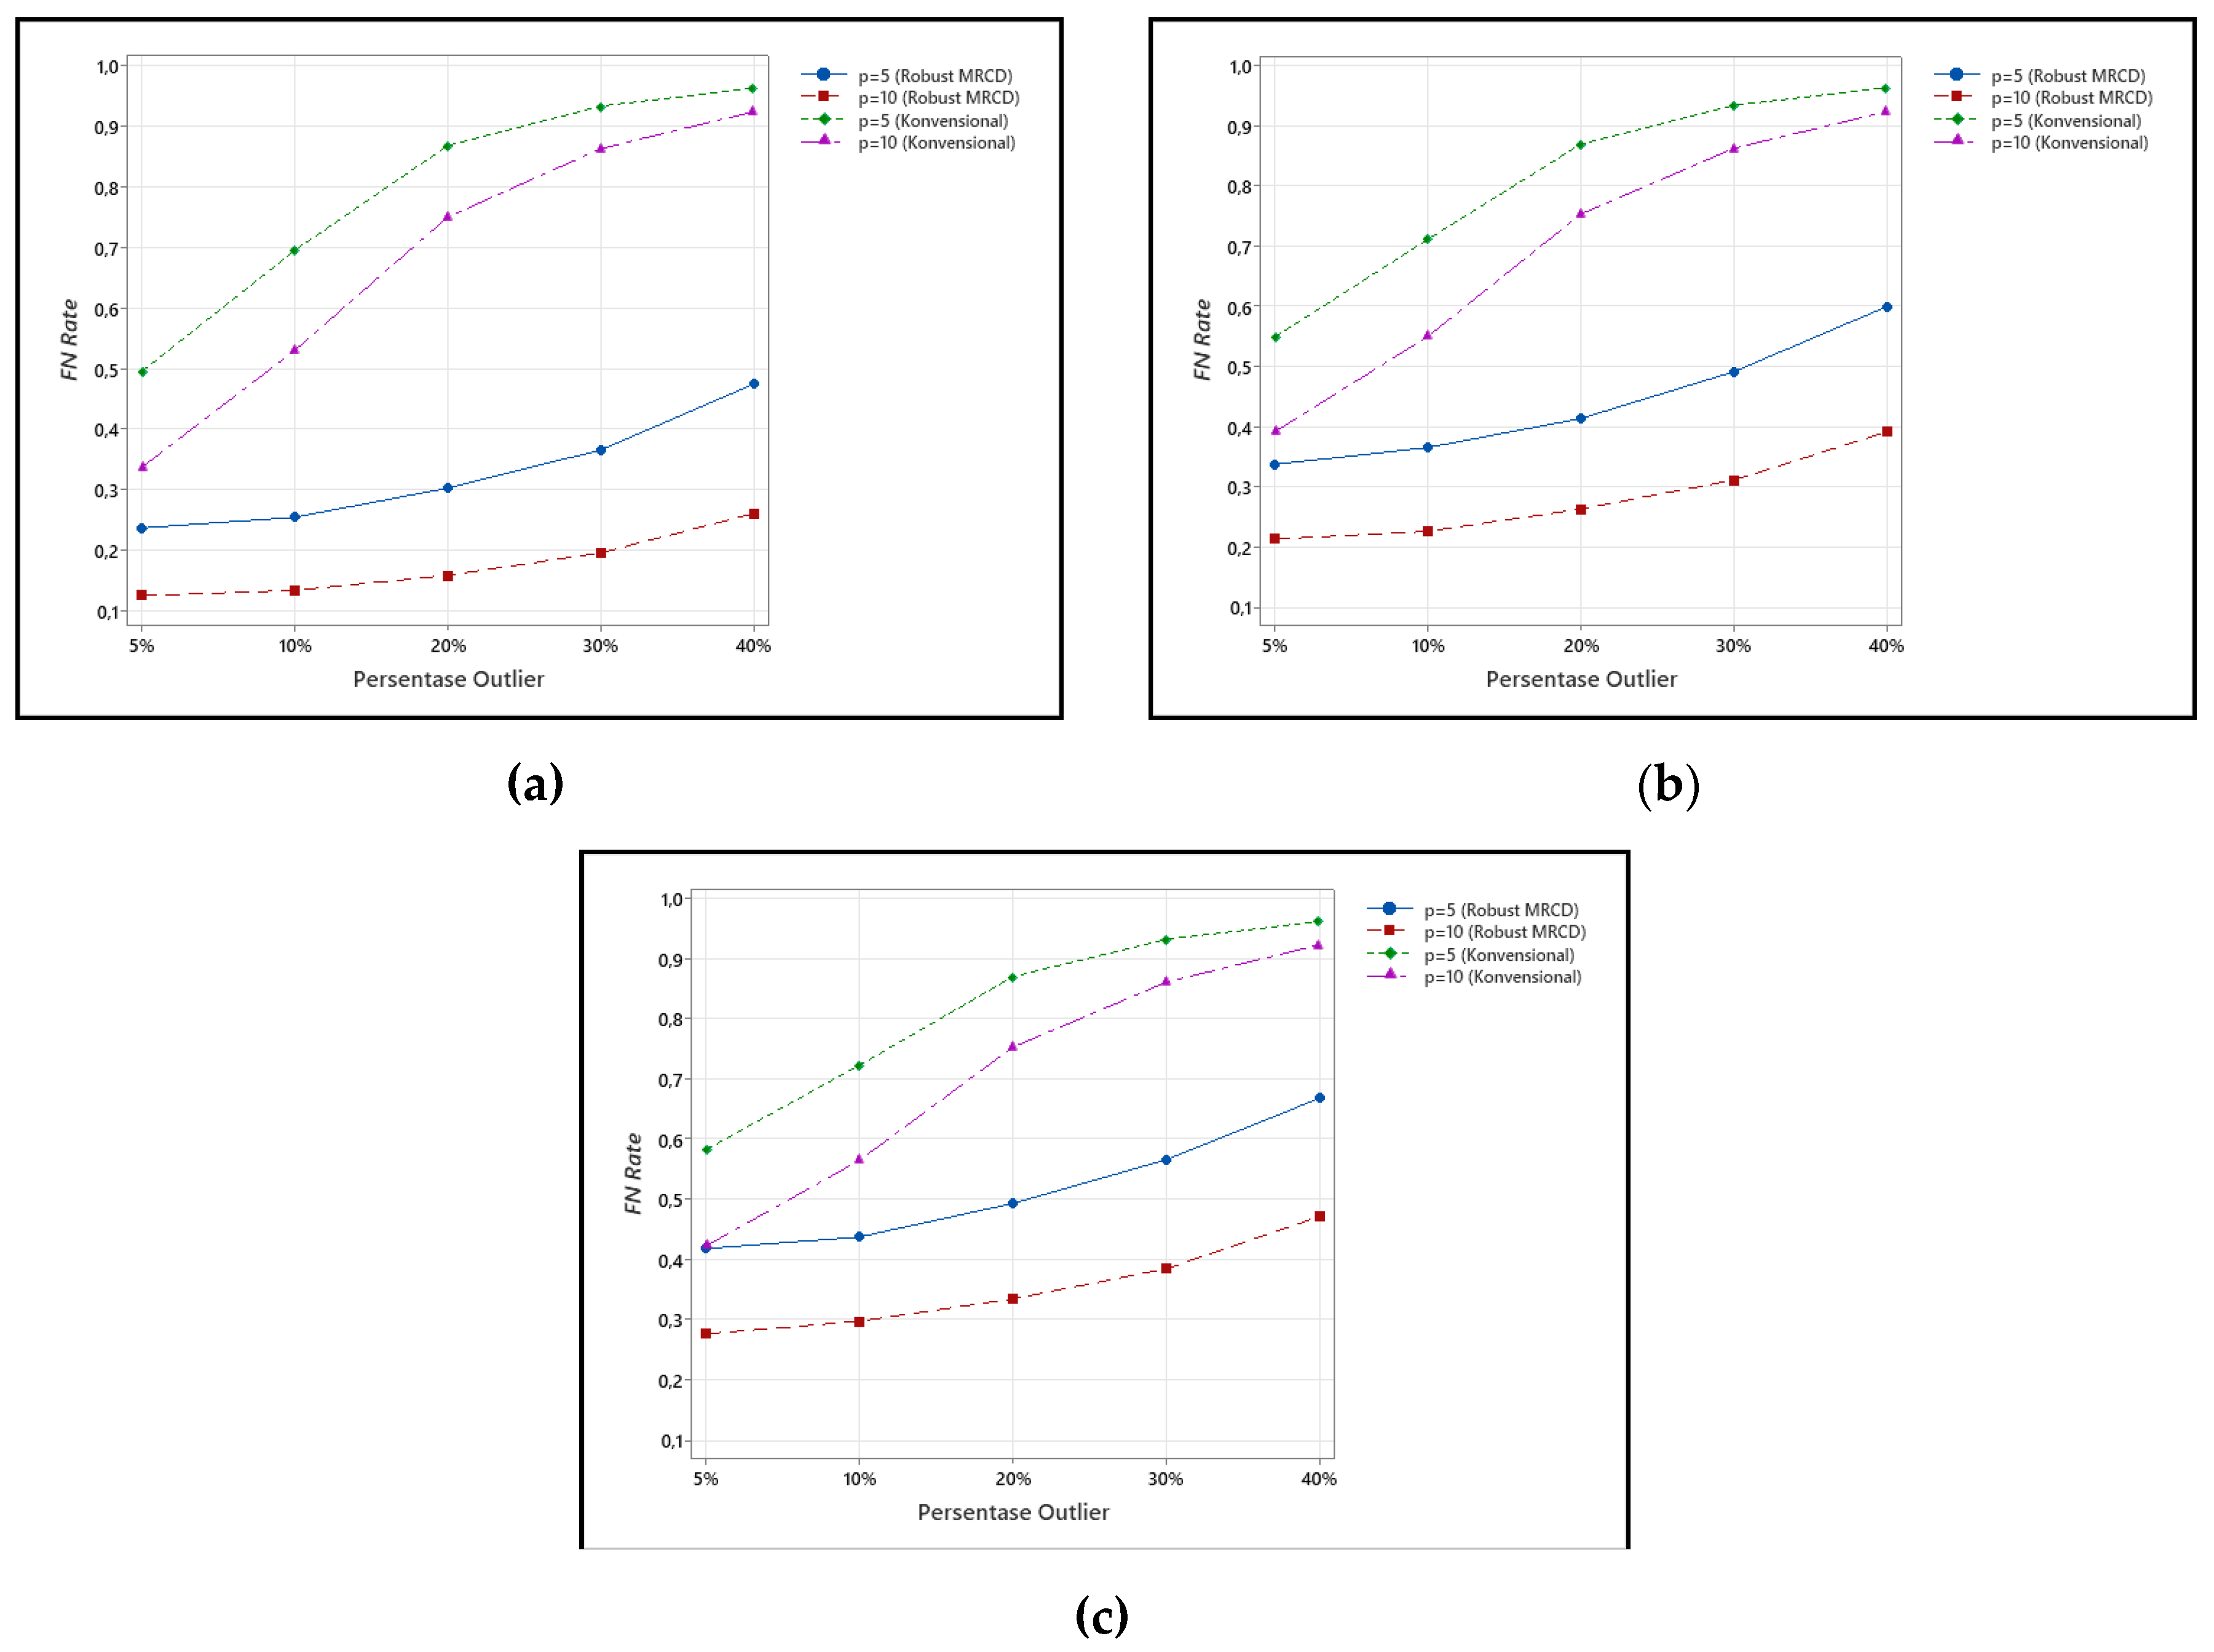
Figure 4.
AUC Levels of Outlier Detection at (a) ρ = 0.3, (b) ρ = 0.5, and (c) ρ = 0.7.
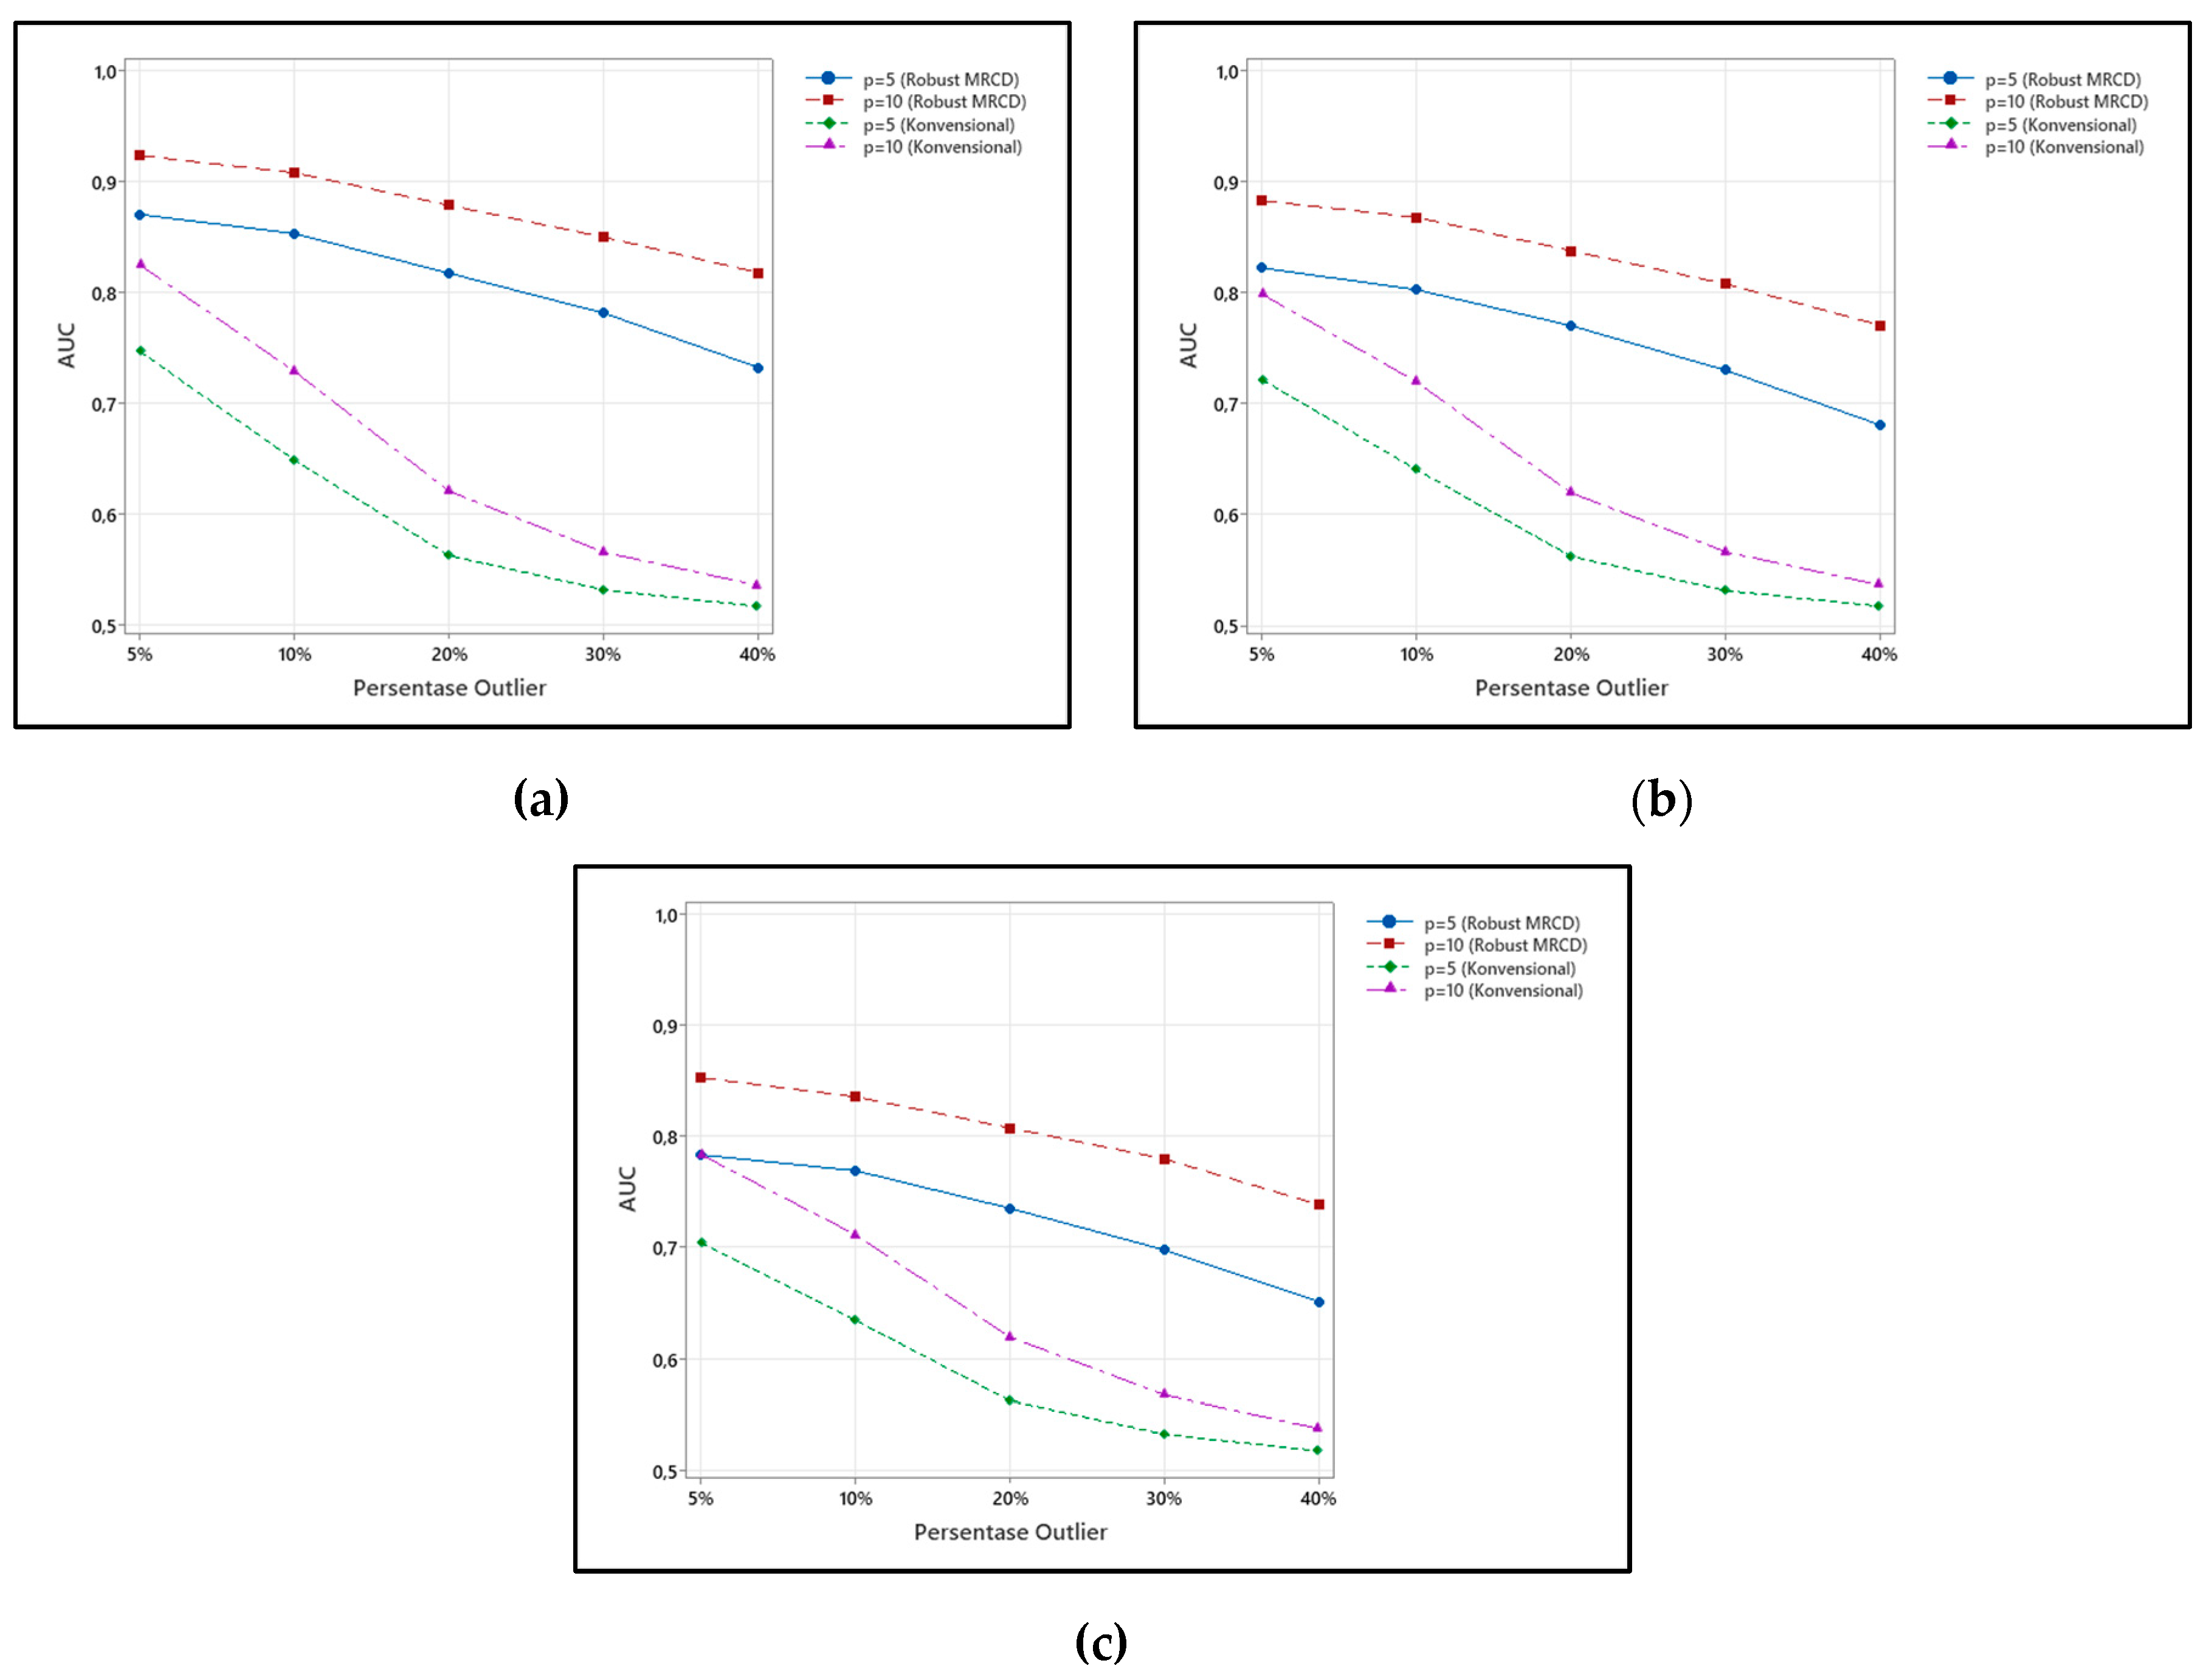
Figure 5.
Application of (a) MRCD-based and (b) MRCD-free Max-Half-Mchart Robust charts to Cement Quality Characteristics Data.
Figure 5.
Application of (a) MRCD-based and (b) MRCD-free Max-Half-Mchart Robust charts to Cement Quality Characteristics Data.
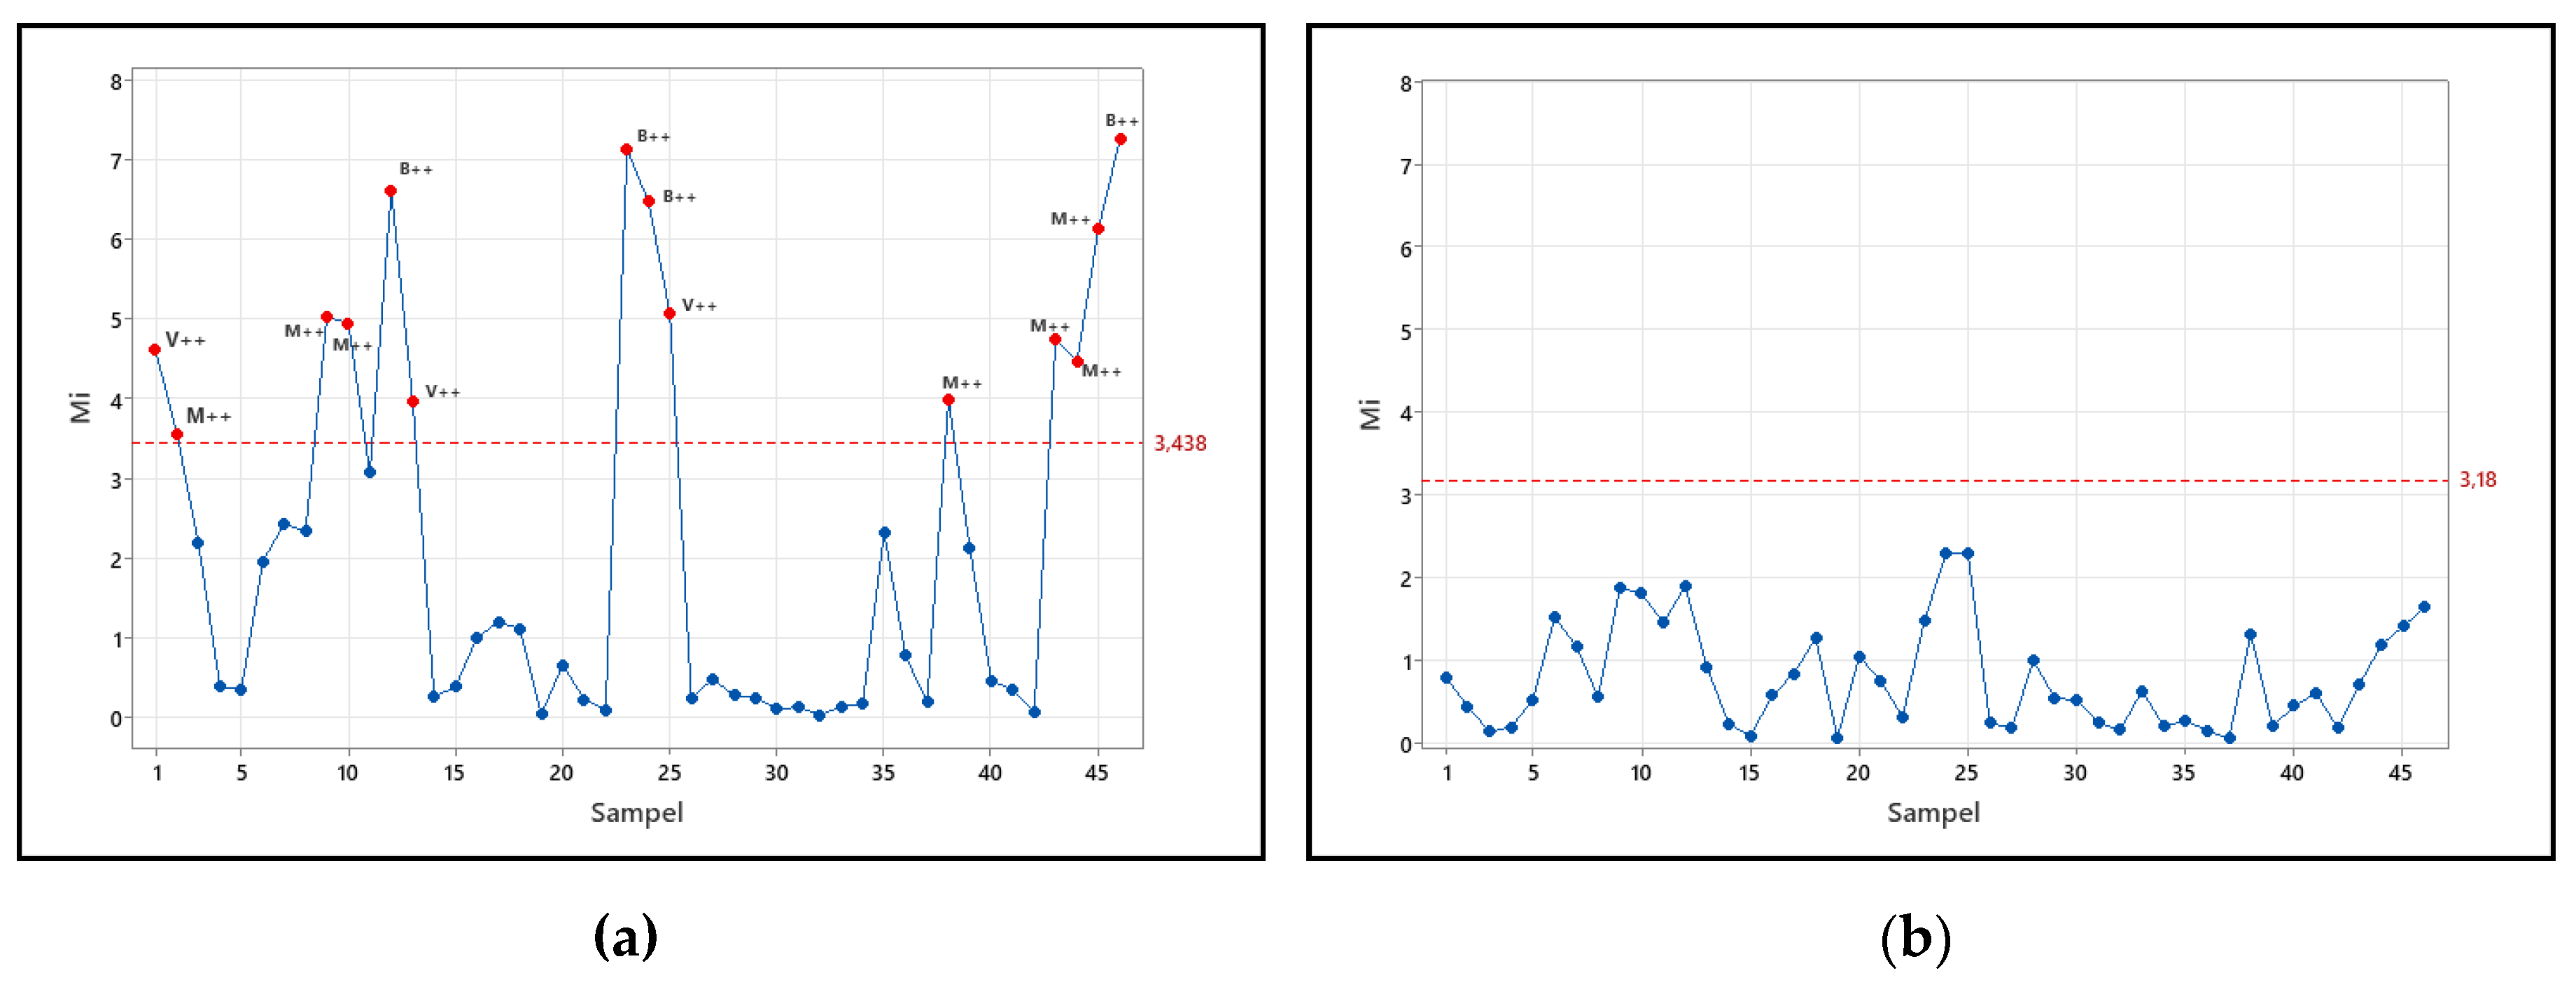

Table 1.
ARL for Process Mean Shift of MRCD-Based Max-Half-Mchart.
| Shift | |||||||
| =0.3 | =0.5 | =0.7 | =0.3 | =0.5 | =0.7 | ||
| 0 | 0.00 | 372.107 | 371.220 | 373.210 | 370.850 | 371.490 | 369.100 |
| 1 | 0.25 | 337.586 | 336.078 | 352.175 | 334.159 | 342.853 | 358.868 |
| 2 | 0.50 | 248.847 | 278.168 | 295.012 | 268.410 | 289.185 | 313.113 |
| 3 | 0.75 | 149.062 | 193.544 | 220.350 | 178.344 | 223.345 | 263.629 |
| 4 | 1.00 | 82.654 | 118.276 | 137.210 | 98.850 | 146.140 | 192.350 |
| 5 | 1.25 | 40.460 | 63.696 | 88.277 | 51.567 | 97.586 | 128.581 |
| 6 | 1.50 | 21.527 | 37.896 | 54.381 | 25.417 | 53.878 | 84.594 |
| 7 | 1.75 | 11.649 | 20.497 | 32.568 | 13.621 | 29.954 | 52.609 |
| 8 | 2.00 | 6.314 | 12.305 | 18.489 | 7.537 | 17.960 | 31.852 |
| 9 | 2.25 | 3.903 | 7.484 | 12.243 | 4.601 | 10.681 | 19.191 |
| 10 | 2.50 | 2.621 | 4.858 | 7.777 | 2.996 | 6.755 | 12.792 |
| 11 | 2.75 | 2.021 | 3.511 | 5.061 | 2.078 | 4.540 | 8.285 |
| 12 | 0.00 | 372.107 | 371.220 | 373.210 | 370.850 | 371.490 | 369.100 |
Table 2.
ARL for Process Variability Shift of MRCD-Based Max-Half-Mchart.
| Shift | |||||||
| =0.3 | =0.5 | =0.7 | =0.3 | =0.5 | =0.7 | ||
| 0 | 1.00 | 372.107 | 371.220 | 373.210 | 370.850 | 371.490 | 369.100 |
| 1 | 1.25 | 65.700 | 42.169 | 20.767 | 40.054 | 22.754 | 8.826 |
| 2 | 1.50 | 23.840 | 13.090 | 5.440 | 11.398 | 6.013 | 2.507 |
| 3 | 1.75 | 11.970 | 6.674 | 3.108 | 5.310 | 3.041 | 1.586 |
| 4 | 2.00 | 7.189 | 4.275 | 2.191 | 3.218 | 2.020 | 1.224 |
| 5 | 2.25 | 4.819 | 3.025 | 1.749 | 2.294 | 1.558 | 1.116 |
| 6 | 2.50 | 3.571 | 2.508 | 1.532 | 1.813 | 1.330 | 1.071 |
| 7 | 2.75 | 2.998 | 2.084 | 1.406 | 1.532 | 1.212 | 1.027 |
| 8 | 3.00 | 2.551 | 1.815 | 1.295 | 1.363 | 1.131 | 1.015 |
| 9 | 3.25 | 2.165 | 1.617 | 1.206 | 1.247 | 1.077 | 1.012 |
| 10 | 3.50 | 1.943 | 1.469 | 1.154 | 1.179 | 1.469 | 1.004 |
| 11 | 3.75 | 1.788 | 1.399 | 1.124 | 1.127 | 1.399 | 1.006 |
| 12 | 4.00 | 1.599 | 1.321 | 1.097 | 1.091 | 1.027 | 1.003 |
Table 3.
ARL for Process Mean and Variability Shift of MRCD-Based Max-Half-Mchart.
| Shift | ||||||||
| =0.3 | =0.5 | =0.7 | =0.3 | =0.5 | =0.7 | |||
| 0 | 0 | 0.00 | 1.00 | 372.107 | 371.221 | 373.210 | 370.850 | 371.490 |
| 1 | 1 | 0.25 | 1.25 | 63.588 | 40.214 | 19.563 | 38.454 | 21.625 |
| 2 | 2 | 0.50 | 1.50 | 20.121 | 12.153 | 5.570 | 10.325 | 5.685 |
| 3 | 3 | 0.75 | 1.75 | 8.453 | 6.052 | 2.833 | 4.493 | 2.775 |
| 4 | 4 | 1.00 | 2.00 | 5.045 | 3.654 | 2.058 | 2.599 | 1.857 |
| 5 | 5 | 1.25 | 2.25 | 3.277 | 2.424 | 1.710 | 1.822 | 1.412 |
| 6 | 6 | 1.50 | 2.50 | 2.230 | 2.020 | 1.379 | 1.443 | 1.218 |
| 7 | 7 | 1.75 | 2.75 | 1.886 | 1.693 | 1.253 | 1.255 | 1.119 |
| 8 | 8 | 2.00 | 3.00 | 1.549 | 1.408 | 1.168 | 1.143 | 1.073 |
| 9 | 9 | 2.25 | 3.25 | 1.343 | 1.262 | 1.108 | 1.076 | 1.038 |
| 10 | 10 | 2.50 | 3.50 | 1.183 | 1.173 | 1.067 | 1.035 | 1.023 |
| 11 | 11 | 2.75 | 3.75 | 1.140 | 1.127 | 1.055 | 1.013 | 1.011 |
| 12 | 12 | 3.00 | 4.00 | 1.099 | 1.066 | 1.038 | 1.011 | 1.008 |
Table 4.
MRCD-based Robust Max-Half-Mchart Outlier Detection Result with .
| %out | Accuracy | FP Rate | FN Rate | AUC | |
| 0.3 | 5 | 0.968 | 0.021 | 0.238 | 0.870 |
| 10 | 0.940 | 0.038 | 0.256 | 0.853 | |
| 20 | 0.890 | 0.061 | 0.304 | 0.817 | |
| 30 | 0.841 | 0.070 | 0.367 | 0.782 | |
| 40 | 0.774 | 0.059 | 0.476 | 0.733 | |
| 0.5 | 5 | 0.967 | 0.017 | 0.338 | 0.823 |
| 10 | 0.938 | 0.029 | 0.366 | 0.803 | |
| 20 | 0.881 | 0.045 | 0.414 | 0.771 | |
| 30 | 0.819 | 0.048 | 0.492 | 0.730 | |
| 40 | 0.737 | 0.038 | 0.600 | 0.681 | |
| 0.7 | 5 | 0.966 | 0.014 | 0.418 | 0.784 |
| 10 | 0.936 | 0.023 | 0.438 | 0.770 | |
| 20 | 0.873 | 0.035 | 0.494 | 0.736 | |
| 30 | 0.804 | 0.037 | 0.566 | 0.698 | |
| 40 | 0.716 | 0.028 | 0.668 | 0.652 |
Table 5.
MRCD-based Robust Max-Half-Mchart Outlier Detection Result with .
| %out | Accuracy | FP Rate | FN Rate | AUC | |
| 0.3 | 5 | 0.968 | 0.027 | 0.126 | 0.923 |
| 10 | 0.943 | 0.048 | 0.135 | 0.908 | |
| 20 | 0.902 | 0.083 | 0.160 | 0.879 | |
| 30 | 0.869 | 0.103 | 0.197 | 0.850 | |
| 40 | 0.834 | 0.102 | 0.262 | 0.818 | |
| 0.5 | 5 | 0.970 | 0.020 | 0.214 | 0.883 |
| 10 | 0.944 | 0.036 | 0.227 | 0.868 | |
| 20 | 0.899 | 0.059 | 0.264 | 0.838 | |
| 30 | 0.856 | 0.071 | 0.312 | 0.808 | |
| 40 | 0.804 | 0.065 | 0.392 | 0.771 | |
| 0.7 | 5 | 0.970 | 0.017 | 0.277 | 0.853 |
| 10 | 0.943 | 0.030 | 0.298 | 0.836 | |
| 20 | 0.894 | 0.048 | 0.335 | 0.808 | |
| 30 | 0.845 | 0.055 | 0.385 | 0.780 | |
| 40 | 0.781 | 0.049 | 0.472 | 0.739 |
Table 6.
Quality Characteristics in Cement Data.
| Variable | Description |
| x1 | LOI (%) |
| x2 | SO3 (%) |
| x3 | BTL (%) |
| x4 | Free Lime (%) |
| x5 | Residual 0.045 mm |
| x6 | Blaine (cm2) |
| x7 | Start (minute) |
| x8 | Finish (minute) |
| x9 | Third Day Compressive Strength |
| x10 | Seventh Day Compressive Strength |
Table 7.
Dependence Test.
| Chi-square | df | P-value |
| 183.937 | 45 | 1.031735×10⁻¹⁸ |
Table 8.
Comparison of Out-of-control on Both charts.
| Control chart | UCL | Total Out-Of-Control | Mean Shift | Variability Shift | The Shift of Both |
| MRCD-Based Robust Max Half Mchart | 3.438 | 14 | 3 | 3 | 8 |
| Max-Half-Mchart | 3.18 | 0 | - | - | - |
Disclaimer/Publisher’s Note: The statements, opinions and data contained in all publications are solely those of the individual author(s) and contributor(s) and not of MDPI and/or the editor(s). MDPI and/or the editor(s) disclaim responsibility for any injury to people or property resulting from any ideas, methods, instructions or products referred to in the content. |
© 2026 by the authors. Licensee MDPI, Basel, Switzerland. This article is an open access article distributed under the terms and conditions of the Creative Commons Attribution (CC BY) license (http://creativecommons.org/licenses/by/4.0/).
Copyright: This open access article is published under a Creative Commons CC BY 4.0 license, which permit the free download, distribution, and reuse, provided that the author and preprint are cited in any reuse.


