Submitted:
12 February 2026
Posted:
12 February 2026
You are already at the latest version
Abstract
Black Soldier Fly (BSF) larvae are gaining attention for their high feed conversion efficien-cy, transforming organic matter into nutrients. As interest in insects as food ingredients grows, quality control becomes essential. This study evaluates the potential of near-infrared spectroscopy (NIRS) using benchtop and portable equipment to simultane-ously determine crude proteins and lipids in BSF larvae flour. Larvae were reared on agro-industrial waste, processed into flour, and analyzed using reference methods. NIRS data were examined with PCA for sample grouping and PLS regression for quantification. The benchtop method NIRS showed superior accuracy, with RMSECV of 1.24% and R²CV of 0.946 for lipids, and 0.59% and 0.989 for proteins. The portable device, though less pre-cise, effectively identified nutritional patterns. This green analytical approach eliminates toxic reagents, reduces environmental impact, and ensures rapid, precise analysis. It supports sustainable insect production, fostering food security, and eco-friendly agro-industrial practices.
Keywords:
green analytical chemistry
; near‐infrared spectroscopy
; chemometrics
; black soldier fly larvae flour
; sustainable protein sources
1. Introduction
Searching for alternative protein sources has been a primary concern in food security and sustainable agriculture in recent years. Insects have gained prominence due to their high feed conversion rate, which allows them to efficiently transform organic matter into nutrients [1]. Among the insects studied, the Black Soldier Fly (BSF; Hermetia illucens) larvae have attracted the attention of entrepreneurs worldwide due to their potential for production from biodegradable waste [2].
BSF larvae can potentially become raw material for various commercial products such as biodiesel, chitin-based biopolymers, cosmetics, and soil fertilizers and as a promising option for food supplementation, especially in animal feed production [3,4,5,6]. Renowned for their richness in high-quality proteins, essential fatty acids, vitamins, and minerals, BSF larvae are a promising nutrient source. However, the nutritional composition of the larvae can be influenced by several factors, such as the substrates used as feed [7].
During the larval stage, large amounts of fats and proteins are stored. The typical fat content of pre-pupae of the black soldier fly is around 32%, with a high content of saturated fatty acids, particularly lauric acid (C12:0), which represents 67% of the total [6,8]. Regarding protein content, researchers have reported values ranging from 20% to 77% of dry weight, with variations depending on the substrate used [9,10,11]. The higher the protein content in the diet, the higher the protein content in the pre-pupa, up to a certain limit, suggesting a critical amount of protein that must be present in the diet. Dietary fibers also play a positive role in obtaining pre-pupa protein biomass from BSF [7]. Regarding essential amino acids, lysine, leucine, and valine are the most correlated with the presence of nutrients in the diet, with leucine and valine being strongly dependent on the protein and lipid content of the diet, while lysine is correlated with the amount of carbohydrates [7,12]. Protein and fat content variation underscores the importance of maintaining rigorous quality control to ensure product standardization and consistency [13,14].
Given the nutritional quality of insect larvae in recent years, their use in animal feed has been the subject of numerous studies [2,5,15]. Insects have great potential as an ingredient in pig diets due to their nutrient composition, utilization, and functional properties [16]. Replacing soybean oil with BSF-derived fats in broiler diets led to an increase in saturated fatty acids from 32.2% in soy to up to 43.5% in diets containing BSF oil [17]. Regarding digestibility, replacing fish meal with up to 30% BSF meal in African catfish diets did not hinder nutrient digestibility and utilization [18]. Given the numerous studies on applying BSF in animal feed, standardizing production and processing procedures contributes to the required product quality. In this context, maintaining quality control and knowledge of the composition of BSF larvae is of the utmost importance.
Currently, reference methods used for food composition analysis are time-consuming, use hazardous reagents, require skilled personnel, and often generate toxic waste [19]. Kjeldahl protein determination requires ~8 h and hazardous reagents (H₂SO₄), while Soxhlet lipid extraction takes ~6 h and uses organic solvents. For this reason, new trends are emerging in the development of new analytical methods, such as miniaturization of equipment, reduction in sample preparation time and quantity, development of techniques with reduced or eliminated solvent use, and the use of less toxic solvents [20,21,22]. Given the emerging need for rapid and low-cost analyses, the application of near-infrared spectroscopy (NIRS) in nutritional composition analysis, such as the determination of proteins and lipids, emerges as a promising alternative that aligns perfectly with the principles of green analytical chemistry [23].
NIRS uses non-invasive electromagnetic radiation to interact with samples, eliminating chemical waste generation and minimizing energy consumption. Additionally, its capability to directly analyze solid and liquid samples without complex sample preparation contributes to device miniaturization and the development of portable equipment. Measurements in the NIRS region (700 to 2500 nm) are generally used for qualitative purposes. However, when combined with multivariate calibration and chemometric methods, it is possible to calculate the desired concentration of constituents [23]. Previous studies have reported the efficiency of NIRS-based methods for estimating protein and lipid content in insect larvae and larvae flour with prediction errors (RMSEP) as low as 1.18% [24,25,26]. However, these studies either focused on different insect species, specific production conditions (e.g., living larvae), or lacked comparative analysis between benchtop and portable devices.
In this context, the present study proposes a novel approach for analyzing the composition of BSF larvae flours using NIRS combined with chemometric methods to simultaneously quantify crude protein and lipid (ether extract) content. A key feature of this work is the direct comparison of benchtop and portable NIRS instruments under the same experimental design, an approach scarcely explored in literature. Importantly, the methodology was applied under real operating conditions in a biofactory producing BSF larvae flours, which further reinforces the practical relevance and uniqueness of the study.
2. Materials and Methods
2.1. Production of BSF Larvae
The BSF larvae used in this study were reared in a climate-controlled environment under controlled conditions at 28 ± 2 °C, with a relative humidity of 50 to 60% for 30 days [5]. Upon reaching the pre-pupal stage, the larvae were harvested, frozen at –21 °C for 48 h to interrupt metabolic activity and ensure sample stability and then subjected to drying and milling. For flour production, the larvae were dried in a forced-air oven at 70 °C for 72 hours and ground to 1 mm (18 mesh).
BSF larvae fed with different substrates were used to construct more robust models. The diets consisted of binary mixtures of farinaceous residue and residues from four agro-industrial processes (white grape pomace from the wine industry, olive cake from the olive oil industry, malt bagasse from the brewing industry, and orange bagasse from the juice industry). The control diet consisted of 100% farinaceous residue, as described in Table 1.
The farinaceous residue originates from the rearing of Ephestia kuehniella (flour moth), which is maintained as a host for parasitoid wasps. This substrate consists of 97% whole wheat flour and 3% brewer’s yeast (Saccharomyces cerevisiae). The substrate is produced at the university’s biofactory. After 30 days, the larvae flour moth is removed for parasitoid rearing, and the remaining farinaceous residue is used in experiments with BSF larvae.
2.2. Reference Method for Total Lipids and Crude Protein Determination
For the determination of lipids (ether extract) and crude protein content, the procedures were carried out according to the official methods of analysis established by the AOAC. The method employed for determining lipid content involves extracting the lipid content from the sample using a solvent, followed by evaporating the solvent AOAC Official Method 978.04 (AOAC, 2019). Meanwhile, protein content determination was performed using the Kjeldahl method, which includes digesting the sample with sulfuric acid to release nitrogen, subsequently converting nitrogen to ammonia. The ammonia is then distilled and titrated to determine the amount of nitrogen in the sample, which is used to calculate the protein content AOAC Official Method 920.39 [27].
2.3. Near-Infrared Spectroscopy (NIRS) Methodology
For the acquisition of NIR spectra (benchtop and portable), samples were first dried in an oven at 70 ± 2°C (MA 037, Marconi, BR), then crushed and sieved to a particle size of 1 mm (Oster® mill, CA).
In the benchtop spectrometer studies, spectra were acquired from 1000 to 2500 nm with a resolution of 1.6 nm and eight scans. The equipment used was a near-infrared spectrometer with an integrating sphere (Spectrum 400, Perkin Elmer, USA), used with a near-infrared reflectance accessory (NIRA). This setup ensures diffuse and specular reflectance, uniform detection even in heterogeneous samples, and minimizes polarization effects from the illumination beam and sample interactions.
In contrast, with the portable spectrometer, spectra were acquired in the range of 900 to 1700 nm with a resolution of 12 nm and six scans. The portable equipment used in this study was developed based on a DLP NIRScan Nano EVM spectrophotometer (Texas Instruments®, USA). To protect the spectrophotometer and aid in spectrum acquisition, a polylactic acid (PLA) case was produced with 3D printing technology (3D Pro, GTMAX3D Core A2V2, BR) as described by da Silva et al. [20].
2.4. Multivariate Data Analysis
Multivariate data analysis was initially applied to the samples using the infrared spectra acquired by the two spectrophotometers, as an exploratory data analysis. The aim was to observe the performance of the two methodologies in identifying groupings samples and in identifying any potential anomalous samples.
For this purpose, the principal component analysis (PCA) was conducted to reduce the dimensionality of the spectral dataset and facilitate visualization of similarities among samples. Most samples measured with the benchtop spectrometer were analyzed in triplicate; however, sample OO50 was measured five times. For the portable spectrometer, measurements were performed in five replicates, except for sample GR25, which was measured four times due to differences in sample availability.
Subsequently, partial least squares regression models (PLS) were developed to quantify lipids and proteins using both methodologies. For this, the spectral data obtained from the benchtop and portable spectrophotometers (matrix xb and xp), along with the percentage of lipids and proteins (vector yb and yp), were used to develop calibration models for quantitative analysis. The PCA and PLS models were performed using Solo+Mia software from Eigenvector Research Inc. (version 8.1).
Following the acquisition of spectra from both devices, various preprocessing techniques were investigated to identify the optimal model for predicting the composition of BSF larval flours. The best model was selected based on the lowest values of root mean square error of cross-validation (RMSECV) and root mean square error of calibration (RMSEC), and the highest coefficient of determination (R²) [28]. Cross-validation was performed using the Venetian blinds method with 10 splits and a blind thickness of 1.
The performance of the calibration models was evaluated in the analysis of BSF larvae flours from different origins, with a total of 15 test samples analyzed using three replicates on the benchtop equipment and five replicates on the portable equipment.
The difference in the number of replicates was due to sample availability and specific technical requirements of the instruments, and no samples were excluded to ensure a faithful representation of the methodologies’ performance.
3. Results and Discussion
The reference methodologies employed identified significant variations in the concentrations of lipids (20.4 – 40.0%) and crude proteins (29.7 – 46.9%) in the set of samples investigated.
The nutritional composition of BSF larvae flour varied according to the agro-industrial substrates used (Table 2). The control diet (CON) yielded intermediate levels of protein (39.8%) and lipids (31.5%), whereas olive pomace (OO50) resulted in the lowest protein content (29.7%). Barley malt at 75% inclusion (BM75) promoted the highest protein concentration (46.9%) and the lowest lipid level (20.4%), while orange pomace at 25% (OJ25) produced the highest lipid content (40.0%). Increasing orange pomace to 50% (OJ50) restored protein levels (40.8%) and reduced lipids (27.1%). Grape pomace (GR25) provided relatively high protein (40.8%) with moderate lipid content (27.1%). Overall, these findings demonstrate clear substrate-specific effects, with BM75 favoring protein accumulation, OJ25 enhancing lipid deposition, and OO50 limiting protein incorporation.
This variation has also been reported in other studies, where crude protein content in BSF larvae ranges from 20% to 77% and lipid content from 10% to 40%, depending on the substrate used as a food source [9,10,11,29,30,31,32].
The increases in protein and carbohydrate concentrations in the diet result in higher fat levels. [14] However, regardless of the feeding substrate, it has been reported that lauric acid is predominant, followed by myristic, palmitic, and oleic acids, indicating that despite the different amounts of total lipids, the predominant fatty acids remain the same. [3,33] The nitrogen source in the substrate plays an important role in both larval development and the bioconversion process, impacting growth and product quality. [7,13,34]
The observed wide variability is beneficial and intentional for developing calibration models. Additionally, the fact that the predominant fatty acids remain consistent regardless of the feeding substrate [3], also enhances the performance of the multivariate analysis by NIRS.
Figure 1 shows the infrared spectra profiles of BSF larval flour samples obtained using portable and benchtop spectrophotometers with different wavelength ranges.
Since they are primarily composed of proteins, fats, and carbohydrates, the absorption peaks observed in insect flours are associated with these compounds. The regions around 1200 nm contain CH stretching bands corresponding to the second harmonic of HC=CH, CH3, and CH2, related to the presence of lipids. [35,36] The absorption bands between 1699 and 1797 nm promote CH bond stretching in the first harmonic, also associated with fat and fatty acid content [36].
Regarding peaks related to proteins and amino acids, the most significant wavelengths include the regions of 1495 and 1578 nm, with the first overtone of N—H stretching, NH, and the first overtone of N—H in CONH-R. Additionally, absorption bands are observed in the regions of 1978 and 2053 nm, corresponding to asymmetric stretching + amide II, 2164 nm symmetric stretching + amide II, 2298 nm related to 2 × amide I + amide III, and the 2525 nm region for asymmetric C—N—C stretching. [35,37]
3.1. Multivariate Analysis by Principal Component Analysis (PCA)
The PCA data was obtained after preprocessing using the second derivative (Savitzky-Golay filter) and mean centering in this study stage. For the benchtop spectrophotometer, a window width of w = 15 points was used, while for the portable spectrophotometer, a width of w = 3 points was applied due to its lower resolution.
Exploratory data analysis by PCA allowed a better understanding of the relationships between the sets. The principal components PC1, PC2, and PC3 account for 82.59% of the total variance in the data and provide discriminatory information about the samples using the portable equipment. The first principal component (PC1) explains 53.48% of the total variance, while PC2 and PC3 account for 22.42% and 6.69%, respectively (Figure 2).
The variability in PC1 is primarily associated with higher absorption in the regions around 940 nm, 1180 nm, 1380 nm, and 1407 nm (positive side of PC1), as well as 912–1220 nm (negative side of PC1), which are linked to proteins. For PC2, higher absorbance was observed at 1355 nm, 1376 nm, 1150–1190 nm, and 1700 nm on the positive side, while 1220 nm and 1670 nm were prominent on the negative side of PC2.
In the benchtop equipment, PC1 accounted for 77.59% of the variability, while PC2 and PC3 explained 10.27% and 7.30%, respectively (Figure 3). Despite the clustering observed among the CON, BM25, and GR25 samples, the PC1 versus PC3 plot reveals clearly defined and distinct groups. The positive side of PC1 is mainly influenced by signals generated at 1700 nm (lipids), 1900 nm, 2298 nm (protein), and 2340 nm (lipids). It can also be observed that the samples with higher protein content are located in this region.
The PCA results revealed clustering of samples according to differences in nutritional composition, reflecting the inherent variability among substrates and production conditions. This variability represents a critical challenge for developing robust calibration models. By integrating this exploratory analysis with regression models, it becomes evident that differences in sample grouping influence prediction accuracy, particularly when calibration and prediction sets differ in origin. Addressing this variability was among the objectives of the present study as it reflects real production scenarios in which analytical methods must reliably operate despite heterogeneity in sample profiles. Thus, the combination of PCA and PLS analyses highlights not only the discriminatory power of spectral features but also the capacity of multivariate calibration to cope with matrix diversity, underscoring the synergy between these approaches.
3.2. Multivariate Analysis by Partial Least Squares (PLS)
Various preprocessing methods were evaluated to highlight the spectral variations among the samples, enhance the performance of the calibration models, and minimize errors during spectrum acquisition. The best model was selected regarding the lowest RMSECV, the best R²C results, and the smallest number of latent variables. The results of these evaluations are organized in Tables S1 of the supplementary material.
To define the optimal number of latent variables (LVs) in the PLS models, both RMSEC and RMSECV values were examined (Figure S1, supplementary material). In the model based on the portable NIRS device, a slight increase in RMSECV was observed for crude protein beyond 5 LVs; however, 9 LVs were selected to improve lipid prediction, highlighting the trade-off when using a multicomponent calibration. In contrast, the benchtop model showed consistent error reduction up to 7 LVs, indicating greater robustness.
For predicting bromatological characteristics, the portable device showed the lowest RMSECV after preprocessing with the first derivative (Savitsky-Golay filter, width w = 3 points), followed by mean centering and using nine latent variables.
For the benchtop device, the best results were obtained with preprocessing using the multiplicative scattering correction and first derivative (Savitsky-Golay filter, width w = 15 points), followed by mean centering and using seven latent variables. In the spectra obtained from benchtop spectrophotometers, the Savitzky-Golay filter with 15 points was applied to achieve the most effective signal smoothing, considering the greater resolution of the infrared spectra produced by these devices.
The performance of the selected PLS regression models using portable and benchtop spectrophotometers for determining lipids and crude protein (%, w/w) is presented in Figure 4 and Figure 5, respectively.
The results presented by the calibration models indicate that the strategy of producing flour from BSF larvae fed with different substrates was effective for developing calibration models to quantify lipids and crude proteins.
Regarding lipids content, the benchtop equipment showed better performance, with an RMSECV of 1.24% (w/w) and R²CV of 0.946, compared to 2.60% (w/w) and 0.785 presented by the portable equipment. These differences can be mainly attributed to the robustness of the benchtop equipment, which covers a larger spectral region (between 1700 nm and 2500 nm). Regions above 1700 nm contain important information about molecular vibrations related to the presence of proteins. Animal-origin flours exhibit specific characteristics in the region between 2000 and 2500 nm, with notable peaks associated with the presence of animal-derived proteins [38].
This instrumental limitation of the portable NIRS device is also evident in the loading plots (Figure S2, supplementary material). The Variable Importance in Projection (VIP) scores quantify the relevance of each variable used in the PLS model and are commonly applied for variable selection. Variables with VIP values close to or exceeding 1 are considered significant within the model. In the present results, the highest VIP contributions occur in the wavelength region above 1700 nm, demonstrating that the benchtop spectrophotometer is more effective in detecting analytes whose absorption bands lie within this spectral range.
In this region, several combination and overtone bands associated with amide I, II, and III vibrations (≈1900–2500 nm), as well as C–H stretching and deformation modes of fatty acids (≈1700–1800 nm and ≈2300 nm), provide highly specific chemical information essential for modeling these analytes [37]. Studies on mealworm and BSF matrices consistently highlight these same bands as the primary predictors of crude protein and lipid content, reinforcing their analytical relevance [24,25]. Thus, access to the extended NIR range up to 2500 nm allows the benchtop spectrophotometer to capture absorption features directly attributable to peptide and fatty-acid structures, explaining the stronger VIP responses and its superior predictive ability when compared to portable devices limited to shorter wavelengths.
As for crude protein content, the results demonstrated an RMSECV of 0.59% and R²CV of 0.989 for the benchtop equipment compared to an RMSECV of 2.00 and R²CV of 0.863 for the portable equipment. Previous studies have also demonstrated the potential of NIRS in discriminating BSF larvae morphology (instars) and identifying the feed source used as a substrate [26]. Additionally, the literature shows a trend toward using portable NIRS equipment for analyzing the proximate composition of food matrices such as cheese, milk, and whey protein [39,40,41].
When the models were applied to the analysis of test samples, the best results were obtained for lipid determination using spectra acquired with the benchtop spectrophotometer, yielding prediction error values (RMSEP) of 1.59% (w/w). When the portable spectrophotometer was used, these errors reached 5.23% (w/w).
For crude protein quantification, the RMSEP values were 3.88% (w/w) and 3.37% (w/w) for spectra obtained with the benchtop and portable spectrophotometers, respectively.
Another important factor to consider is that the samples used for prediction had significantly different origins compared to the calibration samples, either due to production methodology, substrate used, or the larval slaughtering and flour processing methods. These factors contributed to the significantly higher prediction error (p < 0.05) than that observed in cross-validation tests. Thus, future methodological developments may achieve better performance if sample variations are incorporated into the calibration dataset.
It is important to draw attention to the higher error levels associated with portable methods, which must be carefully considered depending on the quality of results required for process monitoring. This study highlights using portable NIRS equipment for lipids and crude protein determination, demonstrating a comparable performance to benchtop equipment. The feasibility of using portable devices in field scenarios broadens the practical applicability of NIRS in the food analysis particularity, confirming trends toward faster and lower-cost analyses. Portable NIRS devices offer several advantages for non-destructive, online, or in-situ analyses, including small size, low cost, simplicity of operation, user-friendly sample interface, portability, and ergonomic design [42].
With the non-invasive monitoring capabilities of NIRS and the reasonable predictability of the nutritional composition of BSF larvae flours using a portable device, it is possible to record and evaluate the composition of insect flours continuously. This aids in selecting the most suitable feed for larval development and composition [25].
The results demonstrate that NIRS enables rapid (<1 min), reagent-free determinations of crude protein and lipids in BSF flour, in contrast with conventional methods that require 6–8 h and hazardous chemicals, thereby aligning with the principles of green analytical chemistry.
4. Conclusions
The PCA exploratory analysis revealed that the benchtop equipment was superior in identifying the larvae flour samples with varying nutritional compositions. However, the portable NIRS device also demonstrated efficiency, proving beneficial for the preliminary identification of nutritional patterns among the samples, though with slightly lower performance than the benchtop equipment.
Similarly, using both benchtop and portable equipment, NIRS combined with multivariate calibration methods proved helpful in determining total lipids and crude proteins. Although the benchtop spectrophotometer offers higher resolution and a broader reading range, the portable spectrometer also performed well, demonstrating the ability to build calibration models. However, applying sample sets from different production processes revealed a significant matrix effect, impairing the quantification of lipids and crude proteins, mainly when using the portable spectrophotometer.
The proposed analytical approach offers a sustainable quality control strategy for larvae flour, aligning with green analytical chemistry by eliminating toxic reagents, reducing environmental impact, and ensuring precision and speed. The use of NIRS tools has the potential to advance the insect production industry, promoting food security and sustainable agriculture.
Supplementary Materials
The following supporting information can be downloaded at the website of this paper posted on Preprints.org, Table S1: Effect of different pre-processing strategies on the calibration models for lipids and crude proteins (% w/w) in BSF larval flour using benchtop and portable spectrophotometer; Figure S1: Root mean square error of calibration (RMSEC) and cross-validation (RMSECV) as a function of the number of latent variables for lipid and crude protein determinations using benchtop (A) and portable (B) infrared spectrophotometers; Figure S2: Variable importance in projection (VIP) scores of the partial least-squares prediction model for crude protein (A) and lipids (B) concentration using portable and benchtop spectrophotometers.
Author Contributions
Conceptualization, R.O.S., D.C.S. and A.K.; methodology, R.O.S., L.R.F., R.M.S. and A.B.C.; software, G.A.H. and A.B.C..; validation, R.O.S.; formal analysis, L.R.F. and D.C.S.; data curation, R.O.S..; writing—original draft preparation, R.O.S, A.B.C..; writing—review and editing, A.B.C, B.B..; project administration, A.K and A.B.C. All authors have read and agreed to the published version of the manuscript.
Funding
This research received no external funding.
Data Availability Statement
The datasets used and/or analyzed during the current study are available from the corresponding author on reasonable request.
Acknowledgments
The authors thank the National Council for Scientific and Technological Development (CNPQ) - protocol 302816/2023-2, Coordination for the Improvement of Higher Education Personnel (CAPES) - code 001, and Foundation for Research of the State of Rio Grande do Sul (FAPERGS) – protocol 24/2551-0001188-9. During the preparation of this manuscript, the authors used ChatGPT (OpenAI, GPT-5.2) to assist with language editing and text refinement. The authors reviewed and edited the output as necessary and take full responsibility for the content of this publication.
Conflicts of Interest
The authors declare no conflicts of interest.
Abbreviations
The following abbreviations are used in this manuscript:
| BSF | Black Soldier Fly |
| NIR | Near-Infrared |
| NIRS | Near-Infrared Spectroscopy |
| PCA | Principal Component Analysis |
| PLS | Partial Least Squares |
| RMSEC | Root Mean Square Error of Calibration |
| RMSECV | Root Mean Square Error of Cross-Validation |
| RMSEP | Root Mean Square Error of Prediction |
| VIP | Variable Importance in Projection |
| LV | Latent Variables |
| PLA | Polylactic Acid |
References
- Dobermann, D.; Swift, J.A.; Field, L.M. Opportunities and hurdles of edible insects for food and feed. Nutrition Bulletin 2017, 42, 293-308. [CrossRef]
- Ahmad, I.K.; Peng, N.T.; Amrul, N.F.; Basri, N.E.A.; Jalil, N.A.A.; Azman, N.A. Potential Application of Black Soldier Fly Larva Bins in Treating Food Waste. Insects 2023, 14, 434.
- Franco, A.; Salvia, R.; Scieuzo, C.; Schmitt, E.; Russo, A.; Falabella, P. Lipids from Insects in Cosmetics and for Personal Care Products. Insects 2022, 13, 41.
- Nampijja, Z.; Kiggundu, M.; Kigozi, A.; Lugya, A.; Magala, H.; Ssepuuya, G.; Nakimbugwe, D.; Walusimbi, S.S.; Mugerwa, S. Optimal substitution of black soldier fly larvae for fish in broiler chicken diets. Scientific African 2023, 20, e01636. [CrossRef]
- Pérez-Pacheco, R.; Hinojosa-Garro, D.; Ruíz-Ortíz, F.; Camacho-Chab, J.C.; Ortega-Morales, B.O.; Alonso-Hernández, N.; Fonseca-Muñoz, A.; Landero-Valenzuela, N.; Loeza-Concha, H.J.; Diego-Nava, F.; et al. Growth of the Black Soldier Fly Hermetia illucens (Diptera: Stratiomyidae) on Organic-Waste Residues and Its Application as Supplementary Diet for Nile Tilapia Oreochromis niloticus (Perciformes: Cichlidae). Insects 2022, 13, 326.
- Surendra, K.C.; Olivier, R.; Tomberlin, J.K.; Jha, R.; Khanal, S.K. Bioconversion of organic wastes into biodiesel and animal feed via insect farming. Renewable Energy 2016, 98, 197-202. [CrossRef]
- Fuso, A.; Barbi, S.; Macavei, L.I.; Luparelli, A.V.; Maistrello, L.; Montorsi, M.; Sforza, S.; Caligiani, A. Effect of the Rearing Substrate on Total Protein and Amino Acid Composition in Black Soldier Fly. Foods 2021, 10, 1773.
- Ramos-Bueno, R.P.; González-Fernández, M.J.; Sánchez-Muros-Lozano, M.J.; García-Barroso, F.; Guil-Guerrero, J.L. Fatty acid profiles and cholesterol content of seven insect species assessed by several extraction systems. European Food Research and Technology 2016, 242, 1471-1477. [CrossRef]
- Sideris, V.; Georgiadou, M.; Papadoulis, G.; Mountzouris, K.; Tsagkarakis, A. Effect of Processed Beverage By-Product-Based Diets on Biological Parameters, Conversion Efficiency and Body Composition of Hermetia illucens (L) (Diptera: Stratiomyidae). Insects 2021, 12, 475.
- Hopkins, I.; Newman, L.P.; Gill, H.; Danaher, J. The Influence of Food Waste Rearing Substrates on Black Soldier Fly Larvae Protein Composition: A Systematic Review. Insects 2021, 12, 608.
- Wang, Y.-S.; Shelomi, M. Review of Black Soldier Fly (Hermetia illucens) as Animal Feed and Human Food. Foods 2017, 6, 91.
- Zulkifli, N.F.N.M.; Seok-Kian, A.Y.; Seng, L.L.; Mustafa, S.; Kim, Y.-S.; Shapawi, R. Nutritional value of black soldier fly (Hermetia illucens) larvae processed by different methods. PLOS ONE 2022, 17, e0263924. [CrossRef]
- Hosseindoust, A.; Ha, S.H.; Mun, J.Y.; Kim, J.S. Quality Characteristics of Black Soldier Flies Produced by Different Substrates. Insects 2023, 14, 500.
- Barragan-Fonseca, K.B.; Dicke, M.; van Loon, J.J.A. Nutritional value of the black soldier fly (Hermetia illucens L.) and its suitability as animal feed – a review. Journal of Insects as Food and Feed 2017, 3, 105-120. [CrossRef]
- Lu, S.; Taethaisong, N.; Meethip, W.; Surakhunthod, J.; Sinpru, B.; Sroichak, T.; Archa, P.; Thongpea, S.; Paengkoum, S.; Purba, R.A.P.; et al. Nutritional Composition of Black Soldier Fly Larvae (Hermetia illucens L.) and Its Potential Uses as Alternative Protein Sources in Animal Diets: A Review. Insects 2022, 13, 831.
- Hong, J.; Kim, Y.Y. Insect as feed ingredients for pigs. Animal bioscience 2022, 35, 347-355. [CrossRef]
- Schiavone, A.; Cullere, M.; De Marco, M.; Meneguz, M.; Biasato, I.; Bergagna, S.; Dezzutto, D.; Gai, F.; Dabbou, S.; Gasco, L.; et al. Partial or total replacement of soybean oil by black soldier fly larvae (Hermetia illucens L.) fat in broiler diets: effect on growth performances, feed-choice, blood traits, carcass characteristics and meat quality. Italian Journal of Animal Science 2017, 16, 93-100. [CrossRef]
- Sándor, Z.J.; Banjac, V.; Vidosavljević, S.; Káldy, J.; Egessa, R.; Lengyel-Kónya, É.; Tömösközi-Farkas, R.; Zalán, Z.; Adányi, N.; Libisch, B.; et al. Apparent Digestibility Coefficients of Black Soldier Fly (Hermetia illucens), Yellow Mealworm (Tenebrio molitor), and Blue Bottle Fly (Calliphora vicina) Insects for Juvenile African Catfish Hybrids (Clarias gariepinus × Heterobranchus longifilis). Aquaculture Nutrition 2022, 2022, 4717014. [CrossRef]
- Moore, J.C.; DeVries, J.W.; Lipp, M.; Griffiths, J.C.; Abernethy, D.R. Total Protein Methods and Their Potential Utility to Reduce the Risk of Food Protein Adulteration. Comprehensive Reviews in Food Science and Food Safety 2010, 9, 330-357. [CrossRef]
- da Silva, I.C.M.; Abich, J.G.; Maurer, N.B.; Soares, J.; Pessatto, D.F.; Santos, R.O.; Helfer, G.A.; da Costa, A.B. Fast and low-cost method for direct and simultaneous determination of nitrogen and carbon in soybean leaves using benchtop and portable near-infrared devices. Journal of the Science of Food and Agriculture 2024, 104, 1843-1852. [CrossRef]
- Sajid, M.; Płotka-Wasylka, J. Green analytical chemistry metrics: A review. Talanta 2022, 238, 123046. [CrossRef]
- Baumann, L.; Librelotto, M.; Pappis, C.; Helfer, G.A.; Santos, R.O.; dos Santos, R.B.; da Costa, A.B. NanoMetrix: An app for chemometric analysis from near infrared spectra. Journal of Chemometrics 2020, 34, e3281. [CrossRef]
- Gałuszka, A.; Migaszewski, Z.; Namieśnik, J. The 12 principles of green analytical chemistry and the SIGNIFICANCE mnemonic of green analytical practices. TrAC Trends in Analytical Chemistry 2013, 50, 78-84. [CrossRef]
- Cruz-Tirado, J.P.; Vieira, M.S.d.S.; Amigo, J.M.; Siche, R.; Barbin, D.F. Prediction of protein and lipid content in black soldier fly (Hermetia illucens L.) larvae flour using portable NIR spectrometers and chemometrics. Food Control 2023, 153, 109969. [CrossRef]
- Kröncke, N.; Benning, R. Determination of Moisture and Protein Content in Living Mealworm Larvae (Tenebrio molitor L.) Using Near-Infrared Reflectance Spectroscopy (NIRS). Insects 2022, 13, 560.
- Alagappan, S.; Hoffman, L.C.; Mantilla, S.M.O.; Mikkelsen, D.; James, P.; Yarger, O.; Cozzolino, D. Near Infrared Spectroscopy as a Traceability Tool to Monitor Black Soldier Fly Larvae (Hermetia illucens) Intended as Animal Feed. Applied Sciences 2022, 12, 8168.
- Chemists., A.o.O.A. Official Methods of Analysis of AOAC International. 2019, Official Method 978.04.
- Rinnan, Å.; Berg, F.v.d.; Engelsen, S.B. Review of the most common pre-processing techniques for near-infrared spectra. TrAC Trends in Analytical Chemistry 2009, 28, 1201-1222. [CrossRef]
- Zozo, B.; Wicht, M.M.; Mshayisa, V.V.; van Wyk, J. The Nutritional Quality and Structural Analysis of Black Soldier Fly Larvae Flour before and after Defatting. Insects 2022, 13. [CrossRef]
- Liland, N.S.; Biancarosa, I.; Araujo, P.; Biemans, D.; Bruckner, C.G.; Waagbø, R.; Torstensen, B.E.; Lock, E.-J. Modulation of nutrient composition of black soldier fly (Hermetia illucens) larvae by feeding seaweed-enriched media. PLOS ONE 2017, 12, e0183188. [CrossRef]
- Meneguz, M.; Schiavone, A.; Gai, F.; Dama, A.; Lussiana, C.; Renna, M.; Gasco, L. Effect of rearing substrate on growth performance, waste reduction efficiency and chemical composition of black soldier fly (Hermetia illucens) larvae. J Sci Food Agric 2018, 98, 5776-5784. [CrossRef]
- Tschirner, M.; Simon, A. Influence of different growing substrates and processing on the nutrient composition of black soldier fly larvae destined for animal feed. Journal of Insects as Food and Feed 2015, 1, 249-259. [CrossRef]
- Kierończyk, B.; Rawski, M.; Mikołajczak, Z.; Homska, N.; Jankowski, J.; Ognik, K.; Józefiak, A.; Mazurkiewicz, J.; Józefiak, D. Available for millions of years but discovered through the last decade: Insects as a source of nutrients and energy in animal diets. Animal nutrition (Zhongguo xu mu shou yi xue hui) 2022, 11, 60-79. [CrossRef]
- Lu, Y.; Zhang, S.; Sun, S.; Wu, M.; Bao, Y.; Tong, H.; Ren, M.; Jin, N.; Xu, J.; Zhou, H.; et al. Effects of Different Nitrogen Sources and Ratios to Carbon on Larval Development and Bioconversion Efficiency in Food Waste Treatment by Black Soldier Fly Larvae (Hermetia illucens). Insects 2021, 12, 507.
- Benes, E.; Biró, B.; Fodor, M.; Gere, A. Analysis of wheat flour-insect powder mixtures based on their near infrared spectra. Food Chemistry: X 2022, 13, 100266. [CrossRef]
- Kröncke, N.; Neumeister, M.; Benning, R. Near-Infrared Reflectance Spectroscopy for Quantitative Analysis of Fat and Fatty Acid Content in Living Tenebrio molitor Larvae to Detect the Influence of Substrate on Larval Composition. Insects 2023, 14, 114.
- Chen, L.; Yang, Z.; Han, L. A Review on the Use of Near-Infrared Spectroscopy for Analyzing Feed Protein Materials. Applied Spectroscopy Reviews 2013, 48, 509-522. [CrossRef]
- Mandrile, L.; Fusaro, I.; Amato, G.; Marchis, D.; Martra, G.; Rossi, A.M. Detection of insect’s meal in compound feed by Near Infrared spectral imaging. Food Chemistry 2018, 267, 240-245. [CrossRef]
- Riu, J.; Gorla, G.; Chakif, D.; Boqué, R.; Giussani, B. Rapid Analysis of Milk Using Low-Cost Pocket-Size NIR Spectrometers and Multivariate Analysis. Foods 2020, 9, 1090.
- Bittante, G.; Patel, N.; Cecchinato, A.; Berzaghi, P. Invited review: A comprehensive review of visible and near-infrared spectroscopy for predicting the chemical composition of cheese. Journal of Dairy Science 2022, 105, 1817-1836. [CrossRef]
- Tu, Z.; Irudayaraj, J.; Lee, Y. Characterizing Spray-Dried Powders through NIR Spectroscopy: Effect of Two Preparation Strategies for Calibration Samples and Comparison of Two Types of NIR Spectrometers. Foods 2023, 12, 467.
- dos Santos, C.A.T.; Lopo, M.; Páscoa, R.N.M.J.; Lopes, J.A. A Review on the Applications of Portable Near-Infrared Spectrometers in the Agro-Food Industry. Applied Spectroscopy 2013, 67, 1215-1233. [CrossRef]
Figure 1.
Profile of the NIR spectra from BSF larval flour samples acquired by portable (from 900 to 1700 nm) and benchtop (from 1100 to 2500 nm) spectrophotometers.
Figure 1.
Profile of the NIR spectra from BSF larval flour samples acquired by portable (from 900 to 1700 nm) and benchtop (from 1100 to 2500 nm) spectrophotometers.
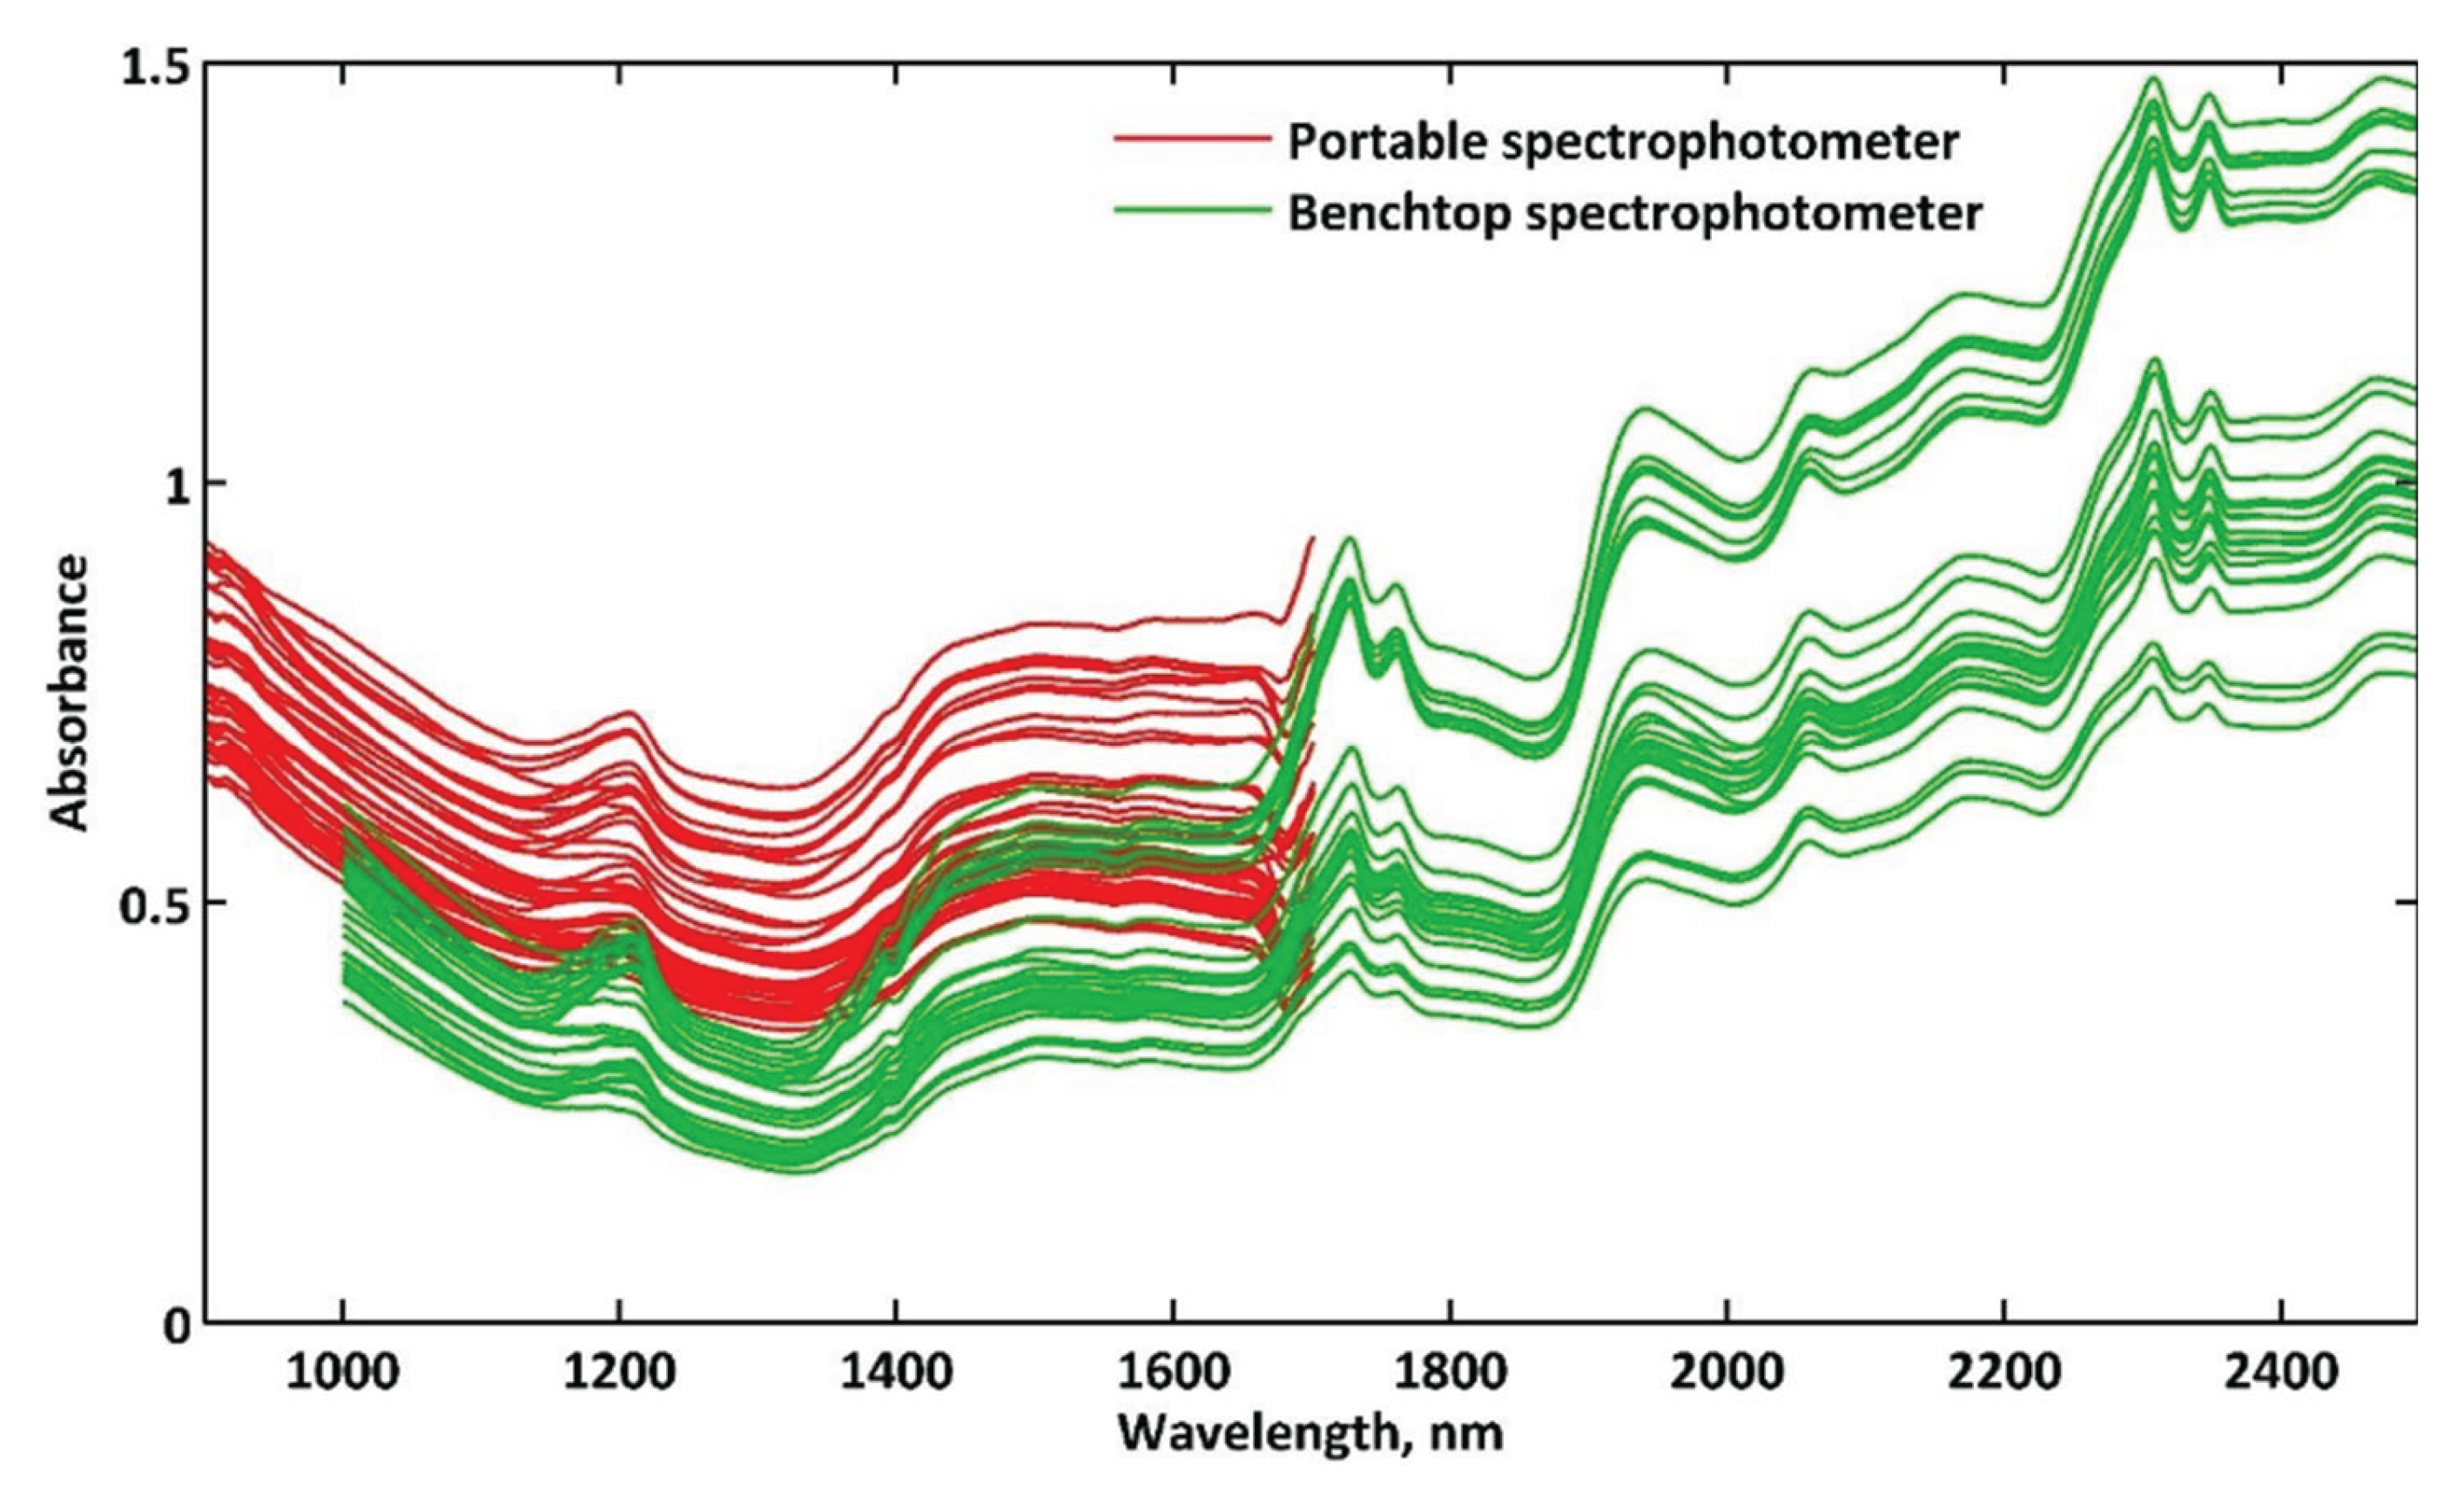
Figure 2.
Principal component analysis (PC1 x PC2 and PC1 x PC3) of insects fed with different food sources obtained by portable spectrophotometer and spectral data pretreatments: second derivative (Savitzky-Golay filter, width w = 3 points) and mean-centering.
Figure 2.
Principal component analysis (PC1 x PC2 and PC1 x PC3) of insects fed with different food sources obtained by portable spectrophotometer and spectral data pretreatments: second derivative (Savitzky-Golay filter, width w = 3 points) and mean-centering.
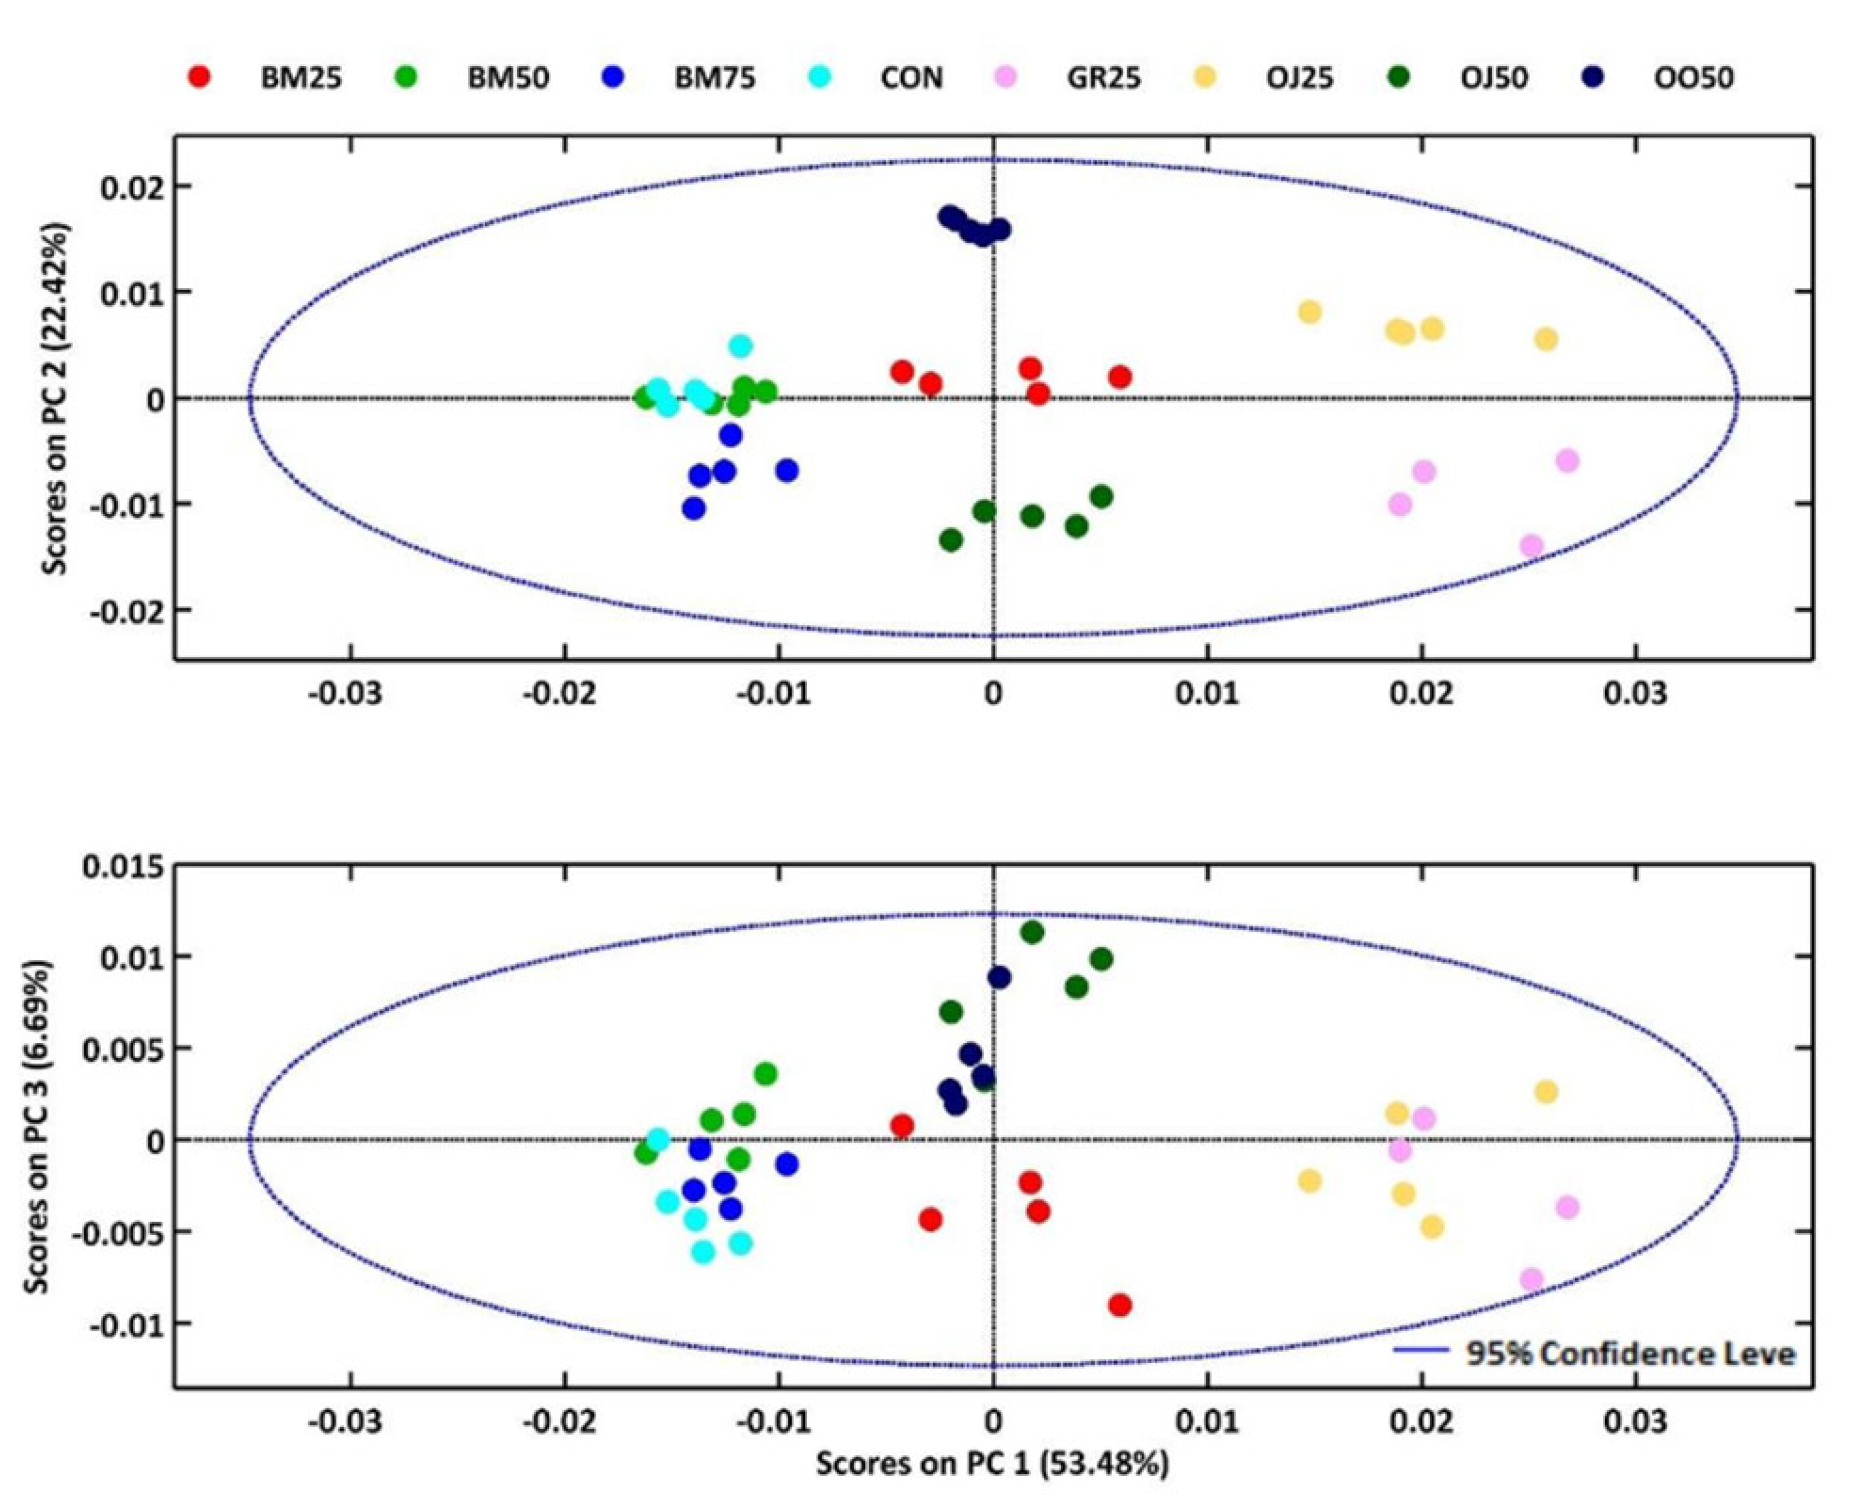
Figure 3.
Principal component analysis (PC1 x PC2 and PC1 x PC3) of insects fed with different food sources obtained by benchtop spectrophotometer and spectral data pretreatments: first derivative (Savitzky-Golay filter, width w = 15 points) and mean-centering.
Figure 3.
Principal component analysis (PC1 x PC2 and PC1 x PC3) of insects fed with different food sources obtained by benchtop spectrophotometer and spectral data pretreatments: first derivative (Savitzky-Golay filter, width w = 15 points) and mean-centering.
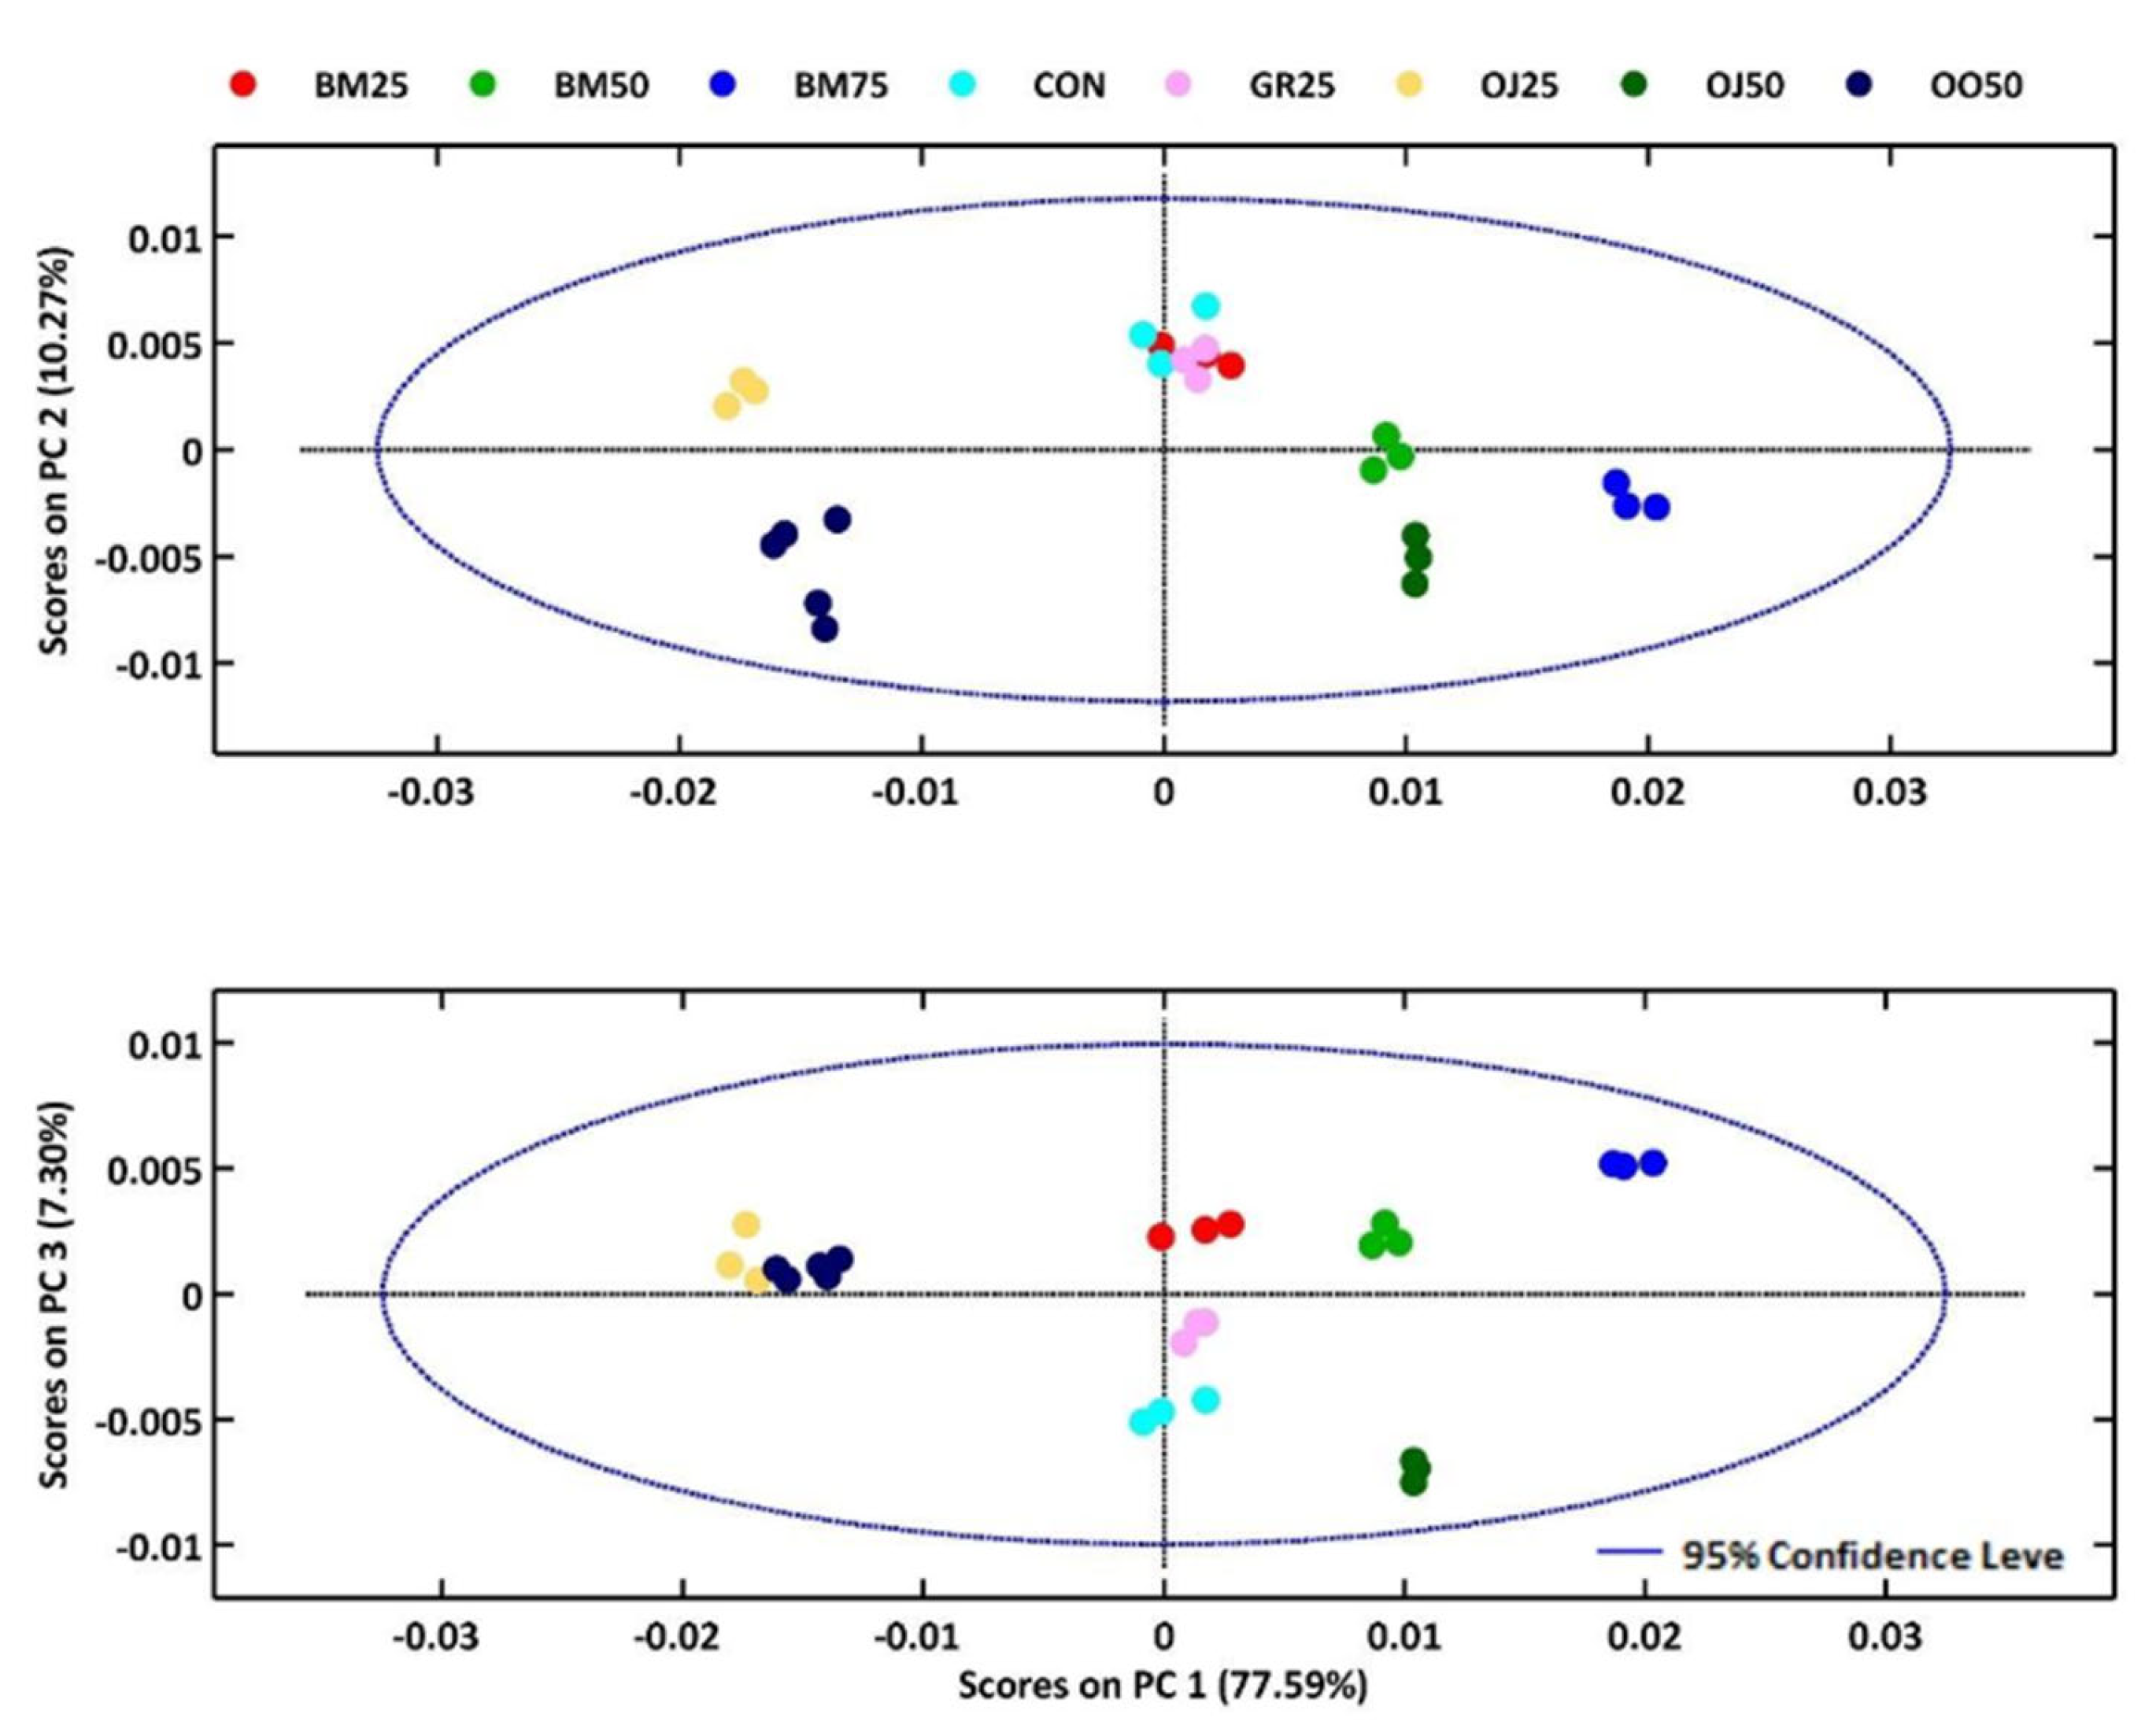
Figure 4.
Correlation between the measured lipid values obtained through the reference method and the predicted results from the benchtop spectrophotometer (A) and the portable spectrophotometer (B).
Figure 4.
Correlation between the measured lipid values obtained through the reference method and the predicted results from the benchtop spectrophotometer (A) and the portable spectrophotometer (B).
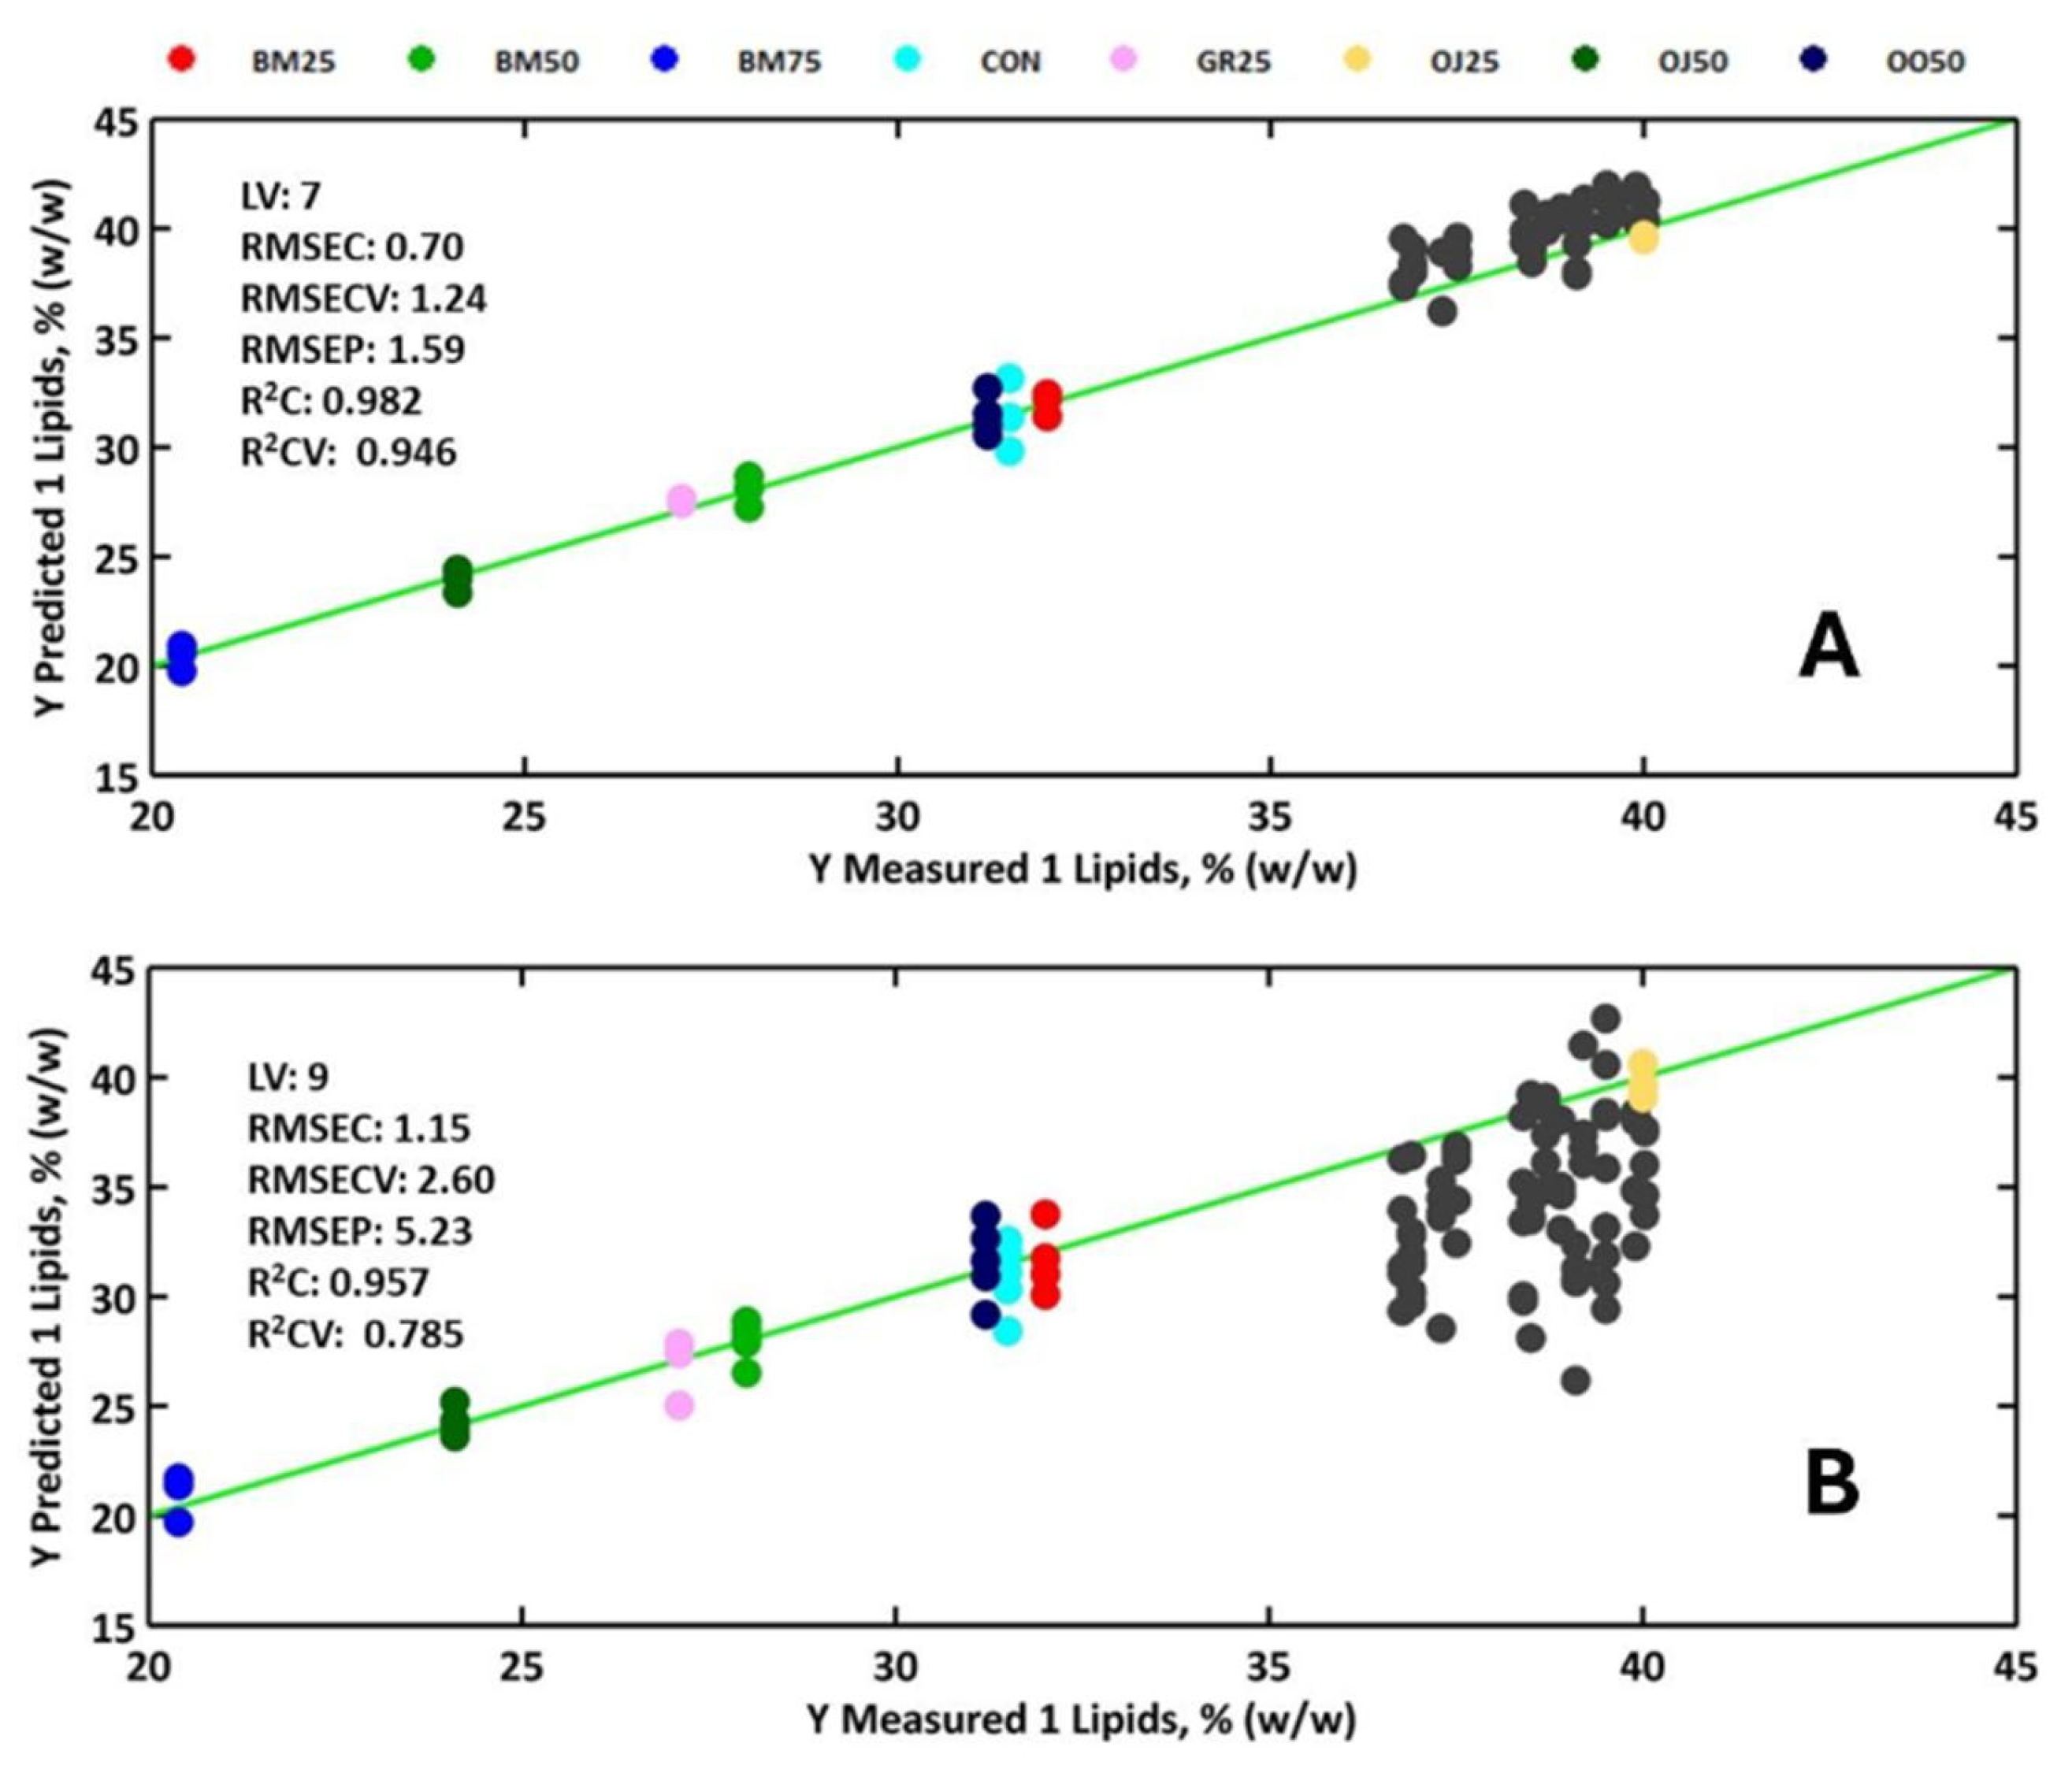
Figure 5.
Correlation between the measured crude protein values obtained through the reference method and the predicted results from the benchtop spectrophotometer (A) and the portable spectrophotometer (B).
Figure 5.
Correlation between the measured crude protein values obtained through the reference method and the predicted results from the benchtop spectrophotometer (A) and the portable spectrophotometer (B).
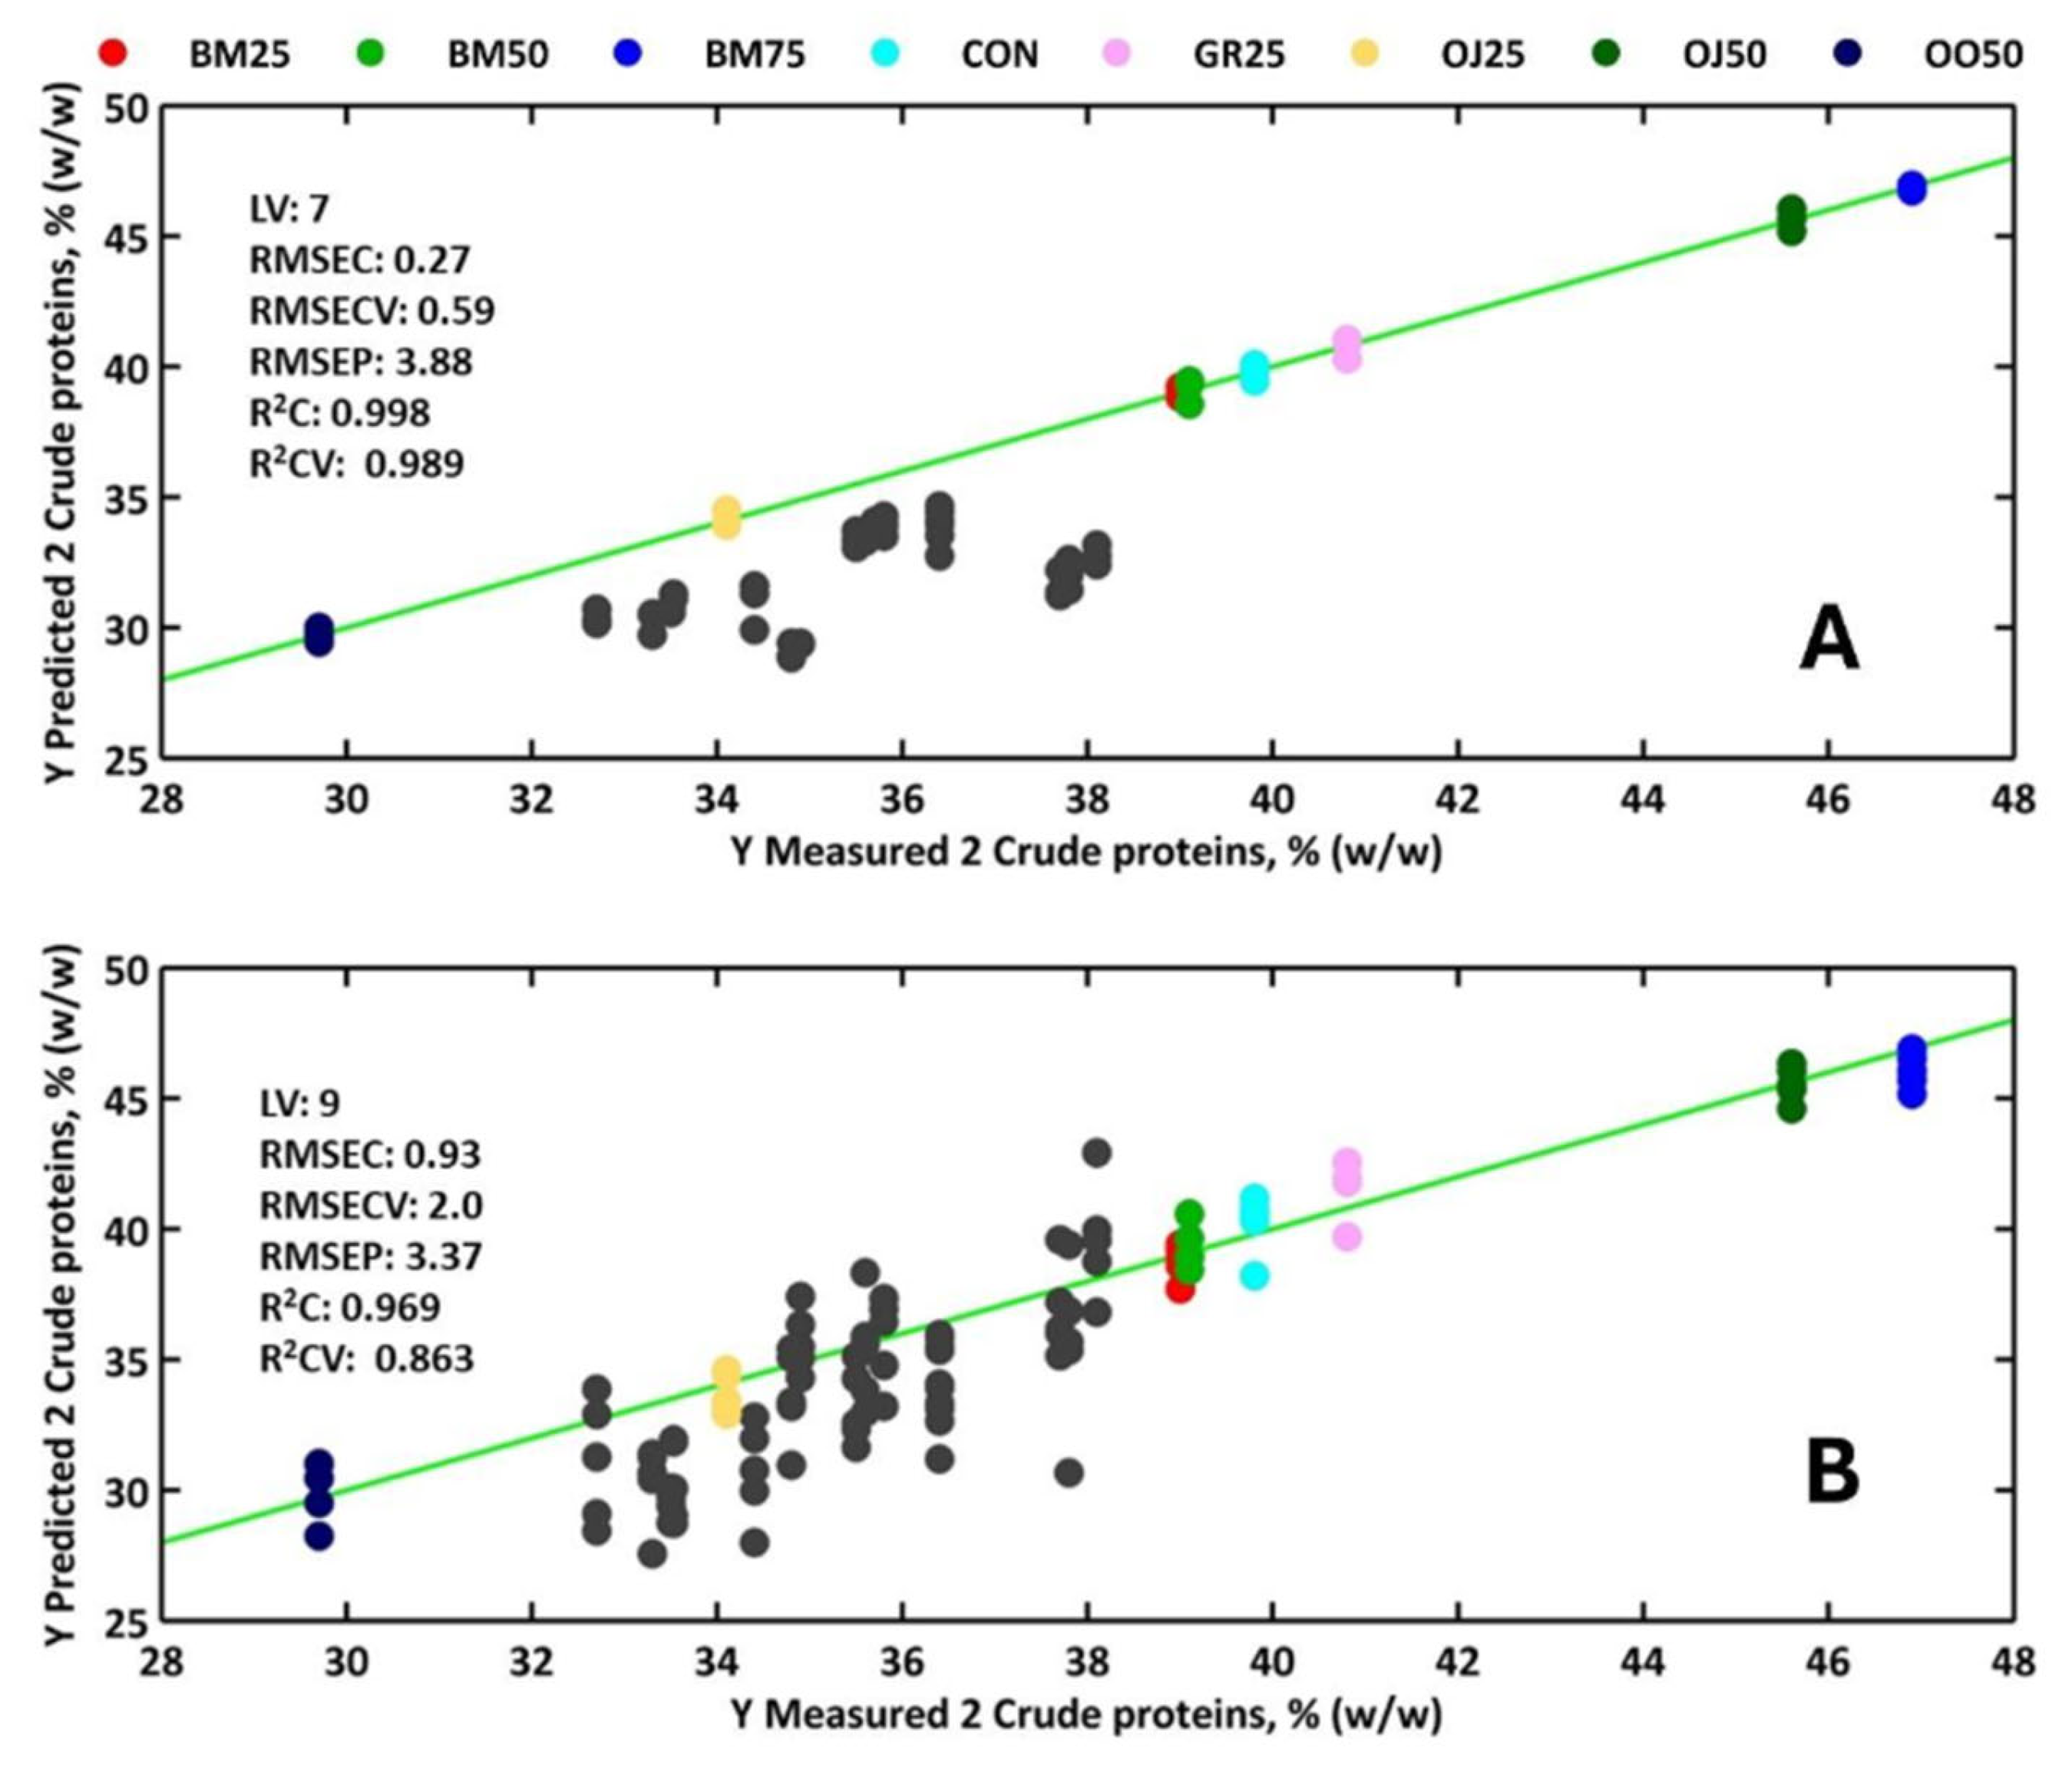

Table 1.
Mix of residues used as a substrate for BSF larval production.
| Code | Origin of agro-industrial residue | Description | Farinaceous residue, % | Agro-industrial residue, % |
| CON | - | Control | 100 | 0 |
| GR25 | Grape processing from the wine industry | White grape pomace | 75 | 25 |
| OO50 | Olive processing from the oil industry | Olive pomace | 50 | 50 |
| BM25 | Barley malt processing from the brewing industry | 75 | 25 | |
| BM50 | Spent grain | 50 | 50 | |
| BM75 | 25 | 75 | ||
| OJ25 | Orange juice processing from the beverage industry | Orange pomace | 75 | 25 |
| OJ50 | 50 | 50 |
Where: CON: Control; GR25: Grape processing from the wine industry (White grape pomace, 25%); OO50: Olive processing from the oil industry (Olive pomace, 50%); BM25: Barley malt processing from the brewing industry (Spent grain, 25%); BM50: BM (Spent grain, 50%); BM75: BM (Spent grain, 75%); OJ25: Orange juice processing from the beverage industry (Orange pomace, 25%); OJ50: OJ (Orange pomace, 50%).
Table 2.
Mean content of total proteins and total lipids (n =3) in flour produced from BSF larvae reared on different substrates.
Table 2.
Mean content of total proteins and total lipids (n =3) in flour produced from BSF larvae reared on different substrates.
| Code | Crude proteins, % (w/w) | Lipids (ether extract), % (w/w) |
| CON | 39.8 ± < 0.1 | 31.5 ± < 0.1 |
| GR25 | 40.8 ± < 0.1 | 27.1 ± < 0.1 |
| OO50 | 29.7 ± < 0.1 | 31.2 ± < 0.1 |
| BM25 | 39.0 ± < 0.1 | 32.0 ± < 0.1 |
| BM50 | 39.1 ± < 0.1 | 28.0 ± < 0.1 |
| BM75 | 46.9 ± < 0.1 | 20.4 ± < 0.1 |
| OJ25 | 34.1 ± < 0.1 | 40.0 ± < 0.1 |
| OJ50 | 40.8 ± < 0.1 | 27.1 ± < 0.1 |
Where: CON - control; GR25 - grape processing from the wine industry (white grape pomace, 25%); OO50 - olive processing from the oil industry (olive pomace, 50%); BM25 - barley malt processing from the brewing industry (spent grain, 25%); BM50 - BM (spent grain, 50%); BM75 - BM (spent grain, 75%); OJ25 - orange juice processing from the beverage industry (orange pomace, 25%); OJ50 - OJ (orange pomace, 50%).
Disclaimer/Publisher’s Note: The statements, opinions and data contained in all publications are solely those of the individual author(s) and contributor(s) and not of MDPI and/or the editor(s). MDPI and/or the editor(s) disclaim responsibility for any injury to people or property resulting from any ideas, methods, instructions or products referred to in the content. |
© 2026 by the authors. Licensee MDPI, Basel, Switzerland. This article is an open access article distributed under the terms and conditions of the Creative Commons Attribution (CC BY) license (http://creativecommons.org/licenses/by/4.0/).
Copyright: This open access article is published under a Creative Commons CC BY 4.0 license, which permit the free download, distribution, and reuse, provided that the author and preprint are cited in any reuse.


