Submitted:
11 February 2026
Posted:
15 February 2026
You are already at the latest version
Abstract
The gut–skin axis is increasingly implicated in psoriasis pathogenesis, yet the cross-compartment convergence of molecular programs remains incompletely defined. We constructed a conceptual “Triple-Hit” multi-omics framework by integrating five independent public datasets spanning gut microbial functional remodeling (shotgun metagenomics), systemic immune-cell methylomes (PBMC and CD8+ T-cell EPIC 850K), and lesional skin regulatory layers (miRNA and bulk RNA-seq). In the gut compartment, functional profiles exhibited a selective reduction in microbial lipid catabolic potential, including decreased fatty acid degradation and a lowered composite lipid degradation score, alongside heterogeneous shifts across SCFA-associated metabolic pathways. Systemically, PBMC methylomes revealed widespread regional remodeling (45,396 DMRs) enriched for membrane-proximal signaling and cytoskeletal programs, while CD8+ T cells showed specific epigenetic alterations in lipid- and glycosphingolipid-associated loci, suggesting a systemic metabolic–epigenetic alignment. In the skin, we identified a compact miRNA signature (168 DE-miRNAs) and a mechanistically interpretable, directionality-constrained miRNA–mRNA bridge that aligns with an AMP-dominant inflammatory transcriptome, consistent with reduced post-transcriptional restraint. Collectively, these findings support a convergent multi-omics framework linking putative microbial metabolic remodeling, systemic immune priming, and cutaneous effector programs. This study provides a systems-level perspective on psoriasis pathogenesis, highlighting the metabolic–epigenetic–transcriptional convergence as a potential avenue for therapeutic intervention.
Keywords:
psoriasis
; gut-skin axis
; multi-omics
; microbial metabolism
; lipid metabolism
; DNA methylation
; immune-cell epigenetics
; antimicrobial peptides
1. Introduction
Psoriasis is a chronic, immune-mediated inflammatory disease traditionally defined by hyperproliferative skin lesions, but it is now widely recognized as a systemic disorder with metabolic, immunological, and microbial dimensions [1,2,3,4]. Beyond the visible cutaneous manifestations, patients frequently exhibit systemic inflammation and an increased prevalence of cardiometabolic comorbidities, highlighting the need for integrative models that extend beyond skin-restricted pathology [5,6]. In this context, the gut-skin axis has emerged as a conceptual framework linking intestinal microbial ecology, host immune regulation, and cutaneous inflammation, yet the molecular convergence across these compartments remains incompletely defined.
Accumulating evidence implicates gut microbial dysbiosis in psoriasis, with multiple studies reporting altered community composition and reduced diversity compared with healthy controls [7,8,9]. However, taxonomic descriptions alone offer limited mechanistic insight. Recently, attention has shifted toward functional profiling, emphasizing microbial metabolic potential as a biologically interpretable layer connecting microbes to host physiology [10]. Importantly, such metagenome-derived profiles represent community-level functional capacity, rather than direct measurements of metabolite concentrations. Short-chain fatty acid (SCFA)-associated pathways and lipid metabolism have been repeatedly implicated in inflammatory skin diseases. While SCFA depletion is often cited, recent findings suggest a broader remodeling of microbial lipid-catabolic capacity, raising the possibility that higher-order metabolic shifts—rather than transient fluctuations of individual metabolites—may serve as persistent upstream signals in psoriasis pathophysiology [11,12,13].
In parallel, systemic epigenetic alterations in immune cells have been increasingly reported in psoriasis. Epigenome-wide association studies (EWAS) in peripheral blood mononuclear cells (PBMCs) and purified immune subsets have identified disease-associated DNA methylation changes at loci involved in immune identity, signaling, and cellular activation [14,15,16]. Crucially, microbial metabolites such as SCFAs have been reported to act as epigenetic modifiers (e.g., via histone deacetylase [HDAC] inhibition), suggesting a potential mechanistic link between gut metabolic remodeling and systemic immune states[17,18,19]. A key unresolved issue is whether such epigenetic changes represent “priming” mechanisms that predispose immune responses or merely secondary adaptations. Distinguishing between these interpretations requires integrative analyses that relate immune-cell methylomes to upstream microbial functional signals and downstream tissue-level programs.
At the tissue level, psoriatic lesions are characterized by a robust inflammatory-proliferative transcriptional state driven largely by keratinocytes and infiltrating immune cells [20,21]. Antimicrobial peptides (AMPs) and alarmins, including members of the S100 family and β-defensins, are consistently upregulated and contribute to both barrier dysfunction and immune activation [22,23,24,25]. In addition to transcriptional control, post-transcriptional regulation by microRNAs (miRNAs) has emerged as an important layer shaping keratinocyte behavior, immune signaling, and barrier-related processes in psoriasis [26,27]. Nevertheless, how miRNA-mediated regulation aligns with systemic epigenetic signatures and microbial metabolic changes has not been systematically addressed within a unified framework.
Despite substantial progress across individual layers, several gaps remain. Most studies examine the gut microbiome, immune epigenome, or lesional transcriptome in isolation, often using distinct cohorts and platforms, limiting cross-compartment inference. Moreover, microbial metabolic remodeling, immune-cell methylome signatures, and lesional effector programs are rarely evaluated within a coherent analytical framework that prioritizes biological alignment across layers. As a result, it remains unclear whether these features represent independent disease correlates or components of a convergent, system-level psoriasis-associated program.
Here, we present a conceptual “Triple-Hit” multi-omics framework that integrates gut microbial functional profiles, systemic immune-cell DNA methylation signatures, and lesional regulatory and transcriptomic programs using five independent public datasets. By focusing on (i) Putative Gut Trigger (microbial metabolic remodeling), (ii) Putative Systemic Mediator (immune-cell epigenetic priming), and (iii) Downstream Skin Effector (AMP-dominant lesional state), we aim to identify cross-compartment patterns that are consistently associated with psoriasis. This integrative approach provides a structured framework for understanding how microbial, epigenetic, and cutaneous layers functionally align in psoriasis, highlighting systemic metabolic–epigenetic convergence, particularly in lipid- and membrane-proximal programs, as a key feature of disease pathogenesis. Because these datasets originate from independent cohorts, our cross-layer interpretations emphasize convergent associations rather than direct causal inference.
2. Materials and Methods
2.1. Study Design and Multi-Omics Dataset Integration
2.1.1. The “Triple-Hit” Framework Design
To reconstruct the systemic pathology of psoriasis along the gut–blood–skin axis, we designed a conceptual “Triple-Hit” multi-omics framework (Figure 1). This study integrates five independent public datasets spanning three biological compartments to investigate the following hypothesized layers:
- Hit 1 (Putative Gut Trigger): Microbial functional remodeling and metabolic potential.
- Hit 2 (Putative Systemic Mediator): Epigenetic priming in circulating immune cells (PBMCs and CD8+ T cells).
- Hit 3 (Downstream Skin Effector): Post-transcriptional regulation and inflammatory transcriptomic programs in lesional skin.
This design prioritizes cross-layer interpretability, aiming to connect microbial metabolic shifts to systemic epigenetic remodeling and cutaneous inflammation within a unified mechanistic hypothesis, while acknowledging the cohort heterogeneity inherent to public data integration.
2.1.2. Data Acquisition and Cohort Definitions
All datasets were retrieved from the NCBI Gene Expression Omnibus (GEO) or Sequence Read Archive (SRA). The inclusion criteria and group definitions for each layer are summarized in Table 1.
- Gut Microbiome (Metabolic Layer): Shotgun metagenomic sequencing data were obtained from GSE239722 [28]. To capture the baseline functional state without the confounding effects of systemic therapy, we selected samples from untreated psoriasis patients (PsO-UT, n = 8) and healthy controls (HC, n = 8).
- Systemic Epigenome (Epigenetic Layer): To profile systemic epigenetic alterations, we utilized two independent DNA methylation datasets generated on the Illumina Infinium MethylationEPIC BeadChip (850K) platform. For the aggregate immune state, we compared peripheral blood mononuclear cells (PBMCs) from psoriasis vulgaris patients (PsO-PB, n = 20) with healthy controls (HC, n = 19; GSE200376), while cell-type-specific epigenetic priming was investigated using purified CD8+ T cells from psoriasis patients (PsO-CD8, n = 10) and healthy controls (HC, n = 9; GSE184500) [29,30].
- Skin Transcriptome and Regulome (Effector Layer): To construct the regulatory bridge in psoriatic lesions, we integrated lesional miRNA profiles (GSE220586; PsO-L n = 4 vs HC n = 4) with lesional transcriptomic data (GSE186063; PsO-L n = 13). For the transcriptomic control group, we utilized healthy-appearing skin from patients with ankylosing spondylitis (AS-HC, n = 12), which serves as a robust non-lesional baseline to isolate the psoriasis-specific inflammatory program [31,32].
2.2. Gut Microbiome Shotgun Metagenomic Analysis (GSE239722)
2.2.1. Metagenomic Data Processing and Functional Profiling
Shotgun metagenomic sequencing data were obtained from the publicly available dataset GSE239722, comprising 16 samples: healthy controls (HC, n = 8) and patients with untreated psoriasis (PsO-UT, n = 8). The original study generated paired-end shotgun metagenomic reads using the Illumina NovaSeq 6000 platform. In the present analysis, we used the author-provided processed functional abundance profiles. Briefly, as reported by the data generators, reads were assembled into contigs using MEGAHIT, genes were predicted with MetaGeneMark, and a non-redundant gene catalog was constructed using MMseqs2 (95% sequence identity, 90% overlap) [33,34,35]. Functional annotation was performed against the KEGG database (E-value < 1 × 10⁻⁵), and gene-level abundances were aggregated to KEGG Pathway Level 3 and normalized to relative abundance [36]:
- Assembly & Prediction: Reads were assembled into contigs using MEGAHIT and genes were predicted using MetaGeneMark.
- Gene Catalog Construction: A non-redundant gene catalog was constructed using MMseqs2 (95% identity, 90% overlap).
- Functional Annotation: Gene sequences were annotated against the KEGG database (E-value < 1e-5) to generate functional profiles.
- Normalization: The resulting gene abundance profiles were aggregated to KEGG Pathway Level 3 and normalized to relative abundance (proportions summing to 1 per sample) to correct for sequencing depth differences.
2.2.2. Statistical Analysis of Functional Remodeling
To characterize the gut functional landscape in psoriasis, we compared the relative abundance of metabolic pathways between groups using the Wilcoxon rank-sum test (Mann-Whitney U test), a non-parametric method suitable for the sample size (n = 8 per group). P-values were adjusted for multiple comparison using the Benjamini-Hochberg (FDR) procedure. We specifically interrogated pathways linked to the “Gut-Skin Axis,” focusing on Short-Chain Fatty Acid (SCFA) metabolism (e.g., Butanoate metabolism, Propanoate metabolism) and Lipid degradation pathways.
2.2.3. Lipid Degradation Functional Score
To quantify the aggregate reduction in the gut’s lipid catabolic potential—the proposed “Trigger” in our Triple-Hit model—we developed a composite “Lipid Degradation Functional Score.” This score integrates three representative lipid-catabolic pathways: Fatty acid degradation (ko00071), Glycerolipid metabolism (ko00561), and Glycerophospholipid metabolism (ko00564). To ensure that pathways with varying baseline abundances contributed equally to the composite signature, we applied z-score standardization. The score for each sample is defined as the sum of the z-scores of the constituent pathways:
Where is the relative abundance of pathway in sample , and and are the mean and standard deviation of pathway across the entire cohort. Group differences in this composite score were evaluated using the Wilcoxon rank-sum test.
2.3. PBMC DNA Methylation Analysis (GSE200376)
2.3.1. Data Processing and Quality Control
Publicly available DNA methylation profiles of peripheral blood mononuclear cells (PBMCs) were obtained from GSE200376 generated using the Illumina Infinium MethylationEPIC BeadChip. Raw intensity data (IDAT) were processed using the minfi package [37]. We applied Noob (Normal-exponential-out-of-band) normalization for background correction and dye-bias adjustment, which is superior for detecting small effect sizes in heterogeneous tissues [38]. Probes were filtered based on the following criteria:
- Detection P-value > 0.01 in any sample.
- Cross-reactive probes and probes overlapping known SNPs.
- Probes located on sex chromosomes (X, Y), to exclude sex-specific bias.
2.3.2. Identification of Systemic Epigenetic Alterations
To capture the systemic epigenetic landscape reflecting the “Triple-Hit” myeloid bias, we adopted a holistic analysis strategy:
- Cell Type Composition: Unlike tissue-specific analyses, we did not regress out cell type proportions. This decision was made to ensure that the epigenetic signature captures the aggregate systemic immune state, including the disease-associated shifts in circulating immune composition (e.g., monocytes and other myeloid populations) which is a hallmark of the “Trigger-Mediator” axis.
- Differentially Methylated Regions (DMRs): We utilized DMRcate with a Gaussian kernel smoothing (bandwidth lambda = 1000 bp, scaling factor C = 2) [39]. Significant DMRs were identified using an FDR < 0.05 threshold.
- Differentially Methylated Positions (DMPs): Single-CpG differences were assessed using limma on M-values [40]. To isolate the disease-specific effect from demographic confounders, Sex and Age were included as covariates in the linear model design matrix ( ~ Group + Sex + Age).
2.3.3. Functional Enrichment with Bias Correction
Over-Representation Analysis (ORA) was performed to interpret the biological meaning of the widespread DMR landscape. To prevent statistical bias arising from the array’s heavy coverage of promoter regions, we utilized a custom background universe restricted to promoter-associated genes (TSS1500, TSS200, 5′UTR, and 1st Exon) rather than the whole genome. This rigorous approach confirmed that the enrichment of “Membrane-Proximal Signaling” and “Adhesion/Cytoskeleton” pathways represents a bona fide biological signal.
2.4. CD8+ T Cell DNA Methylation Analysis (GSE184500)
2.4.1. Data Processing and Quality Control
Genome-wide DNA methylation profiling of purified CD8+ T cells was performed using the Illumina Infinium MethylationEPIC BeadChip (850K). Raw intensity data (IDAT) were processed using the minfi package in R. To correct for dye bias and background fluorescence, we applied Noob (Normal-exponential-out-of-band) normalization. Beta values () were utilized for biological visualization and effect size estimation (), while M-values were used for statistical testing. Quality control was strictly enforced: probes with a detection P-value > 0.01 in any sample were excluded. Additionally, probes located on sex chromosomes or overlapping known SNP (dbSNP) were removed to prevent technical artifacts.
2.4.2. Identification of Differentially Methylated Regions (DMRs)
To capture spatially coordinated epigenetic remodeling (“Epigenetic Priming”), we identified Differentially Methylated Regions (DMRs) using the DMRcate package. A Gaussian kernel smoothing was applied with a bandwidth (lambda) of 1000 bp and a scaling factor (C) of 2. Significant DMRs were defined based on a false discovery rate (FDR) of the Stouffer-transformed P-values (HMFDR).
- Discovery Set: For functional enrichment and “Triple-Hit” system-level analysis, we applied a relaxed discovery threshold of FDR < 0.10 and a mean methylation difference |Δβ| ≥ 0.02.
- Visualization: For target loci visualization (Figure 4g-j), we calculated the region-median β value, representing the central methylation tendency of CpGs within each identified DMR.
2.4.3. Functional Enrichment Analysis (ORA)
To interpret the biological relevance of the relaxed DMR signature, Over-Representation Analysis (ORA) was performed using the clusterProfiler package [41]. DMR-associated genes were mapped to GO Biological Processes, KEGG, and Reactome pathways. Crucially, to account for the platform’s bias toward promoter regions, we used a custom background universe restricted to promoter-associated genes (TSS1500, TSS200, 5′UTR, and 1st Exon) rather than the whole genome. This ensured that the identified lipid and immune-trafficking pathways (e.g., Glycosphingolipid biosynthesis) represented true biological enrichment rather than array design artifacts.
2.5. Skin miRNA Expression Analysis (GSE220586)
2.5.1. Data Preprocessing and Quality Control
Normalized miRNA expression profiles were obtained from GSE220586 (GPL17107; miRCURY LNA microRNA Array, 7th Gen, Exiqon/QIAGEN). To ensure robust downstream analysis, we applied stringent quality control criteria using a custom R pipeline. Features with non-finite values were converted to NA, and miRNAs were retained only if valid measurements were present in at least 6 of 8 samples (75% detection rate). Remaining missing values were imputed using row-wise median imputation to prevent artificial variance inflation. Low-variance features were removed prior to Principal Component Analysis (PCA) to ensure numerical stability.
2.5.2. Differential miRNA Expression Analysis
Differential expression between psoriatic lesional skin (PsO-L) and healthy controls (HC) was assessed using the limma package. A no-intercept design matrix was constructed, and contrasts were defined as (PsO-L – HC). We applied empirical Bayes moderation (eBayes) and adjusted P-values using the Benjamini-Hochberg (BH) procedure. Significant differentially expressed miRNAs (DEMs) were defined based on an adjusted P-value (FDR)
0.05. However, to ensure that the downstream regulatory bridge focused only on biologically potent drivers, we utilized a subset of these DEMs satisfying an additional effect size threshold of
for visualization and network construction.
2.5.3. Multi-Tiered miRNA Target Prediction and Evidence Scoring
To construct a high-confidence regulatory network relevant to lipid and AMP pathology, we implemented a multi-tiered evidence scoring system integrating predictions from multiMiR (querying TargetScan, DIANA, miRTarBase, TarBase) and a local implementation of miRDB v6.0. Identified miRNA-target interactions were categorized into evidence tiers [42,43,44,45,46,47]:
- Level 2 (High Confidence): Experimentally validated interactions (miRTarBase/TarBase) OR supported by ≥2 prediction databases.
- Level 1 (Moderate Confidence): Supported by multiple prediction databases but lacking experimental validation.
- Level 0 (Low Confidence): Single-database support (excluded from final analysis). Only interactions classified as Level 2 or higher were retained for the regulatory bridge analysis.
2.5.4. Directionality-constrained “Triple-Hit” Bridge Construction
We constructed a miRNA-mRNA regulatory bridge by integrating the high-confidence miRNA targets with the matched transcriptomic dataset (GSE186063, processed as described in Section 4.6).
- ID Mapping: Ensembl IDs from the mRNA dataset were mapped to HGNC symbols using org.Hs.eg.db.
- Directionality Constraint: We retained only pairs adhering to canonical repression logic: Upregulated miRNA (PsO-L) targeting downregulated mRNA, and downregulated miRNA (PsO-L) targeting upregulated mRNA.
- Pathological Module Filtering: The constrained pairs were mapped to predefined “Triple-Hit” effector modules: AMP Core (Literature/DEG-driven), Barrier-Lipid Core and Keratinocyte Differentiation. This filtering strategy prioritized mechanistically interpretable links over global correlation, specifically highlighting the epigenetic control of lipid metabolism and antimicrobial defense.
2.6. Skin Transcriptome Analysis (GSE186063)
2.6.1. Dataset and Preprocessing
Bulk RNA-sequencing data of human skin were obtained from the publicly available dataset GSE186063. Transcriptomic profiles of lesional psoriasis skin (PsO-L) were compared with those of healthy skin controls (AS-HC). Expression data were processed and analyzed using R (v4.5.1). For downstream analyses, gene-level expression values were normalized using the trimmed mean of M-values (TMM) method and transformed to log2 counts-per-million (logCPM) [48]. Sample annotations were used to define experimental groups, and only samples corresponding to AS-HC and PsO-L were retained for Figure 6 analyses. Gene identifiers were harmonized to Ensembl gene IDs, and gene symbols were mapped using standard human gene annotation resources from Bioconductor to enable downstream pathway, transcription factor, and cell-type analyses [49].
2.6.2. Differential Expression Analysis and Visualization
Differential expression analysis between PsO-L and AS-HC was performed using linear modeling implemented in the limma package. Empirical Bayes moderation was applied to stabilize variance estimates across genes. Differentially expressed genes (DEGs) were identified based on log2 fold-change and moderated statistics, with p values adjusted for multiple testing using the Benjamini–Hochberg false discovery rate (FDR) procedure. DEG results were visualized using volcano plots (log2 fold-change versus −log10 adjusted p value), and expression patterns of selected DEGs were displayed as heatmaps, with expression values standardized by row-wise z-score for visualization[40,50].
2.6.3. Hallmark Gene Set Enrichment Analysis and Axis-Level Aggregation
To characterize pathway-level transcriptional remodeling in psoriatic lesions, Gene Set Enrichment Analysis (GSEA) was performed using a pre-ranked approach. Genes were ranked according to log2 fold-change values derived from the limma analysis, preserving both effect size and directionality[51]. Enrichment analysis was conducted against the MSigDB Hallmark gene set collection. Enrichment results were summarized using normalized enrichment scores (NES), and statistical significance was evaluated using the FDR-adjusted p value (p.adjust, hereafter referred to as padj)[52,53].
For higher-level interpretation, Hallmark gene sets were further grouped into predefined biological axes—lipid metabolism, insulin/metabolic signaling, and inflammation—based on functional annotation rules. For each axis, NES values were summarized at the axis level, and axis-level significance was assessed by the median padj of the constituent Hallmark gene sets.
2.6.4. Transcription Factor Activity Inference
Upstream regulatory activity was inferred by estimating transcription factor (TF) activities from gene expression data using the decoupleR framework in conjunction with curated human regulons from the DoRothEA database[54]. Regulons with high to intermediate confidence levels were used. TF activity scores were computed using a weighted mean method with permutation-based estimation. Differential TF activity between PsO-L and AS-HC was assessed using linear modeling, and results were summarized with effect sizes and FDR-adjusted p values for visualization[55].
2.6.5. Immune and Stromal Cell Score Estimation (MCP-Counter)
To estimate the relative enrichment of immune and stromal cell populations within the skin transcriptome, cell-type scores were computed using MCP-counter based on gene expression values mapped to human gene symbols. MCP-counter scores were calculated for each sample and summarized by cell type[56]. Statistical differences in cell-type scores between PsO-L and AS-HC were assessed using the Wilcoxon rank-sum test for each cell type, with p values adjusted for multiple testing using the Benjamini–Hochberg FDR method. Cell-type enrichment patterns were visualized using group comparison boxplots.
2.7. Statistical Analysis and Visualization
All statistical analyses were conducted in R [57]. Unless otherwise stated, statistical tests were two-sided, and p values were adjusted for multiple comparisons using the Benjamini–Hochberg procedure. Data visualization was performed using ggplot2 and ComplexHeatmap, with consistent formatting, font sizes, and a fixed group order applied across all figures [58,59].
3. Results
3.1. Triple-Hit Study Design and Dataset Overview for Psoriasis
To organize multi-compartment evidence along the gut–blood–skin axis, we constructed a Triple-Hit multi-omics framework that integrates microbial functional profiles (Hit 1), immune-cell DNA methylome signatures (Hit 2), and lesional regulatory/transcriptomic effector programs (Hit 3) using five independent public datasets (Figure 1; Table 1). This design prioritizes cross-layer interpretability by aligning each omics layer with a biologically coherent role within a shared conceptual axis (microbial metabolic remodeling → systemic immune-cell epigenetic remodeling → AMP-dominant lesional skin programs), while avoiding causal assumptions and acknowledging cohort and platform heterogeneity inherent to public-data integration.
As summarized in Table 1, Hit 1 leveraged a gut shotgun metagenomic cohort (GSE239722) comparing healthy controls (HC; n = 8) and untreated psoriasis samples (PsO-UT; n = 8) to quantify community-level functional potential and derive lipid- and SCFA-related functional signatures. Hit 2 comprised EPIC 850K DNA methylation data from PBMCs (GSE200376; HC n = 19 vs PsO-PB n = 20) and purified CD8+ T cells (GSE184500; HC n = 9 vs PsO-CD8 n = 10), enabling region-based DMR analyses and pathway-level interpretation of immune-cell methylome remodeling. Hit 3 integrated lesional miRNA profiles (GSE220586; HC n = 4 vs PsO-L n = 4) with lesional bulk transcriptomics (GSE186063; AS-HC n = 12 vs PsO-L n = 13) to connect post-transcriptional regulation with an AMP-dominant inflammatory–proliferative lesional program and associated immune/stromal signature shifts. Notably, regarding the skin transcriptomic cohort (GSE186063), healthy-appearing skin from ankylosing spondylitis patients (AS-HC) was utilized as the available non-lesional baseline, and all downstream analyses were rigorously interpreted as within-dataset contrasts.
Together, the framework and datasets summarized in Figure 1 and Table 1 provide the structural basis for the Results sections that follow: gut microbial functional remodeling (Section 3.2), systemic PBMC methylome remodeling (Section 3.3), CD8+ T-cell methylome signatures (Section 3.4), lesional miRNA reprogramming and directionality-constrained miRNA–mRNA integration (Section 3.5), and lesional transcriptomic pathway/regulatory remodeling (Section 3.6).
3.2. Gut Microbial Functional Remodeling in Psoriasis Reveals Reduced Lipid Catabolic Potential with Selective SCFA-Pathway Shifts
To characterize functional alterations in the gut microbiome in psoriasis, we compared KEGG pathway level 3 functional profiles derived from shotgun metagenomic relative abundance between healthy controls (HC) and psoriasis (PsO-UT). Crucially, in this context, the inferred functional profile reflects the community-level functional potential (i.e., the relative representation of pathways within the microbial community), rather than direct measurement of metabolite concentrations.
Across lipid-associated functions, the dot-plot summary indicated that PsO-UT was characterized by a downward shift in fatty acid degradation and additional lipid metabolic pathways (Figure 2a). In contrast, sphingolipid metabolism showed an upward shift, suggesting a remodeling of gut microbial lipid-related functional capacity in psoriasis, with reduced lipid catabolic potential accompanied by selective enrichment of specific lipid-associated processes.
SCFA-associated metabolic pathways displayed a heterogeneous pattern (Figure 2b). Pathways directly linked to SCFA metabolism—most notably propanoate metabolism and butanoate metabolism—trended downward in PsO-UT. Meanwhile, pathways representing upstream carbohydrate utilization and central metabolism, including glycolysis/gluconeogenesis, pyruvate metabolism, and starch and sucrose metabolism, were relatively enriched. Together, these results are consistent with a functional reconfiguration in which upstream energy-harvesting/central carbon metabolism exhibits an upward shift while terminal SCFA-associated metabolic pathways show weaker or opposite directionality in psoriasis.
To validate key signals from the summary plots at the individual pathway and composite-signature level, we examined representative readouts using box plots. Fatty acid degradation exhibited a significant reduction in PsO-UT compared with HC (Wilcoxon p = 0.0181; Figure 2c), supporting a consistent decrease in gut microbial lipid catabolic potential in psoriasis. Extending this observation beyond a single pathway, we computed a lipid degradation functional score per sample as the sum of z-scores for three representative KEGG L3 lipid pathways (ko00071: fatty acid degradation; ko00561: glycerolipid metabolism; ko00564: glycerophospholipid metabolism). This composite lipid score was markedly lower in PsO-UT than in HC (Wilcoxon p = 0.00538; Figure 2d), indicating a coordinated depletion of lipid degradation–related functional capacity at the community level.
Overall, Figure 2 supports a psoriasis-associated gut functional signature characterized by impaired lipid catabolic potential alongside heterogeneous shifts across SCFA-related pathways, providing a mechanistic anchor (Putative Trigger) for downstream integration with systemic and cutaneous multi-omics layers within the gut–skin axis framework.
3.3. Systemic PBMC DNA Methylation Remodeling in Psoriasis (GSE200376) Highlights Widespread DMRs and Immune-State-Linked Epigenetic Priming
We next profiled systemic epigenetic alterations in peripheral blood mononuclear cells (PBMCs) using EPIC 850K DNA methylation data (GSE200376; HC, n = 19; PsO-PB, n = 20). Unsupervised PCA based on highly variable CpG sites revealed a modest but discernible separation between PsO-PB and healthy controls, consistent with broad yet heterogeneous methylome remodeling rather than a single dominant axis of variation (PC1 = 4.7% and PC2 = 2.5% explained variance; Figure 3a).
Region-based analysis identified a large burden of differentially methylated regions (DMRs) distributed across the genome. The cumulative Manhattan-like landscape demonstrated that significant DMRs were detected across essentially all chromosomes, with numerous regions exceeding the predefined false discovery rate threshold (FDR < 0.05), indicating system-wide rather than locus-restricted methylation perturbations (Figure 3b). Notably, DMR directionality was skewed toward increased methylation in psoriasis PBMCs: 26,572 DMRs (58.5%) showed increased methylation, whereas 18,824 (41.5%) showed decreased methylation (total 45,396 DMRs; Figure 3c). Although the directionality differed, the effect sizes were comparably modest in magnitude, with median Δβ of −0.0172 (IQR −0.0301 to −0.0100) for decreased-methylation DMRs and +0.0174 (IQR +0.0116 to +0.0246) for increased-methylation DMRs (Figure 3d). This pattern suggests a coordinated accumulation of small but consistent regional shifts affecting a large fraction of the methylome.
To determine whether top DMRs capture a reproducible group-level signature, we summarized each DMR by the per-sample median β value across CpGs in the region and visualized the top-ranked DMR set. The heatmap of top DMRs revealed clear clustering of samples by disease status (Figure 3e), supporting the presence of a robust systemic epigenetic signature in psoriasis PBMCs despite the modest overall separation observed in PCA. Several top DMRs were annotated to immune-state and signaling-related genes, including BCL11B and multiple loci linked to cellular signaling/structure (e.g., TRIOBP, and GRB7), as well as developmental regulators (HOXA10, HOXB2), collectively consistent with an altered immune-cell state and/or PBMC composition shift in psoriasis.
Representative DMRs further showed consistent β-median shifts between groups at the individual-region level (Figure 3f–i), recapitulating the bidirectional nature of methylation remodeling observed in the global summaries. Specifically, DMRs annotated to ATP6V0E2 (chr7:149,568,778–149,571,146; Wilcoxon p = 1.2×10^−7) and BAALC (chr8:104,151,814–104,154,894; Wilcoxon p = 4.4×10^−7) exhibited lower region-level median β values in PsO-PB relative to HC, consistent with regional hypomethylation in psoriasis PBMCs. In contrast, DMRs mapped to ABI3 (chr17:47,286,445–47,289,036; Wilcoxon p = 2.1×10^−6) and PRF1 (chr10:72,357,735–72,360,448; Wilcoxon p = 8.8×10^−7) showed higher median β values in PsO-PB, exemplifying region-level hypermethylation at immune-relevant loci. Together, these locus-level examples illustrate that psoriasis PBMC remodeling is not confined to a single direction of change, but instead comprises coordinated, regionally structured shifts spanning both hypo- and hypermethylated programs.
At the single-CpG level (DMP analysis), the volcano plot highlighted CpG sites jointly exhibiting large effect sizes and strong multiple-testing–adjusted significance (Figure 3j). Labeled hits included CpGs annotated to immune lineage/effector modules (BCL11B, KIR3DL2, and CD226), an epigenetic regulator (DNMT3A), and metabolic or membrane-associated signaling genes (DGKQ, GALM, SLC15A4, PLOD1, and PLXND1), suggesting that systemic psoriasis may involve coordinated perturbations spanning immune-state regulation, epigenetic machinery, and membrane-proximal signaling axes.
To contextualize the DMR signal at the pathway level, we performed KEGG pathway over-representation analysis (ORA; hsa pathways) on DMR-annotated genes. Enriched terms prominently included adhesion and cytoskeletal remodeling programs (e.g., IgSF CAM signaling, integrin signaling, focal adhesion) together with membrane-associated signal transduction pathways (e.g., MAPK signaling, calcium signaling, Rap1 signaling, phospholipase D signaling) (Figure 3k). Collectively, these results support a model in which psoriasis is associated with widespread PBMC epigenome remodeling characterized by a predominance of hypermethylated regions, accompanied by a reproducible top-DMR signature and prominent CpG-level alterations mapping to immune identity and membrane-proximal signaling programs consistent with systemic immune-state–linked epigenetic priming.
3.4. Directional DNA Methylation Remodeling of Circulating CD8+ T Cells in Psoriasis Reveals a Hypomethylation-Biased Regional Profile Enriched for Lipid- and Membrane-Associated Pathways (GSE184500)
To assess whether circulating effector T cells exhibit disease-associated epigenetic remodeling in psoriasis, we analyzed genome-wide DNA methylation profiles of purified CD8+ T cells generated using the Illumina MethylationEPIC array (GSE184500), comparing healthy controls (HC, n = 9) and psoriasis patients before treatment (PsO-CD8, n = 10). Unsupervised principal component analysis (PCA) based on highly variable CpG sites showed a modest but discernible separation between PsO-CD8 and HC, indicating a global shift in the CD8+ T-cell methylation landscape associated with psoriasis (Figure 4a).
We next performed region-based analysis using DMRcate to identify coordinated methylation changes across adjacent CpG sites. Differentially methylated regions (DMRs) were distributed across multiple chromosomes rather than confined to a limited number of loci, consistent with widespread but regionally structured epigenetic remodeling (Figure 4b). In total, 175 DMRs were detected using the criteria applied in this figure. Notably, these regions exhibited a pronounced directional bias: 123 DMRs (70.3%) showed decreased methylation in PsO-CD8 relative to HC, whereas 52 DMRs (29.7%) showed increased methylation (Figure 4c). Examination of effect-size distributions further demonstrated that hypomethylated and hypermethylated DMRs occupied distinct Δβ ranges, with region-median Δβ values centered at −0.0185 (IQR −0.0313 to −0.0105) for decreased DMRs and 0.0133 (IQR 0.0056 to 0.0229) for increased DMRs (Figure 4d). Together, these results indicate a hypomethylation-biased pattern within the set of regions undergoing differential methylation in circulating CD8+ T cells in psoriasis.
A heatmap of top-ranked DMRs based on region-median β values further illustrated coherent group-level methylation patterns when samples were ordered HC → PsO-CD8 (Figure 4e). Although effect sizes at individual regions were modest, the consistency of directional changes across multiple loci supports the presence of structured epigenetic remodeling rather than stochastic variation.
To explore the functional themes represented by DMR-associated genes, we conducted KEGG pathway over-representation analysis using a relaxed DMR discovery set, as specified for this figure. The top-ranked pathways included modules related to membrane organization and signaling, such as ECM–receptor interaction and PI3K–Akt signaling, alongside lipid- and glyco-conjugate–related processes including glycerolipid metabolism and glycosphingolipid biosynthesis (Figure 4f). While these enrichments did not uniformly reach stringent significance thresholds, their convergence on lipid-associated and membrane-proximal pathways suggests that regional DNA methylation changes in circulating CD8+ T cells preferentially affect programs relevant to cellular structure, signaling, and metabolic adaptation.
To provide locus-level context, we visualized region-median methylation patterns for four representative DMRs selected for biological interpretability: PITPNC1, CSNK1G1, CXCL12, and PIAS1 (Figure 4g–j). These loci span functions related to lipid-associated signaling and trafficking (PITPNC1), kinase-mediated regulatory pathways (CSNK1G1), immune cell migration (CXCL12), and SUMOylation-linked control of inflammatory signaling (PIAS1). Boxplots illustrate the distribution of region-median β values across groups, with individual sample values overlaid. While group-wise differences at single loci were variable—consistent with modest effect sizes and limited sample numbers—each region was identified as a DMR by region-based analysis, supporting their inclusion as illustrative examples of the broader epigenetic remodeling observed.
Collectively, these results demonstrate that circulating CD8+ T cells in psoriasis exhibit a directionally biased pattern of regional DNA methylation changes, characterized by a predominance of hypomethylated DMRs and enrichment of lipid- and membrane-associated functional themes. Rather than indicating direct transcriptional activation at specific loci, this pattern is consistent with an epigenetically “primed” cellular state, potentially increasing the responsiveness of CD8+ T cells to downstream metabolic and inflammatory cues relevant to skin homing and effector function.
3.5. Lesional miRNA Remodeling in Psoriasis and Directionality-Constrained miRNA–mRNA Bridging Aligns with AMP Activation and Barrier–Lipid/Keratinocyte Differentiation Modules (GSE220586)
To characterize post-transcriptional regulatory remodeling in psoriatic lesions, we analyzed lesional miRNA expression profiles from GSE220586 (PsO-L, n = 4; HC, n = 4). Unsupervised clustering of the top differentially expressed miRNAs revealed clear separation between PsO-L and HC, indicating that a compact miRNA signature captures a coherent lesional regulatory state (Figure 5a). Differential expression analysis identified 168 significant miRNAs (FDR < 0.05; 86 upregulated and 82 downregulated in PsO-L vs HC), and the volcano summary highlighted multiple high-effect signals across both directions (Figure 5b). The volcano plot displays −log10(P value), while significance was defined using FDR (Benjamini–Hochberg) < 0.05.
To translate miRNA changes into mechanistically interpretable downstream consequences, we integrated lesional miRNA signals with lesional skin mRNA changes using a directionality-constrained miRNA–mRNA bridging strategy, retaining only pairs showing inverse directionality (miRNA↑/mRNA↓ or miRNA↓/mRNA↑), consistent with canonical miRNA-mediated repression (Figure 5c). This constraint reduces ambiguity inherent to target prediction by prioritizing interactions that are internally consistent within the paired miRNA and mRNA datasets.
The resulting constrained bridge network connected prioritized miRNAs to targets spanning biologically coherent modules that represent hallmark features of psoriatic lesions (Figure 5c). In particular, retained targets mapped to (i) an AMP literature core, (ii) a barrier–lipid core, and (iii) a keratinocyte differentiation module, with additional links to auxiliary lipid metabolism (Figure 5d). The alluvial summary further visualized how the retained miRNA–mRNA edges converge on these modules and align with the observed direction of target mRNA dysregulation in PsO-L (Figure 5d). Collectively, these analyses support that lesional miRNA reprogramming forms a directionally coherent regulatory layer that is closely aligned with cutaneous AMP activation and barrier–lipid/keratinocyte differentiation remodeling in psoriasis.
3.6. Lesional Skin Transcriptomics in Psoriasis Reveals an Inflammatory-Proliferative State with Coordinated TF Activity Shifts and Immune-Cell Signature Remodeling
To characterize psoriasis-associated transcriptional programs in skin, we compared bulk RNA-seq profiles of psoriatic lesional skin (PsO-L) against healthy-appearing non-lesional skin used as the within-dataset baseline (AS-HC). Differential expression analysis revealed a strong disease signature dominated by keratinocyte activation/barrier remodeling and inflammation-related genes, with prominent upregulation of canonical psoriatic markers including DEFB4A, S100A7/A8/A9, and IL36G (Figure 6a). A heatmap of the top differentially expressed genes demonstrated clear separation of PsO-L from AS-HC, indicating a coherent lesion-specific expression program (Figure 6b).
At the pathway level, Hallmark gene set enrichment analysis showed robust enrichment of inflammatory and immune signaling in PsO-L, alongside proliferative cell-cycle programs (Figure 6c). Enriched signatures included high-NES pathways such as TNF/NF-κB–linked inflammation, IL6–JAK–STAT signaling, complement and Interferon-associated responses, and cell-cycle regulators (e.g., E2F TARGETS, G2M CHECKPOINT), consistent with an activated inflammatory–hyperproliferative lesional phenotype. In contrast, gene sets reflecting epithelial differentiation/homeostatic features and selected metabolic programs, such as FATTY ACID METABOLISM, trended toward AS-HC enrichment (negative NES). To facilitate an interpretable summary, we aggregated Hallmark enrichments into three keyword-defined conceptual axes based on keyword matching of Hallmark gene set name: Inflammation (IL-17, TNF, Interferon, NF-kB, inflamm), Lipid metabolism (lipid, fatty, sphingo, cholesterol), and Insulin/Metabolic signaling (insulin, PI3K, AKT, mTOR, Glycolysis). This axis-level aggregation indicated a relative downshift of lipid-metabolism–related Hallmark programs in PsO-L accompanied by concurrent increases in inflammation- and insulin/metabolic signaling–related programs (Figure 6d), supporting coordinated inflammatory–metabolic reprogramming within lesional skin.
We next inferred upstream regulatory activity using DoRothEA regulons and decoupleR. TF activity analysis identified a set of transcriptional regulators with increased inferred activity in PsO-L, driven by top-ranked factors such as E2F2, STAT4/2, and RELA (NF-κB subunit), whereas a subset of TFs, including LHX2 and SOX10, displayed decreased inferred activity (Figure 6e). Finally, immune/stromal signature deconvolution using MCP-counter revealed distinct alterations in cellular composition between PsO-L and AS-HC (Figure 6f). Specifically, we observed significant enrichment of key effector cells involved in psoriasis pathogenesis, including neutrophils (FDR = 0.008), CD8 T cells (FDR = 0.015), and overall T cell populations (FDR = 0.044). The monocytic lineage (FDR = 0.029), associated with inflammatory responses, was also significantly upregulated. In contrast, B lineage scores were significantly reduced in PsO-L compared to AS-HC (FDR = 0.015). Collectively, these results position lesional psoriasis skin as an inflammatory–proliferative state with coordinated TF-level control and an accompanying shift in keyword-defined metabolic axes, providing transcriptomic support for downstream multi-omics integration.
4. Discussion
In this study, we applied an integrative multi-omics framework to dissect the systemic and tissue-specific molecular alterations underlying psoriasis, focusing on the coordinated interplay between gut microbial functional remodeling, immune-cell epigenetic reprogramming, and lesional skin transcriptional activation. By analyzing independent public datasets spanning gut metagenomics, DNA methylation in circulating and cell-sorted immune populations, and skin transcriptomics, we provide convergent evidence that psoriasis is characterized not by isolated molecular perturbations, but by a convergent remodeling axis that links microbial metabolic capacity, immune-cell epigenetic priming, and an AMP-dominant cutaneous inflammatory program.
A central finding of this work is the observation that psoriasis-associated gut dysbiosis is accompanied by a selective reduction in the relative abundance of microbial lipid-catabolic and SCFA-associated metabolic pathways, rather than a uniform loss of metabolic capacity. Functional profiling of shotgun metagenomic data revealed consistent downward shifts in pathways related to fatty acid degradation and short-chain fatty acid metabolism—including butanoate and propanoate metabolism—alongside compensatory enrichment of alternative lipid-associated processes such as sphingolipid metabolism. These results are consistent with previous reports of reduced fecal SCFA levels in psoriasis [8,60] but specifically highlight that the disturbance is imprinted at the level of microbial functional potential, suggesting an ecological shift in metabolic capacity rather than simply reflecting transient metabolite depletion. Importantly, this functional imbalance is compatible with an upstream context that could plausibly contribute to host immune regulation through well-established SCFA-mediated epigenetic and immunomodulatory mechanisms [11,61,62].
At the systemic immune level, our methylome analyses of PBMCs and purified CD8+ T cells revealed widespread DNA methylation remodeling in psoriasis, characterized by distributed differentially methylated regions (DMRs) across the genome. The identification of coherent DMR landscapes, rather than isolated differentially methylated positions, underscores that psoriasis is associated with coordinated epigenetic reprogramming of immune cells [14,15,16,63]. Functional enrichment of DMR-associated genes highlighted pathways involved in immune activation, signal transduction, and membrane-proximal regulatory processes. Notably, the epigenetic remodeling of lipid-associated signaling loci in CD8+ T cells (e.g., PITPNC1) conceptually resonates with the observed loss of gut microbial lipid-catabolic capacity, supporting the plausibility of a systemic metabolic–epigenetic axis in which pathway-level themes co-occur across compartments.
The CD8+ T cell–specific methylation analysis further strengthens this interpretation. Despite the limited sample size inherent to cell-sorted methylome datasets, the detection of structured DMR landscapes and functionally coherent pathway enrichment indicates that cytotoxic T cells in psoriasis undergo targeted epigenetic reprogramming. These changes may contribute to altered effector differentiation, cytotoxic potential, and tissue residency, all of which are critical features of psoriatic inflammation [64,65]. The use of a relaxed DMR discovery threshold for pathway-level over-representation analysis allowed recovery of biologically meaningful signals while maintaining transparency regarding statistical stringency, a balance that is increasingly recognized as necessary for functional interpretation of epigenomic data in modestly sized cohorts.
At the tissue level, lesional skin transcriptome analysis revealed a pronounced AMP-dominant inflammatory program, accompanied by activation of canonical immune and stress-response pathways [66,67]. Crucially, our integration of lesional miRNA profiles (GSE220586) provides a mechanistically interpretable layer to this transcriptional dysregulation. The identified directionality-constrained miRNA–mRNA bridge suggests that the downregulation of key regulatory miRNAs is consistent with reduced post-transcriptional restraint on inflammatory targets, effectively reinforcing the AMP-dominant state [26,68]. By integrating these post-transcriptional findings with upstream immune methylation and gut functional alterations, our data suggest that the lesional transcriptome reflects not only local cytokine-driven inflammation but also the downstream manifestation of systemic immune priming. In this context, the skin emerges as an effector organ responding to a “primed” immune landscape rather than the sole origin of disease activity [1,2].
Importantly, immune-cell infiltration analysis using MCP-counter provided orthogonal support for this model. The increased abundance scores of cytotoxic lymphocytes, myeloid lineages, and other immune populations in psoriatic lesions align with the observed transcriptomic activation and reinforce the biological relevance of the inferred immune signatures [20]. While MCP-counter does not quantify absolute cell numbers, its marker-based abundance estimates offer a robust means of contextualizing bulk RNA-seq data and linking transcriptional patterns to changes in cellular composition.
Taken together, these findings support a model in which psoriasis arises from the convergence of three interrelated hits: (i) Putative Trigger: Gut microbial functional remodeling characterized by reduced genomic potential for lipid catabolism and SCFA metabolism, (ii) Putative Mediator: Systemic immune-cell epigenetic priming involving coordinated DNA methylation changes linked to lipid/membrane signaling, and (iii) Downstream Effector: Amplification of an AMP-driven inflammatory program in the skin, stabilized by disrupted miRNA-mediated post-transcriptional control. This “triple-hit” framework provides a conceptual scaffold and mechanistic hypothesis bridging microbial ecology, immune regulation, and tissue pathology, offering a systems-level perspective that complements and extends existing cytokine-centric models of psoriasis [21,69].
Several limitations should be acknowledged. All analyses were conducted using independent publicly available datasets, precluding direct experimental validation or longitudinal assessment within the same individuals. Additionally, inferred microbial functions and immune-cell abundance scores represent indirect estimates rather than direct measurements. Nevertheless, the consistency of signals across independent cohorts, omics layers, and analytical approaches strengthens the robustness of our conclusions.
In summary, this study highlights psoriasis as a systemic, multi-layered disorder shaped by coordinated alterations across the gut–immune–skin axis. By integrating functional microbiome profiling with immune epigenomics and miRNA-regulated skin transcriptomics, we provide a unifying framework that emphasizes metabolic–epigenetic–transcriptional convergence in disease pathogenesis. This perspective not only advances our understanding of psoriasis biology but also motivates investigation of strategies aimed at restoring microbial metabolic balance or modulating immune epigenetic states as potential complements to existing anti-inflammatory treatments.
5. Conclusions
This study presents a multi-omics framework integrating gut metagenomic functional profiles, systemic immune-cell DNA methylation, and lesional skin transcriptomics to delineate convergent molecular remodeling in psoriasis. Across independent public datasets, psoriasis exhibited a reproducible shift in gut microbial functional potential characterized by reduced lipid-catabolic capacity and heterogeneous SCFA-associated pathway changes with a tendency toward lower terminal SCFA-related functions, supporting a metabolically remodeled microbiome context. In parallel, DMR-centric analyses of PBMCs and purified CD8+ T cells revealed widespread and structured DNA methylation remodeling consistent with systemic immune-state–linked epigenetic priming, including pathway-level themes and loci related to membrane-proximal signaling and lipid/glycoconjugate biology. Lesional skin transcriptomes demonstrated an AMP-dominant inflammatory program together with a keyword-defined metabolic axis shift (relative downshift of lipid-metabolism–related Hallmark programs), and lesional miRNA remodeling further provided a directionality-constrained miRNA–mRNA bridge consistent with reduced post-transcriptional restraint across AMP and barrier–lipid/keratinocyte modules. Together, these findings support a “Triple-Hit” convergence model in which microbial metabolic remodeling, immune-cell methylome reprogramming, and cutaneous inflammatory–metabolic amplification co-occur across compartments in psoriasis pathophysiology. While these analyses rely on inferred functional and cellular estimates from public datasets, the cross-layer consistency strengthens the robustness of the proposed axis. Future studies coupling longitudinal sampling with direct metabolite measurements and mechanistic validation will be critical to evaluate causality and motivate investigation of strategies targeting microbial metabolic capacity and immune epigenetic states as potential complements to existing anti-inflammatory therapies.
6. Patents
The authors declare that no patents resulted from the work reported in this manuscript.
Supplementary Materials
The following supporting information can be downloaded at the website of this paper posted on Preprints.org. Figure S1: Taxonomic composition of the gut microbiome in healthy controls and psoriasis patients (GSE239722); Figure S2: Alpha diversity of the gut microbiome at the genus level (GSE239722); Figure S3: Beta diversity of the gut microbiome at the genus level (GSE239722); Figure S4: ssGSEA-based Hallmark pathway activity in lesional skin transcriptomes (GSE186063); Figure S5: Correlation between AMP gene expression and inferred immune/stromal cell population scores in GSE186063 skin transcriptomes.
Author Contributions
Conceptualization, Y.K.L.; methodology, Y.K.L.; software, Y.K.L.; validation, H.Y.K., and D.H.S.; formal analysis, Y.K.L.; investigation, Y.K.L.; resources, D.H.S.; data curation, Y.K.L.; writing—original draft preparation, Y.K.L.; writing—review and editing, H.Y.K. and D.H.S.; visualization, Y.K.L.; supervision, D.H.S.; project administration, Y.K.L.; funding acquisition, D.H.S. All authors have read and agreed to the published version of the manuscript.
Funding
This work was supported by Genome editing research program funded from the Korea government (MSIT) (Project No.: RS-2023-00263429).
Institutional Review Board Statement
Not applicable. This study analyzed publicly available, de-identified datasets deposited in the Gene Expression Omnibus (GEO) and did not involve any new collection of human samples or identifiable private information by the authors.
Informed Consent Statement
Not applicable.
Data Availability Statement
The datasets analyzed in this study are publicly available in the Gene Expression Omnibus (GEO) under accession numbers GSE239722, GSE200376, GSE184500, GSE220586, and GSE186063. The analysis scripts used for data processing and visualization and the derived summary tables/figures are available from the corresponding author upon reasonable request.
Acknowledgments
During the preparation of this study, the authors used generative AI tools (Gemini, Google; ChatGPT, OpenAI) for the purposes of debugging, refactoring, and optimizing custom R scripts used for multi-omics data processing and visualization. The authors reviewed and edited the output and take full responsibility for the content of this publication. The AI tools were not used to generate data, perform statistical analyses, interpret biological results, or formulate scientific conclusions.
Conflicts of Interest
The authors declare no conflicts of interest. The funders had no role in the design of the study; in the collection, analyses, or interpretation of data; in the writing of the manuscript; or in the decision to publish the results.
Abbreviations
The following abbreviations are used in this manuscript:
| AMP | Antimicrobial peptide |
| AS-HC | Healthy-appearing skin from Ankylosing Spondylitis patients (Control) |
| BH | Benjamini-Hochberg |
| CPM | Counts Per Million |
| DEG | Differentially expressed gene |
| DE-miRNA | Differentially expressed microRNA |
| DMP | Differentially methylated position |
| DMR | Differentially methylated region |
| EPIC | Infinium MethylationEPIC BeadChip (850K) |
| FDR | False discovery rate |
| GEO | Gene Expression Omnibus |
| GO | Gene Ontology |
| GSEA | Gene set enrichment analysis |
| HC | Healthy control |
| KEGG | Kyoto Encyclopedia of Genes and Genomes |
| L2/L3 | KEGG Level 2/Level 3 functional hierarchy |
| logFC | Log2 Fold Change |
| NES | Normalized Enrichment Score |
| ORA | Over-representation analysis |
| PBMC | Peripheral blood mononuclear cell |
| PCoA | Principal coordinates analysis |
| PCA | Principal component analysis |
| PsO | Psoriasis |
| PsO-CD8 | CD8+ T cells from Psoriasis patients |
| PsO-L | Psoriatic lesional skin |
| PsO-PB | PBMCs from Psoriasis patients |
| PsO-UT | Untreated psoriasis |
| SCFA | Short-chain fatty acid |
| SRA | Sequence Read Archive |
| TF | Transcription factor |
| TMM | Trimmed Mean of M-values |
Appendix A. Definition of the Gut Lipid Degradation Functional Score (Figure 2d)
To quantify gut microbial lipid degradation–related functional potential (Figure 2d), a composite “Lipid Degradation Functional Score” was computed per sample as the sum of z-scores (standardized across all samples in the cohort) from three KEGG Pathway Level 3 categories:
- Fatty acid degradation (ko00071)
- Glycerolipid metabolism (ko00561)
- Glycerophospholipid metabolism (ko00564)
This combination was chosen to represent community-level functional capacity related to lipid catabolism and lipid processing/turnover, enabling an aggregate summary beyond a single pathway.
Appendix B. Hallmark Gene Set Aggregation Logic (Figure 6d)
To summarize MSigDB Hallmark enrichments into interpretable axes (Figure 6d), Hallmark gene sets were grouped using a pre-specified, name-based keyword matching heuristic applied to gene set names (case-insensitive; ignore.case = TRUE). This grouping was used for descriptive axis-level summarization and was not optimized post hoc to fit the data. The Regular Expressions (Regex) applied in the R script were:
- Inflammation axis: grepl(“IL-17|TNF|INTERFERON|NF-KB|INFLAMM”, x, ignore.case = TRUE)
This rule captures Hallmark gene sets reflecting inflammatory signaling and response programs (e.g., TNFα/NF-κB, interferon responses, and inflammatory response).
- Lipid metabolism axis: grepl(“LIPID|FATTY|SPHINGO|CHOLESTEROL”, x, ignore.case = TRUE)
This rule captures lipid-related metabolic programs (e.g., fatty acid metabolism, adipogenesis, and cholesterol homeostasis).
- Insulin/Metabolic signaling axis: grepl(“INSULIN|PI3K|AKT|MTOR|GLYCOLYSIS”, x, ignore.case = TRUE) This rule captures anabolic and glycolysis-handling programs spanning PI3K/AKT/mTOR signaling and central carbon metabolism.
References
- Boehncke, W.-H.; Schön, M.P. Psoriasis. The Lancet 2015, 386, 983–994. [Google Scholar] [CrossRef] [PubMed]
- Nestle, F.O.; Kaplan, D.H.; Barker, J. Psoriasis. N Engl J Med 2009, 361, 496–509. [Google Scholar] [CrossRef] [PubMed]
- Codoñer, F.M.; Ramírez-Bosca, A.; Climent, E.; Carrión-Gutierrez, M.; Guerrero, M.; Pérez-Orquín, J.M.; Horga de la Parte, J.; Genovés, S.; Ramón, D.; Navarro-López, V.; et al. Gut Microbial Composition in Patients with Psoriasis. Sci Rep 2018, 8, 3812. [Google Scholar] [CrossRef]
- Branisteanu, D.E.; Pirvulescu, R.A.; Spinu, A.E.; Porumb, E.A.; Cojocaru, M.; Nicolescu, A.C.; Branisteanu, D.C.; Branisteanu, C.I.; Dimitriu, A.; Alexa, A.I.; et al. Metabolic Comorbidities of Psoriasis (Review). Experimental and Therapeutic Medicine 2022, 23, 1–7. [Google Scholar] [CrossRef] [PubMed]
- Davidovici, B.B.; Sattar, N.; Jörg, P.C.; Puig, L.; Emery, P.; Barker, J.N.; de Kerkhof, P. van; Ståhle, M.; Nestle, F.O.; Girolomoni, G.; et al. Psoriasis and Systemic Inflammatory Diseases: Potential Mechanistic Links between Skin Disease and Co-Morbid Conditions. J Invest Dermatol 2010, 130, 1785–1796. [Google Scholar] [CrossRef]
- Takeshita, J.; Grewal, S.; Langan, S.M.; Mehta, N.N.; Ogdie, A.; Voorhees, A.S.V.; Gelfand, J.M. Psoriasis and Comorbid Diseases: Epidemiology. Journal of the American Academy of Dermatology 2017, 76, 377–390. [Google Scholar] [CrossRef]
- Scher, J.U.; Ubeda, C.; Artacho, A.; Attur, M.; Isaac, S.; Reddy, S.M.; Marmon, S.; Neimann, A.; Brusca, S.; Patel, T.; et al. Decreased Bacterial Diversity Characterizes the Altered Gut Microbiota in Patients With Psoriatic Arthritis, Resembling Dysbiosis in Inflammatory Bowel Disease. Arthritis & Rheumatology 2015, 67, 128–139. [Google Scholar] [CrossRef]
- Hidalgo-Cantabrana, C.; Gómez, J.; Delgado, S.; Requena-López, S.; Queiro-Silva, R.; Margolles, A.; Coto, E.; Sánchez, B.; Coto-Segura, P. Gut Microbiota Dysbiosis in a Cohort of Patients with Psoriasis. Br J Dermatol 2019, 181, 1287–1295. [Google Scholar] [CrossRef]
- Zang, C.; Liu, J.; Mao, M.; Zhu, W.; Chen, W.; Wei, B. Causal Associations Between Gut Microbiota and Psoriasis: A Mendelian Randomization Study. Dermatol Ther (Heidelb) 2023, 13, 2331–2343. [Google Scholar] [CrossRef]
- Franzosa, E.A.; McIver, L.J.; Rahnavard, G.; Thompson, L.R.; Schirmer, M.; Weingart, G.; Lipson, K.S.; Knight, R.; Caporaso, J.G.; Segata, N.; et al. Species-Level Functional Profiling of Metagenomes and Metatranscriptomes. Nat Methods 2018, 15, 962–968. [Google Scholar] [CrossRef]
- Smith, P.M.; Howitt, M.R.; Panikov, N.; Michaud, M.; Gallini, C.A.; Bohlooly-Y, M.; Glickman, J.N.; Garrett, W.S. The Microbial Metabolites, Short Chain Fatty Acids, Regulate Colonic Treg Cell Homeostasis. Science 2013, 341, 10.1126/science.1241165. [Google Scholar] [CrossRef] [PubMed]
- Jian, T.; Craig, M.; Maria, P.; Alison N, T.; Charles R, M.; Laurence, M. The Role of Short-Chain Fatty Acids in Health and Disease. In Advances in Immunology; Academic Press, 2014; Vol. 121, pp. 91–119. [Google Scholar]
- Agus, A.; Planchais, J.; Sokol, H. Gut Microbiota Regulation of Tryptophan Metabolism in Health and Disease. Cell Host & Microbe 2018, 23, 716–724. [Google Scholar] [CrossRef] [PubMed]
- Zhang, P.; Zhao, M.; Liang, G.; Yin, G.; Huang, D.; Su, F.; Zhai, H.; Wang, L.; Su, Y.; Lu, Q. Whole-Genome DNA Methylation in Skin Lesions from Patients with Psoriasis Vulgaris. Journal of Autoimmunity 2013, 41, 17–24. [Google Scholar] [CrossRef] [PubMed]
- Roberson, E.D.O.; Bowcock, A.M. Psoriasis Genetics: Breaking the Barrier. Trends Genet 2010, 26, 415–423. [Google Scholar] [CrossRef]
- Luo, Y.; Qu, K.; Kuai, L.; Ru, Y.; Huang, K.; Yan, X.; Xing, M. Epigenetics in Psoriasis: Perspective of DNA Methylation. Mol Genet Genomics 2021, 296, 1027–1040. [Google Scholar] [CrossRef]
- Zou, F.; Qiu, Y.; Huang, Y.; Zou, H.; Cheng, X.; Niu, Q.; Luo, A.; Sun, J. Effects of Short-Chain Fatty Acids in Inhibiting HDAC and Activating P38 MAPK Are Critical for Promoting B10 Cell Generation and Function. Cell Death Dis 2021, 12, 582. [Google Scholar] [CrossRef]
- Sanford, J.A.; Zhang, L.-J.; Williams, M.R.; Gangoiti, J.A.; Huang, C.-M.; Gallo, R.L. Inhibition of HDAC8 and HDAC9 by Microbial Short-Chain Fatty Acids Breaks Immune Tolerance of the Epidermis to TLR Ligands. Science Immunology 2016, 1, eaah4609. [Google Scholar] [CrossRef]
- Li, M.; van Esch, B.C.A.M.; Henricks, P.A.J.; Folkerts, G.; Garssen, J. The Anti-Inflammatory Effects of Short Chain Fatty Acids on Lipopolysaccharide- or Tumor Necrosis Factor α-Stimulated Endothelial Cells via Activation of GPR41/43 and Inhibition of HDACs. Front. Pharmacol. 2018, 9. [Google Scholar] [CrossRef]
- Lowes, M.A.; Suárez-Fariñas, M.; Krueger, J.G. Immunology of Psoriasis. Annu Rev Immunol 2014, 32, 227–255. [Google Scholar] [CrossRef]
- Greb, J.E.; Goldminz, A.M.; Elder, J.T.; Lebwohl, M.G.; Gladman, D.D.; Wu, J.J.; Mehta, N.N.; Finlay, A.Y.; Gottlieb, A.B. Psoriasis. Nat Rev Dis Primers 2016, 2, 16082. [Google Scholar] [CrossRef]
- Harder, J.; Schröder, J.-M. Antimicrobial Peptides in Human Skin. In Chemical Immunology and Allergy; Kabelitz, D., Schröder, J.-M., Eds.; KARGER: Basel, 2005; pp. 22–41. ISBN 978-3-8055-7862-2. [Google Scholar]
- Zenz, R.; Eferl, R.; Kenner, L.; Florin, L.; Hummerich, L.; Mehic, D.; Scheuch, H.; Angel, P.; Tschachler, E.; Wagner, E.F. Psoriasis-like Skin Disease and Arthritis Caused by Inducible Epidermal Deletion of Jun Proteins. Nature 2005, 437, 369–375. [Google Scholar] [CrossRef] [PubMed]
- Belizário, J.E. Role of Skin Antimicrobial Peptides in the Pathogenesis of Psoriasis, Atopic Dermatitis and Hidradenitis Suppurative: Highlights on Dermcidin. Clinical Immunology Communications 2025, 7, 18–26. [Google Scholar] [CrossRef]
- Christmann, C.; Zenker, S.; Martens, L.; Hübner, J.; Loser, K.; Vogl, T.; Roth, J. Interleukin 17 Promotes Expression of Alarmins S100A8 and S100A9 During the Inflammatory Response of Keratinocytes. Front. Immunol. 2021, 11. [Google Scholar] [CrossRef] [PubMed]
- Sonkoly, E.; Wei, T.; Janson, P.C.J.; Sääf, A.; Lundeberg, L.; Tengvall-Linder, M.; Norstedt, G.; Alenius, H.; Homey, B.; Scheynius, A.; et al. MicroRNAs: Novel Regulators Involved in the Pathogenesis of Psoriasis? PLOS ONE 2007, 2, e610. [Google Scholar] [CrossRef]
- O’Connell, R.M.; Rao, D.S.; Baltimore, D. microRNA Regulation of Inflammatory Responses. Annu. Rev. Immunol. 2012, 30, 295–312. [Google Scholar] [CrossRef]
- Du, X.; Yan, C.; Kong, S.; Che, D.; Peng, B.; Zhu, L.; Geng, S.; Guo, K. Successful Secukinumab Therapy in Plaque Psoriasis Is Associated with Altered Gut Microbiota and Related Functional Changes. Front. Microbiol. 2023, 14, 1227309. [Google Scholar] [CrossRef]
- Lu, Q.; Zhao, M.; Deng, M.; Su, Y. Whole Blood DNA Methylation Arrays of Individuals with Psoriatic Arthritis, Psoriasis Vulgaris, and Healthy Control Subjects (GSE200376). Gene Expression Omnibus (GEO), NCBI. Available online: https://www.ncbi.nlm.nih.gov/geo/query/acc.cgi?acc=GSE200376 (accessed on 10 February 2026).
- Charras, A.; Garau, J.; Hofmann, S.R.; Carlsson, E.; Cereda, C.; Russ, S.; Abraham, S.; Hedrich, C.M. DNA Methylation Patterns in CD8+ T Cells Discern Psoriasis From Psoriatic Arthritis and Correlate With Cutaneous Disease Activity. Front. Cell Dev. Biol. 2021, 9, 746145. [Google Scholar] [CrossRef]
- Quah, S.; Sundaram, G.M.; Subramanian, G.; Vaz, C.; Tan, J.S.L.; Kabir, R.F.; Ong, J.M.R.; Oon, H.H.; Theng, C.; Sampath, P. IL-17–Mediated Downregulation of miR-101 Facilitates the Expression of EZH2 to Promote Epidermal Hyperplasia in Psoriasis. J Invest Dermatol 2024, 144, 403–407.e7. [Google Scholar] [CrossRef]
- Deng, J.; Leijten, E.; Nordkamp, M.O.; Zheng, G.; Pouw, J.; Tao, W.; Hartgring, S.; Balak, D.; Rijken, R.; Huang, R.; et al. Multi-Omics Integration Reveals a Core Network Involved in Host Defence and Hyperkeratinization in Psoriasis. Clin Transl Med 2022, 12, e976. [Google Scholar] [CrossRef]
- Li, D.; Liu, C.-M.; Luo, R.; Sadakane, K.; Lam, T.-W. MEGAHIT: An Ultra-Fast Single-Node Solution for Large and Complex Metagenomics Assembly via Succinct de Bruijn Graph. Bioinformatics 2015, 31, 1674–1676. [Google Scholar] [CrossRef]
- Zhu, W.; Lomsadze, A.; Borodovsky, M. Ab Initio Gene Identification in Metagenomic Sequences. Nucleic Acids Res 2010, 38, e132. [Google Scholar] [CrossRef] [PubMed]
- Steinegger, M.; Söding, J. MMseqs2 Enables Sensitive Protein Sequence Searching for the Analysis of Massive Data Sets. Nat Biotechnol 2017, 35, 1026–1028. [Google Scholar] [CrossRef] [PubMed]
- Kanehisa, M.; Goto, S. KEGG: Kyoto Encyclopedia of Genes and Genomes. Nucleic Acids Res 2000, 28, 27–30. [Google Scholar] [CrossRef] [PubMed]
- Aryee, M.J.; Jaffe, A.E.; Corrada-Bravo, H.; Ladd-Acosta, C.; Feinberg, A.P.; Hansen, K.D.; Irizarry, R.A. Minfi: A Flexible and Comprehensive Bioconductor Package for the Analysis of Infinium DNA Methylation Microarrays. Bioinformatics 2014, 30, 1363–1369. [Google Scholar] [CrossRef]
- Triche, T.J., Jr.; Weisenberger, D.J.; Van Den Berg, D.; Laird, P.W.; Siegmund, K.D. Low-Level Processing of Illumina Infinium DNA Methylation BeadArrays. Nucleic Acids Res 2013, 41, e90. [Google Scholar] [CrossRef]
- Peters, T.J.; Buckley, M.J.; Statham, A.L.; Pidsley, R.; Samaras, K.; V Lord, R.; Clark, S.J.; Molloy, P.L. De Novo Identification of Differentially Methylated Regions in the Human Genome. Epigenetics & Chromatin 2015, 8, 6. [Google Scholar] [CrossRef]
- Ritchie, M.E.; Phipson, B.; Wu, D.; Hu, Y.; Law, C.W.; Shi, W.; Smyth, G.K. Limma Powers Differential Expression Analyses for RNA-Sequencing and Microarray Studies. Nucleic Acids Res 2015, 43, e47. [Google Scholar] [CrossRef]
- Wu, T.; Hu, E.; Xu, S.; Chen, M.; Guo, P.; Dai, Z.; Feng, T.; Zhou, L.; Tang, W.; Zhan, L.; et al. clusterProfiler 4.0: A Universal Enrichment Tool for Interpreting Omics Data. The Innovation 2021, 2, 100141. [Google Scholar] [CrossRef]
- Ru, Y.; Kechris, K.J.; Tabakoff, B.; Hoffman, P.; Radcliffe, R.A.; Bowler, R.; Mahaffey, S.; Rossi, S.; Calin, G.A.; Bemis, L.; et al. The multiMiR R Package and Database: Integration of microRNA–Target Interactions along with Their Disease and Drug Associations. Nucleic Acids Research 2014, 42, e133–e133. [Google Scholar] [CrossRef]
- Wong, N.; Wang, X. miRDB: An Online Resource for microRNA Target Prediction and Functional Annotations. Nucleic Acids Res 2015, 43, D146–152. [Google Scholar] [CrossRef]
- Agarwal, V.; Bell, G.W.; Nam, J.-W.; Bartel, D.P. Predicting Effective microRNA Target Sites in Mammalian mRNAs. eLife 2015, 4, e05005. [Google Scholar] [CrossRef] [PubMed]
- Cui, S.; Yu, S.; Huang, H.-Y.; Lin, Y.-C.-D.; Huang, Y.; Zhang, B.; Xiao, J.; Zuo, H.; Wang, J.; Li, Z.; et al. miRTarBase 2025: Updates to the Collection of Experimentally Validated microRNA–Target Interactions. Nucleic Acids Res 2025, 53, D147–D156. [Google Scholar] [CrossRef] [PubMed]
- Skoufos, G.; Kakoulidis, P.; Tastsoglou, S.; Zacharopoulou, E.; Kotsira, V.; Miliotis, M.; Mavromati, G.; Grigoriadis, D.; Zioga, M.; Velli, A.; et al. TarBase-v9.0 Extends Experimentally Supported miRNA–Gene Interactions to Cell-Types and Virally Encoded miRNAs. Nucleic Acids Res 2024, 52, D304–D310. [Google Scholar] [CrossRef] [PubMed]
- Karagkouni, D.; Paraskevopoulou, M.D.; Chatzopoulos, S.; Vlachos, I.S.; Tastsoglou, S.; Kanellos, I.; Papadimitriou, D.; Kavakiotis, I.; Maniou, S.; Skoufos, G.; et al. DIANA-TarBase v8: A Decade-Long Collection of Experimentally Supported miRNA–Gene Interactions. Nucleic Acids Res 2018, 46, D239–D245. [Google Scholar] [CrossRef]
- Robinson, M.D.; Oshlack, A. A Scaling Normalization Method for Differential Expression Analysis of RNA-Seq Data. Genome Biol 2010, 11, R25. [Google Scholar] [CrossRef]
- Huber, W.; Carey, V.J.; Gentleman, R.; Anders, S.; Carlson, M.; Carvalho, B.S.; Bravo, H.C.; Davis, S.; Gatto, L.; Girke, T.; et al. Orchestrating High-Throughput Genomic Analysis with Bioconductor. Nat Methods 2015, 12, 115–121. [Google Scholar] [CrossRef]
- Smyth, G.K. Linear Models and Empirical Bayes Methods for Assessing Differential Expression in Microarray Experiments. Stat Appl Genet Mol Biol 2004, 3, Article3. [Google Scholar] [CrossRef]
- Subramanian, A.; Tamayo, P.; Mootha, V.K.; Mukherjee, S.; Ebert, B.L.; Gillette, M.A.; Paulovich, A.; Pomeroy, S.L.; Golub, T.R.; Lander, E.S.; et al. Gene Set Enrichment Analysis: A Knowledge-Based Approach for Interpreting Genome-Wide Expression Profiles. Proceedings of the National Academy of Sciences 2005, 102, 15545–15550. [Google Scholar] [CrossRef]
- Mootha, V.K.; Lindgren, C.M.; Eriksson, K.-F.; Subramanian, A.; Sihag, S.; Lehar, J.; Puigserver, P.; Carlsson, E.; Ridderstråle, M.; Laurila, E.; et al. PGC-1alpha-Responsive Genes Involved in Oxidative Phosphorylation Are Coordinately Downregulated in Human Diabetes. Nat Genet 2003, 34, 267–273. [Google Scholar] [CrossRef]
- Liberzon, A.; Birger, C.; Thorvaldsdóttir, H.; Ghandi, M.; Mesirov, J.P.; Tamayo, P. The Molecular Signatures Database Hallmark Gene Set Collection. cels 2015, 1, 417–425. [Google Scholar] [CrossRef]
- Garcia-Alonso, L.; Iorio, F.; Matchan, A.; Fonseca, N.; Jaaks, P.; Peat, G.; Pignatelli, M.; Falcone, F.; Benes, C.H.; Dunham, I.; et al. Transcription Factor Activities Enhance Markers of Drug Sensitivity in Cancer. Cancer Res 2018, 78, 769–780. [Google Scholar] [CrossRef] [PubMed]
- Badia-i-Mompel, P.; Vélez Santiago, J.; Braunger, J.; Geiss, C.; Dimitrov, D.; Müller-Dott, S.; Taus, P.; Dugourd, A.; Holland, C.H.; Ramirez Flores, R.O.; et al. decoupleR: Ensemble of Computational Methods to Infer Biological Activities from Omics Data. Bioinformatics Advances 2022, 2, vbac016. [Google Scholar] [CrossRef] [PubMed]
- Becht, E.; Giraldo, N.A.; Lacroix, L.; Buttard, B.; Elarouci, N.; Petitprez, F.; Selves, J.; Laurent-Puig, P.; Sautès-Fridman, C.; Fridman, W.H.; et al. Estimating the Population Abundance of Tissue-Infiltrating Immune and Stromal Cell Populations Using Gene Expression. Genome Biol 2016, 17, 218. [Google Scholar] [CrossRef] [PubMed]
- Team, R. A Language and Environment for Statistical Computing. Computing 2006, 1. [Google Scholar] [CrossRef]
- Wickham, H. Ggplot2: Elegant Graphics for Data Analysis; Springer New York: New York, NY, 2009; ISBN 978-0-387-98140-6. [Google Scholar]
- Gu, Z.; Eils, R.; Schlesner, M. Complex Heatmaps Reveal Patterns and Correlations in Multidimensional Genomic Data. Bioinformatics 2016, 32, 2847–2849. [Google Scholar] [CrossRef]
- Kong, H.H.; Segre, J.A. Skin Microbiome: Looking Back to Move Forward. J Invest Dermatol 2012, 132, 933–939. [Google Scholar] [CrossRef]
- Furusawa, Y.; Obata, Y.; Fukuda, S.; Endo, T.A.; Nakato, G.; Takahashi, D.; Nakanishi, Y.; Uetake, C.; Kato, K.; Kato, T.; et al. Commensal Microbe-Derived Butyrate Induces the Differentiation of Colonic Regulatory T Cells. Nature 2013, 504, 446–450. [Google Scholar] [CrossRef]
- Arpaia, N.; Campbell, C.; Fan, X.; Dikiy, S.; van der Veeken, J.; deRoos, P.; Liu, H.; Cross, J.R.; Pfeffer, K.; Coffer, P.J.; et al. Metabolites Produced by Commensal Bacteria Promote Peripheral Regulatory T-Cell Generation. Nature 2013, 504, 451–455. [Google Scholar] [CrossRef]
- Frischknecht, L.; Vecellio, M.; Selmi, C. The Role of Epigenetics and Immunological Imbalance in the Etiopathogenesis of Psoriasis and Psoriatic Arthritis. Therapeutic Advances in Musculoskeletal 2019, 11, 1759720X19886505. [Google Scholar] [CrossRef]
- Nickoloff, B.J.; Qin, J.-Z.; Nestle, F.O. Immunopathogenesis of Psoriasis. Clin Rev Allergy Immunol 2007, 33, 45–56. [Google Scholar] [CrossRef]
- Cheuk, S.; Schlums, H.; Gallais Sérézal, I.; Martini, E.; Chiang, S.C.; Marquardt, N.; Gibbs, A.; Detlofsson, E.; Introini, A.; Forkel, M.; et al. CD49a Expression Defines Tissue-Resident CD8+ T Cells Poised for Cytotoxic Function in Human Skin. Immunity 2017, 46, 287–300. [Google Scholar] [CrossRef]
- Swindell, W.R.; Johnston, A.; Carbajal, S.; Han, G.; Wohn, C.; Lu, J.; Xing, X.; Nair, R.P.; Voorhees, J.J.; Elder, J.T.; et al. Genome-Wide Expression Profiling of Five Mouse Models Identifies Similarities and Differences with Human Psoriasis. PLOS ONE 2011, 6, e18266. [Google Scholar] [CrossRef]
- Li, B.; Tsoi, L.C.; Swindell, W.R.; Gudjonsson, J.E.; Tejasvi, T.; Johnston, A.; Ding, J.; Stuart, P.E.; Xing, X.; Kochkodan, J.J.; et al. Transcriptome Analysis of Psoriasis in a Large Case-Control Sample: RNA-Seq Provides Insights into Disease Mechanisms. J Invest Dermatol 2014, 134, 1828–1838. [Google Scholar] [CrossRef]
- Hawkes, J.E.; Nguyen, G.H.; Fujita, M.; Florell, S.R.; Callis Duffin, K.; Krueger, G.G.; O’Connell, R.M. microRNAs in Psoriasis. J Invest Dermatol 2016, 136, 365–371. [Google Scholar] [CrossRef]
- Armstrong, A.W.; Blauvelt, A.; Callis Duffin, K.; Huang, Y.-H.; Savage, L.J.; Guo, L.; Merola, J.F. Psoriasis. Nat Rev Dis Primers 2025, 11, 45. [Google Scholar] [CrossRef]
Figure 1.
Figure 1. Triple-Hit multi-omics framework and dataset architecture for psoriasis across the gut–blood–skin axis: The schematic summarizes the study design integrating five independent public datasets spanning three compartments: (Hit 1) gut microbial functional remodeling from shotgun metagenomics (GSE239722; HC vs PsO-UT), (Hit 2) systemic immune-cell methylome signatures from EPIC 850K DNA methylation profiles in PBMCs (GSE200376; HC vs PsO-PB) and purified CD8+ T cells (GSE184500; HC vs PsO-CD8), and (Hit 3) cutaneous regulatory and transcriptomic programs captured by lesional miRNA profiling (GSE220586; HC vs PsO-L) and lesional bulk RNA-seq (GSE186063; AS-HC vs PsO-L).
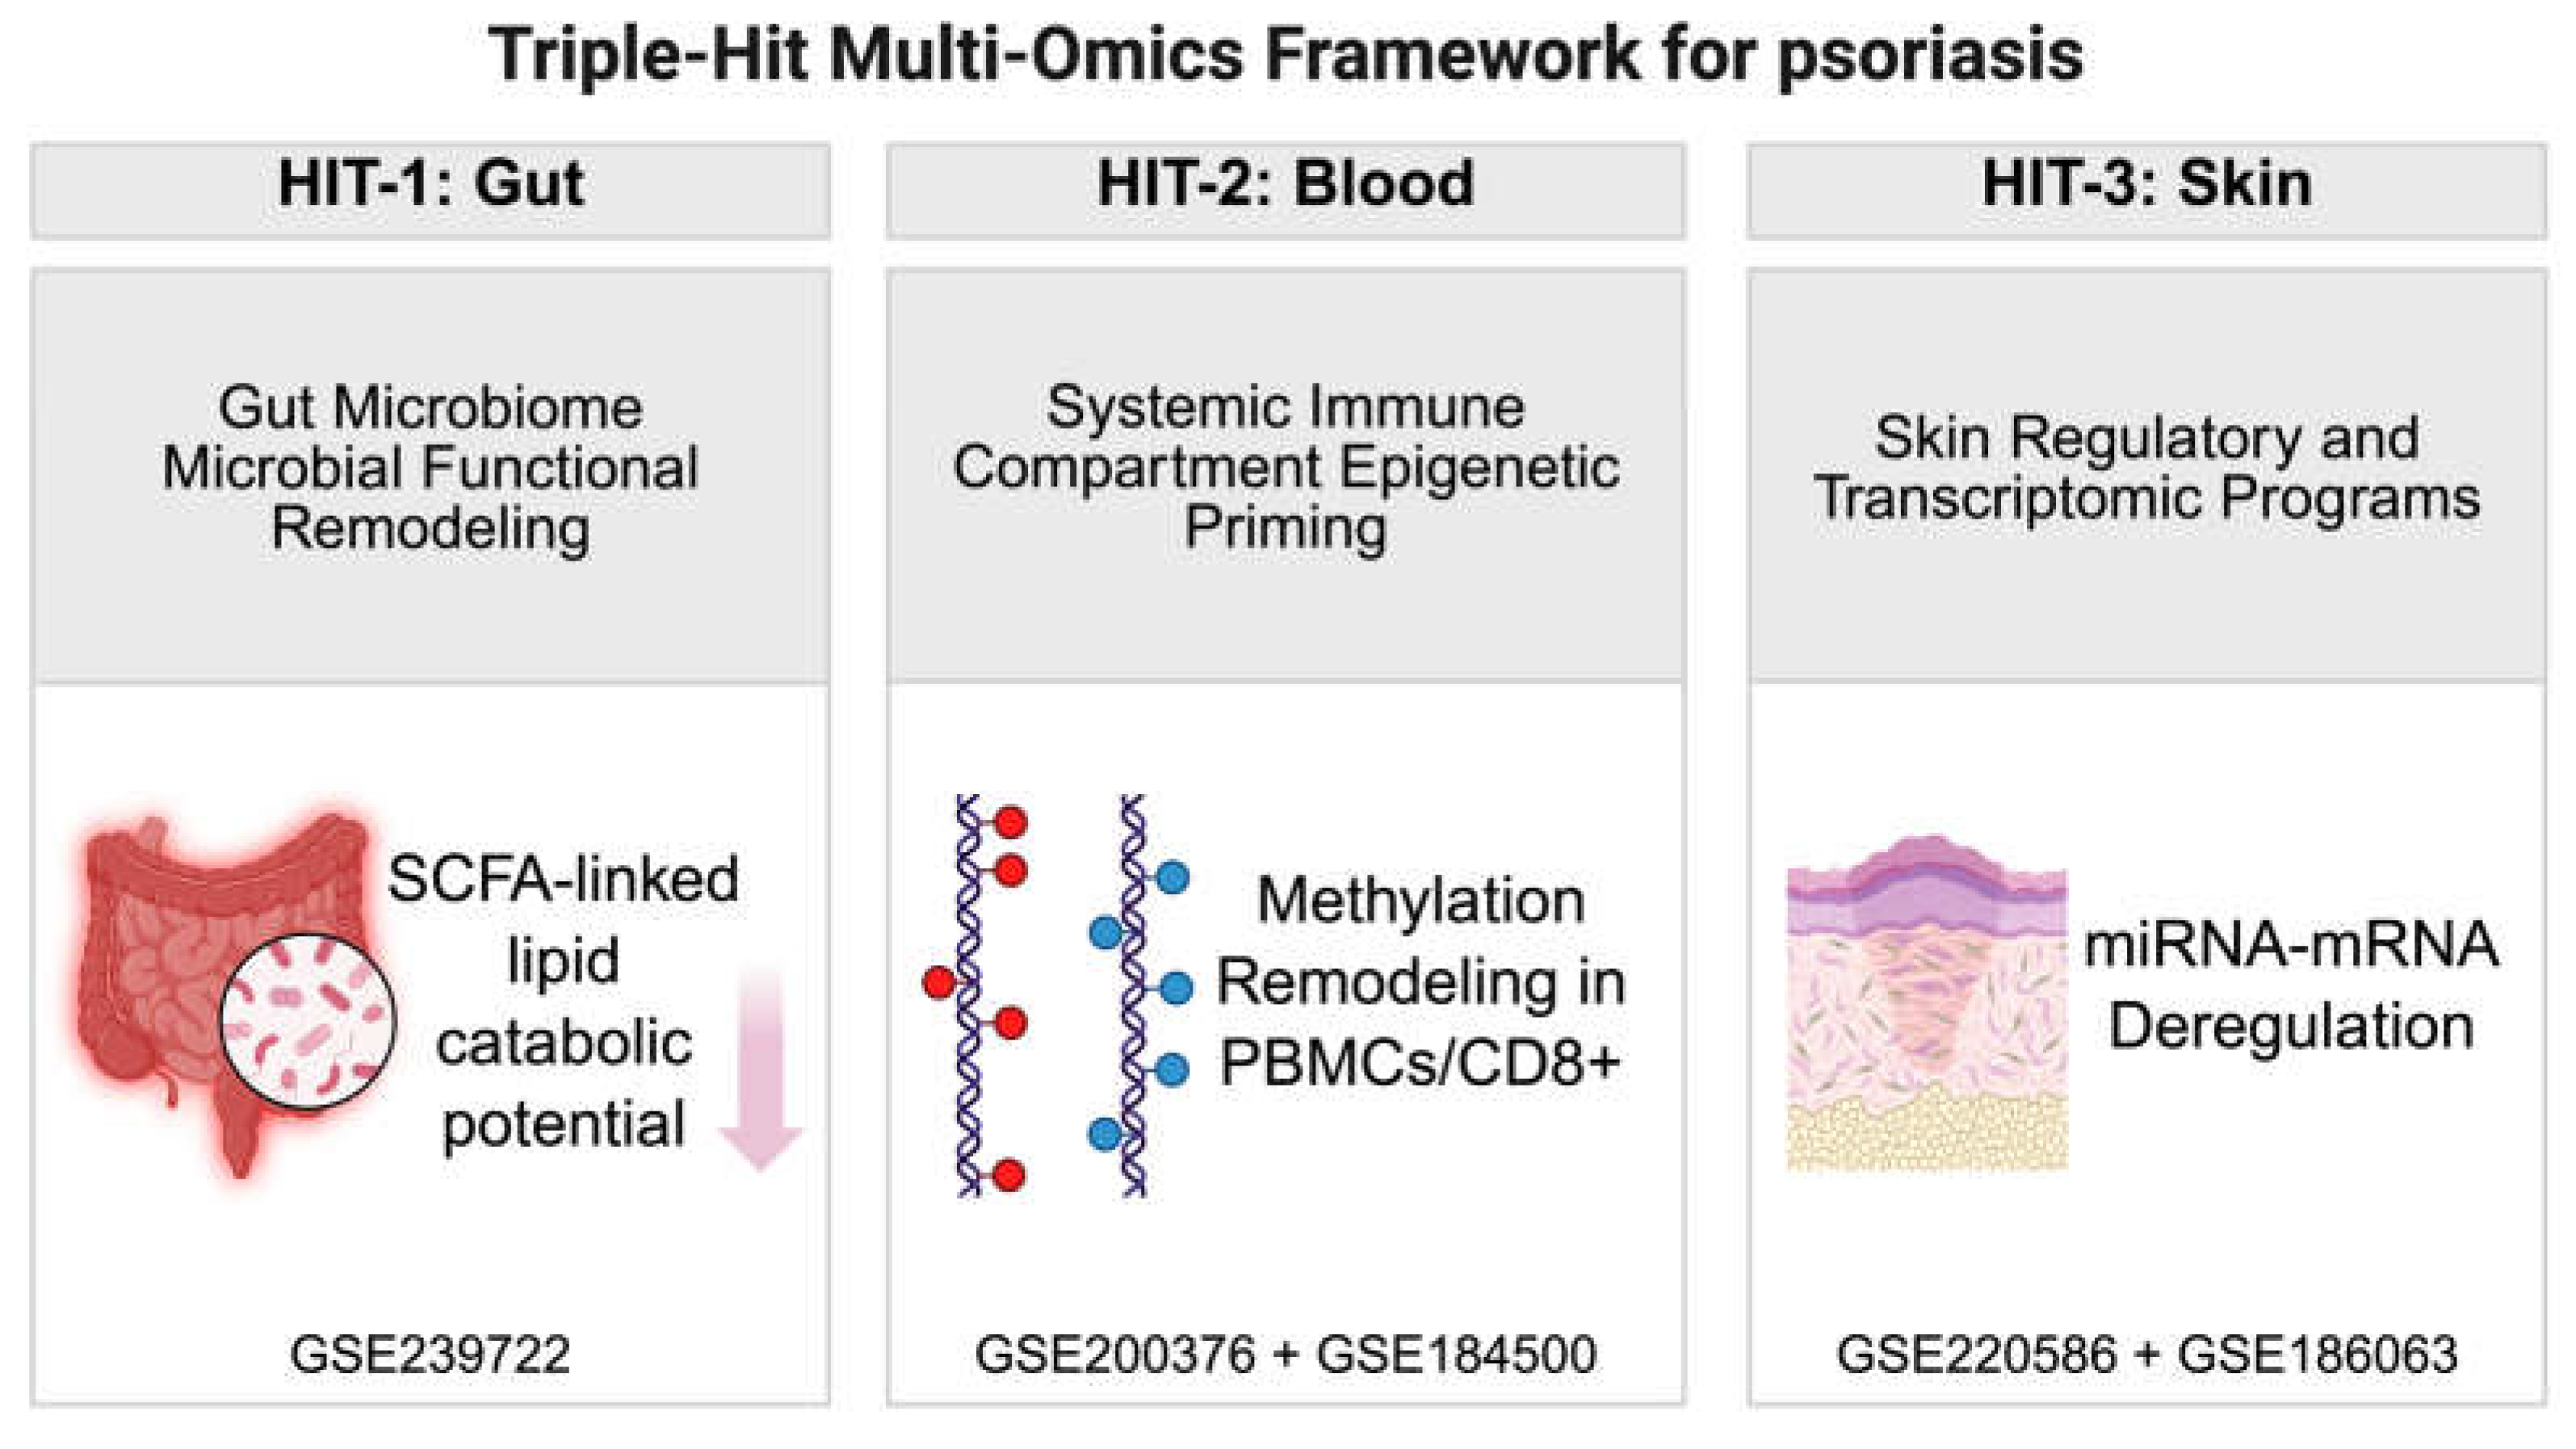
Figure 2.
Gut microbial functional remodeling in psoriasis highlights reduced lipid catabolic potential and heterogeneous shifts in SCFA-related pathways: Shotgun metagenomic functional profiles were summarized using KEGG pathway level 3 relative abundance and compared between healthy controls (HC) and psoriasis (PsO-UT). (a) Dot plot of lipid-related pathways. The x-axis indicates log2 fold change (log2FC; PsO-UT – HC), and dot size represents −log10(FDR). PsO-UT shows decreased fatty acid degradation and a broader reduction trend across several lipid metabolic pathways, whereas sphingolipid metabolism is shifted upward; (b) Dot plot of SCFA-associated pathways (same encoding). PsO-UT shows a downward shift in propanoate metabolism and butanoate metabolism, while upstream carbohydrate/central metabolism pathways including glycolysis/gluconeogenesis, pyruvate metabolism, and starch and sucrose metabolism are shifted upward; (c) Box plot of fatty acid degradation pathway relative abundance demonstrates a significant reduction in PsO-UT (Wilcoxon p = 0.0181); (d) Gut lipid degradation functional score in healthy controls (HC) and psoriasis (PsO-UT), computed per sample as the z-score sum of KEGG L3 lipid pathways (ko00071: fatty acid degradation; ko00561: glycerolipid metabolism; ko00564: glycerophospholipid metabolism) from the gut metagenomic cohort GSE239722 (HC, n = 8; PsO-UT, n = 8; Wilcoxon p = 0.00538).
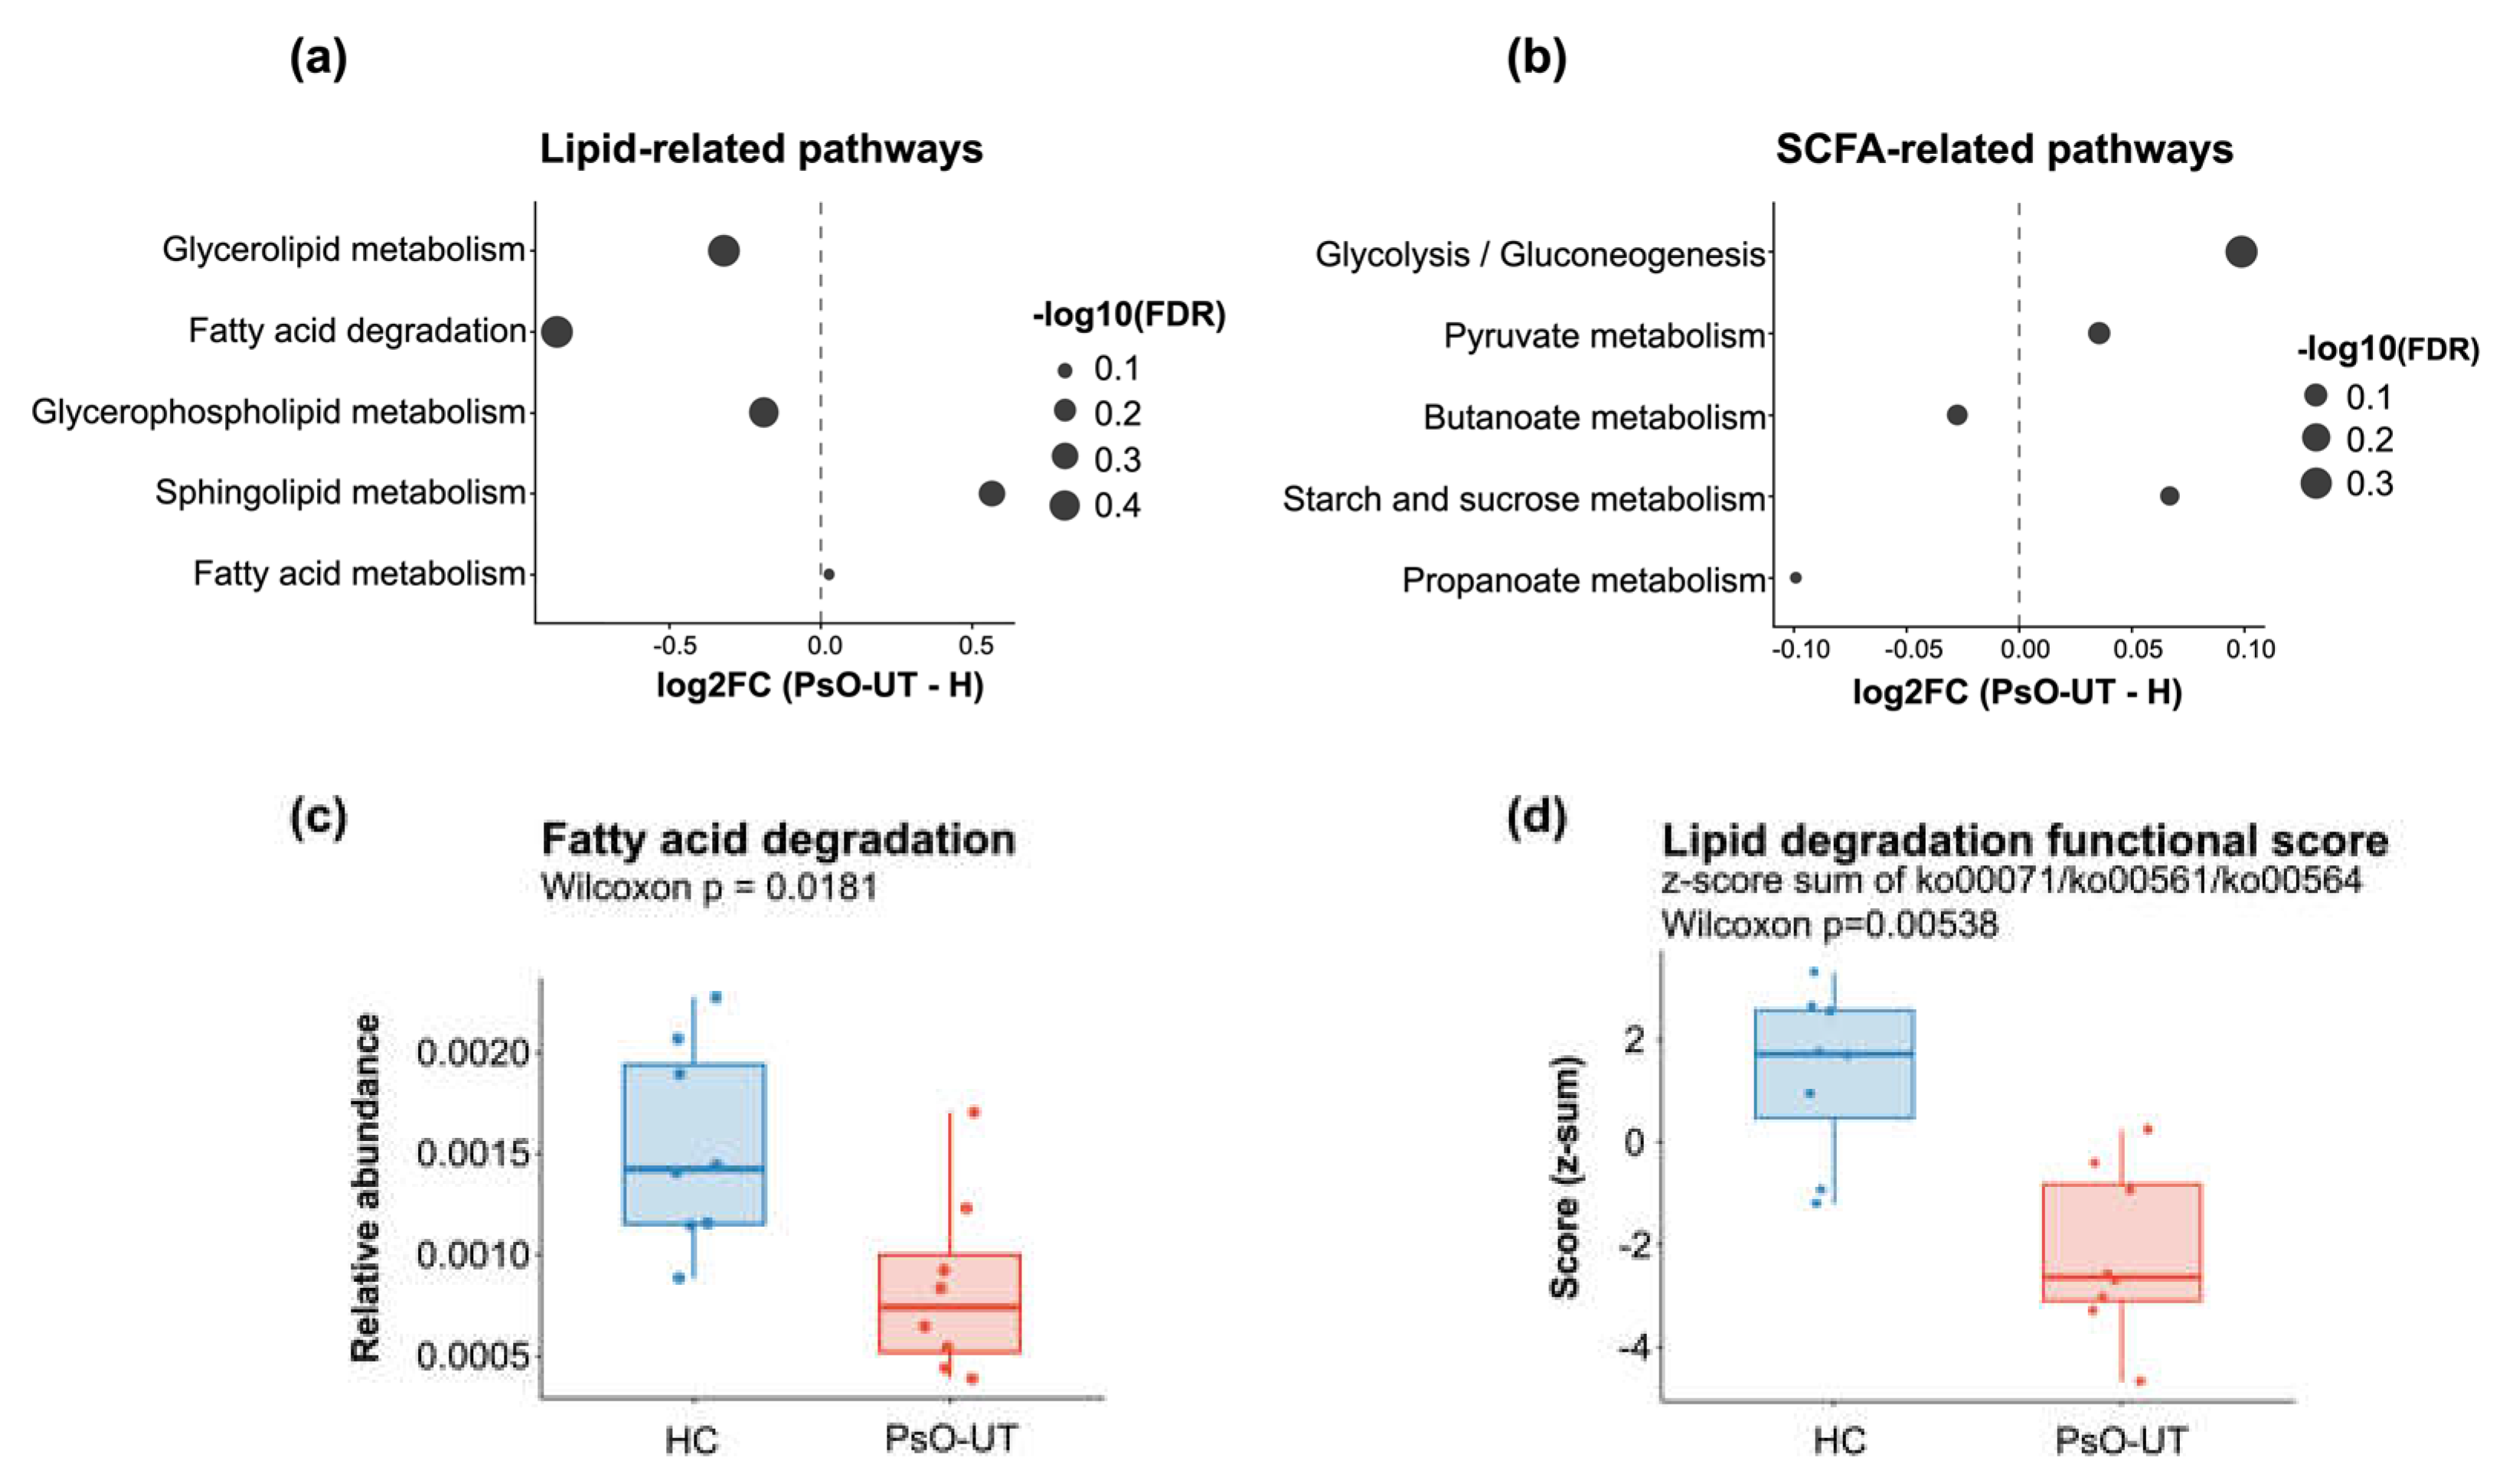
Figure 3.
Systemic PBMC DNA methylation remodeling in psoriasis (GSE200376) reveals widespread DMRs, a reproducible top-DMR signature, and enrichment of membrane-proximal signaling programs (HC vs PsO-PB): (a) Unsupervised principal component analysis (PCA) based on highly variable CpG sites shows a modest but discernible separation between psoriasis PBMC samples (PsO-PB) and healthy controls (HC), consistent with heterogeneous methylome remodeling; (b) Manhattan-like genome-wide DMR landscape demonstrating that significant differentially methylated regions (DMRs) are broadly distributed across essentially all chromosomes; (c) Summary of DMR directionality (hypermethylation vs hypomethylation) indicating the relative burden of regions showing increased or decreased methylation in PsO-PB compared with HC; (d) Distribution of regional effect sizes (Δβ) across DMRs shown separately for hypo- and hypermethylated regions, illustrating predominantly modest but consistent shifts; (e) Heatmap of top-ranked DMRs, where each DMR is summarized by the per-sample median β value across CpGs within the region, revealing clustering of samples by disease status; (f-i) Representative DMR examples visualized as per-sample median β values for selected loci (ATP6V0E2, BAALC, ABI3, and PRF1), highlighting consistent group-level methylation shifts at individual regions; (j) Volcano plot of differentially methylated positions (DMPs) at the single-CpG level, highlighting CpG sites with large effect sizes and strong multiple-testing–adjusted significance; (k) KEGG pathway over-representation analysis (ORA) of DMR-annotated genes (hsa pathways), identifying enrichment of adhesion/cytoskeletal remodeling and membrane-associated signaling pathways consistent with systemic immune-state–linked epigenetic priming.
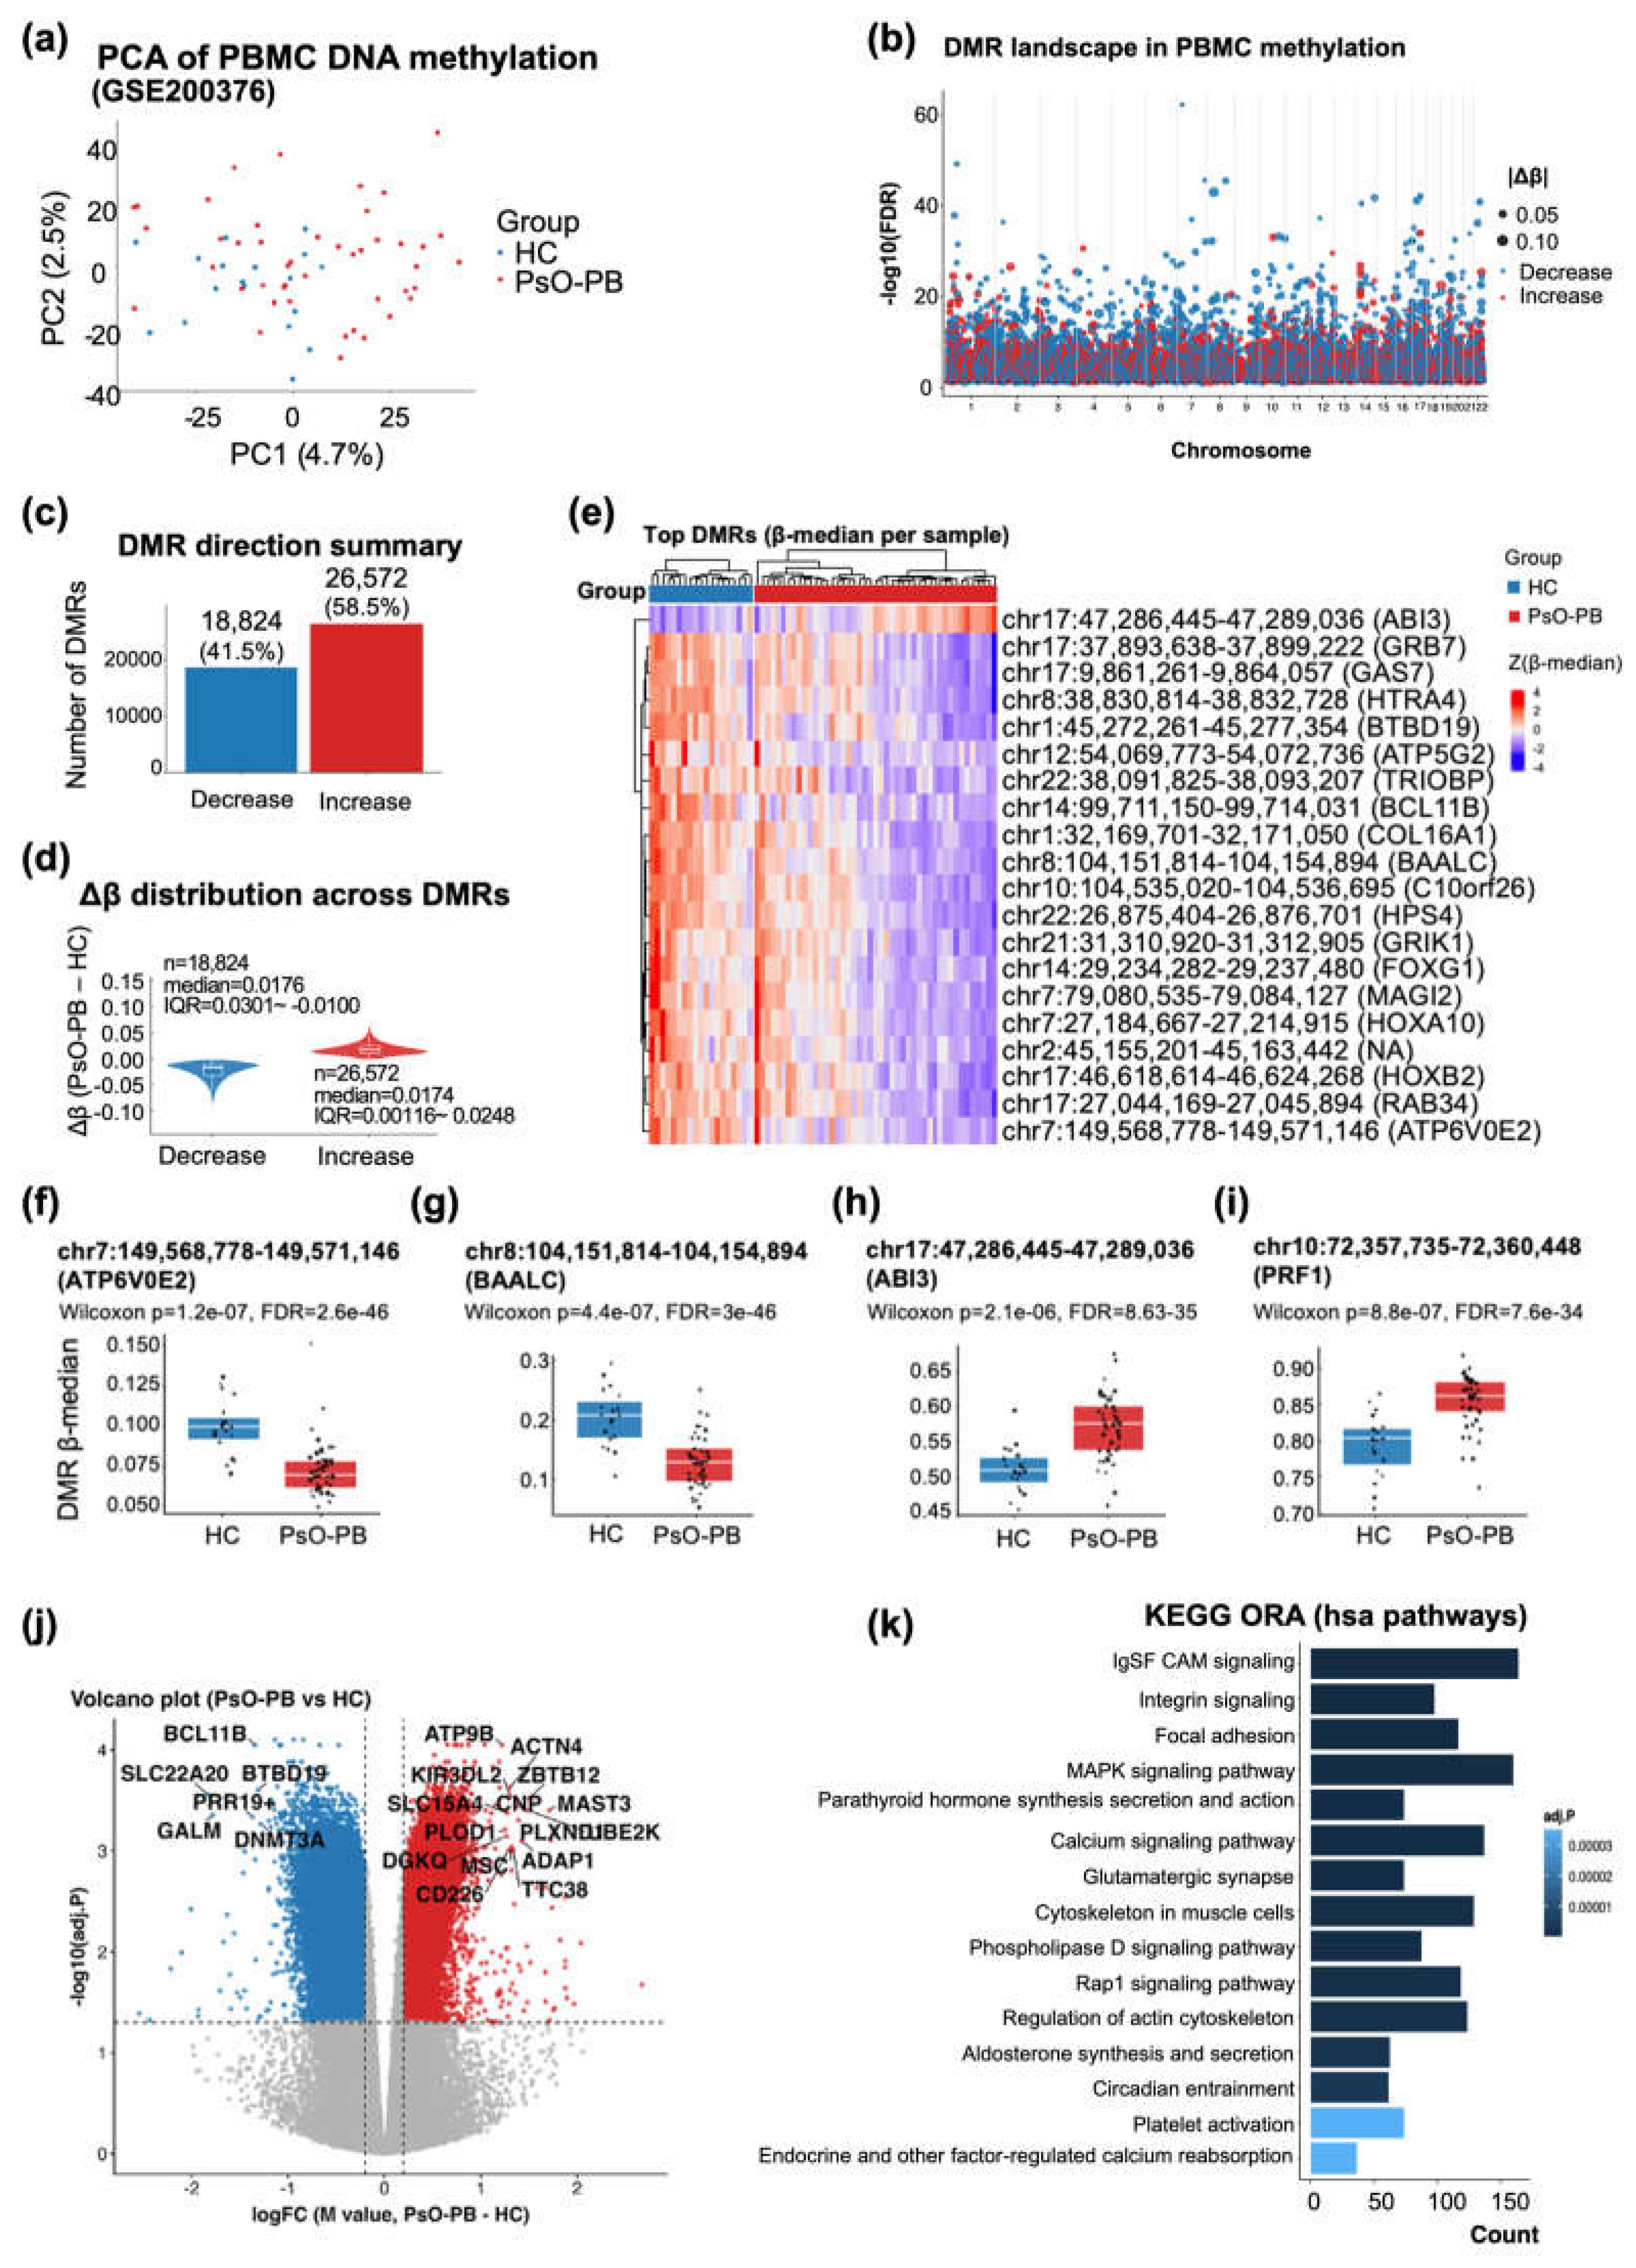
Figure 4.
Directional DNA methylation remodeling of circulating CD8+ T cells in psoriasis (GSE184500): (a) Principal component analysis (PCA) of genome-wide DNA methylation profiles (Illumina MethylationEPIC) from purified circulating CD8+ T cells comparing healthy controls (HC, n = 9) and psoriasis before treatment (PsO-CD8, n = 10). PCA was computed using highly variable CpG sites (β values after preprocessing); points are colored by group (HC, blue; PsO-CD8, red) and show a modest group-level separation; (b) Genome-wide DMR landscape identified by region-based analysis (DMRcate). Each point represents a DMR plotted across chromosomes; the y-axis indicates −log10(FDR) for the DMR, point size reflects |Δβ| (PsO-CD8 − HC; region-median β), and color denotes direction (decrease vs increase in PsO-CD8 relative to HC); (c) Directionality summary of detected DMRs, showing that most regions exhibit decreased methylation in PsO-CD8 relative to HC (123/175, 70.3%), compared with increased methylation (52/175, 29.7%); (d) Distribution of Δβ across DMRs stratified by direction. Violin/box plots summarize region-median methylation differences (Δβ), with median (IQR) of −0.0185 (−0.0313 to −0.0105) for decreased DMRs (n = 123) and 0.0133 (0.0056 to 0.0229) for increased DMRs (n = 52); (e) Heatmap of top-ranked DMRs showing region-median β values (row z-score) with samples ordered HC → PsO-CD8; rows are annotated by genomic coordinates and representative overlapping gene symbols where available; (f) KEGG pathway over-representation analysis (ORA) for genes linked to the relaxed DMR set used in this figure. Top-ranked pathways include membrane/ECM and signaling-associated terms (e.g., ECM–receptor interaction, PI3K–Akt signaling), along with lipid- and glyco-conjugate–related pathways (e.g., glycerolipid metabolism; glycosphingolipid biosynthesis); (g–j) Representative DMR loci visualized as boxplots of region-median β values with individual samples overlaid: PITPNC1 (g), CSNK1G1 (h), CXCL12 (i), and PIAS1 (j). Each panel reports the Wilcoxon rank-sum p-value for the group comparison and the corresponding DMR-level FDR from the region-based analysis (as labeled in the plots); positive Δβ indicates higher methylation in PsO-CD8 relative to HC.
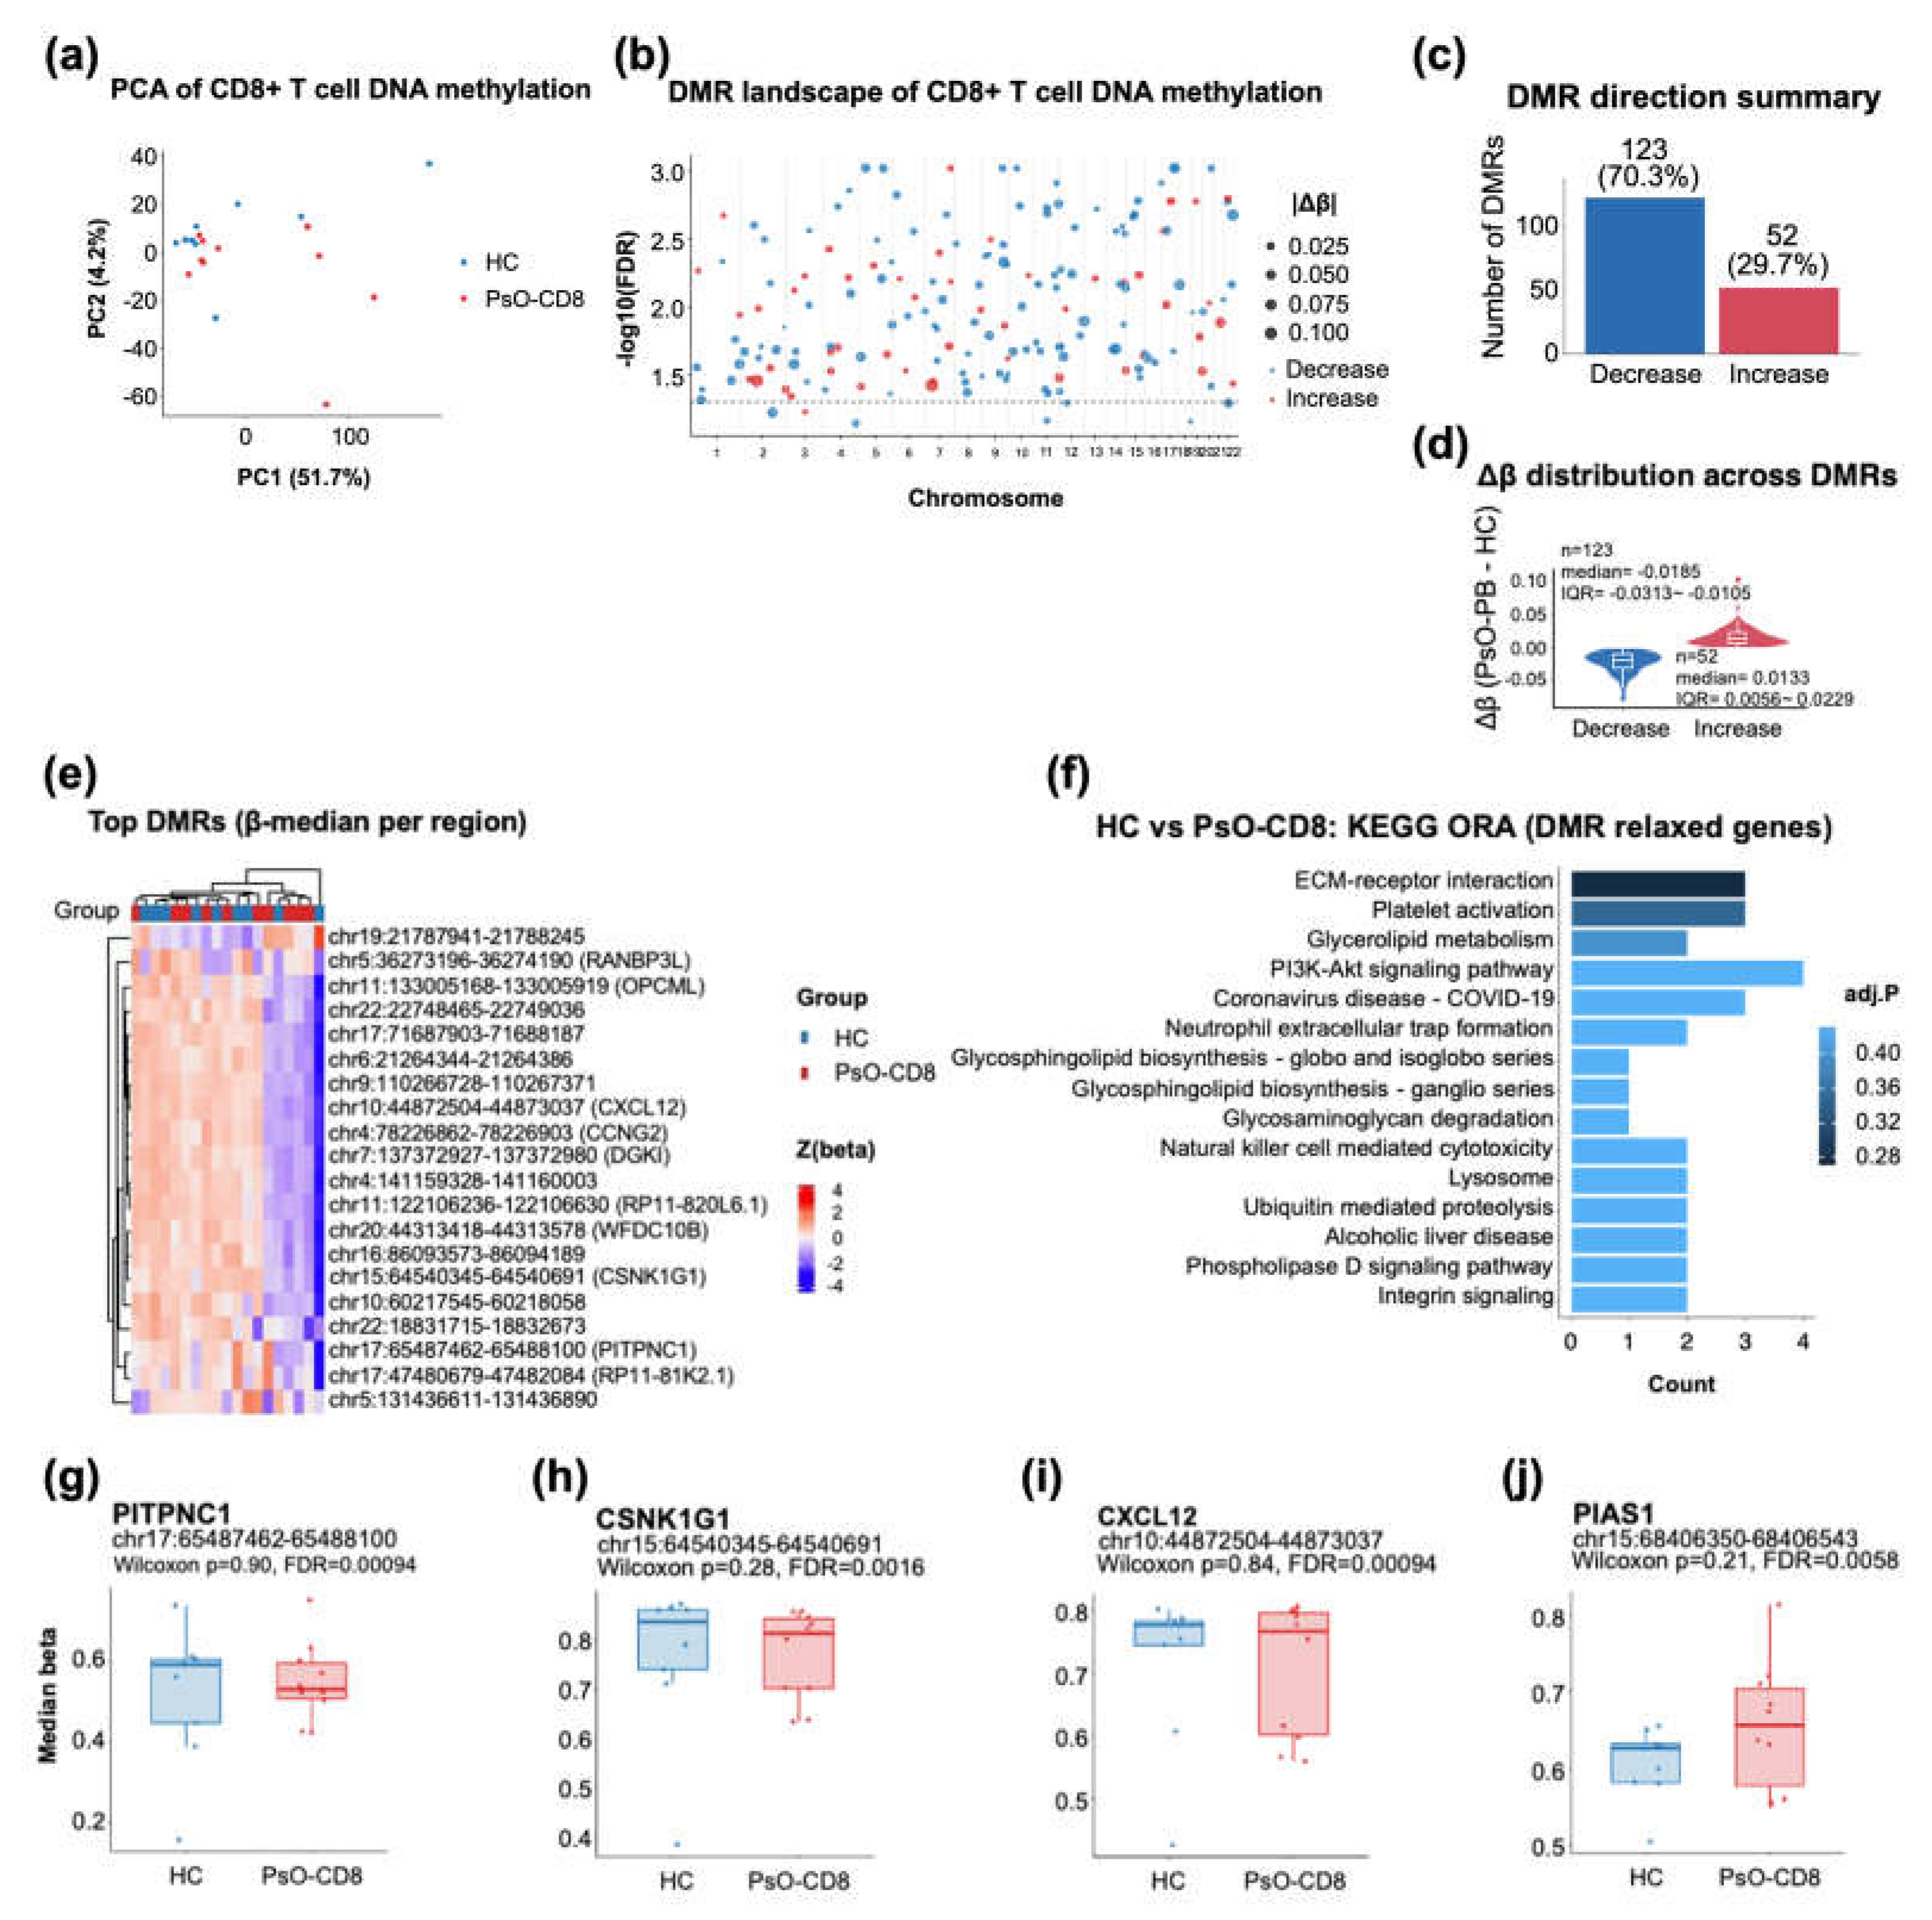
Figure 5.
Lesional miRNA remodeling and directionality-constrained miRNA–mRNA bridging highlight links to AMP programs and barrier–lipid/keratinocyte differentiation modules in psoriasis: (a) Heatmap of the top differentially expressed miRNAs between healthy controls (HC, n = 4) and psoriatic lesional samples (PsO-L, n = 4). Values are shown as row-scaled expression (z-score) to emphasize relative up/down patterns across samples; hierarchical clustering separates HC and PsO-L; (b) Volcano plot summarizing differential miRNA expression in PsO-L versus HC. The x-axis indicates log2 fold-change (PsO-L vs HC) and the y-axis indicates −log10(P value). miRNAs meeting the significance threshold (FDR 0.05) are considered differentially expressed, and selected miRNAs with large effect sizes and strong statistical support are labeled; (c) Directionality-constrained miRNA–mRNA “targeting bridge” network. Candidate miRNA–target pairs were compiled from target-evidence resources (e.g., multiMiR and experimentally supported databases) and retained only when miRNA and target mRNA changes were inversely directional (miRNA↑/mRNA↓ or miRNA↓/mRNA↑), consistent with canonical miRNA-mediated repression. Nodes represent miRNAs and their putative target genes; arrows indicate miRNA-to-target edges; (d) Alluvial (Sankey) summary of the constrained bridge, showing how prioritized miRNAs connect to functionally curated target modules (AMP literature core, barrier–lipid core, keratinocyte differentiation, and auxiliary lipid metabolism) and to the observed direction of target mRNA change in PsO-L. Flow width represents the number of retained miRNA–mRNA edges (edge count) after directionality filtering and prioritization.
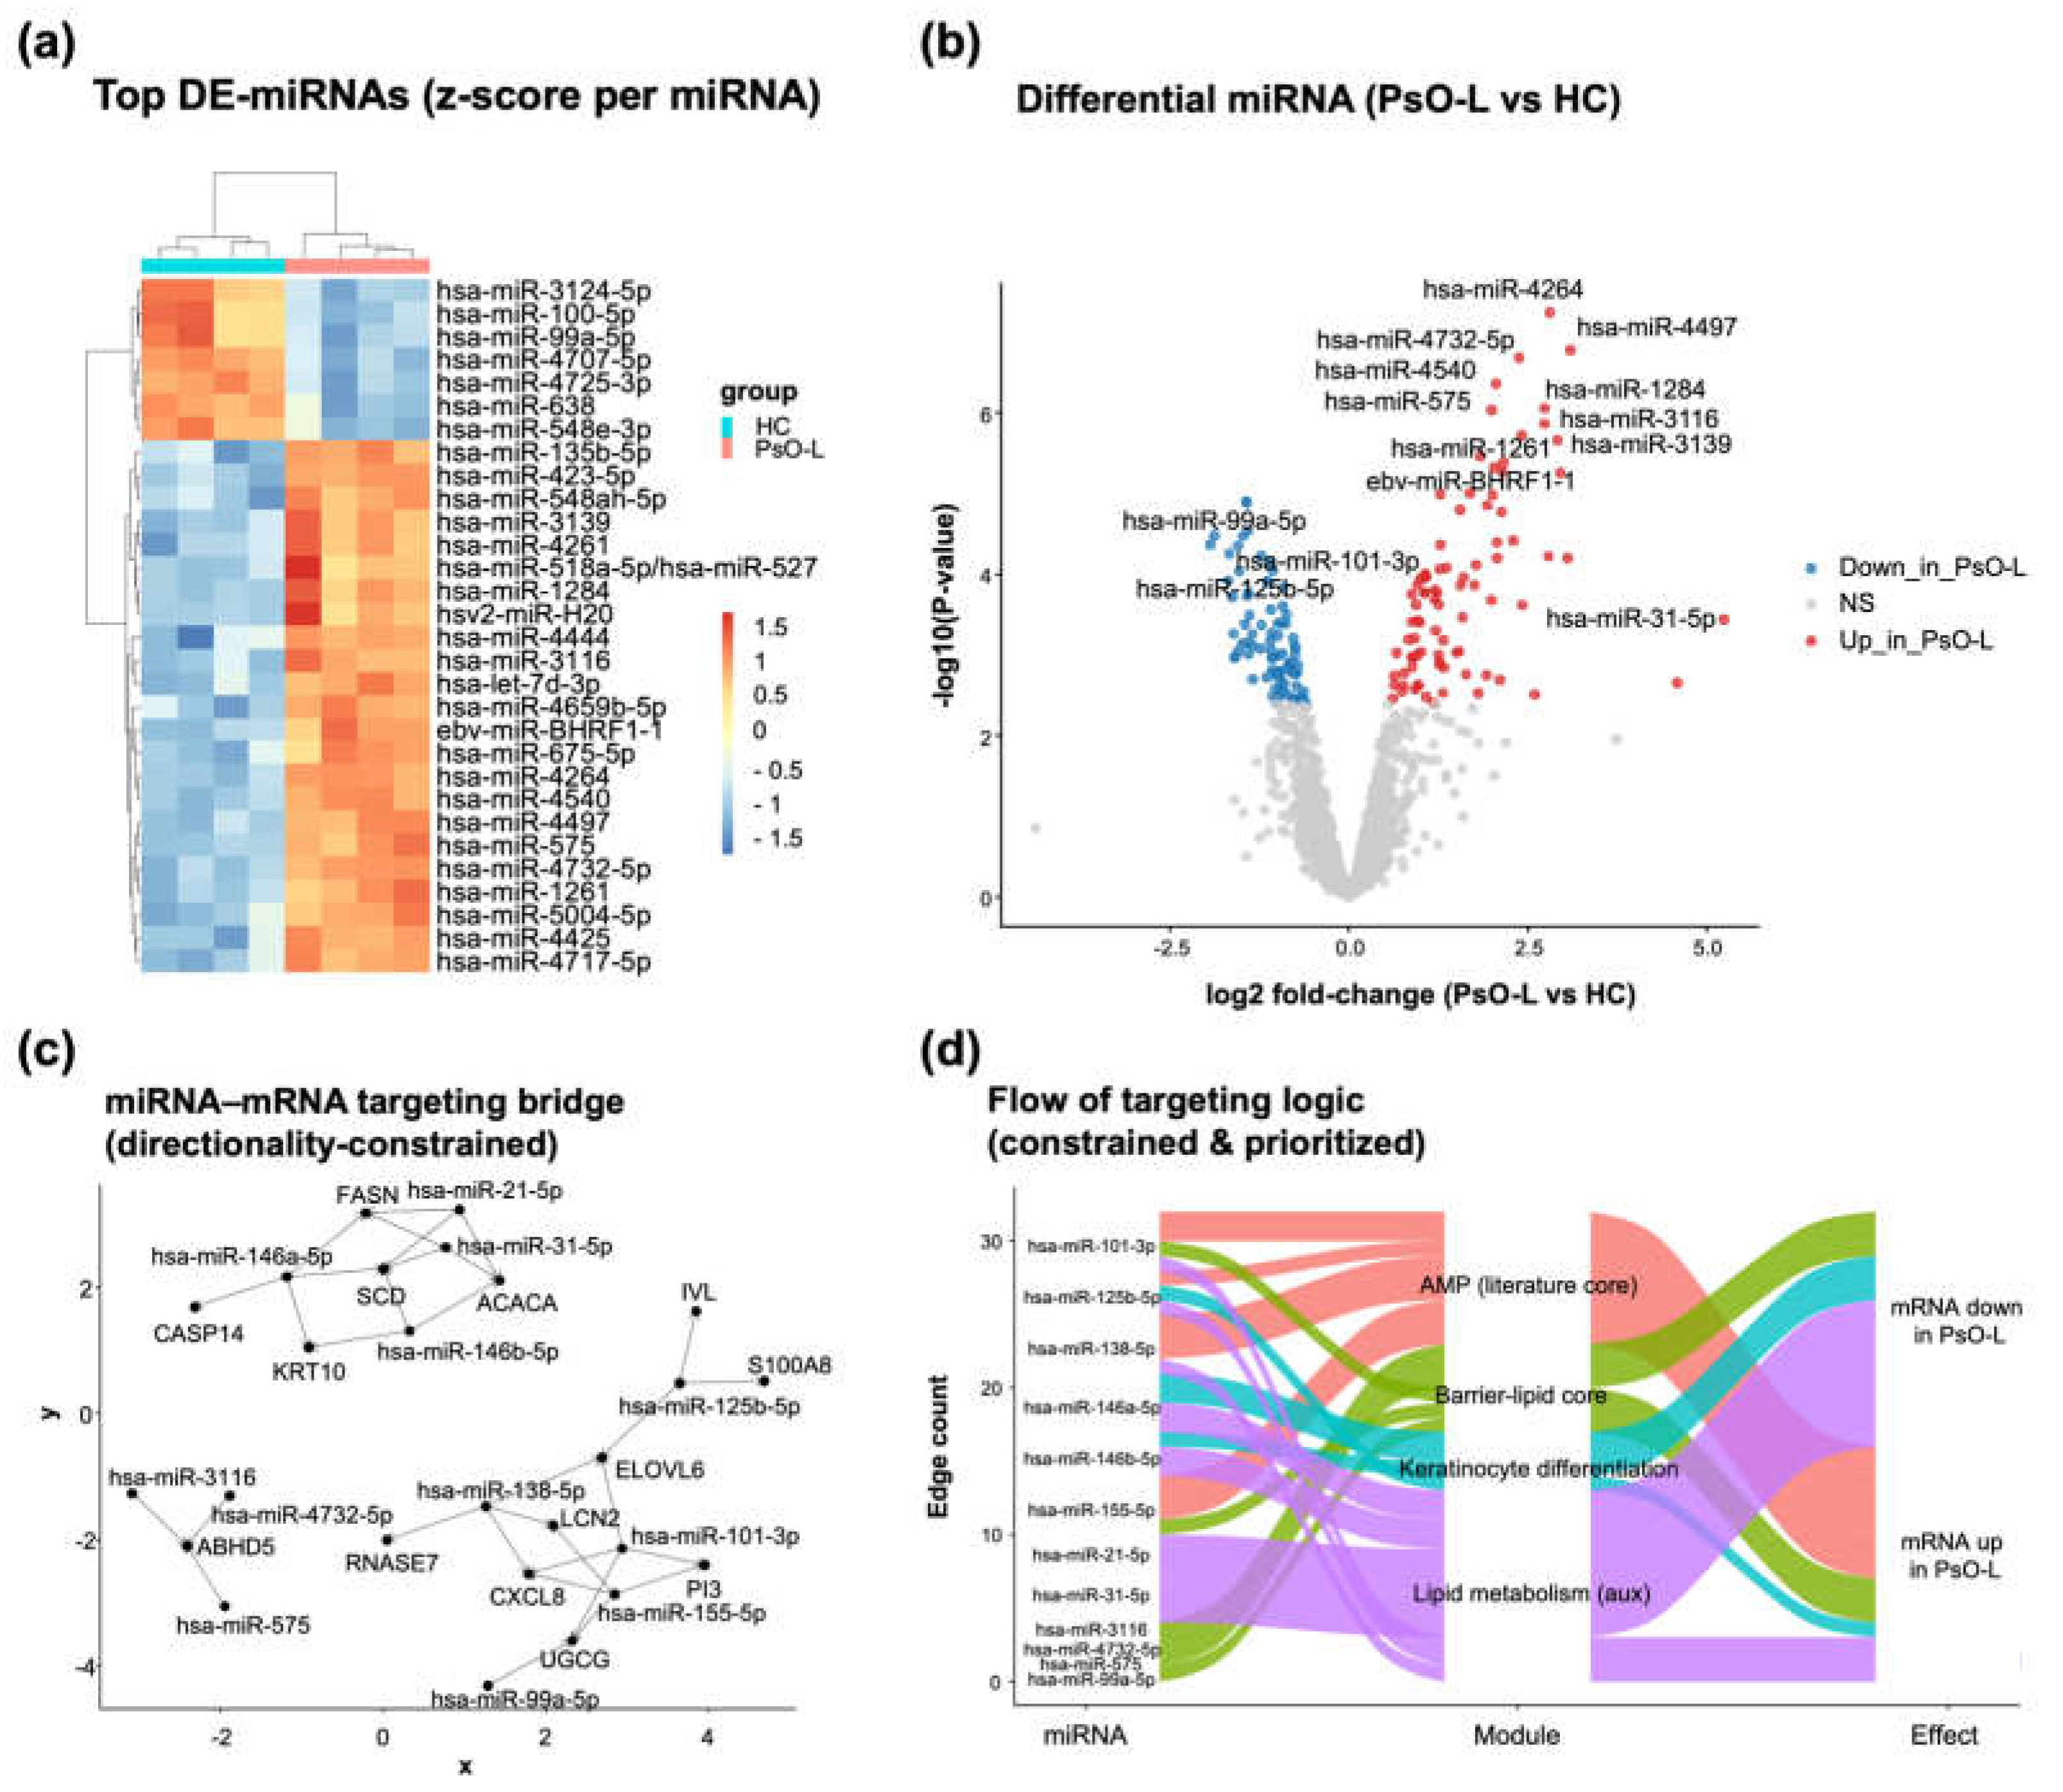
Figure 6.
Transcriptomic remodeling in psoriatic lesional skin highlights an inflammatory–proliferative program with altered metabolic axes, coordinated TF activity shifts, and immune-cell signature differences; (a) Differential expression volcano plot comparing PsO-L and AS-HC. The x-axis indicates log2 fold-change (PsO-L − AS-HC) and the y-axis indicates −log10(adjusted P value). Dashed lines denote the significance and fold-change thresholds used for DEG classification (|log2FC| ≥ 1 and FDR ≤ 0.05); (b) Heatmap of top differentially expressed genes (DEGs) across samples, visualized as row-wise z-scores. Genes are displayed as representative upregulated and downregulated sets in PsO-L relative to AS-HC; (c) Hallmark gene set enrichment analysis (GSEA) performed on a ranked gene list derived from differential expression results, summarized by normalized enrichment score (NES). Dot size reflects −log10(FDR), and direction indicates enrichment in PsO-L (positive NES) or AS-HC (negative NES); (d) Aggregated axis summary of Hallmark GSEA results, in which gene sets are grouped into predefined biological axes and summarized as axis-level NES values. In panel (d), asterisks indicate aggregated axes in which the median FDR-adjusted p value (padj) of the constituent Hallmark gene sets was < 0.05; (e) Transcription factor (TF) activity inference using DoRothEA regulons and decoupleR (weighted mean), reporting differential TF activity between PsO-L and AS-HC and visualizing top signals with effect size and FDR-based significance encoding; (f) Cell/immune enrichment scores estimated from bulk transcriptomes using MCP-counter and compared between AS-HC and PsO-L; group differences were assessed using the Wilcoxon rank-sum test with Benjamini–Hochberg FDR correction.
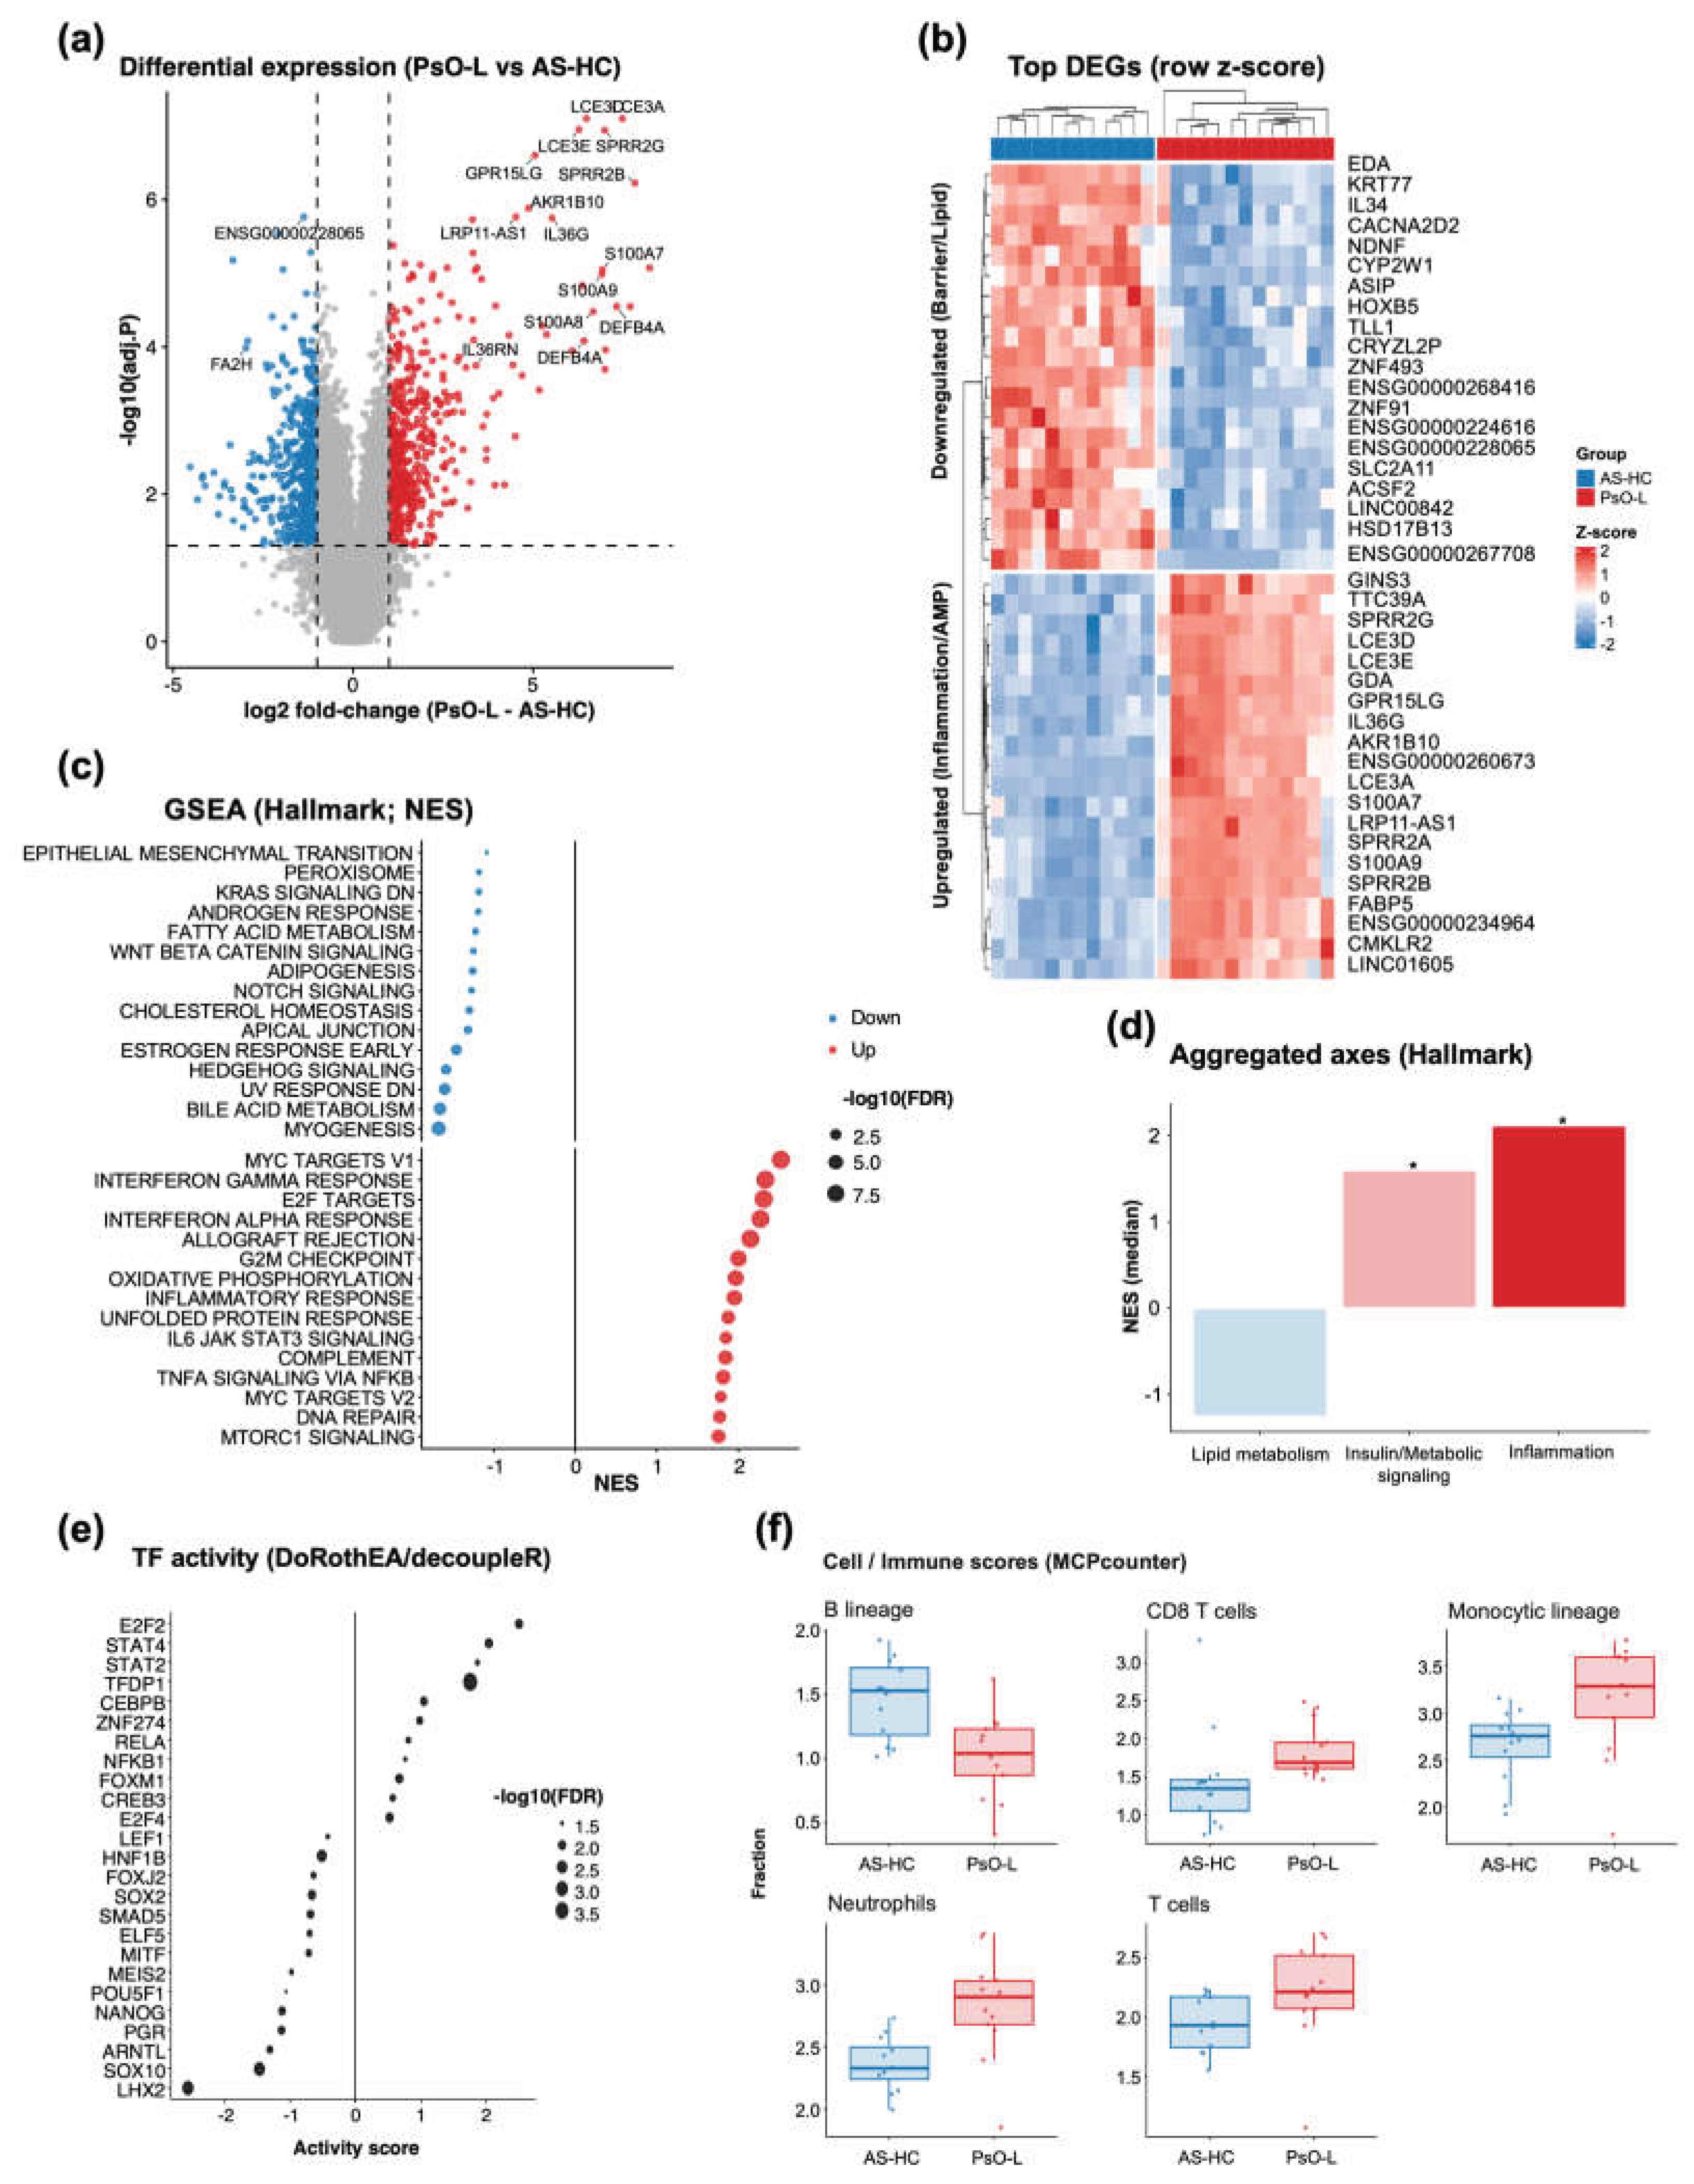

Table 1.
Summary of datasets and analytical outputs.
| Layer | Dataset | Omics/Platform | Groups used (n) | Key outputs |
| Gut microbiome | GSE239722 | Shotgun metagenomics |
HC (n=8), PsO-UT 1 (n=8) | Taxonomy; functional profiling (KEGG L2/L3, GO) |
| Systemic (PBMC) | GSE200376 | DNA methylation (EPIC 850K) | HC (n=19), PsO-PB 2 (n=20) | DMP/DMR; promoter focused enrichment |
| Systemic (CD8+ T) | GSE184500 | DNA methylation (EPIC 850K) | HC (n=9), PsO-CD8 3 (n=10) | Cell-type EWAS; DMP/DMR |
| Skin (miRNA) | GSE220586 | miRNA array | HC (n=4), PsO-L 4 (n=4) | DE-miRNA; target inference (TargetScan/miRDB) |
| Skin transcriptome | GSE186063 | Bulk RNA-seq | AS-HC 5 (n=12), PsO-L (n=13) | DEGs; AMP program; Immune/stromal deconvolution (MCP-counter) |
1 PsO-UT (GSE239722): untreated psoriasis samples labeled BT* were used. 2 PsO-PB (GSE200376): psoriasis vulgaris peripheral blood samples were used. 3 PsO-CD8 (GSE184500): CD8+ T-cell DNA methylation profiles from psoriasis patients were used. 4 PsO-L (GSE220586, GSE186063): psoriasis lesional skin samples were used. 5 AS-HC (GSE186063): healthy-appearing skin from patients with ankylosing spondylitis was used as a healthy control.
Disclaimer/Publisher’s Note: The statements, opinions and data contained in all publications are solely those of the individual author(s) and contributor(s) and not of MDPI and/or the editor(s). MDPI and/or the editor(s) disclaim responsibility for any injury to people or property resulting from any ideas, methods, instructions or products referred to in the content. |
© 2026 by the authors. Licensee MDPI, Basel, Switzerland. This article is an open access article distributed under the terms and conditions of the Creative Commons Attribution (CC BY) license (http://creativecommons.org/licenses/by/4.0/).
Copyright: This open access article is published under a Creative Commons CC BY 4.0 license, which permit the free download, distribution, and reuse, provided that the author and preprint are cited in any reuse.


