
Submitted:
06 February 2026
Posted:
12 February 2026
You are already at the latest version
Abstract
The article presents a case study of an event that occurred in Gdańsk, Poland, in 1994. During a rock concert at the old Gdańsk Shipyard Arena, a fire started. The audience was evacuated in a state of emotional agitation. This event resulted in the death of seven people and left many people injured, some of which had permanent injuries. This article presents the technical characteristics of the building where the event occurred and the event course. Based on the analysis of many source materials, the fire course as well as rescue and firefighting operations are described. The fire course was accurately recreated using computer simulations. Analyses conducted immediately after the event 30 years ago primarily concluded that all emergency exits being open would have been sufficient for the evacuation of the crowd in the building. A total of nine evacuation scenarios were simulated, the first of which was the recreation of the real event. In the other scenarios, the conditions were modified to investigate the impacts of the number of people and availability of emergency exits on the outcomes. As a result of the conducted research, the hypothesis regarding the recognition of blocked emergency doors as the main cause of death and injuries of the participants of the analysed event was questioned. The second issue that should be considered innovative was the description of the blocking pile phenomenon. An attempt was made to identify similar situations reported in the literature and elucidate this phenomenon.
Keywords:
evacuation
; emotional evacuation
; fire safety
; case study
1. Introduction
Live events provide an opportunity for analysing the evacuation safety of emotionally agitated people, which is particularly important because research experiments involving people in such a state are very difficult or impossible to conduct. Because of the tragic consequences of events involving a crowd stampede during an emotional evacuation [1,2,3], the analysis of such events to minimise their consequences is extremely important. Although previous studies have analysed real events—e.g., sports events [4,5] earthquakes [6,7] or religious festivals [8]—the evacuation of crowds from buildings has very rarely been reported. Moreover, the possibilities for analysing the evacuation of crowds from buildings are limited because of the scarcity and poor quality of available visual recordings. Because this topic will never be exhaustive, this study analysed an event that occurred in Gdańsk, Poland, in 1994. The event had tragic consequences, with two people dying at the scene and another five later in hospitals because of their injuries. Furthermore, 250 people required hospital treatment, and ~100 suffered permanent disabilities to varying degrees [9]. Previous analyses of this event [9,10,11] mainly focused in the actions of emergency services, and the assessment of the evacuation conditions inside the building was limited to the identification of blocked escape routes. More analyses were focused on the victims, specifically targeting their psychological conditions, treatment, and recovery [12]. However, the research potential of this event is much greater. The review of studies on real events suggests that inaccurately investigated events can reveal many interesting and unobvious observations when analysed again in depth. For example, analyses of The Who’s concert in 1979 proved that the 11 deaths were not caused by panic (as understood in a behavioural sense) but by crowd-inertia-induced trampling [13], suggesting that real events have the greatest cognitive potential for characterising the evacuation of emotionally charged crowd.
The source materials, mainly texts, relating to the 1994 event analysed herein are over 30 years old. As mobile phones were not in use at that time, extensive video footage of the incident is unavailable. However, although individual photos and videos are available, most of them are from before the fire started and after the evacuation, as per the reports regarding the firefighting operation. Although one short video from inside the hall—recorded just after the fire started—is available [14], extensive eyewitness statements were recorded and detailed press reports were published because the whole Poland was following the event at that time [12]. A thorough analysis of the eyewitness statements and other available material enabled a faithful reconstruction of the event course. This article discusses previously unpublished operational materials obtained and analyses conducted during the subsequent investigation of the event that are not widely described [15]. Unfortunately, there is not much comparative material available in the literature. As an example of a similar event, with a much higher number of fatalities, we can mention the fire in Brazil in 2013 [16]. Unfortunately, also in this case, research data that could be used for scientific purposes are not available, they focus rather on post-traumatic stress disorder [17] and the role of physiotherapy in the rehabilitation [18].
This article describes simulations of the evacuation process and potential consequences of a fire for the facility’s users under nine scenarios. Considering different number of peoples present, evacuation processes were simulated from the start of both the incident and the concert and by considering the maximum possible number of attendees. In addition, for each scenario, an evacuation process was simulated by assuming the availability of all emergency exits from the start of the incident. These analyses and simulations are anticipated to answer important research questions regarding the possible effects of fire for different conditions. These answers will be helpful in ensuring fire safety during such mass events in buildings. The author was primarily interested in the hypothesis proposed at that time: all escape exits being open would have been sufficient for the evacuation of the crowd in the building. This hypothesis was evaluated for nine scenarios. During the analysis of the incident, a very important observation was made, which was previously described in detail in the literature: a blocking pile was formed behind the emergency exit. It has been noted that a blocking pile occurs when a person in a moving crowd cannot maintain a upright position and starts to fall over. Subsequently, other people trip and fall over them, creating a blocking pile that grows to a height of ~0.5–1 times the height of the average person in the crowd. The space behind the last emergency exit was too small to enable the crowd to disperse in a direction parallel to the axis of the exit because a fence was separating the pavement from the railway track. The crowd pressure was so great that the crowd could not dissipate spontaneously in directions perpendicular to the axis of the exit. An attempt was made to identify similar situations reported in the literature and elucidate this phenomenon.
2. Event Description and Progression
2.1. Building and Event Characteristics
The Sports and Entertainment Arena building of the Gdańsk Shipyard was built in the 1920s and served an industrial purpose till 1956 before being converted into a sports and entertainment arena possessing a nominal capacity of 3,000 people; notably, even more people were admitted during boxing matches. The building comprised a one-storey, single-space hall and an adjacent two-storey office and staff area. The two-storey area and hall were made of brick and steel with brick-filled exterior walls, respectively. The roof, floor and grandstand structure were made of wood and roofing felt, wood and steel profiles, respectively. The seats in the tribunes were made of wooden slats, and the tribune structure was covered with wood-based panels, forming storage spaces underneath. The hall’s interior was equipped with a wooden stage, and fabric curtains divided the hall into sections. The hall’s dimensions were ~65 m × 31 m, and the height was 8.6–13.6 m. A simplified diagram of the building is shown in Figure 1.
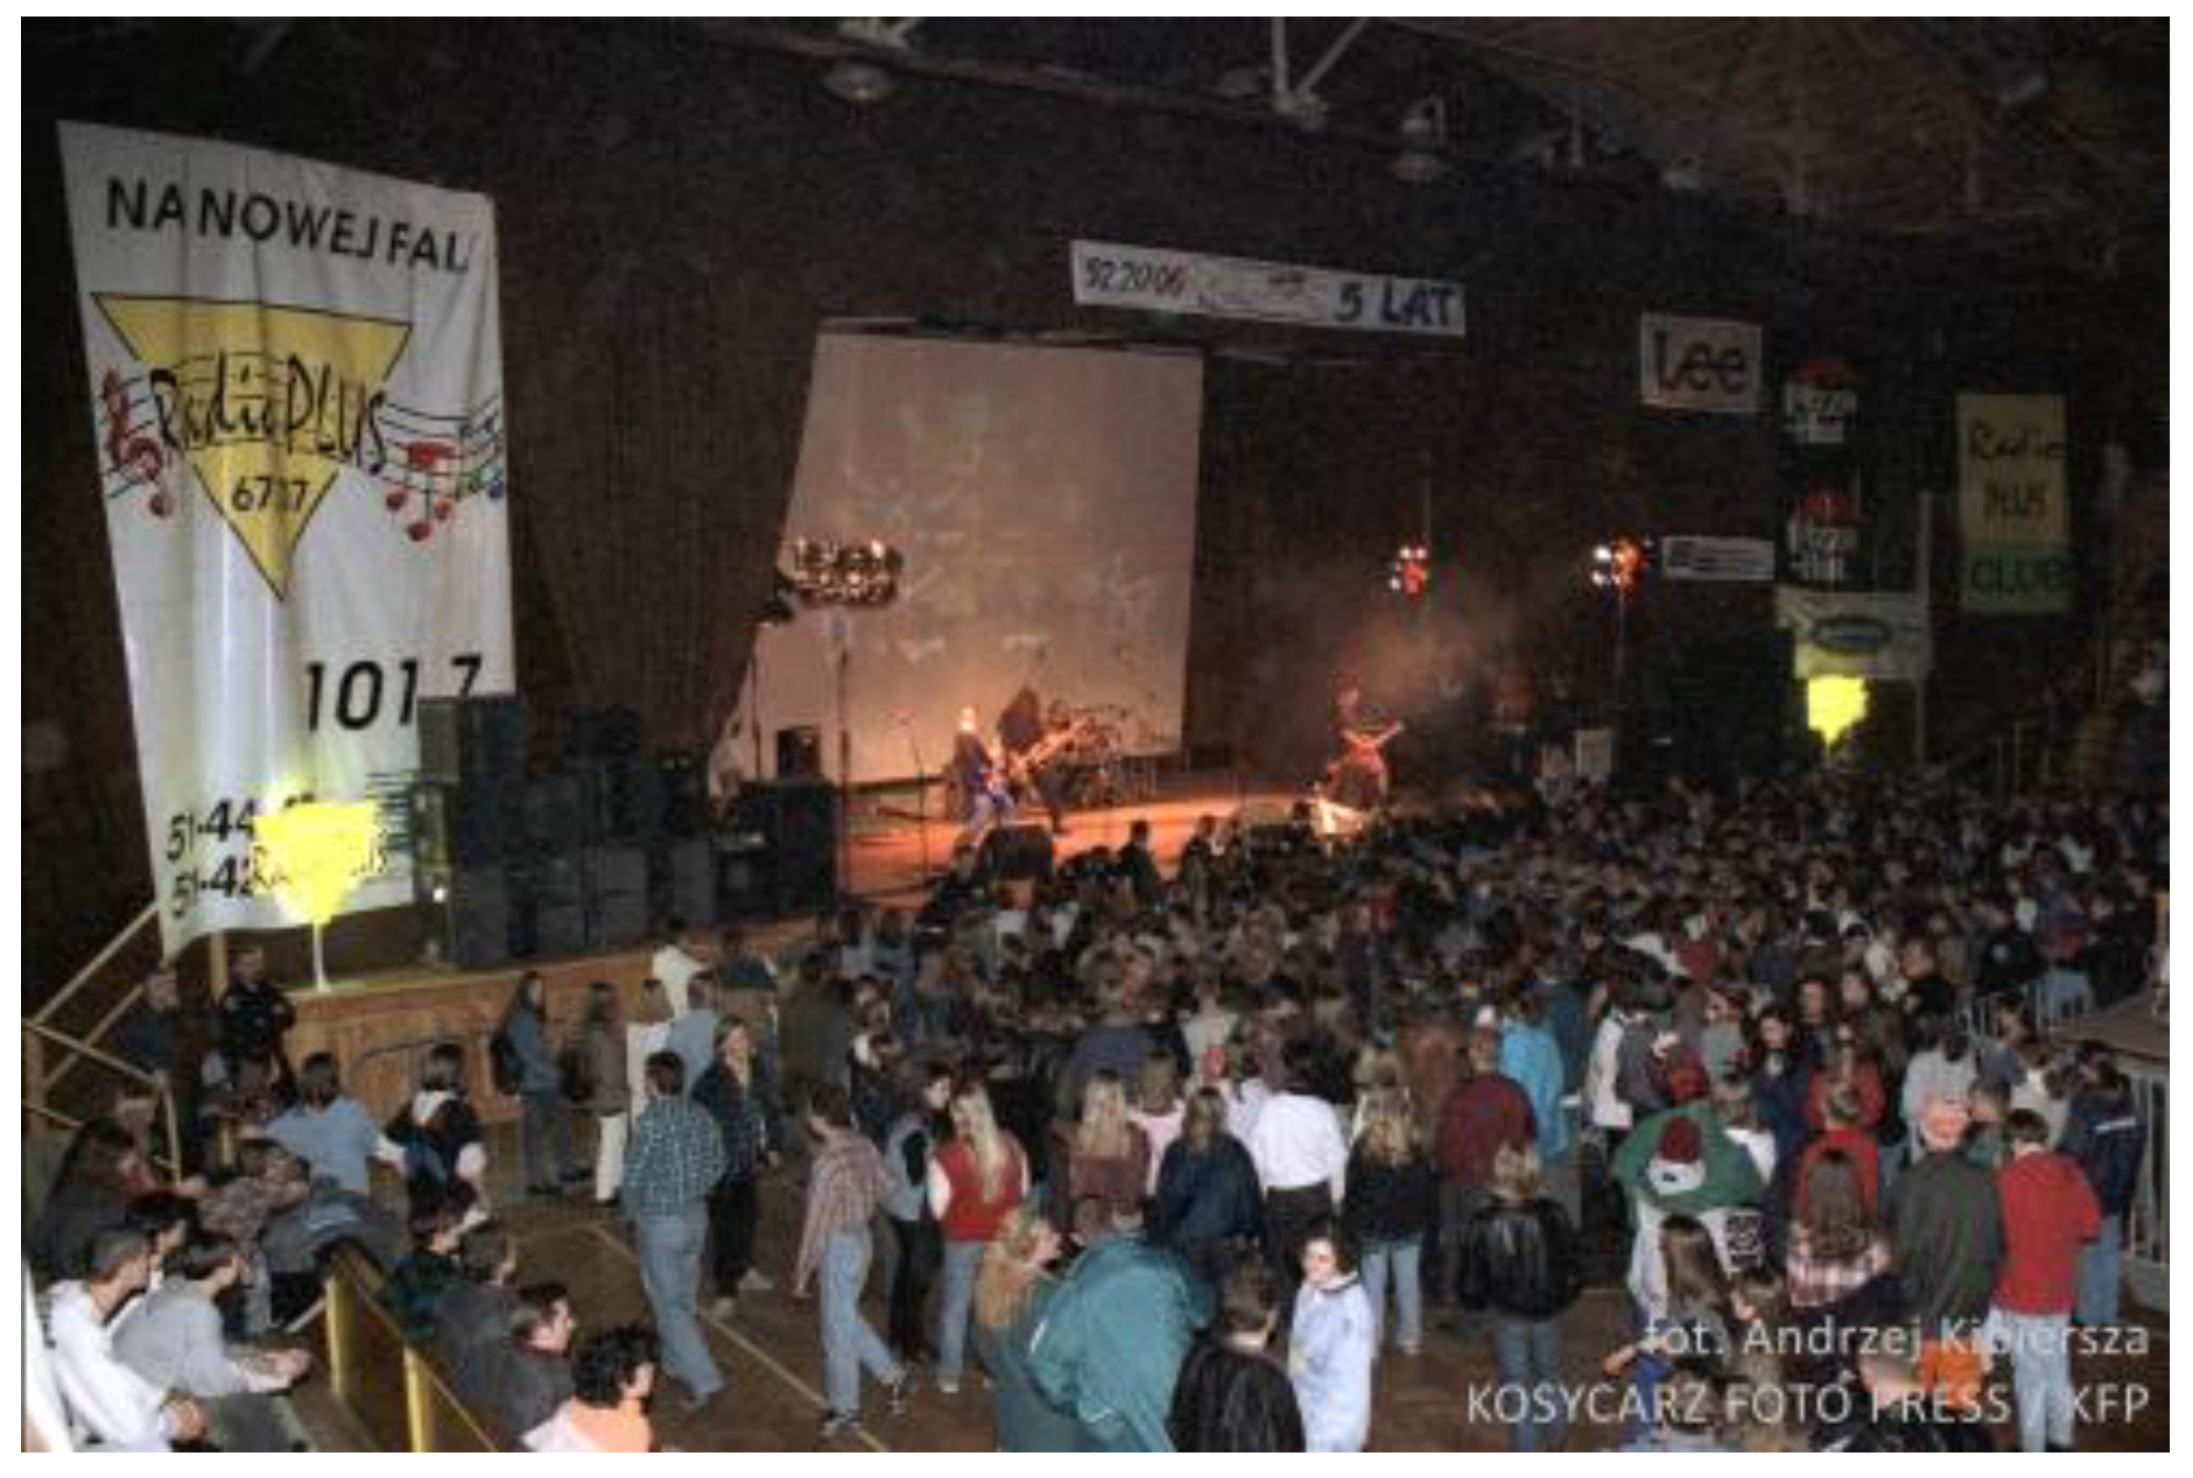
On 24 November 1994, an event, comprising a rock concert by the group Golden Life and a broadcast of the MTV award ceremony, was planned at the Sport and Entertainment Hall. According to various sources, at the time of the fire, the number of event participants in the hall ranged from 600 [9] to over 2,000 [11]. For various reasons, the number of participants is difficult to estimate.
Figure 2.
Interior of the hall during the rock concert before the fire started (Andrzej Kibersza/KFP).
Figure 2.
Interior of the hall during the rock concert before the fire started (Andrzej Kibersza/KFP).
2.2. Firefighting Operations
The concert lasted from approximately 19:00 until 19:45; then, the broadcast of the MTV award show began at 20:00. Some people left the hall during the break between the events. According to eyewitness statements [15], from approximately 20:40, the aromas of varnish and acetone were detected in the vicinity of tribune 2 (Figure 1), followed by smoke, and at approximately 20:54, a fire began to start of tribune 2, probably from plastic mattresses that had been set on fire and stored in a wooden compartment under tribune 2. Security and fire services attempted to extinguish the fire, but to no avail. At approximately 20:56, one jet of water was discharged from the onsite fire engine, with similar results. According to the film documentation, the fire developed dynamically, and the time from the moment the flames appeared on the tribune’s surface until the fire reached the height of the roof structure was approximately 70 s [15]. Notably, at the beginning of the fire, the gathered crowd of young people did not realise the danger [12], some were watching the fire (Figure 3), while others were still playing on tribune 2.
Approximately 60 s after noticing the fire, the concert staff used the sound system to call for calm and then for the people to leave the building through the main exit onto Jana z Kolna Street. At approximately 20:56, support was requested from the Gdańsk Shipyard Company Fire Brigade, located near the scene of the incident. Units of the city’s State Fire Service were also deployed. At approximately 20:58, three fire engines from the service arrived at the scene and began extinguishing the fire from the shipyard side. Shortly, the firefighters operating the city’s fire engine (from Jana z Kolna Street) recognised the situation and decided not to extinguish the fire but to immediately start the evacuation by unloading the body pile located on the pavement in front of the main entrance.
Using specialised equipment, the firefighters tried to cut through the bars closing the two pairs of emergency exit doors and dismantled the fence in front of the main emergency exit. At approximately 21:10, according to eyewitnesses, ‘an explosion occurred, which licked flames at faces, hands and legs, taking away hair and eyebrows’. A thorough analysis and reconstruction of the fire course confirmed that at that time, a flashover, possibly a backdraft, occurred.
Only after the last people had been evacuated from the area near the main emergency exit, at approximately 21:14, was the firefighting operation started from Jana z Kolna Street (Figure 4), when the hall’s roof collapsed.
The report on the end of the main fire-extinguishing operations inside the hall was sent at 23:00. The overall fire-extinguishing operation, comprising extinguishing the fire in the administrative part of the building and securing operations, lasted until the morning hours, and control over the burnt area was returned to the building’s owner at 07:27. The images of the burnt area and ruins of the hall are shown in Figure 5 and Figure 6, respectively.
2.3. Reconstructed Fire Development Course
In an expert opinion prepared for the investigation, the fire development course was reconstructed in detail as a mathematical–physical model [15] as follows.
The analysed fire development course was divided into the following phases:
- Phase 1 (0–4 min): A ‘latent’ fire started and developed under the tribune.
- Phase 2 (4–20 min): The fire started on the tribune surface and flared.
- Phase 3 (20–23 min): The hall roof caught fire and collapsed.
By assuming that the state parameters of the cold layer remained constant, a typical zonal model was adopted to describe the development of the internal fire. Energy and mass equations were formulated for a two-layer internal fire model. The convection zone was not considered because it was treated as a mass and energy carrier. The adopted model is described in available literature [15,20].
The following fire parameters are considered herein:
- 1)
- Room dimensions:
- ∙
- Length: 65.0 m
- ∙
- Width: 31.5 m
- ∙
- Height: 12.0 m
- 2)
- Material data:
Roof
- Specific heat: 2.720 J kg−1 K−1
- Density: 550 kg m−3
- Thermal conductivity: 0.200 W m−1 K−1
- Blackness level: 0.60
Walls
- Specific heat capacity: 838 J kg−1 K−1
- Density: 1.580 kg m−3
- Thermal conductivity: 0.461 W m−1 K−1
- Blackness level: 0.85
Flammable material
Combustion heat: 12.2 MJ kg−1
Fire velocity: 0.020 m s−1
Specific mass burn rate: 0.014 kg m−2 s−1
Amount of solid smoke particles generated from 1 kg of the flammable material: 0.014 kg kg−1
Volume of combustion products formed after burning 1 kg of the combustible material: 3.99 m3 kg−1
Volume of air needed to burn 1 kg of the combustible material: 3.54 m3 kg−1
Specific smoke optical density: 300 m2 kg−1
Fire data:
Distance from the fire’s origin point to the north wall: 5.0 m
Distance from the fire’s origin point to the western wall: 32.0 m
Height above the floor at the combustible material’s lower edge: 0.0 m
Height above the floor at the combustible material’s upper edge: 4.5 m
Weather conditions:
Air temperature: 293.0 K
Wind direction: 0o
A comparative analysis of the calculated parameters and those reported in the operational documentation of the rescue and firefighting operation course [12] as well as eyewitness statements of the event timeline showed that the reconstructed fire course faithfully reflected the parameters of the actual fire course. Therefore, a reconstruction of the fire course using currently available, more complex computer models was not attempted. The data obtained from the model developed at that time [15] were then used for further evacuation analyses.
3. Evacuation
The building comprised a one-storey hall and an adjacent two-storey office and staff area on the south side (Jana z Kolna Street). To exit the hall through the main emergency exit, the corridor in the office and staff building must be traversed (Figure 1, Figure 8 and Figure 10). Figure 8 shows a diagram of the emergency exit routes.
According to statements from participants and rescuers and collected source material, when the evacuation was announced, most people (out of approximately 1500) had already left the event, and approximately 600 people remained inside the hall, approximately half of which safely evacuated, while the other half was trapped near the hall’s main exit and could not leave. The first visible signs of the fire were noticed at approximately 20:54 [12,15]. Notably, at the beginning of the fire, the gathered crowd of young people did not recognise the danger [12,14]: some observed the fire (Figure 3), while others ignored the danger.
At approximately 20:55, the concert staff used the public address system to make an announcement asking people to remain calm and leave the building via the main exit onto Jana z Kolna Street. Some people listened to the staff’s instructions and began to evacuate (20:55). At that time, because of the failed attempts to extinguish the fire, the smoke and high temperature became increasingly severe; however, even with all the emergency exits blocked, the people leaving the hall could still evacuate smoothly.
The analysis of the main escape route from the hall towards Jana z Kolna Street (the only escape route used), revealed the following groups of doors en route (Figure 8):
- Three pairs of swinging doors from the hall to the atrium (A), comprising a 2.9-m-wide central door (2) and two pairs of 1.5-m-wide side doors (1) and (3). All these doors were open. The closed doors (1) and (2) are shown in Figure 9;
- Three pairs of swinging doors from hall (A) to hall (B), comprising a 2.95-m-wide central door (5) and two pairs of 1.6-m-wide side doors (4) and (6). The outer and central doors were open and closed, respectively;
- Three pairs of lattice doors from the vestibule (B) to the building’s exterior, comprising a sliding and folding 2.5-m-wide central door (8) and two pairs of sliding 1.5-m-wide side doors (7) and (9). The central and side doors were open and closed, respectively.
The vestibules possessed different heights, with five and three steps up and down in vestibules (A) and (B), respectively (the vestibular cross-section is shown in Figure 10).
At approximately 20:57, the lights went out, drastically changing the evacuation. In addition to the severely limited visibility, the fire was already noticeably impacting the people, causing them to panic. The situation was exacerbated by the limited flow of people through the partially blocked emergency exits, producing congestion. At this stage, the greatest crowd pressure and lack of movement were in front of the blocked doors (7) and (9). According to a report from a rescuer in the unit that arrived at the scene at 21:02: ‘The side bars on the left and right are locked in a way that prevents them from being opened. The hands of those trapped in the entrance hall are sticking out of the bars, calling for help’ [12]. At that time, a phenomenon not previously described in detail in the literature was developing behind the main emergency exit (8). Exiting through the open main external door (8) did not guarantee safety and, even worse, could have caused additional injuries. Before exiting, ‘between the hall and the fence by the railway track, there is a pile of people, about 3 bays wide, entangled in several layers. There are approximately 70 people in the pile’, according to a report from a rescuer in the unit that arrived at the scene at 21:02 [12]. Ultimately, with inadequate space behind the emergency exit, the crowd could not unload the blocking pile on its own (Figure 11 and Figure 24).
The people stuck in the jam near the main evacuation exit could not free themselves from the crowd in any direction. This situation required immediate intervention by the firefighters, who were the first to arrive at the scene. They did not start extinguishing the fire; their actions were focused on freeing the people trapped in front of the building and, consequently, in the vestibule (B). The firefighters tried to cut the grates blocking exits no. (7) and (9) and dismantle spans (10), (11) and (12) of the fence separating the sidewalk from the tracks (Figure 11). In this direction, work began at approximately 21:03. The first task was only partially effective: Although a few rods could be bent, the second task was successfully implemented. After the spans were removed, the body tangle partially slid onto the tram tracks, which somewhat relieved the pressure around the main exit from the building [10]. A view of the external lattice, emergency exit door and removed fence panels is shown in Figure 12.
While the tangled crowd was being unloaded outside and inside the building, a flashover occurred at approximately 21:10. Although eyewitnesses described it as an explosion [12], an analysis [15], determined that it was a flashover, possibly a backdraft. This phenomenon caused many people to suffer burns to their hands and heads in addition to the physical injuries (bruises and fractures) typical of such events [22]. The hall’s exit was cleared at approximately 21:12, and the evacuation was completed shortly thereafter, just before the roof collapsed (at approximately 21:14).
The following evacuation timeline is shown in Figure 13:
- 1)
- 20:55: (0 s) The evacuation started and was proceeding smoothly;
- 2)
- 20:57: (120 s) The lights went out, the evacuation area was congested and the evacuation routes were blocked;
- 3)
- 20:59: (240 s) A critical condition was satisfied when the temperature exceeded 60 °C;
- 4)
- 21:03: (480 s) Firefighters started to support the evacuation;
- 5)
- 21:06: (660 s) Another critical condition was satisfied when the smoke layer descended below 1.8 m above the floor;
21:10: (900 s) A flashover occurred;
- 6)
- 21:12: (1020 s) The hall’s exits were clearing;
- 7)
- 21:13: (1080 s) The evacuation ended;
21:14: (1140 s) The hall’s roof collapsed.
Two people died in the fire: a young girl who was trampled in the vestibule (A) in front of the blocked door (5) (Figure 8) and a journalist who returned to the building to retrieve his equipment and was crushed by the collapsed roof. Five more fire victims died later in the hospital because of their injuries. Two-hundred-fifty people required hospital treatment, including everyone who was stuck in the blocking pile.
4. Evacuations Simulated Under Different Conditions
4.1. Scenarios and Methods
The analysis of alternative scenarios aimed to utilise the information about the actual event course to improve safety conditions and prevent similar future tragic events. Eyewitness statements and the reconstruction of the fire course enabled the precise determination of conditions critical for evacuation (points 3 and 5 in Figure 13). Nine scenarios were examined: a reference scenario that actually occurred and eight hypothetical scenarios that could have happened. The findings can help to not only analyse evacuation safety during mass evacuations in buildings but also consider possible legislative changes.
During the event that occurred on 24 November 1994, ~1,500 people were in the Gdańsk Shipyard Arena at the peak attendance of the concert (scenarios 3a, 3b and 4), and ~600 people were in the arena during the evacuation (scenarios 1a, 1b and 2). However, >3,000 people had previously been allowed into the same arena during various sporting events. Therefore, the last three scenarios (scenarios 5a, 5b and 6) of the evacuation were simulated considering 3,000 people present. In these scenarios (5a, 5b and 6) the course of the fire from the actual event was assumed for analysis, even though there is no evidence that in the case of another type of event, it would have been similar to the one in the analysed event (occurrence of critical evacuation parameters at the same time in all scenarios). The reason for this assumption is that the stands where the fire started remained in the building during each type of event.
Characteristics of the simulated scenarios (below and in Table 2):
- (1a) The reference scenario reflecting the exact conditions at the time of the incident (600 people), where a blocking pile is formed;
- (1b) A scenario reflecting a hypothetical situation at the time of the incident (600 people), where no blocking piles are formed;
- (2) A scenario reflecting a hypothetical situation at the time of the incident (600 people), where all evacuation exits are open;
- (3a) A scenario reflecting a hypothetical situation at the concert (1500 people), where a blocking pile is formed;
- (3b) A scenario reflecting a hypothetical situation at the concert (1500 people), where no blocking piles are formed;
- (4) A scenario reflecting a hypothetical situation at the concert (1,500 people), where all evacuation exits are open;
- (5a) A scenario reflecting a hypothetical situation wherein the building reaches its maximum audience capacity (3,000 people), with two main evacuation exits being open;
- (5b) A scenario reflecting a hypothetical situation wherein the building reaches its maximum audience capacity (3,000 people), with two main evacuation exits being open and no blocking piles being formed;
- (6) A scenario reflecting a hypothetical situation wherein the building reaches its maximum audience capacity (3,000 people), with all evacuation exits being open.
It should be noted that scenarios 5a, 5b and 6 do not have a clear scientific character in this case. In contrast to the other scenarios, where real conditions are analysed, in these three cases the evacuation of a larger number of people than those who were in the building on the day of the event is analysed. These studies were conducted for hypothetical scenarios that could have taken place at a different type of event (sports), so they could have been accompanied by a different course of fire (critical evacuation parameters could have occurred at a different time). However, conducting these evacuation scenarios (5a, 5b and 6) was necessary in order to answer the question of whether the thesis of the then investigators is true. It stated that the main cause of the tragic consequences of the fire was the obstruction of all evacuation exits.
Each scenario was simulated 10 times (90 scenarios were simulated in total), and for each scenario, the results are reported for the average of the 10 simulations.
The pedestrian reaction curve in Figure 14a was based on data from a real event. About 25% of the participants started evacuating within the first 60 seconds by themselves. The rest were either passively watching the fire start or were not interrupting the fun. After about this time, the staff called the participants to evacuate, which increased the number of people starting to evacuate. After 120 seconds from the start of the fire, the lights went out, which caused a sudden call to evacuate all the remaining participants at the same time. The distribution of evacuation times shown in Figure 14b concerns scenarios 5a, 5b and 6, i.e., hypothetical events that did not occur in reality. It was not possible to obtain experimental data and therefore a lognormal distribution was adopted, which is typical for this type of research.
The evacuations were simulated using the Pathfinder agent-based software, developed by Thunderhead Engineering [23], for simulating human movement and widely used to analyse and design safe evacuation plans for various buildings, such as commercial high-rise buildings [24], metro stations [25], schools and universities [26] and shopping centres [27]. In Pathfinder, the pedestrian velocity settings in the scenarios included the following factors: set maximum speed, area type, terrain corrections and pedestrian density in the room [26].
For analysing people’s movements, Pathfinder offers the Society of Fire Protection Engineers (SFPE) and control modes. The SFPE mode implements concepts found in the Engineering Guide for Human Behaviour in Fire [28] and reflects a flow model where the density of the people in a room determines the walking velocities and the door width controls the flow through doors. The steering mode is based on inverse steering behaviour. The routing behaviour was first presented by Craig Reynolds [29] and then transformed into the inverse routing behaviour by Héni Ben Amor [30]. Pathfinder’s routing mode enables the natural occurrence of complex behaviours as a by-product of traffic algorithms, eliminating the need to calculate the congestion and density of open doors [31]. This study used the control mode because under the conditions of crowding and queuing at exits, the flow through the door is not solely controlled by the door width (as in the SFPE mode).
The parameters adopted for the simulation using the Pathfinder program, in scenarios 1a, 1b, 2, 3a, 3b and 4 were determined based on real data from the event (reaction times, preferences for choosing evacuation exits) and on the basis of literature data implemented in the program [28] (speed of movement, specific flow). In scenarios 5a, 5b and 6, all parameters come from literature data implemented in the program [28], because they refer to a hypothetical event.
The problem related to simulating the blocking pile phenomenon in scenarios 1a, 3a and 5a was solved by analyzing and using data obtained from the actual event in Gdańsk. As a result of the conducted investigation activities, a fairly accurate timetable of the event was created, so there is information available on how many people were blocked, when the phenomenon occurred, when it began to be relieved by the rescue services and when it was finished. The data analysis shows that the relief of the blocking pile by the rescue services lasted at a rate of about 0.65 people per second and such data was adopted to run the scenarios. It should be noted that the rate of relief of the blocking pile will be different for different conditions, such as the covered area, the number of rescuers, access restrictions. Determining the relationship between these conditions and the rate of relief of the blocking pile requires further research.
4.2. Series 1: Scenarios 1a, 1b and 2
In scenarios 1a, 1b and 2, the simulations included the number of people present at the moment of the actual event (600). Scenario 1a is a reference scenario that reproduces the real event. Scenarios 1b and 2 are hypothetical scenarios that could have happened, where no blocking piles are formed and all emergency exits are open, respectively.
Figure 15 shows that in the scenarios where no blocking piles are formed (1b) and all emergency exits are open (2), the evacuation times (309 and 220 s, respectively) are much shorter than the evacuation time (1080 s) in the reference scenario (1). In Figure 15, the curve for scenario 1a consists of three segments. The first segment (from 0 to 150 s) is the evacuation until the blocking pile occurs. The second segment is the horizontal line between 150 and 480 s caused by the formation of a blocking pile behind the main emergency exit (WE-5), which stopped the evacuation. The third segment (after 480 s) is the unloading of the blocking pile by the rescue services at a rate of about 0.65 persons/s (actual data).
4.3. Series 2: Scenarios 3a, 3b and 4
Scenarios 3a, 3b and 4 refer to the situations that could have occurred at the rock concert when 1500 people were present. The other conditions remain the same as that in series 1. In particular, scenario 3a assumes the formation of a blocking pile, scenario 3b assumes evacuation without the formation of a blocking pile, and scenario 4 assumes that all emergency exits are open.
The simulated evacuation profiles in scenarios 3a, 3b and 4 are shown in Figure 16. The general result was the same as that for the first series of simulations. In scenarios 3b and 4, where no blocking piles form, the evacuation times were much shorter (755 and 405 s, respectively) than that (2444 s) in scenario 3a, where a blocking pile is formed. Among all the analysed scenarios, scenario 3a showed the longest average evacuation time. This is particularly noteworthy because scenario 3a is similar to the actual event and would have happened if the fire had occurred an hour earlier. The findings show that at the moment the roof collapsed, ~800 people would still have been inside the building. Notably, the graphs do not show people’s locations in the building, which are quite important in the analysis and therefore will be discussed in Section 4.5. In Figure 16, the curve for scenario 3a consists of three segments. The first segment (from 0 to 150 s) is the evacuation until the blocking pile occurs. The second segment is the horizontal line between 150 and 480 s caused by the formation of a blocking pile behind the main emergency exit (WE-5), which stopped the evacuation. The third segment (after 480 s) is the unloading of the blocking pile by the rescue services at a rate of about 0.65 people/s (actual data). The second and third segments are identical to the phenomenon that occurred in scenario 1a (Figure 15), but there were a much larger number of people to unload.
4.4. Series 3: Scenarios 5a, 5b and 6
Scenarios 5a, 5b and 6 (Figure 17) concern the building’s maximum audience capacity, which, according to available sources, could have been over 3,000 people. This assumption forced further changes in the scenarios because a different event had to be analysed (without a curtain and with additional stands available). In these scenarios, at least two evacuation exits were assumed to always be open. Additionally, at exit WE-4, a blocking pile forms in scenario 5a, no blocking piles form in scenario 5b, and all the evacuation exits are open in scenario 6.
In Figure 17, segments can be distinguished for all three curves. In scenario 5a, the first segment (up to 210 s) is the time of free evacuation until the formation of a blocking pile. The next point (350 s) is the end of using exit WE-2, evacuation is possible only through WE-5, where a blocking pile has occurred (evacuation halted). Then the rescue services start to unload the blocking pile (480 s). In scenario 5b, the division into two segments occurs at 350 s, where the evacuation slows down, because evacuation is possible only through exit WE-5 (through exit WE-2 all the people who chose it have already left). In scenario 6, the division into segments occurs at 210 s, where the evacuation slows down because evacuation is only possible through exits WE-4, WE-5 and WE-6 (all the people who chose them have already exited through exits WE-1, WE-2 and WE-3).
Although the event analysed in these scenarios is different from the actual event in 1994, the results of this study confirm the previously observed rules. The worst-case scenario occurs when a blocking pile is assumed to form, and not all the emergency exits are open (scenario 5a, evacuation time = 2327 s). In the other scenarios, the evacuation times are substantially shorter: Assuming no blocking piles form (scenario 5b), the evacuation time is 547 s. When all the emergency exits are open but with a different distribution of escape route choices (scenario 6), the evacuation time is 610 s. Notably, among these scenarios, the worst-case scenario means two emergency exits are open instead of one. In these and the previous scenarios, the first assumption is that the evacuees could not change their choice of the escape route after 120 s from the fire’s outbreak because by then, the light had gone out, and the other exits were not visible. The second assumption was a change in the distribution of the escape route choices. In scenarios 5a and 5b, the north–south distribution was 50:50, while in scenario 6, it was 30:70. The following assumptions were also made to search for non-intuitive observations:
- The evacuation time in scenario 6 was longer than that in scenario 5b, even though more emergency exits were open in scenario 6. The distribution of the evacuation direction choice (especially when the choice cannot be changed during evacuation) substantially impacted the evacuation time. This indicates that when designing emergency exits for large rooms, the principle of the even distribution of emergency exits around the room’s perimeter should be applied.
- The evacuation course (shape of the graph) shows two characteristic dips at 200 and 350 s in scenarios 6 and 5b, respectively. These breaks (slowing down of evacuation) are because of people queuing at one emergency exit since people have already evacuated through the other exits (this applies to people who have chosen an emergency exit other than the main one).
4.5. Scenario Summary
For each scenario, the distributions of the people at 0, 240, 660 and 900 s (Figure 18, Figure 19, Figure 20 and Figure 21, respectively) are presented to enable a deeper analysis by visualising the locations of the people awaiting evacuation from the building. This is important in the analysed case because the worst conditions occurred in the main hall, where critical parameters occurred the fastest. During the actual evacuation, people remained in a jam in the evacuation corridor on the south side (from Jana z Kolna Street). This corridor was directly connected with the outside area and was therefore a fresh-air channel, which limited the negative effects of fire in this area.
Time = 0 s
Figure 18 shows the situation at the beginning of the evacuation. Scenarios 1a, 1b and 2 concerns 600 people, i.e., the situation at the time of the actual event. In these scenarios, 500 people were at the floor level and 100 people were in the stands. Scenarios 2a, 2b and 3 concern the situation before the event, from when the rock concert was ongoing, and 1500 people were in attendance, with 1,250 people at the floor level and 250 people in the stands. Scenarios 5a, 5b and 6 concern a hypothetical event that could have happened at a different time, where the hall was not divided by a curtain, and a maximum of 3,000 people were present. The distribution of the people was 2,500 at the floor level and 500 in the stands.
Time = 240 s
Figure 19 shows the situations in the scenarios at the 240th s of the fire, i.e., when the critical temperature of 60 °C was exceeded in the hall space. In scenarios 1a, 1b and 2, all the people have managed to leave the hall (not the building), i.e., the most dangerous area, by this time. In scenario 2 (where all the emergency exits were open), all the people have left the building, and in scenario 1b (where no blocking piles formed), the evacuation proceeded smoothly. In the real scenario (1a), a visible blocking pile formed. Scenarios 3a, 3b and 4, containing more people, show worrying observations. Only in scenario 4, i.e., with emergency exits open, are all the people outside the hall space, in the escape corridors on the south side. In both scenarios 3a and 3b, numerous people are exposed to the critical temperatures inside the hall.
Scenarios 5a, 5b and 6 also revealed worrying observations. In all the scenarios, numerous people remained in the hall, exposed to high temperatures. In the investigation immediately following the actual event, the assumption that the building was safe if all the emergency exits were open is not true. Even with all the emergency exits open, the building was not safe in the event of a large crowd gathering, and a fire would have resulted in casualties anyway.
Time = 660 s
The situation after the smoke layer has dropped to below 1.8 m (660 s) in the hall is shown in Figure 20.
In scenario 1a, the blocking pile is still visible. In scenarios 1b and 2, all the people who could leave have already left the building. In scenario 3a, the blocking pile still prevents a smooth evacuation. In scenario 3b, all the people have already left the hall, and some are still in the evacuation corridor. In scenario 4, the evacuation was completed after 405 s, and no people who could move remained inside the building. In scenario 5a, all the people who chose the north exit have clearly left the building at 660 s, and the blocking pile is still preventing people from leaving the building via the south exit. In scenario 5b (two escape routes, north and south, are open), all the people who could move have already left the building at 547 s. The same situation applies to scenario 6, where the evacuation ends after 610 s.
Time = 900 s
At 900 s, a flashover occurred in the building. The situation at that moment is shown in Figure 21. At that time, in scenarios 3a and 5a, where blocking piles had formed, people still remained in the building. In reality (scenario 1a), however, no people remained inside the hall at 900 s, and flames (according to eyewitness statements) appeared in the south-side evacuation corridor’s upper part and burned many faces and hands. In scenarios 3a and 5a, people remained in the hall space, suggesting that the injuries would have been much more numerous and severe, including many fatalities.
5. Discussion and Conclusions
An extended case study analysis enables conclusions to be drawn and directions for further research to be determined. Although the 1994 event itself caused fatalities, it should be considered as rather mild compared to similar events. Eleven people were killed due to trampling at a The Who concert in 1979 [13], even without a fire. In Gdańsk, several circumstances combined to prevent the number of casualties from being many times higher. As a comparative reference event, the fire that occurred in December 1994 at the Karamay Friendship Palace in Xinjiang, China [32] can be considered. In addition to the fact that both events occurred within a short period of time, the purpose of both buildings was similar (the Karamay Palace was an auditorium) and the number of participants was similar. At the time of the fire in China, ~800 people were inside the building. A total of 325 people died in the incident in China, confirming that the consequences in Poland could have been substantially worse. In the Karamay Friendship Palace, the main cause of the tragedy was also blocked emergency exits (Figure 22). Unsurprisingly, the difference between the numbers of people evacuated with open and closed emergency exits was noticeable; the same result was reported in the studies presented in this article (Figure 15, Figure 16 and Figure 17).
The following differences between these events can be considered as reasons for the substantially fewer fatalities in Poland than in China:
- Fewer (and lower density of) participants, amounting to ~600 people; in the extreme scenario, up to 3,000 people could have been inside the hall in Gdańsk.
- A simple functional layout, where the exits from the hall were exits from the building or exits to a corridor leading directly to the outside of the building.
- Openwork (grids) at the end of the emergency exits, which guaranteed access to fresh air.
- Easy access for rescue units and good access to the building from the fire lane.
- The original evacuation direction could not be changed because the people could not return to the hall covered by the fire and smoke.
This last reason may seem to be counterintuitive because in theory, changing the blocked evacuation exit to an open one should improve the evacuation outcome. In these specific cases, however, the change resulted in exposure to smoke and heat, which was (among other aspects) the reason for the high number of casualties in China.
Another event that may provide some comparative material is the fire at The Kiss nightclub in Santa Maria in Brazil in 2013. The fire started at around 2:30 am when a band performing at the club let off as part of its show cheap fireworks meant for outdoor use instead of the more expensive indoor fireworks. The band that was onstage pointed out the flares upward. The club’s ceiling ignited and, because of a malfunctioning fire extinguisher, the blaze spread throughout the packed club at lightning speed, emitting thick, toxic smoke. Those inside panicked as they tried to get out and smoke made them lose their sense of direction. About 50 of the victims were found in the club’s two bathrooms apparently confusing their doors with the exit door. At least 90 per cent of the victims died of smoke inhalation rather than burns. The club had combustible insulating foam material in the ceiling, and faulty fire safety equipment. It had neither an alarm nor a sprinkler system and had only one exit. Moreover, metal barriers, used to keep people in line on their way in, ended up blocking people from getting out. Firefighters, just like in Poland, faced huge problems related to access to the inside of the building and had to open a hole in the outer wall to allow more people to escape. While the 615 square-meter club’s capacity is under 700 people, it was packed with an estimated 1,200 to 1,300 people. 236 youngsters were killed and more than 169 hospitalized for smoke inhalation and burns, with dozens of them in critical condition [16].
Comparison of the events in Poland and China in 1994 and in Brazil in 2013 indicates a key issue related to the conditions of evacuation. Tragic consequences are much more likely when there are problems with evacuation exits and this should be key in ensuring fire safety for large gatherings of people in buildings. In Poland, the doors were closed and the crowd thickened behind blocked exits (openwork, which limited the tragic consequences because people did not retreat to the danger zone), in China, the doors were closed and the crowd retreated to the place of fire, while in Brazil people confused toilet entrances with evacuation exits.The analysis of the 1994 incident and alternative scenarios that were established showed that the number of victims on that day could have been much higher. In each analysed alternative scenario, considering the formation of a blocking pile, the number of potential victims was higher than that in the actual event. Further, in the extreme scenario (3a), it could have reached ~800 people.
During event analysis, a phenomenon called blocking pile formation was observed, which was previously been described in detail in the literature. However, the literature survey revealed that a similar phenomenon occurred, alongside others, at the The Who concert in Cincinnati in 1979. In the available description of this event [13], because the physical effects of crowd interaction were not the subject of the analysis, no attention was likely paid to these aspects. Moreover, these aspects were not considered during the reporting and explanation of the Gdańsk event. In the author’s opinion, a blocking pile is one of the critical phenomena that can occur when crowds are evacuating from confined spaces. Notably, if sufficiently large spaces are not provided for bottlenecks, the crowd will not be able to release the pressure on its own, even if the pressure is as high as 4450 N m−1 [33]. This will cause a blocking pile comprising a pile of people who have fallen over (Figure 11). According to the testimony of many eyewitnesses [12], rescuers encountered a pile of ~70 people about 1.5-m high in front of the main emergency exit in Gdańsk, from which the people could not escape on their own (Figure 23a and Figure 23b).
Although a blocking pile cannot be accurately recreated in any simulation programme or experiment, attempts can be made to describe its characteristics and causes. A blocking pile occurs when a person in a moving crowd cannot maintain a upright position and starts to fall over. Subsequently, other people trip and fall over them, creating a blocking pile that grows to a height of the height of the average person in the crowd.
The main reasons for the formation of a blocking pile are as follows:
- The critical crowd density is exceeded, preventing controlled movement on the floor surface, which is often additionally supported by a overcoming the difference in levels;
- Inadequate space is available around the blocking pile for the pile to naturally self-disperse;
- The crowd surrounding the blocking pile in the outer circles is unaware of the emerging danger (and is still pushing). In the inner circles, a rational reaction is impossible.
A precise physical description of the blocking pile phenomenon requires further research, including the relationship between crowd density, crowd geometry, and the possibility of pile formation. Intuitively, it can be assumed that the occurrence of this phenomenon is the result of disruption of the natural movement of the crowd, both in the transverse directions and stop-and-go waves [34]. This disruption is local (falling over one or several people) and develops until the pressure drops or the direction of the crowd movement changes. Then the blocking pile must be discharged, which is usually not possible on its own and requires the participation of external people. Analyses containing pressure distributions and velocity fields could be used to further investigate the described phenomenon.
The high risk of a substantial increase in the number of people injured is also shown by the summary of the total evacuation times in the individual scenarios (Figure 24).
Figure 24 shows that the three longest total evacuation times (clearly distinguishable from the other evacuation times) are for scenarios 1a, 3a and 5a, i.e., in scenarios wherein a blocking pile occurred or was assumed to have occurred.
The analysis of the 1994 event in Gdańsk and alternative scenarios lead to the following conclusions:
- Existing buildings intended for large groups of people should be gradually adapted to comply with current regulations as they can pose a substantial risk to safety during evacuation.
- The organisation of an event for a large group of people and the subsequent adaptation of the number of people to the building’s boundary conditions are inadequate. Proper organisation and crowd control must also be ensured, especially regarding the availability of all emergency exits.
- Critical evacuation parameters, such as visibility and critical temperatures, are reached very quickly, even in rooms with high ceilings. When designing crowd evacuation plans, rapid fire spreads should always be assumed.
- The safest buildings for events and auditoriums are those with exits leading directly from the main auditorium to the building’s exterior.
- In buildings, the movements of people and crowds under comfortable conditions and during evacuation drills are different from those of emotional people and crowds during actual evacuations.
- When planning crowd evacuation, the formation possibility of a blocking pile must be anticipated, which critically increases the risk of fatalities because of trampling.
- Because buildings’ exterior spaces are not always safe, the provision of adequate space for relieving the pressure of crowds exiting the building should be verified.
In relation to the conducted analysis, in particular taking into account the blocking pile phenomenon, it is worth proposing expected legislative changes regarding crowd evacuation, in the design of safe evacuation in buildings. The introduction of specific legislative changes, especially for rooms intended for over 300 people (the value currently used in Polish technical and construction regulations), would be advisable:
- Introduction of mandatory use of an audible alarm system;
- Increasing the required width of evacuation exits by 50% and requiring the use of three (not two) evacuation exits;
- As an alternative to the two above requirements, conducting a computer simulation of evacuation or real tests to confirm the effectiveness of another solution [35].
The study in question focused on evacuation conditions, but further analyses are possible regarding fire safety in the context of the event in Gdańsk. Available modern risk assessment tools [36] allow using the available information to draw more general conclusions. Unfortunately, it is no longer possible to conduct an assessment and examination of the fire-damaged building materials as is the case in other cases [37], since the building has been demolished and the area cleared. Future studies may also concern technical and construction requirements for auditorium buildings in terms of their construction and determining optimal solutions for this type of buildings, what happened after the fire in Brazil [38].
Funding
This research received no external funding.
Data Availability Statement
Data will be made available on request.
Declaration of Generative AI and AI-assisted technologies in the writing process
The author did not use generative artificial intelligence or AI-assisted technologies to improve the writing process or in any other respect during the preparation of this work.
Declaration of interests
The author declares that he has no known competing financial interests or personal relationships that could appear to have influenced the work reported in this paper.
References
- Haase, K.; Kasper, M.; Koch, M.; Müller, S. A Pilgrim Scheduling Approach to Increase Safety During the Hajj. Operations Research 2019, 67(2), 376–406. [Google Scholar] [CrossRef]
- Burkle, F. M.; Hsu, E. B. Ram Janki Temple: Understanding human stampedes. The Lancet 2011, 377(9760), 106–107. [Google Scholar] [CrossRef] [PubMed]
- Zhu, R.; Lin, D.; Jendryke, M.; Zuo, C.; Ding, L.; Meng, L. Geo-tagged social media data-based analytical approach for perceiving impacts of social events. ISPRS International Journal of Geo-Information 2019, 8(1), 15. [Google Scholar] [CrossRef]
- Walker, G. The Ibrox stadium disaster of 1971. In Soccer & Society, 2 ed.; Routledge: London, 2004; pp. 169–182. [Google Scholar]
- Hillsborough Independent Panel. Hillsborough The Report; The Stationery Office: London, 2012. [Google Scholar]
- Yang, X.; Wu, Z.; Li, Y. Difference between real-life escape panic and mimic exercises in simulated situation with implications to the statistical physics models of emergency evacuation: The 2008 Wenchuan earthquake. Physica A 2011, 390, 2375–2380. [Google Scholar] [CrossRef]
- Bernardini, G.; Lovreglio, R.; Quagliarini, E. Proposing behavior-oriented strategies for earthquake emergency evacuation: A behavioral data analysis from New Zealand, Italy and Japan. Safety Science 2019, 116, 295–309. [Google Scholar] [CrossRef]
- Johansson, A.; Helbing, D.; A-Abideen, H. Z.; Al-Bosta, S. From crowd dynamics to crowd safety: A video-based analysis. Advances in Complex Systems 2008, 11(4), 497–527. [Google Scholar] [CrossRef]
- Sawicki, T. Wspomnienie tragedii (Memory of the tragedy). Przegląd Pożarniczy 10/2009, str. 14–15.
- DM, Głośne echa tragedii (Loud echoes of tragedy). Przegląd Pożarniczy 2/1995, str. 4–8.
- Sobótka, A. Gdańsk - dwie tragedie (Gdańsk - two tragedies). Przegląd Pożarniczy 2021, 7, str. 20–22. [Google Scholar]
- Pożar hali widowiskowej Stoczni Gdańskiej i jego ofiary – przykład masowej katastrofy (The fire in the Gdańsk Shipyard auditorium and its victims – an example of a mass disaster); Borys, B., Ed.; Stowarzyszenie Osób Poparzonych w Hali Stoczni Gdańskiej (Association of Burn Victims in the Gdańsk Shipyard Hall): Gdańsk, 1999. [Google Scholar]
- Johnson, N. R. Panic at “The Who Concert Stampede”: An empirical assessment. Social Problems 1987, 34(4), 362–373. [Google Scholar] [CrossRef]
- TVP3 Gdańsk, Pożar Hali Stoczni Gdańsk (Fire in the Gdańsk Shipyard Hall). Available online: https://gdansk.tvp.pl/75528363/pozar-hali-stoczni-gdansk (accessed on 16 February 2025).
- Wolanin, J.; Ościłowska, B.; Piórczyński, W.; Prochacki, D.; Staryński, E.; Dziwulski, D. Analiza przyczyn i okoliczności rozwoju pożaru Hali Widowiskowo – Sportowej Stoczni Gdańskiej, Szkoła Główna Służby Pożarniczej (Analysis of the causes and circumstances of the development of the fire in the Sports and Entertainment Hall of the Gdańsk Shipyard, Main School of Fire Service); Warszawa, 1995. [Google Scholar]
- Atiyeh, B. Brazilian Kiss nightclub disaster. Ann Burns Fire Disasters 2013, 26, 3. [Google Scholar] [PubMed]
- Bertolazi, A.N.; Mann, K.C.; Lima, A.V.P.B.; Hidalgo, M.P.L.; John, A.B. Post-traumatic stress disorder prevalence and sleep quality in fire victims and rescue workers in southern Brazil: a cross-sectional study. Public Health 2022, Volume 209, Pages 4–13. [Google Scholar] [CrossRef] [PubMed]
- Albuquerque, I.M.; Pasqualoto, A.S.; Trevisan, M.E.; Gonçalves, M.P.; Badaró, A.F.V.; Moraes, J.P.; Prado, A.L.C. Role of physiotherapy in the rehabilitation of survivors of the Kiss nightclub tragedy in Santa Maria, Brazil. Physiotherapy 2013, Volume 99(Issue 4), Pages 269–270. [Google Scholar] [CrossRef] [PubMed]
- Dziennik Bałtycki, Pożar w hali Stoczni Gdańskiej. Dziś mija 21 lat od tragedii (Fire in the Gdańsk Shipyard hall. Today marks 21 years since the tragedy). Available online: https://dziennikbaltycki.pl/pozar-w-hali-stoczni-gdanskiej-dzis-mija-21-lat-od-tragedii-archiwalne-zdjecia-artykuly/ar/9118443 (accessed on 16 February 2025).
- Kwiatkowski, A.; Rydzek, T.; Szulc, C.; Wolanin, J.; Zdanowski, M. Matematyczno-komputerowy model kryminalistycznego badania przyczyn i okoliczności pożarów: rozprawa habilitacyjna (Mathematical-computer model of forensic investigation of causes and circumstances of fires: habilitation thesis); Ministerstwo Spraw Wewnętrznych (Ministry of the Interior): Warszawa, 1989. [Google Scholar]
- Tok, FM. “Na podłodze widzieliśmy dywan z ciał. Po tym dywanie uciekali najsilniejsi”. Pożar w Hali Stoczni Gdańskiej (“We saw a carpet of bodies on the floor. The strongest escaped on this carpet.” Fire in the Gdańsk Shipyard Hall). Available online: https://www.tokfm.pl/Tokfm/7,103085,30187680,na-podlodze-widzielismy-dywan-z-cial-po-tym-dywanie-uciekali.html (accessed on 16 February 2025).
- Sarshar, P.; Radianti, J.; Gonzalez, J.J. Modeling panic in ship fire evacuation using dynamic Bayesian network. Innovative Comput. Technol. (INTECH) 2013. [Google Scholar] [CrossRef]
- Thunderhead Engineering, Pathfinder User Manual, Version: 2024-2. Available online: https://support.thunderheadeng.com/docs/pathfinder/2024-2/user-manual/.
- Yan, Z.; Wang, Y.; Chao, L.; Guo, J. Study on evacuation strategy of commercial high-rise building under fire based on FDS and pathfinder. CMES - Computer Modeling in Engineering and Sciences 2023, 138(2), 1077–1102. [Google Scholar] [CrossRef]
- Qin, J.; Liu, C.; Huang, Q. Simulation on fire emergency evacuation in special subway station based on Pathfinder. Case Studies in Thermal Engineering 2020, 21, 100677. [Google Scholar] [CrossRef]
- Jing, M.; Zhang, G.; Guo, S.; Wang, C. Simulation method for fire evacuation safety of teaching buildings in colleges and universities. Results in Engineering 2025, 25, 104512. [Google Scholar] [CrossRef]
- Wang, H. -R.; Chen, Q. -G.; Yan, J. -B.; Yuan, Z.; Liang, D. Emergency Guidance Evacuation in Fire Scene Based on Pathfinder. 7th International Conference on Intelligent Computation Technology and Automation, Changsha, China, 2014; pp. 226–230. [Google Scholar] [CrossRef]
- SFPE. SFPE Guide to Human Behavior in Fire, 2nd ed.; Springer International Publishing, 2019; Available online: https://www.springer.com/gp/book/9783319946962.
- Reynolds, C. W. Steering behaviors for autonomous characters. Game developers conference; Vol. 1999, pp. 763–782.
- Amor, H. B.; Obst, O.; Murray, J. Fast, neat and under control: Inverse steering behaviors for physical autonomous agents. Fachberichte Informatik 2003, 12–2003. [Google Scholar]
- Yaman, M.; Kurtay, C. Analysis of fire evacuation scenarios in children’s cultural centers. Journal of Safety Science and Resilience 2025, 6(1), 114–123. [Google Scholar] [CrossRef]
- Li, C.; Huo, F.; Zhou, T.; Wang, D.; Li, Y.; Jiang, C. Multifactor dynamic coupled model for building fire evacuation: Case study of the Karamay Friendship Palace fire. Journal of Building Engineering 2024, 95, 110079. [Google Scholar] [CrossRef]
- Helbing, D.; Farkas, I.; Vicsek, T. Simulating dynamic features of escape panic. Nature 2000, 407(6803), 487–490. [Google Scholar] [CrossRef]
- Helbing, D.; Farkas, I.J.; Vicsek, T. Crowd Disasters and Simulation of Panic Situations. In The Science of Disasters; Springer: Berlin, Heidelberg, 2002. [Google Scholar] [CrossRef]
- Pecio, M. Selected Issues in Crowd Evacuation Under Panic Conditions. Preprints 2025, 2025040973. [Google Scholar] [CrossRef]
- Krasuski, A.; Pecio, M. Application of an integrated risk assessment software to quantify the life safety risk in building during a fire. MATEC Web of Conferences 2018, 247, 00011. [Google Scholar] [CrossRef]
- Momin, M.A.; Ahmed, K.S.; Mustafy, T.; Islam, M.J. Damage assessment and test results of construction materials of a fire-damaged RC building. Results in Engineering, Volume Volume 24(2024), 102986. [CrossRef]
- Gragnani, A.; Oliveira, A.F.; Boro, D.; Pham, T.N.; Ferreira, L.M. Response and legislative changes after the Kiss nightclub tragedy in Santa Maria/RS/Brazil: Learning from a large-scale burn disaster. Burns, Volume 2017, Volume 43(Issue 2), 343–349. [Google Scholar] [CrossRef]
Figure 1.
Layout of the hall at the time of the incident (the blocked doors are marked in red).
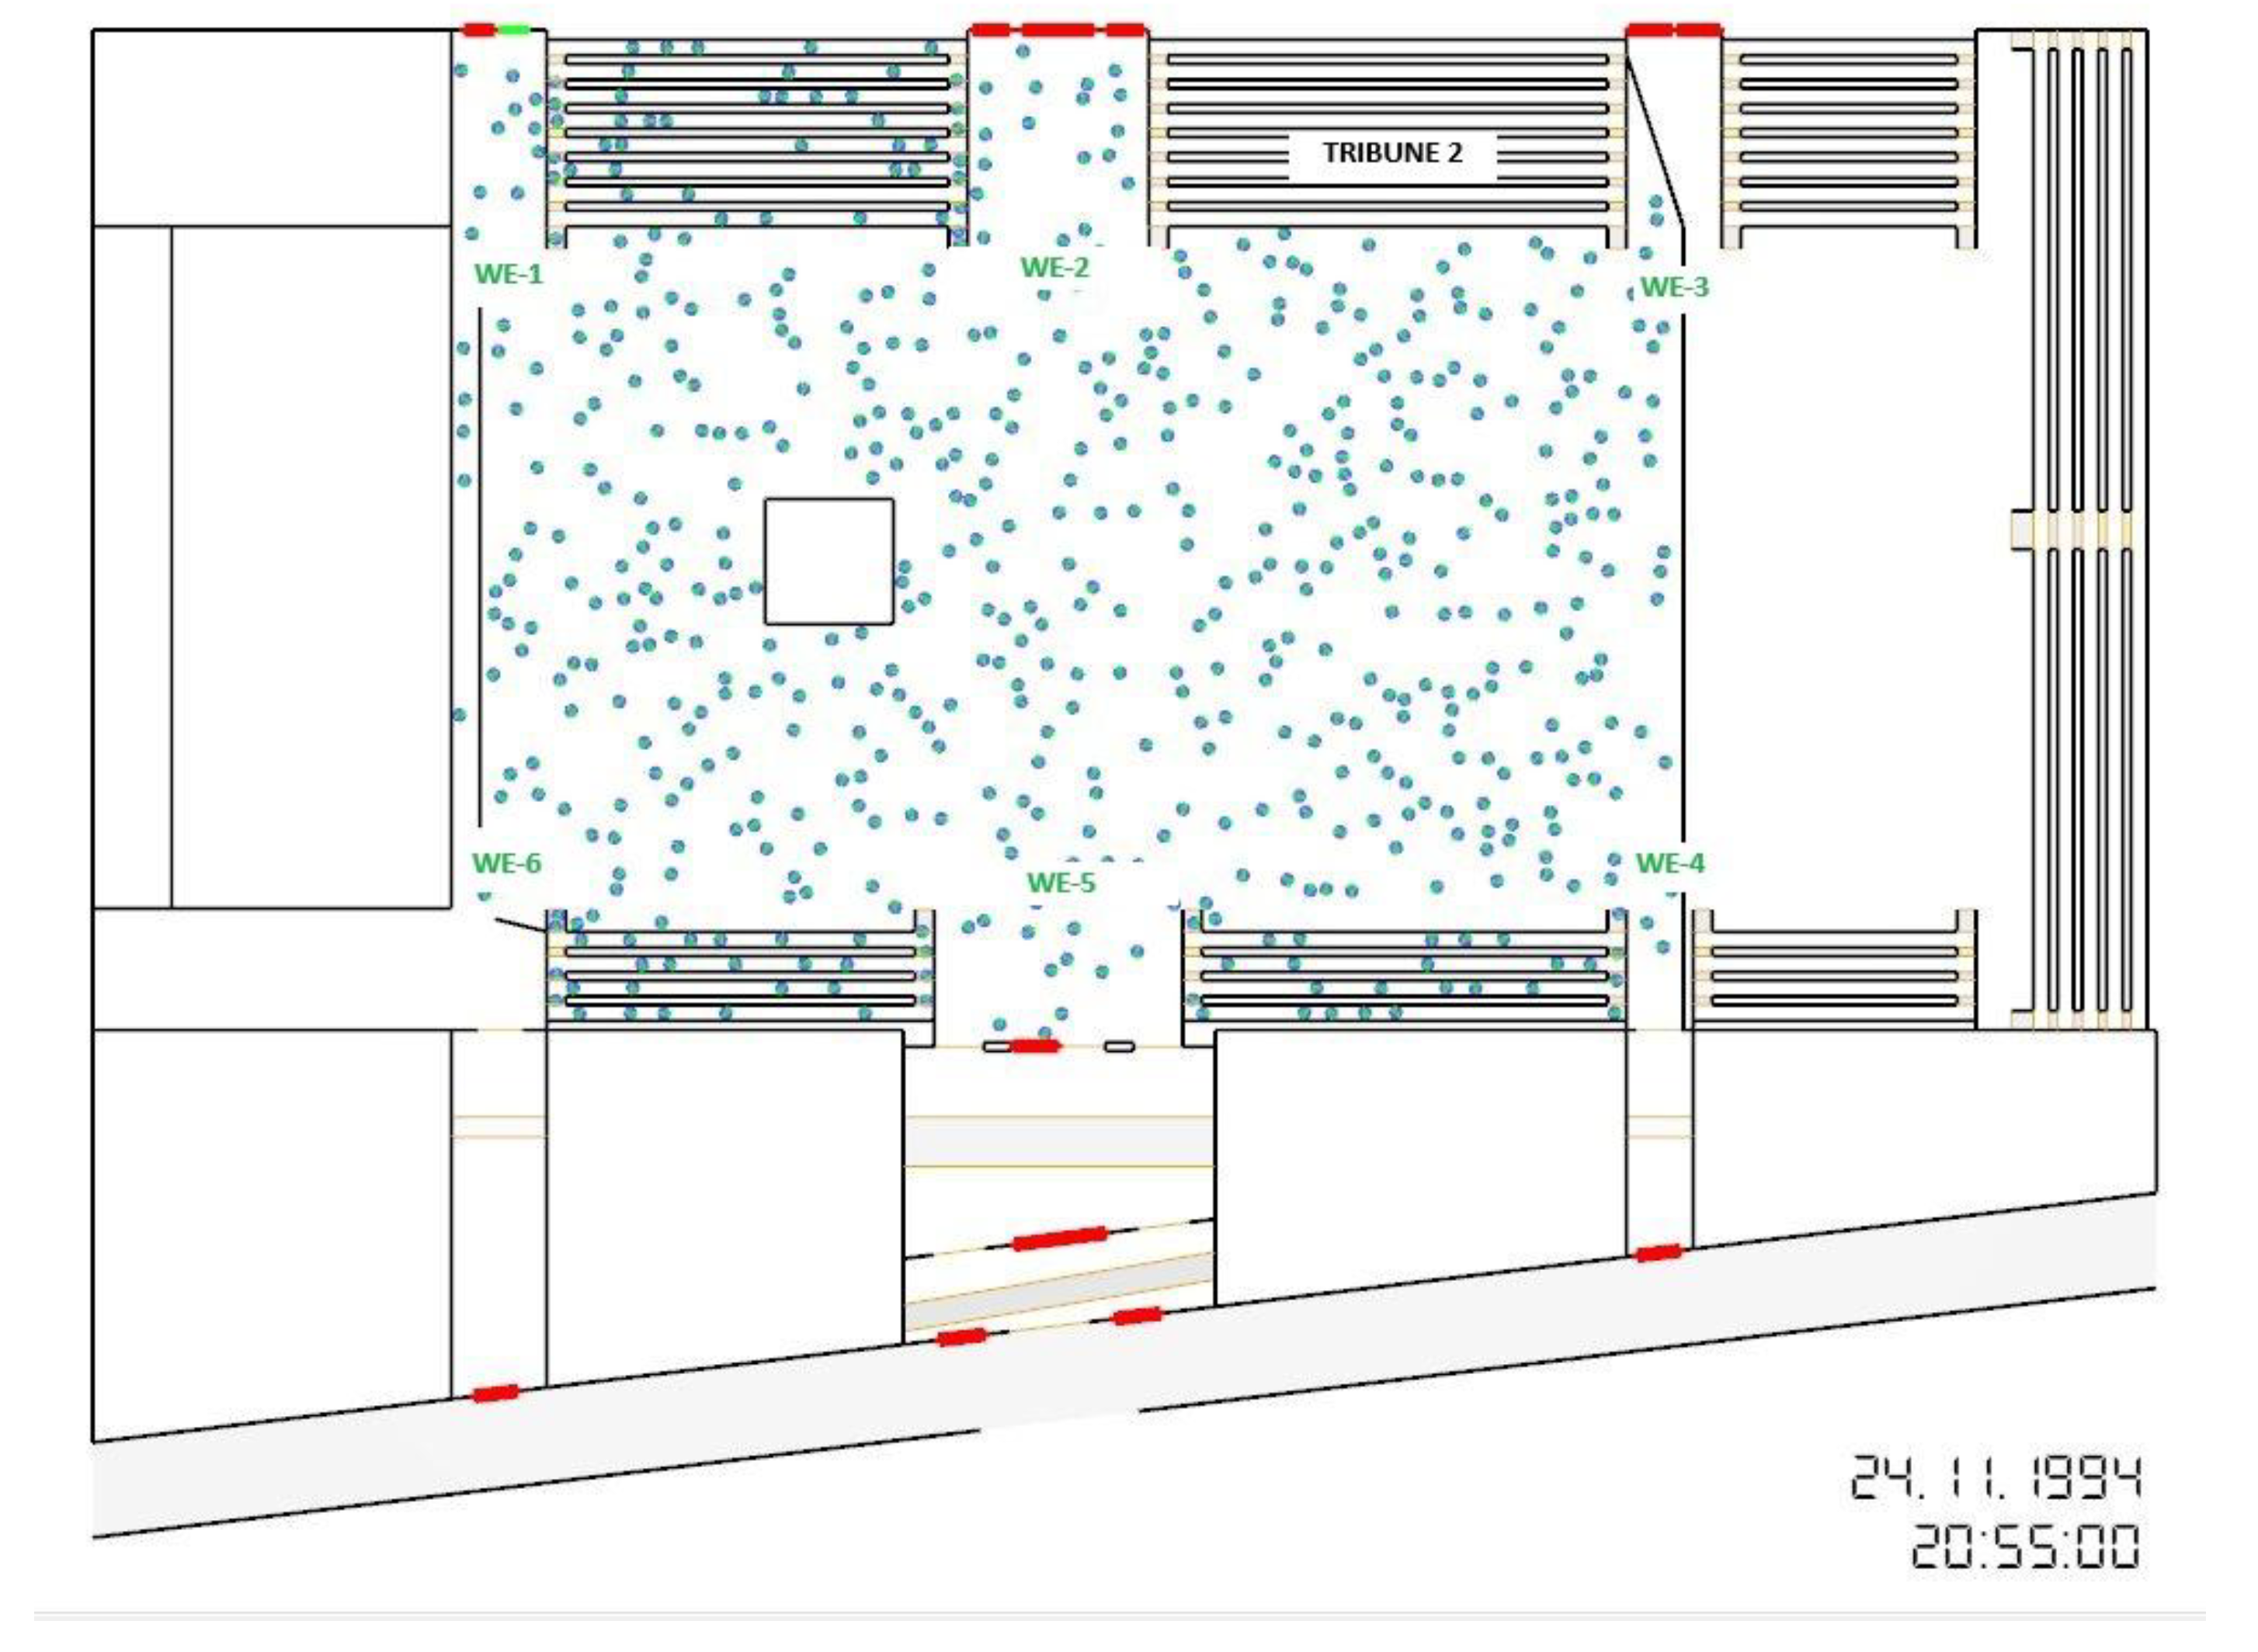
Figure 3.
Video still from inside the hall at the beginning of the fire, showing people watching the flames [14].
Figure 3.
Video still from inside the hall at the beginning of the fire, showing people watching the flames [14].
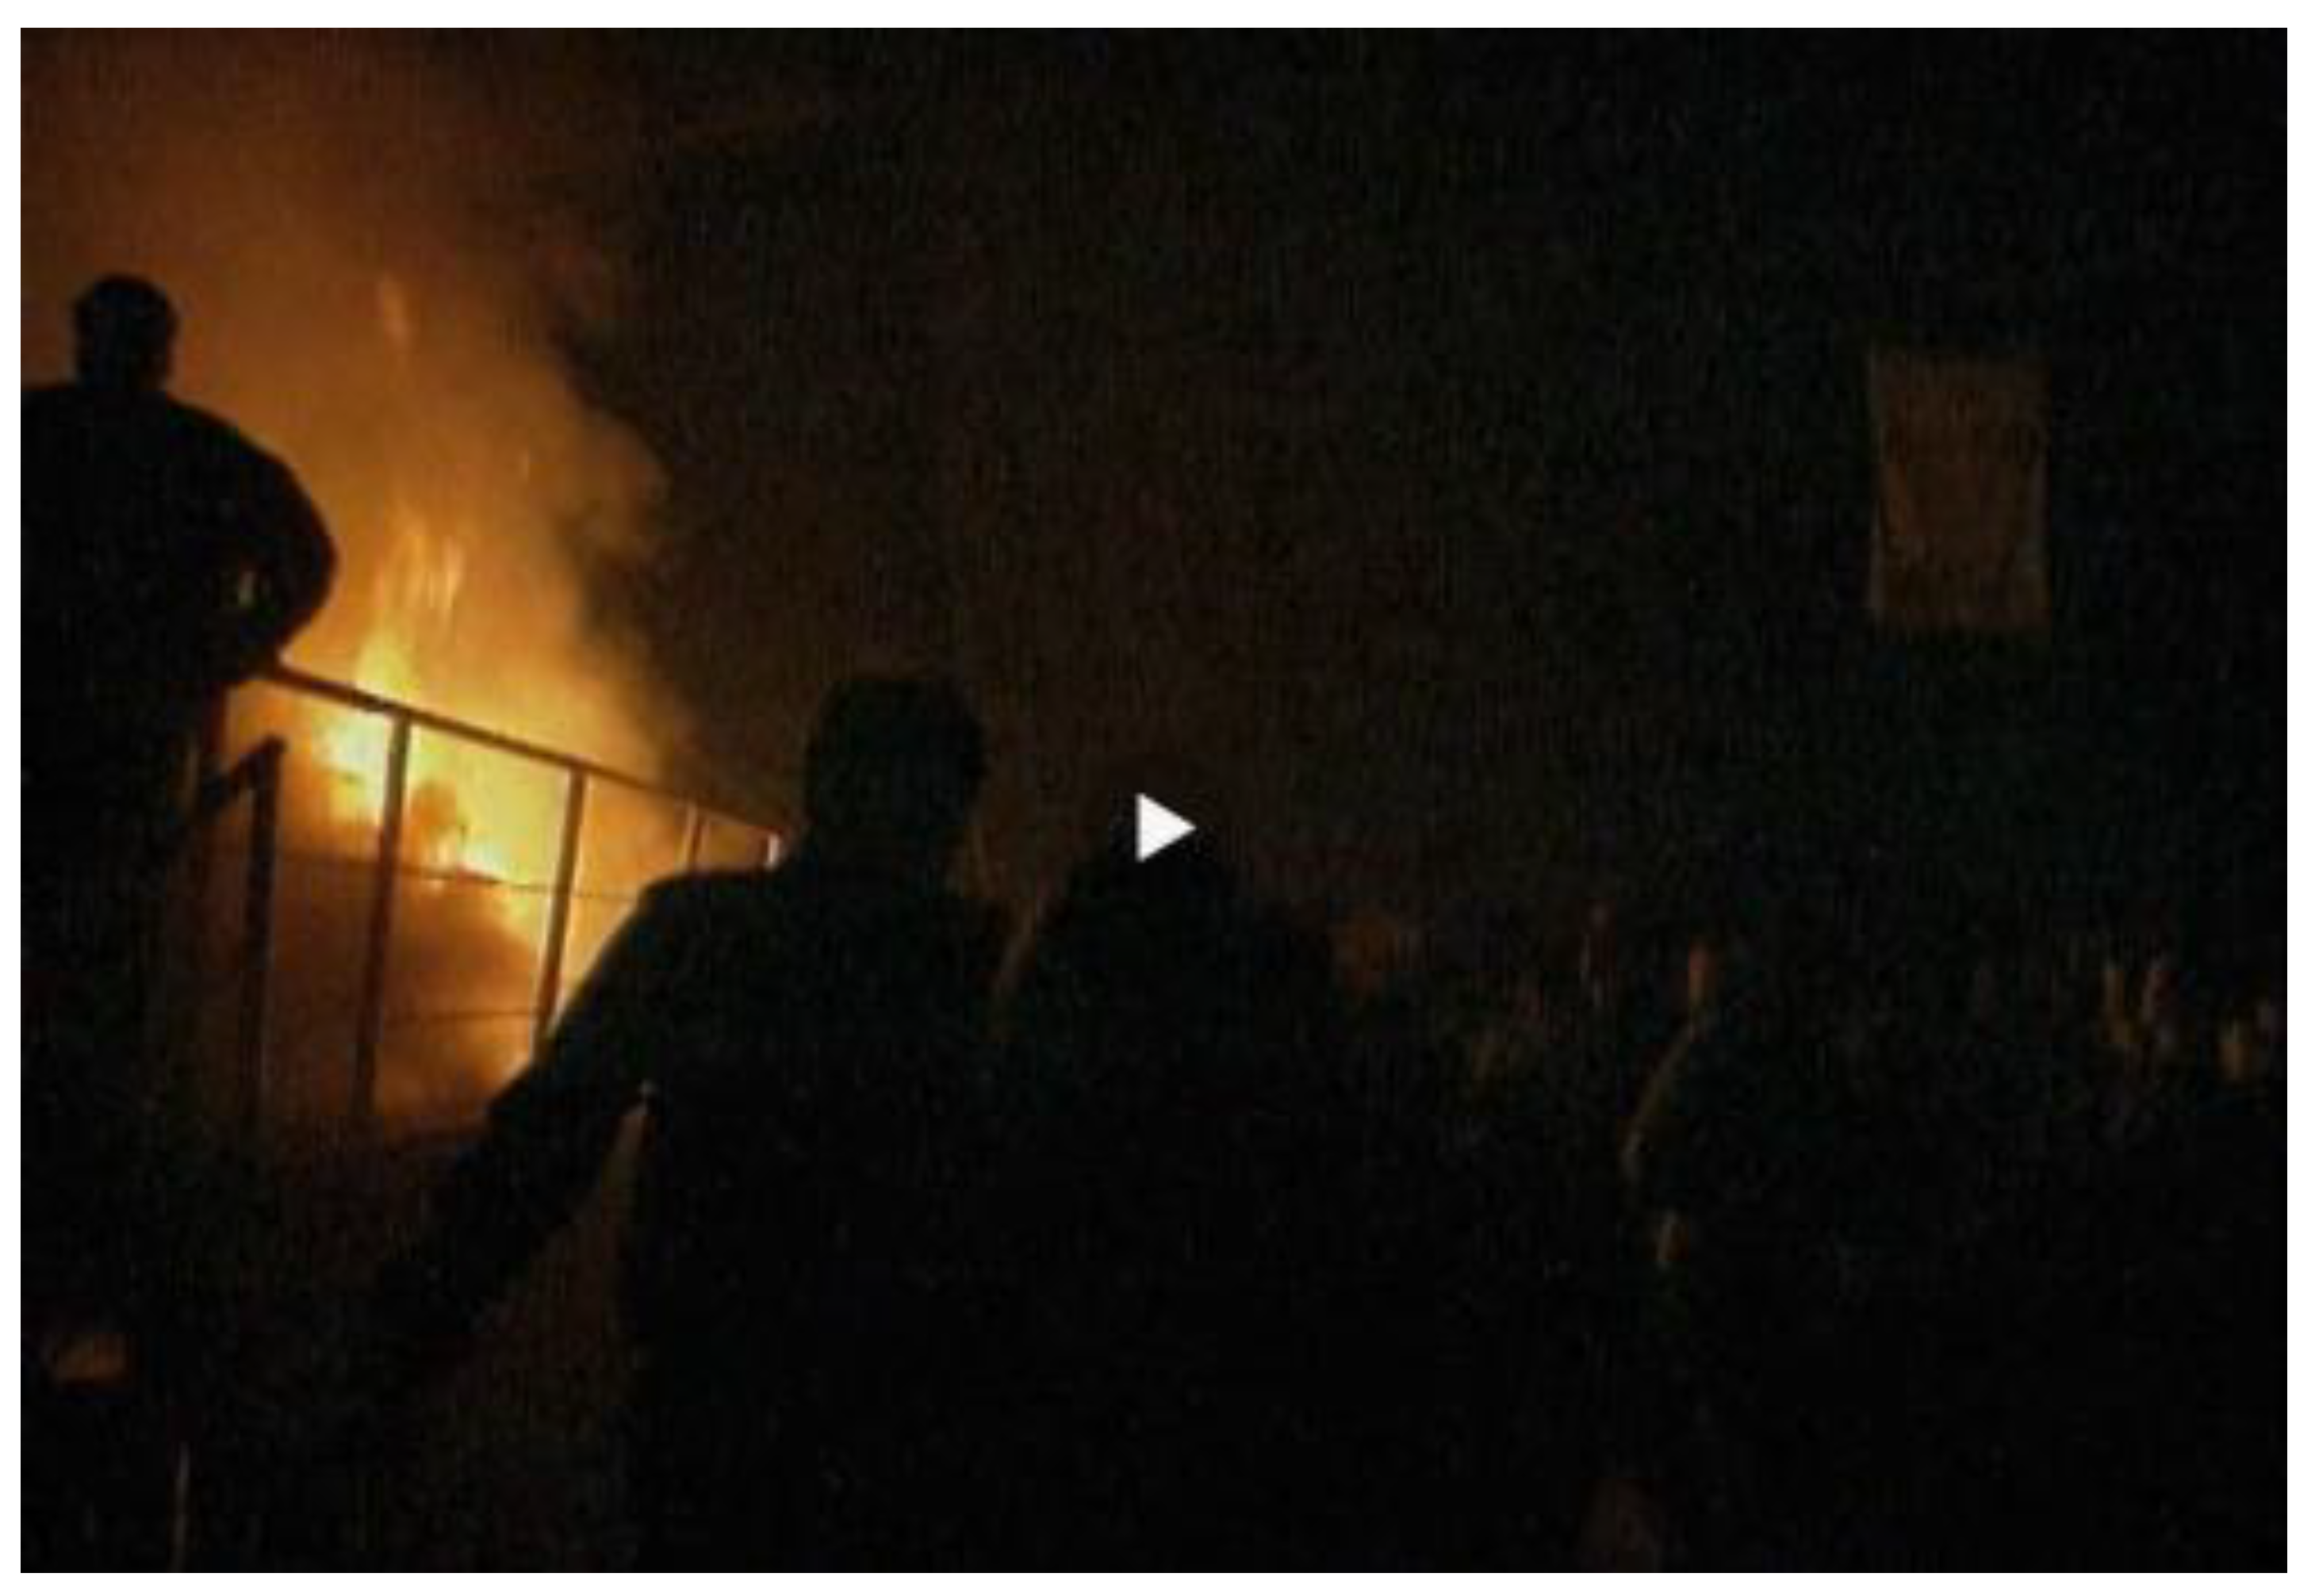
Figure 4.
Fire-extinguishing operation from the Jana z Kolna Street side of the building [16].
Figure 4.
Fire-extinguishing operation from the Jana z Kolna Street side of the building [16].
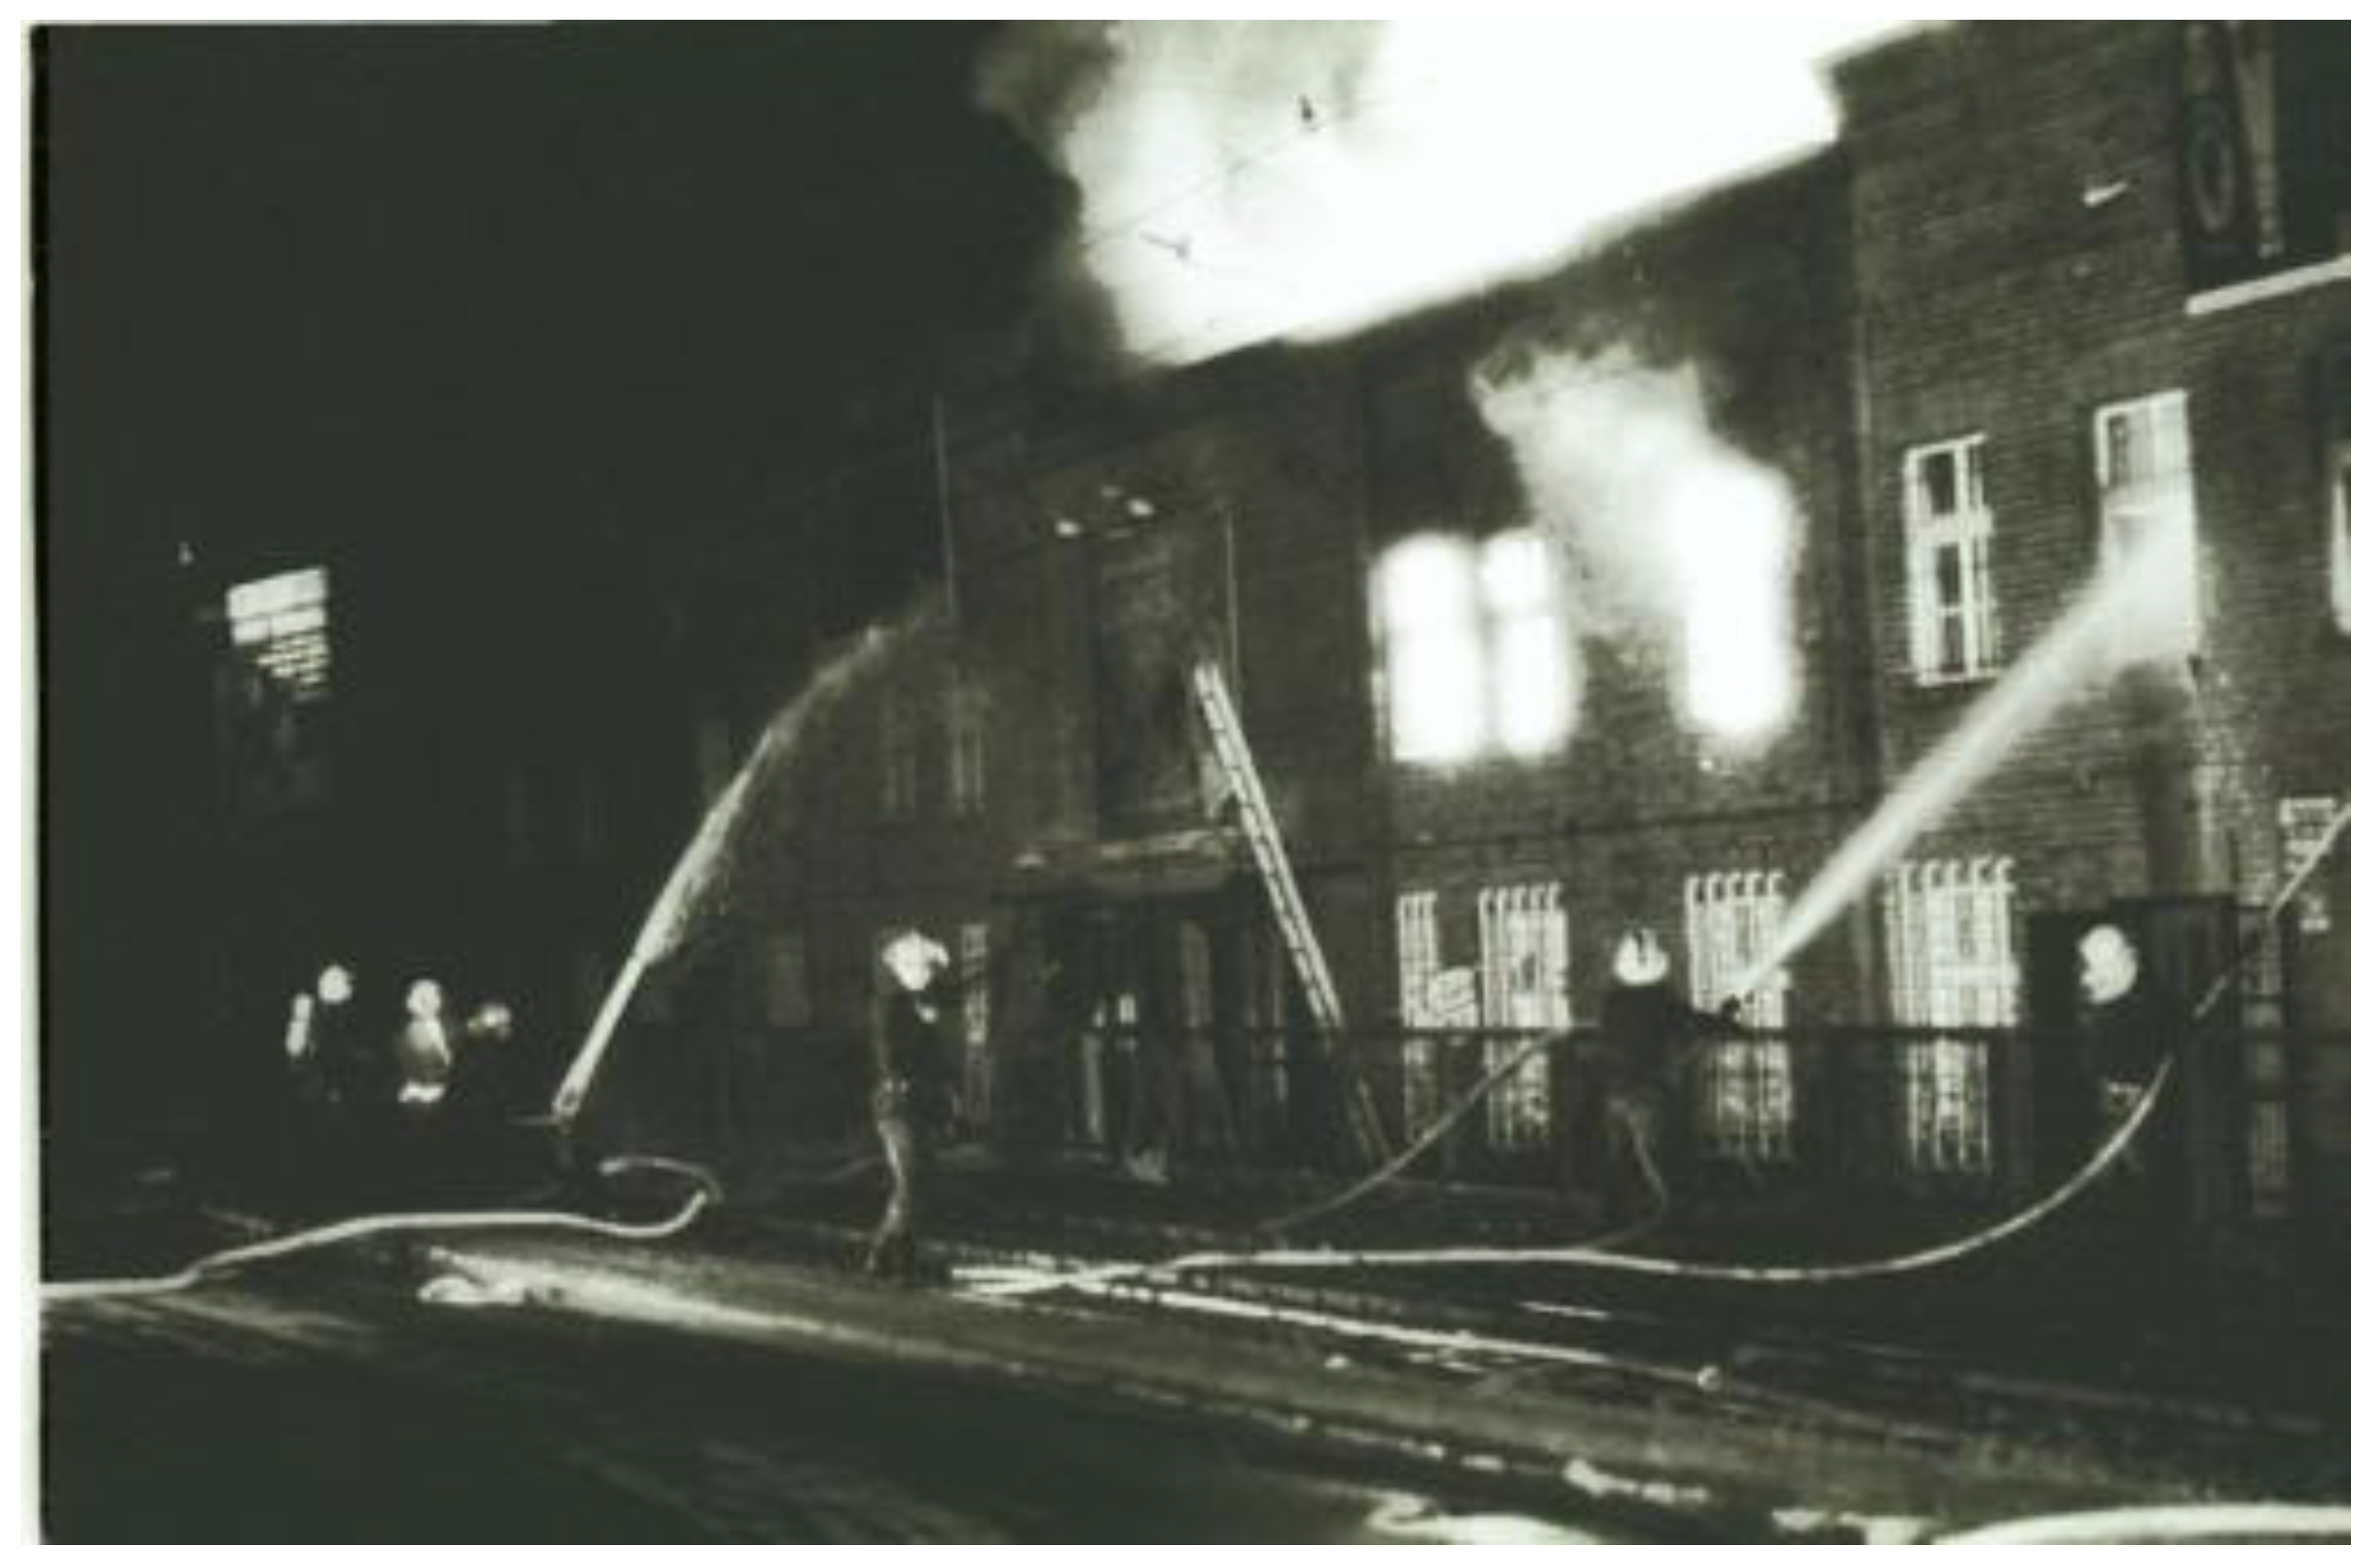
Figure 5.
Burnt hall viewed from the shipyard side [19].
Figure 5.
Burnt hall viewed from the shipyard side [19].
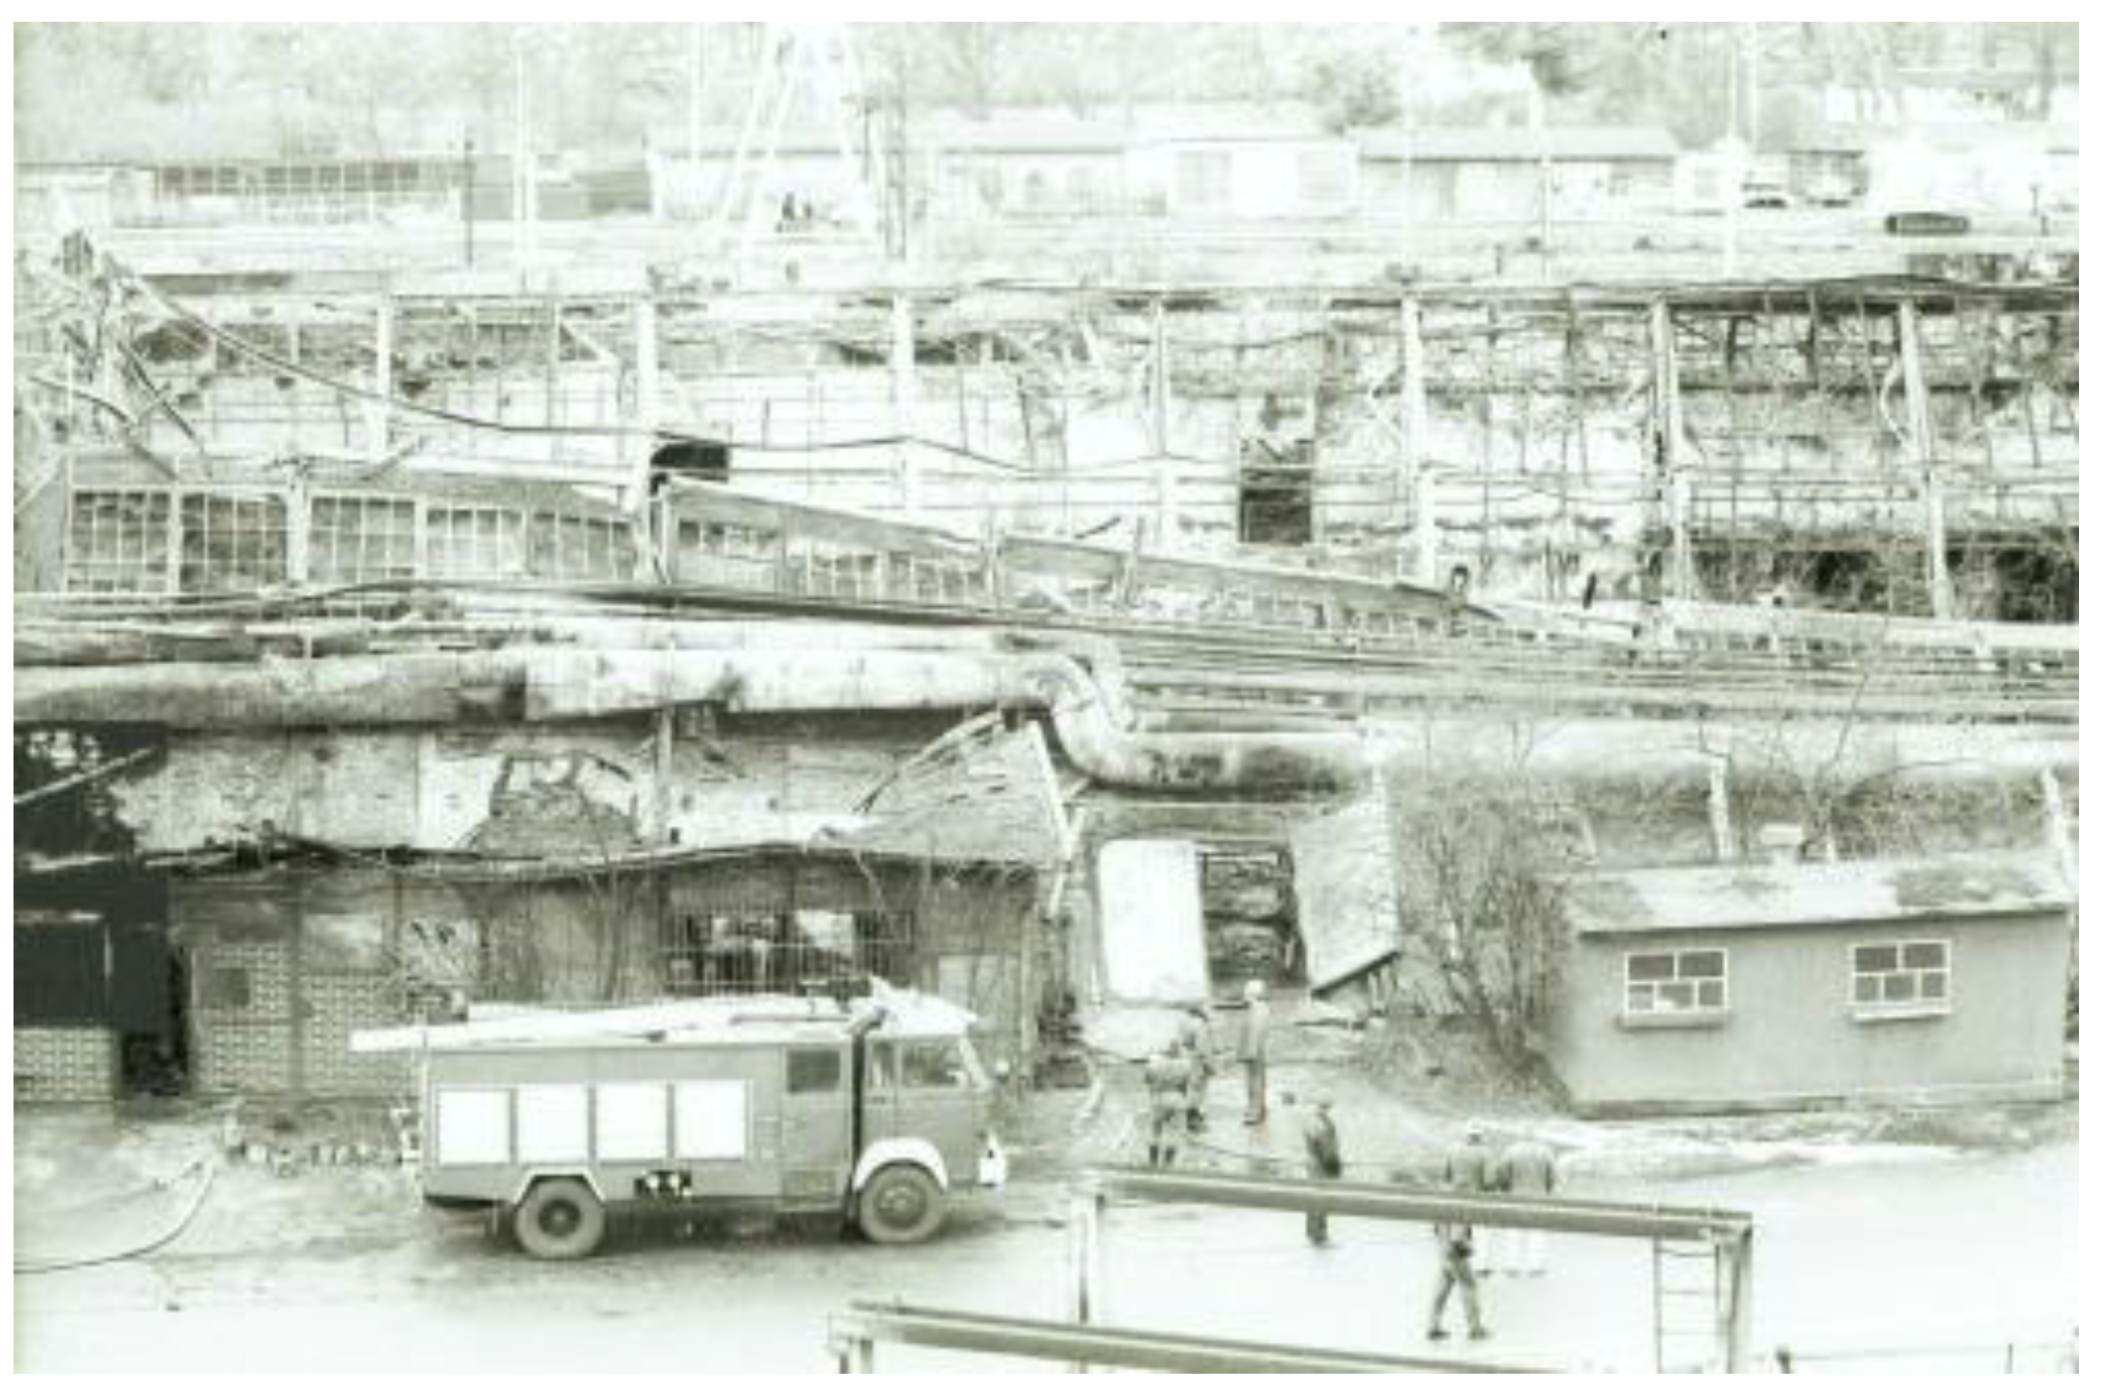
Figure 6.
Burnt hall viewed from the inside (Maciej Kosycarz/KFP).
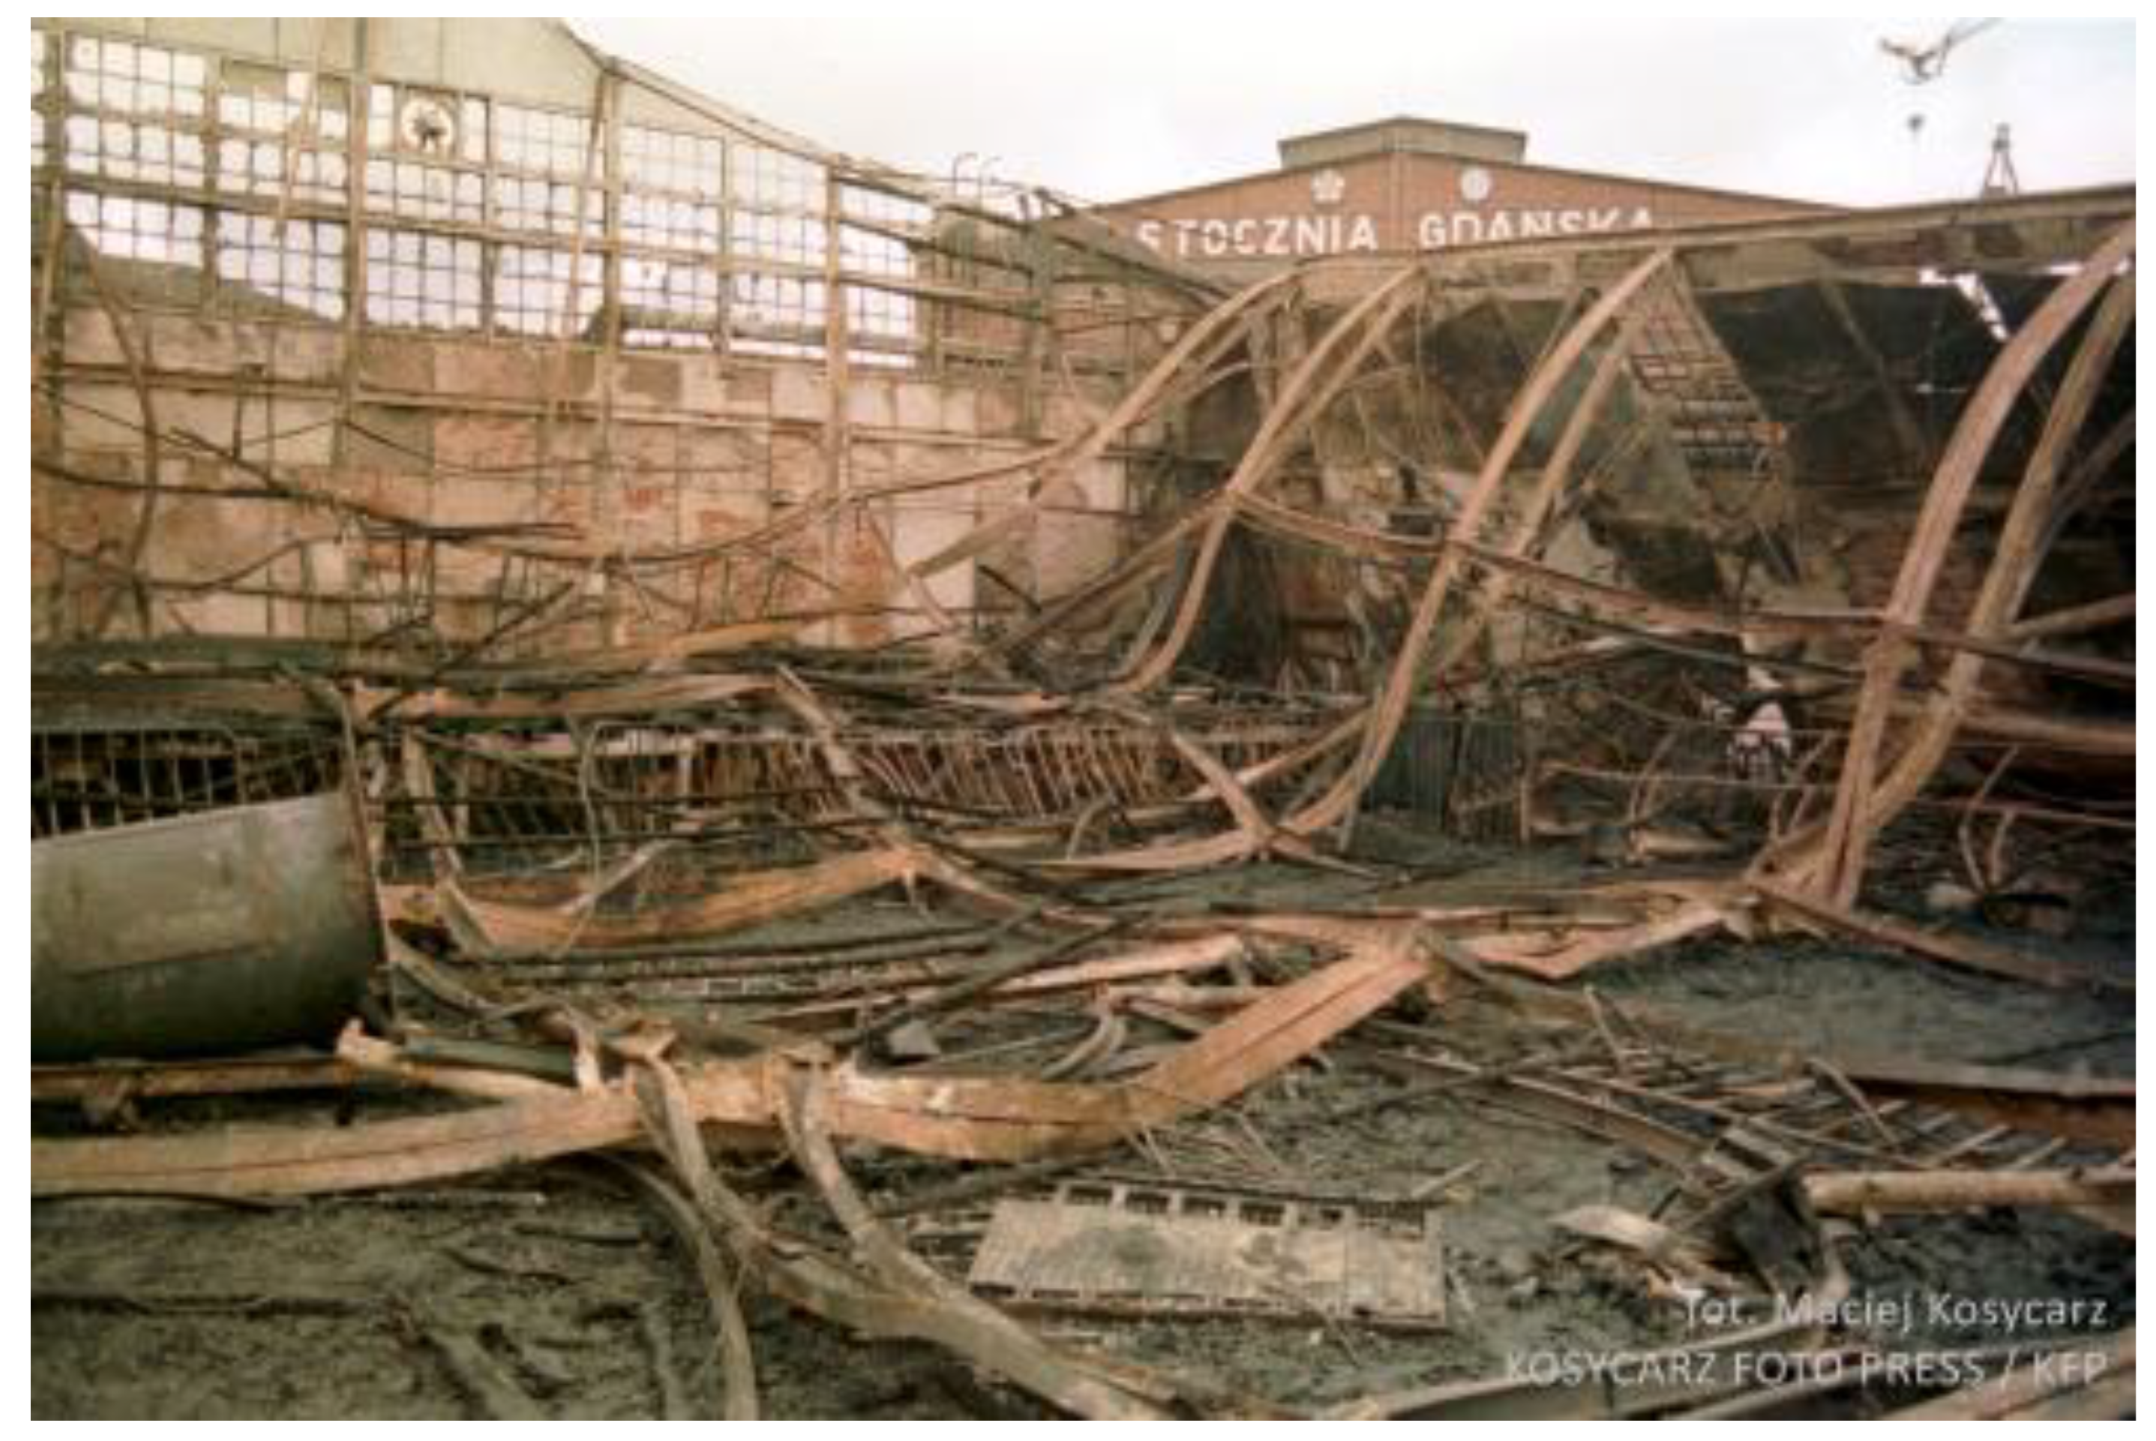
Figure 7.
Variation of the reconstructed fire parameters.
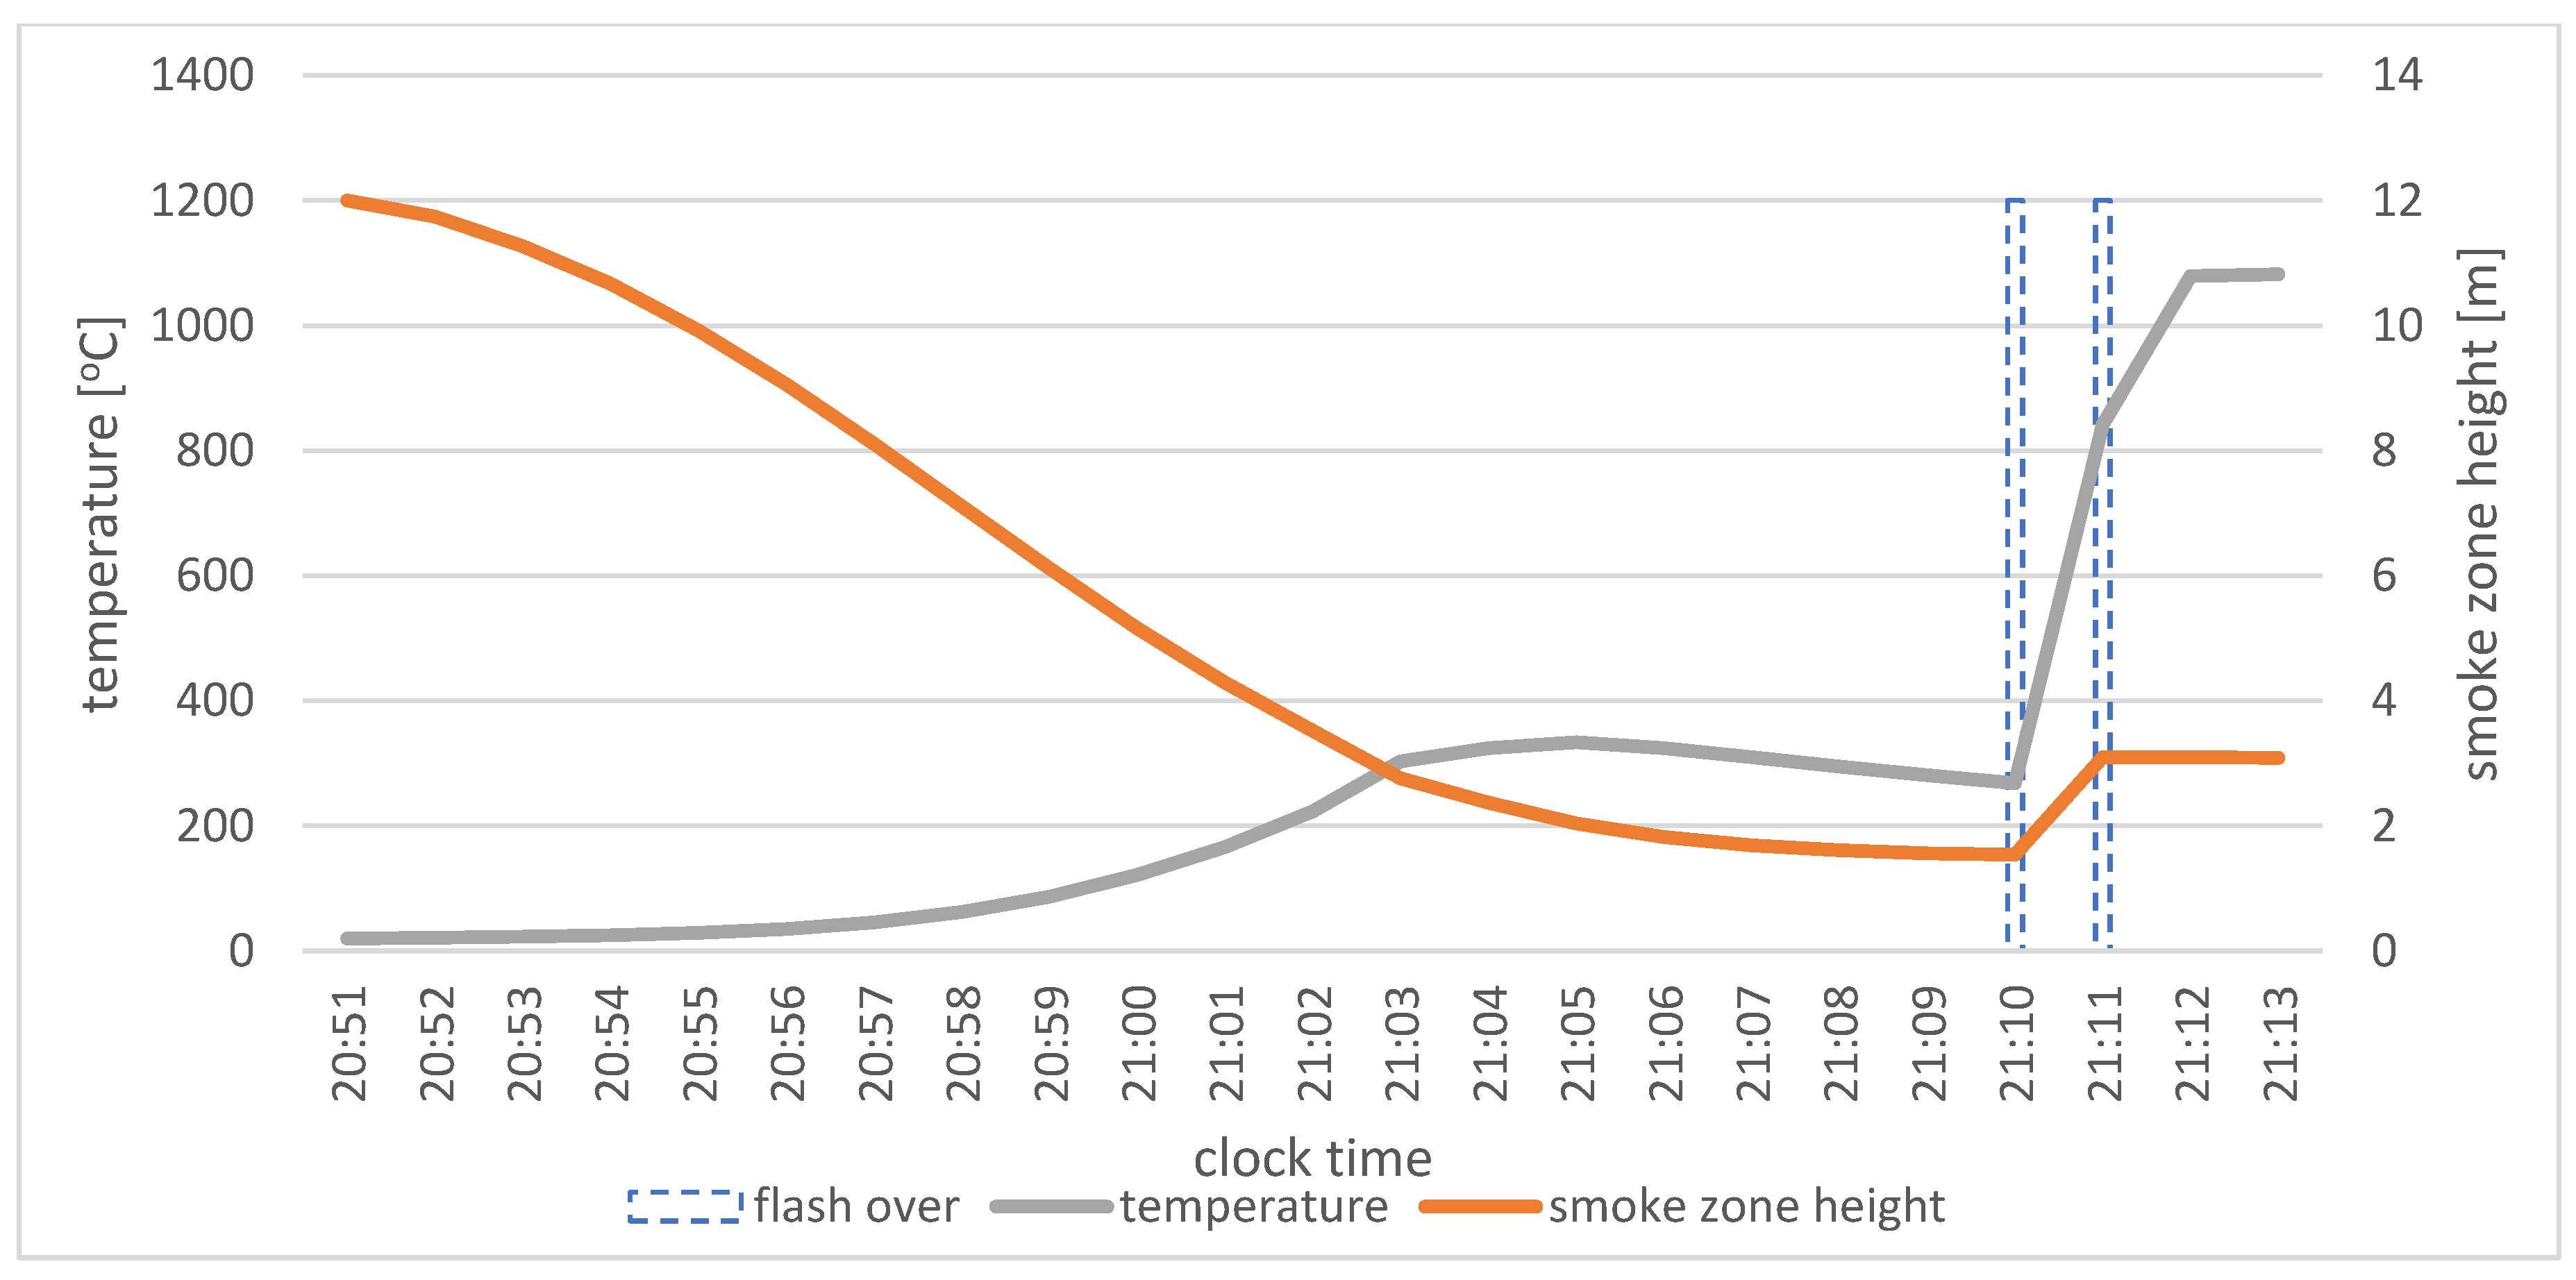
Figure 8.
Diagram showing the accessibility of the hall’s emergency exits [10].
Figure 8.
Diagram showing the accessibility of the hall’s emergency exits [10].
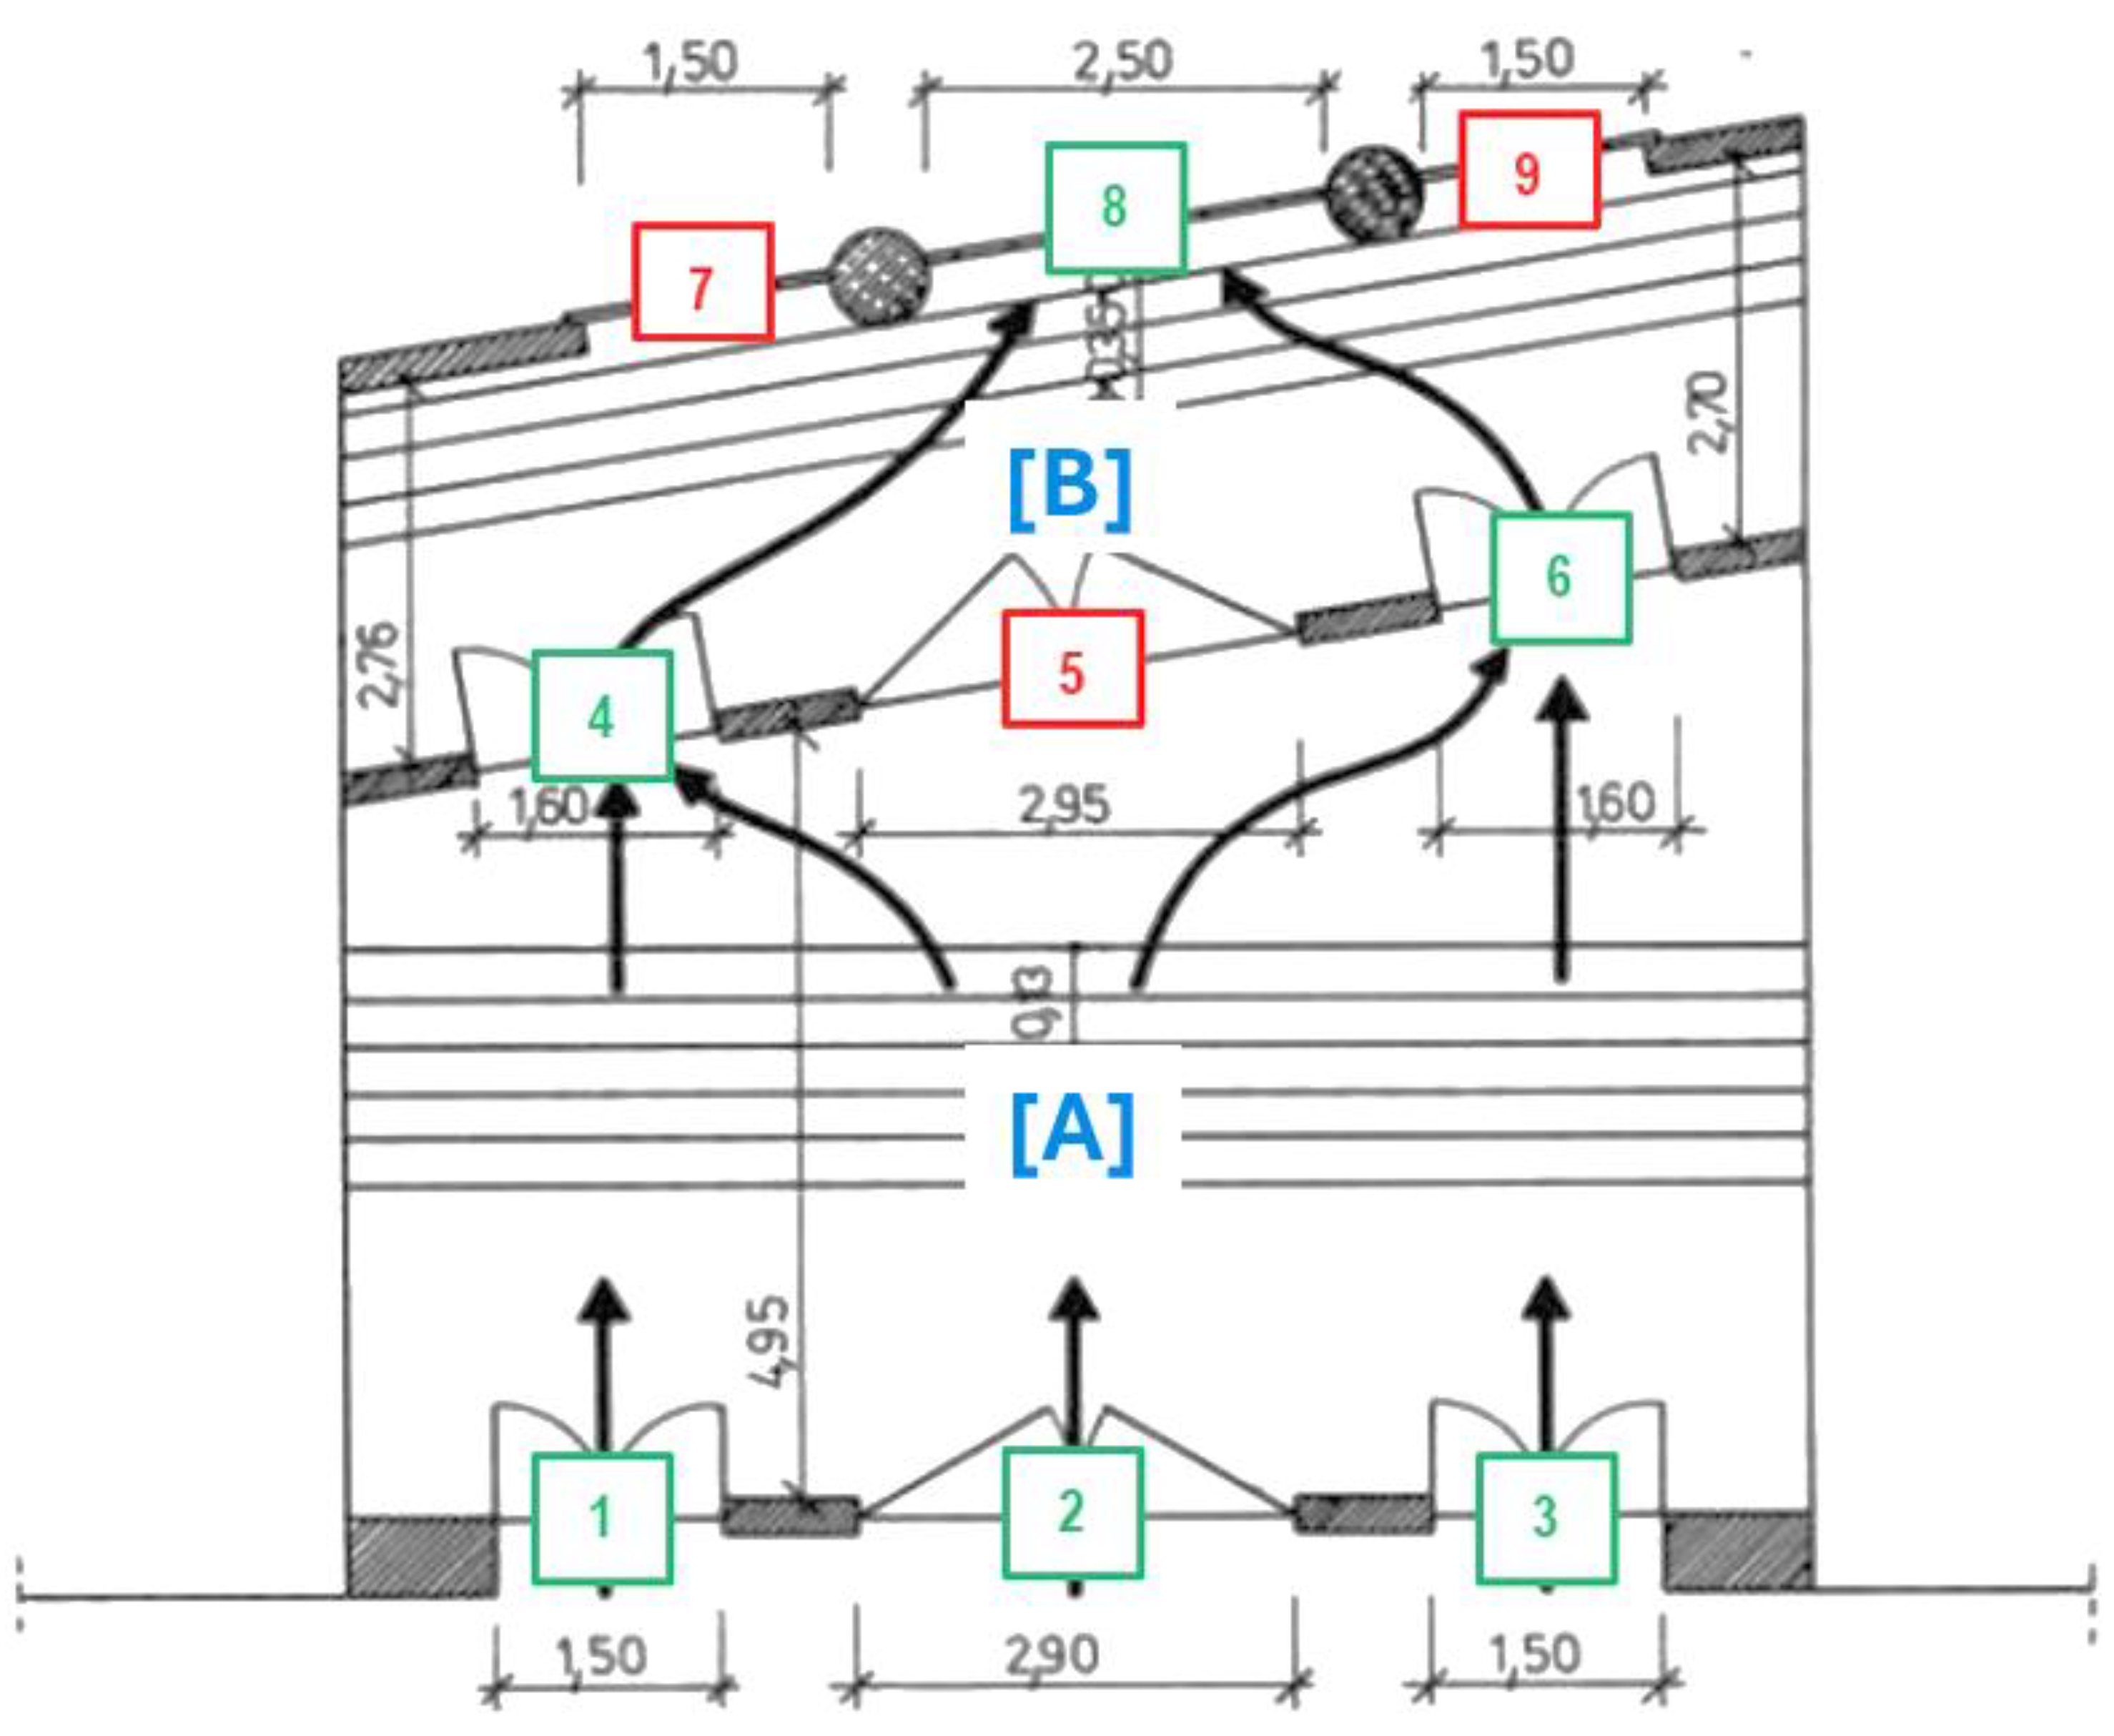
Figure 9.
Burnt first emergency exits (1) and (2) of the hall [21].
Figure 9.
Burnt first emergency exits (1) and (2) of the hall [21].
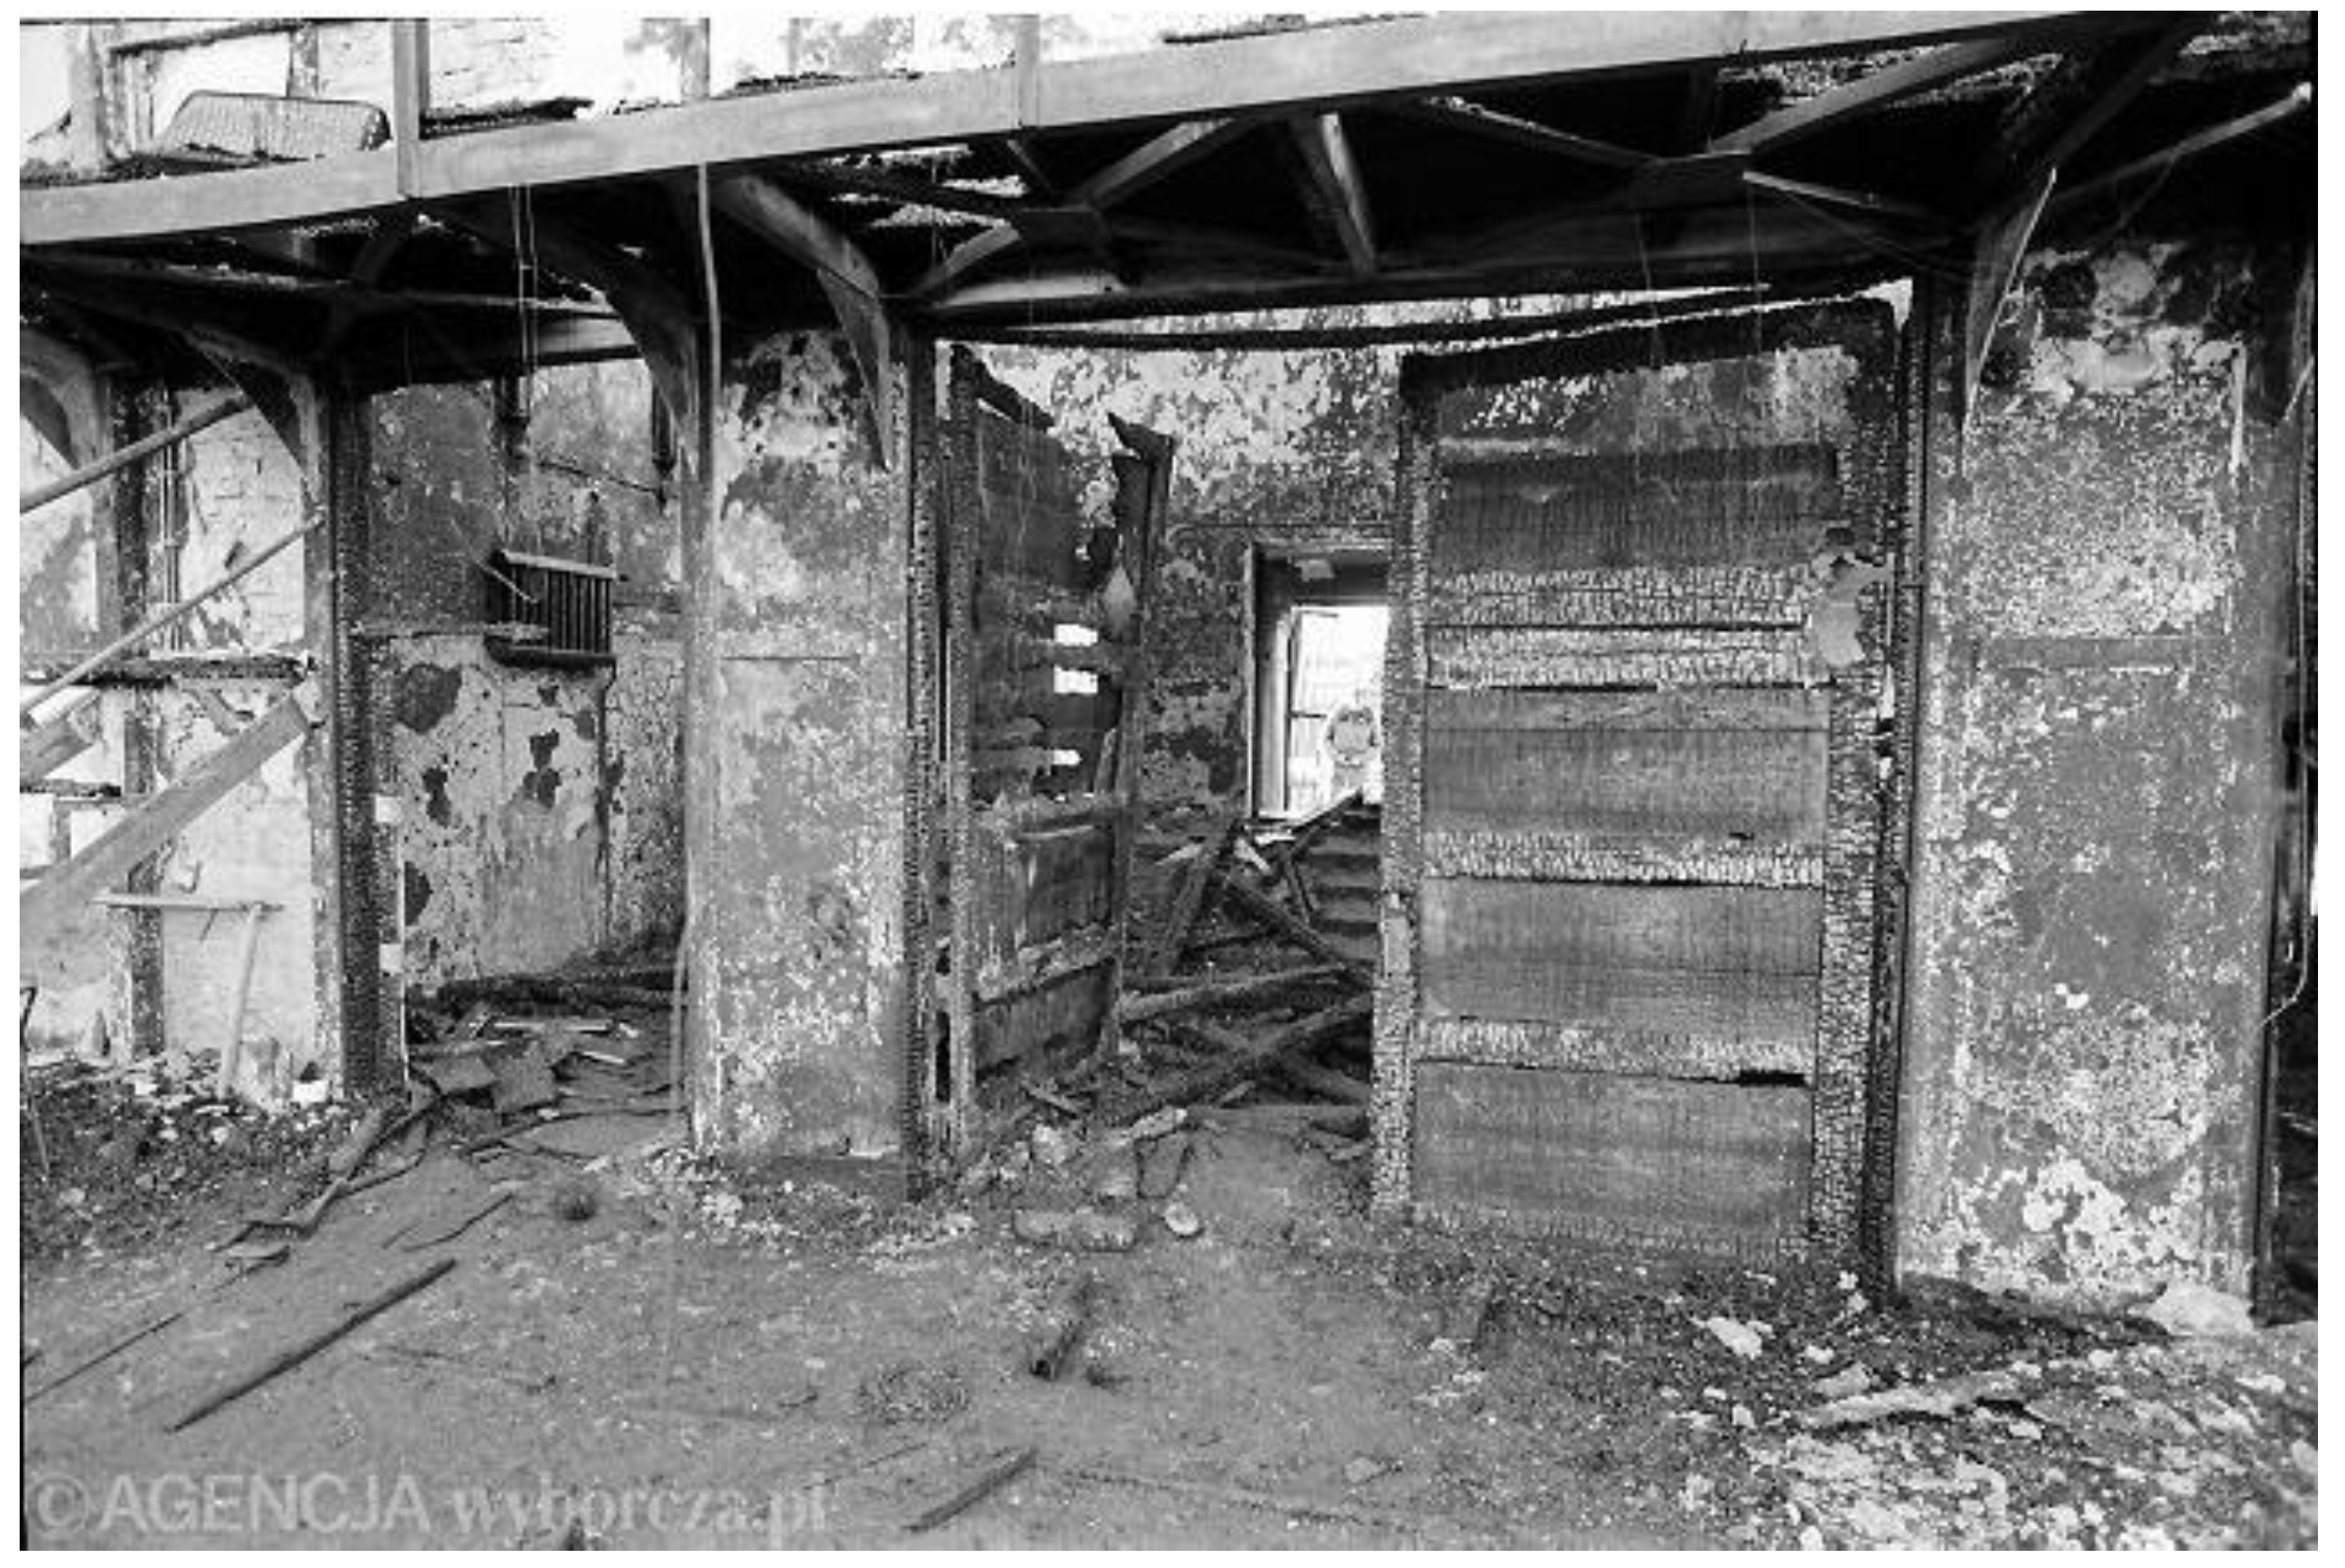
Figure 10.
Cross-section through an emergency exit.
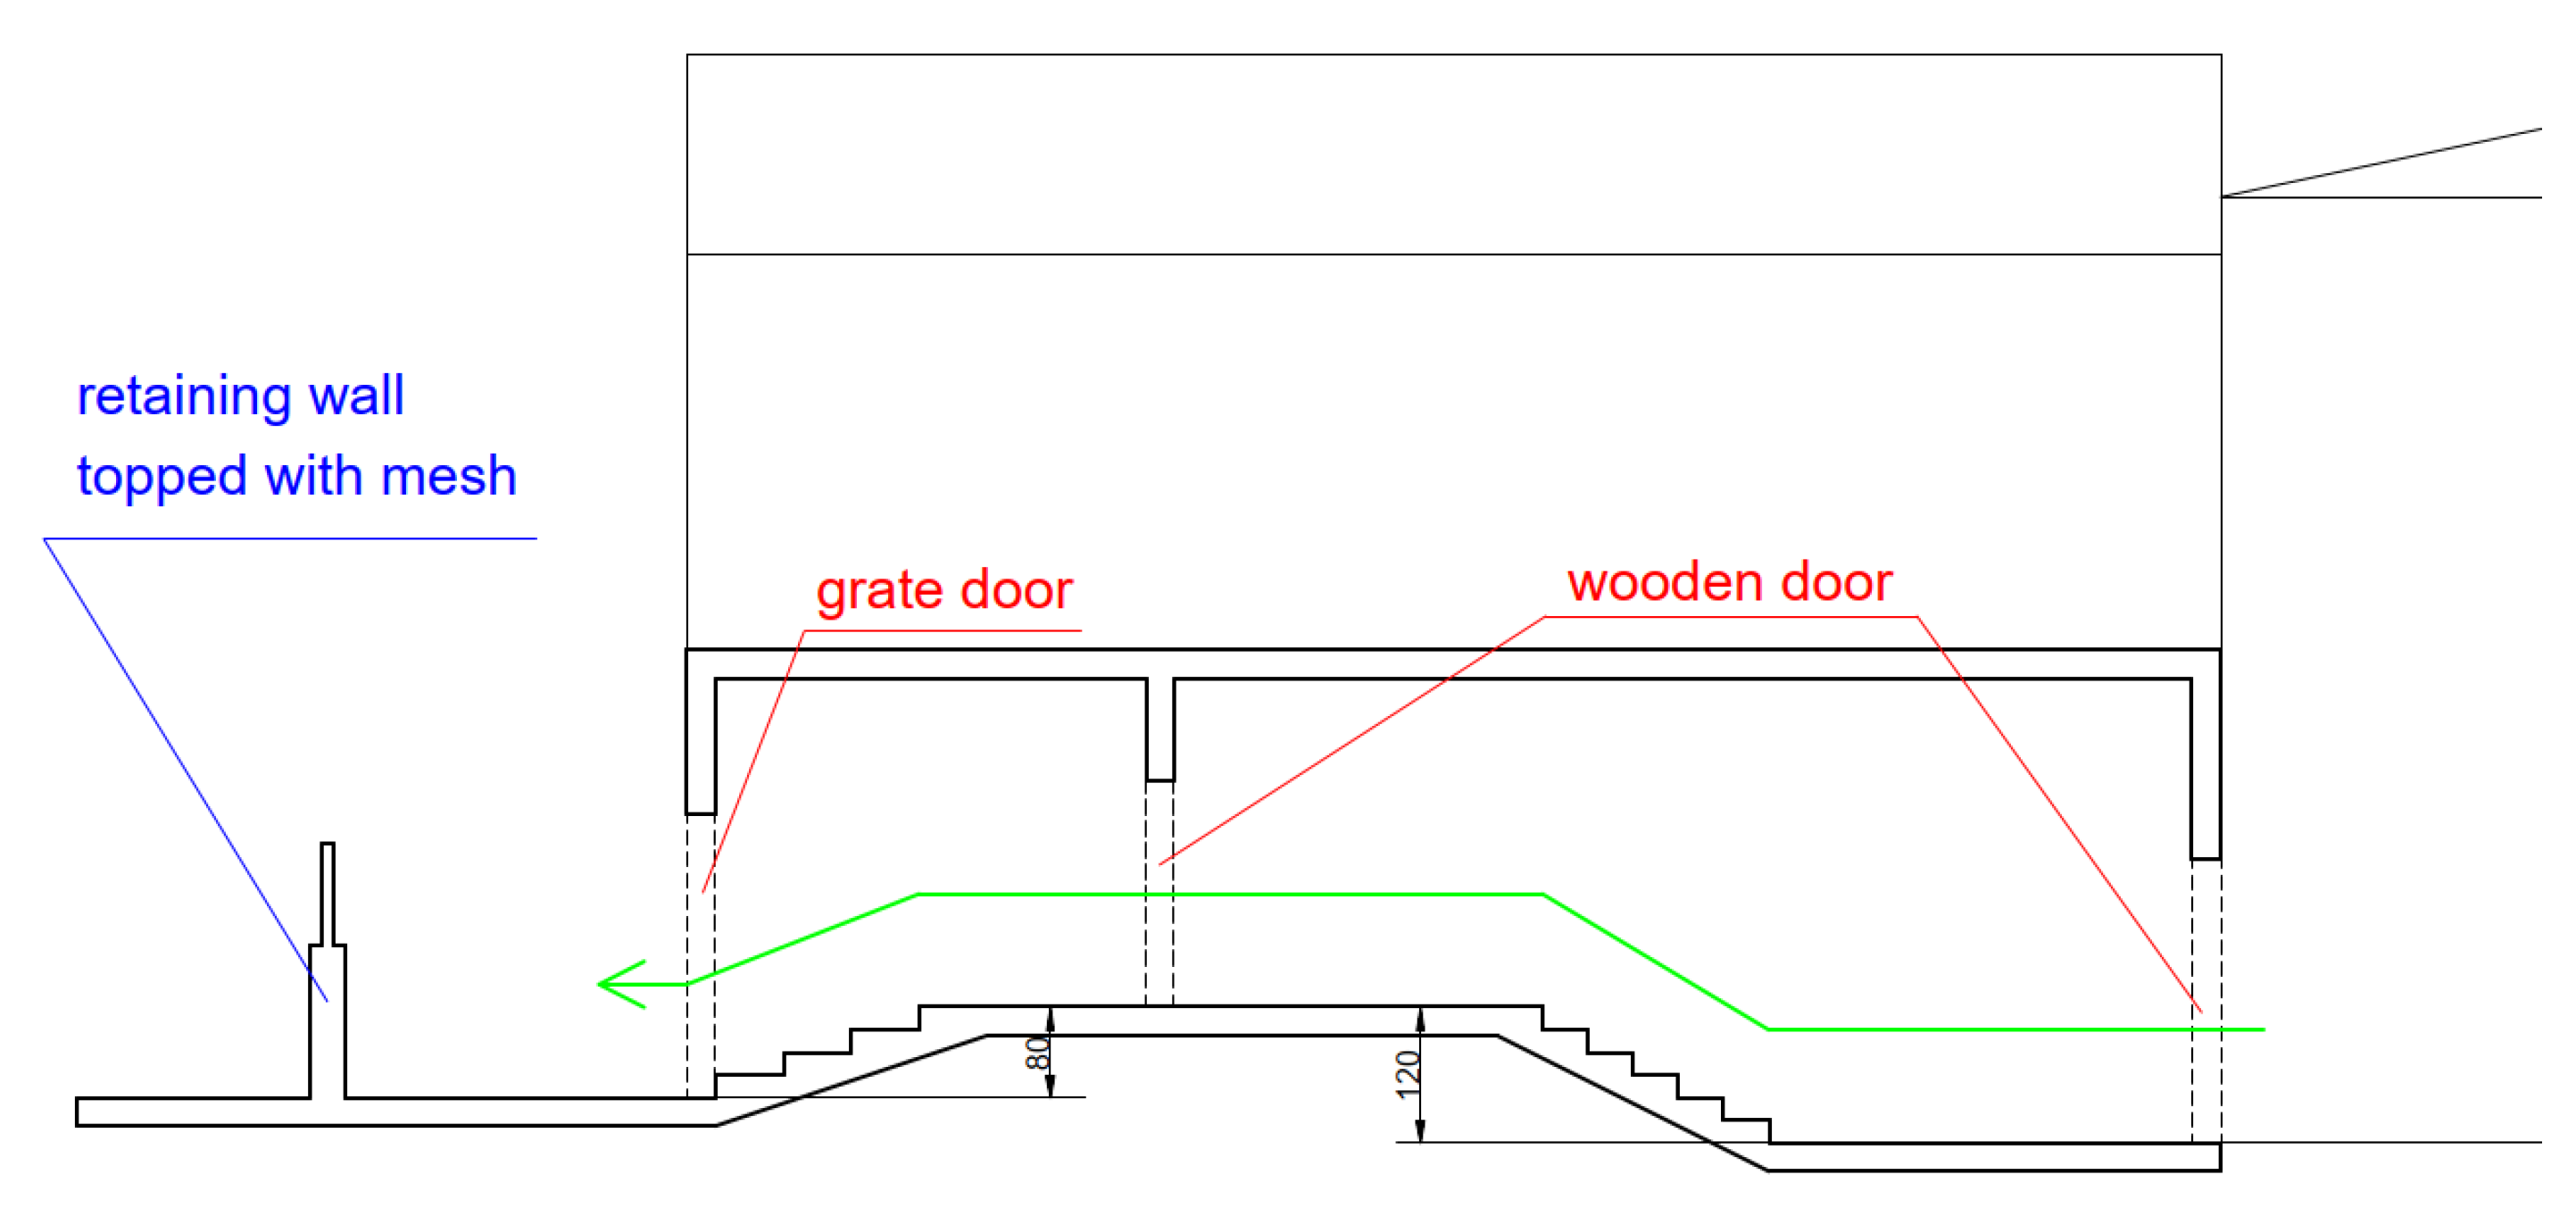
Figure 11.
Situation at the peak of the evacuation, with crosses marking intertwined, immobilised people (a blocking pile) [10].
Figure 11.
Situation at the peak of the evacuation, with crosses marking intertwined, immobilised people (a blocking pile) [10].
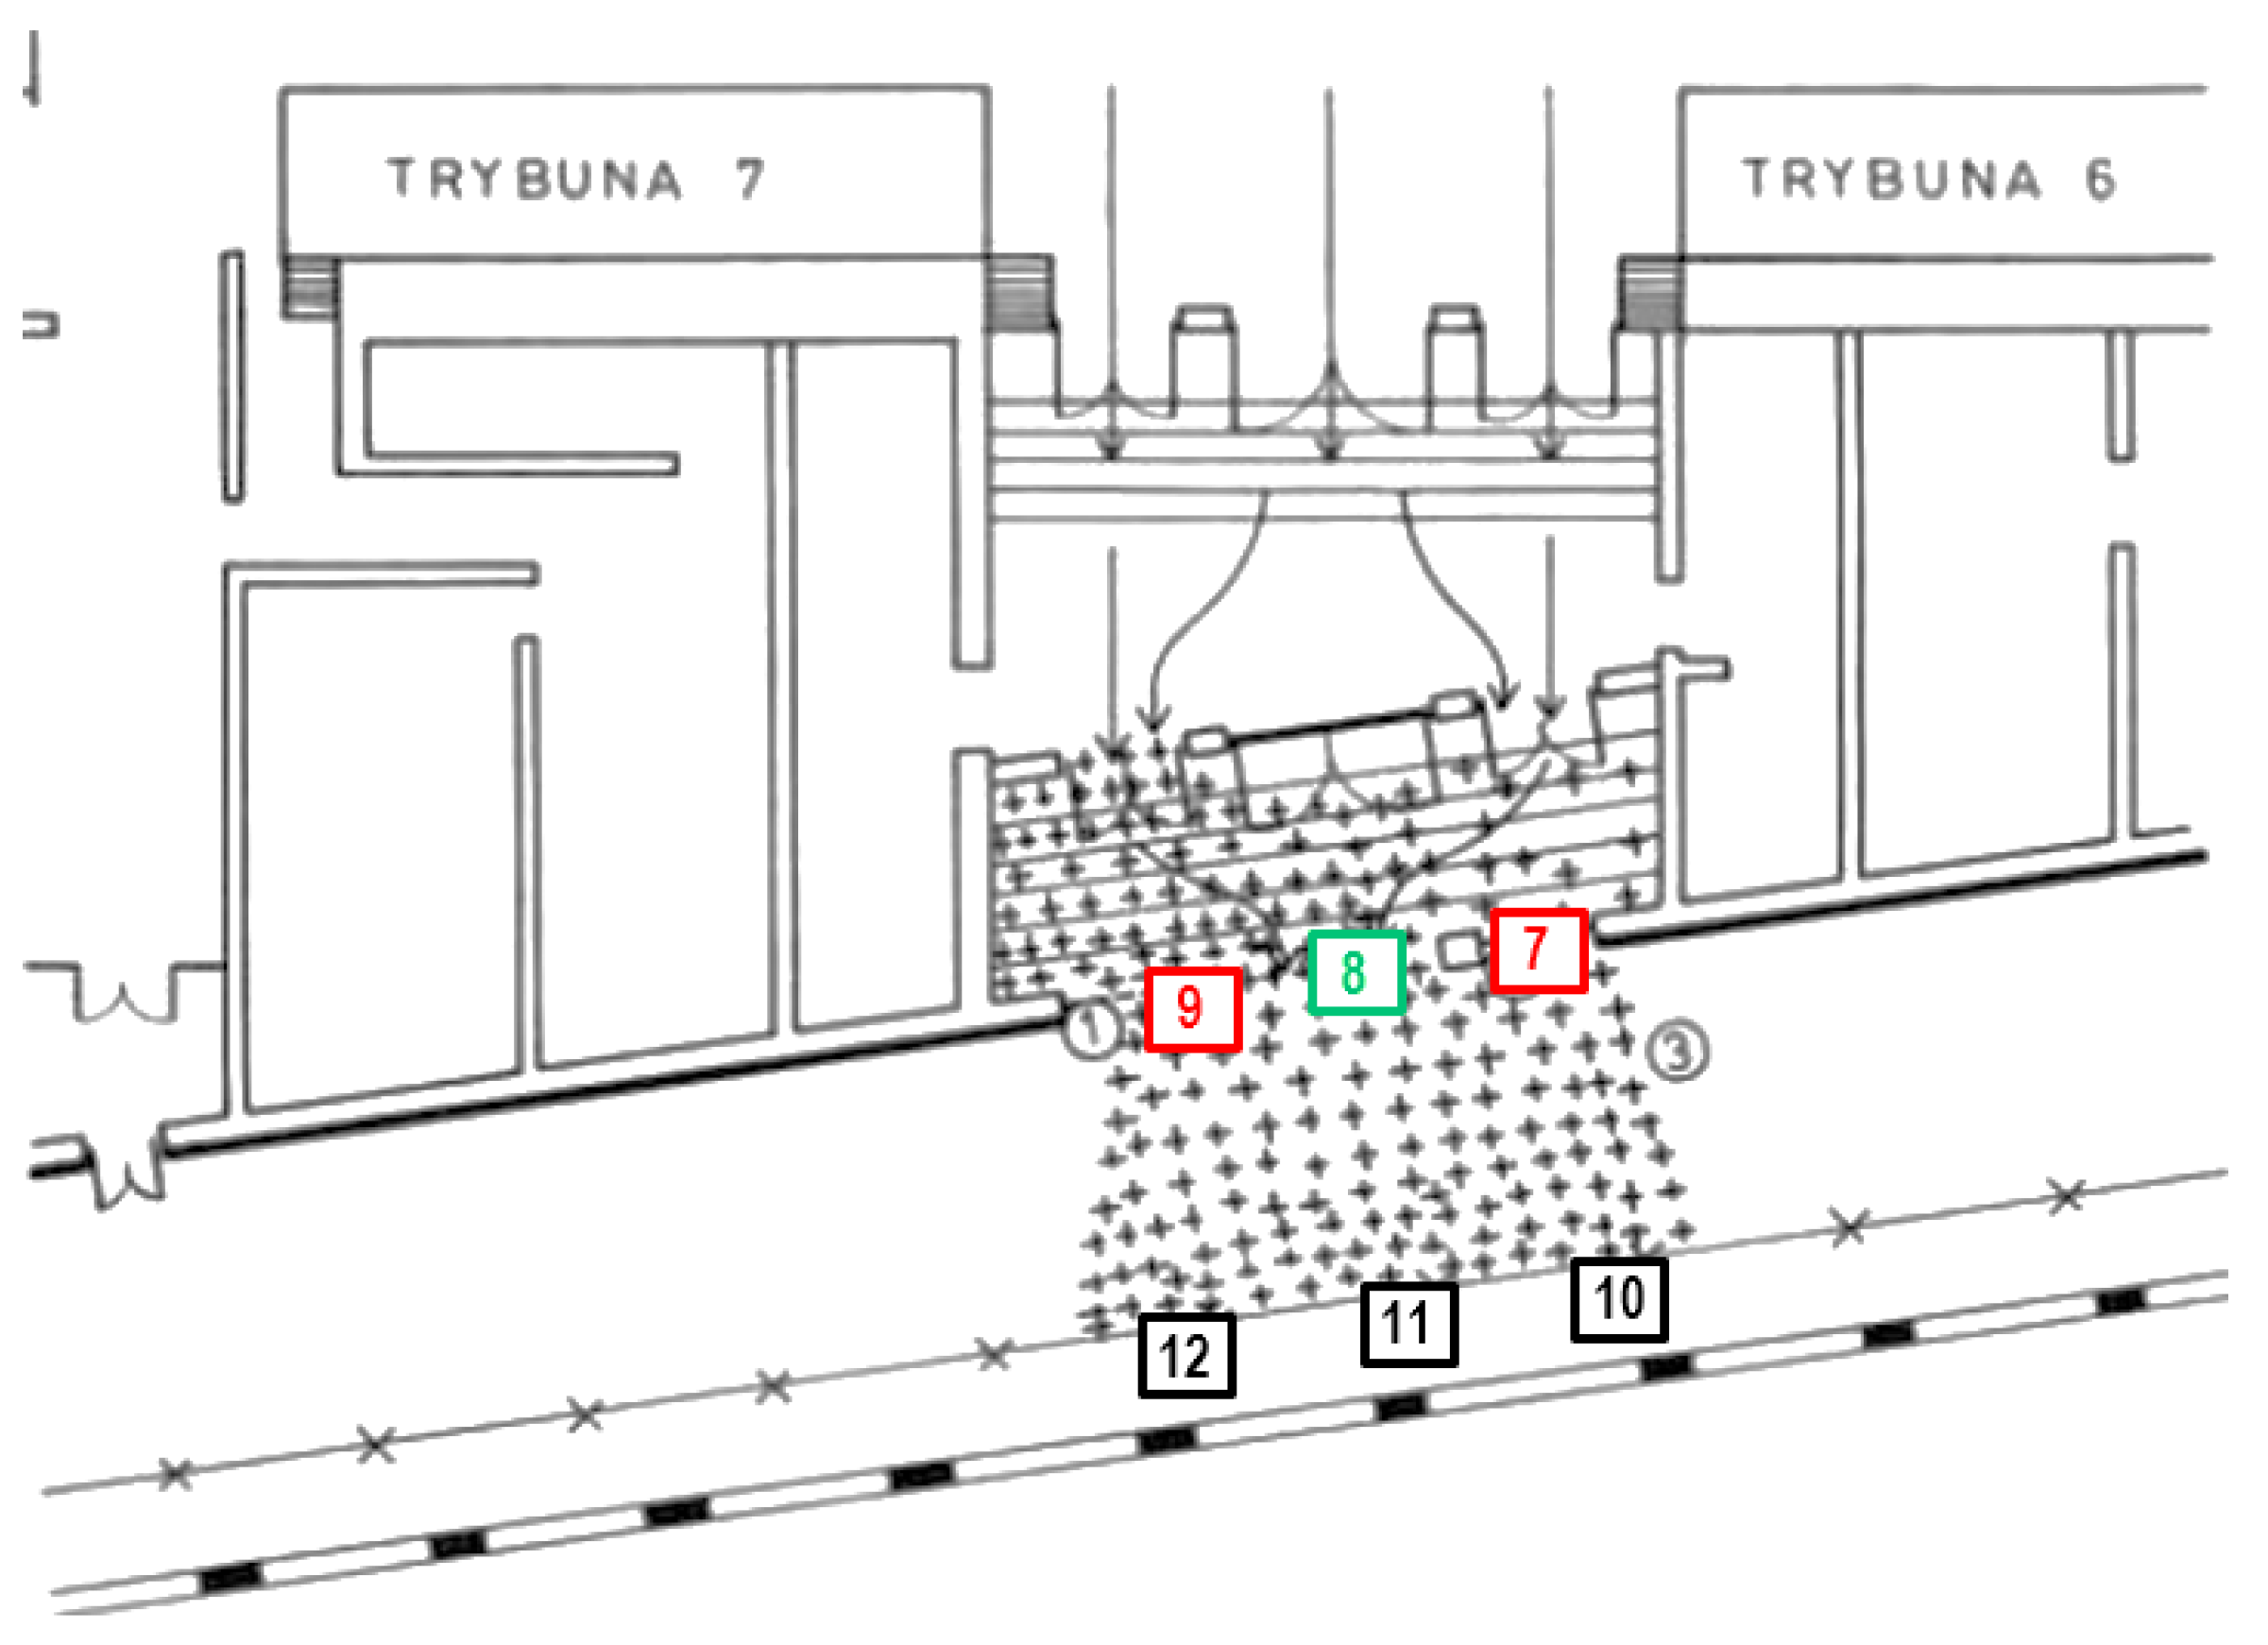
Figure 12.
External emergency exit from the hall onto Jana z Kolna street. The photo shows the results of the rescue teams’ efforts: bent grating bars and fence sections removed from the tram line (PAP/Alamy Stock Photo).
Figure 12.
External emergency exit from the hall onto Jana z Kolna street. The photo shows the results of the rescue teams’ efforts: bent grating bars and fence sections removed from the tram line (PAP/Alamy Stock Photo).
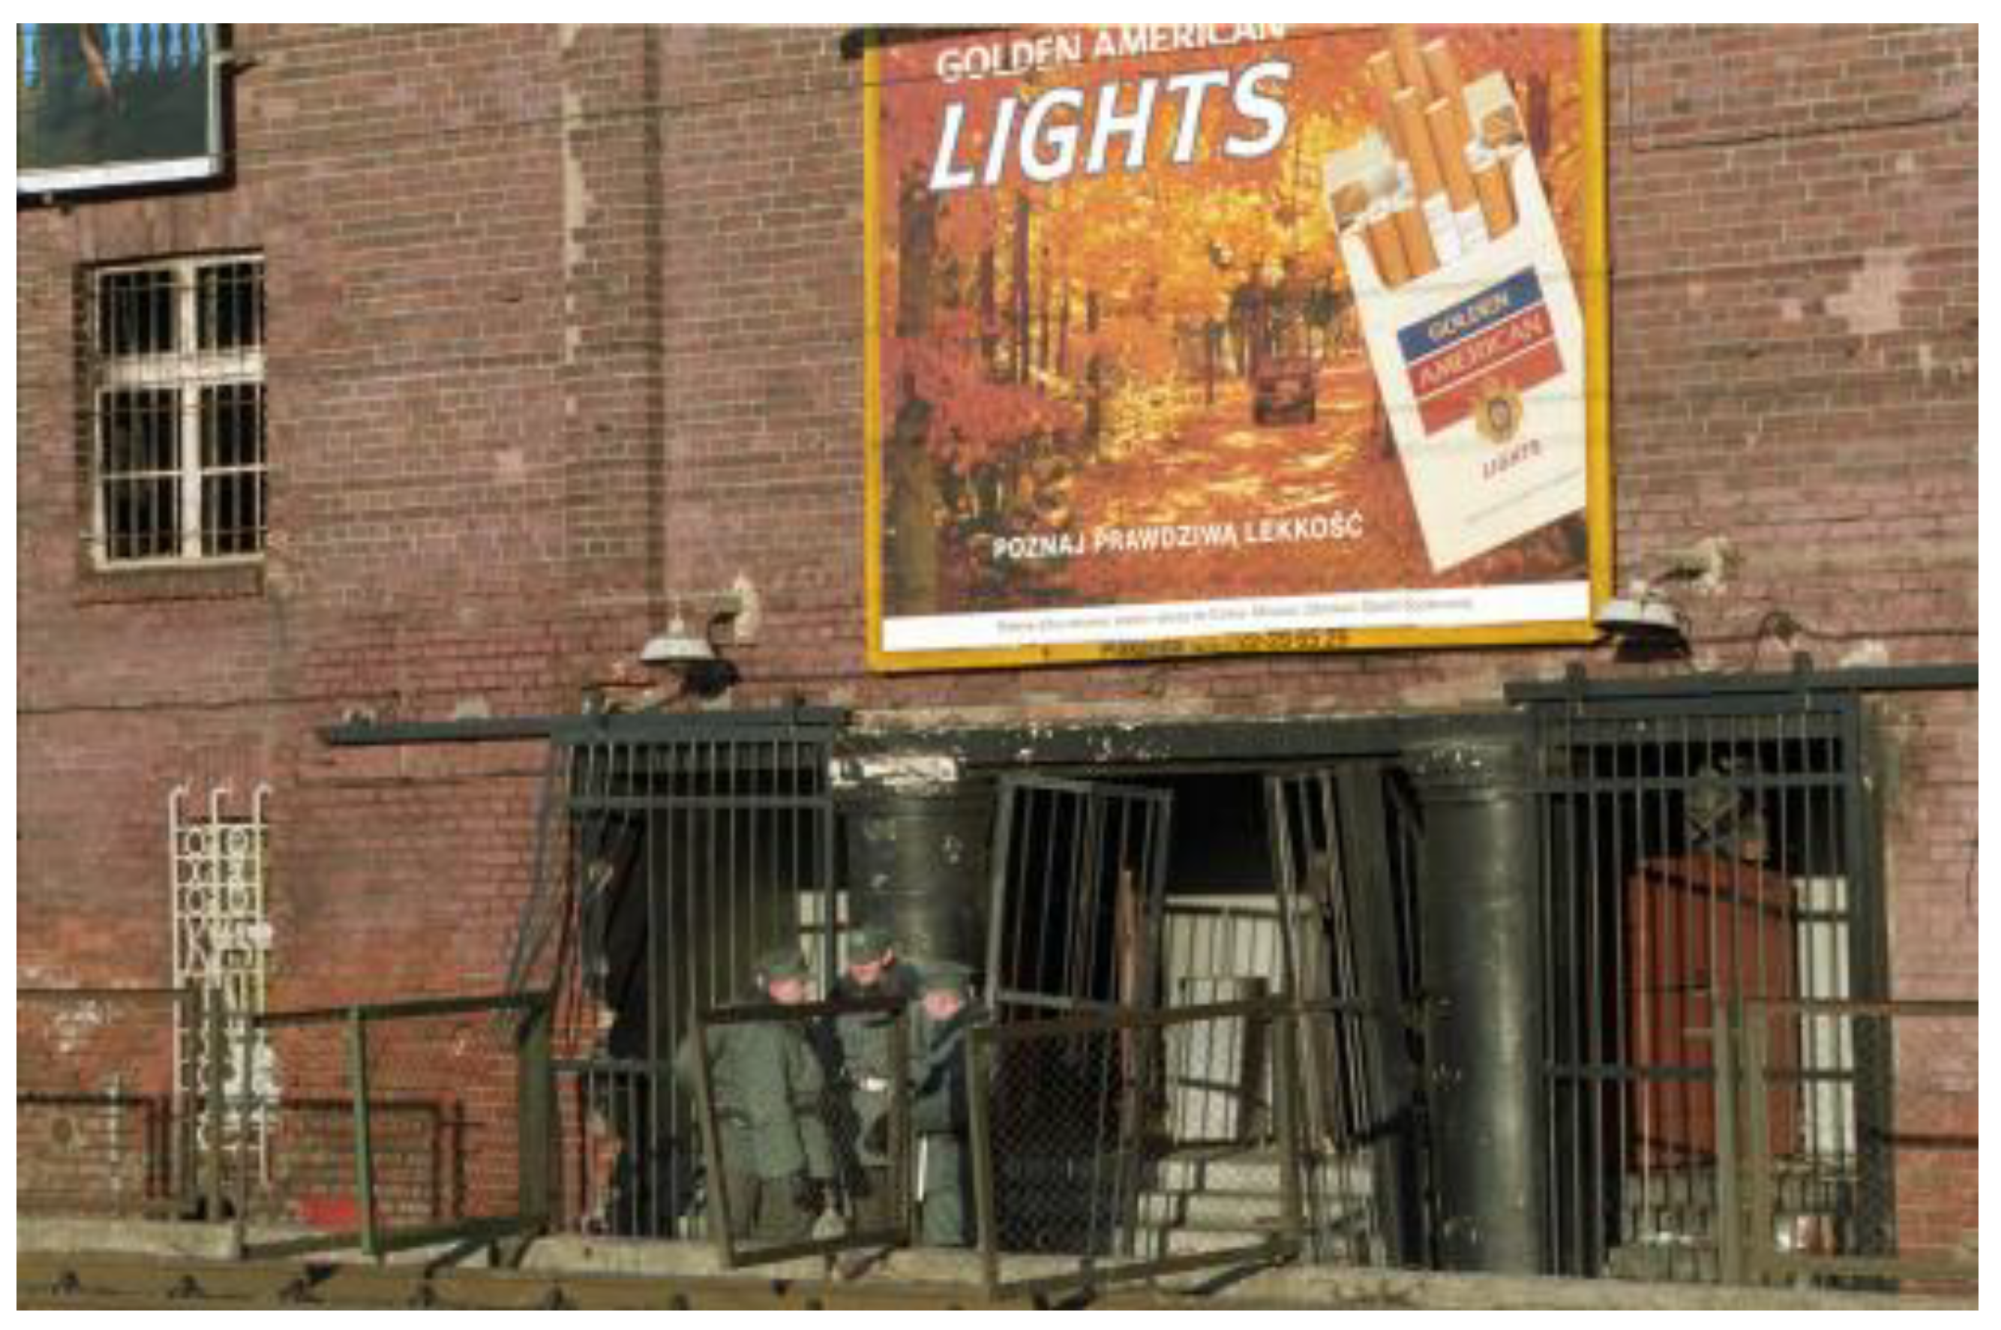
Figure 13.
Evacuation timeline.
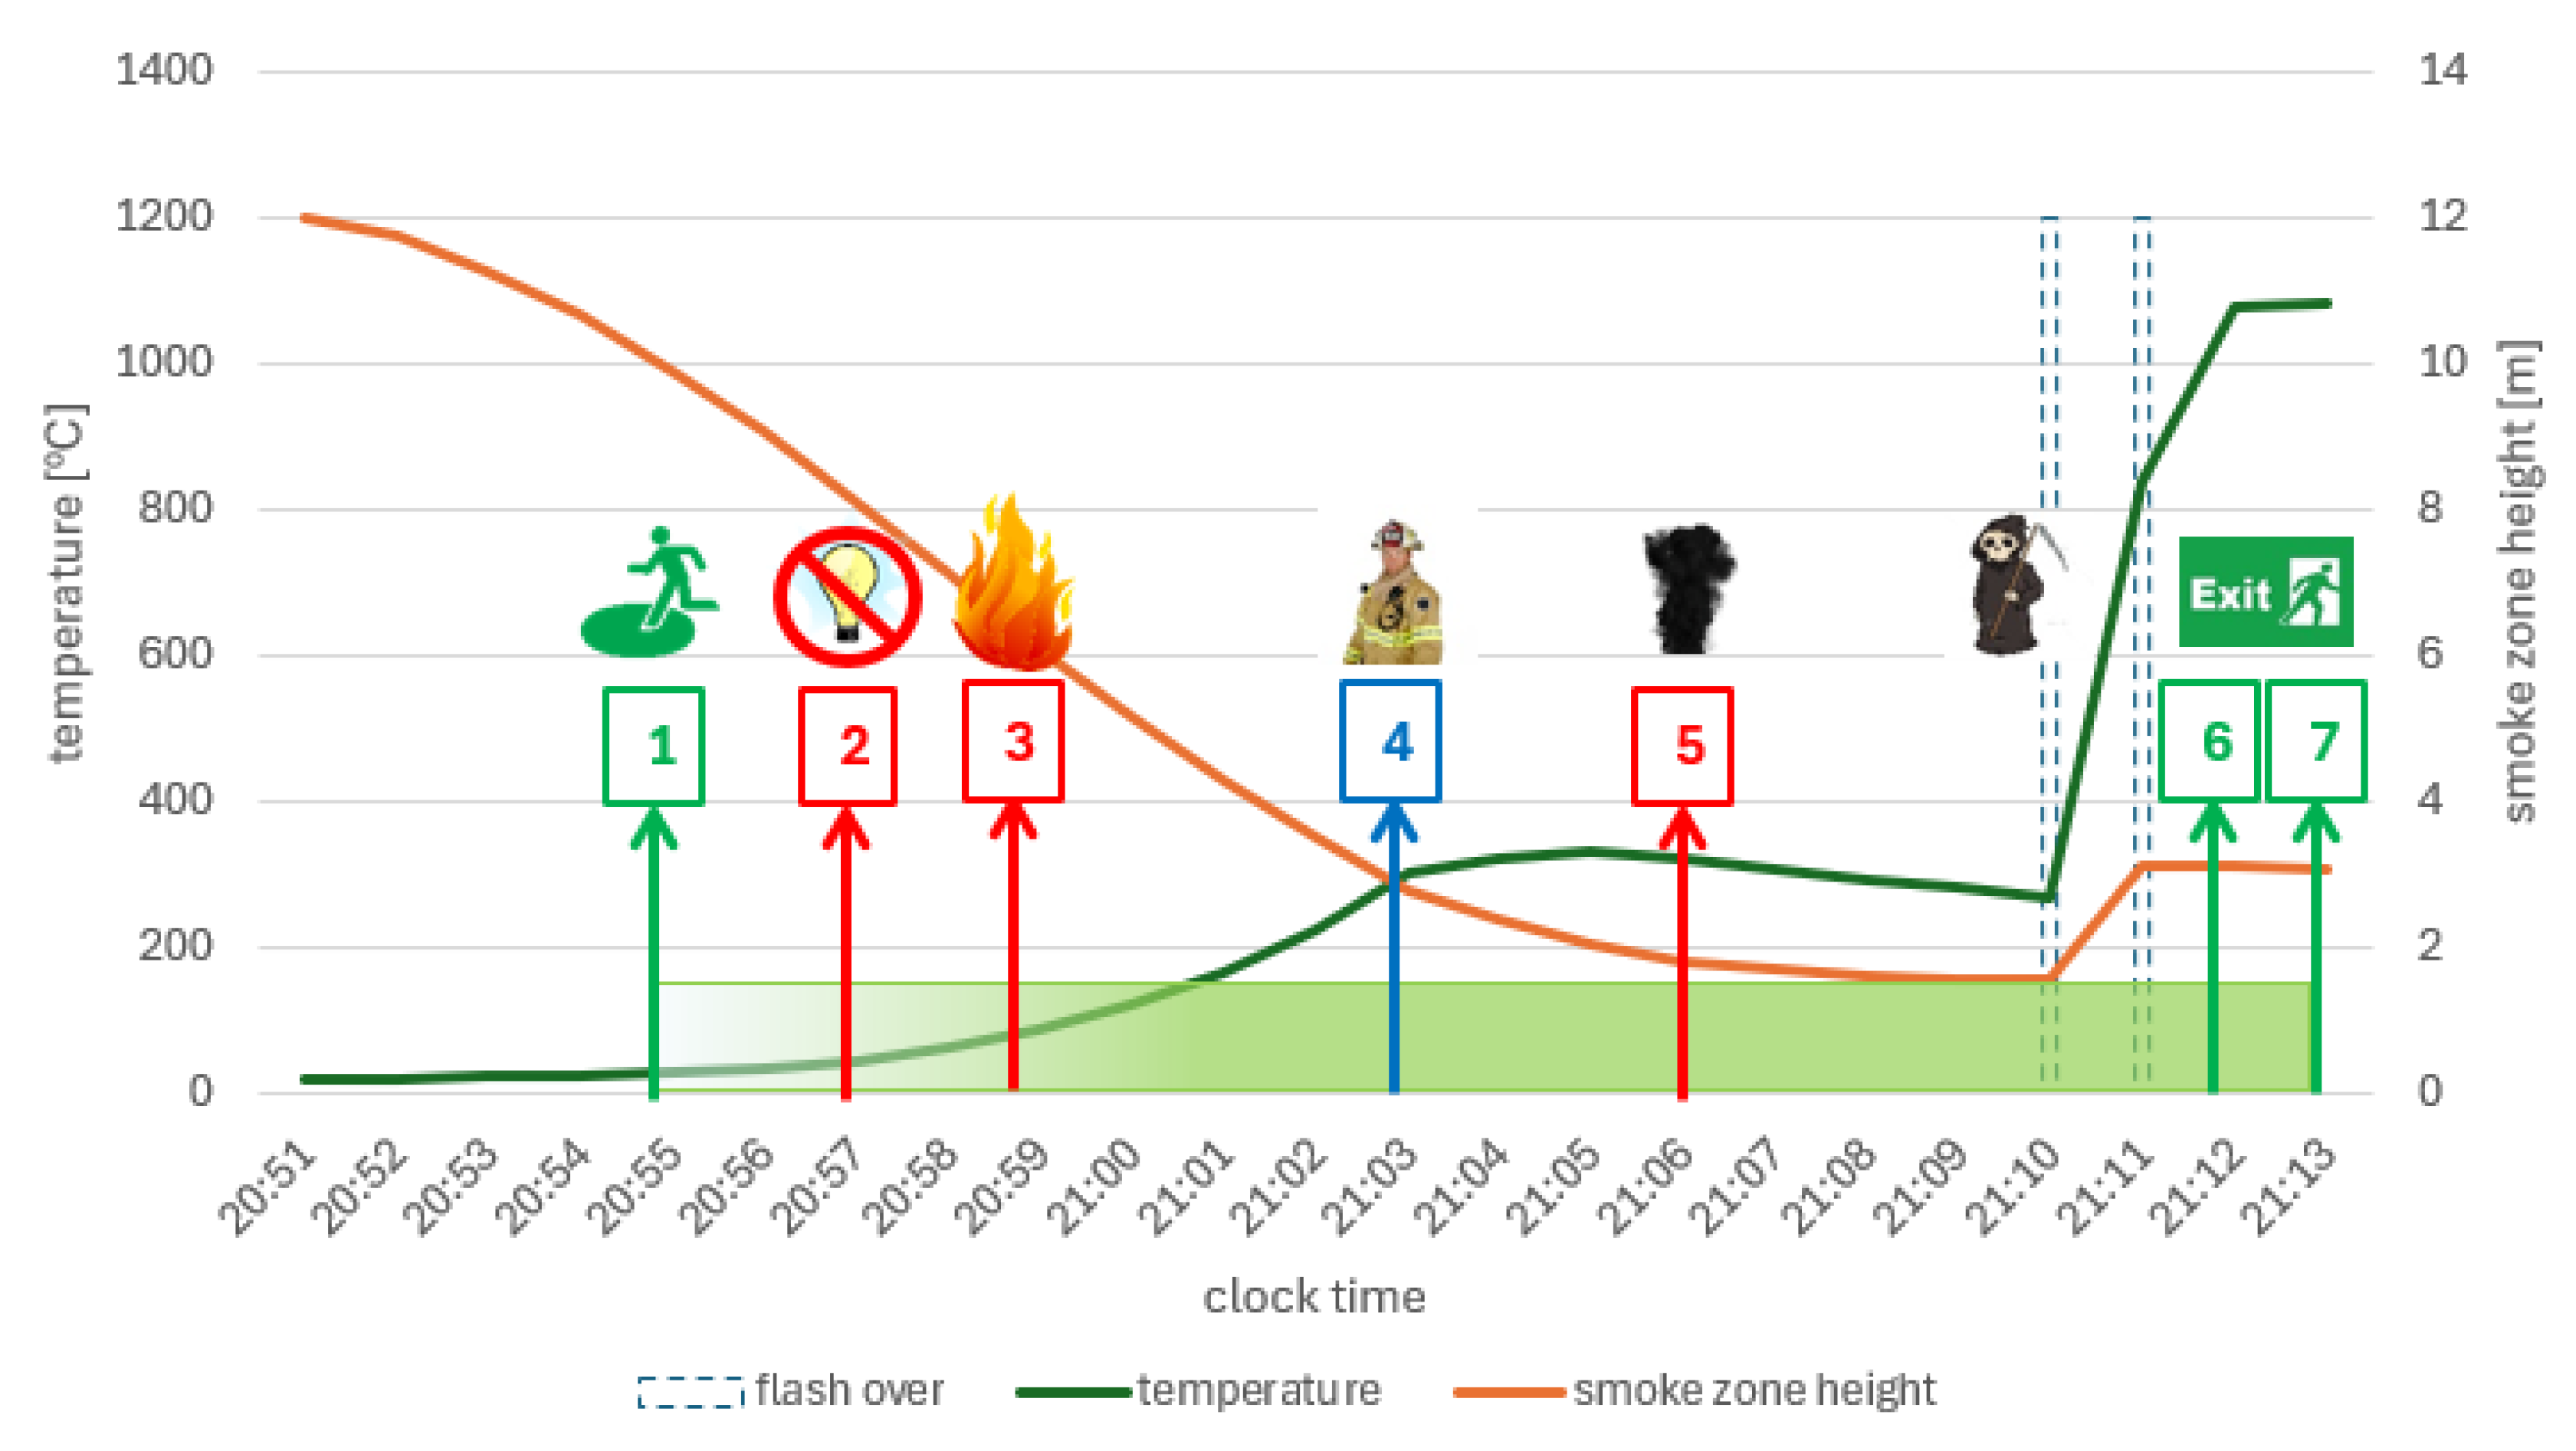
Figure 14.
Reaction time profiles for scenarios (a) 1a, 1b, 2, 3a, 3b and 4 as well as (b) 5a, 5b and 6.
Figure 14.
Reaction time profiles for scenarios (a) 1a, 1b, 2, 3a, 3b and 4 as well as (b) 5a, 5b and 6.
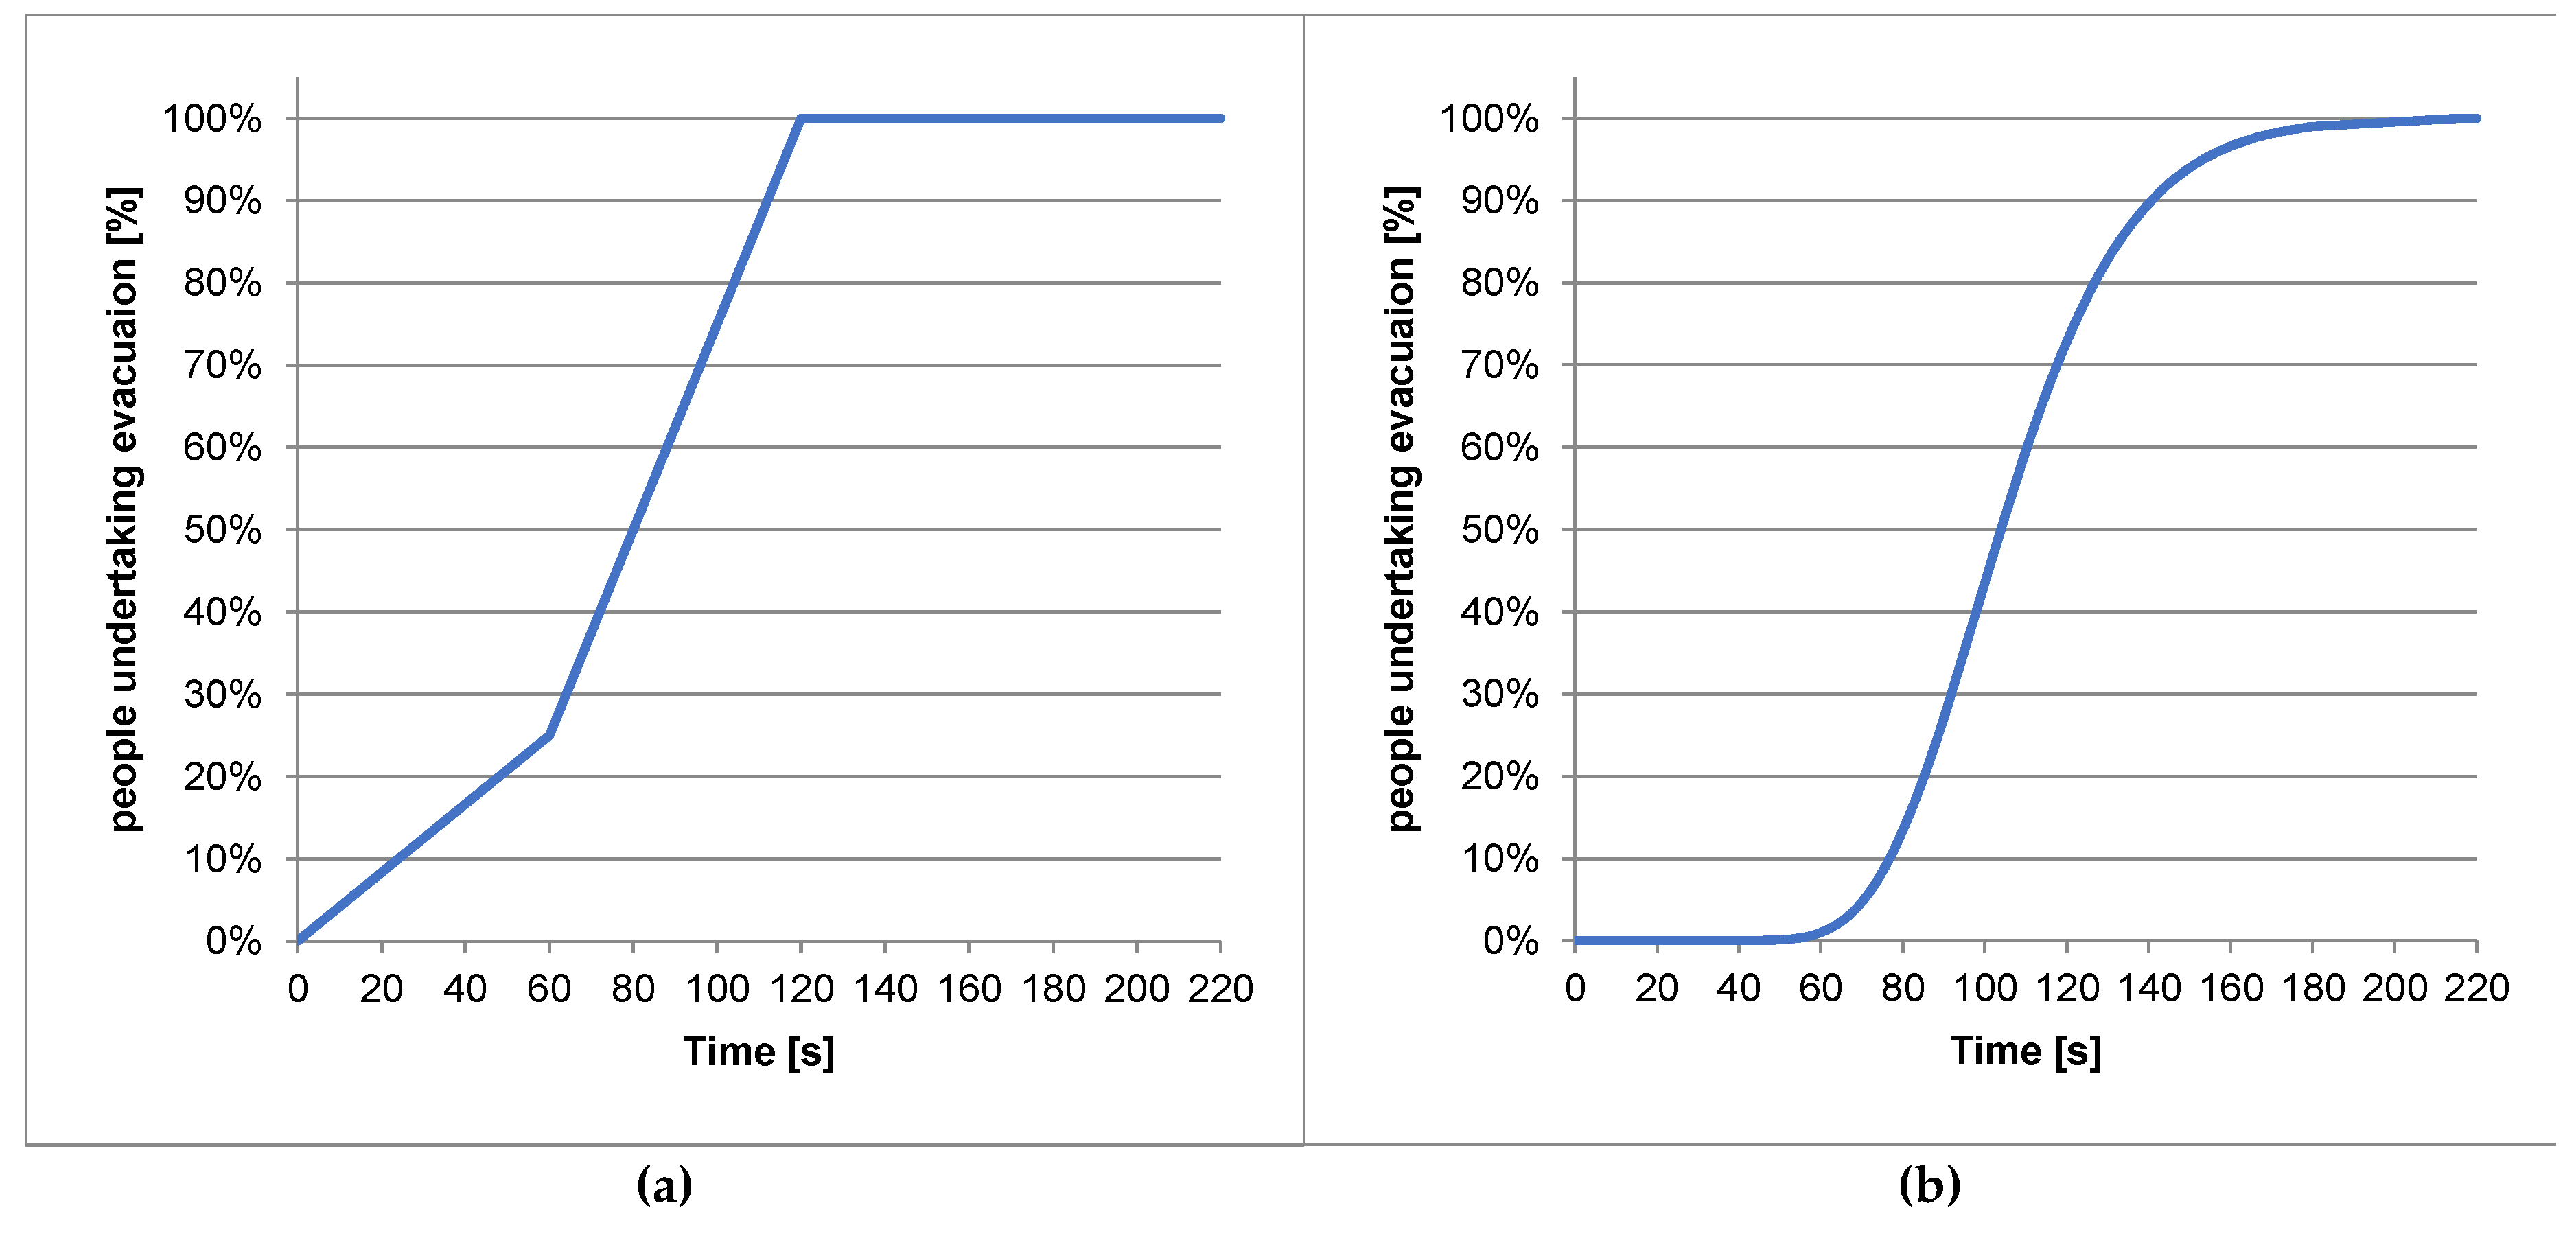
Figure 15.
Evacuation profiles in scenarios 1a, 1b and 2.
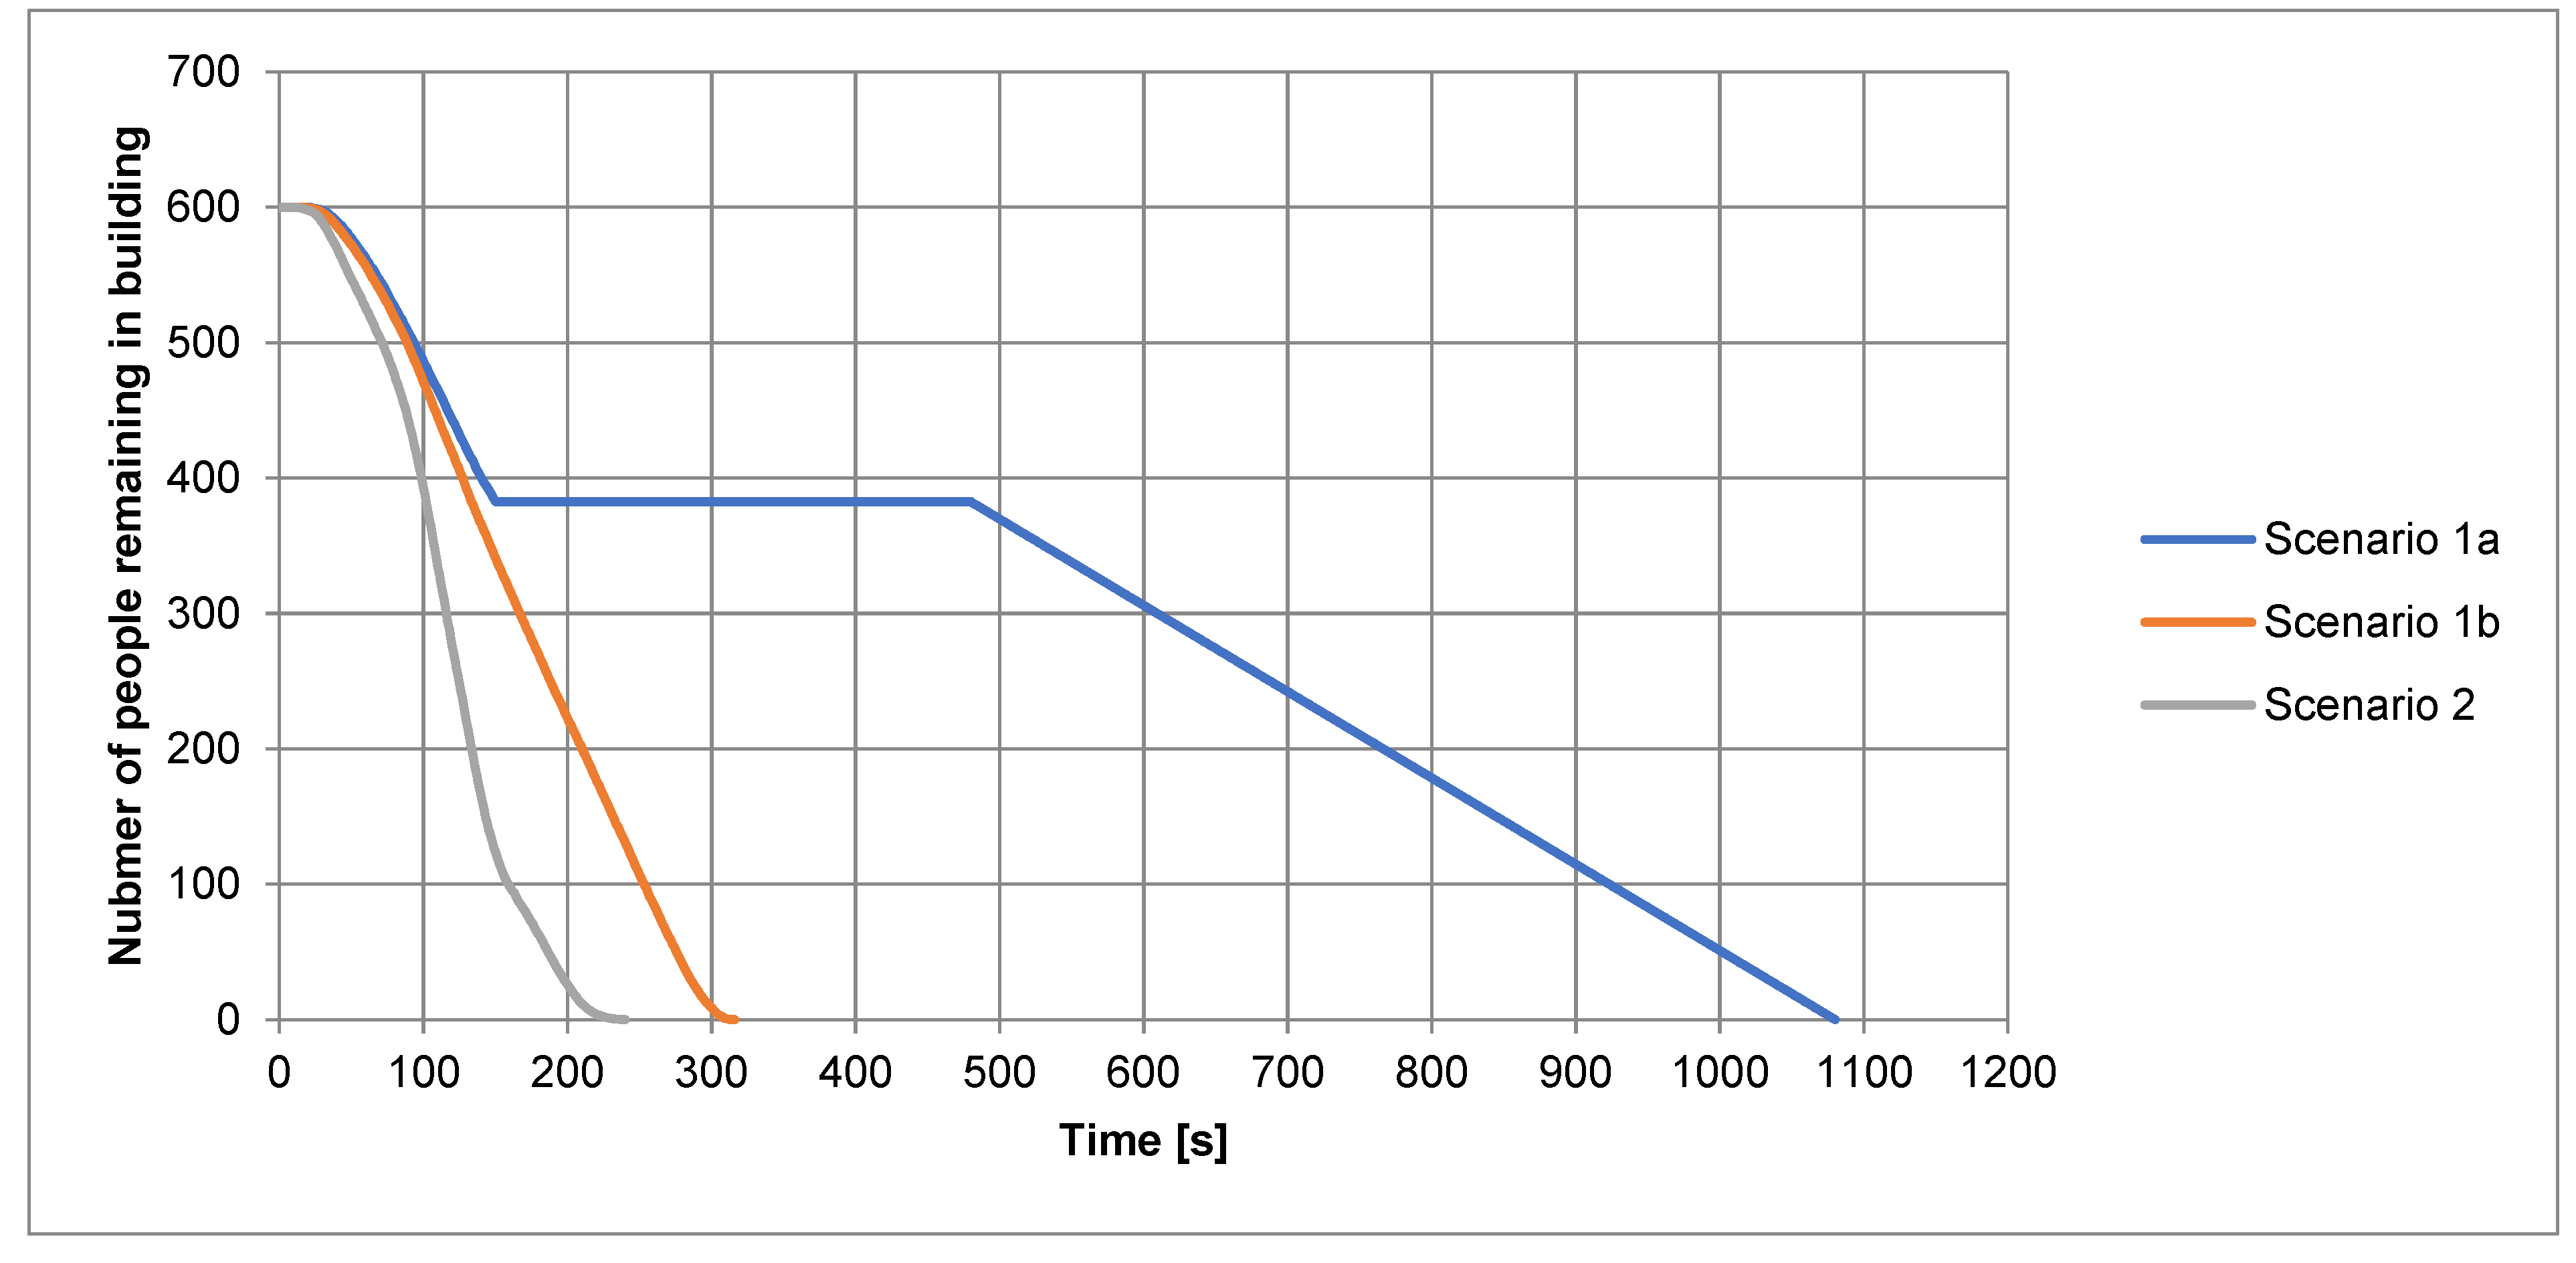
Figure 16.
Evacuation profiles in scenarios 3a, 3b and 4.
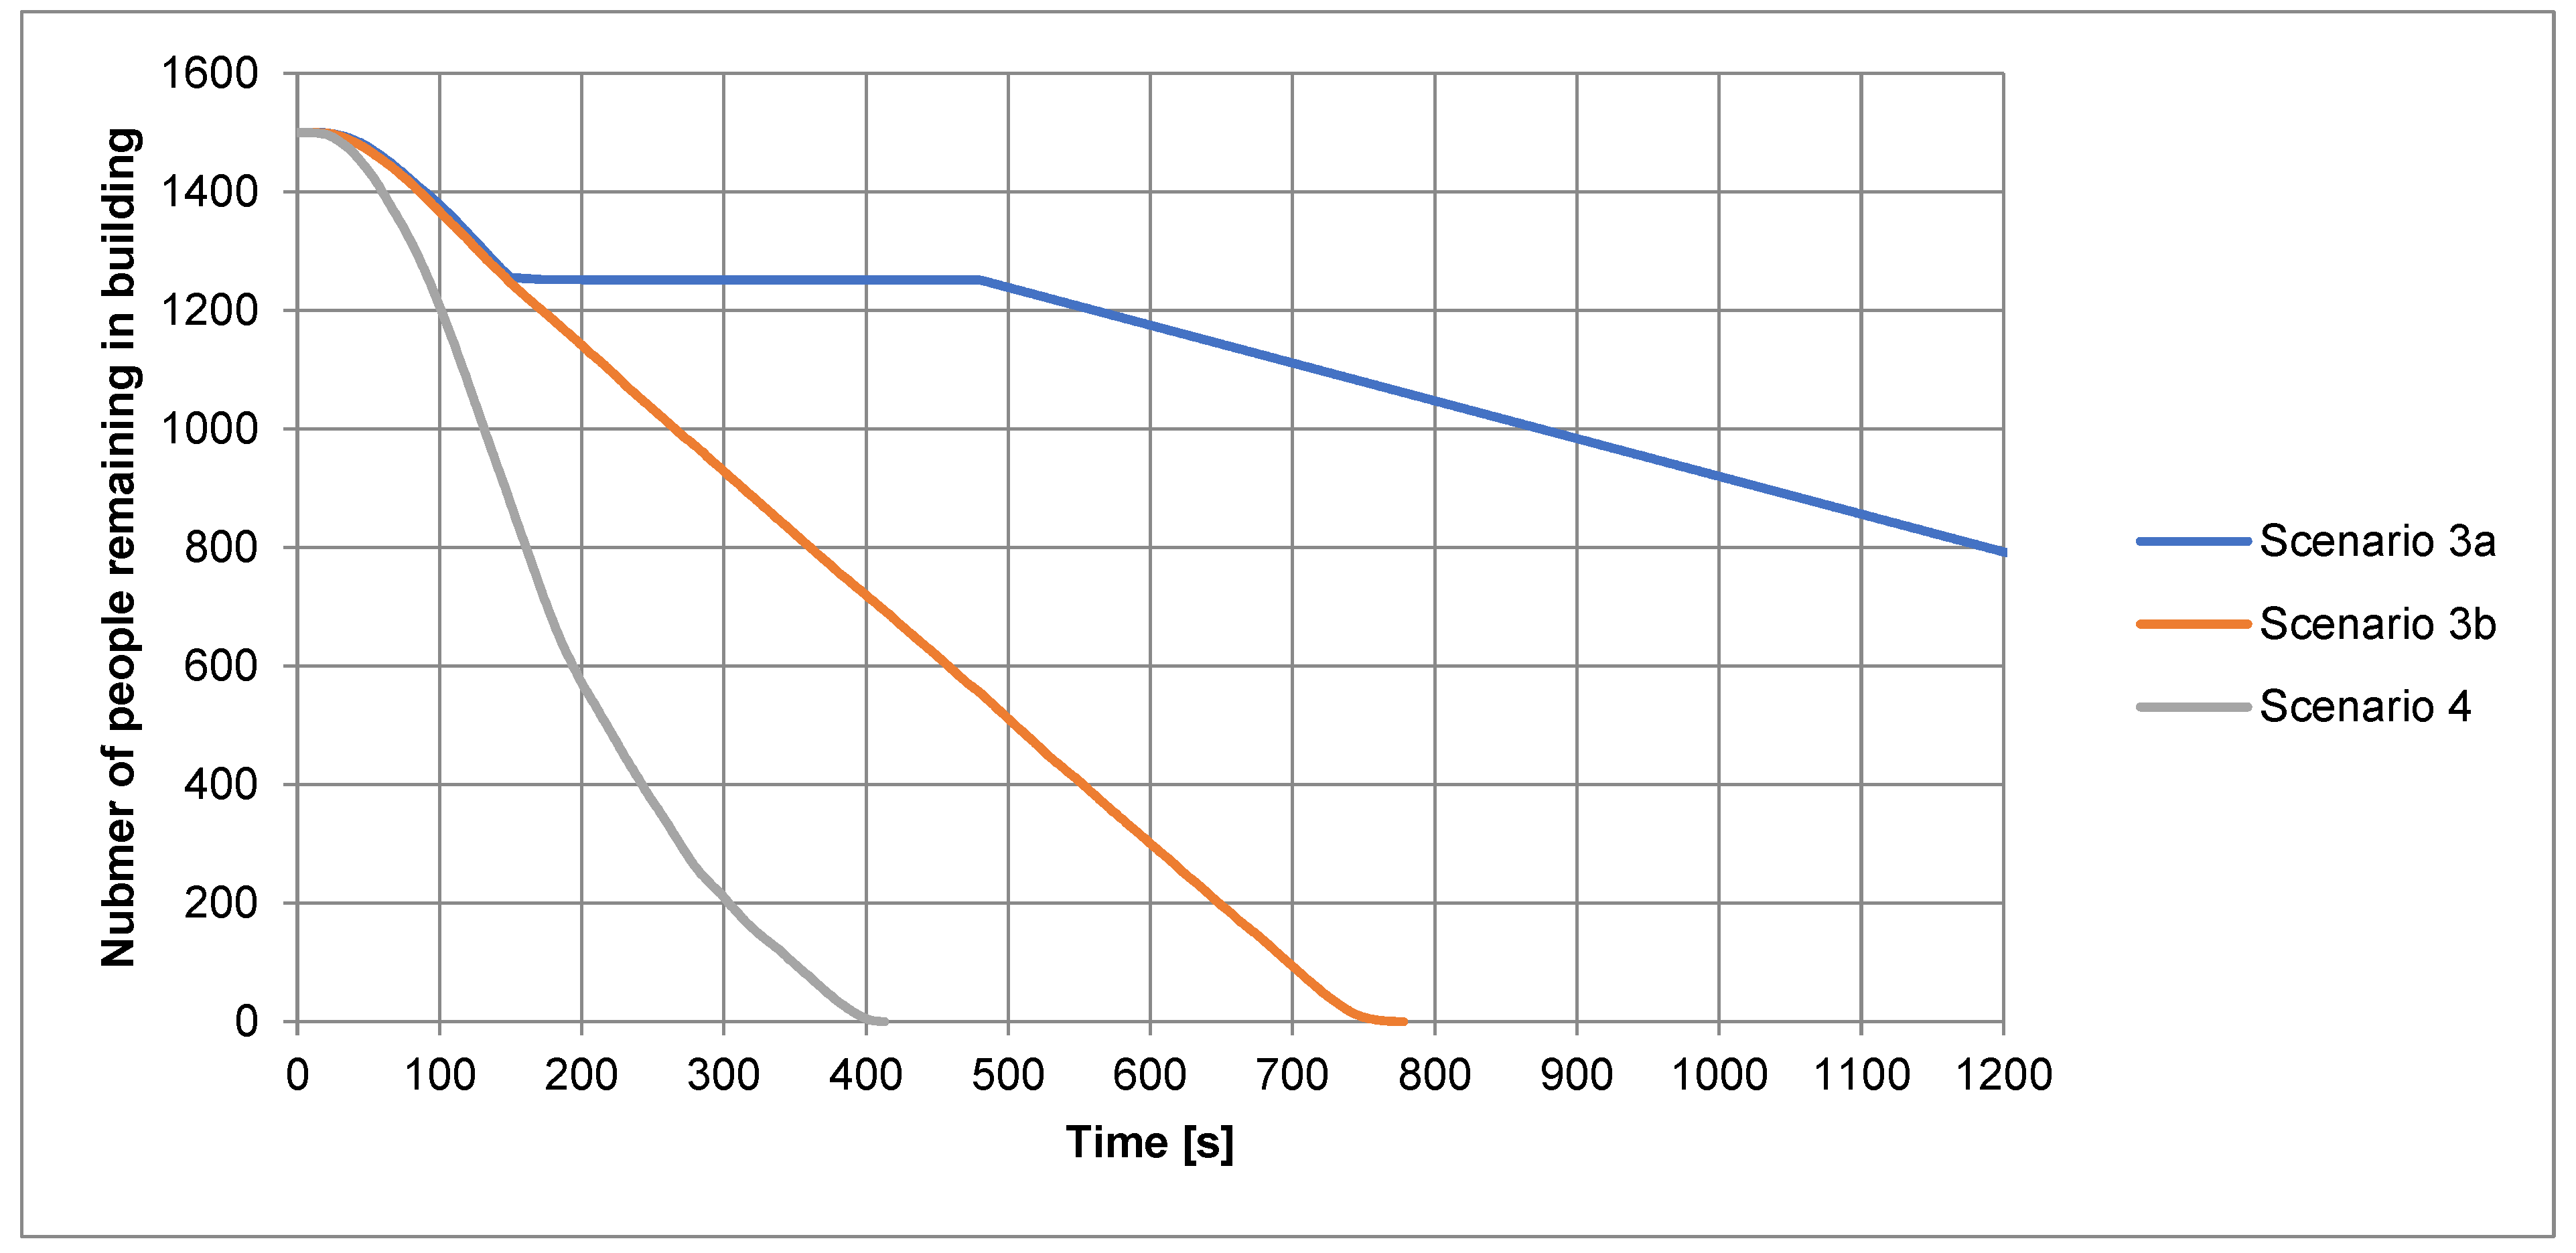
Figure 17.
Evacuation profiles in scenarios 5a, 5b and 6.
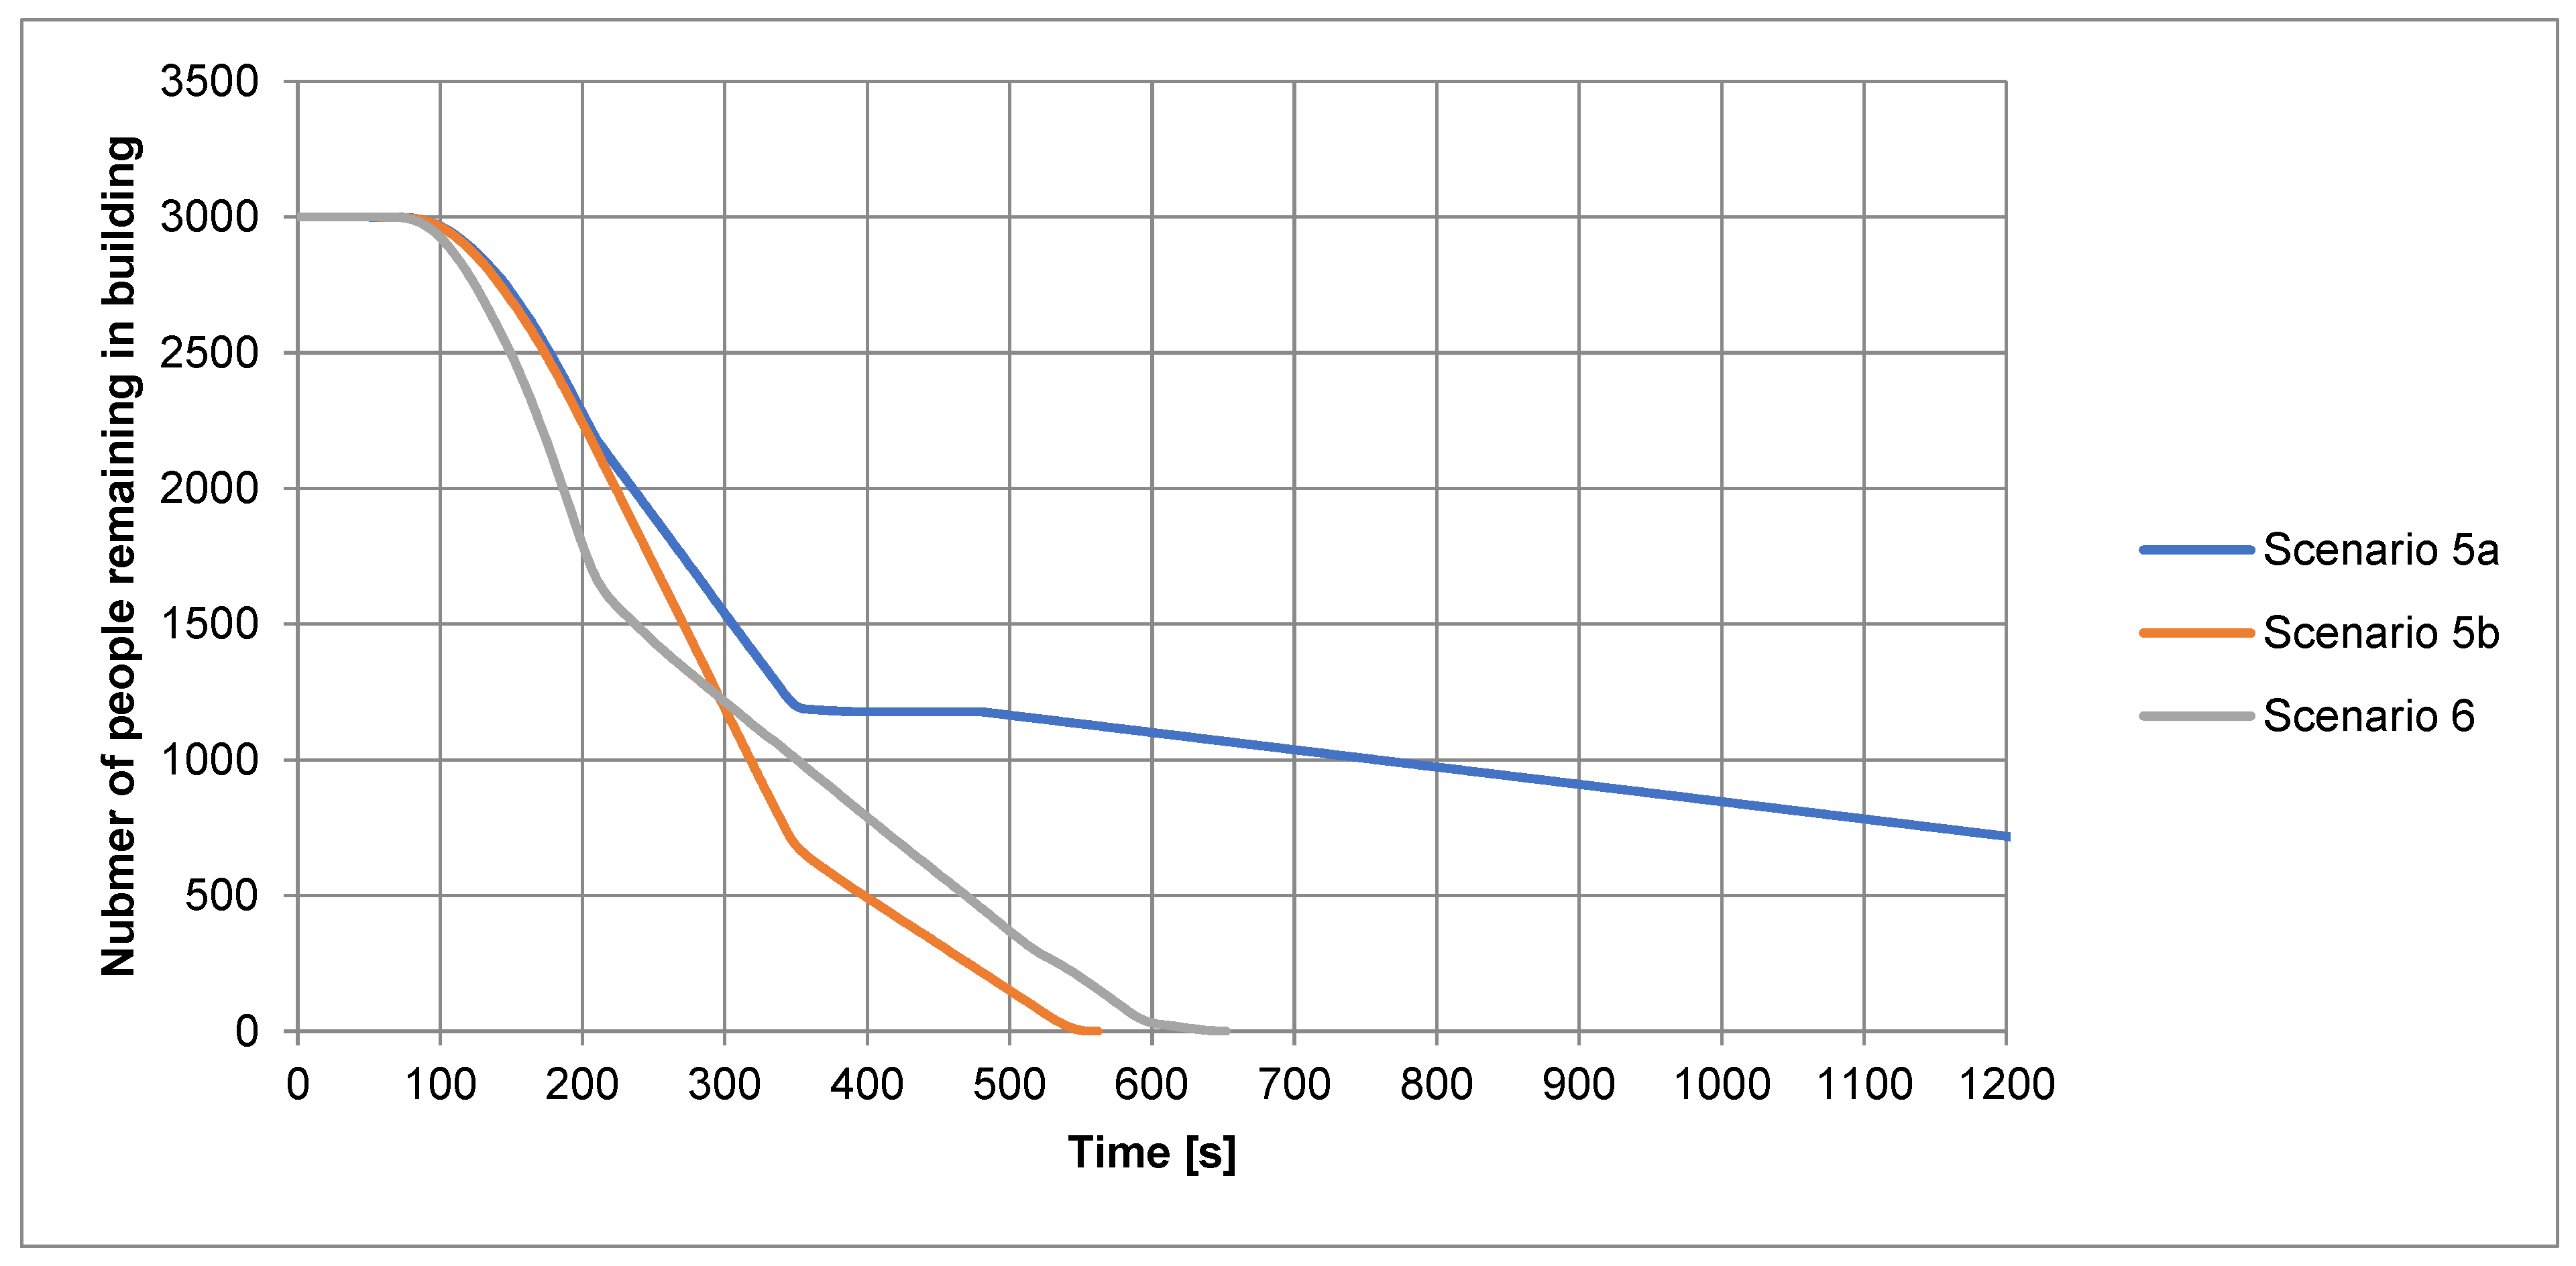
Figure 18.
Views at the start of the evacuation in different scenarios.
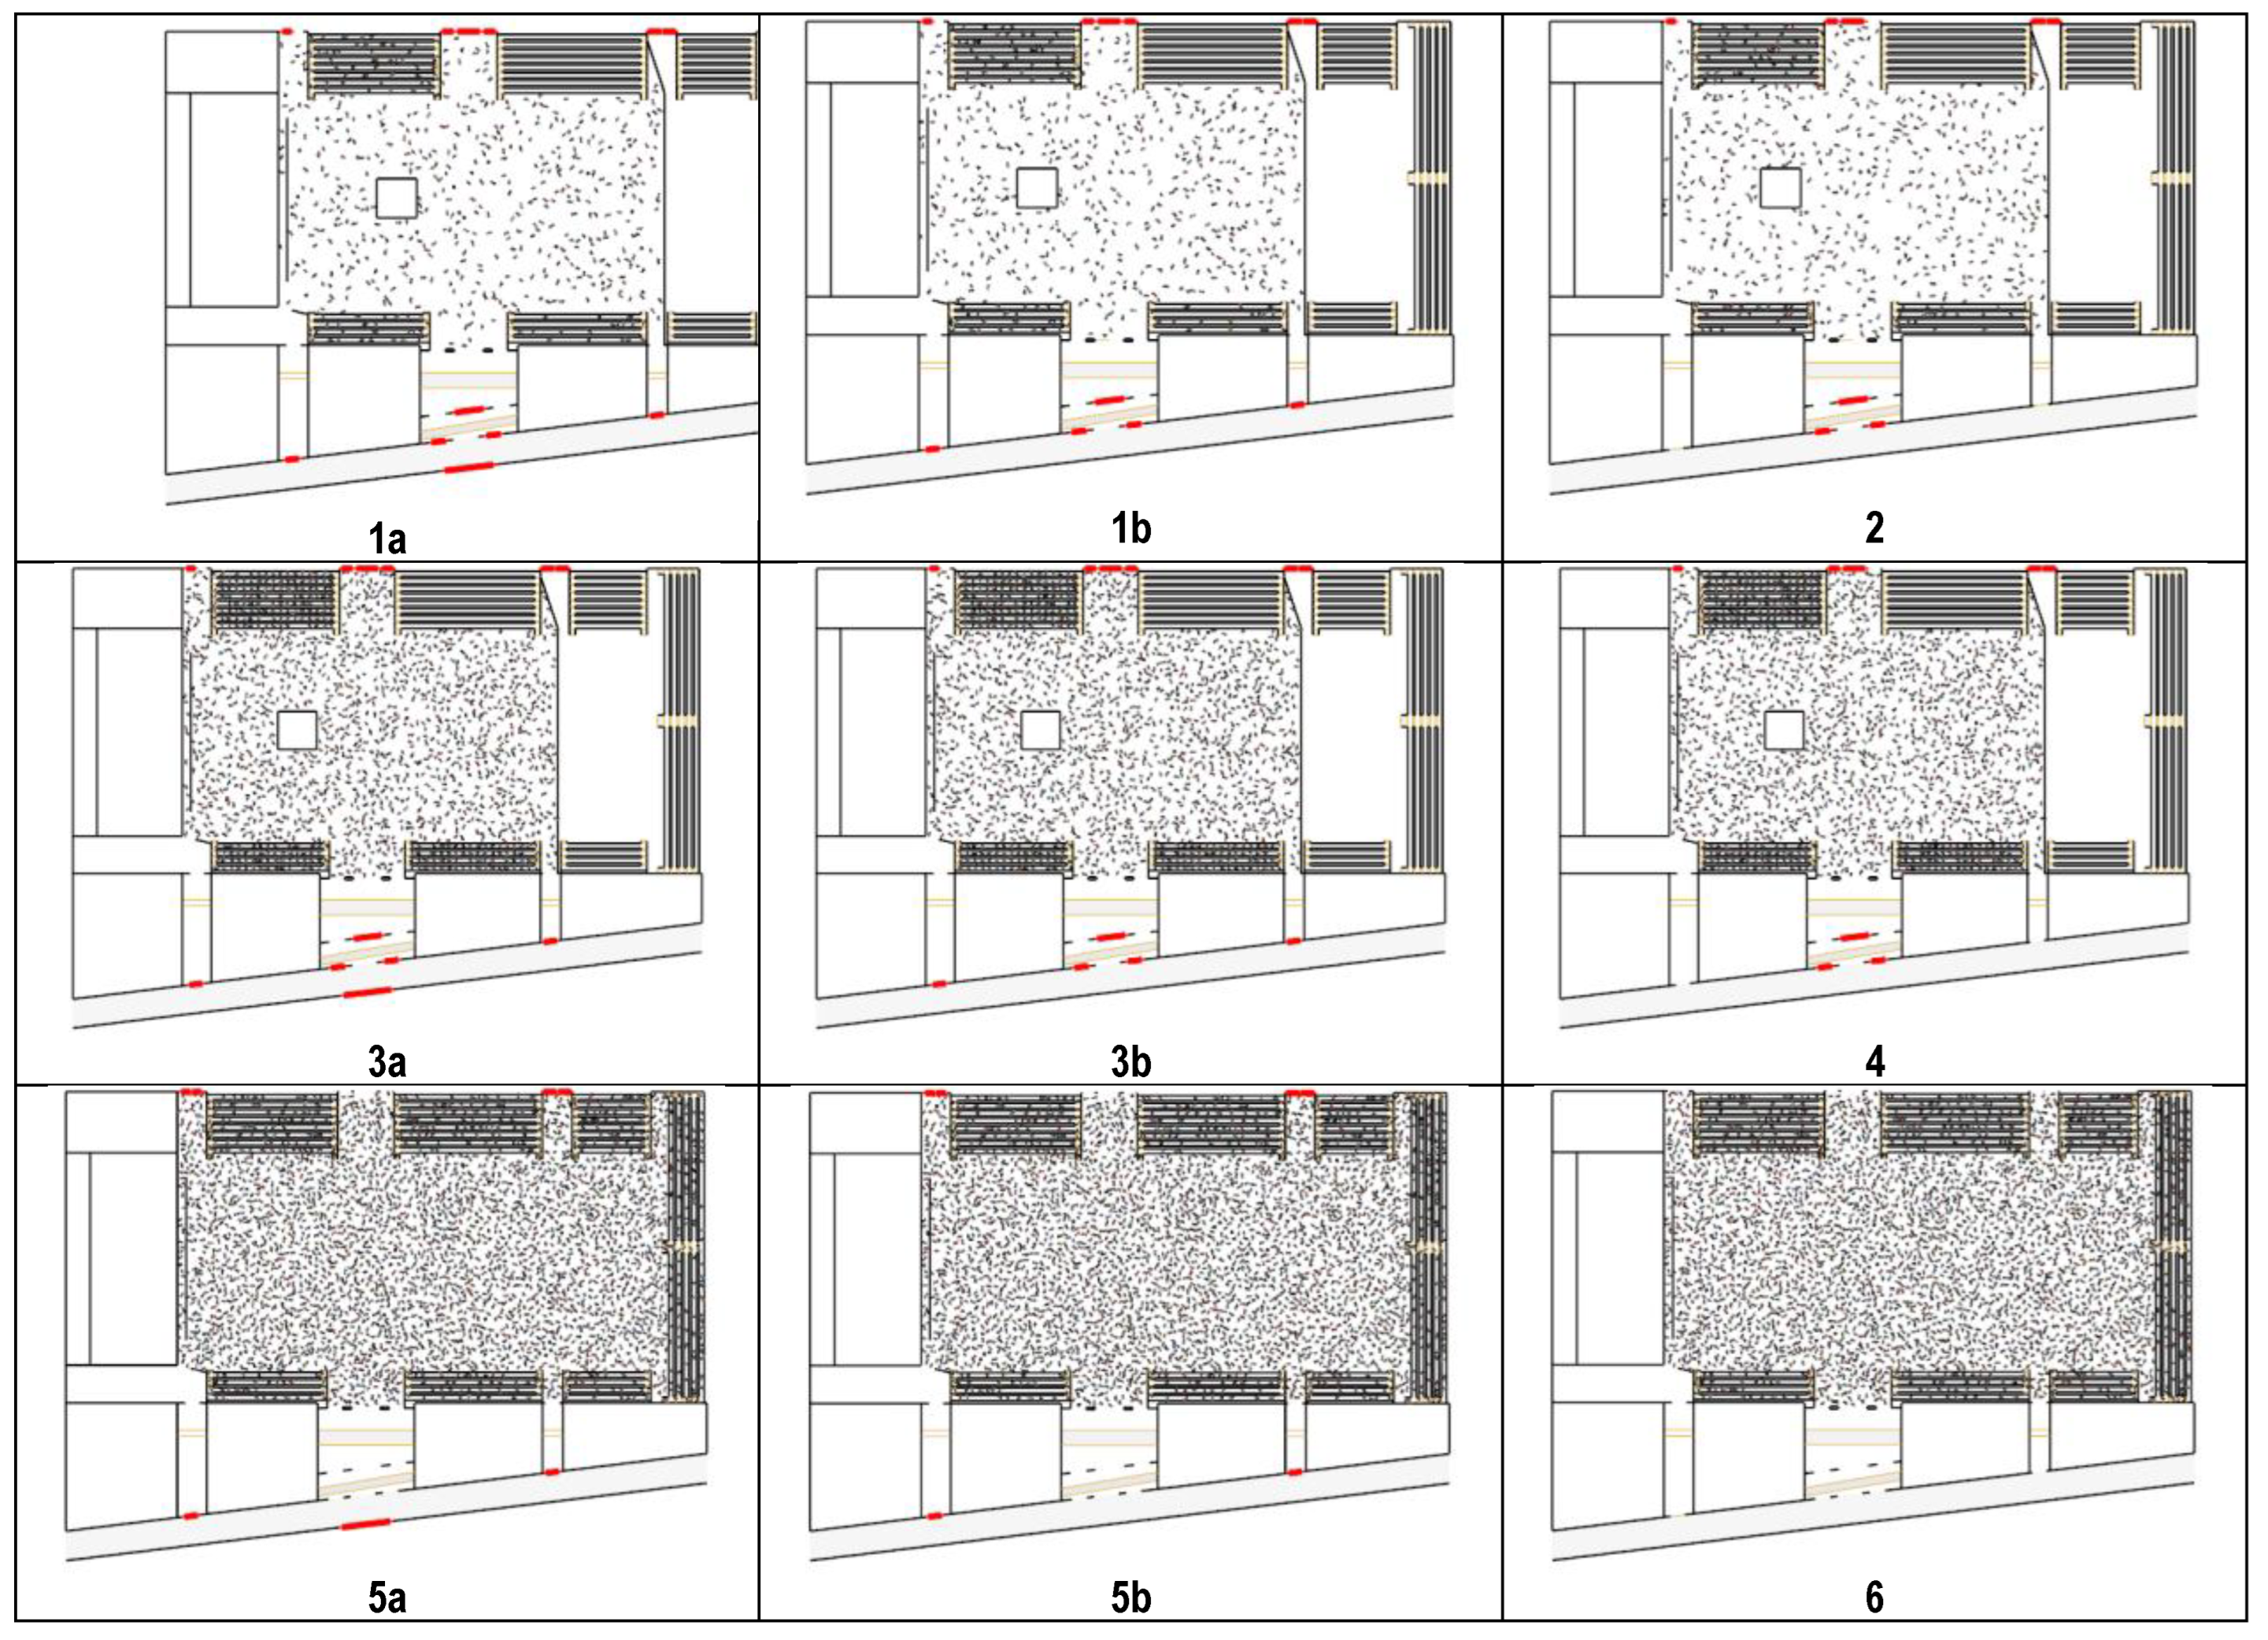
Figure 19.
Views of the evacuation after 240 s in different scenarios (at the critical temperature).
Figure 19.
Views of the evacuation after 240 s in different scenarios (at the critical temperature).
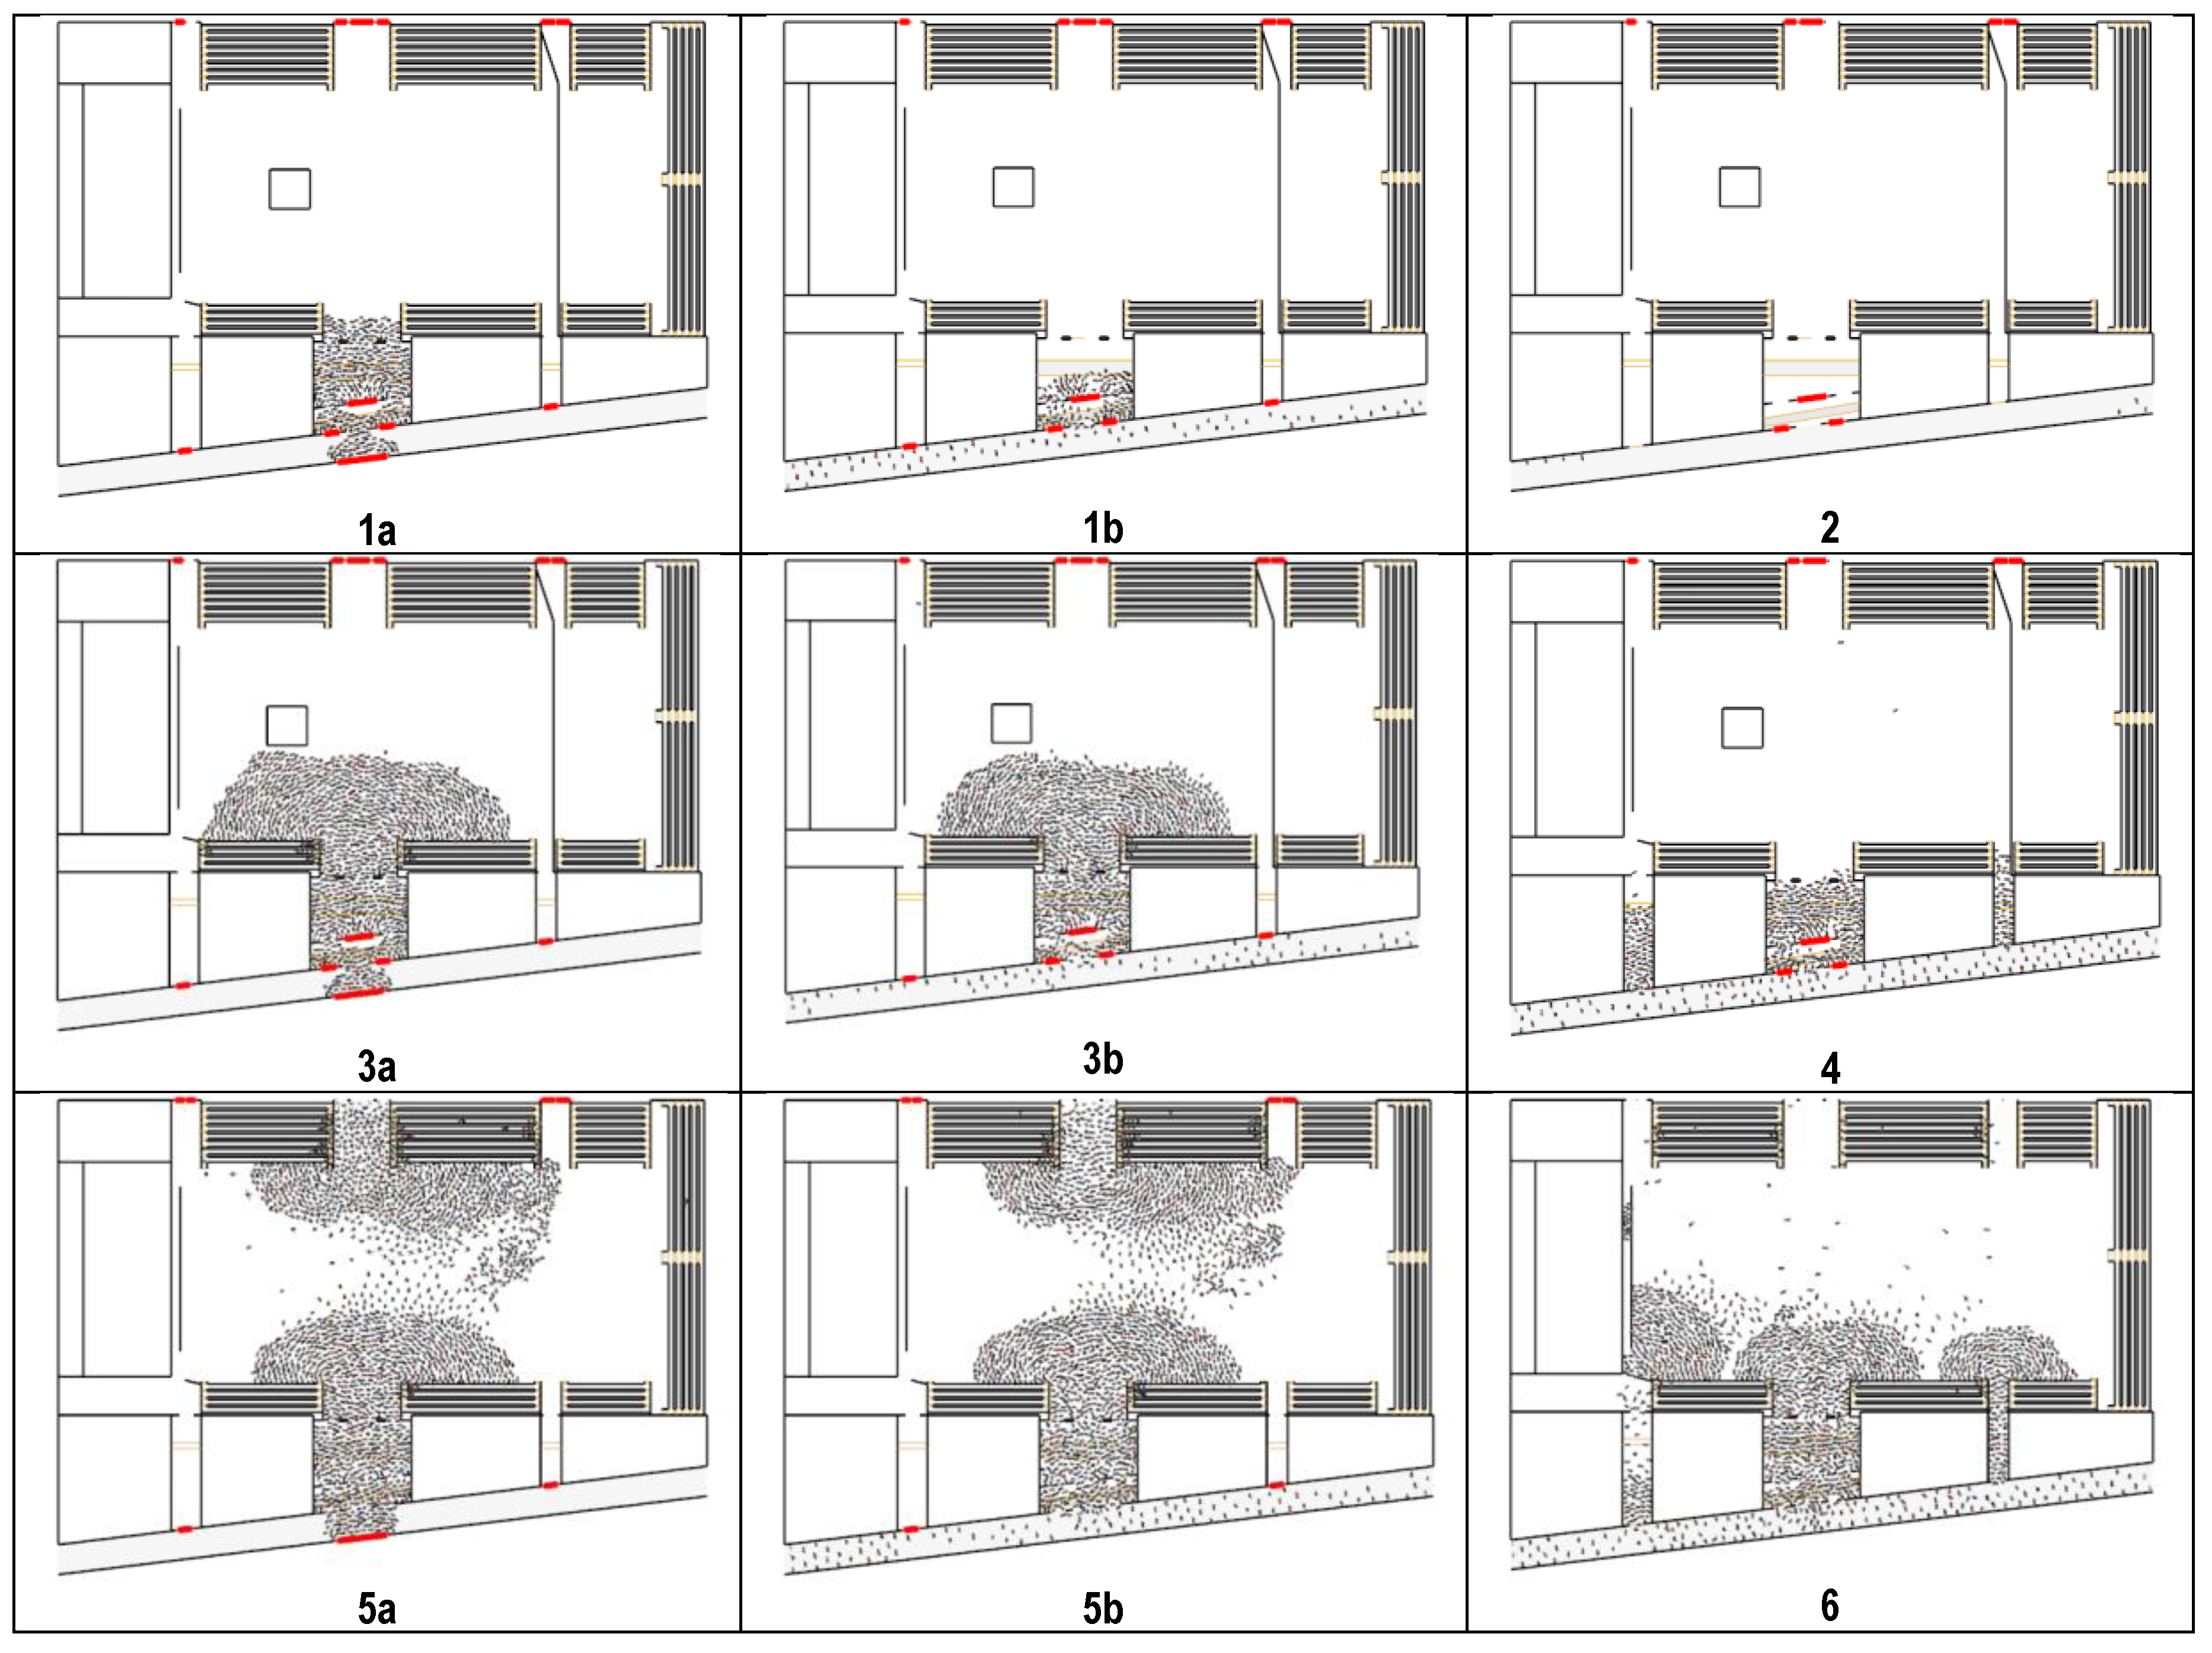
Figure 20.
Views of the evacuation after 660 s in different scenarios (with a critical smoke layer).
Figure 20.
Views of the evacuation after 660 s in different scenarios (with a critical smoke layer).
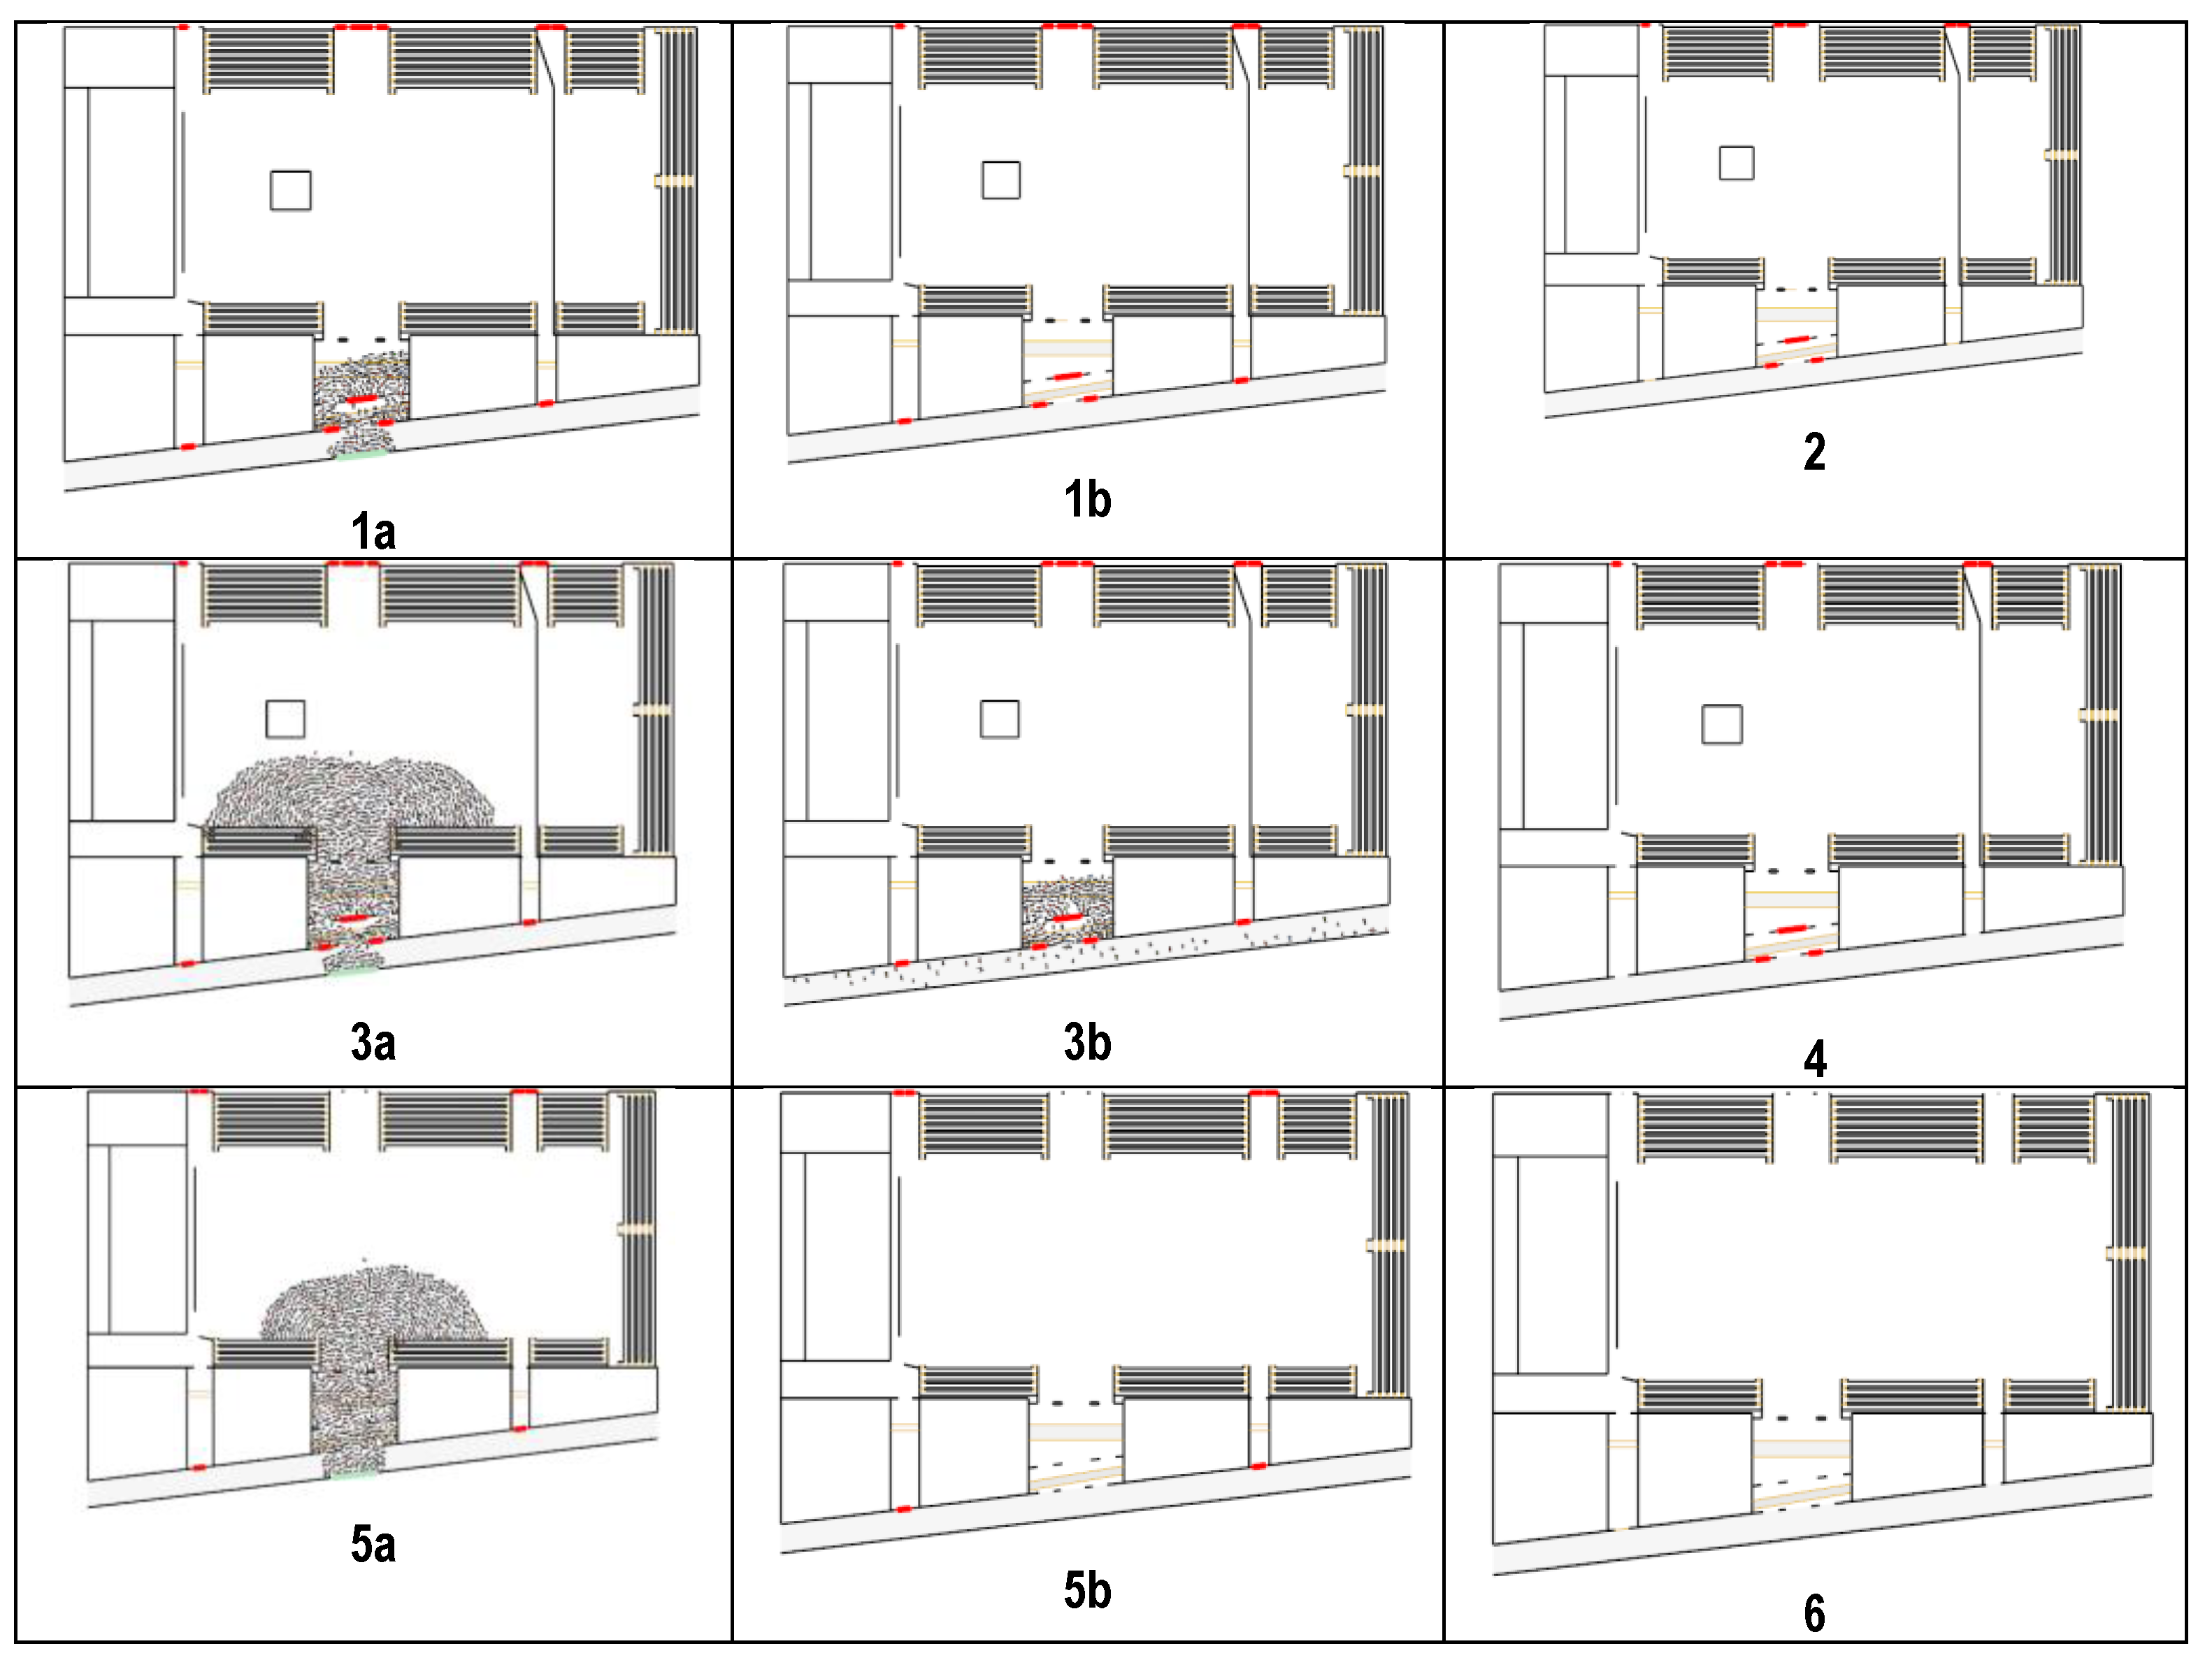
Figure 21.
Views of the evacuation after 900 s in different scenarios (flashover).
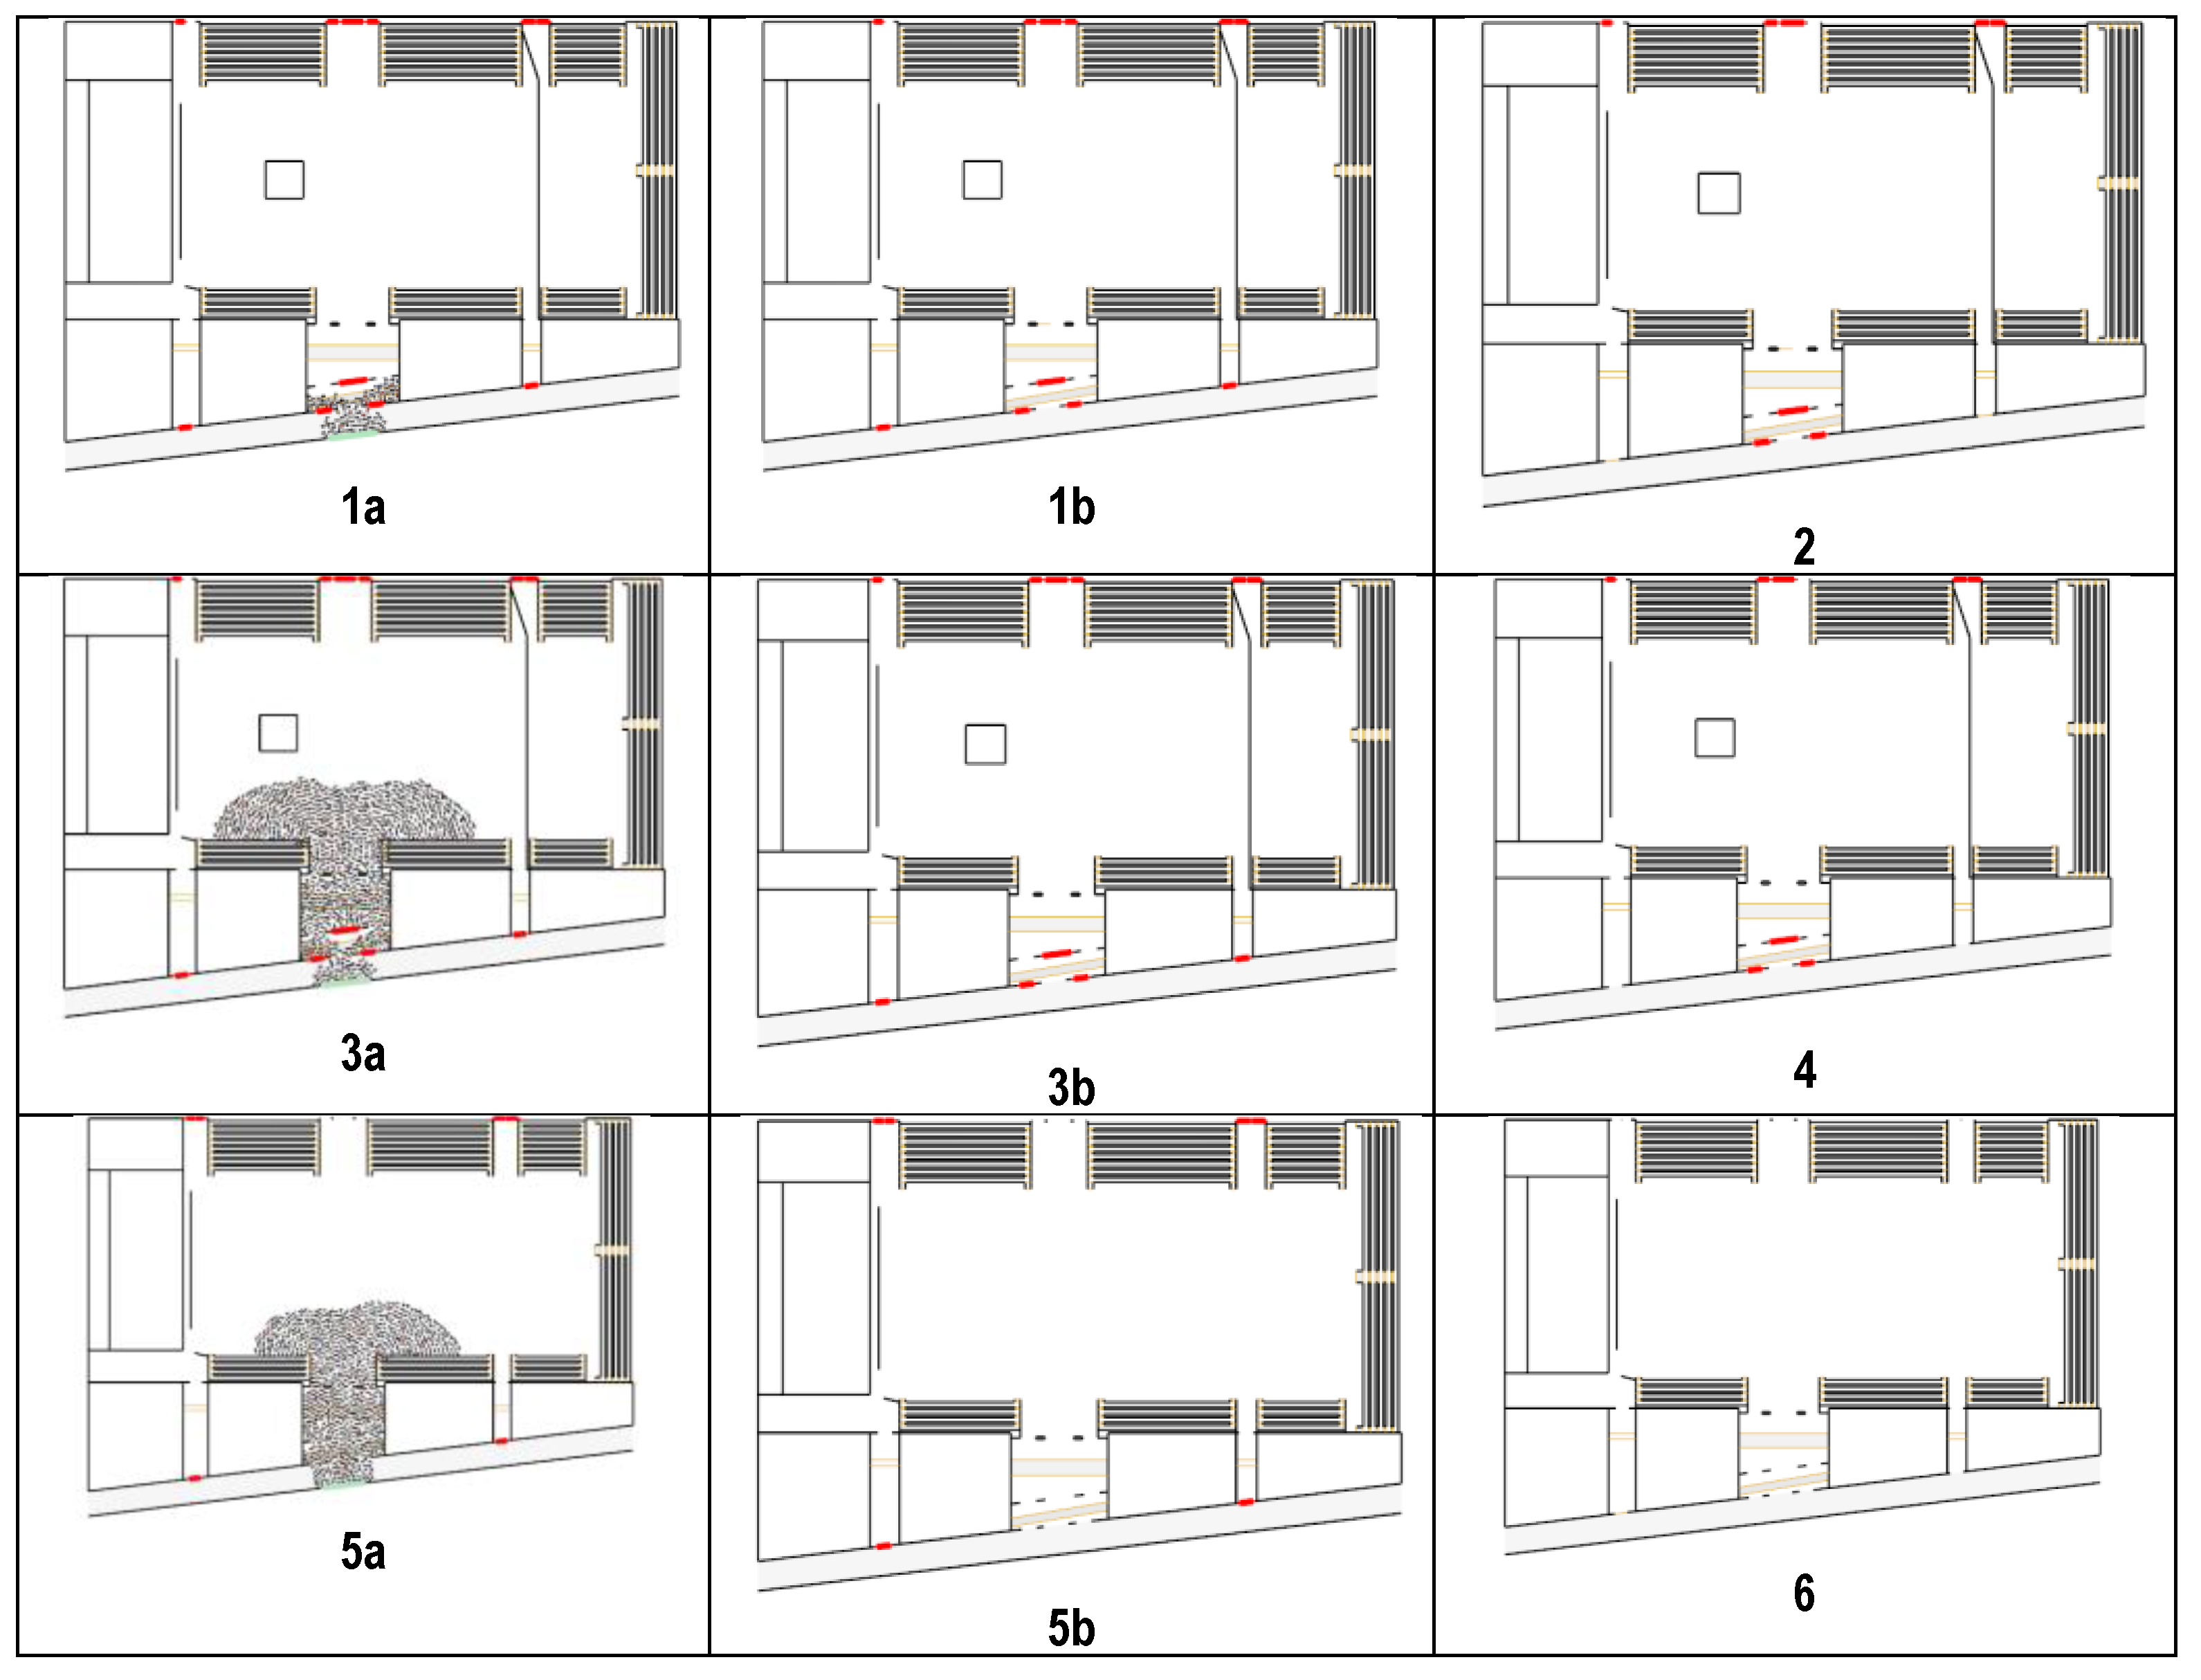
Figure 22.
Difference in the evacuation outcomes in the Chinese incident depending on the availability of emergency exits [32].
Figure 22.
Difference in the evacuation outcomes in the Chinese incident depending on the availability of emergency exits [32].
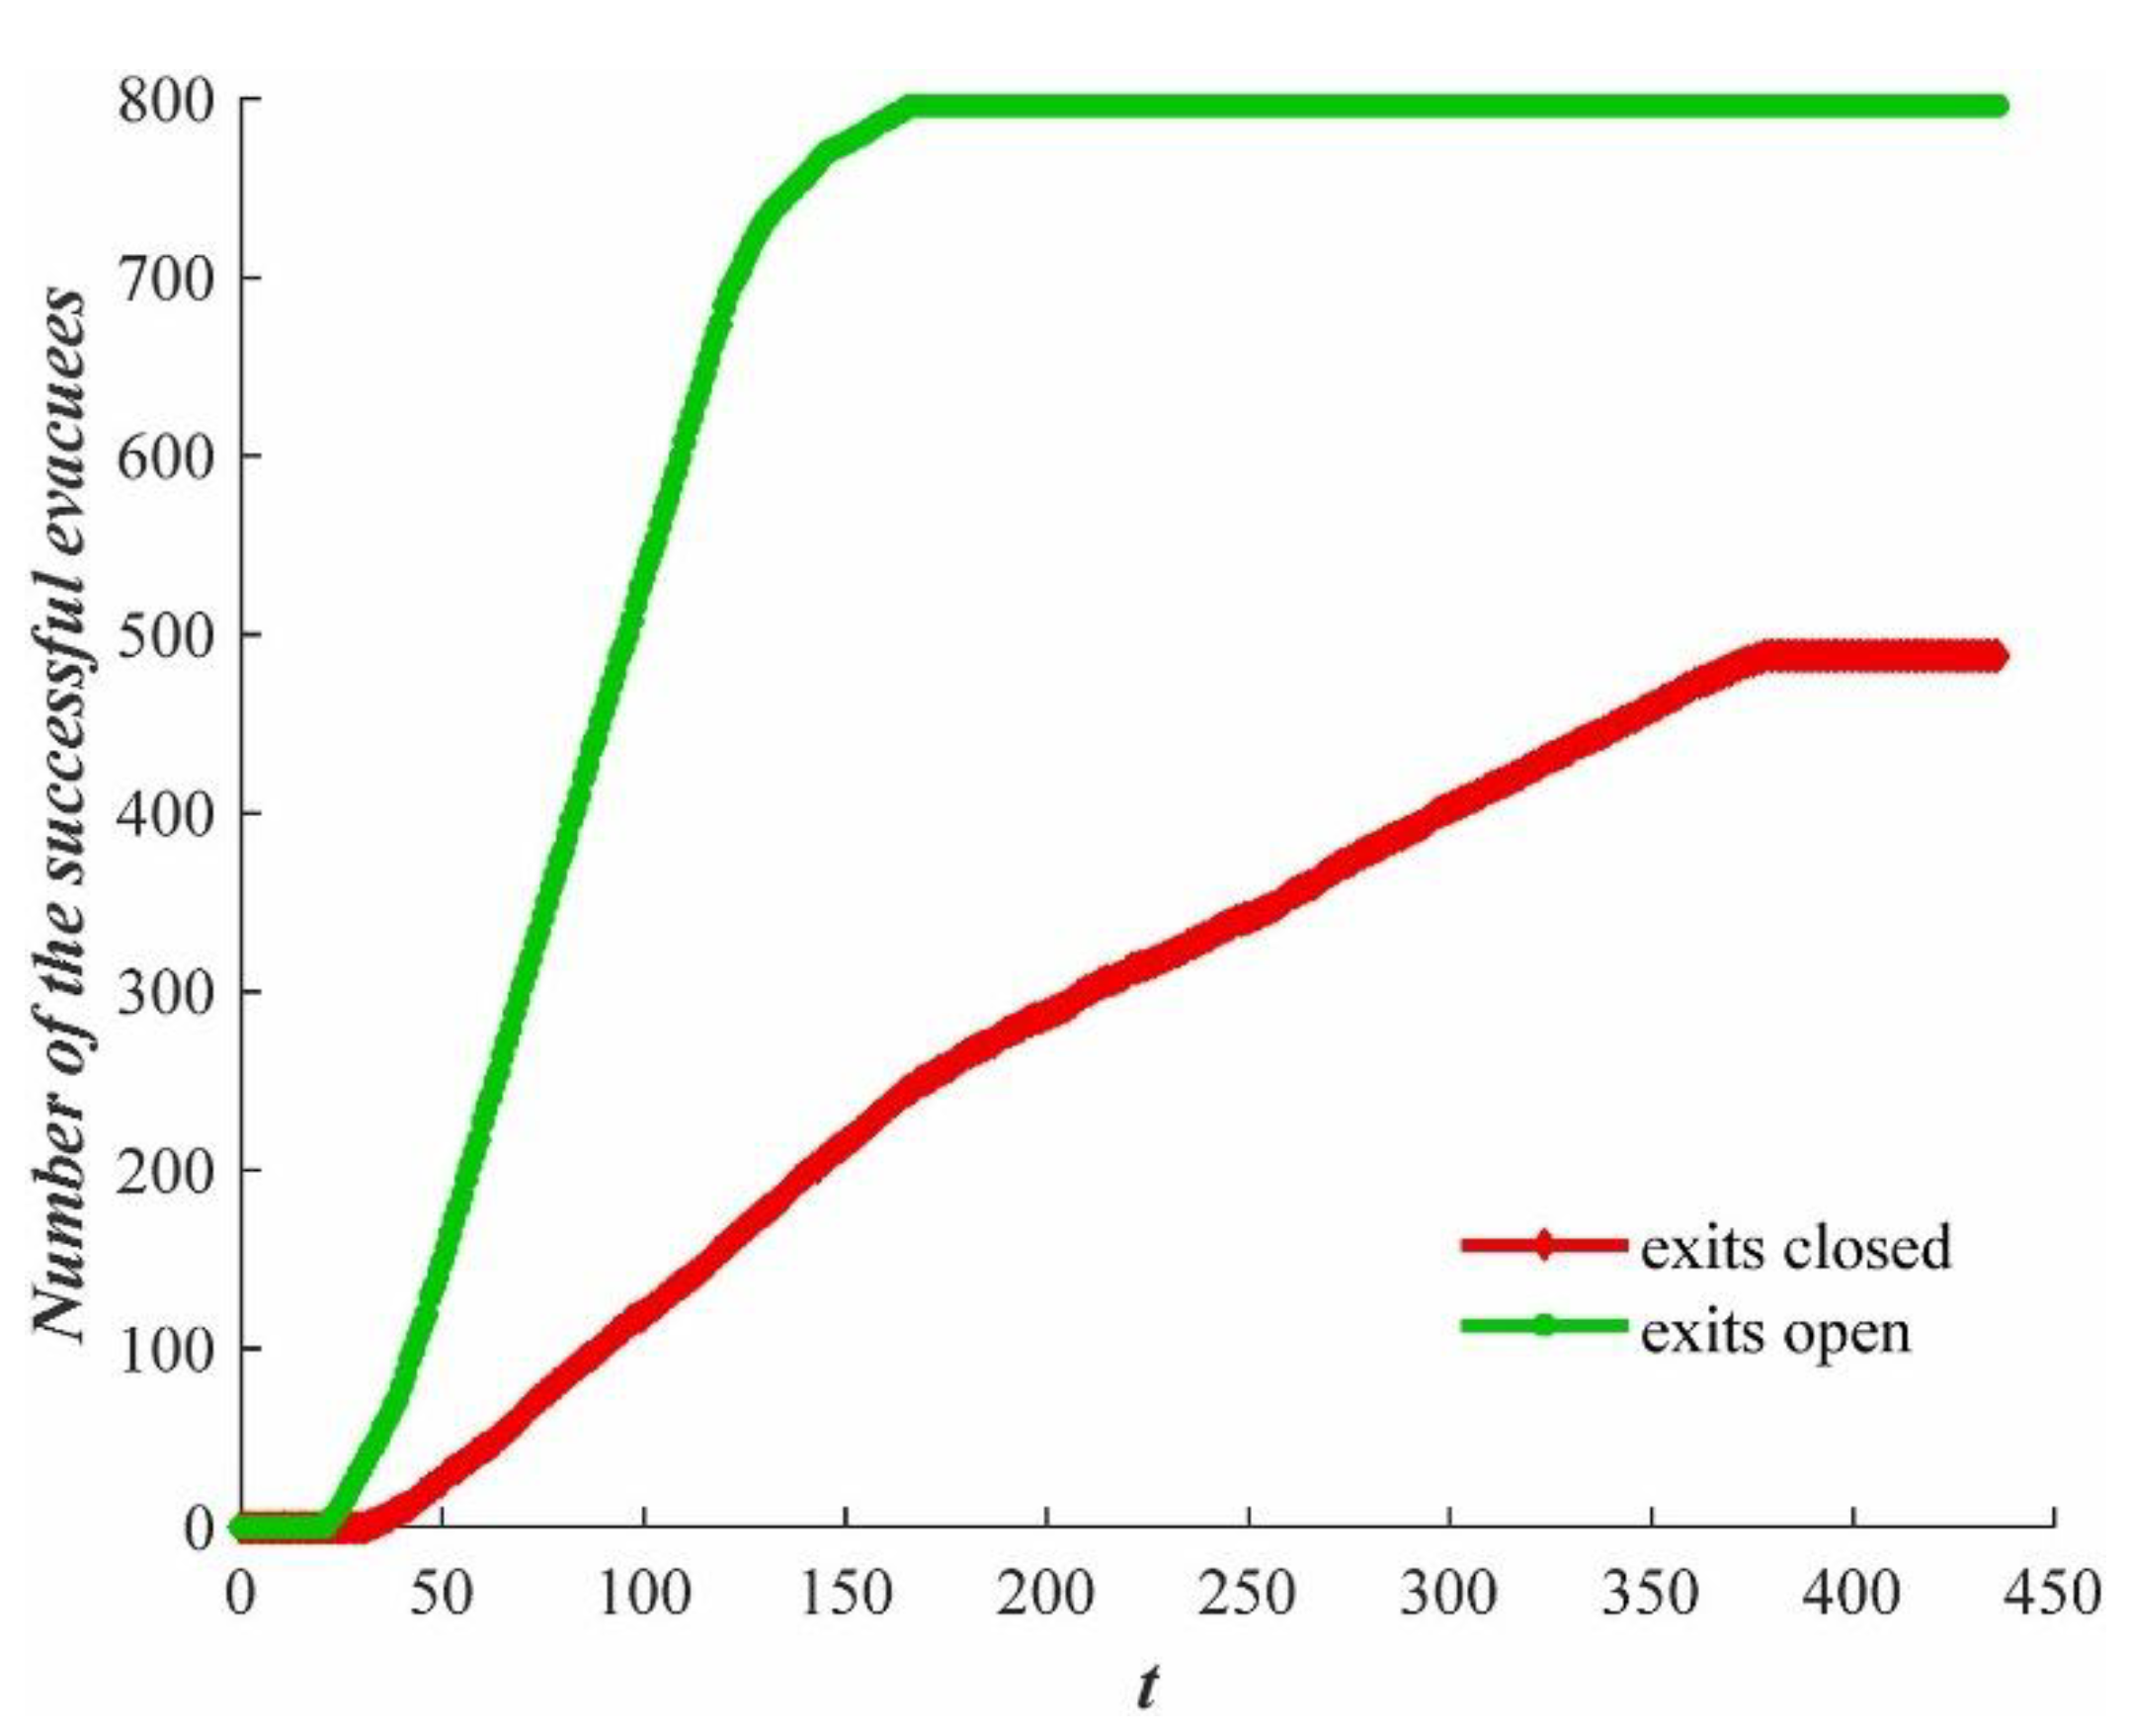
Figure 23.
Plane (a) and cross-sectional views (b) of the blocking pile that was generated in front of an emergency exit.
Figure 23.
Plane (a) and cross-sectional views (b) of the blocking pile that was generated in front of an emergency exit.
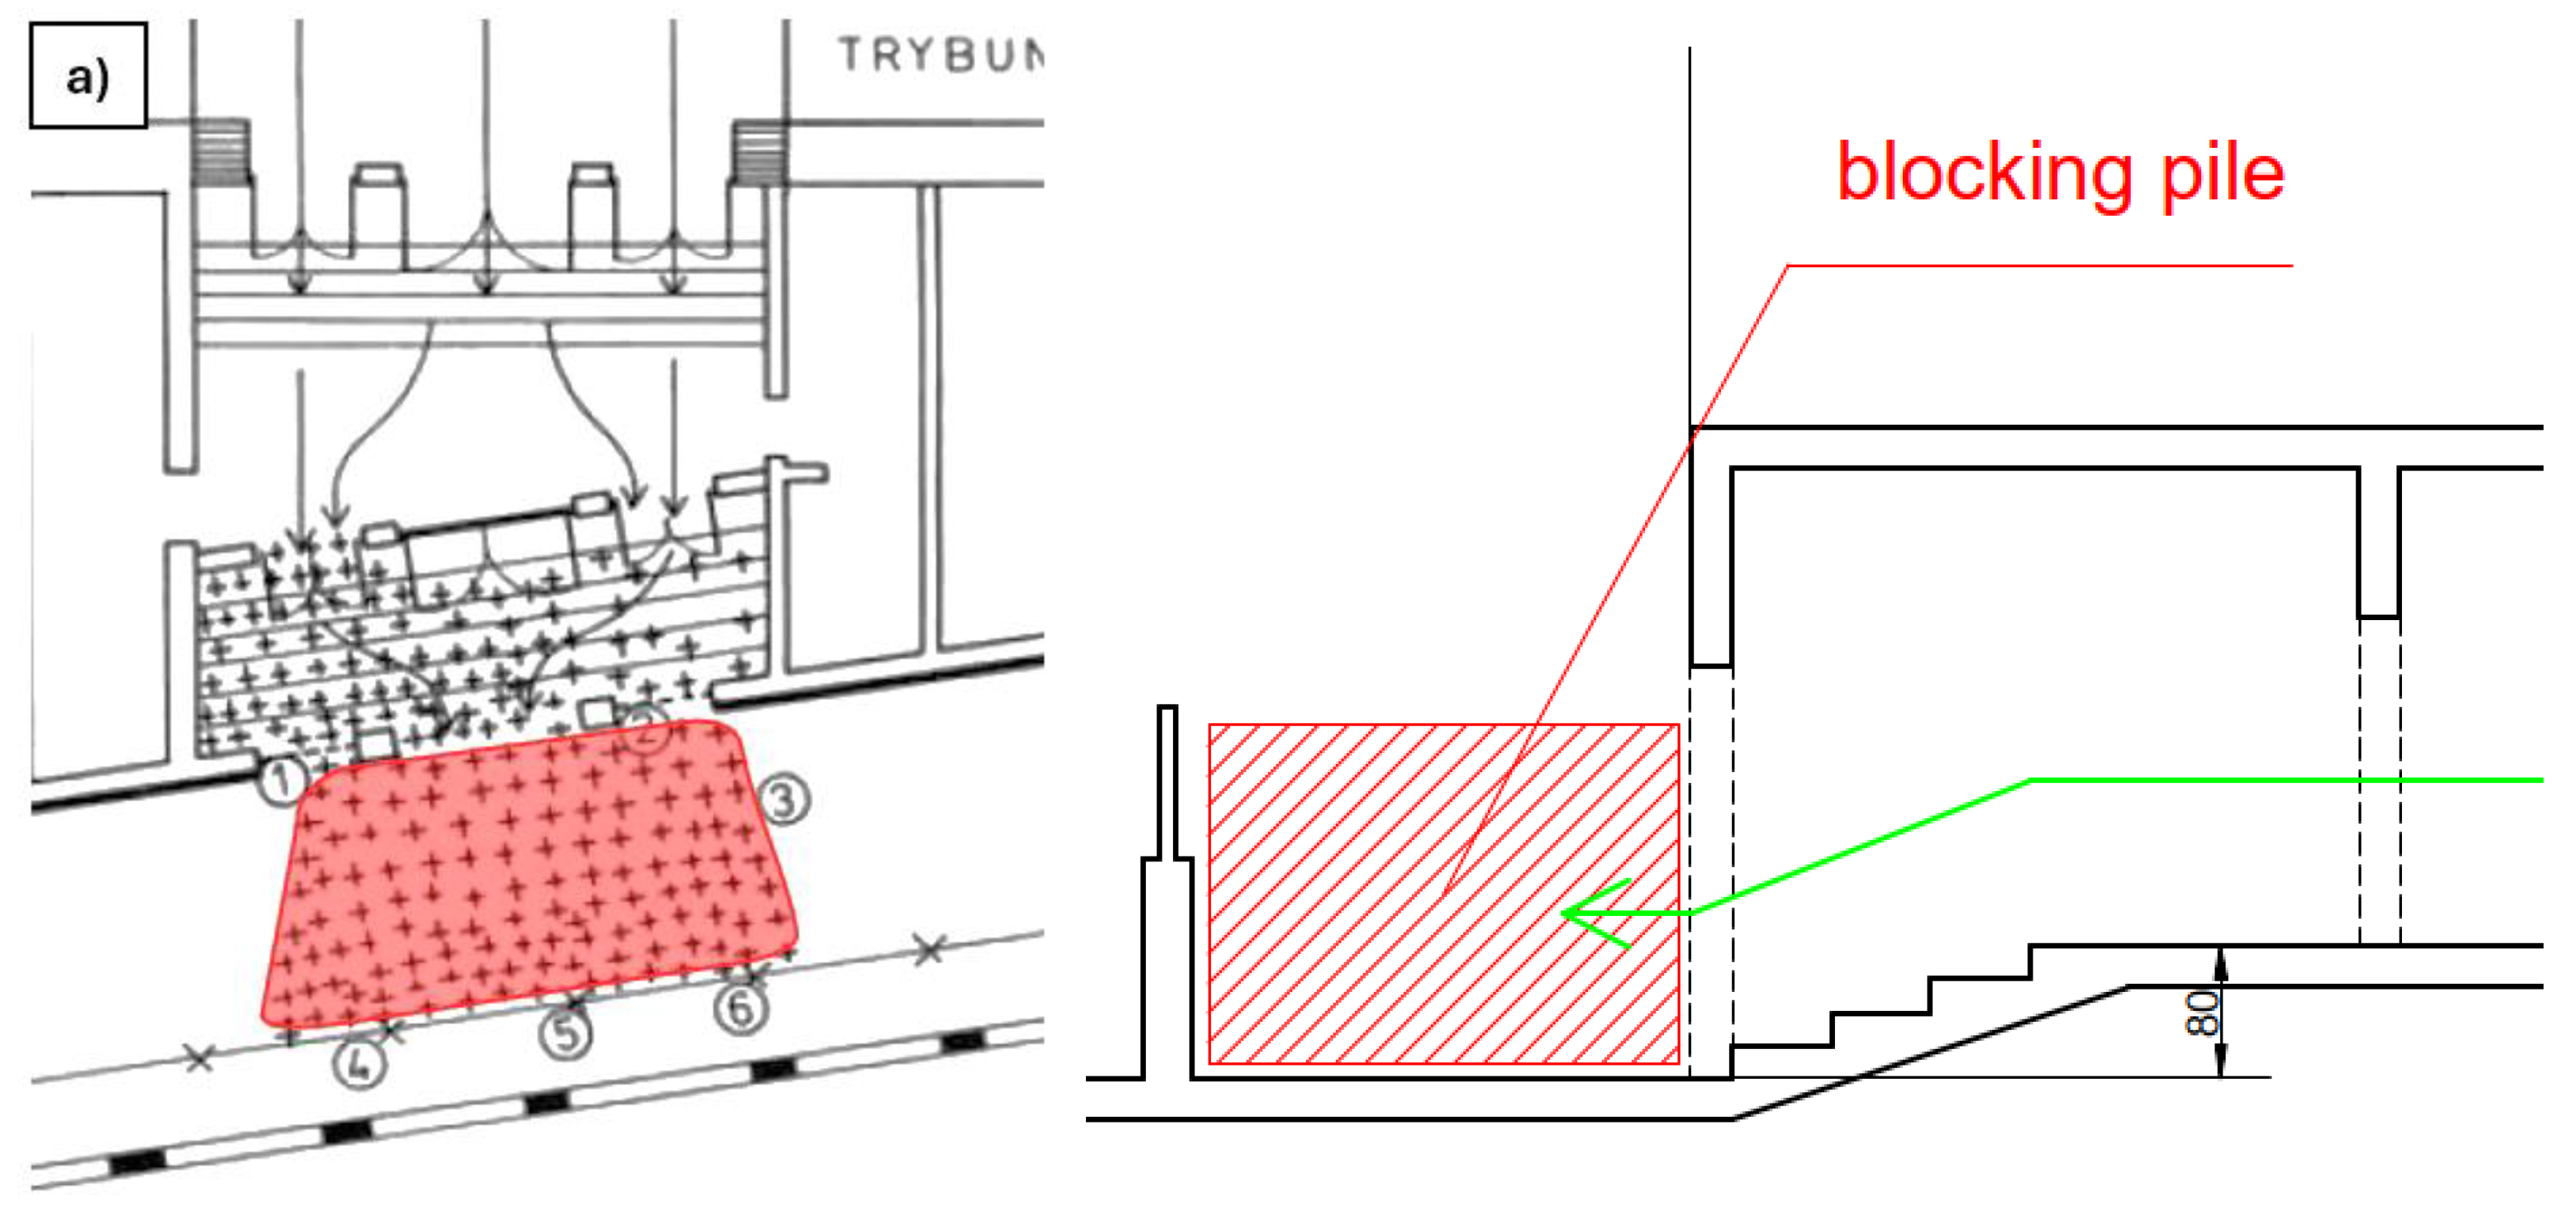
Figure 24.
Total evacuation times in all the scenarios. Blocking piles formed in scenarios 3a and 5a.
Figure 24.
Total evacuation times in all the scenarios. Blocking piles formed in scenarios 3a and 5a.
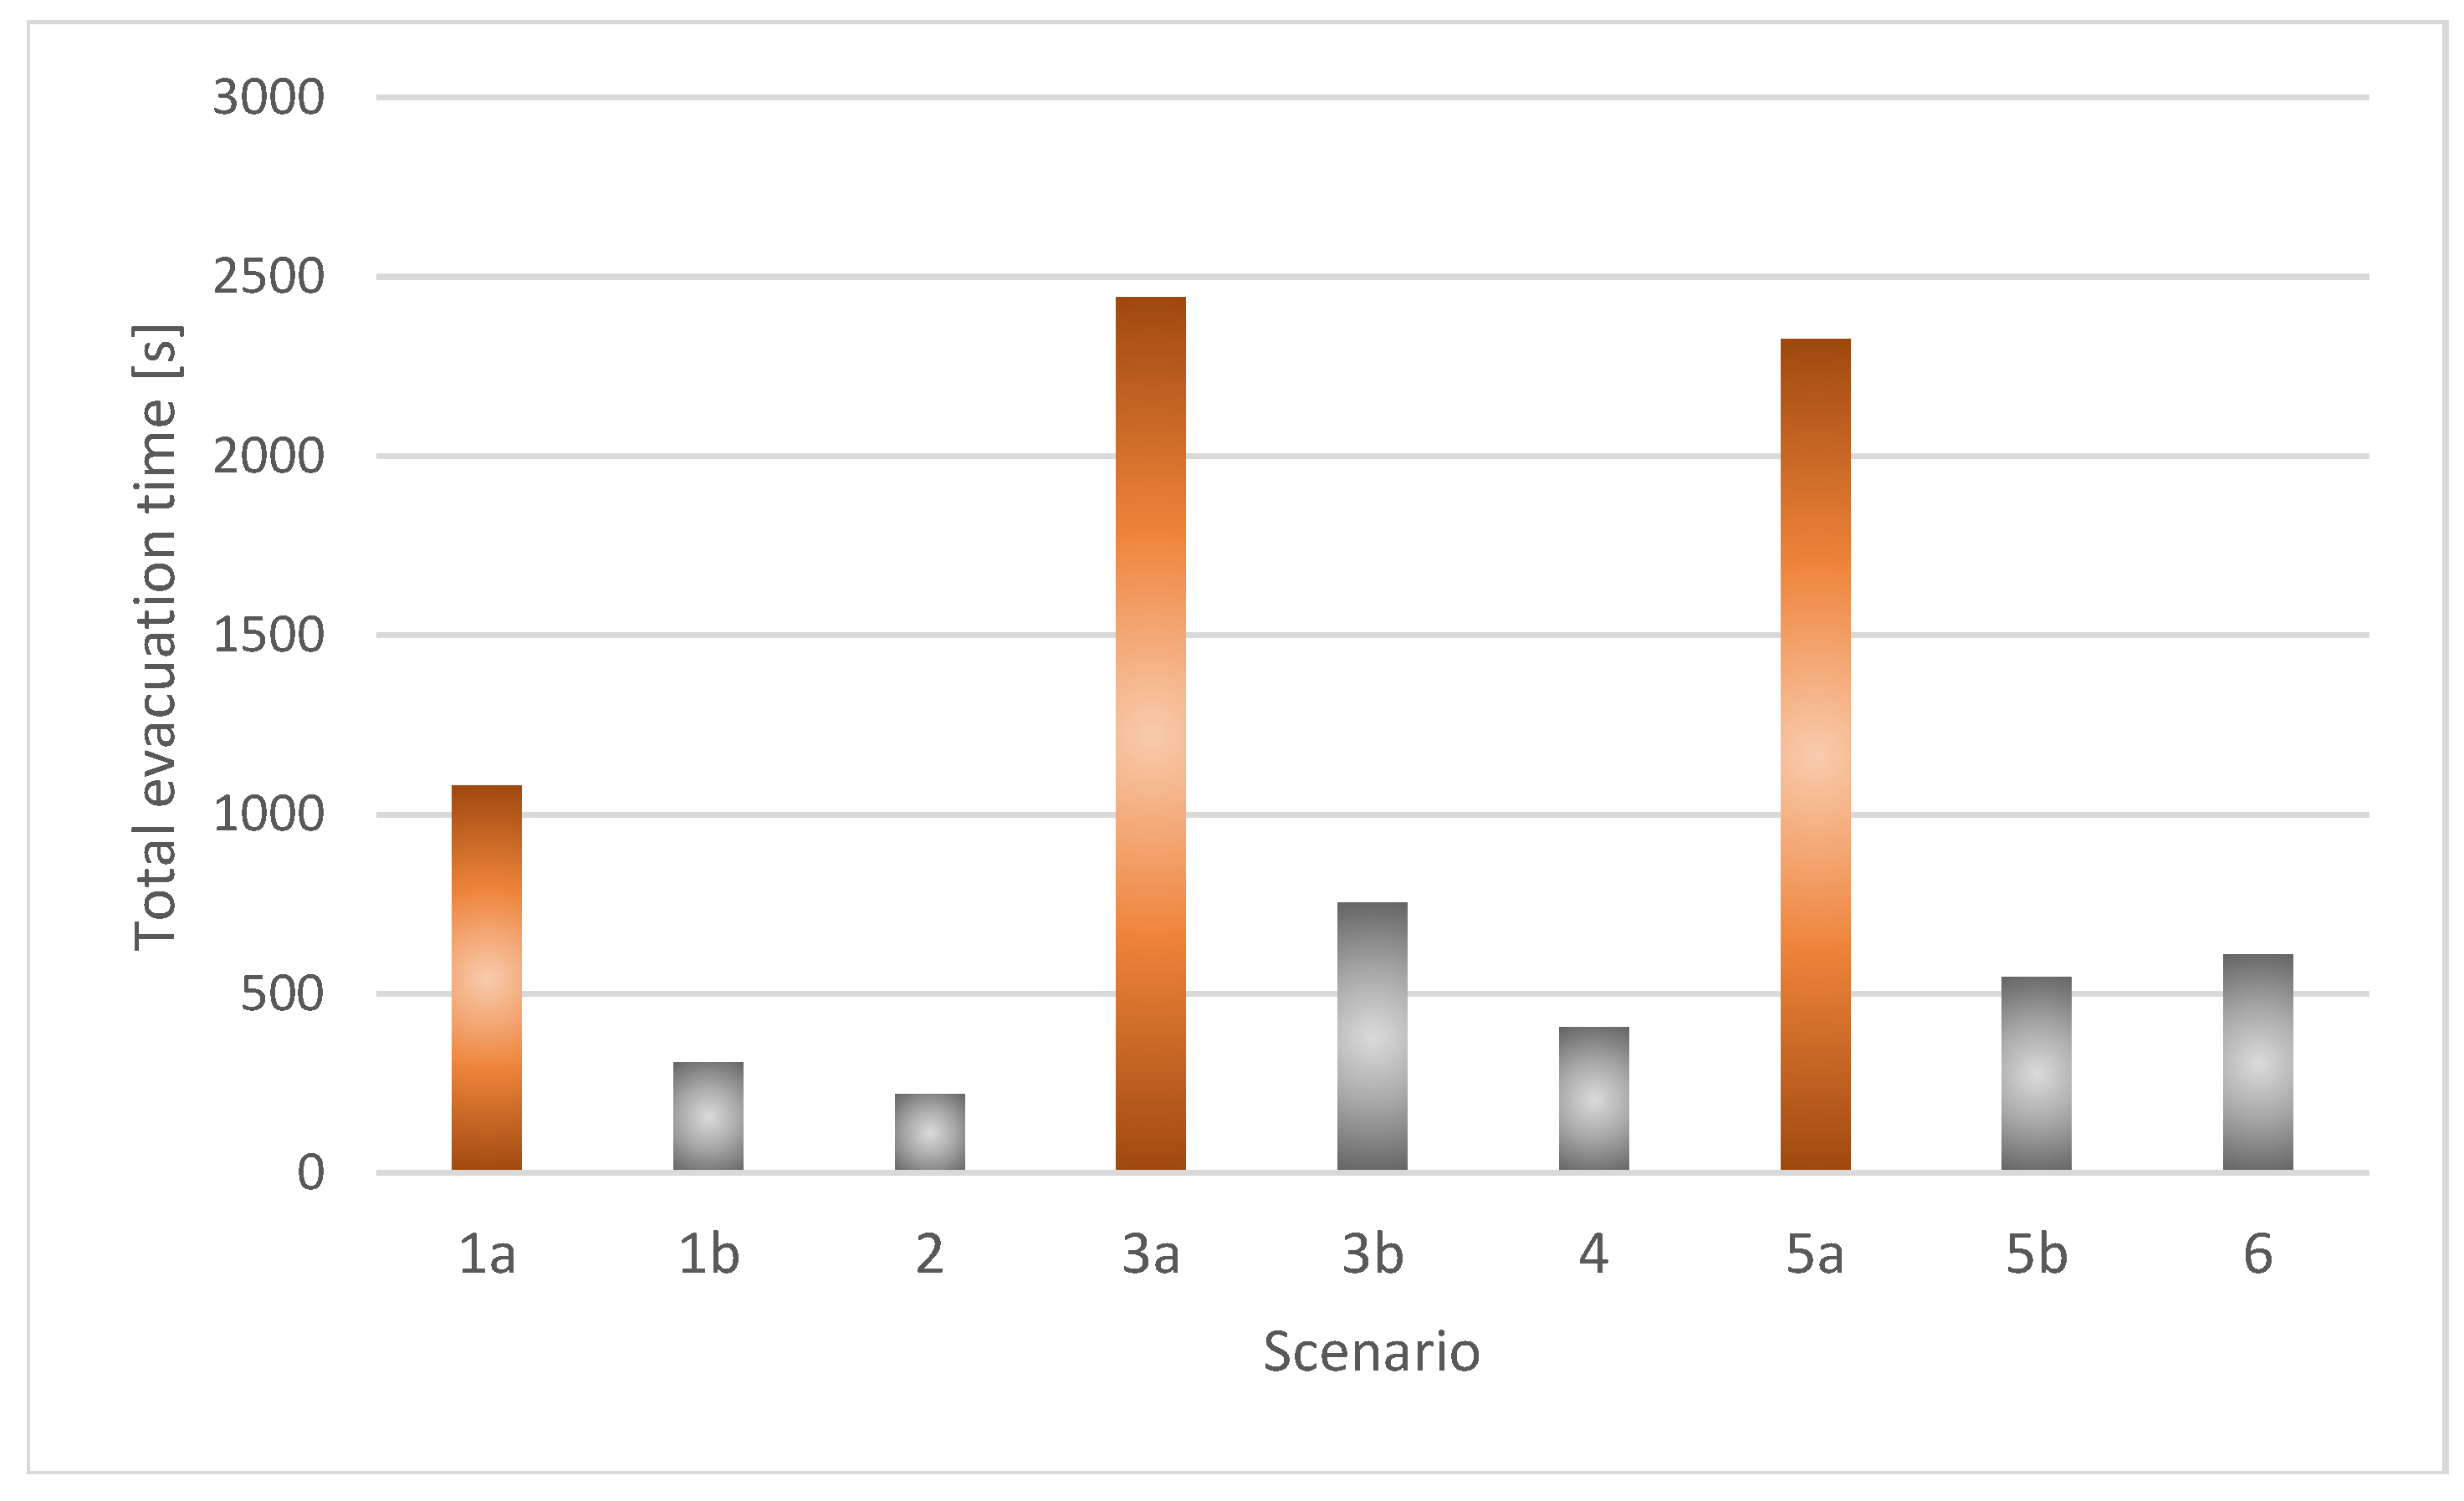

Table 1.
Parameters calculated for the reconstructed fire (: fire duration (s), : clock time, : fire area (m2), : smoking zone’s height (m) and : smoking zone’s temperature (°C)).
Table 1.
Parameters calculated for the reconstructed fire (: fire duration (s), : clock time, : fire area (m2), : smoking zone’s height (m) and : smoking zone’s temperature (°C)).
| (s) | (h:m) | (m2) | (m) | Notes | |
|---|---|---|---|---|---|
| 0 | 20:51 | 0 | 12 | 20 | The fire starts. |
| 1 | 20:52 | 0.34 | 11.74 | 21.2 | |
| 2 | 20:53 | 1.18 | 11.27 | 22.8 | |
| 3 | 20:54 | 3.01 | 10.67 | 25.1 | |
| 4 | 20:55 | 7.01 | 9.92 | 28.9 | The fire starts on the tribune’s surface. |
| 5 | 20:56 | 15.1 | 9.06 | 35.3 | |
| 6 | 20:57 | 29.52 | 8.11 | 45.9 | |
| 7 | 20:58 | 52.32 | 7.11 | 62.2 | |
| 8 | 20:59 | 85.04 | 6.12 | 86.8 | |
| 9 | 21:00 | 121.08 | 5.16 | 121.5 | |
| 10 | 21:01 | 169.76 | 4.29 | 165.9 | |
| 11 | 21:02 | 204.66 | 3.52 | 223.1 | |
| 12 | 21:03 | 264.82 | 2.76 | 303.5 | |
| 13 | 21:04 | 312.86 | 2.37 | 324.4 | |
| 14 | 21:05 | 376.02 | 2.04 | 333.6 | |
| 15 | 21:06 | 445.14 | 1.82 | 324.1 | |
| 16 | 21:07 | 520.16 | 1.69 | 309.8 | |
| 17 | 21:08 | 601.05 | 1.61 | 294.8 | |
| 18 | 21:09 | 687.77 | 1.56 | 280.8 | |
| 19 | 21:10 | 780.32 | 1.54 | 268.3 | Flashover |
| 20 | 21:11 | 982.78 | 3.1 | 841.4 | |
| 21 | 21:12 | 1070 | 3.1 | 1079.3 | |
| 22 | 21:13 | 1165 | 3.09 | 1082 | |
| 23 | 21:14 | The roof collapsed; end of the analysis. | |||
Table 2.
Characteristics of the analysed evacuation scenarios.
| Scenario | Blocking pile | Number of people | Curtain | Reaction time (s) | Exit preferences | Exits | Time required for block pile formation (s) | |||||||
|---|---|---|---|---|---|---|---|---|---|---|---|---|---|---|
| Total | Stands | WE-1 | WE-2 | WE-3 | WE-4 | WE-5 | WE-6 | Number | Width (m) | |||||
| 1a | Yes | 600 | 100 | Yes | 60 s: 25%, 120 s: 100%; uniform distribution (after calling for evacuation (60 s) the distribution changed); Figure 15a |
2% | - | - | - | 98% | - | 2 | 3.5 | 150 |
| 1b | No | - | ||||||||||||
| 2 | No | 25% | - | 75% | 5 | 7.5 | - | |||||||
| 3a | Yes | 1500 | 250 | 2% | - | - | - | 98% | - | 2 | 3.5 | 150 | ||
| 3b | No | - | ||||||||||||
| 4 | No | 25% | - | 75% | 5 | 7.5 | - | |||||||
| 5a | Yes | 3000 | 500 | No | 60s: 1%, 180 s: 99% 215.6 s: 100%; lognormal distribution; Figure 15b |
- | 50% | - | - | 50% | - | 2 | 7.2 | 210 |
| 5b | No | - | ||||||||||||
| 6 | No | 30% | 70% | 6 | 17.8 | - | ||||||||
Disclaimer/Publisher’s Note: The statements, opinions and data contained in all publications are solely those of the individual author(s) and contributor(s) and not of MDPI and/or the editor(s). MDPI and/or the editor(s) disclaim responsibility for any injury to people or property resulting from any ideas, methods, instructions or products referred to in the content. |
© 2026 by the authors. Licensee MDPI, Basel, Switzerland. This article is an open access article distributed under the terms and conditions of the Creative Commons Attribution (CC BY) license (http://creativecommons.org/licenses/by/4.0/).
Copyright: This open access article is published under a Creative Commons CC BY 4.0 license, which permit the free download, distribution, and reuse, provided that the author and preprint are cited in any reuse.


