Submitted:
10 February 2026
Posted:
11 February 2026
You are already at the latest version
Abstract
Studying how people manage and use their time not only deepens our understanding of individual routines but also highlights the roles they play within their household and society. The Survey of Health, Ageing, and Retirement in Europe (SHARE) Wave 8 developed a novel time expenditure module enabling cross-national, longitudinal analysis of daily activities among adults aged 50 and over. This paper presents the module’s design and initial findings. We provide methodological guidance essential for accurate data interpretation and present descriptive results by country, gender, age, and education. Our findings reveal substantial cross-national variation in time allocation patterns. While sleep (7-8.5 hours) and leisure activities (3.5-5.5 hours) dominate daily schedules across all countries, women spend approximately an hour more per day on household chores than men, with even greater gaps of 78 to 109 minutes in Southern Europe. Gender differences in care work are negligible, with the notable exception of Israel where women provide substantially more care. In contrast, men spend more time in paid work and leisure. Educational gradients are most pronounced for paid work: tertiary-educated older adults spend nearly three times as long in employment (119 minutes) compared to those with below-secondary education (44 minutes). Time use shifts substantially with age: paid work drops from 207 to 18 minutes between ages 50-64 and 65-79, while leisure and sleep increase. Contrary to stereotypes of older adults’ lives, these patterns reveal both continuity and change. With subsequent waves, this module will illuminate whether these patterns represent stable features of later life or transitional states that evolve with health, partnership status, and proximity to end of life.
Keywords:
time use
; daily activities
; older Europeans
; cross-national comparison
; gender
1. Introduction
Time is a limited resource and how individuals spend their time, as well as their level of control over it, is influenced by various factors, including gender, socio-economic status, culture, and where they find themselves in their life course. Significant life events experienced by older adults, such as transitions in and out of employment, health-related issues, children leaving the parental home, or taking on care responsibilities, shape the demands on their time. Examining the patterns of how individuals spend their time in more detail is important for understanding the dynamics of the ageing process. Ultimately, a more comprehensive understanding of the constraints and inequalities in time use can facilitate the design and implementation of effective policies that target the needs of older adults and promote their overall well-being. To contribute to that, the Survey of Health, Ageing, and Retirement in Europe (SHARE), introduced its time expenditure module for the first time in Wave 8. This time expenditure module collects data on time and activities performed on a reference day. The data also make it possible to examine how time is shared within households, i.e. how partners spend time together or divide housework and leisure time, and thus to identify gender differences. The SHARE time expenditure data, characterised by its cross-nationally harmonised panel design and household perspective, offers a detailed insight into the daily lives of older Europeans. This contributes to the ongoing debate on patterns and inequalities of time use.
This paper provides an overview of the design of the time expenditure module and presents first descriptive results based on Wave 8 data. It seeks to explain the methodological considerations necessary for the proper interpretation of the data and highlight their usefulness. The paper is organised in five sections. Section 2 examines the importance of a longitudinal perspective for studying time use and presents previous studies focusing on the time use of people aged 50 and over. Section 3 outlines the main features of the time expenditure module in SHARE and provides information on the sample. Section 4 presents descriptive results for key socio-demographic variables that illustrate how people aged 50-and-over spend their time in different European countries, providing an overview of the activity patterns of the older adult population in Europe and country-level variations. Section 5 summarizes the results and explores the potential uses of the data.
2. Measuring Time in Longitudinal Surveys
2.1. The Longitudinal Dimension of Time Use
The phenomenon of population ageing represents a global trend. Eurostat projections estimate that by 2050, people aged 55 and over will account for around 40% of the total population in the European Union. This demographic shift is largely the result of persistently low birth rates and increasing life expectancy in many countries (European Commission, Statistical Office of the European Union, 2020). To assess the social participation, well-being, and demand for care and support of older Europeans, understanding how they organise their daily lives is becoming increasingly important as the population ages.
Evidence shows that time is not distributed equally across social groups, with differences by gender (Campaña et al., 2023, Ferranna et al. 2022, Kan et al., 2021, Matud et al., 2024) and education level (Kan et al., 2021). Furthermore, time allocation undergoes substantial changes over the life course, particularly during transitions such as retirement (Ferranna et al., 2022), widowhood (Adena et al., 2023), or health (Matud et al., 2024). These changes do not follow a single trajectory: While some older adults experience active ageing, characterised by continued engagement in work, volunteering and leisure activities, others face periods of decline, marked by reduced mobility and an increased need for care. To capture this diversity, longitudinal data is essential as it enables researchers to observe changes in individuals over time. This approach provides policymakers with insights into the evolving needs and contributions of populations aged 60 and over.
2.2. Cross-National Comparability
Comparing patterns of time use across countries is essential for understanding how institutions, welfare regimes, and cultural norms shape the daily lives of older adults. However, such comparisons face a number of challenges. Differences in survey design, activity classification, translation, fieldwork times and sample composition can affect the validity of cross-national analyses and complicate interpretation.
To reduce these problems, major harmonisation initiatives have been developed, most notably the Harmonised European Time Use Surveys (HETUS) and the Multinational Time Use Study (MTUS). These projects recode national diary surveys into a common framework, allowing researchers to carry out cross-country analyses on more comparable grounds. However, significant challenges persist. One major issue is the absence of a universally standardised system for defining and classifying activities across diverse survey instruments. It is important to note that categories may overlap or be defined differently, and cultural differences in how respondents report their activities add further complexity (Ferranna et al., 2022; Gauthier & Smeeding, 2003). The type and format of available data also shape harmonisation efforts. While some countries provide detailed microdata, others only release aggregated tables, thereby limiting the level of analysis that can be conducted (Ferranna et al., 2022). In addition, the covariates collected alongside time diaries, such as socio-economic background, household composition, or health indicators, vary considerably across national surveys. This inconsistency restricts the scope for analysing how time use patterns are associated with demographic and social characteristics (Gauthier & Smeeding, 2003).
Despite these challenges, cross-national comparability remains a central goal in time use research. The SHARE Wave 8 Time Expenditure module contributes to this agenda by combining harmonised measures of daily activities with detailed longitudinal information on health, work, and family networks, thus offering a valuable complement to existing diary-based datasets.
2.3. Patterns of Time Use in Older Age: Inequalities, Transitions, and Contexts
2.3.1. Gendered Patterns of Time Use
Inequalities in how men and women use their time have been widely documented in the literature. Across Europe, women spend significantly more time on unpaid work than men, and this pattern persists across the life course and across countries. On average, during the 2010s, women reported spending about 4.5 hours per day on unpaid work, compared with 2.5 hours for men (Campaña et al., 2023). As a result, women carry a heavier combined workload, paid and unpaid, than men at all ages (Ferranna et al., 2022).
The gap in housework begins early in adulthood and grows during the years of family formation, when childcare and household tasks peak (Campaña et al., 2023; Matud et al., 2024). However, evidence suggests that this gap narrows as individuals progress through their lives. After retirement, women’s hours in housework tend to decline, while men increase their contribution to domestic tasks, reducing but not eliminating the gap (Gauthier & Smeeding, 2003).
Furthermore, women allocate a greater proportion of their time to childcare and to caring for sick or dependent relatives than men. The imbalance is especially evident during midlife, when demands for care often coincide for both younger and older generations (Matud et al., 2024).
Conversely, men consistently allocate more time to paid employment than women, a phenomenon that is evident across countries and across life course. In Europe, working men spend on average more than an hour per day longer in paid work than working women. At the same time, women’s labour force participation rates remain lower than men’s in all European countries studied (Campaña et al., 2023).
Men also spend more time than women on leisure and personally enjoyable activities (Ferranna et al., 2022; Matud et al., 2024). A similar disparity is observed in sleep patterns, with older women reporting shorter durations of rest compared to their male counterparts in Japan, South Korea, Taiwan, and Southern Europe (Kan et al., 2021).
These inequalities matter for wellbeing. For women, more time in housework is linked to poorer health outcomes, while for both genders, physical activity improves wellbeing (Matud et al., 2024). Yet retirement often leads both men and women to shift substantial time into passive activities, particularly television viewing (Gauthier & Smeeding, 2003).
2.3.2. Life Course Transitions and Heterogeneity in Older Age
The most significant life course transition in later life is the sharp decrease in time spent on paid work. This modification has the effect of releasing a significant number of hours, which are then allocated to other activities. However, the allocation of these hours varies across groups (Ferranna et al., 2022; Gauthier & Smeeding, 2003).
A significant proportion of the time that is released from paid work is allocated to leisure and personal care activities, and to a lesser extent on unpaid work. Research shows that a lot of this additional leisure time is spent in a passive manner, for instance, watching television or resting (Ferranna et al., 2022; Gauthier & Smeeding, 2003). In MTUS countries, individuals aged 60 and over allocate over six hours daily to leisure activities, in contrast to approximately four hours allocated by those of middle age (Ferranna et al., 2022).
Educational attainment also influences how people spend their time in later life. A study has found, in an East Asian context, a correlation between higher education and earlier retirement, more leisure time and less sleep, partly because more educated adults have greater financial security (Kan et al., 2021). However, other evidence suggests that in Western societies highly educated older adults may work longer, as they tend to have more stable, better-paid jobs and enjoy better health (Ferranna et al., 2022; Kan et al., 2021)
4. Who Answers the Time Expenditure Module?
The Time Expenditure (TE) module was designed as a panel module, meaning that only longitudinal respondents, who had participated in a previous SHARE wave, were eligible to receive this set of questions. For Wave 8, this indicates that the TE module was not fielded in countries that joined SHARE in Wave 7, as these countries administered a distinct wave that utilised the retrospective life history questionnaire (SHARELIFE). The new countries of Wave 7 only completed the regular baseline interview in Wave 8, thus the respondents in these countries were not yet eligible for the panel modules. Consequently, the data for the TE module is only available for 19 of the 27 participating countries in Wave 81. Moreover, the design decision meant that in the remaining countries only respondents who were already part of the panel sample, i.e. those who had already completed the baseline questionnaire in a previous wave, were eligible to answer the TE module. The implication of this design decision is the exclusion of refreshment samples2 from the Wave 8 TE questions. The module was administered only to respondents living in private households, while individuals residing in nursing homes were excluded. The following tables present results using release data from Wave 8 (SHARE-ERIC, 2024g). Table 1 below shows the sample distribution for the countries that received the TE module. Note that the variation between countries is caused by the size of their panel sample as well as the fact that some countries, such as Poland and Israel, could not fully realize their panel sample due to the COVID-19 pandemic (for more details see Bergmann et al., 2021; Scherpenzeel et al., 2020). Table 1 also shows how the sample is distributed by age group and gender. This provides an overview of the demographic composition of the respondents included in the analysis.
5. Design Features of the Time Expenditure Module
The Time Expenditure (TE) module is composed of a set of questions covering predefined categories of activities. Unlike time-use diaries, it does not ask respondents to report specific activities. Instead, it gathers information on the amount of time spent on groups of related activities that fall under the same predefined category within each question. Consequently, the recorded times do not necessarily add up to 24 hours, and in most cases they do not. Further, it is possible that some of the times recorded overlap to some extent, as respondents might count some activities in more than one category.
The module begins with the interviewer informing the respondent of the reference period to which the questions relate. In order to minimise the impact of recall bias, the reference day is defined as “yesterday” (Scherpenzeel & Tony, 2021)3, and the interviewer notes which day of the week this corresponds to. How people spend their time may be different by the day of the week and therefore closely linked to the day on which the interview was conducted. Table 2 below presents the distribution of the reference days. It shows that most interviews took place during weekdays, with Friday and Saturday being the days least frequently referenced, probably due to the organisation of the fieldwork by the survey agencies.
The TE module also incorporates a question regarding whether the reference day is a normal day or whether something unusual has occurred. This information allows for the assessment of whether variations in time use patterns can be attributed to specific events, whether favourable or adverse, that have impacted the respondent's daily routine. As shown in Table 3 several countries had a high percentage of respondents reporting that the reference day was unusually positive. This trend may be influenced by a number of factors, including gender and the reference day.
After establishing the reference day and its context, the module proceeds to ask respondents about their time spent across a set of predefined activity categories. The groups of activities are as follows: household chores; personal care; looking after children; helping parents or parents-in-law; helping partner; helping other family members or people; leisure; leisure with partner; administrative chores; paid work; voluntary work; commute; napping; sleeping. Table 4 presents the full list of activity groups included in the questionnaire.
In terms of questionnaire design, as is shown in Figure 1, each activity begins with a short introduction, which the interviewer reads out loud to explain what the activity involves. After the introduction, the interviewer asks the respondent to report the time spent on the activities by entering the number of hours in one field and the number of minutes in another. If the respondent declares not to have done the activity, this is indicated with the answer “0 hours” and “0 minutes.”.
6. First Results: Time Patterns Among Older Europeans
In this section, the descriptive evidence from the Wave 8 Time Expenditure module is presented to demonstrate how older Europeans allocate their time (SHARE-ERIC, 2024g). The primary objective of this study is twofold. Firstly, it seeks to emphasise patterns that can be further investigated using SHARE data. Secondly, it aims to illustrate the new module's potential for ageing research. By focusing on adults aged 50 and over (N=35.965), this study improves understanding of how time is used in later life, an area that has received limited attention in cross-country analyses. To achieve this objective, an analysis of the time use patterns of people over 50 in different European countries is conducted, with a subsequent examination of whether these patterns vary by gender, age and education. A key strength of SHARE is the ex-ante harmonisation of questionnaires across countries, which enables consistent comparison of results and the inclusion of explanatory factors such as education and health to analyse differences in time allocation from a transnational perspective.
6.1. Measures
Our analysis begins with an examination of time use patterns at the individual level, exploring how people aged 50 and over5, spend their days across European countries. The present study focuses on the key socio-demographic factors of gender, age, education and health status, which are known to influence daily activities. By examining these factors, we aim to identify differences in how time is allocated and to provide an initial descriptive overview of how older Europeans organise their everyday lives.
The primary outcome variable in the present analysis is time spent. The measurement of time is expressed in total minutes. First, the reported hours were converted into minutes. Subsequently, a new variable was created by incorporating these converted hours into the reported minutes. For instance, if a respondent indicated spending 2 hours and 10 minutes on personal care, the hours were converted into 120 minutes (2 × 60) and then combined with the 10 minutes reported, resulting in a total of 130 minutes. For the analyses in this working paper, we use the average time spent on each activity, without distinguishing between weekdays and weekends. Cases reporting 0 in both minutes and hours were kept as such. “Don’t know” and “Refusal” responses were excluded from the analysis on an item-by-item basis. We also constructed new variables that grouped the questions into broad categories of activities, as follows:

Table 5.
New broader activities categories.
| New Variable | Variables Included |
|---|---|
| Household chores and administrative tasks | te005_, te006_, te032_, te033_ |
| Helping activities | te014_, te015_, te017_, te018_, te020_, te021_, te023_, te024_ te038_ te039_ |
| Paid work and commute | te035_, te036_, te041_, te042_ |
| Leasure and personal care | te011_, te012_, te026_, te027_ |
| Sleeping and napping | te047_, te048_, te050_, te051_ |
Gender was recoded into a dummy variable that includes two categories, male and female.
Age was recategorized into three groups, "50-64", "65-79" and "80+". This categorization aims to reflect the three groups “late working age”, “retirement age”, and “oldest old”.
The education variable is based on the isced1997_r variable from the gv_isced module provided by SHARE. This generated module provides harmonised ISCED classifications across all countries. The variable was recategorized into four groups, “below secondary” (ISCED levels 0 and 1), “secondary and post-secondary” (levels 2 to 4), and “tertiary” (levels 5 and 6) plus one group for other degrees that could not be classified.
6.2. Daily Activities in Later Life: A Cross-Country Overview
Figure 2 shows the average amount of time spent on activity groups on a reference day, measured in minutes, across countries. Sleeping and napping represent the most time-consuming activity across all countries. Average sleep time ranges from approximately 434 minutes (7 hours and 14 minutes) in Israel to over 514 minutes (8 hours and 34 minutes) in Croatia. These findings underscore substantial variations in sleep patterns among older adults across different countries.
Given that the sample consists of an older population, with a large proportion of respondents already retired, the second largest proportion of time is spent in leisure and personal care activities. The time spent on these activities varies considerably across countries, ranging from relatively low levels in Italy (213 minutes) and Luxembourg (226 minutes), to notably higher levels in Slovenia (333 minutes) and the Czech Republic (322 minutes).
In contrast, paid work and commuting account for a comparatively small proportion of daily time use, reflecting the age profile of the sample and the high retirement rates. The average time spent on paid work ranges from a minimum of 36 minutes in Hungary to a maximum of 147 minutes in Italy. Higher values are observed in countries such as Italy, Denmark and the Netherlands.
The time spent on household chores and administrative tasks also varies substantially between countries. The highest average levels are observed in Hungary (155 minutes), the Czech Republic (151 minutes), and Slovenia (147 minutes), while considerably lower levels are found in France and Denmark (both 92 minutes) as well as the Netherlands (91 minutes). It is notable that the six countries with the highest average time spent on chores and administration comprise all countries in the sample that could plausibly be considered “Eastern Europe”.
Finally, time spent helping, caring for others, and volunteering is generally limited, yet remains an important part of daily life in later years. There is also notable variation in this activity, ranging from around 55 minutes in Estonia to over 130 minutes in Israel.
Overall, this figure highlights significant heterogeneity in the daily time allocation of older adults across different countries. While sleep and leisure dominate daily schedules across all countries, the relative importance of paid work, unpaid household activities, and informal care varies considerably, emphasising the influence of institutional, cultural, and life-course contexts on time use in later life.
6.3. Gender Differences in Time Use
Next, we examine gender differences in daily time allocation across countries, focusing on activity groups. Across all countries, women spend considerably more time than men on household chores and administrative tasks. The gender gap in unpaid domestic work is substantial, often exceeding one hour on the reference day, with the largest differences observed in Spain (78 minutes), Slovenia (82 minutes), Italy (84 minutes), and Greece (109 minutes). In contrast, gender differences in domestic work are smaller, though still present, in countries such as Sweden (26 minutes), Estonia (25 minutes) and Denmark (13 minutes). This illustrates a noticeable contrast between the comparatively gender-equal Northern countries and the countries of Southern Europe, where women shoulder a larger share of unpaid work.
Figure 3.
Average minutes spent on activities across gender and country. Data: SHARE Wave 8, release version: 9.0.0 (N=35.965), weighted.
Figure 3.
Average minutes spent on activities across gender and country. Data: SHARE Wave 8, release version: 9.0.0 (N=35.965), weighted.
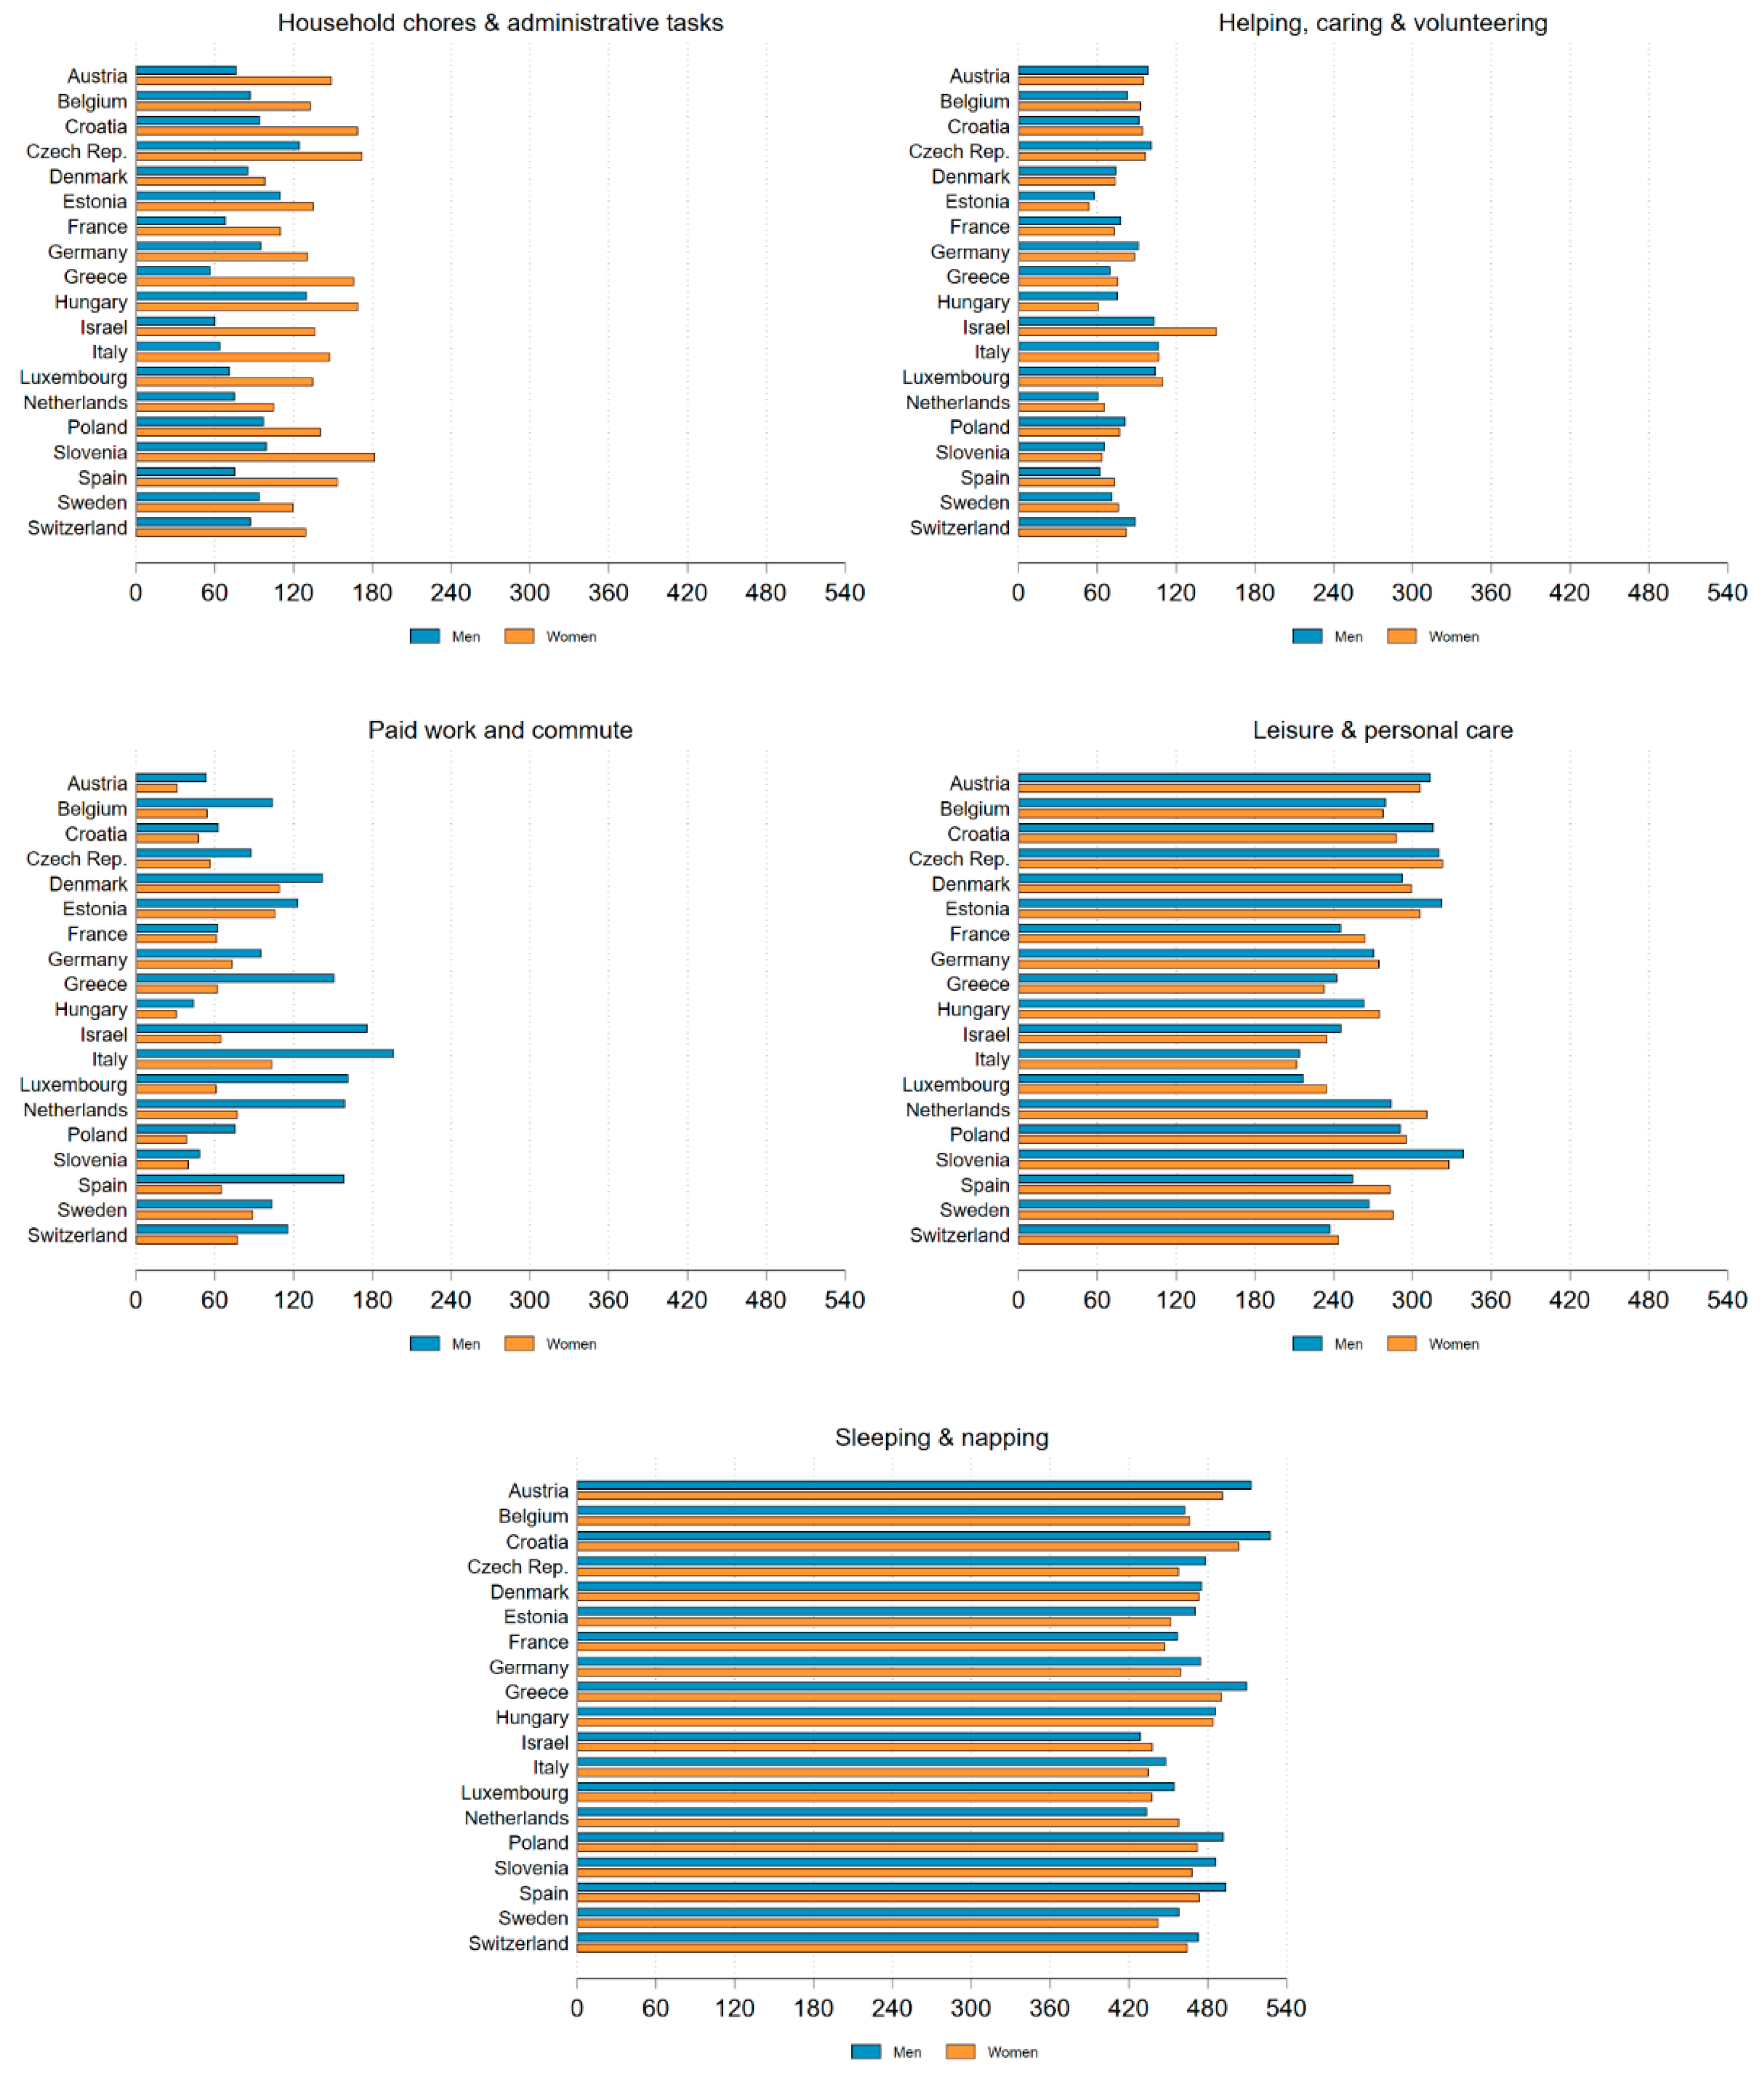
Furthermore, the results indicate only small gender differences in care-related activities. In some countries, men report slightly higher average care times than women. Overall, care-related time use appears to be almost evenly distributed between the genders in later life, with the exception of Israel where women spend considerably more time on care-related activities than men.
By contrast, men consistently spend more time on paid work than women, reflecting gendered labour market trajectories and different retirement ages. Although average levels of paid work are relatively low overall, the gender gap persists into later life, with particularly large differences observed in countries such as Italy, Israel, Spain and Greece.
Gender differences are also present in leisure and personal care activities, as well as sleeping and napping. In most countries, men spend slightly more time than women on both leisure activities and sleep, but the gender gaps are smaller than those observed for paid and unpaid work. These differences are relatively consistent across countries, but exceptions include the Netherlands, Spain as well as Sweden for leisure and the Netherlands as well as Israel for sleeping and napping.
Taken together, the figures show that gender inequalities in how time is used persist into later life. Although disparities in care work narrow substantially with age, significant gender differences remain in domestic labour and paid work, alongside small male advantages in leisure and sleep.
6.4. Age and Education Gradients in Daily Time Use
We next examine age-related differences in daily time allocation (see Figure 4). Time spent on household chores and administrative tasks remains relatively stable across age groups, though a decline is observed at older ages. Respondents aged 50–64 spend an average of 106 minutes on these activities, compared with 123 minutes among those aged 65–79. In the oldest age group (80+), the time spent on household and administrative tasks decreases to 94 minutes, indicating a decline in unpaid domestic activities with advancing age.
A clearer age gradient is observed for activities involving helping, caring, and volunteering activities. Individuals aged 50–64 spend around 95 minutes on care-related activities. This number falls to 88 minutes among those aged 65–79, and then more sharply still to 52 minutes among those aged 80 and over. This pattern indicates a progressive reduction in care-related time commitments with advancing age.
As individuals age, the time spent in paid work and commuting is known to decrease. While individuals aged 50–64 still dedicate a substantial amount of time to paid work (207 minutes on average in a reference day), this number drops to 18 minutes among those aged 65–79. This pronounced decline reflects the widespread transition into retirement in later life.
In contrast, time allocated to leisure and personal care increases with age. Average daily leisure time rises from 232 minutes among individuals aged 50–64 to 281 minutes among those aged 65–79 and remains at a similar level (281 minutes) among respondents aged 80 and above. This pattern highlights the growing importance of leisure-oriented activities as paid work obligations diminish.
Finally, sleeping and napping show a clear and constant increase across age groups. Average sleep time rises from 452 minutes (approximately 7 hours and 32 minutes) among individuals aged 50–64, to 464 minutes among those aged 65–79, reaching 490 minutes (around 8 hours and 10 minutes) in the oldest age group. This gradual increase reflects age-related changes in daily rhythms and rest patterns.
Overall, the age profiles reveal a substantial reallocation of time in later life, characterised by a decline in paid work, a gradual reduction in care-related activities, and increasing time dedicated to leisure and sleep.
Figure 5 shows the average amount of time spent on activity groups on the reference day, grouped by educational attainment and averaged across countries. Information on educational attainment was pooled from previous waves (SHARE-ERIC, 2024g, 2024f, 2024e, 2024d, 2024c, 2024b, 2024a). Rather than focusing on individual values, the figure highlights broad socio-economic patterns in daily time allocation in later life.
The time spent on household chores and administrative tasks varies moderately across educational groups. Those with secondary or post-secondary education spend slightly more time on these activities (125 minutes) than those with below-secondary (111 minutes) or tertiary (116 minutes) education, suggesting that there is no strong or consistent educational gradient in unpaid domestic work.
However, a modest educational gradient is evident for helping, caring and volunteering. The time spent on these activities increases from 71 minutes among individuals with below-secondary education, to 83–86 minutes among those with secondary or tertiary education.
Educational differences are most pronounced for paid work and commuting. Those with tertiary education spend substantially more time on paid work (119 minutes), compared to 111 minutes for those with secondary and post-secondary education, and just 44 minutes for those with below-secondary education. This gradient reflects higher labour market attachment and later retirement among the more highly educated.
Time allocated to leisure and personal care shows relatively limited variation across educational groups. Average leisure time ranges from 265 minutes among individuals with below-secondary education to 258 minutes among those with secondary and post-secondary education, with similar levels observed for tertiary education (258 minutes). Overall, leisure time appears only weakly associated with educational attainment.
Finally, sleeping and napping exhibit a modest inverse relationship with education. Individuals with lower levels of education report the longest sleep duration (469 minutes), while those with secondary, post-secondary, and tertiary education report slightly shorter sleep times (between 462 and 457 minutes). This pattern suggests small but systematic differences in rest patterns across educational groups.
Taken together, the results indicate that educational differences in daily time use during later life are most pronounced for paid work, while other activities, such as household chores, leisure, and sleep, show comparatively modest variation.
7. Conclusions
The aim of this study was to describe patterns of time use among older Europeans aged 50 years and above, with the goal of gaining a more profound understanding of the manner in which daily activities are structured in later life. Our results point to a relative stability in time use across much of later adulthood, with more pronounced changes emerging at older ages. In particular, the oldest age groups spend less time on activities involving interaction with others, such as household work and caring, and more time sleeping and resting. These findings are relevant in the context of SHARE, as they reflect key life-course transitions, such as retirement and changes in health status, that shape daily routines in older age. Our descriptive analyses also reveal substantial gender differences in time use across countries. Women consistently allocate more time to household chores whereas men dedicate more time to leisure and sleep. These patterns are persistent and highlight the continued relevance of gendered divisions of labour in later life. However, there is notable geographic variation in these gendered patterns of time expenditure. From a policy perspective, the findings underscore the importance of gender-sensitive approaches that recognise the unequal distribution of unpaid work among older adults, particularly the caregiving and domestic responsibilities that disproportionately affect older women and may constrain their opportunities for leisure and rest.
In addition, educational attainment emerges as an important dimension of heterogeneity in later-life time use. While differences by education are modest for activities such as household chores, leisure, and sleep, they are particularly pronounced for paid work and commuting. Older adults with higher levels of education remain more strongly engaged in paid work, reflecting persistent socioeconomic gradients in labour market attachment and retirement timing. These findings suggest that educational inequalities continue to shape daily life well into older age, even after formal retirement transitions.
Finally, existing research on time use among older adults often underestimates the diversity of the older population, including variation by socioeconomic status, health, and household context. A major limitation of many studies is their reliance on cross-sectional data, which provide only a snapshot of daily activities at a single point in time. Longitudinal data is needed to better understand how time use evolves as individuals age and experience changes in employment status, health, and family circumstances.
The Time Expenditure module was administered in SHARE Wave 9 and will be collected for a third time in Wave 10. These waves will provide rich longitudinal data that allow researchers to track individual-level changes in time use over time. This unique dataset offers valuable opportunities to examine how daily routines adapt to ageing, retirement, health transitions, and changes in household composition, thereby contributing to a deeper understanding of active ageing and social participation in later life.
Acknowledgments
This paper uses data from SHARE Waves 1, 2, 4, 5, 6, 7 and 8 (DOIs: 10.6103/SHARE.w1.900, 10.6103/SHARE.w2.900, 10.6103/SHARE.w4.900, 10.6103/SHARE.w5.900, 10.6103/SHARE.w6.900, 10.6103/SHARE.w7.900, 10.6103/SHARE.w8.900) see Börsch-Supan et al. (2013) for methodological details. The SHARE data collection has been funded by the European Commission, DG RTD through FP5 (QLK6-CT-2001-00360), FP6 (SHARE-I3: RII-CT-2006-062193, COMPARE: CIT5-CT-2005-028857, SHARELIFE: CIT4-CT-2006-028812), FP7 (SHARE-PREP: GA N°211909, SHARE-LEAP: GA N°227822, SHARE M4: GA N°261982, DASISH: GA N°283646) and Horizon 2020 (SHARE-DEV3: GA N°676536, SHARE-COHESION: GA N°870628, SERISS: GA N°654221, SSHOC: GA N°823782, SHARE-COVID19: GA N°101015924) and by DG Employment, Social Affairs & Inclusion through VS 2015/0195, VS 2016/0135, VS 2018/0285, VS 2019/0332, VS 2020/0313, SHARE-EUCOV: GA N°101052589 and EUCOVII: GA N°101102412. Additional funding from the German Federal Ministry of Research, Technology and Space (01UW1301, 01UW1801, 01UW2202), the Max Planck Society for the Advancement of Science, the U.S. National Institute on Aging (U01_AG09740-13S2, P01_AG005842, P01_AG08291, P30_AG12815, R21_AG025169, Y1-AG-4553-01, IAG_BSR06-11, OGHA_04-064, BSR12-04, R01_AG052527-02, R01_AG056329-02, R01_AG063944, HHSN271201300071C, RAG052527A) and from various national funding sources is gratefully acknowledged (see www.share-eric.eu).
References
- Adena, M.; Hamermesh, D.; Myck, M.; Oczkowska, M. Home Alone: Widows’ Well-Being and Time. Journal of Happiness Studies 2023, 24(2), 813–838. [Google Scholar] [CrossRef] [PubMed]
- SHARE Wave 8 Methodology: Collecting Cross-National Survey Data in Times of COVID-19; Bergmann, M., Börsch-Supan, A., Eds.; Munich Center for the Economics of Aging (MEA), 2021. [Google Scholar]
- Bergmann, M.; Kneip, T.; De Luca, G.; Scherpenzeel, A. SHARE Working Paper Series 81-2022: Survey participation in the Eighth Wave of the Survey of Health, Ageing and Retirement in Europe (SHARE). 2022; 1315719. [Google Scholar] [CrossRef]
- Bergmann, M.; Wagner, M.; Yilmaz, Y.; Axt, K.; Kronschnabl, J.; Pettinicchi, Y.; Schmidutz, D.; Schuller, K.; Stuck, S.; Börsch-Supan, A. SHARE Corona Surveys: Study profile. Longitudinal and Life Course Studies 2024, 15(4), 506–525. [Google Scholar] [CrossRef] [PubMed]
- Bergmann, M.; Bethmann, A.; De Luca, G. Sampling Design in SHARE Wave 8 and Recruitment of Refreshment Samples until the Suspension fo Fieldwork. In SHARE Wave 8 Methodology: Collecting Cross-National Survey Data in Times of COVID-19; Bergmann, M., Börsch-Supan, A., Eds.; Munich Center for the Economics of Aging (MEA), 2021; pp. 49–55. [Google Scholar]
- Börsch-Supan, A.; Brandt, M.; Hunkler, C.; Kneip, T.; Korbmacher, J.; Malter, F.; Schaan, B.; Stuck, S.; Zuber, S. Data Resource Profile: The Survey of Health, Ageing and Retirement in Europe (SHARE). International Journal of Epidemiology 2013, 42(4), 992–1001. [Google Scholar] [CrossRef] [PubMed]
- Campaña, J.C.; Gimenez-Nadal, J.I.; Velilla, J. Measuring Gender Gaps in Time Allocation in Europe. Social Indicators Research 2023, 165(2), 519–553. [Google Scholar] [CrossRef]
- European Commission. Statistical Office of the European Union. 1. Population developments. In Ageing Europe: Looking at the lives of older people in the EU: 2020 edition.; Publications Office, 2020; pp. 15–32. Available online: https://data.europa.eu/doi/10.2785/628105.
- Ferranna, M.; Sevilla, J.; Zucker, L.; Bloom, D. Patterns of Time Use Among Older People (No. W30030; p. w30030); National Bureau of Economic Research, 2022. [Google Scholar] [CrossRef]
- Gauthier, A.H.; Smeeding, T.M. Time Use at Older Ages: Cross-National Differences. Research on Aging 2003, 25(3), 247–274. [Google Scholar] [CrossRef]
- Kan, M.-Y.; Zhou, M.; Negraia, D.V.; Kolpashnikova, K.; Hertog, E.; Yoda, S.; Jun, J. How do Older Adults Spend Their Time? Gender Gaps and Educational Gradients in Time Use in East Asian and Western Countries. Journal of Population Ageing 2021, 14(4), 537–562. [Google Scholar] [CrossRef]
- Matud, M.P.; Bethencourt, J.M.; Del Pino, M.J.; Hernández-Lorenzo, D.E.; Fortes, D.; Ibáñez, I. Time Use, Health, and Well-Being across the Life Cycle: A Gender Analysis. Social Sciences 2024, 13(6), 307. [Google Scholar] [CrossRef]
- Scherpenzeel, A.; Axt, K.; Bergmann, M.; Douhou, S.; Oepen, A.; Sand, G.; Schuller, K.; Stuck, S.; Wagner, M.; Börsch-Supan, A. Collecting survey data among the 50+ population during the COVID-19 outbreak: The Survey of Health, Ageing and Retirement in Europe (SHARE). Survey Research Methods 2020, 217–221 Pages. [Google Scholar] [CrossRef]
- Scherpenzeel, A.; Tony, J. Time Expenditure. In SHARE Wave 8 Methodology: Collecting Cross-National Survey Data in Times of COVID-19; Bergmann, M., Börsch-Supan, A., Eds.; Munich Center for the Economics of Aging (MEA), 2021; pp. 49–55. [Google Scholar]
- Schuller, K.; Lasson, S.; Sand, G.; Bergmann, M.; Pflüger, S.-M.; Hannemann, T.; Börsch-Supan, A. SHARE Compliance Profiles – Wave 8 . In MEA; Max Planck Institute for Social Law and Social Policy, 2021. [Google Scholar]
- SHARE-ERIC. Survey of Health, Ageing and Retirement in Europe (SHARE) Wave 1 (Version 9.0.0) [Data set]; SHARE-ERIC, 2024a. [Google Scholar] [CrossRef]
- SHARE-ERIC. Survey of Health, Ageing and Retirement in Europe (SHARE) Wave 2 (Version 9.0.0) [Data set]; SHARE-ERIC, 2024b. [Google Scholar] [CrossRef]
- SHARE-ERIC. Survey of Health, Ageing and Retirement in Europe (SHARE) Wave 4 (Version 9.0.0) [Data set]; SHARE-ERIC, 2024c. [Google Scholar] [CrossRef]
- SHARE-ERIC. Survey of Health, Ageing and Retirement in Europe (SHARE) Wave 5 (Version 9.0.0) [Data set]; SHARE-ERIC, 2024d. [Google Scholar] [CrossRef]
- SHARE-ERIC. Survey of Health, Ageing and Retirement in Europe (SHARE) Wave 6 (Version 9.0.0) [Data set]; SHARE-ERIC, 2024e. [Google Scholar] [CrossRef]
- SHARE-ERIC. Survey of Health, Ageing and Retirement in Europe (SHARE) Wave 7 (Version 9.0.0) [Data set]; SHARE-ERIC, 2024f. [Google Scholar] [CrossRef]
- SHARE-ERIC. Survey of Health, Ageing and Retirement in Europe (SHARE) Wave 8 (Version 9.0.0) [Data set]; SHARE-ERIC, 2024g. [Google Scholar] [CrossRef]
Figure 1.
Example question design.
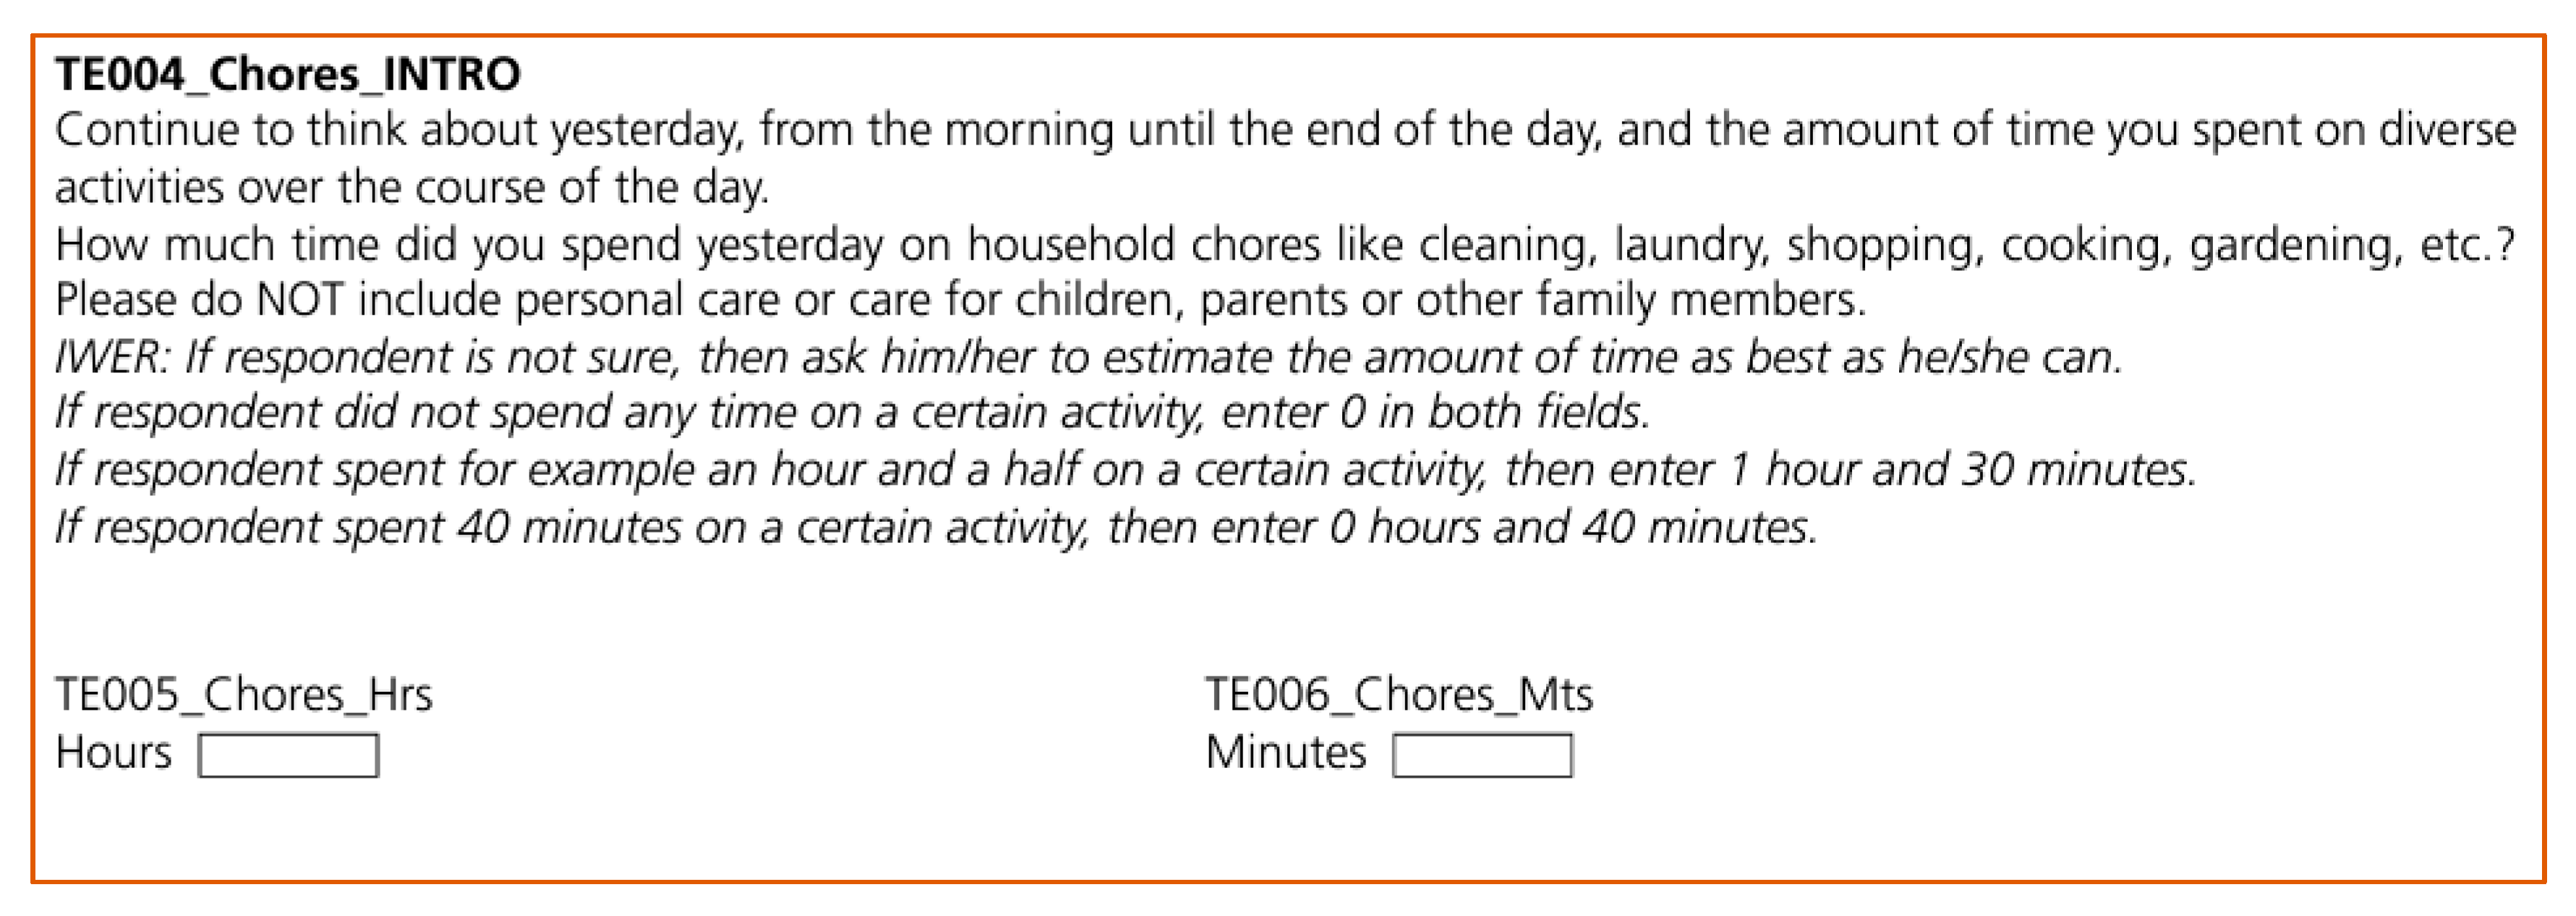
Figure 2.
Average minutes spent on activities across countries. Data: SHARE Wave 8, release version: 9.0.0 (N=35.965), weighted.
Figure 2.
Average minutes spent on activities across countries. Data: SHARE Wave 8, release version: 9.0.0 (N=35.965), weighted.
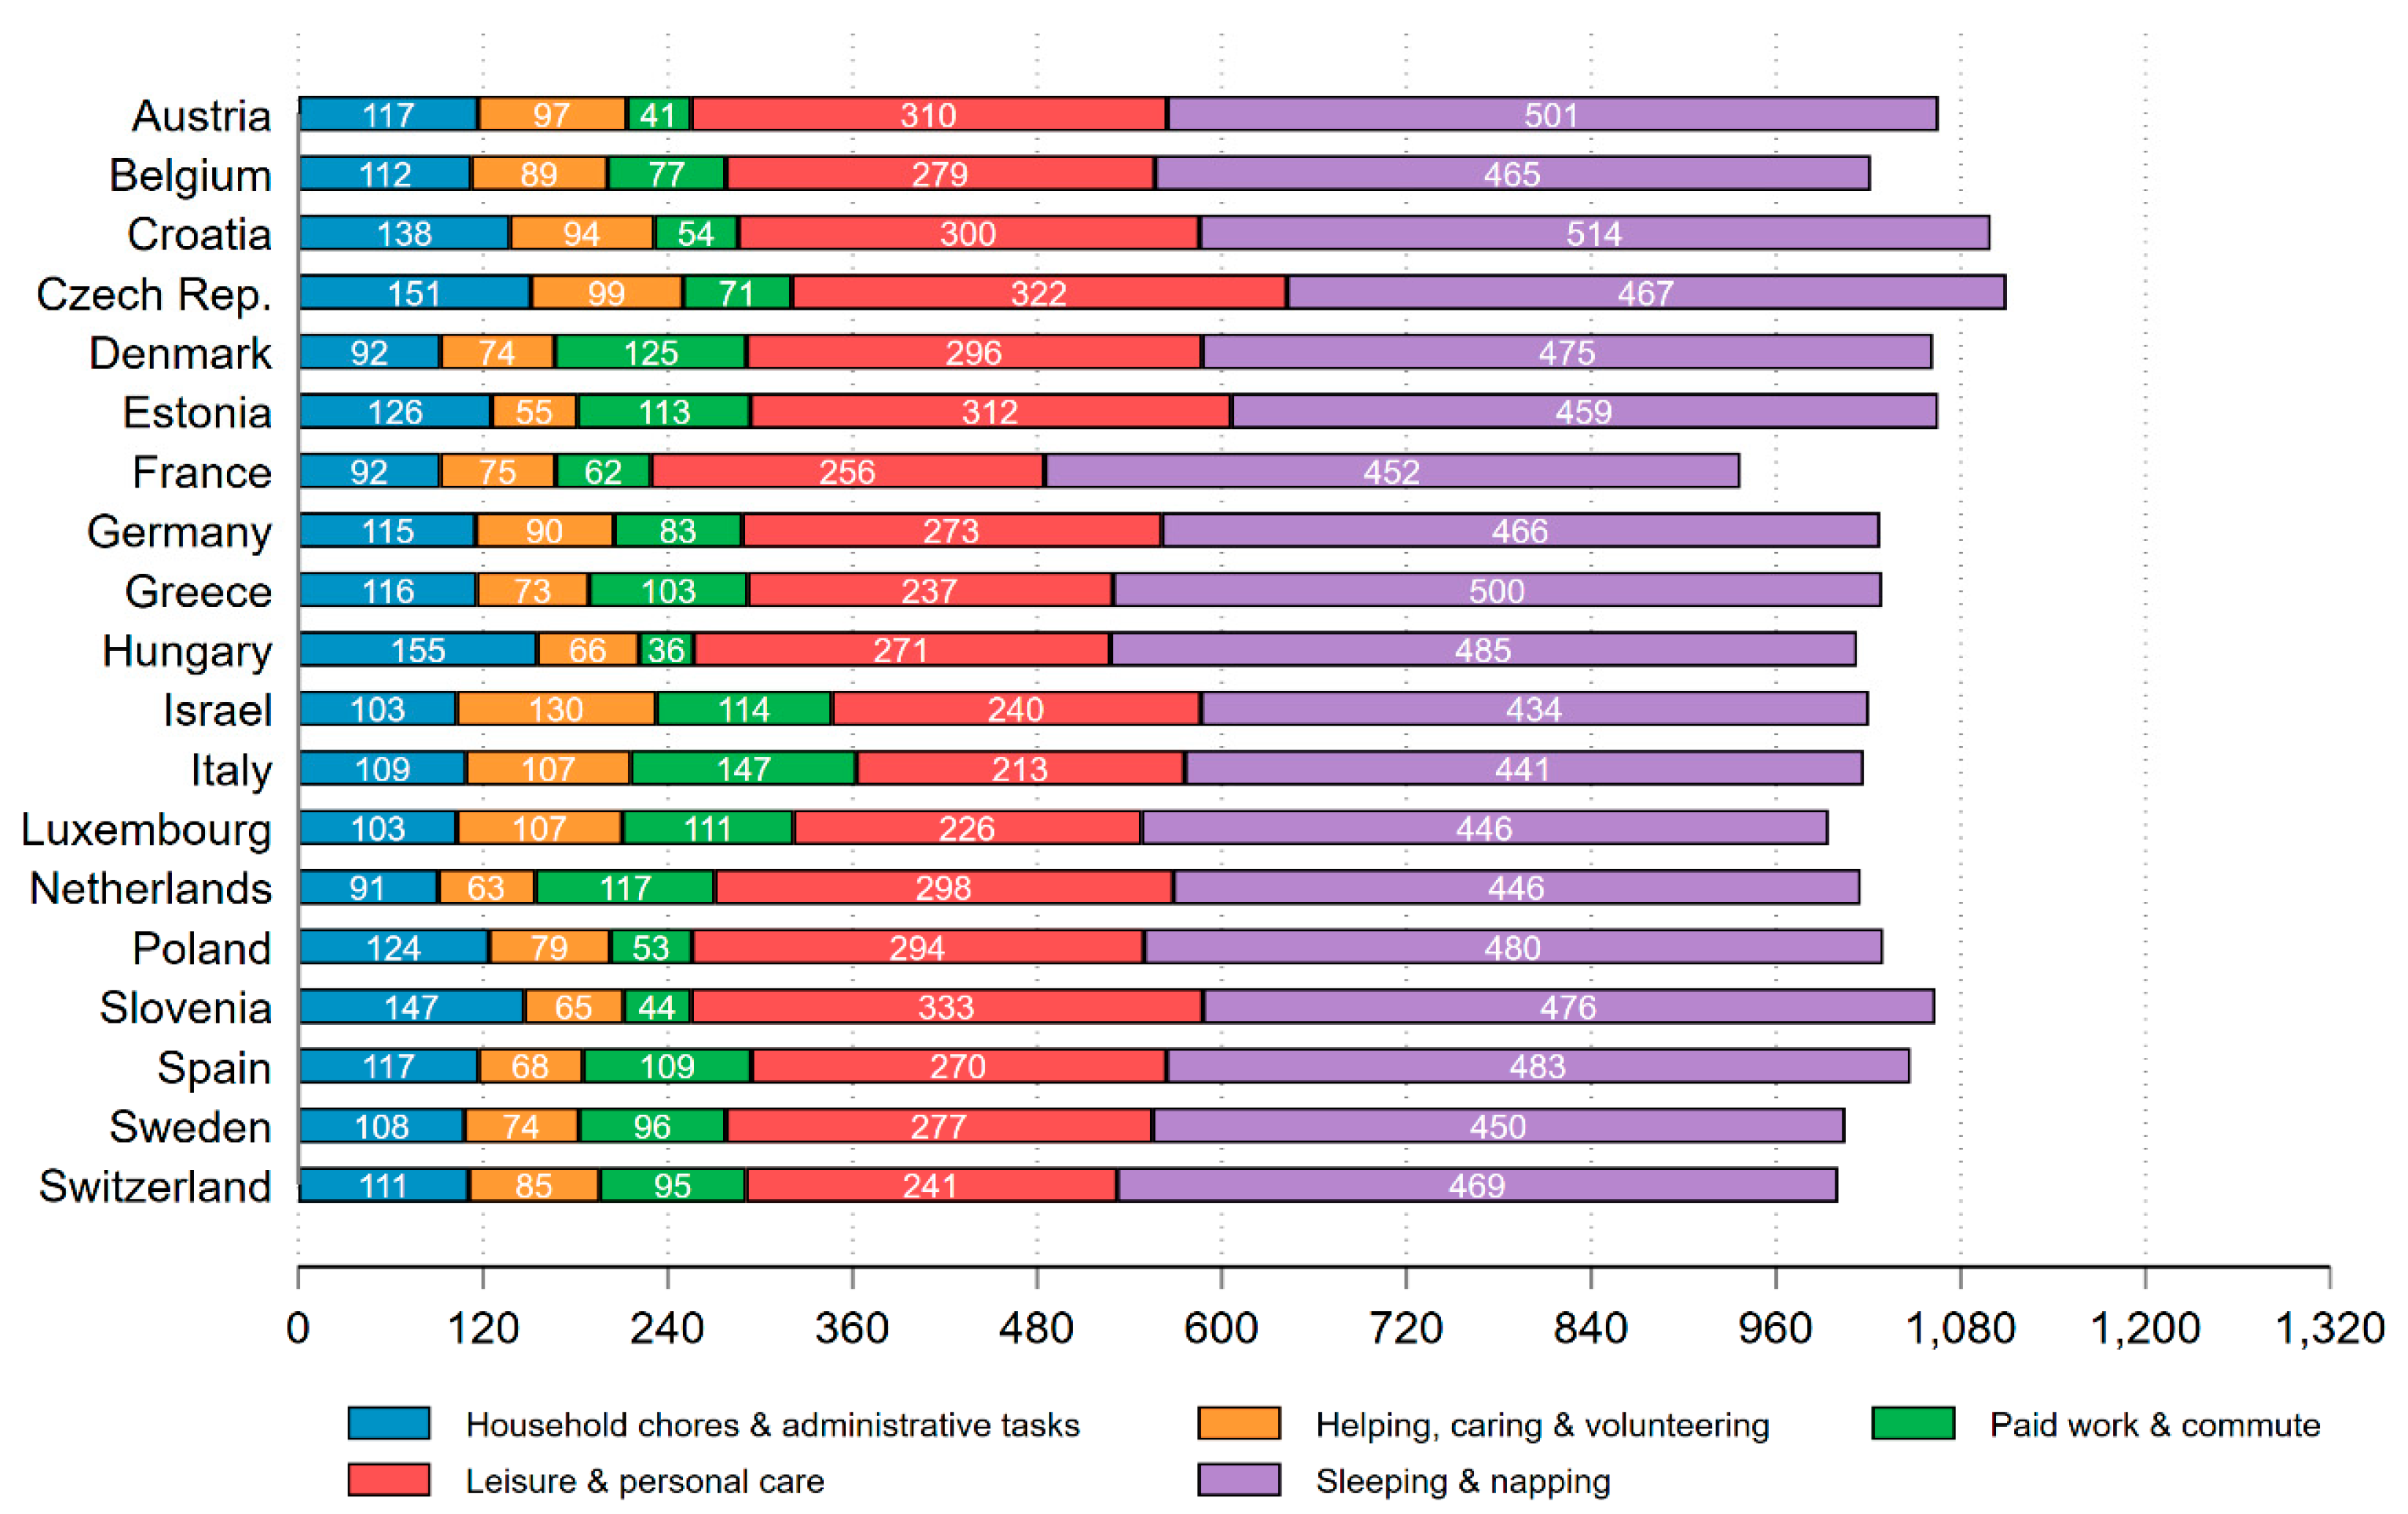
Figure 4.
Average minutes spent on activities by age groups. Data: SHARE Wave 8, release version: 9.0.0 (N=35.965), weighted.
Figure 4.
Average minutes spent on activities by age groups. Data: SHARE Wave 8, release version: 9.0.0 (N=35.965), weighted.
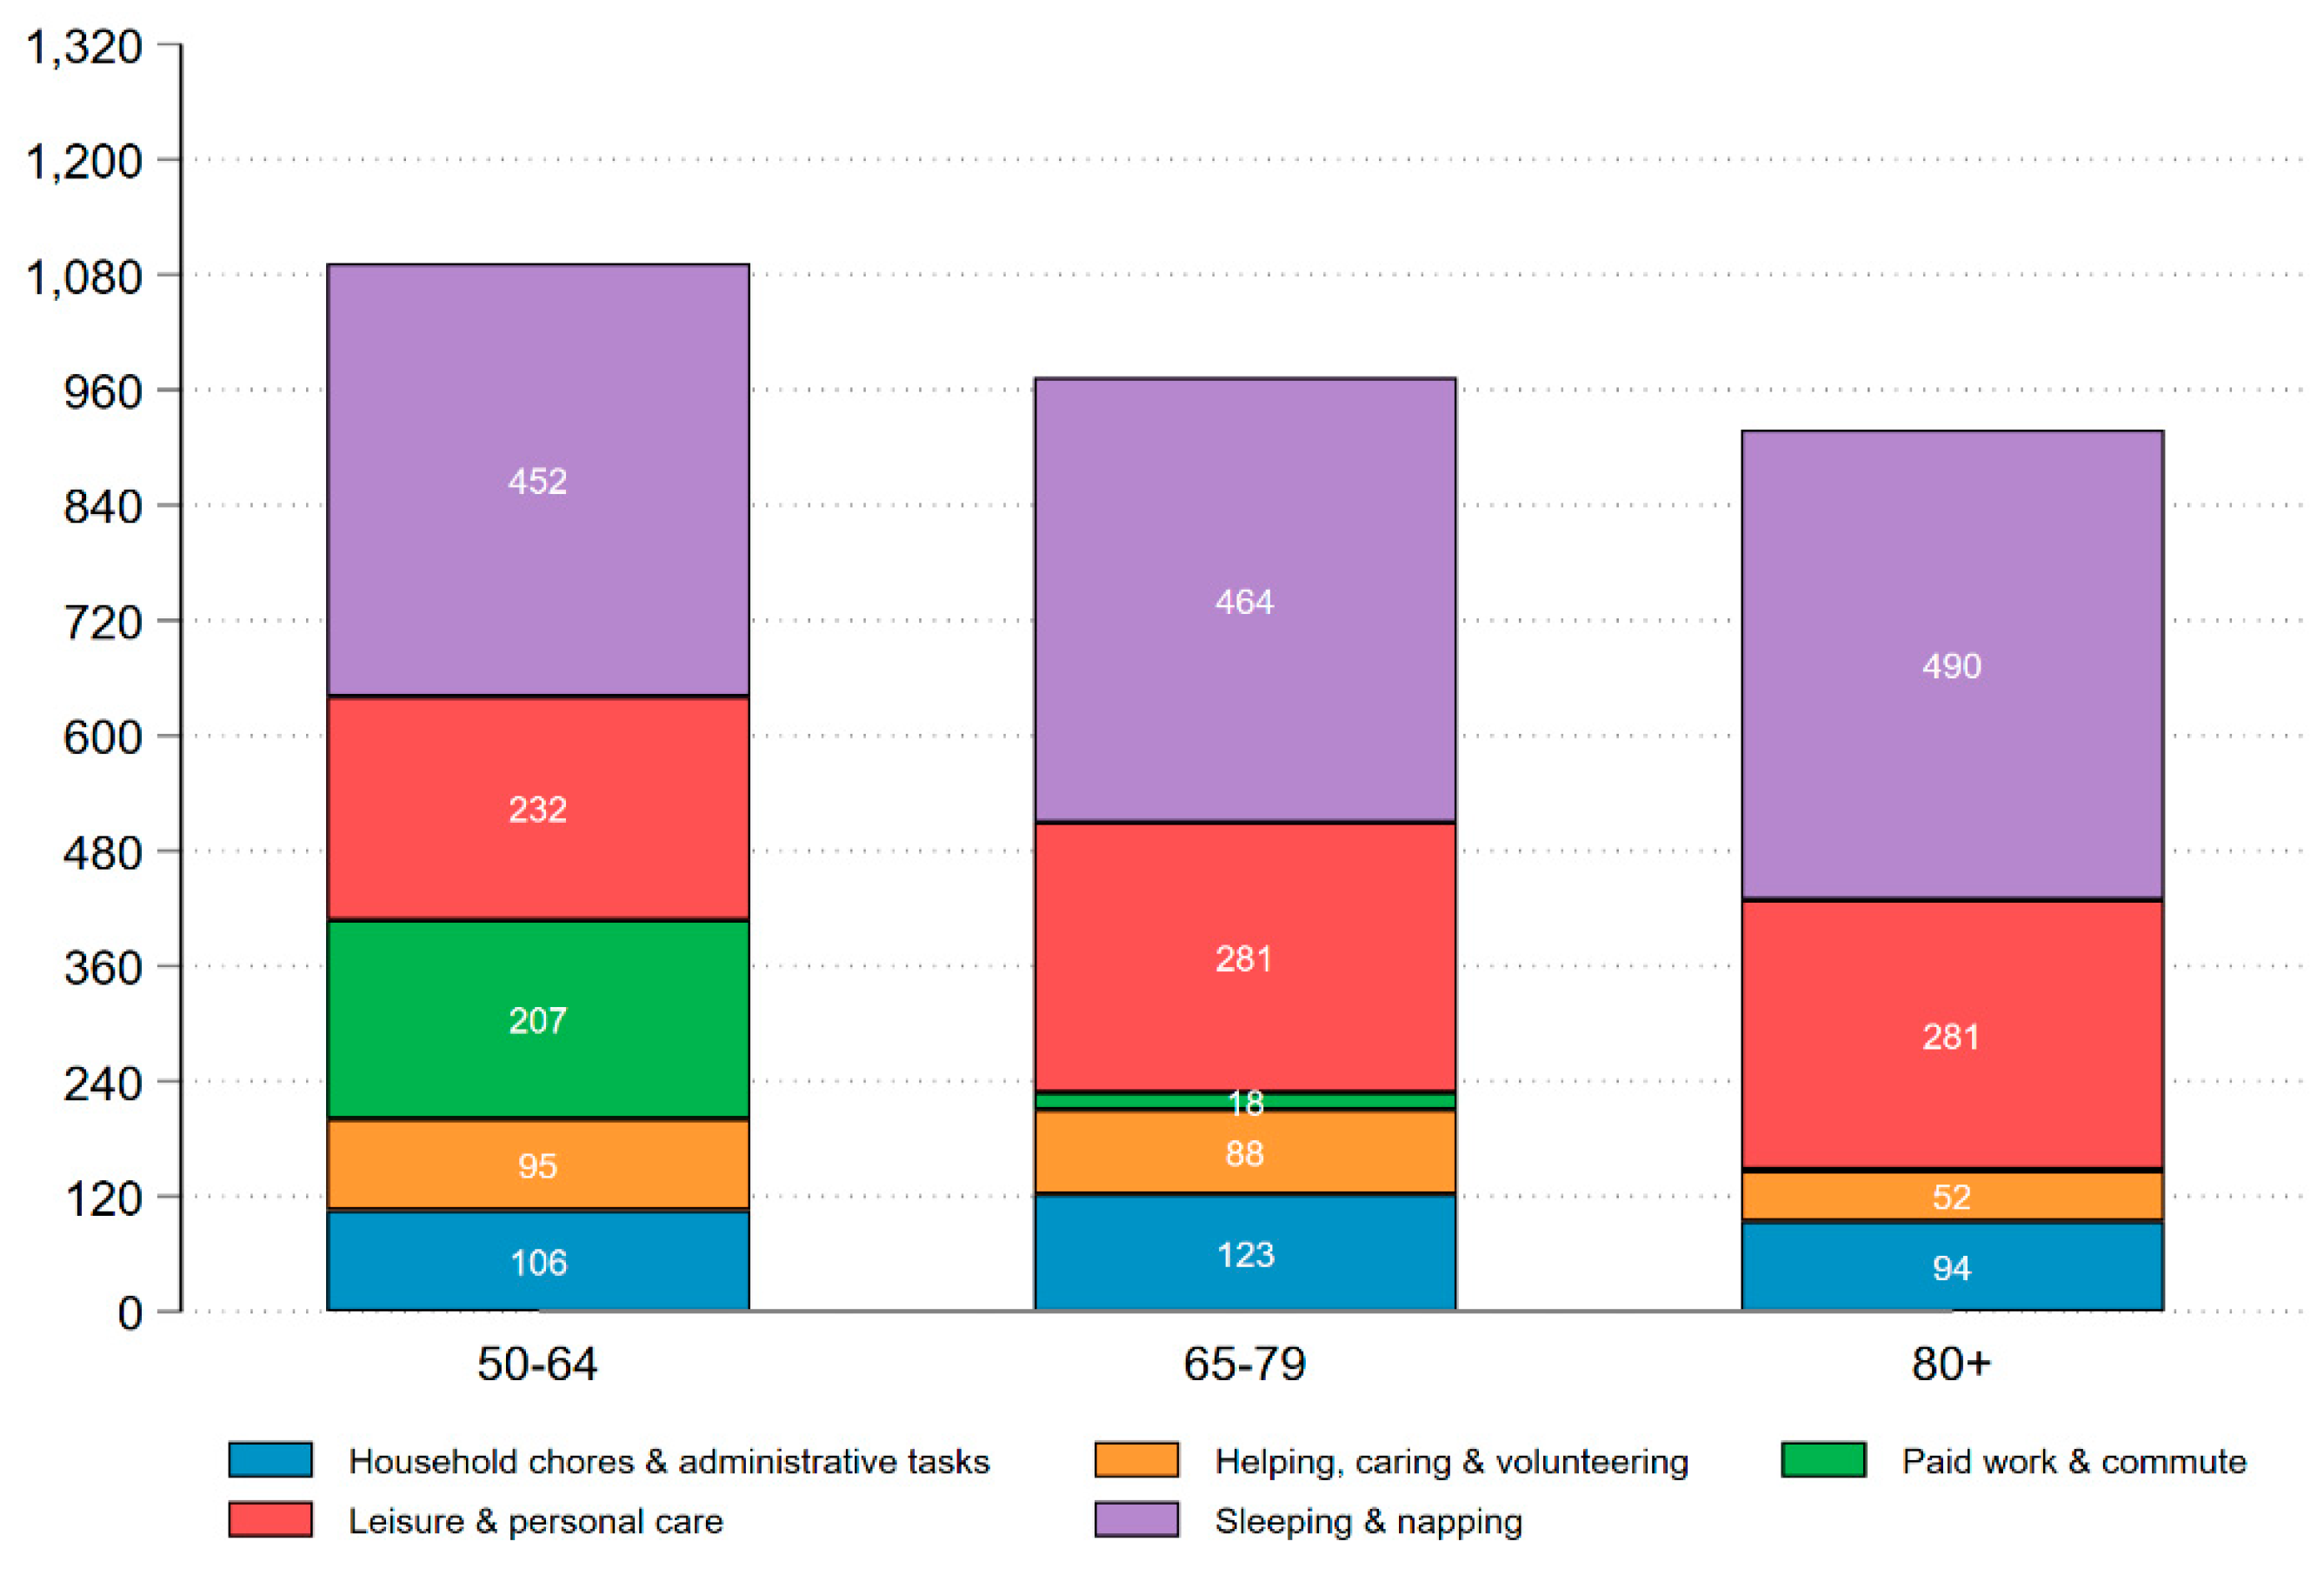
Figure 5.
Average minutes spent on activities across educational levels and country. Data: SHARE Wave 8, release version: 9.0.0 (N=35.836), weighted.
Figure 5.
Average minutes spent on activities across educational levels and country. Data: SHARE Wave 8, release version: 9.0.0 (N=35.836), weighted.
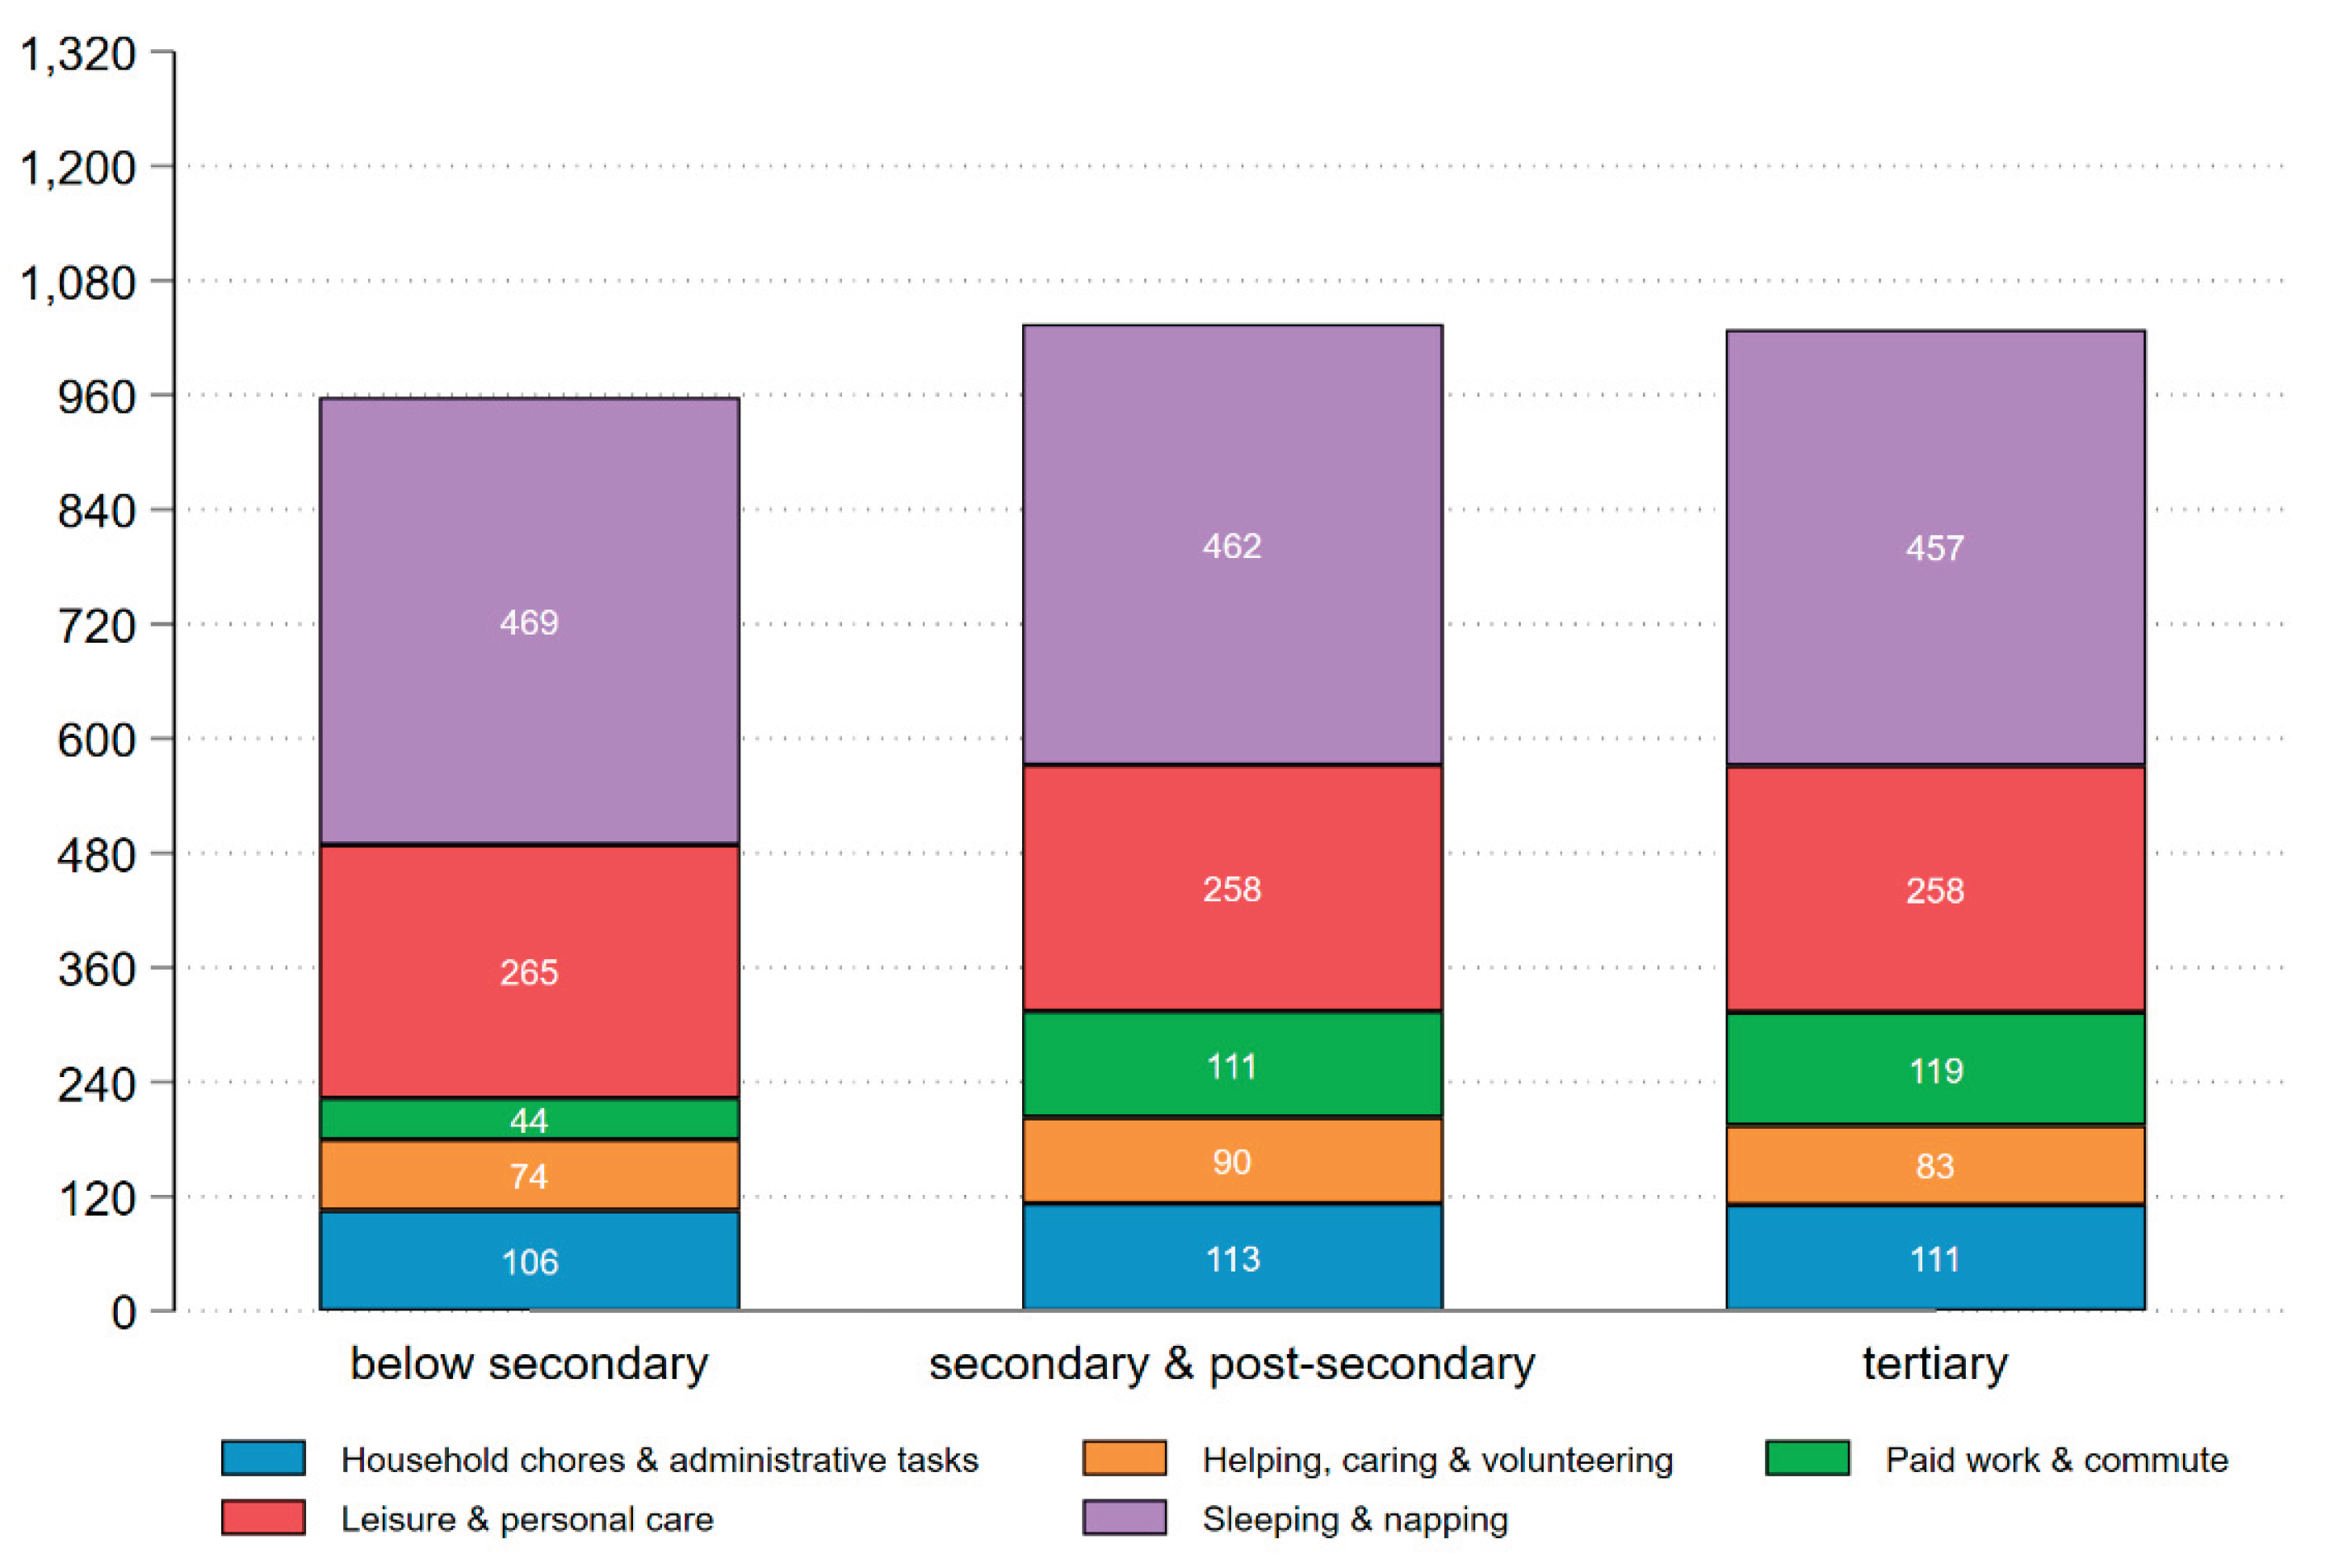
Table 1.
Time Expenditure module sample distribution by country.
| Sample | Gender | Age | ||||||
|---|---|---|---|---|---|---|---|---|
| Country | Freq. | Percent | Female | Male | <49 | 50-65 | 66-74 | 75+ |
| Austria | 1,509 | 4.17 | 60.44 | 39.56 | 0.40 | 24.78 | 34.19 | 40.62 |
| Belgium | 1,915 | 5.29 | 55.61 | 44.39 | 0.47 | 36.92 | 33.21 | 29.40 |
| Croatia | 1,055 | 2.92 | 56.87 | 43.13 | 40.95 | 32.42 | 26.16 | |
| Czech Republic | 2,634 | 7.28 | 61.20 | 38.80 | 0.34 | 23.50 | 41.84 | 34.32 |
| Denmark | 2,108 | 5.83 | 54.27 | 45.73 | 0.28 | 37.90 | 33.59 | 28.23 |
| Estonia | 2,975 | 8.22 | 63.73 | 36.27 | 0.44 | 29.14 | 30.42 | 40.00 |
| France | 2,418 | 6.68 | 58.23 | 41.77 | 0.33 | 32.30 | 34.95 | 32.42 |
| Germany | 2,809 | 7.76 | 53.29 | 46.71 | 0.21 | 34.64 | 33.61 | 31.54 |
| Greece | 2,948 | 8.15 | 57.50 | 42.50 | 0.51 | 35.48 | 32.39 | 31.61 |
| Hungary | 751 | 2.08 | 61.52 | 38.48 | 0.27 | 29.16 | 42.34 | 28.23 |
| Israel | 876 | 2.42 | 59.47 | 40.53 | 0.34 | 19.52 | 41.32 | 38.81 |
| Italy | 2,131 | 5.89 | 56.50 | 43.50 | 0.47 | 32.75 | 30.92 | 35.85 |
| Luxembourg | 868 | 2.40 | 54.26 | 45.74 | 0.12 | 44.24 | 34.22 | 21.43 |
| Netherlands | 1,846 | 5.10 | 54.71 | 45.29 | 0.16 | 26.76 | 42.31 | 30.77 |
| Poland | 780 | 2.16 | 58.08 | 41.92 | 0.13 | 30.51 | 41.79 | 27.56 |
| Slovenia | 2,346 | 6.48 | 59.25 | 40.75 | 0.21 | 31.37 | 33.97 | 34.44 |
| Spain | 2,084 | 5.76 | 56.81 | 43.19 | 0.10 | 24.04 | 32.29 | 43.57 |
| Sweden | 2,288 | 6.32 | 54.11 | 45.89 | 0.17 | 17.92 | 39.29 | 42.61 |
| Switzerland | 1,842 | 5.09 | 54.72 | 45.28 | 0.49 | 29.97 | 35.07 | 34.47 |
| Total | 36,183 | 100 | 57.40 | 42.60 | 0.32 | 30.40 | 35.13 | 34.14 |
Data: SHARE Wave 8, Release version: 9.0.0, not weighted.
Table 2.
Distribution of the reference day4.
| What Day Was Yesterday? | Freq. | Percent |
|---|---|---|
| Monday | 6,770 | 18.98 |
| Tuesday | 6,584 | 18.46 |
| Wednesday | 6,481 | 18.17 |
| Thursday | 5,328 | 14.94 |
| Friday | 2,446 | 6.86 |
| Saturday | 1,531 | 4.29 |
| Sunday | 6,530 | 18.31 |
| Total | 35,670 | 100 |
Data: SHARE Wave 8, Release version: 9.0.0, not weighted.
Table 3.
Distribution of a “normal day”.
| Country | It Was a Normal Day | My Day Included Unusual Bad Things | My Day Included Unusual Good Things |
|---|---|---|---|
| Austria | 82.26 | 4.97 | 12.77 |
| Belgium | 79.78 | 7.14 | 13.08 |
| Croatia | 86.40 | 3.74 | 9.87 |
| Czech Republic | 83.01 | 4.22 | 12.77 |
| Denmark | 73.43 | 5.73 | 20.85 |
| Estonia | 84.29 | 3.89 | 11.81 |
| France | 73.58 | 6.84 | 19.57 |
| Germany | 79.37 | 6.53 | 14.10 |
| Greece | 95.09 | 1.61 | 3.29 |
| Hungary | 93.78 | 2.44 | 3.79 |
| Israel | 78.75 | 6.27 | 14.99 |
| Italy | 91.81 | 3.35 | 4.84 |
| Luxembourg | 75.27 | 8.72 | 16.02 |
| Netherlands | 73.73 | 6.98 | 19.29 |
| Poland | 90.27 | 3.11 | 6.61 |
| Slovenia | 86.20 | 3.42 | 10.39 |
| Spain | 88.64 | 4.60 | 6.76 |
| Sweden | 62.94 | 6.53 | 30.52 |
| Switzerland | 73.17 | 5.41 | 21.42 |
| Total | 81.40 | 4.96 | 13.64 |
Data: SHARE Wave 8, Release version: 9.0.0, not weighted.
Table 4.
List of activities and variables included in TE module.
| Dimension | Question Text |
|---|---|
| Household chores | How much time did you spend yesterday on household chores like cleaning, laundry, shopping, cooking, gardening, etc? Do NOT include personal care or care for children, parents or other family members. |
| Personal care | How much time did you spend yesterday on personal care, such as washing, dressing, visiting the hairdresser, seeing the doctor, etc.? |
| Looking after children | How much time did you spend yesterday on activities with your children, grandchildren, children you baby-sit or any other children you look after? This can include washing, dressing, playing, taking to school/other activities, helping with homework etc. |
| Helping parents or parents-in-law | How much time did you spend yesterday on helping your parents or parents-in-law? This can include assistance with administrative chores, washing, dressing, taking them to see the doctor etc. |
| Helping partner | How much time did you spend yesterday on helping {your husband, your wife, your partner}? This can include assistance with administrative chores, washing, dressing, taking {him/her} to see the doctor etc. |
| Helping other family members or people | How much time did you spend yesterday on helping other family members or other people you know? DO NOT include helping {your husband, your wife, your partner or} parents and kids that you have already mentioned here. |
| Leisure | How much time did you spend yesterday on leisure time activities? This can include watching TV, social media, sports, hobbies, talking with friends or family, going out etc. |
| Administrative chores | How much time did you spend yesterday on administrative chores and own family finances? |
| Paid work | How much time did you spend yesterday on paid work? Paid work can be in employment or as self-employed. Please, do NOT include the time spent traveling to and from work, but do count overtime hours. |
| Voluntary work | How much time did you spend yesterday on voluntary work? Do NOT include household chores, helping family members, care for children, and other activities you have already just mentioned. |
| Commute | How much time did you spend yesterday on traveling to and from work or voluntary work? |
| Napping | How much time did you spend yesterday on napping and resting during daytime? Do not include sleeping at night time. |
| Sleeping | How much time did you spend yesterday on sleeping at night time? |
| Other activities | Did you spend time yesterday on other activities which we have not asked about yet? |
| Leisure with partner | You mentioned that you spent {N} hours and {N} minutes on leisure time activities, yesterday. How much of that time did you spend together with {PARTNER}? |
| 1 | SHARE is normally fielded in 28 countries (27 European countries and Israel). Portugal could not start with the Wave 8 fieldwork before the outbreak of the Covid-19 pandemic due to funding issues, so it was excluded from the Wave 8 main data collection. For a full list of participating countries, please refer to https://share-eric.eu/data/data-documentation/waves-overview. |
| 2 | Refreshment samples are the newly participating respondents, who are introduced to the SHARE sample to both include the newly eligible age cohorts (as new generations reach the age of 50) and to account for attrition. |
| 3 | See for other approaches to reference periods. |
| 4 | The difference between the totals in Table 1 and Table 2 is due to the exclusion of “don't know”, “refusal”, and “technical missing” values |
| 5 | Although the module also includes some respondents under the age of 50, for example, partners of eligible participants, we exclude them from the analysis to focus on individuals aged 50 and over. |
Disclaimer/Publisher’s Note: The statements, opinions and data contained in all publications are solely those of the individual author(s) and contributor(s) and not of MDPI and/or the editor(s). MDPI and/or the editor(s) disclaim responsibility for any injury to people or property resulting from any ideas, methods, instructions or products referred to in the content. |
© 2026 by the authors. Licensee MDPI, Basel, Switzerland. This article is an open access article distributed under the terms and conditions of the Creative Commons Attribution (CC BY) license.
Copyright: This open access article is published under a Creative Commons CC BY 4.0 license, which permit the free download, distribution, and reuse, provided that the author and preprint are cited in any reuse.


