Submitted:
10 February 2026
Posted:
12 February 2026
You are already at the latest version
Abstract
Plug-in hybrid electric vehicles (PHEVs) are expected to reduce fleet CO₂ emissions, yet their real-world performance often deviates substantially from type-approval expectations. This study examines whether traction battery capacity provides an independent explanatory signal for the test-to-reality CO₂ gap (gap%), or whether it primarily acts as a proxy for market segmentation and usage patterns. Using European on-board fuel and energy consumption monitoring (OBFCM) records for 457,555 PHEV observations (2021–2023) from 14 manufacturers, we estimate nested fixed-effects models and introduce engineered usage proxies describing charge-depleting operation (EUR), hybrid utilization intensity (HI), energy-into-battery intensity (EDE), and a real-world to type-approval fuel-consumption ratio proxy (ELP). Battery capacity alone explains limited variation in gap% (R² = 0.075), while adding segment/year/manufacturer fixed effects increases R² to 0.203 and adding usage proxies increases it to 0.826, with the battery coefficient attenuating from 19.6 to 8.9 percentage points per kWh. Allowing non-linear battery terms via cubic B-splines yields only a modest additional improvement (R² ≈ 0.829), although the conditional shape is non-monotonic. Importantly, the battery–gap association is strongly segment-dependent, ranging from −22.1 pp/kWh in medium vans to +10.5 pp/kWh in large cars. Robustness checks using model-identifier fixed effects (MS_Cn) with standard errors clustered by MS_Cn further attenuate the battery effect (p ≈ 0.085), whereas ELP remains strongly associated with gap%. Overall, battery capacity is informative for compliance analytics mainly as a proxy variable capturing segmentation and real-world usage, rather than a universal lever of PHEV CO₂ performance.
Keywords:
PHEV
; vehicles
; OBFCM
; real-world CO₂
; battery capacity
; non-linear modeling
; WLTP
1. Introduction
Plug-in hybrid electric vehicles (PHEVs) are positioned as an important transitional technology in European decarbonisation strategies because, in principle, a traction battery can displace engine operation over a substantial share of daily driving while preserving long-distance capability [1,2]. In regulatory accounting, PHEV CO₂ performance is largely inferred from type-approval procedures (e.g., WLTP) combined with assumptions about how frequently the vehicle operates electrically in real use [3,4]. This framing implies a simple intuition: increasing battery capacity should increase electric driving and reduce real-world CO₂ [5,6].
Large-scale monitoring evidence has increasingly challenged that intuition by documenting systematic gaps between type-approval expectations and real-world outcomes for contemporary European PHEV fleets [7,8]. In prior OBFCM-based analyses, the distribution of gap% was found to be heavily right-skewed with an average around 300%, indicating that real-world fuel consumption and CO₂ emissions often exceed test-cycle expectations by a wide margin [9,10]. Importantly for this study, battery capacity shows only a weak association with real-world CO₂ and exhibits a weak but positive correlation with gap%, i.e., larger batteries are not automatically linked to smaller gaps.
These observations raise an unresolved question with direct implications for compliance analytics and policy: does traction battery capacity contain an independent, causal signal for the test-to-reality CO₂ gap, or does it mainly act as a proxy for unobserved factors such as market segment, vehicle mass and performance targets, powertrain architecture, and real-world usage regimes. Because battery size is strongly entangled with segmentation [11,12] (e.g., premium or larger vehicles tending to carry larger batteries), simple bivariate relationships cannot separate “battery effect” from systematic differences in who buys the vehicle and how it is operated. A credible assessment therefore requires modelling strategies that explicitly control for segmentation and manufacturer/model heterogeneity while accounting for usage-related mechanisms that are observable in fleet monitoring data [13,14]. In Europe, regulatory updates such as the Euro 6e amendment aim to address these discrepancies by adjusting the utility factor (UF) curve used in type-approval to better reflect real-world usage, acknowledging that PHEVs often operate with far lower electric driving shares than officially assumed [15]. Similarly, studies in the United States based on data from Fuelly and the California Bureau of Automotive Repair indicate that real-world electric drive shares are 26%–56% lower than EPA label values, leading to fuel consumption 42%–67% higher than certified figures [16]. These findings underscore a systemic challenge: PHEV performance is highly dependent on actual usage patterns—especially charging behavior—rather than nominal battery capacity alone. While prior research has focused on regulatory adjustments and aggregated fleet gaps, the role of battery capacity as an explanatory variable remains ambiguous.
This study addresses that gap using data from the Joint Research Centre’s On-Board Fuel and energy Consumption Monitoring (OBFCM) database for light-duty M1 vehicles, concatenated for 2021–2023, where each record represents a unique vehicle and—when multiple OBFCM readouts exist for one vehicle—the most recent readout is retained. From this source we construct a “true PHEV” analytical sample using a minimum traction battery capacity threshold and quality filters, yielding 457,555 vehicles (and 452,872 observations in the fully specified regressions after excluding missing proxy variables) across 14 manufacturers. Methodologically, we quantify how the apparent battery–gap relationship changes along a nested fixed-effects ladder (segment, monitoring year, manufacturer), test whether non-linear battery terms add explanatory power (B-splines and partial-residual diagnostics), and estimate segment-dependent marginal battery slopes to directly evaluate heterogeneity and potential sign reversals. Finally, we perform robustness checks using model-identifier fixed effects (MS_Cn) with standard errors clustered by MS_Cn to assess whether any residual battery signal remains once model-level heterogeneity is absorbed, thereby operationalising and testing the “battery as proxy variable” interpretation in a large harmonised fleet dataset.
2. Materials and Methods
This study used vehicle-level data from the Joint Research Centre (JRC) On-Board Fuel and energy Consumption Monitoring (OBFCM) dataset for light-duty M1 vehicles, concatenated for monitoring years 2021–2023 [17]. On-Board Fuel and Energy Consumption Monitoring (OBFCM) is a standardized system installed in modern vehicles to record real-world fuel and energy usage. It collects detailed data on parameters such as distance traveled, fuel consumption, CO₂ emissions, and the operation of electric powertrains, providing a transparent view of actual vehicle performance beyond laboratory type-approval tests [18,19]. Each record represents a unique vehicle; when multiple OBFCM readouts were available for a given vehicle within the observation period, only the most recent readout was retained to avoid repeated counting and to better reflect the latest in-use state of the vehicle.
The methodological framework, illustrated in Figure 1, proceeds as follows. The analysis begins with the OBFCM database, which provides real-world fuel consumption, CO₂ emissions, and detailed powertrain operation counters for a large fleet of PHEVs. From this foundation, key variables are constructed. The dependent variable, the CO₂ gap%, is computed as the percentage difference between real-world and type-approval emissions. The primary explanatory variable is the vehicle's battery capacity (kWh). To capture the crucial dimension of usage behavior, four engineered proxies are derived from OBFCM data: Electric Utilization Ratio (EUR), Hybridization Intensity (HI), Energy-to-Distance Efficiency (EDE), and an Engine-Load Proxy (ELP). Furthermore, fixed effects for vehicle segment, monitoring year, manufacturer, and (in robustness checks) specific model identifier (MSCn) are incorporated to control for structural and unobserved heterogeneity.
A nested modeling strategy is then employed using Ordinary Least Squares (OLS) regression. Models sequentially add fixed effects and usage proxies to isolate the battery signal. Supplementary analyses include cubic B-splines to test for non-linear battery effects and segment-interaction terms to estimate heterogeneous marginal slopes.
The study demonstrates that traction battery capacity is primarily a proxy variable for market segmentation and, crucially, for real-world usage intensity (charging behavior and engine dominance). It does not serve as a universal, independent lever for real-world CO₂ performance. The findings underscore the importance of usage-based metrics—derivable from monitoring systems like OBFCM—over simple hardware specifications like battery size for effective compliance analytics and policy design targeting real-world PHEV decarbonization.
The raw database was assembled from multiple manufacturer-specific extracts and harmonized into a single analytical table including vehicle identifiers, monitoring year, brand, segment, type-approval reference values, and real-world OBFCM measurements. The core real-world variables used in this work include real-world fuel consumption (RW_FC), real-world CO₂ emissions (RW_CO2), and OBFCM distances describing charge-depleting operation with engine off and engine on, charge-increasing operation, total lifetime distance, and cumulative energy into the traction battery. Type-approval reference fuel consumption (TA_FC) was used to compute an engine-load proxy and to provide a consistent benchmark against real-world operation.
To focus the analysis on “true” plug-in hybrids and to ensure data validity, we applied a sequence of sample-selection criteria aligned with OBFCM-based fleet analyses. First, PHEVs were defined using a minimum traction battery capacity threshold of 5 kWh, which excludes conventional non-plug-in hybrids and mild hybrids while retaining vehicles with plug-in-capable battery systems. Second, quality filters were applied to remove implausible or extreme values likely reflecting data errors or non-representative operation: gap% was restricted to −100 to 1000, and RW_CO2 was restricted to 0 to 500 g/km. After applying these criteria, the final analytical cohort comprised 457,555 PHEV vehicles, with 452,872 observations available for the fully specified regressions after listwise deletion of missing values in engineered proxies.
The primary dependent variable was the test-to-reality CO₂ gap expressed as a percentage (gap%), computed consistently with OBFCM literature as the relative difference between real-world and type-approval CO₂ (or corresponding fuel-consumption-based reference), i.e., a positive value indicates that real-world emissions exceed the type-approval expectation. Battery capacity was treated as the main explanatory variable of interest, entered as a continuous predictor and mean-centered (batt_c) for interpretability and numerical stability. In addition, we engineered usage-related proxies from OBFCM fields to represent key mechanisms linking driver behavior and operating conditions to real-world emissions: EUR (electric-mode utilization ratio within charge-depleting operation), HI (hybridization intensity capturing charge-depleting engine-on plus charge-increasing distance relative to lifetime distance), EDE (energy into battery per kilometer), and ELP (a proxy for engine-dominant operation defined as the ratio RW_FC/TA_FC, capped to reduce the influence of extreme outliers).
The statistical analysis was based on ordinary least squares (OLS) regression. To test whether battery capacity provides an independent signal or mainly acts as a proxy for segmentation and usage, we estimated a nested sequence of models that progressively add controls and fixed effects: (i) a battery-only baseline, (ii) segment and monitoring-year fixed effects, (iii) manufacturer fixed effects, and (iv) engineered usage proxies. Heteroskedasticity-robust standard errors (HC3) were used as the default inference approach for baseline specifications. To evaluate whether the conditional battery–gap relationship departs from linearity, we additionally estimated models using cubic B-splines for battery capacity (df = 3–5) and used partial-residual diagnostics aggregated by battery-capacity deciles. Finally, to assess robustness to unobserved model-level heterogeneity, we estimated an alternative specification including model-identifier fixed effects (MS_Cn) and computed cluster-robust standard errors clustered by MS_Cn, which is appropriate when residual correlation is expected within model identifiers. All computations were performed in Python using standard data-science libraries (pandas/numpy) and econometric routines from statsmodels.
Formally, the regulatory gap was computed as:
where:
RW_CO2 – real-world CO2,
TA_CO2 - corresponding type-approval (WLTP) CO₂ reference value.
Positive values therefore indicate underestimation of real-world emissions by the type-approval benchmark. To reduce the influence of implausible records and ensure comparability, gap% was restricted to the interval −100 to 1000 and RW_CO2 to 0–500 g/km, consistent with OBFCM-based quality screening practices.
Engineered proxies were computed directly from OBFCM distance and energy counters to represent use intensity and powertrain operating mode. Electric-mode utilization ratio (EUR, %) was defined within charge-depleting operation:
where:
- correspond to OBFCM charge-depleting distances with engine off and engine on.
Hybridization intensity (HI, %) was defined as:
where:
dCI - charge-increasing operation distance,
dlife - total lifetime distance.
Energy-to-distance efficiency (EDE, kWh/km) was computed as:
where:
Eintobatt - cumulative energy into the battery (kWh).
The engine-load proxy (ELP, unitless) was computed from the ratio of real-world to type-approval fuel consumption and capped to limit the leverage of extreme obsertions, i.e., ELP = min(RW_FC/TA_FC,1), with larger values indicating more engine-dominant operation.
For all engineered variables, denominators were required to be strictly positive; observations with zero/negative denominators were set to missing for that derived metric. Missing values in raw OBFCM counters were treated conservatively (e.g., distance/energy counters set to zero only when consistent with the counter semantics) and the fully specified regression sample was obtained via listwise deletion across gap%, battery capacity, and engineered proxies. Battery capacity was mean-centered (batt_c) prior to model fitting to improve interpretability and numerical stability in specifications that included non-linear terms (splines).
3. Results
The final analytical sample comprised 457,555 unique PHEV vehicles after applying the battery capacity threshold (≥1.56 kWh) and quality filters (gap% restricted to [-100, 1000] and RWCO₂ to [0, 500] g/km). Table 1 presents the descriptive statistics for key variables. The sample was dominated by upper medium cars (41.7%) and lower medium cars (37.0%), with large cars accounting for 19.9% and medium vans for 1.3% of observations. The majority of vehicles were monitored in 2021 (55.8%), with 2022 and 2023 contributing 35.1% and 9.2% respectively. Battery capacity in the PHEV sample ranged from 1.56 to 21.6 kWh with a mean of 13.0 kWh (SD = 2.38 kWh). The distribution was strongly left-skewed, with 87.8% of the full raw database showing zero battery capacity values (conventional hybrids excluded from analysis), and the PHEV-only distribution concentrated between 11.6 and 14.1 kWh (IQR). The test-to-reality CO₂ gap exhibited substantial variation (mean = 300.1%, SD = 170.6%), with the median gap at 273.8%, indicating that real-world emissions typically exceeded type-approval expectations by nearly threefold.
The engineered usage proxies showed (Table 1) considerable variability across the fleet. Electricmode utilization ratio (EUR) averaged 69.8% within charge-depleting operation (SD =19.7%), with an interquartile range from 55.6% to 86.4%. Hybridization intensity (HI) averaged 19.4% (SD = 16.7%), reflecting the proportion of lifetime distance driven in engine on charge-depleting or charge-increasing modes. Energy-to-distance efficiency (EDE) averaged 0.070 kWh/km (SD = 0.056), while the engine-load proxy (ELP, defined as RWFC/TAFC and capped at 5.0) averaged 3.67 (SD = 1.13), indicating that real-world fuel consumption typically exceeded type-approval expectations by a factor of 3.7 for the engine-dominant operating component.
The manufacturer distribution was concentrated (Table 2) among premium European brands, with Volvo (33.9%) and BMW AG (25.3%) representing nearly 60% of the PHEV sample. This composition reflects both the European PHEV market structure during 2021-2023 and the availability of OBFCM data by manufacturer. The concentration in specific segments and brands underscores the importance of controlling for segmentation effects when assessing battery capacity associations with real-world gap%.
3.1. Nested Fixed-Effects Models: Battery Capacity Attenuation
To evaluate whether battery capacity provides an independent signal for the test-to-reality CO₂ gap or primarily acts as a proxy for segmentation and usage patterns, we estimated a nested sequence of OLS regression models with progressively added controls. Table 3 presents the model comparison, showing the evolution of the battery capacity coefficient and model explanatory power (R²) across four specifications.
Model M0, which regressed gap% on battery capacity alone, yielded a positive coefficient of 19.6 percentage points per kWh (p < 0.001), with an R² of only 0.075. This baseline model confirms the counterintuitive positive bivariate association: larger batteries are associated with higher test-to-reality gaps, contradicting the regulatory expectation that larger batteries should enable more electric driving and reduce real-world CO₂ emissions. Adding segment and monitoring-year fixed effects (M1) increased R² to 0.185, indicating that market segmentation explains an additional 11 percentage points of gap% variation. The battery coefficient attenuated slightly to 18.5 pp/kWh, suggesting that part of the battery-gap association is confounded by segment-level differences in vehicle characteristics and usage patterns. Further addition of manufacturer fixed effects (M2) raised R² to 0.203 and reduced the battery coefficient to 17.5 pp/kWh, reflecting manufacturer-specific heterogeneity in powertrain design, calibration strategies, and customer profiles. The most substantial change occurred in Model M3, which incorporated the four engineered usage proxies (EUR, HI, EDE, ELP) alongside all fixed effects. R² increased dramatically to 0.826, indicating that real-world usage intensity explains the vast majority of gap% variation once segmentation and manufacturer effects are controlled. Critically, the battery capacity coefficient attenuated by 54.7% from the baseline, declining to 8.9 pp/kWh (p < 0.001). This attenuation demonstrates that a large portion of the apparent battery-gap relationship is mediated by usage patterns: vehicles with larger batteries tend to be driven in more engine-dominant modes, offsetting any potential electric-range advantage. Among the usage proxies in Model M3, the engine-load proxy (ELP) exhibited the strongest association with gap% (β = 121.1, p < 0.001), confirming that the ratio of real-world to type approval fuel consumption is the dominant predictor of the test-to-reality gap. Electric mode utilization ratio (EUR) showed a negative association (β = 0.22, p < 0.001), indicating that higher electric-mode usage within charge-depleting operation is associated with marginally higher gaps when all other factors are held constant—a result likely reflecting that EUR itself is conditioned on charge-depleting events rather than overall trip mix. Energy-to-distance efficiency (EDE) exhibited a large negative coefficient (β = -305.2, p < 0.001), consistent with the interpretation that cumulative battery charging per kilometer driven reflects more frequent charging and electric operation, which partially offsets engine-dominant usage.
3.2. Non-Linear Battery Capacity Effects: Cubic Spline Analysis
To assess whether the conditional battery–gap relationship departs from linearity, we first examined partial residuals of gap% aggregated by battery-capacity deciles from the full usage-controlled model (M3). Battery capacity was divided into ten equal-count deciles between 1.56 and 21.6 kWh, and for each decile we computed the mean and interquartile range of the partial residuals, holding segment, monitoring year, manufacturer and usage proxies (EUR, HI, EDE, ELP) constant.
Figure 2 shows that the conditional relationship between battery capacity and the test-to-reality gap is clearly non-monotonic. The mean partial residual is slightly negative in the lowest two deciles (up to about 11.6 kWh, roughly −15 to −20 percentage points), becomes positive in the 11.6–13.0 kWh range (peaking around +15–20 pp), returns close to zero around 12.9–13.0 kWh, turns mildly negative again in the 13.0–13.8 kWh region (down to about −15 pp), and then rises sharply for the highest-capacity decile (14.2–21.6 kWh, about +35 pp). The shaded interquartile bands indicate that despite this structure, substantial within-decile variation remains, with IQR widths between roughly 40 and 70 percentage points.
Despite the visual evidence of non-monotonicity in the partial residuals, the incremental explanatory power of non-linear battery terms was modest. Allowing cubic B-splines with df = 3 increased R² from 0.826 to 0.828 (+0.2 percentage points), with df = 4 yielding R² = 0.829 (+0.3 pp) and df = 5 yielding R² = 0.829 (no further improvement). These results indicate that while the conditional battery-gap relationship is not strictly linear, the non-linear component explains less than 0.5% of gap% variation once usage proxies and fixed effects are included.
Figure 3 illustrates the predicted gap% as a function of battery capacity using the cubic spline model (df = 4), with all usage proxies and categorical controls held at their median or modal values (EUR = 72.2%, HI = 15.1%, EDE = 0.063 kWh/km, ELP = 3.74, segment = Upper Medium Car, year = 2021, manufacturer = Volvo). The prediction curve confirms the nonmonotonic shape observed in the partial residuals: predicted gap% peaks around 13-14 kWh at approximately 315%, declines to a local minimum around 17-18 kWh (approximately 280%), and then increases sharply for the largest batteries (>20 kWh, exceeding 410%). This U-shaped pattern suggests that the marginal effect of battery capacity on gap% reverses sign depending on the battery size range, likely reflecting the interaction between battery capacity, vehicle segment, and real-world usage regimes.
3.3. Usage Proxy Relationships: Electric Utilization and Gap%
The engineered usage proxies provide direct insight into how real-world operating behavior mediates the test-to-reality gap. Figure 4 presents a scatter plot of EUR (electric-mode utilization ratio within charge-depleting operation) versus gap%, color-coded by market segment. The negative association between EUR and gap% is visually evident: observations with higher electric utilization (EUR > 80%) cluster in the lower-gap region (gap% < 400%), while those with low electric utilization (EUR < 40%) extend to very high gaps (gap% > 600%).
The Pearson correlation between EUR and gap% was -0.34 (p < 0.001), confirming a moderate negative association. To further quantify this relationship, Table 4 presents mean and median gap% by EUR deciles. Vehicles in the lowest EUR decile (EUR ≤ 41.7%) exhibited a mean gap% of 420.7% (median = 391.1%), while those in the highest decile (EUR ≥ 94.1%) had a mean gap% of 223.1% (median = 190.6%). This 197-percentage-point difference in mean gap% across the EUR distribution underscores the dominant role of real-world charging and electric-mode usage in determining PHEV compliance outcomes.
The monotonic decline in gap% across EUR deciles demonstrates that the frequency and intensity of electric-mode operation—not battery capacity per se—is the primary 3.4 Usage Proxy Relationships: Electric Utilization and Gap% determinant of real-world PHEV CO₂ performance. Vehicles with large batteries but low charging frequency (low EUR) perform similarly to or worse than vehicles with smaller batteries but high charging frequency (high EUR), reinforcing the interpretation that battery capacity acts as a proxy for usage patterns rather than a direct causal lever.
3.4. Segment-Specific Marginal Battery Slopes: Heterogeneity and Sign Reversals
Given the strong entanglement between battery capacity and market segmentation, we estimated segment-specific marginal battery slopes by including battery×segment interaction terms in the full model (M3 specification). Table 5 and Figure 5 present the estimated marginal effects of battery capacity on gap% for each segment, along with 95% confidence intervals.
Based on Figure 5 the marginal battery slope for medium vans was -22.1 pp/kWh (95% CI: -22.7, -21.6), indicating that within this segment, larger batteries are associated with substantially lower test-to-reality gaps. This negative relationship is consistent with fleet or commercial usage patterns where vans are charged regularly and operated on predictable routes, allowing larger batteries to deliver their intended electric-range benefit. In contrast, the marginal slope for large cars was +10.5 pp/kWh (95% CI: 10.3, 10.7), indicating that larger batteries in the premium large-car segment are associated with higher gaps. This counterintuitive result likely reflects a combination of factors: premium large cars with bigger batteries tend to be heavier, more powerful, and driven by users with 3.5 Segment-Specific Marginal Battery Slopes: Heterogeneity and Sign Reversals longer trip distances and lower charging frequency, leading to predominantly engine-based operation despite the larger battery capacity. Upper medium cars exhibited an intermediate positive slope of +7.1 pp/kWh (95% CI: 6.9, 7.3), while lower medium cars showed a near-zero marginal effect (+1.0 pp/kWh, 95% CI: 0.8, 1.2). The progression from strongly negative (medium vans) through near-zero (lower medium cars) to strongly positive (large cars) demonstrates that the battery-gap relationship is not universal but contingent on segment-specific usage regimes, vehicle characteristics, and customer profiles. The sign reversal across segments is a critical finding for compliance analytics and policy design. It indicates that battery capacity alone cannot serve as a reliable proxy for realworld PHEV CO₂ performance without accounting for segmentation and usage context. In particular, policies or incentive structures that reward larger batteries without conditioning on real-world charging behavior may inadvertently favor segments and usage patterns where larger batteries do not translate into lower emissions.
3.5. Robustness Check: Model-Level Fixed Effects and Clustered Standard Errors
To further test the battery-as-proxy interpretation, we estimated an alternative specification that absorbs all model-level heterogeneity by including fixed effects for each unique model identifier (MSCn, N = 209 models). Standard errors were clustered by MSCn to account for within-model correlation in residuals. This specification effectively isolates variation in gap% and battery capacity within models that share the same powertrain architecture, market positioning, and expected customer base, providing a stringent test of whether battery capacity retains explanatory power once model-level confounding is removed.
The results of the MSCn fixed-effects model showed that the battery capacity coefficient remained positive (β = 8.88 pp/kWh in the manufacturer-FE model) but became statistically non-significant (p = 0.085) when MSCn fixed effects and clustered standard errors were applied. In contrast, the usage proxies retained their strong associations: EUR (β = 0.23, p < 0.001), HI (β = 0.10, p < 0.001), EDE (β = -305.2, p < 0.001), and especially ELP (β = 121.1, p < 0.001) remained highly significant and substantively unchanged in magnitude. This robustness check reinforces the interpretation that battery capacity's apparent association with gap% is largely spurious, driven by confounding with model-level characteristics (e.g., powertrain calibration, mass, aerodynamics, target customer segment) rather than a direct causal effect of battery size on real-world charging frequency or electric-mode operation. Once these model-level confounders are absorbed via MSCn fixed effects, the residual battery variation within models (e.g., minor capacity differences due to degradation or specification updates) has no detectable association with gap%. Meanwhile, usage intensity—as captured by the engineered proxies—remains the dominant and robust predictor of PHEV real-world CO₂ performance.
4. Discussion
The central finding of this study is that traction battery capacity provides only a weak independent signal for PHEV test-to-reality CO₂ gaps once segmentation, manufacturer heterogeneity, and real-world usage patterns are accounted for. In the baseline bivariate specification, larger batteries were associated with larger gaps (β = 19.6 pp/kWh, R2 = 0.075)—a counterintuitive result that contradicts the regulatory intuition that bigger batteries enable more electric driving and thus lower real-world emissions. However, this association attenuated by 55% to 8.9 pp/kWh (p < 0.001) after adding usage proxies (R² = 0.826), and became statistically non-significant (p = 0.085) in the model-identifier fixed-effects robustness check. These results demonstrate that battery capacity functions primarily as a proxy variable for unobserved factors such as market segmentation, powertrain design priorities, and customer usage regimes, rather than a direct causal determinant of charging frequency or electric-mode operation.
This proxy interpretation aligns with the fleet-level composition of the OBFCM data: larger batteries are disproportionately found in premium large-car and upper-medium segments (mean 15.2 kWh) driven by customers with longer trip distances, higher performance expectations, and lower charging access, leading to predominantly engine-dominant operation. Conversely, medium vans with larger batteries (often fleet-operated) exhibit the strongest negative battery-gap relationship (−22.1 pp/kWh), reflecting predictable routes and regular charging infrastructure. The near-zero marginal effect in lower-medium cars (+1.0 pp/kWh) further illustrates how battery size alone cannot predict compliance outcomes without segment context.
Real-world usage proxies explained the overwhelming majority of gap variation (R² increase from 0.203 to 0.826), confirming that PHEV CO₂ performance hinges on charging behavior rather than nominal electric range. The engine-load proxy (ELP; RWFC/TAFC) emerged as the strongest predictor (β = 121.1, p < 0.001), with real-world fuel consumption exceeding type-approval values by a factor of 3.7 on average—consistent with fleet-wide gaps of 3.5–4.9× reported by T&E and EEA analyses of OBFCM data. Electric utilization ratio (EUR) showed a moderate negative correlation (r = −0.34), with gap% declining monotonically from 421% (EUR < 42%) to 223% (EUR > 94%), underscoring that the share of charge-depleting distance driven electrically—not battery capacity—is key.
These patterns echo prior OBFCM studies: ICCT analyses of ~9,000 European PHEVs found real-world fuel consumption 3–5× higher than WLTP (4.0–8.4 L/100 km vs. 1.6 L/100 km), driven by low charge-depleting utilization rather than battery limitations. Our engineered proxies (EUR, HI, EDE, ELP) operationalize these mechanisms at fleet scale, explaining why aggregate battery capacity fails as a compliance metric.
The segment-specific marginal slopes reveal fundamental heterogeneity: from strongly negative (−22.1 pp/kWh, medium vans) through near-zero (+1.0 pp/kWh, lower-medium cars) to strongly positive (+10.5 pp/kWh, large cars). This sign reversal across segments indicates no universal battery-gap relationship, challenging simplistic regulatory assumptions. Large-car premiums prioritize performance and long-distance capability, offsetting battery benefits via mass and engine-dominant usage; medium vans leverage batteries via fleet discipline.
Such heterogeneity extends prior segment-stratified OBFCM work, where premium PHEVs consistently underperform despite larger batteries. Our analysis quantifies this via interaction terms, showing that omitting segmentation biases battery coefficients upward by 120% (19.6 vs. 8.9 pp/kWh).
Partial residuals exhibited a clear non-monotonic pattern—local minima at ~11 kWh and ~13.5 kWh, sharp rise above 14 kWh—yet cubic splines added only 0.3% to R² (0.826 → 0.829). This modest gain suggests non-linearities reflect discrete battery-size jumps tied to segment/model transitions rather than smooth technological gradients. Wide IQR bands (~40–70 pp) highlight residual individual variation unexplained by fleet aggregates.
Our mean gap of 300% aligns with recent OBFCM fleet reports: T&E documented widening gaps from 3.5× (2021) to 4.9× (2023) across 800,000+ PHEVs; Ariadne Projekt estimated 6.0–6.2 L/100 km real-world vs. 1.0–1.25 L/100 km WLTP; JRC/EEA confirmed 3.5× multipliers for 2021 PHEVs [20]. Unlike model-level audits, our 457,555-vehicle sample enables fixed-effects decomposition, isolating battery's proxy role.
Our findings provide empirical, fleet-scale validation for the regulatory concerns and proposed measures outlined in recent policy assessments. The stark divergence between type-approval and real-world performance we document (mean gap of 300%) directly echoes and quantifies the warnings from European NGOs and agencies about PHEVs becoming a compliance loophole, delivering only a fraction of expected on-road CO₂ savings [21]. The critical role of usage proxies like ELP and EUR underscores the necessity of moving beyond static hardware parameters like battery capacity for regulation. This supports the core argument for the mandatory collection and use of On-Board Fuel Consumption Monitoring (OBFCM) data as a foundational tool for transparency and effective policy-making, a point strongly emphasized in the context of both closing the emissions gap and holding manufacturers accountable [22]. Furthermore, our segment-specific results—showing high-emitting large cars versus lower-emitting fleet vans—offer a data-driven rationale for nuanced policy design. They align with recommendations that any future role for PHEVs, such as a potential limited allowance post-2035, must be contingent upon meeting strict, real-world performance criteria (e.g., minimum electric range, maximum real-world CO₂ thresholds) verified via OBFCM, as suggested by analyses like the Ariadne Projekt [23]. Ultimately, our conclusion that "PHEV compliance hinges on usage reality, not battery promises" reinforces the imperative for regulations like the evolving Euro 6e/7 framework to anchor compliance in verified real-world operation, ensuring this transitional technology genuinely contributes to decarbonization goals without undermining the transition to full electrification.
Regulatory studies emphasize utility-factor corrections to address these gaps, supporting our call for usage-based monitoring over battery-size incentives [24,25]. Battery capacity cannot serve as a standalone compliance proxy: it conflates technology with usage and segmentation, potentially rewarding engine-dominant premiums while penalizing efficient fleet vans. Policymakers should prioritize OBFCM-derived usage metrics (e.g., ELP caps, minimum EUR floors) in fleet regulations, as proposed by T&E and Ariadne. Model-identifier fixed effects reveal that intra-model battery variation (e.g., degradation) has negligible gap impact, validating usage-focused verification.
Cross-sectional OBFCM data precludes causal identification of charging infrastructure or trip-profile effects. Retrospective proxies (e.g., EUR conditioned on charge-depleting events) may understate full-hybrid operation. Future work could link OBFCM to GPS/telematics for trip-level analysis or panel data to track degradation [26]. Extending to 2024–2025 data will assess post-UF-correction trends.
5. Conclusions
Traction battery capacity serves primarily as a proxy variable for market segmentation and real-world usage patterns rather than an independent determinant of PHEV test-to-reality CO₂ gaps. While larger batteries show a positive bivariate association with gaps (β = 19.6 pp/kWh), this effect attenuates by 55% after controlling for usage proxies (β = 8.9 pp/kWh, R² = 0.826) and becomes insignificant with model-level fixed effects (p = 0.085). Segment-specific slopes range from strongly negative in medium vans (−22.1 pp/kWh) to strongly positive in large cars (+10.5 pp/kWh), confirming no universal battery–gap relationship.
Real-world usage intensity—as captured by electric utilization ratio (EUR), engine-load proxy (ELP), and related metrics—explains the vast majority of compliance variation. Gap% declines monotonically from 421% (EUR < 42%) to 223% (EUR > 94%), underscoring that charging behavior, not battery size, drives PHEV performance.
For compliance analytics and policy design, regulators should prioritize OBFCM-derived usage metrics over battery capacity as a performance indicator, conditioning incentives on verified real-world electric operation across diverse segments and manufacturers.
Author Contributions
For research articles with several authors, a short paragraph specifying their individual contributions must be provided. The following statements should be used “Conceptualization, P.K. and M.M.; methodology, M.M.; software, M.M.; validation, T.C., P.K. and M.M.; formal analysis, T.C.; investigation, M.M.; resources, M.M.; data curation, M.M.; writing—original draft preparation, M.M.; writing—review and editing, M.M.; visualization, M.M.; supervision, T.C.; project administration, P.K.; funding acquisition, T.C. All authors have read and agreed to the published version of the manuscript.” Please turn to the CRediT taxonomy for the term explanation. Authorship must be limited to those who have contributed substantially to the work reported.
Funding
This research received no external funding
Data Availability Statement
The original contributions presented in this study are included in the article. Further inquiries can be directed to the corresponding author.
Conflicts of Interest
The authors declare no conflicts of interest.
Abbreviations
The following abbreviations are used in this manuscript:
BEV Battery Electric Vehicle
CD Charge-Depleting (mode)
CI Charge-Increasing (operation)
CO₂ Carbon Dioxide
CS Charge-Sustaining (mode)
EDE Energy-to-Distance Efficiency
ELP Engine-Load Proxy
EUR Electric Utilization Ratio
FE Fixed Effects
GHG Greenhouse Gas
HI Hybridization Intensity
MDPI Multidisciplinary Digital Publishing Institute
OBFCM On-Board Fuel and energy Consumption Monitoring
OLS Ordinary Least Squares
PEMS Portable Emissions Measurement System
PHEV Plug-in Hybrid Electric Vehicle
pp/kWh Percentage points per kilowatt-hour
RDE Real Driving Emissions
RW_CO₂ Real-World CO₂ emissions
RW_FC Real-World Fuel Consumption
TA_CO₂ Type-Approval CO₂ emissions
TA_FC Type-Approval Fuel Consumption
UF Utility Factor
WLTP Worldwide Harmonized Light Vehicles Test Procedure
References
- Neves, S. A.; Marques, A. C. What has driven the adoption of BEV and PHEV in the EU? Research in Transportation Business & Management 2025, 60, 101331. [Google Scholar] [CrossRef]
- Pollák, F.; Vodák, J.; Soviar, J.; Markovič, P.; Lentini, G.; Mazzeschi, V.; Luè, A. Promotion of electric mobility in the European Union—Overview of project PROMETEUS from the perspective of cohesion through synergistic cooperation on the example of the catching-up region. Sustainability 2021, 13(3), 1545. [Google Scholar] [CrossRef]
- Liu, X.; Zhao, F.; Hao, H.; Chen, K.; Liu, Z.; Babiker, H.; Amer, A. A. From NEDC to WLTP: Effect on the Energy Consumption, NEV Credits, and Subsidies Policies of PHEV in the Chinese Market. Sustainability 2020, 12(14), 5747. [Google Scholar] [CrossRef]
- Pavlovic, J.; Tansini, A.; Fontaras, G.; Ciuffo, B.; Otura, M. G.; Trentadue, G.; Millo, F. No. 2017-24-0133; The Impact of WLTP on the Official Fuel Consumption and Electric Range of Plug-in Hybrid Electric Vehicles in Europe. SAE Technical Paper, 2017.
- Pielecha, J.; Gis, W. Testing Exhaust Emissions of Plug-In Hybrid Vehicles in Poland. Energies 2024, 17(24), 6288. [Google Scholar] [CrossRef]
- Pielecha, J.; Skobiej, K.; Kubiak, P.; Wozniak, M.; Siczek, K. Exhaust emissions from plug-in and HEV vehicles in type-approval tests and real driving cycles. Energies 2022, 15(7), 2423. [Google Scholar] [CrossRef]
- Tansini, A.; Pavlovic, J.; Fontaras, G. Quantifying the real-world CO2 emissions and energy consumption of modern plug-in hybrid vehicles. Journal of Cleaner Production 2022, 362, 132191. [Google Scholar] [CrossRef]
- Plötz, P.; Link, S.; Ringelschwendner, H.; Keller, M.; Moll, C.; Bieker, G.; Mock, P. Real-world usage of plug-in hybrid vehicles in Europe. In ICCT White Paper; 2022. [Google Scholar]
- Mądziel, M.; Campisi, T. Can Plug-in Hybrids Deliver the Promised CO 2 Reductions? OBFCM-Based Real-World Assessment of European Passenger Cars. 2026. [Google Scholar]
- Tansini, A.; Marin, A. L.; Suarez, J.; Aguirre, N. F.; Fontaras, G. Learning from the real-world: Insights on light-vehicle efficiency and CO2 emissions from long-term on-board fuel and energy consumption data collection. Energy Conversion and Management 2025, 335, 119816. [Google Scholar] [CrossRef]
- Patil, T. D.; Vinot, E.; Ehrenberger, S.; Trigui, R.; Redondo-Iglesias, E. Sensitivity analysis of battery aging for model-based PHEV use scenarios. Energies 2023, 16(4), 1749. [Google Scholar] [CrossRef]
- Guozhi, P.; Tao, Z.; Guanhong, D.; Zekang, H.; Feifan, Y.; Shaobo, X. Battery sizing for plug-in hybrid electric vehicles considering social cost of carbon. Journal of Energy Storage 2025, 131, 117556. [Google Scholar] [CrossRef]
- Zacharof, N.; Broekaert, S.; Grigoratos, T.; Bitsanis, E.; Fontaras, G. A real world assessment of European medium-duty vehicle emissions and fuel consumption. Atmospheric Environment: X 2025, 25, 100307. [Google Scholar] [CrossRef]
- Suarez, J.; Tansini, A.; Ktistakis, M. A.; Marin, A. L.; Komnos, D.; Pavlovic, J.; Fontaras, G. Towards zero CO2 emissions: Insights from EU vehicle on-board data. Science of the Total Environment 2025, 1001, 180454. [Google Scholar] [CrossRef]
- Dornoff, J. Euro 6e: Changes to the European Union light-duty vehicle type-approval procedure. POLICY 2022. [Google Scholar]
- Isenstadt, A.; Yang, Z.; Searle, S.; German, J. Real world usage of plug-in hybrid vehicles in the United States. In Real world usage of plug-in hybrid vehicles in the United States; 2022. [Google Scholar]
- Suarez Corujo, Jaime; Tansini, Alessandro; Ktistakis, Markos; Laverde Marin, Andres; Komnos, Dimitrios; Pavlovic, Jelica; Fontaras, Georgios. OBFCM real-world data from M1 vehicles; European Commission, Joint Research Centre (JRC), 2025. [Google Scholar]
- Dimaratos, A.; Kontses, D.; Doulgeris, S.; Zacharof, N.; Keramidas, A.; Stamos, G.; Samaras, Z. No. 2023-24-0113; The potential of on-board data monitoring for the characterization of real-world vehicle fuel and energy consumption and emissions. SAE Technical Paper, 2023.
- Tapak, P.; Kocur, M.; Matej, J. On-Board Fuel Consumption Meter Field Testing Results. Energies 2023, 16(19), 6861. [Google Scholar] [CrossRef]
- Plötz, P.; Gnann, T. Real-world Fuel Consumption and Potential Future Regulation of Plug-In Hybrid Electric Vehicles in Europe–An Empirical Analysis of about one Million Vehicles. 2025. [Google Scholar]
- Plötz, P.; Link, S.; Ringelschwendner, H.; Keller, M.; Moll, C.; Bieker, G.; Mock, P. Real-World Usage of Plug-in Hybrid Vehicles in Europe: A 2022 Update on Fuel Consumption, Electric Driving, and CO₂ Emissions. 2022. [Google Scholar]
- Document: How can fuel consumption meters ensure car CO2 limits are met on the road. Trasnport&Environemnt. 2020. Available online: https://www.transportenvironment.org/articles/how-can-fuel-consumption-meters-ensure-car-co2-limits-are-met-road (accessed on 5.02.2026).
- Plötz, P.; Gnann, T. Real-world Fuel Consumption and Potential Future Regulation of Plug-In Hybrid Electric Vehicles in Europe–An Empirical Analysis of about one Million Vehicles. 2025. [Google Scholar]
- Mądziel, M. Phase-Specific Mixture of Experts Architecture for Real-Time NOx Prediction in Diesel Vehicles: Advancing Euro 7 Compliance. Energies 2025, 18, 5853. [Google Scholar] [CrossRef]
- Pielecha, J.; Woś, P.; Kuszewski, H.; Mądziel, M.; Krzemiński, A.; Kulasa, P.; Gis, W.; Piątkowski, P.; Sobczak, J. Real-Driving Emissions of Euro 2–Euro 6 Vehicles in Poland—17 Years of Experience. Appl. Sci. 2026, 16, 348. [Google Scholar] [CrossRef]
- Mądziel, M.; Campisi, T. Predicting Auxiliary Energy Demand in Electric Vehicles Using Physics-Based and Machine Learning Models. Energies 2025, 18, 6092. [Google Scholar] [CrossRef]
Figure 1.
General workflow of the research.
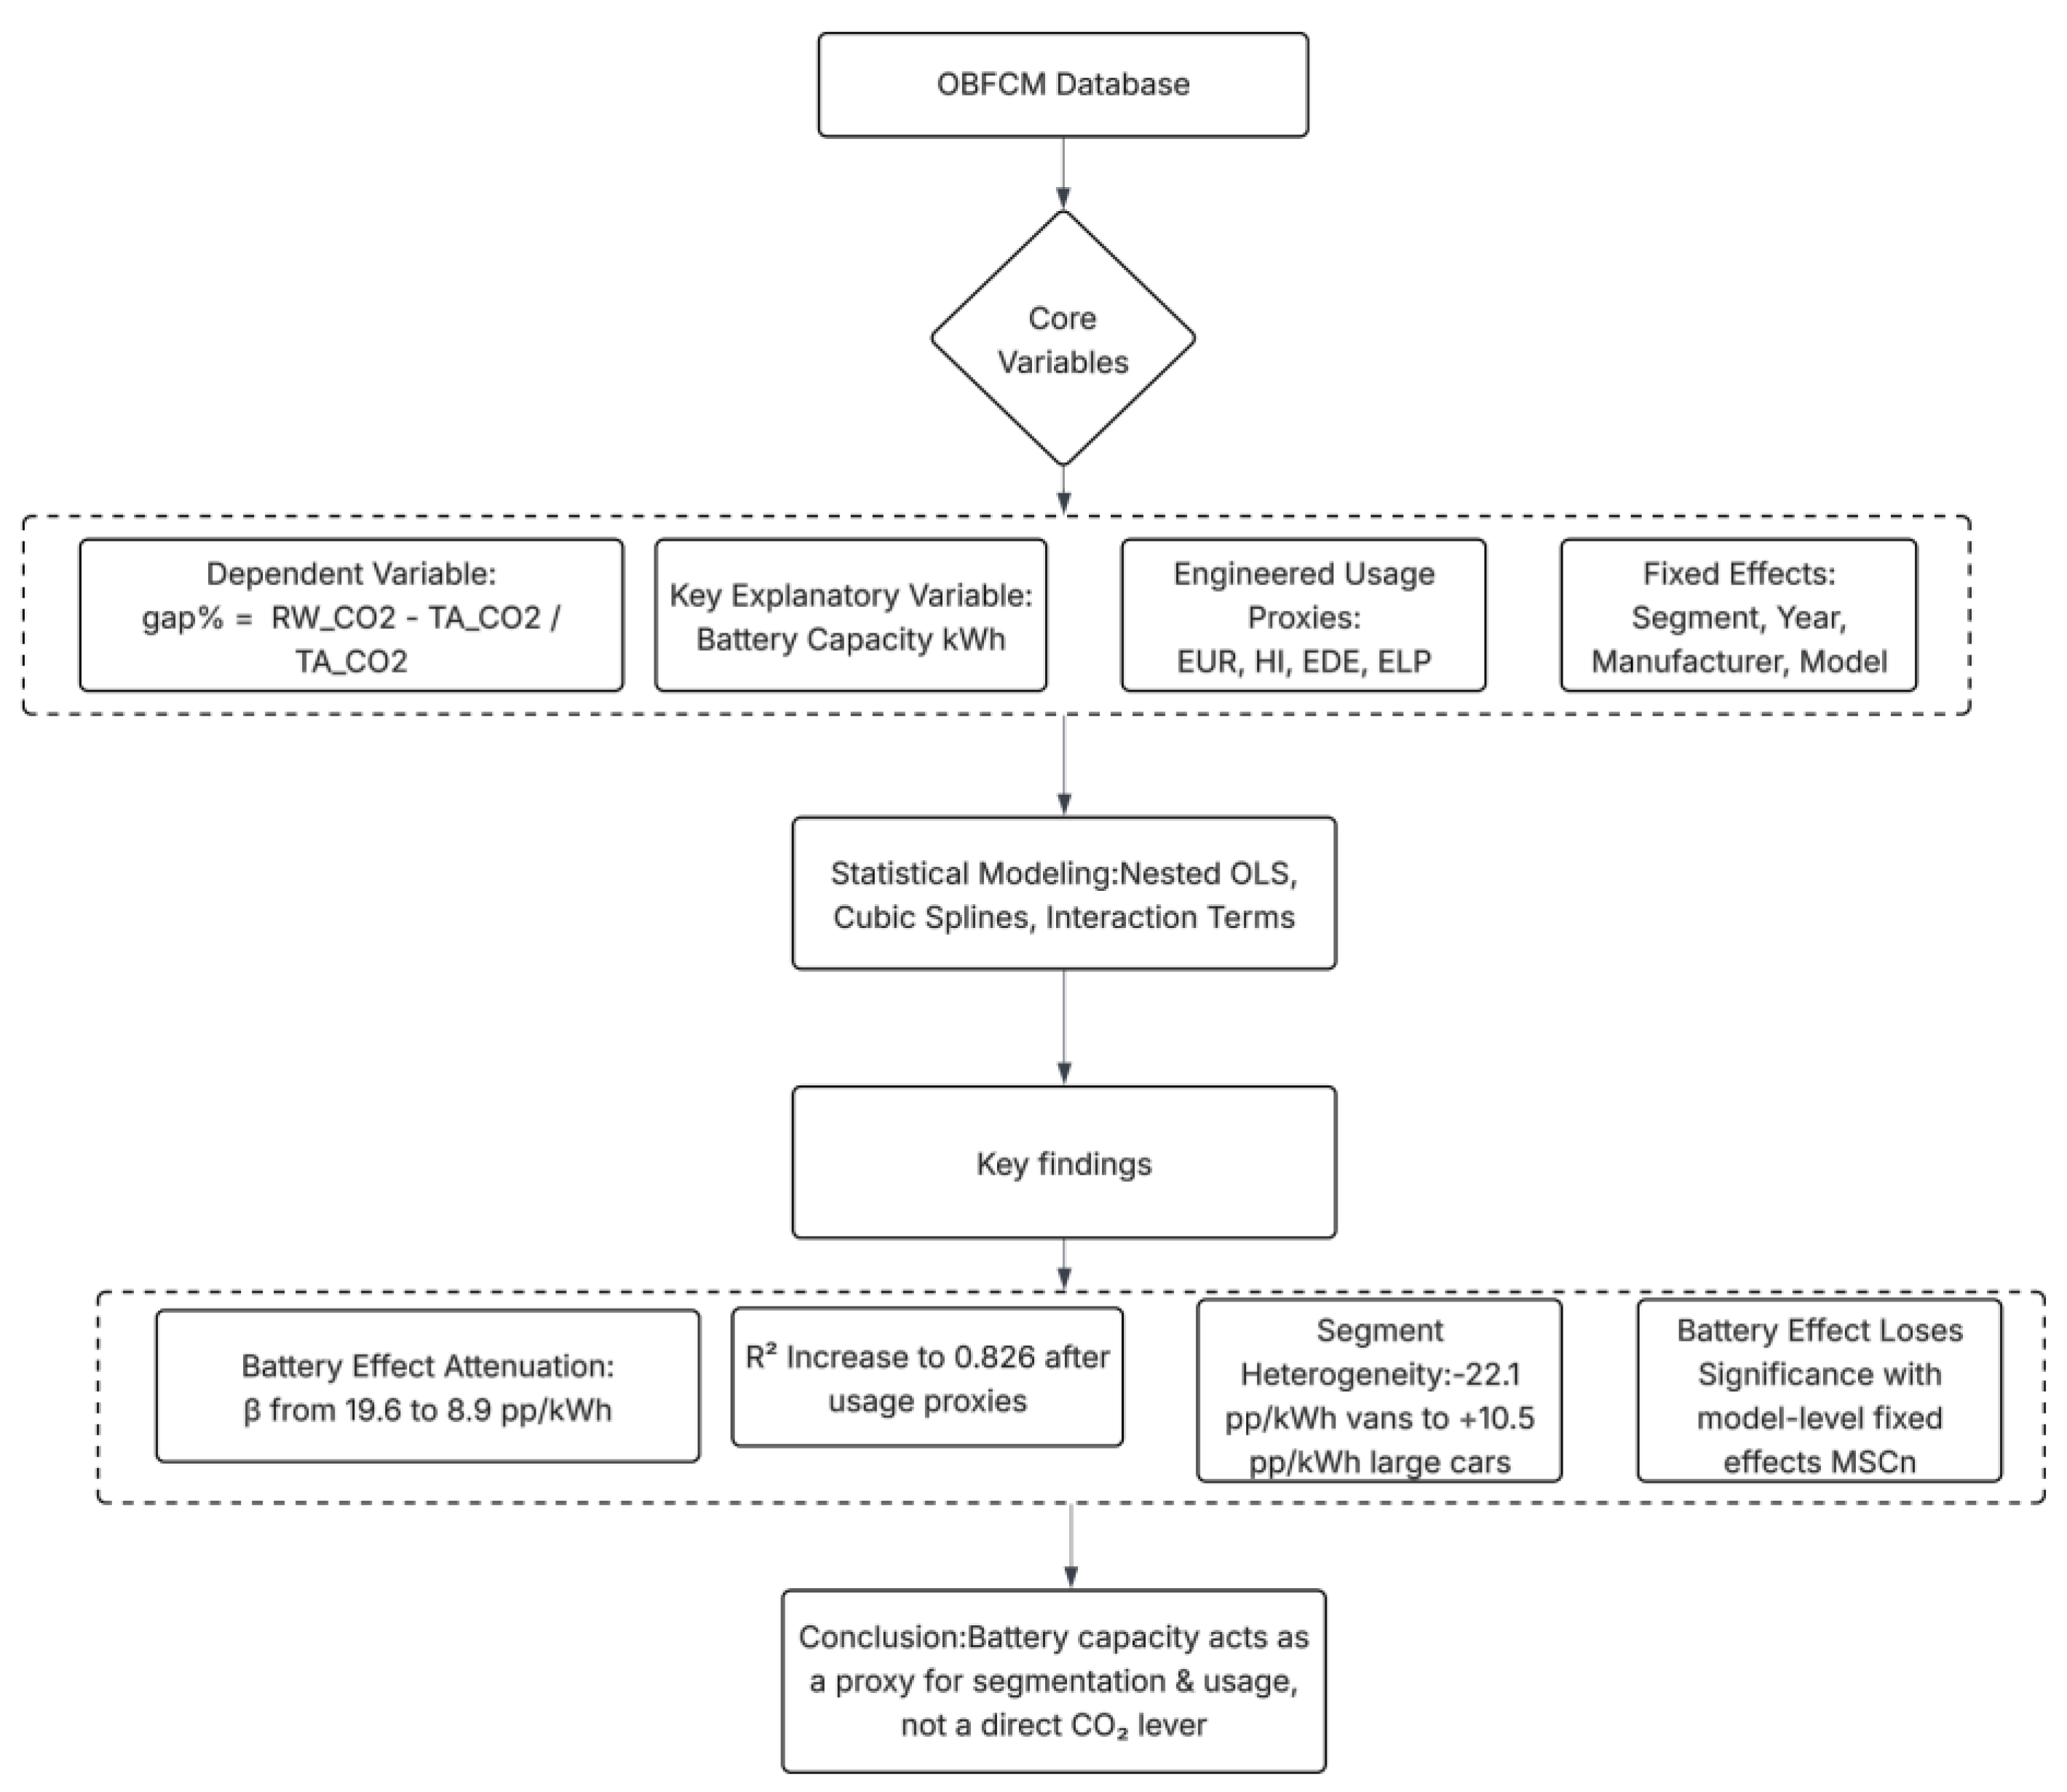
Figure 2.
Partial residuals (battery deciles).
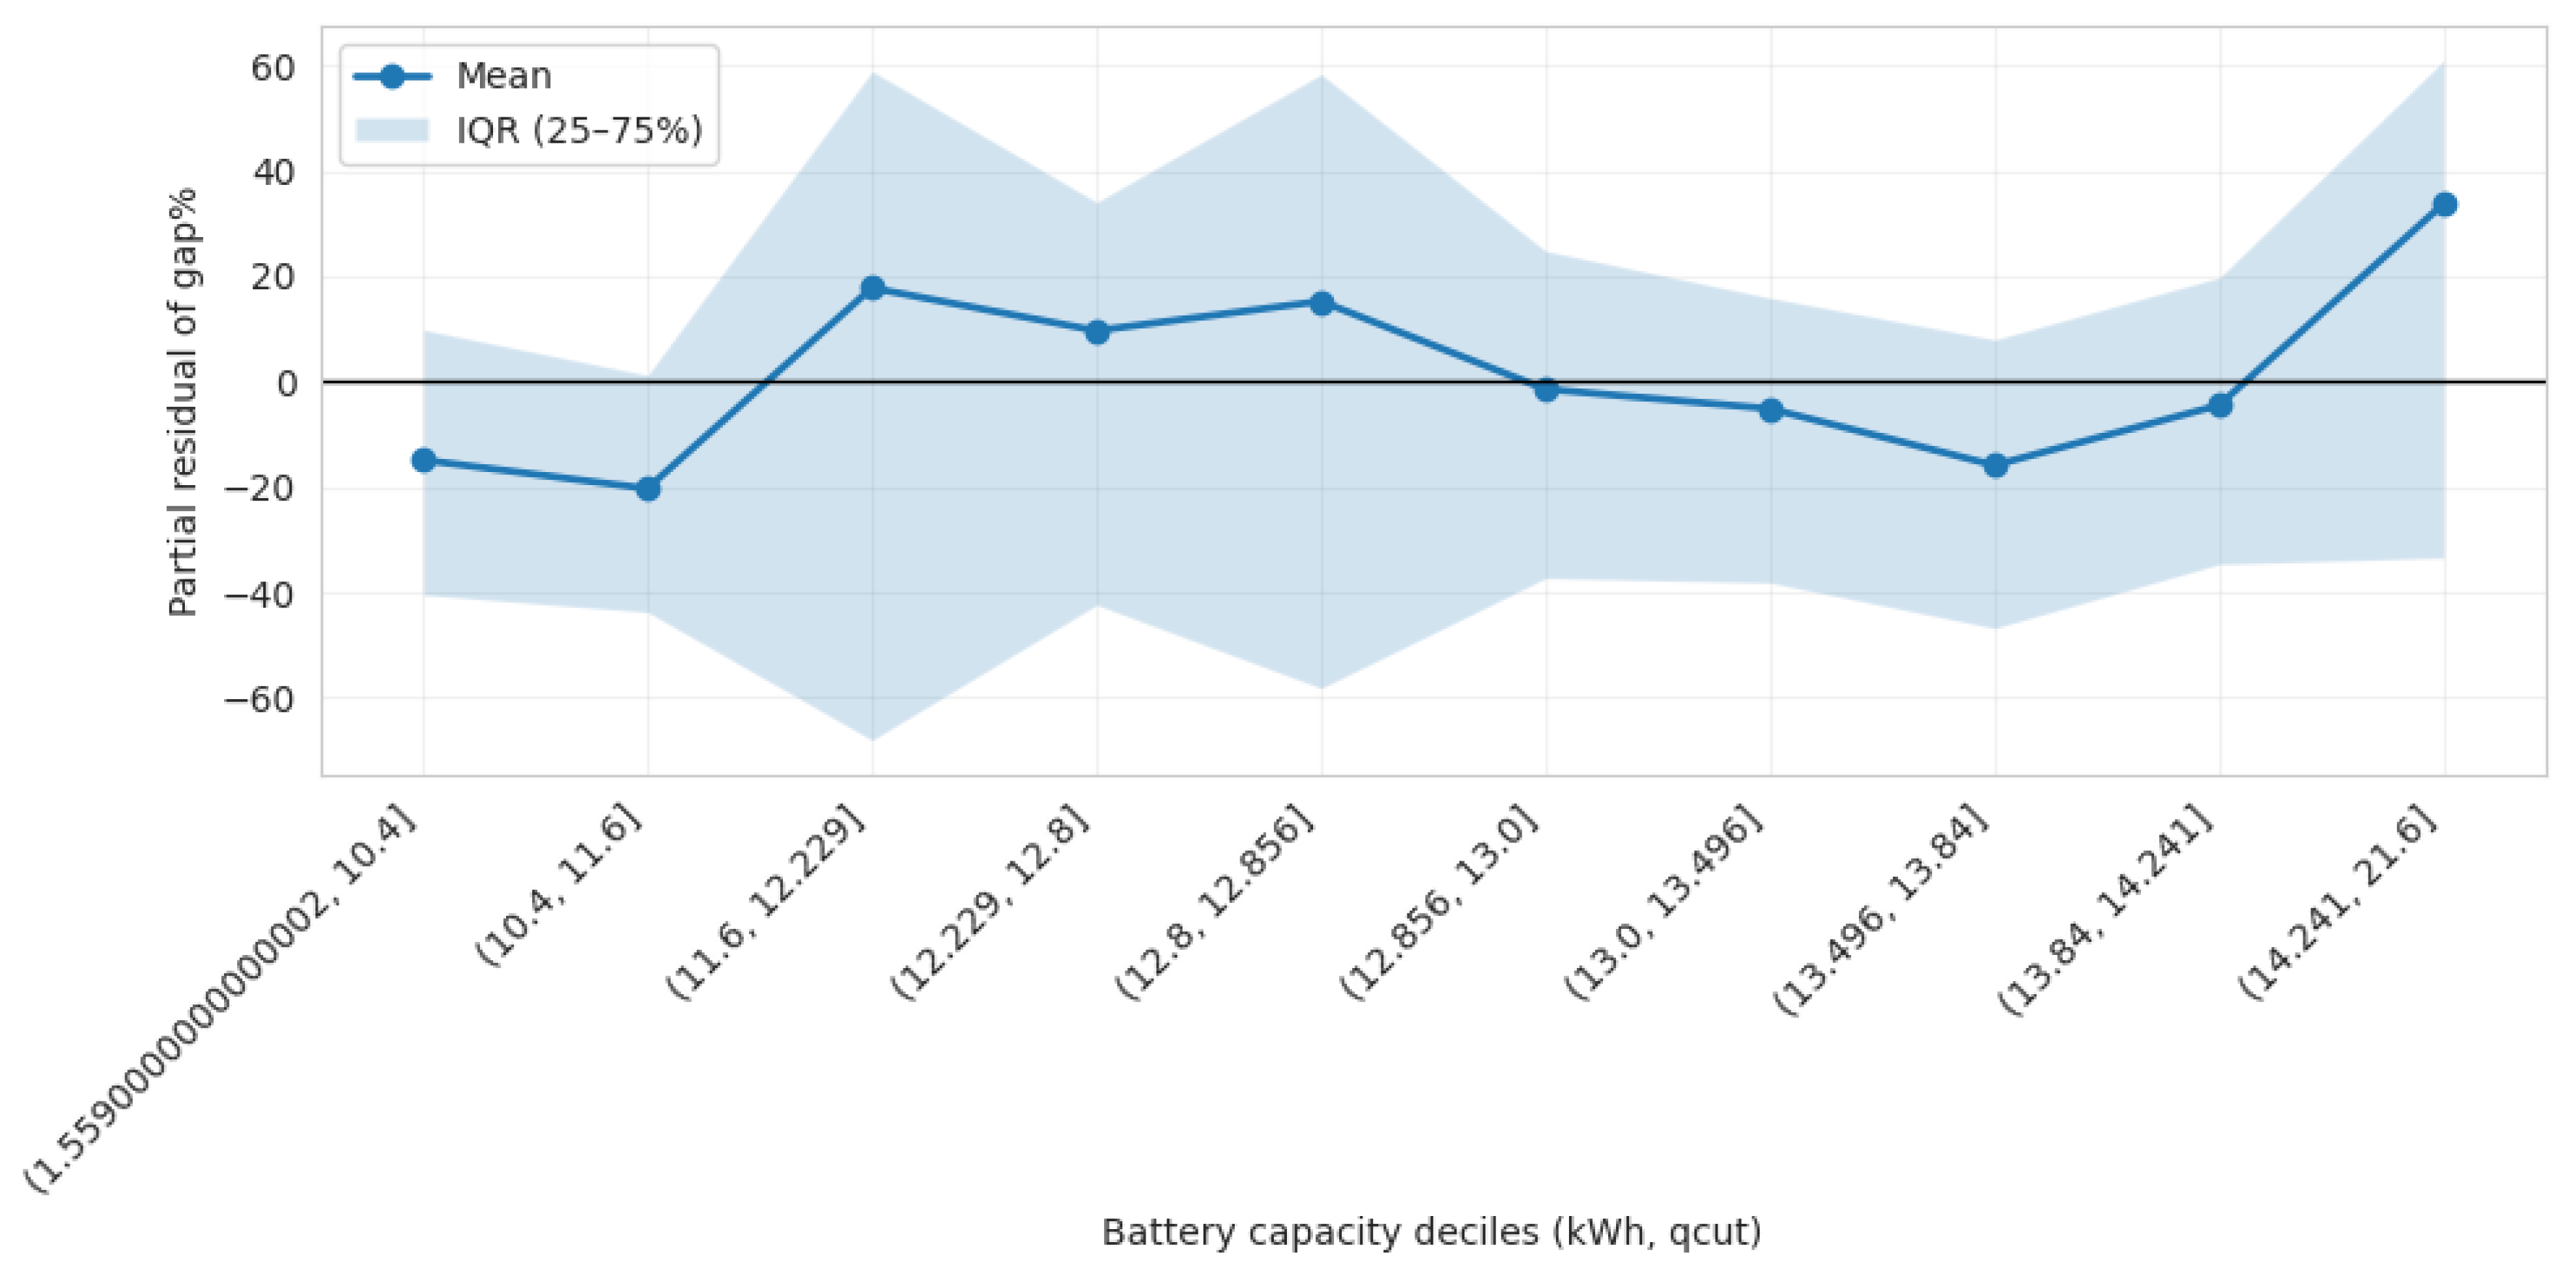
Figure 3.
Spline prediction curve (controls at medians).
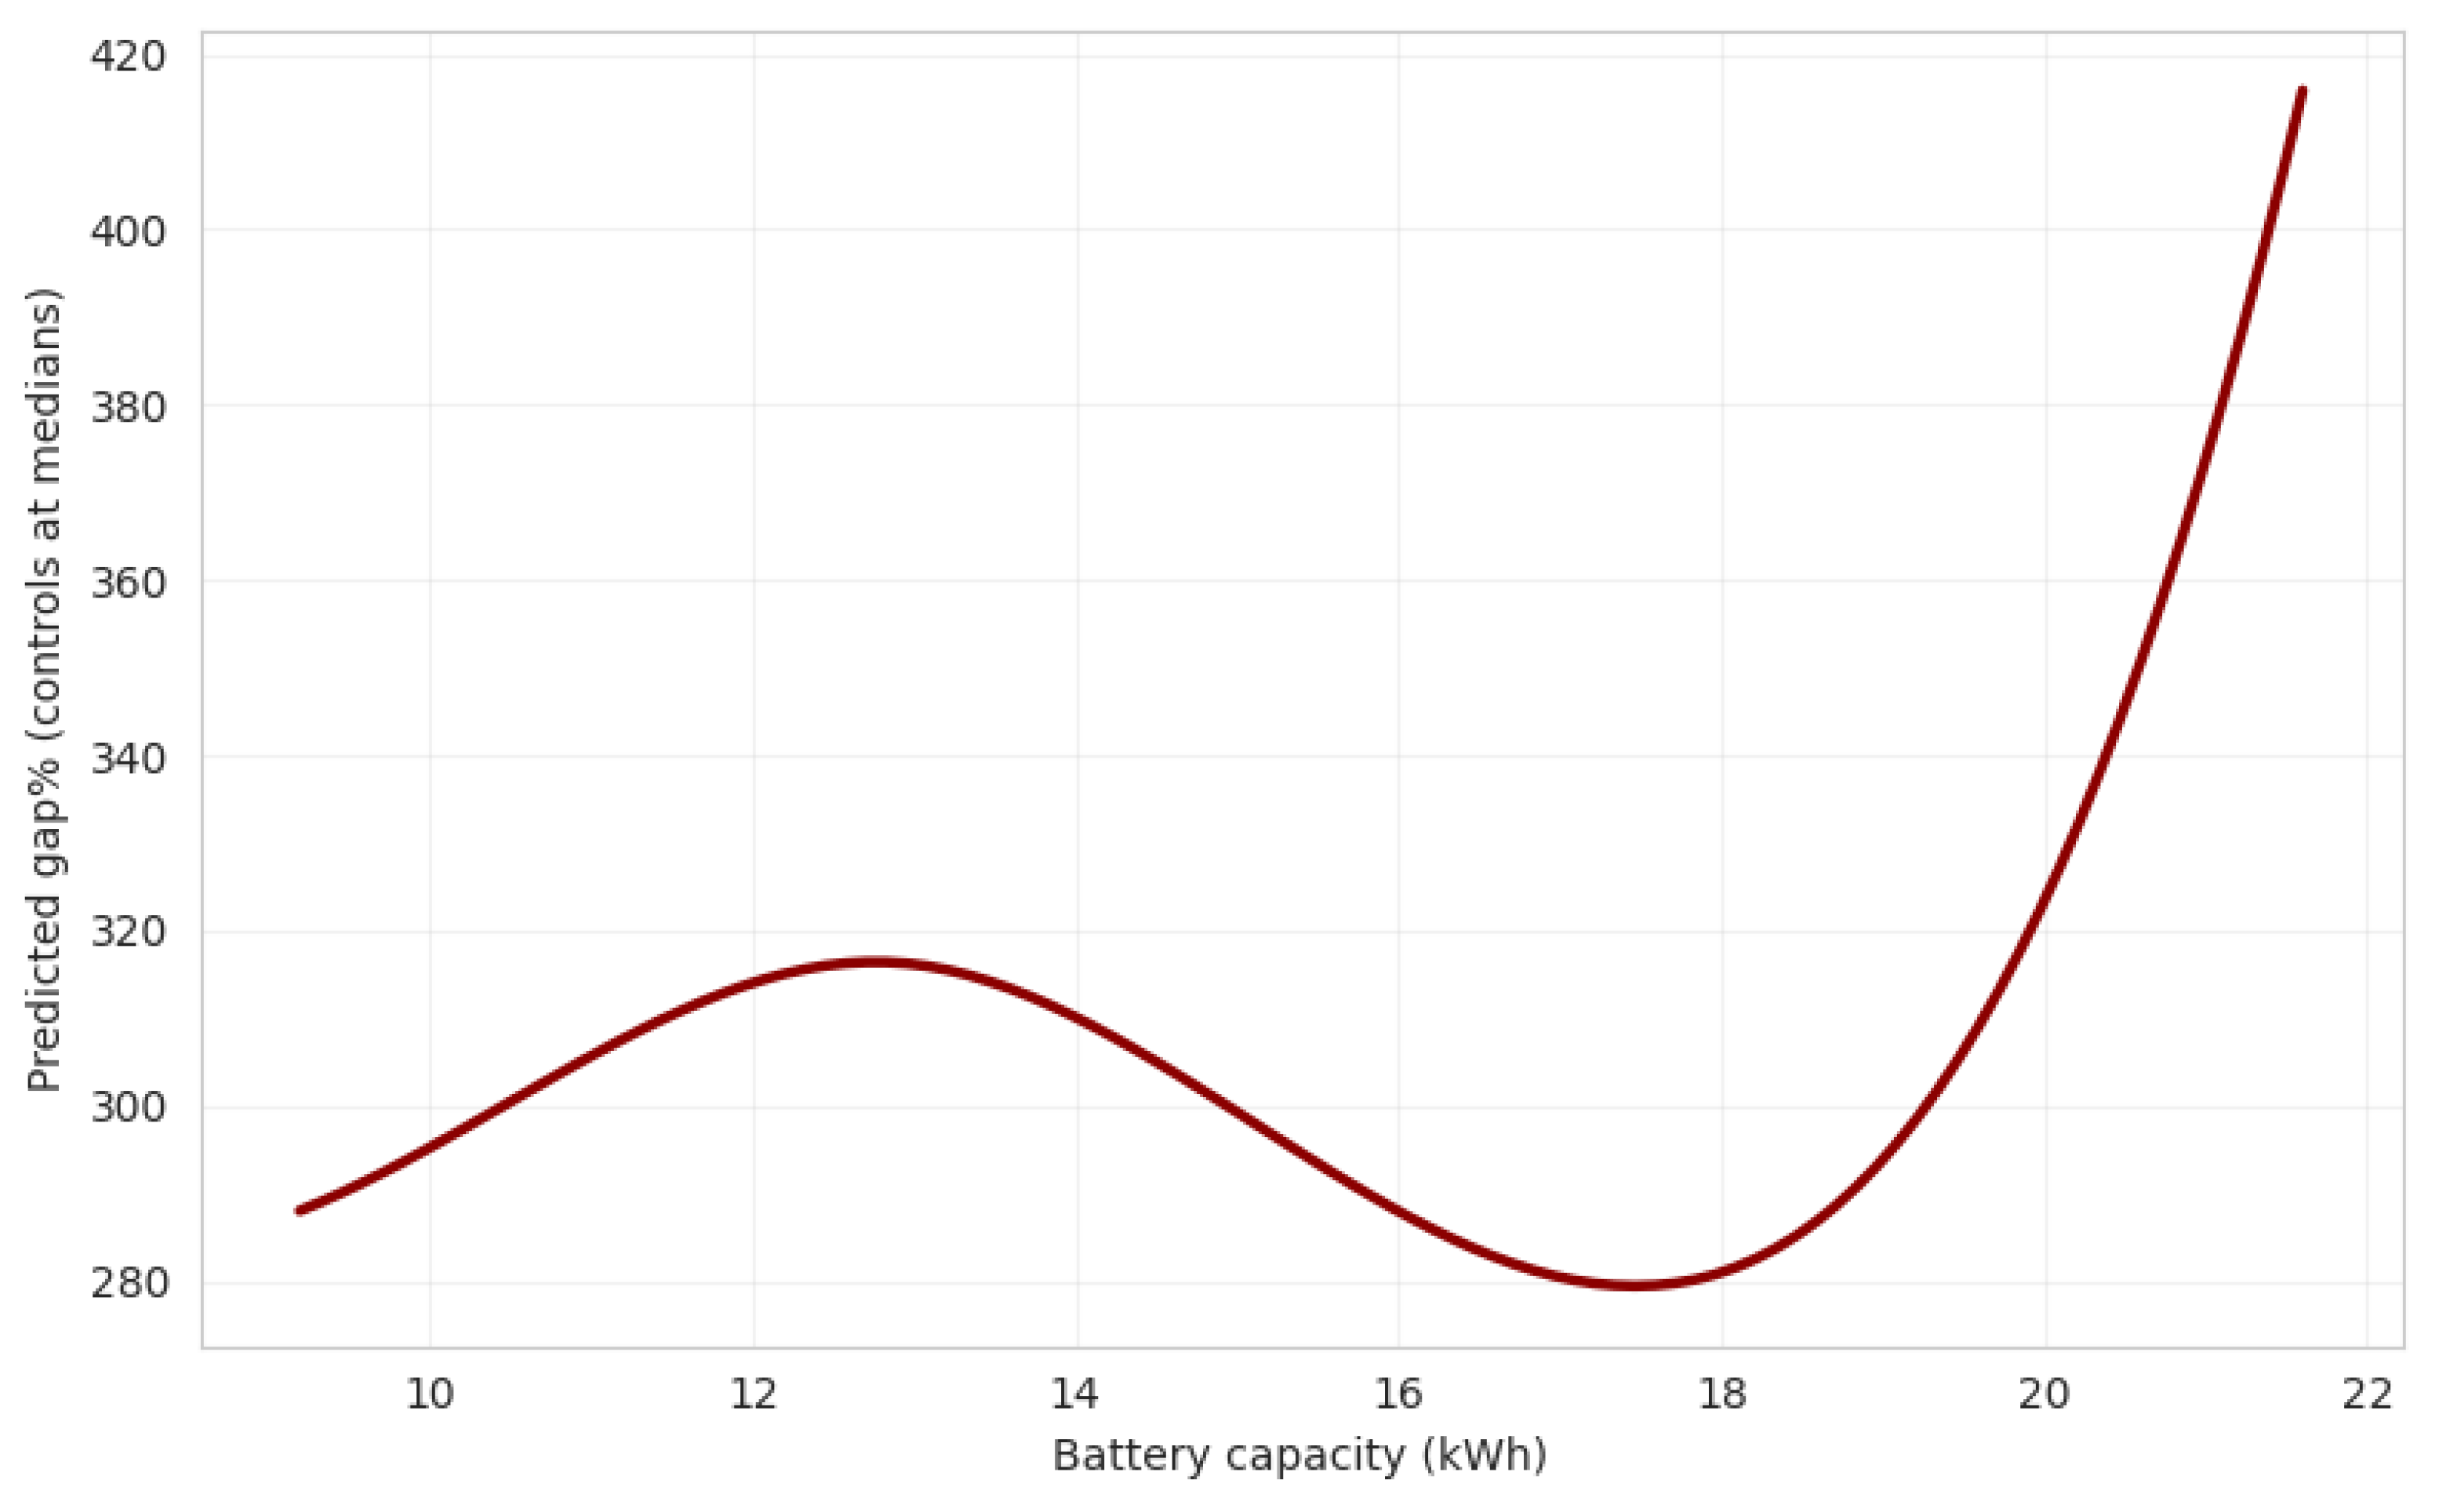
Figure 4.
EUR vs gap% scatter (colored by segment).
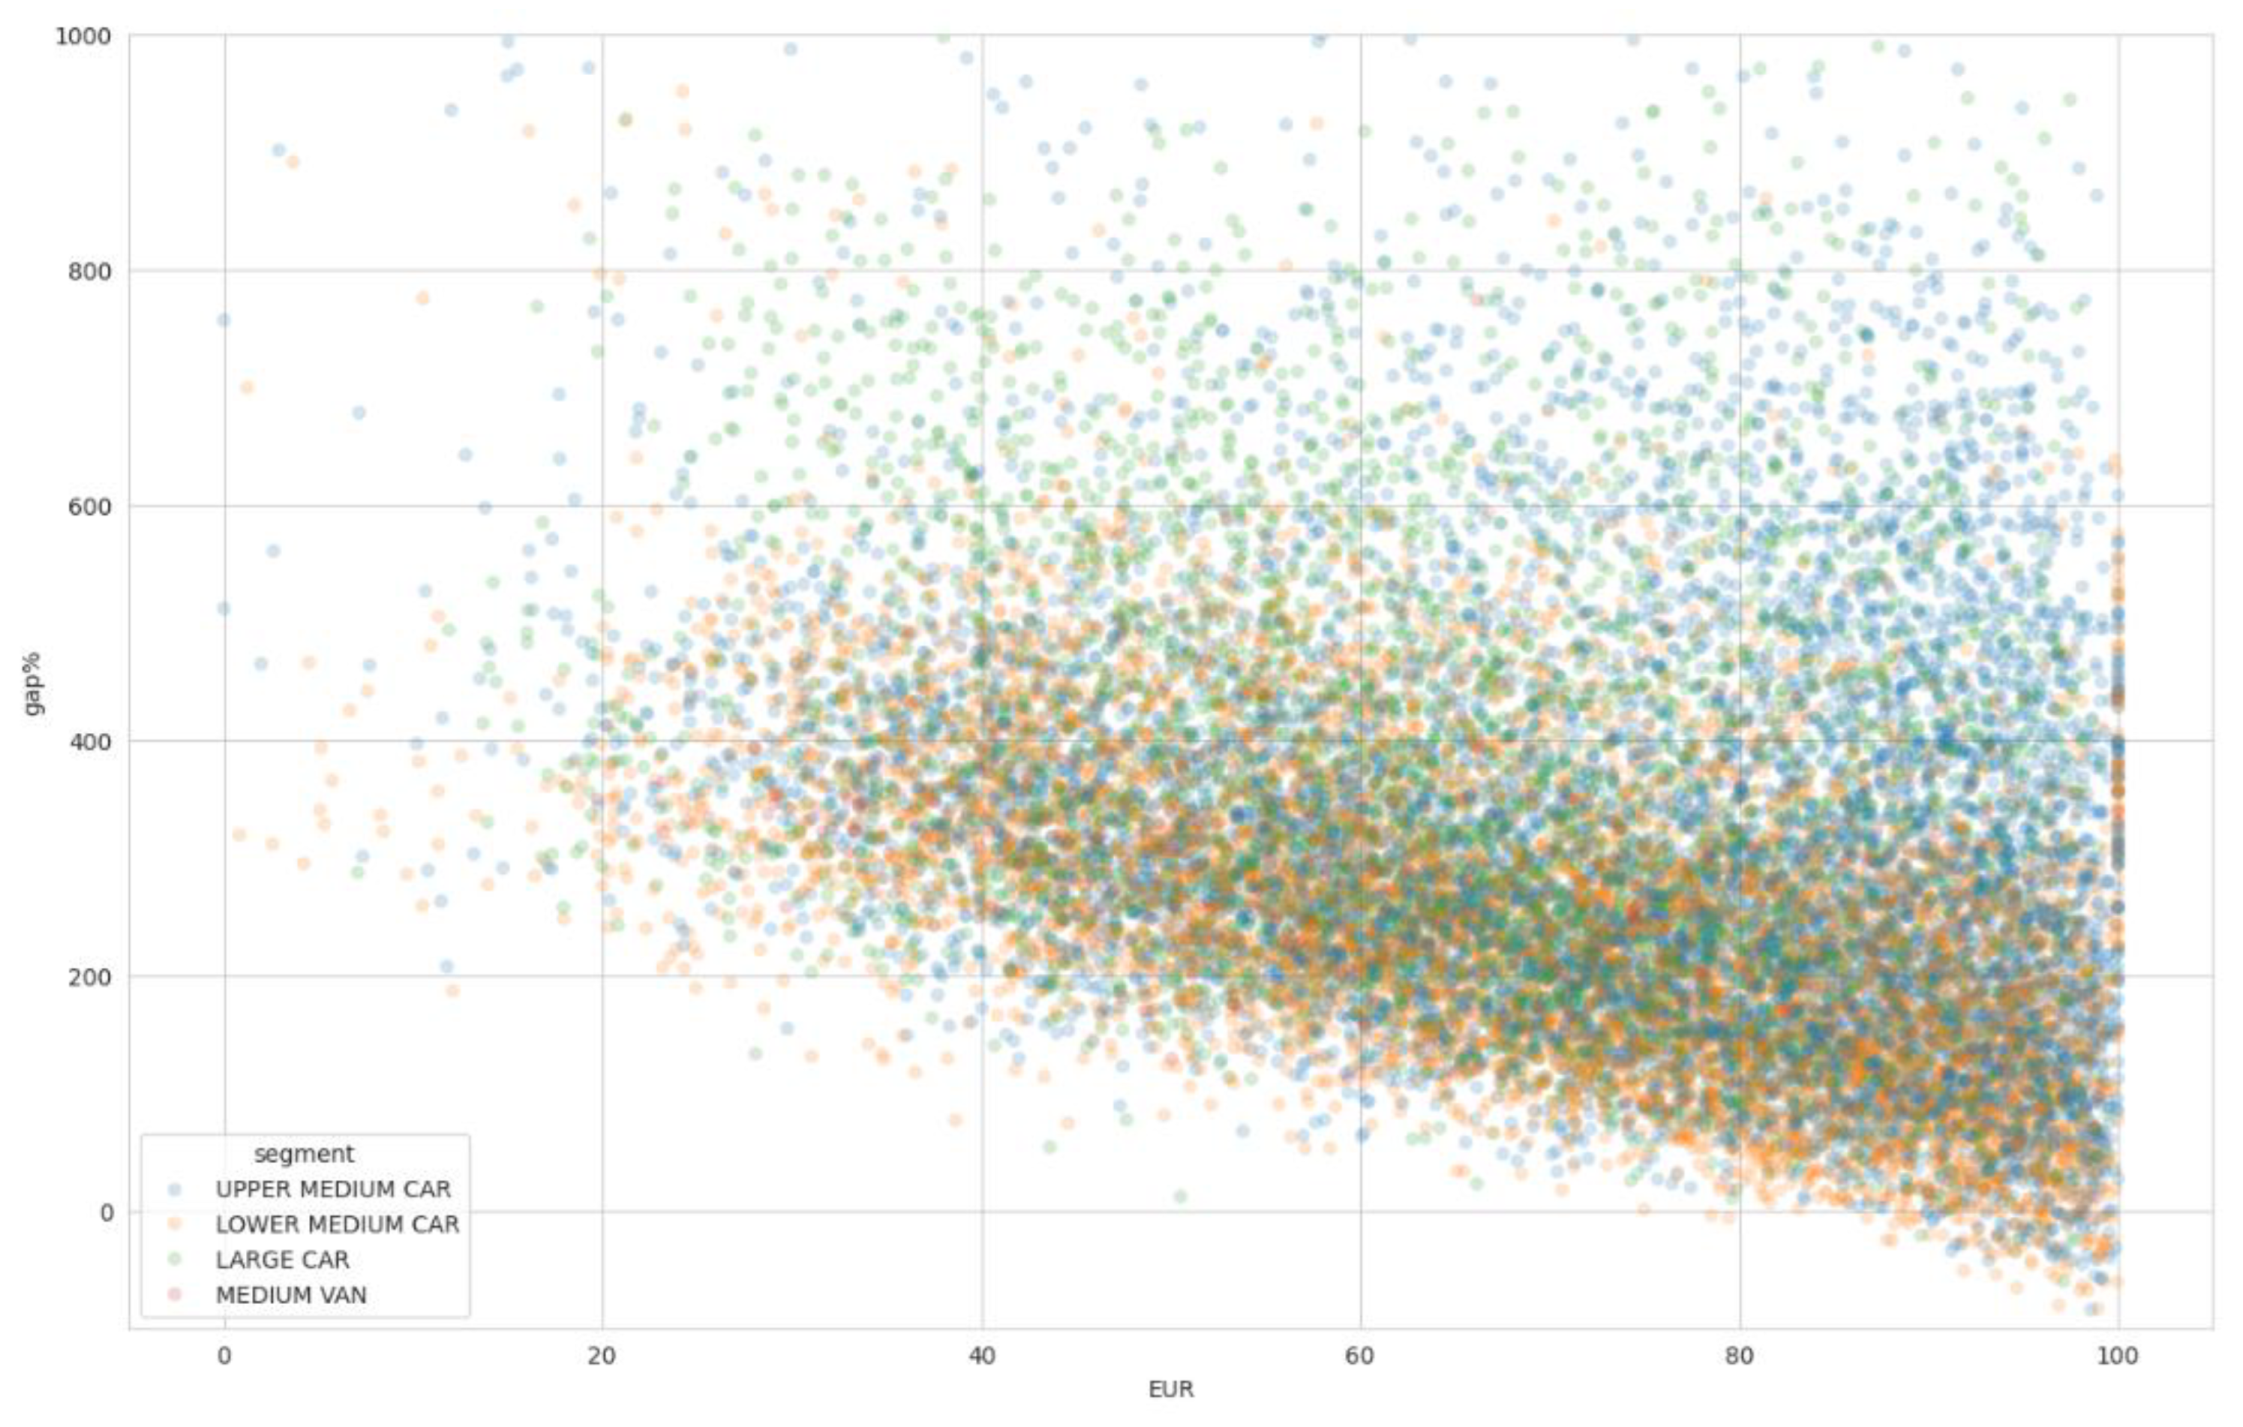
Figure 5.
Segment-specific marginal battery slopes (forest point plot).
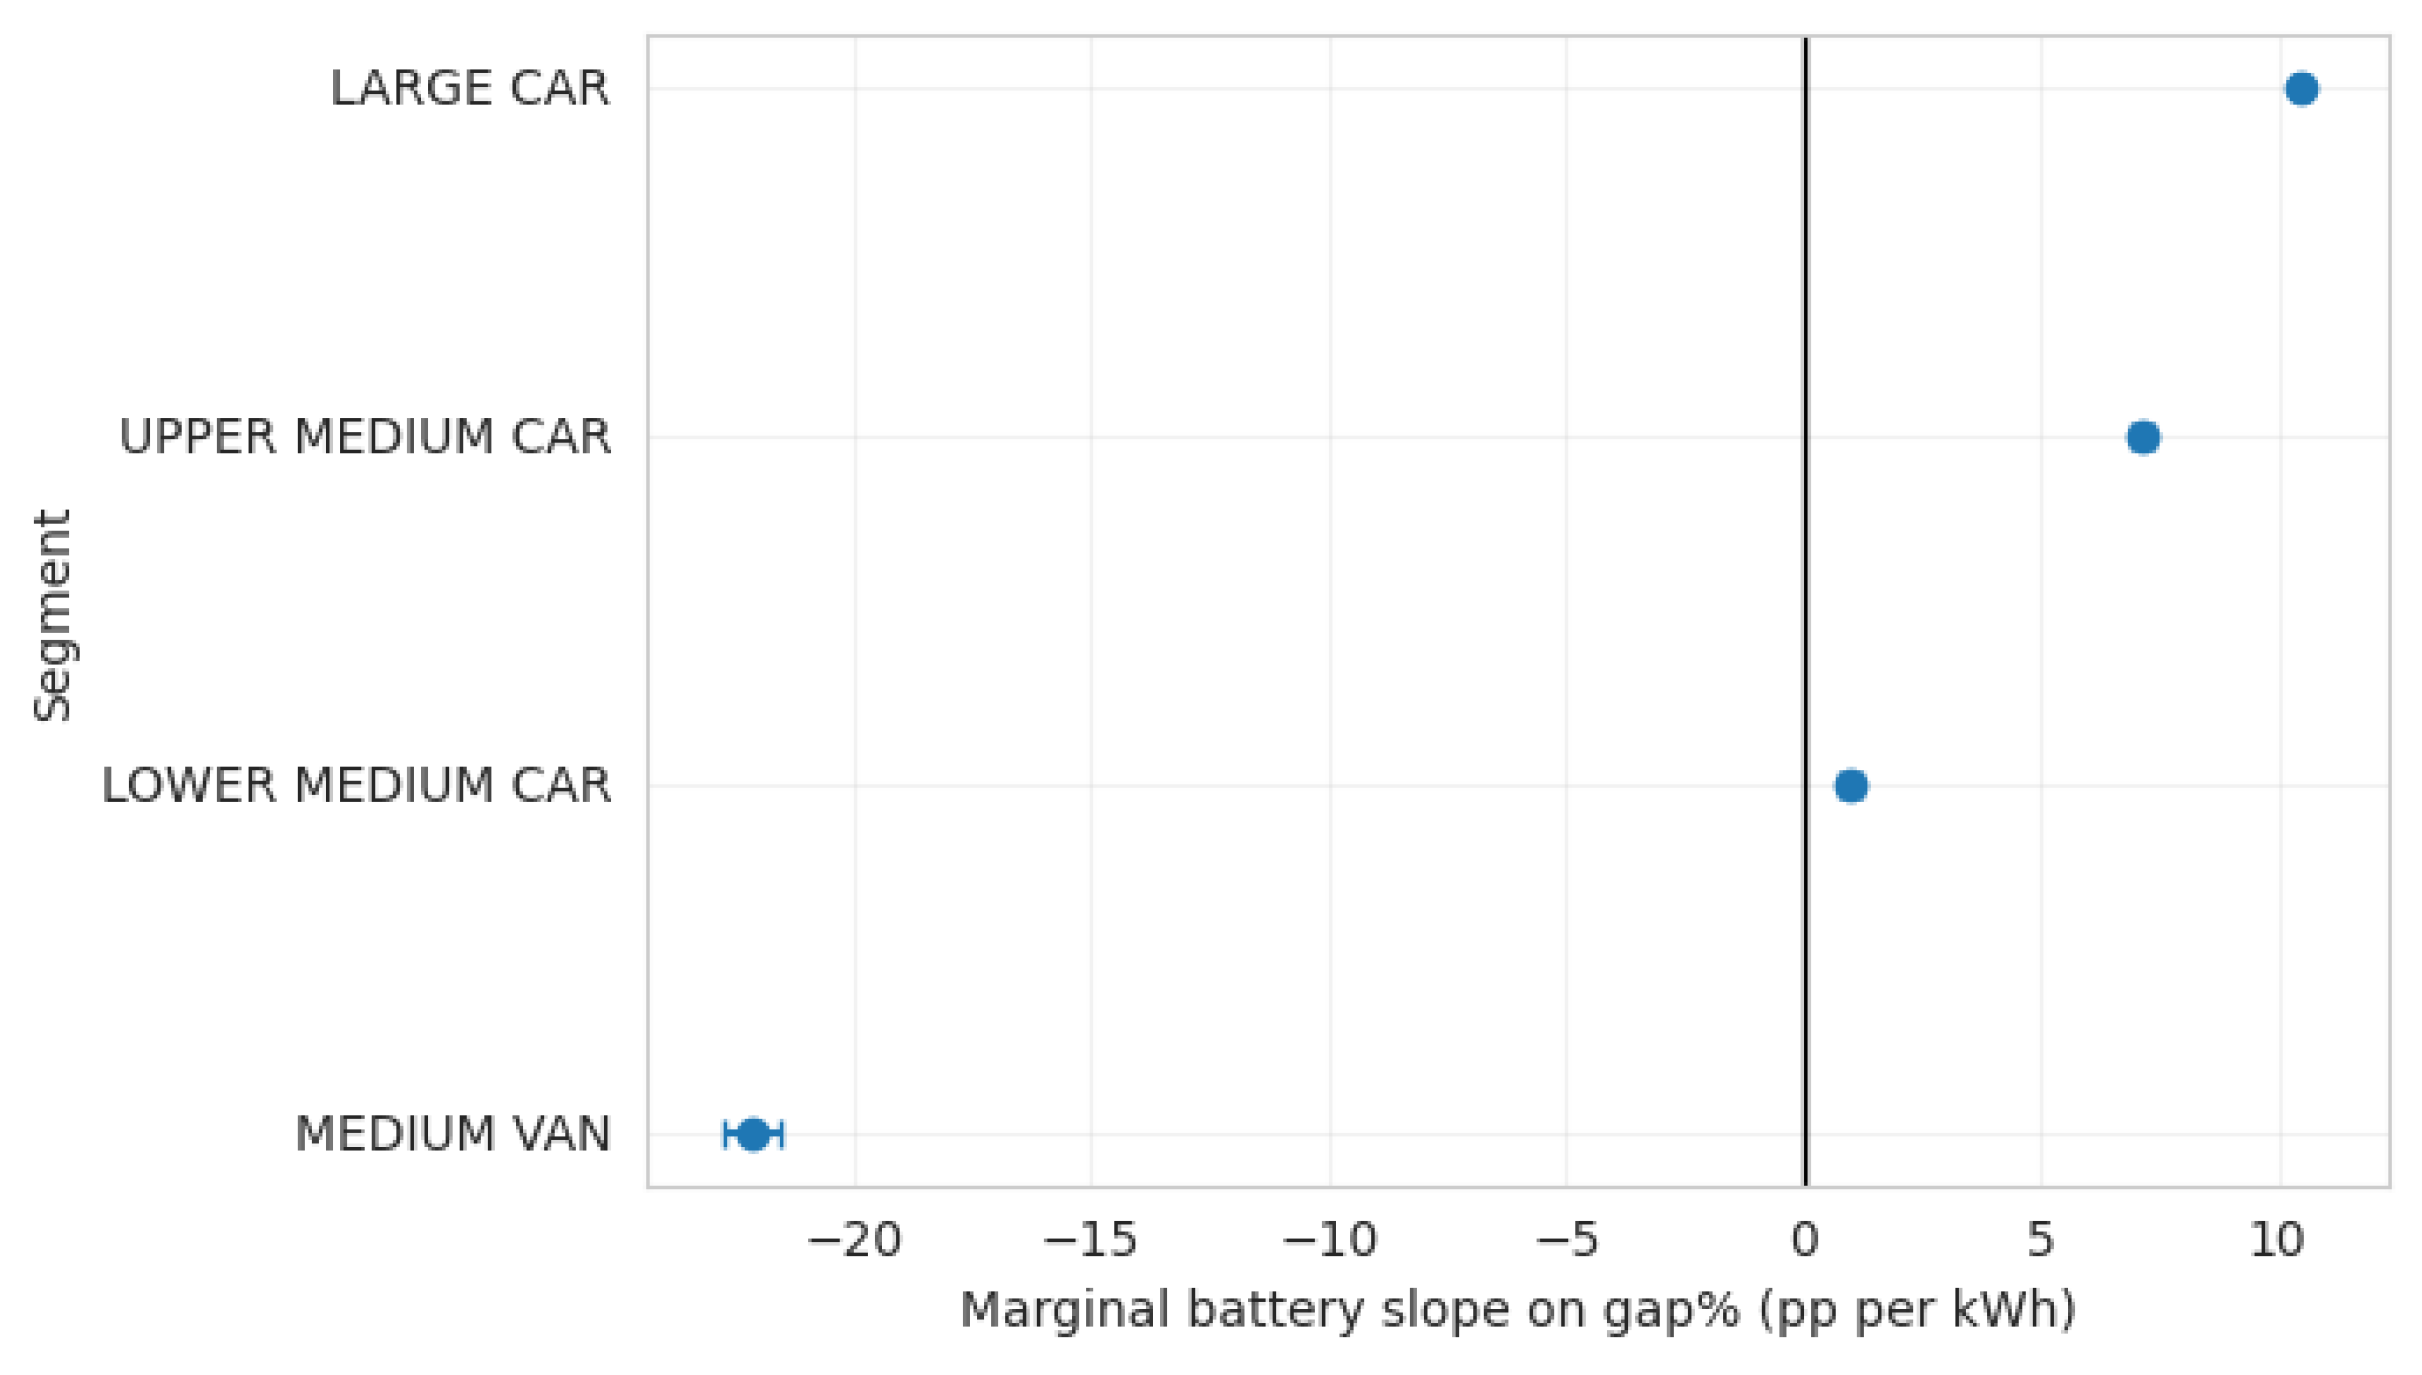

Table 1.
Descriptive statistics for PHEV analytical sample (N = 457,555).
| Variable | Mean | SD | Min | Q25 | Median | Q75 |
| Dependent Variable | ||||||
| gap% (test-to-reality CO₂ gap) | 300.1 | 170.6 | -96.6 | 179.8 | 273.8 | 391.5 |
| Key Explanatory Variable | ||||||
| Battery capacity (kWh) | 13.04 | 2.38 | 1.56 | 12.00 | 12.86 | 13.61 |
| Usage Proxies | ||||||
| EUR (electric utilization ratio, %) | 69.8 | 19.7 | 0.0 | 55.6 | 72.2 | 86.4 |
| HI (hybridization intensity, %) | 19.4 | 16.7 | 0.0 | 6.2 | 15.1 | 28.3 |
| EDE (energy-to-distance, kWh/km) | 0.070 | 0.056 | 0.0 | 0.022 | 0.063 | 0.107 |
| ELP (engine-load proxy, unitless) | 3.67 | 1.13 | 0.03 | 2.80 | 3.74 | 4.91 |
| Control Variables | ||||||
| RWCO₂ (g/km) | 108.3 | 58.4 | 0.0 | 64.3 | 99.7 | 143.0 |
Table 2.
Sample composition by segment, monitoring year, and manufacturer (N = 457,555).
| Category | N | % |
| Market Segment | ||
| Upper Medium Car | 190,910 | 41.7 |
| Lower Medium Car | 169,482 | 37.0 |
| Large Car | 91,093 | 19.9 |
| Medium Van | 6,070 | 1.3 |
| Monitoring Year | ||
| 2021 | 255,078 | 55.8 |
| 2022 | 160,434 | 35.1 |
| 2023 | 42,043 | 9.2 |
| Manufacturer (Top 10) | ||
| Volvo | 155,351 | 33.9 |
| BMW AG | 115,729 | 25.3 |
| SEAT | 40,070 | 8.8 |
| Volkswagen | 36,022 | 7.9 |
| Audi AG | 31,860 | 7.0 |
| Škoda | 19,430 | 4.2 |
| Mazda | 17,923 | 3.9 |
| Toyota | 15,603 | 3.4 |
| Fiat Group | 12,677 | 2.8 |
| Opel Automobile | 7,621 | 1.7 |
Table 3.
Nested fixed-effects models: battery capacity coefficient attenuation and R² progression.
| Model | N | R² | Battery (pp/kWh) | p-value |
| M0: Battery only | 457,555 | 0.075 | 19.63 | <0.001 |
| M1: + Segment + Year FE | 457,555 | 0.185 | 18.46 | <0.001 |
| M2: + Manufacturer FE | 457,555 | 0.203 | 17.45 | <0.001 |
| M3: + Usage proxies (EUR, HI, EDE, ELP) | 452,872 | 0.826 | 8.88 | <0.001 |
Table 4.
Mean and median gap% by electric-mode utilization ratio (EUR) deciles.
| EUR Decile (range, %) | N | Mean gap% | Median gap% |
| D1: 0.0 – 41.7 | 45,288 | 420.7 | 391.1 |
| D2: 41.7 – 51.6 | 45,287 | 372.3 | 342.6 |
| D3: 51.6 – 59.3 | 45,287 | 340.1 | 309.8 |
| D4: 59.3 – 66.1 | 45,287 | 312.6 | 280.7 |
| D5: 66.1 – 72.2 | 45,287 | 290.7 | 256.7 |
| D6: 72.2 – 78.1 | 45,287 | 274.5 | 235.9 |
| D7: 78.1 – 83.7 | 45,287 | 264.6 | 222.7 |
| D8: 83.7 – 89.0 | 45,287 | 256.0 | 213.3 |
| D9: 89.0 – 94.1 | 45,287 | 245.5 | 204.5 |
| D10: 94.1 – 100.0 | 45,288 | 223.1 | 190.6 |
Table 5.
Segment-specific marginal battery slopes on gap% (pp per kWh).
| Segment | Slope (pp/kWh) | SE | 95% CI Lower | 95% CI Upper |
| Medium Van | -22.15 | 0.30 | -22.73 | -21.56 |
| Lower Medium Car | 0.97 | 0.11 | 0.77 | 1.18 |
| Upper Medium Car | 7.13 | 0.10 | 6.93 | 7.34 |
| Large Car | 10.49 | 0.09 | 10.31 | 10.67 |
Disclaimer/Publisher’s Note: The statements, opinions and data contained in all publications are solely those of the individual author(s) and contributor(s) and not of MDPI and/or the editor(s). MDPI and/or the editor(s) disclaim responsibility for any injury to people or property resulting from any ideas, methods, instructions or products referred to in the content. |
© 2026 by the authors. Licensee MDPI, Basel, Switzerland. This article is an open access article distributed under the terms and conditions of the Creative Commons Attribution (CC BY) license (http://creativecommons.org/licenses/by/4.0/).
Copyright: This open access article is published under a Creative Commons CC BY 4.0 license, which permit the free download, distribution, and reuse, provided that the author and preprint are cited in any reuse.


