Submitted:
10 February 2026
Posted:
10 February 2026
You are already at the latest version
Abstract
Vehicle–infrastructure cooperative perception (VICP) overcomes the sensing limitations and field-of-view constraints of single-vehicle intelligence by integrating multi-source information from onboard and roadside sensors. However, in complex urban environments, system robustness—particularly regarding blind-spot coverage and feature representation—is severely compromised by occlusion (static and dynamic) and distance-induced point cloud sparsity. To address these challenges, this paper proposes a 3D object detection framework incorporating point cloud feature enhancement and spatial adaptive fusion. First, to mitigate feature degradation under sparse and occluded conditions, a Redefined-SENet (R-SENet) attention module is embedded into the feature encoding stage. This module employs a dual-dimensional squeeze-and-excitation mechanism—across pillars and intra-pillar points—to adaptively recalibrate key geometric features. Concurrently, a Feature Pyramid Backbone Network (FPB-Net) is constructed to enhance unified target modeling across varying distances via multi-scale extraction and cross-layer aggregation. Second, a Spatial Adaptive Feature Fusion (SAFF) module is introduced to resolve feature heterogeneity and spatial misalignment. By explicitly encoding feature origins and leveraging spatial attention, SAFF enables dynamic weighting and complementary fusion of fine-grained vehicle-side features and global roadside semantics. Experiments on the DAIR-V2X benchmark and a custom dataset demonstrate that the proposed method outperforms state-of-the-art approaches, achieving Average Precision (AP) scores of 0.762 and 0.694 at IoU 0.5, and 0.617 and 0.563 at IoU 0.7, respectively. Furthermore, the inference speed satisfies real-time requirements, validating the method’s effectiveness and potential for engineering deployment.
Keywords:
autonomous driving
; vehicle-infrastructure cooperative perception
; point cloud
; feature fusion
1. Introduction
Accurate environmental perception is a fundamental prerequisite for the development of autonomous driving technologies [1]. Currently, autonomous vehicles primarily depend on onboard sensors—such as cameras, LiDAR, and millimeter-wave radar—to acquire detailed three-dimensional information about their surroundings. However, as the demands for perception range and accuracy continue to grow, the limitations of the traditional single-vehicle perception paradigm have become increasingly apparent [2]. Restricted by sensor installation height and physical line-of-sight, single-vehicle sensing still struggles with long-distance detection, severe occlusions, and unavoidable perception blind spots [3,4]. These challenges are particularly pronounced in bus operation scenarios, where vehicles operate on fixed routes, make frequent stops, and interact with a high density of traffic participants. Under such conditions, perception deficiencies can significantly impair autonomous decision-making processes and compromise driving safety.
In response to the inherent limitations of single-vehicle perception, collaborative vehicle–infrastructure perception has recently attracted increasing attention as a promising paradigm for enhancing autonomous driving systems. By enabling information sharing between vehicle-mounted sensors and roadside sensing units, such cooperative perception frameworks can substantially extend sensing coverage and improve environmental awareness, thereby mitigating occlusions and perception blind spots that are difficult to address using onboard sensors alone [5]. Despite its significant potential, vehicle–infrastructure collaborative perception remains far from mature, particularly in complex urban environments. In scenarios characterized by frequent static occlusions, dynamic traffic interactions, and long-range perception demands, point cloud data collected from heterogeneous sensors often become extremely sparse and uneven, leading to severe degradation of discriminative features. However, most existing cooperative perception methods are developed under idealized sensing assumptions and primarily emphasize cross-source feature interaction, while paying limited attention to the effective extraction and enhancement of sparse and degraded point cloud representations under adverse conditions. As a result, the robustness and generalization capability of current systems remain limited in real-world urban scenarios [6]. The performance of cooperative perception systems largely depends on effective cross-source feature fusion; however, vehicle-mounted and roadside sensors differ substantially in viewing angle, scanning range, resolution, and operating environment, leading to inconsistent feature distributions and pronounced domain discrepancies. This heterogeneity complicates direct fusion and may introduce semantic conflicts that hinder perception improvement. Prior studies have sought to address fusion challenges—F-Cooper [7] employs max-selection to highlight salient features, Yu et al. [8] utilize feature concatenation across sources, and Ren et al. [9] introduce feature-weighting schemes. Nevertheless, these approaches typically operate at a single scale or fixed resolution, which limits their ability to jointly capture fine-grained spatial details and global semantic context. Furthermore, most existing methods lack explicit modeling of cross-domain discrepancies; naive concatenation or linear fusion tends to increase redundant feature channels and computational burden, while also introducing biased cross-source interference that degrades detection accuracy. Although PillarGrid [10] improves computational efficiency through max-pooling-based aggregation, it inevitably discards informative signals, resulting in compromised feature completeness and representation fidelity. Consequently, how to effectively alleviate feature sparsity and degradation, while robustly integrating heterogeneous vehicle–infrastructure information and capturing complementary multi-scale semantic representations, remains a critical and open research challenge for vehicle–infrastructure collaborative perception.
To address the challenges of complex traffic environments and local occlusions in vehicle–infrastructure cooperative perception, this paper proposes a novel 3D detection framework for collaborative scenarios, which jointly incorporates point cloud feature enhancement and spatially adaptive cross-source feature fusion to improve perception robustness and detection accuracy.
The main contributions of this work are summarized as follows:
- We present a point-cloud-enhanced feature modeling approach tailored for vehicle–infrastructure cooperative perception. By integrating a dual-dimension squeeze-and-excitation mechanism with a multi-scale feature pyramid, the proposed method improves the representation capability of sparse point clouds, long-range objects, and heavily occluded regions.
- We design a spatially adaptive feature fusion module that explicitly encodes feature sources and generates fusion weights using both max pooling and average pooling. This design enables dynamic and balanced weighting between vehicle-side local features and infrastructure-side global semantics, effectively mitigating fusion bias induced by field-of-view discrepancies.
- Extensive experiments are conducted on the DAIR-V2X dataset and an additional in-house dataset. The results demonstrate that, compared with mainstream cooperative perception approaches, the proposed method achieves a significant improvement in overall 3D detection accuracy and exhibits notably enhanced robustness for long-range targets, occluded regions, and scenarios with incomplete information.
The rest of this paper is arranged as follows: Section 2, we present a comprehensive analysis of the fusion strategy for cooperative perception. Section 3 portrays information on the proposed vehicle–infrastructure cooperative perception network. The experimental results are presented in Section 4. Section 5 contains the conclusion and alludes to future work.
2. Related Work
2.1. LiDAR-Based 3D Object Detection
LiDAR-based 3D object detection constitutes a core component in autonomous driving perception systems, aiming to accurately predicting three-dimensional bounding boxes from point cloud data, including object location, geometric dimensions, orientation, and semantic category [11]. Nevertheless, LiDAR point clouds are inherently unstructured and spatially non-uniform, and their density decreases rapidly with increasing sensing distance. These characteristics pose substantial challenges for efficient point cloud representation and the extraction of discriminative features. Based on different point cloud representation paradigms, existing approaches can be broadly classified into point-based detectors and voxel- (or pillar-) based detectors, each involving distinct trade-offs between feature representation capability and computational efficiency.
Point cloud–based methods operate directly on raw point, thereby preserving geometric structures to the greatest extent. PointNet [12] first introduced an end-to-end framework for point cloud processing, laying the foundation for deep learning–based point cloud analysis. Building upon this paradigm, PointNet++ [13] incorporated hierarchical sampling and multi-scale feature extraction to better capture local geometric relationships. Further extending these ideas, two-stage detectors such as PointRCNN [14] and PV-RCNN [15] integrate fine-grained point-level features with voxel-level contextual information, enabling more accurate 3D object localization. In parallel, one-stage approaches, including 3DSSD [16] streamline the detection pipeline to improve inference efficiency, while Transformer-based models [17,18] introduce global attention mechanisms to enhance contextual reasoning in complex scenes. Despite their strong representational capability, point-based methods typically incur high computational costs, which pose significant challenges for real-time deployment. In contrast, voxel-based detection methods discretize point clouds into regular three-dimensional grids, converting unstructured data into structured representations that facilitate efficient feature extraction and object detection. VoxelNet [19] pioneered this direction by introducing a voxel feature encoder within an end-to-end learning framework; however, it suffered from substantial computational overhead. To address this limitation, SECOND [20] employed sparse convolution to significantly improve efficiency, establishing a widely adopted voxel-based detection paradigm. More recently, anchor-free detectors such as CenterPoint [21] have further enhanced localization accuracy and rotational robustness by predicting object centers instead of relying on predefined anchors. To better balance detection accuracy and real-time performance, PointPillars [22] collapses point clouds along the vertical axis into pillar representations and projects them into bird’s-eye-view feature maps, enabling lightweight 2D convolutional networks to process LiDAR data efficiently. Owing to its fast inference speed, low memory footprint, and strong engineering practicality, PointPillars and its variants have been widely adopted in real-world autonomous driving perception systems.
2.2. V2X Collaborative Perception
According to the stage at which information is fused, existing vehicle–infrastructure cooperative perception methods can be broadly classified into early fusion, intermediate fusion, and late fusion schemes [23,24]. Early fusion directly aggregates raw sensor data, such as point clouds, from multiple agents, thereby substantially expanding the sensing range and improving detection accuracy. Chen et al. [25] proposed the first LiDAR-based early collaborative perception framework by merging raw point clouds captured from different viewpoints, while Arnold et al. [26] further demonstrated that fusing multi-source single-modality sensor data can effectively alleviate field-of-view limitations and sensing deficiencies of individual agents. Nevertheless, early fusion requires the transmission of large volumes of raw data, leading to excessive communication overhead and a high risk of network congestion, which severely constrains its applicability in real-world deployments. In contrast, late fusion integrates perception results at the decision level by combining independently generated detection outputs from vehicles and roadside units. Mo et al. [27] developed an enhanced Kalman filter–based fusion strategy that maintains stable localization and perception performance even under temporary roadside sensing failures. Yu et al. [28] introduced a time-compensated delay fusion (TCLF) scheme that transmits only detection results, thereby significantly reducing communication costs. Despite its superior communication efficiency, late fusion heavily relies on local detection quality, which may result in the loss of fine-grained information and amplify noise propagation during fusion, potentially leading to missed or false detections.
To balance perception accuracy with communication efficiency and inference latency, intermediate fusion has emerged as a dominant paradigm in collaborative perception research [29]. As feature-level fusion strategies, intermediate fusion methods exchange intermediate representations between vehicles and infrastructure units, preserving critical semantic information while substantially reducing bandwidth requirements. F-Cooper [7] introduced an early intermediate fusion framework based on voxel feature encoding and maxout aggregation, achieving real-time performance with reduced computation and communication demands. V2VNet [30] employed a spatially aware graph neural network to enable iterative feature interaction, improving collaboration effectiveness but remaining sensitive to communication delays. OPV2V [31] established a comprehensive benchmark and leveraged graph attention mechanisms to enhance multi-agent feature fusion. V2X-ViT [32] adopted Transformer-based heterogeneous attention for both V2V and V2I interactions, incorporating delay-aware positional encoding to mitigate temporal misalignment. Where2comm [33] selectively transmitted salient spatial regions using confidence maps, thereby reducing bandwidth consumption through sparse feature sharing. FETR [34] utilized Transformer-based future feature prediction to compensate for temporal asynchrony and introduced mask-based enhancement for target-relevant regions. TOCOM-V2I [35] deployed task-aware feature transmission combined with multi-stage compression to support efficient sensing under limited communication capacity. TransIFF [36] proposed an instance-level feature fusion framework that mitigates instability induced by bandwidth constraints and domain disparities. V2X-DGPE [37] further incorporated knowledge distillation and deformable attention to align cross-agent features and correct pose inconsistencies, substantially improving robustness.
Despite the favorable trade-off offered by intermediate fusion schemes, their performance still degrades under severe occlusion and highly sparse LiDAR conditions, where vehicle-side feature extraction remains insufficient, ultimately limiting the achievable gains from collaborative perception.
3. Method
To overcome blind-spot perception and insufficient feature representation in complex traffic environments, this work proposes a multi-source point cloud cooperative perception framework for vehicle–infrastructure systems, as illustrated in Figure 1. During point cloud preprocessing, a timestamp-based synchronization mechanism is employed to temporally align LiDAR data collected from vehicle-mounted and roadside sensors. Subsequently, a global coordinate transformation maps all point clouds into a unified reference frame, eliminating spatial inconsistencies caused by heterogeneous sensor configurations and providing a consistent basis for cross-source feature fusion.In the feature encoding stage, an R-SENet attention module is integrated into the PointPillars backbone to jointly model pillar-level and intra-pillar feature dependencies, thereby adaptively enhancing fine-grained geometric representations in sparse, long-range, and occluded regions. Building upon this enhanced representation, a multi-scale feature pyramid backbone (FPB-Net) is adopted to extract and fuse hierarchical features across different spatial resolutions, strengthening both local detail modeling and global semantic understanding. To reduce communication overhead in collaborative perception, roadside features are compressed and reconstructed through an encoder–decoder pipeline, enabling efficient cross-agent feature transmission.For feature fusion, a Spatially Adaptive Feature Fusion (SAFF) module is introduced to dynamically reweight and complement vehicle-side local features and infrastructure-side global representations via feature expansion and spatial attention mechanisms. This design effectively mitigates fusion bias arising from heterogeneous viewpoints and sensing coverage disparities. Finally, the fused features are forwarded to the detection head to perform accurate 3D object detection.
3.1. Point Cloud Data Preprocessing
In vehicle–infrastructure cooperative perception systems, roadside and onboard LiDAR sensors can achieve coarse temporal synchronization via GPS or Precision Time Protocol (PTP); however, precise alignment remains challenging due to heterogeneity in hardware architectures and sampling frequencies. In particular, mismatched frame rates introduce temporal misalignment between point cloud streams, which in turn degrades the effectiveness of multi-source point cloud fusion. To address this issue, this work adopts a timestamp-based frame matching synchronization strategy [38]. Specifically, temporal offsets between roadside and vehicle-side point cloud frames are computed, and an optimal frame pairing is determined to achieve consistent temporal alignment. This procedure ensures both temporal and spatial coherence across heterogeneous point cloud sources, thereby providing a reliable foundation for subsequent cross-source feature fusion. The matching process is formally defined as follows:
Where and represent the roadside and vehicle-side point cloud frames after matching, respectively. In addition, denote the original roadside frame and the k-th vehicle-side frame. The time difference between these two frames is defined as follow:
Where and denote the timestamps of the roadside and vehicle-side frames, respectively, and δ represents the allowable threshold. When the difference is minimized and falls below δ, the roadside frame and the vehicle-side frame are considered successfully matched. This matching strategy ensures precise temporal alignment between heterogeneous point clouds sources, thereby establishing a reliable basis for subsequent multi-source feature fusion and 3D object detection.
Due to the inherent spatial separation between the point clouds acquired by roadside and onboard sensors, performing coordinate transformation after feature extraction in traditional alignment workflows often introduces registration errors caused by the differing viewpoints of vehicle-mounted and infrastructure-based systems. Alternatively, frame-wise coordinate transformations based on relative poses incur substantial computational overhead in dynamic vehicle–infrastructure interaction scenarios. To address these issues, this work adopts a global coordinate transformation (GCT) strategy, which leverages the positional information of both LiDAR platforms to directly project each point cloud frame into a unified global reference frame. By avoiding repeated frame-to-frame transformations, the proposed approach not only improves computational efficiency but also enhances the accuracy and stability of cross-source feature fusion in cooperative perception.
In this work, point cloud data (PCD) are adopted as an illustrative example. We assume that both vehicle-mounted platforms and roadside units are equipped with LiDAR sensors, and that each point cloud is represented in a three-dimensional Cartesian coordinate system whose origin is defined at the geometric center of the corresponding sensor. The mathematical formulation is defined as follows:
In this formulation, denotes the spatial coordinates of a point, and represents its reflection intensity. The six-degree-of-freedom (6-DoF) pose of the LiDAR sensor can be expressed as follows:
Where , , and denote the LiDAR’s position along the x-, y-, and z-axes in the global coordinate system, while , and represent the roll, pitch, and yaw angles, respectively.
The global alignment of point clouds from the LiDAR coordinate system can be achieved using the following formulation:
Where 、 、 denote the rotation matrices around the x-, y-, and z-axes, respectively, while represents the translation matrix. and correspond to the point cloud data in the sensor coordinate frame and the global coordinate frame. By applying a global coordinate transformation, point clouds acquired from vehicle-mounted and roadside LiDAR sensors are consistently projected into a unified global reference frame. This unified representation facilitates efficient multi-source information fusion while eliminating redundant and computationally expensive coordinate conversions.
3.2. Point Cloud Feature Extraction
3.2.1. Feature Encoding with the Improved PointPillars Network
The conventional PointPillars framework represents sparse 3D point clouds using pillar-based structures and enables efficient object detection in the bird’s-eye-view (BEV) domain. However, its feature encoding stage primarily relies on local statistical descriptors computed within individual pillars, exhibiting limited capacity to capture inter-pillar contextual relationships as well as variations in intra-pillar point distributions. These limitations become more pronounced in vehicle–infrastructure cooperative perception scenarios, where severe environmental occlusion and long-range LiDAR signal attenuation substantially reduce point density around critical objects, leading to the degradation of fine-grained geometric information. To address this challenge, we incorporate a redesigned squeeze-and-excitation attention module, termed Redefined-SENet (R-SENet), into the feature encoding stage of PointPillars. By explicitly modeling attention weights across both pillar-level and point-level dimensions, the proposed module enhances feature robustness and representation fidelity under complex traffic conditions. The architecture of the improved feature encoder is illustrated in Figure 2.
The proposed R-SENet module consists of two principal stages—squeeze and excitation—and comprises four operations: feature transformation (Ftr), squeezing (Fsq), excitation (Fex), and feature scaling (Fscale). The overall structure of the module is illustrated in Figure 3.
First, the input point cloud is formulated as a feature tensor , where N denotes the number of sampled points per pillar, D represents the dimensionality of point-wise features, and P is the non-empty pillars. The tensor X is then projected into a higher-dimensional embedding space through the transformation function , which facilitates the extraction of local geometric characteristics and yields an intermediate feature representation U :
The transformation function is realized through a shared multilayer perceptron or a channel-wise linear projection, which enables the extraction of more discriminative local geometric features.
Afterward, R-SENet performs the squeeze–excitation operation separately along the pillar dimension and within-pillar point dimension. Along the pillar dimension, the squeeze function globally aggregates the intermediate feature map over the feature dimension D and the point dimension N, thereby capturing geometric and semantic contextual information embedded in the overall spatial distribution of the point cloud and producing a statistical representation for each pillar. Meanwhile, along the within-pillar point dimension, the features are aggregated over dimensions D and P to obtain a global statistical descriptor for points residing inside each pillar. The computation is expressed as follows:
This multidimensional squeeze strategy enables the network to preserve the statistical correlation among both inter-pillar and intra-pillar features, even when the point cloud is sparse or unevenly distributed. By performing aggregation operations along specific dimensions, the network is able to capture global contextual information from two complementary perspectives: the overall spatial distribution and the fine-grained local geometric structure.
Subsequently, the excitation function maps the compressed global feature vector to a new representation by employing a gating mechanism composed of two fully connected layers. This module learns the nonlinear dependencies among feature channels and generates the channel-wise weight vectors and .The process is formulated as follows:
Where and denote the learnable weight matrices of the fully connected layers, while and represent the ReLU activation and the sigmoid function, respectively. Subsequently, the scaling function multiplies the channel-wise weight vectors generated during the excitation phase with the intermediate feature tensor U. This operation yields two recalibrated feature tensors and :
Afterward, R-SENet performs an element-wise addition of the feature outputs from the two branches, resulting in the final enhanced feature representation , which can be expressed as:
Finally, the features enhanced by R-SENet is scattered back to its original grid locations, producing a pseudo-image representation enriched with semantic information. The dual-branch attention fusion mechanism not only preserves the inherent spatial geometry of the raw point cloud, but also substantially strengthens key feature responses under sparse conditions caused by occlusion or long-range sensing, thereby providing more reliable feature inputs for vehicle–infrastructure cooperative perception.
3.2.2. 2D Backbone Network
To address the characteristic density variation of point clouds collected by vehicle-mounted and roadside LiDAR—dense at close range but sparse at long distances—we propose a Feature Pyramid Backbone Network (FPB-Net) constructed using standard convolutions and deconvolutions, as illustrated in Figure 4. Taking the pseudo-image features as input, the network performs multi-scale feature modeling and cross-layer information fusion to generate high-level semantic representations for downstream object detection.
FPB-Net consists of three principal submodules: a top–down multi-scale feature extraction network, a transpose-convolution-based upsampling network, and a cross-layer feature aggregation network.
First, the top–down feature extraction network takes low-resolution feature maps as input and progressively enriches the multi-scale semantic representation by capturing global contextual information through cascading convolutional layers and transmitting features across scales. Second, the upsampling network restores the feature maps to the original spatial resolution using transpose convolutions, preparing them for subsequent feature fusion. Finally, the cross-layer feature aggregation network concatenates features from different stages to merge complementary semantic and spatial information, thereby producing more discriminative global representations. To facilitate efficient cross-layer fusion, we adopt a direct concatenation strategy, which preserves feature integrity across scales while minimizing semantic degradation. Moreover, since concatenation introduces no additional trainable parameters and incurs modest computational overhead, it effectively reduces model complexity and mitigates overfitting risks.
In the implementation process, the convolution operation can be abstracted as a sequence of basic computational units ,where denotes the convolution stride, represents the number of convolutional layers, and indicates the number of output channels. Each unit consists of two-dimensional 3×3 convolutional layers, followed by Batch Normalization and a ReLU activation function:
Where and denote the feature maps of the l-th and (l+1)-th layers, respectively, while , and represent the convolution kernel, bias parameters, and the kernel size.
By adjusting the stride , convolution kernel size, and padding configuration, the spatial dimensions of the input pseudo-image can be flexibly altered, thereby enabling feature representations at multiple scales. Finally, the feature maps from all scales are concatenated to construct the vehicle-side feature representation FV and the infrastructure-side feature representation FI. These multi-scale fused features provide a more robust and efficient representation for subsequent detection tasks, particularly in complex environments and occlusion-prone scenarios.
3.3. Feature Compression and Transmission
To reduce the communication overhead incurred during feature sharing in vehicle–road cooperative perception, this study adopts an encoder–decoder–based feature compression and decompression mechanism [10] to enable efficient transmission of shared information. In the compression stage, the intermediate point-cloud features are first encoded by a convolutional neural network and subsequently quantized and losslessly compressed through entropy coding, thereby substantially reducing the amount of data to be transmitted.
Where denotes the compressed infrastructure-side feature, and represents the convolutional neural network layer.
When the vehicle arrives within the communication range, the compressed feature is decompressed through a transposed convolution operation to restore its original spatial resolution and key semantic information, after which it is forwarded to the subsequent feature fusion module.
Where denotes the transposed convolutional layer responsible for reconstructing the original feature representation FID. This mechanism not only ensures the efficient transmission of shared features but also substantially reduces communication overhead, enabling vehicles to obtain rich and accurate cooperative perception information even under limited bandwidth conditions.
3.4. Spatially Adaptive Vehicle–Infrastructure Feature Fusion
In cooperative vehicle–infrastructure perception, feature fusion is performed by concatenating the vehicle-side feature maps with the decompressed infrastructure feature maps to derive a unified feature representation. To address the parameter redundancy arising from multi-source concatenation and the information loss caused by single pooling–based fusion, we propose a Spatial Adaptive Feature Fusion (SAFF) module. SAFF adaptively integrates spatial features extracted by max pooling and average pooling, enabling efficient complementarity between vehicle- and infrastructure-side representations within a unified feature space. The overall architecture of the SAFF module is illustrated in Figure 5.
The SAFF module consists of three stages: feature dimensional expansion, feature concatenation, and spatial adaptive fusion. First, for the vehicle-side features and the infrastructure-side features obtained from different sensing entities, an expand-dimension (Exp_dim) operation is applied to explicitly introduce a source dimension into the feature tensors. This operation preserves the origin of each feature map while projecting them into a unified feature space, and can be expressed as follows:
Where denotes an operation that appends an additional channel at the end of the feature tensor, expanding the original representation from (C,H,W) to (C,H,W,1). Subsequently, the vehicle-side and infrastructure-side features are concatenated along the newly added dimension to form the fused feature representation , expressed as follows:
This operation structurally aligns the spatial properties of the vehicle-side and infrastructure-side features, thereby establishing a unified input representation that facilitates subsequent adaptive fusion.
Building on this, a spatial attention mechanism [39] is further introduced to enhance the spatial modeling capability of the fused features. Specifically, the fused feature map Ffusion is processed with max pooling and average pooling to extract two spatial descriptors, and , respectively. These two descriptors are then concatenated to form the spatial feature representation :
Thus, the proposed design effectively integrates the two types of spatial information embedded within the intermediate concatenated feature map. A 2D convolutional layer followed by a Sigmoid activation is subsequently applied to perform feature selection and dimensionality reduction. The refined representation is then compressed through a squeeze operation to obtain a feature map with dimensions (C,H,W), yielding the final vehicle–infrastructure spatially adaptive fused feature .The corresponding computation is formulated as follows:
In this formulation, denotes the Sigmoid activation function, represents the element-wise multiplication operation, and indicates the reduction of the feature map along the first dimension.
Through the above design, the Spatial Adaptive Feature Fusion module maintains the consistency of spatial and channel representations while adaptively integrating fine-grained structural information from the onboard perception with global semantic cues from the roadside perception.
3.5. Detection Head
In the collaborative vehicle–infrastructure perception network, the detection head performs 3D object detection based on the fused feature representations. In this study, we adopt the standard detection head architecture from PointPillars [22] for classification and regression. Ultimately, the detection head predicts the class label, spatial location, three-dimensional size, and yaw angle for each candidate bounding box, thereby completing the 3D object detection task.
4. Experimental Results
The proposed method is evaluated on the DAIR-V2X-C real-world open-source dataset as well as a self-collected vehicle–infrastructure cooperative perception dataset acquired from real urban traffic scenarios, in order to comprehensively assess its cooperative perception performance.
4.1. Device Information
The experiments were performed on a system equipped with an Intel i5-12400F CPU, an NVIDIA GeForce RTX 3060 GPU with 12 GB of memory, and 32 GB of RAM. The system ran on Ubuntu 20.04.6 LTS, with CUDA 11.3 to accelerate GPU computation. All models were implemented using PyTorch 1.10.1 within a conda environment configured with Python 3.7.12 and cuDNN 8.2.1. This hardware–software setup provides sufficient computational capacity to support multisource point-cloud processing and deep model training in vehicle–infrastructure cooperative perception tasks.
4.2. Experimental Datasets
4.2.1. DAIR-V2X Dataset
The DAIR-V2X dataset [28] is the first large-scale real-world benchmark designed for vehicle–infrastructure cooperative perception research. It contains more than 100 traffic scenarios collected in the Beijing pilot zone for autonomous driving and consists of images and point clouds acquired from cameras and LiDAR sensors mounted on vehicles and roadside infrastructure. On the vehicle side, a 40-line LiDAR operating at 10 Hz with a 360° horizontal field of view (FOV) is used, while the roadside infrastructure employs a 300-line LiDAR with the same sampling frequency and a 100° horizontal FOV to acquire point cloud data. In total, the dataset comprises 38,845 frames of synchronized images and point clouds, covering ten categories of annotated 3D bounding boxes, together with timestamps and calibration files. This dataset enables research on vehicle–road cooperative 3D detection and related tasks, thereby enhancing perception capability in autonomous driving systems. In this study, only LiDAR data from the dataset are used to validate the proposed cooperative perception framework.
4.2.2. Self-Collected Dataset
To validate the effectiveness of the proposed method, we selected a typical urban road beneath the Wenzhi Road Overpass in Zhengzhou as the experimental site. Leveraging a Level 3 (L3) Yutong Intelligent Connected Bus operating on the B7 route, we conducted synchronized collection of vehicle-side and roadside point cloud data, based on which an experimental dataset was constructed. The data acquisition platform is illustrated in Figure 6. The dataset contains approximately 2,000 pairs of synchronized vehicle- and infrastructure-side point cloud frames. This area exhibits dense traffic flow and mixed interactions between vehicles and pedestrians, effectively reflecting the dynamic occlusions and perception blind spots commonly encountered during bus operations. The main specifications of the self-collected dataset and the sensing system are summarized in Table 1.
To ensure high-precision spatiotemporal consistency among multi-source perception data, a hardware-triggered synchronization scheme based on a time server is adopted, and an RTK-based high-precision positioning system is integrated on the bus to provide accurate vehicle pose information. On this basis, precise extrinsic calibration is performed to enable the fusion and processing of vehicle-side and infrastructure-side point clouds within a unified coordinate frame.
4.3. Evaluation Metrics
4.3.1. IoU(Intersection over Union)
IoU is used to quantify the overlap between a predicted bounding box and the corresponding ground-truth box. It is defined as the ratio of the area of their intersection to the area of their union. The IoU calculation is expressed as follows:
A larger IoU value indicates a greater overlap between the predicted bounding box and the ground-truth box. In object detection tasks, predictions with an IoU exceeding a predefined threshold are typically regarded as true positives, whereas those falling below the threshold are considered false positives or false negatives. Therefore, IoU serves as a key metric for evaluating detection accuracy.
4.3.2. AP(Average precision)
AP evaluates the performance of a detection model by computing the area under the Precision–Recall (P–R) curve, thereby reflecting the model’s precision across different recall levels. An AP value closer to 1 indicates superior detection performance. In this study, AP is calculated under multiple IoU thresholds—specifically 0.5 and 0.7, which are commonly used in 3D object detection—to comprehensively assess the effectiveness of the proposed network. During this process, IoU is employed to determine true positives, which directly affects the P–R curve and, consequently, the final AP value.
4.4. Experimental Setup
In the experiments, the detection ranges for the DAIR-V2X dataset were set to , and , while those for the self-collected dataset were configured as , and .The communication ranges between the vehicle and the infrastructure were set to 100 m for the DAIR-V2X dataset and 50 m for the self-collected dataset. Beyond these distances, the vehicle is unable to receive cooperative perception information from the infrastructure. The proposed model was trained using the Adam optimizer with an initial learning rate of 0.002, a weight decay of λ, and a batch size of 2, for a total of 45 epochs. The loss weight for classification was set to 1, and the regression loss weight was set to 2. To enhance data diversity, multiple data augmentation techniques were applied during training, including random flipping along the X- and Y-axes, global scaling with a random factor of , global rotation within , and global translation within the range of . These augmentations improve the model’s robustness and feature learning capability.
4.5. Quantitative Results
To evaluate the detection performance of the proposed method, we conduct comparative experiments on both the DAIR-V2X dataset and our self-collected dataset, benchmarking against several existing fusion approaches, including single-vehicle perception (baseline), early fusion, late fusion, and advanced intermediate collaborative perception methods. The experimental results are summarized in Table 2, where all performance metrics for the compared algorithms are directly cited from their original publications. The symbol “–” indicates that the corresponding result is not provided. As shown in Table 2, the single-vehicle perception method relies solely on the onboard sensors of the ego vehicle and does not exploit information from other cooperative vehicles or roadside infrastructure, leading to significantly lower detection accuracy compared with collaborative perception algorithms. This demonstrates that vehicle–infrastructure cooperation can effectively enhance detection performance and enable more comprehensive and accurate environmental perception. Specifically, the proposed method achieves an AP@0.5 of 0.762 and an AP@0.7 of 0.617 on the DAIR-V2X dataset, and an AP@0.5 of 0.694 and an AP@0.7 of 0.563 on our self-collected dataset. Compared with single-vehicle perception, the proposed method improves AP@0.5 by 28.1% on the DAIR-V2X dataset and by 33.5% on our self-collected dataset.
In addition, inference-time evaluations were conducted on the DAIR-V2X dataset to examine the trade-off between computational efficiency and detection accuracy. The experimental results show that the single-vehicle perception approach achieves the fastest inference speed, with an average latency of 25.36ms, owing to its relatively lightweight model architecture. In contrast, V2X-ViT incurs the highest inference cost—161.04ms—due to its Transformer-based design and substantially larger parameter scale. The collaborative perception framework proposed in this study attains an inference time of 60.67ms, striking a favorable balance between accuracy and computational burden by introducing a vehicle–road feature fusion module while simultaneously mitigating communication bandwidth overhead through the aforementioned feature compression and transmission strategy. Nonetheless, its latency remains higher than that of single-vehicle perception, indicating that further improvements in model design and computational pipelines are required for practical roadside deployment where computing resources are constrained.
4.6. Qualitative Results
Figure 7 provides an intuitive comparison of raw point clouds, the baseline PointPillars model, and the PointPillars model enhanced with R-SENet in terms of their capability to process point-cloud features. The figure depicts a scenario involving both occlusion and long-range perception challenges, and employs heatmap visualization to illustrate the effectiveness of each model in extracting and representing informative features.
Figure 7(a,b) present the raw input point cloud visualization. Figure 7(c,d) further illustrate the disparities in feature representation across different models. As shown in Figure 7(c), the baseline PointPillars model, without the enhancement mechanism, primarily captures continuous road boundaries and topographic contours. The resulting Bird’s-Eye View (BEV) feature maps exhibit broad, uniform responses, indicating a foundational capacity for perceiving the overall scene layout. However, in long-range or occluded areas, the significant reduction in point cloud returns leads to diminished feature activation around targets. Consequently, object boundaries appear blurred or fragmented, failing to form distinct structural features. This suggests that PointPillars struggles to extract robust semantic structures in sparse regions, resulting in an inadequate depiction of local contours for critical objects like vehicles and pedestrians, which limits its detection performance in complex traffic environments.
In contrast, the PointPillars model augmented with R-SENet applies a dual-level squeeze-and-excitation operation on both pillar-wise and intra-pillar features to adaptively recalibrate feature channels. This mechanism effectively enhances feature sensitivity in sparse or structurally incomplete regions. As demonstrated in the heatmap, the enhanced model not only activates weak geometric patterns that the baseline model fails to recognize, but also produces clearer object boundaries and semantic shapes, resulting in more complete representation of potential targets. Overall, the comparative heatmap visualization confirms that integrating R-SENet substantially improves the ability of the model to extract salient features from sparse point-cloud data, thereby validating the effectiveness of the proposed enhancement.
To evaluate the adaptability of the proposed algorithm under dynamic and static occlusions as well as long-range perception scenarios, we conduct a comparative experiment against a single-vehicle perception method, and the results are presented in Figure 8. Specifically, panels (a) and (c) display visualization results on the DAIR-V2X dataset, while panels (b) and (d) show those obtained from our self-collected dataset. In all subfigures, green boxes denote ground-truth bounding boxes, red boxes represent detected objects, and yellow boxes indicate missed detections or inaccurate predictions caused by point-cloud sparsity due to occlusion or limited sensor range. Furthermore, “Ego” refers to the autonomous vehicle in the DAIR-V2X dataset, “Bus” denotes the intelligent connected bus used for data collection in our dataset, and “Infra” corresponds to the roadside infrastructure sensors.
Figure 9 and Figure 10 present the visualized detection results of V2X-ViT, CoAlign, and the proposed method on both the DAIR-V2X dataset and our self-constructed dataset, where Scene 1, Scene 2, and Scene 3 correspond to representative cases involving occlusion and long-range perception. As illustrated, V2X-ViT exhibits noticeable localization deviations and missing detections, while CoAlign demonstrates more stable detection completeness but still leaves room for improvement in bounding-box accuracy. In contrast, the proposed method substantially improves localization precision while effectively suppressing missed detections. The predicted bounding boxes align more closely with the ground-truth annotations, achieving the best overall detection performance among the compared methods. This performance gain primarily stems from the adaptive enhancement of key-region features enabled by the R-SENet module, as well as the spatially adaptive fusion introduced by the SAFF module when integrating features from vehicle and infrastructure perspectives. The combined effect of these modules enables the model to fully exploit spatial details and semantic cues from multi-source perception, yielding more stable and accurate detection under static/dynamic occlusions and long-range scenarios.
Overall, the qualitative analysis demonstrates that the proposed method achieves superior object detection accuracy compared with single-vehicle perception approaches and several state-of-the-art collaborative perception methods.
4.6. Ablation Study
To evaluate the effectiveness of each component in the proposed collaborative perception framework, comprehensive ablation studies were conducted on both the DAIR-V2X dataset and our self-constructed dataset. Specifically, we evaluated the contribution of the R-SENet attention module, the feature pyramid fusion network, and the spatial adaptive vehicle–infrastructure feature fusion module to overall detection performance. The results are summarized in Table 3, where √ and × indicate whether the corresponding module is enabled or disabled.
As illustrated in Table 3, systematic ablation experiments were conducted to evaluate the performance contributions of three core modules: R-SENet, FPB-Net, and SAFF. The evaluation was performed on both the DAIR-V2X dataset and a custom-built dataset. The results demonstrate that each module provides stable and complementary performance gains across various IoU thresholds. Specifically, incorporating R-SENet yielded improvements of 3.9% and 4.8% in AP@0.5 and AP@0.7 on the DAIR-V2X dataset, and 4.2% and 3.8% on the custom dataset, respectively. These gains indicate that the dual-dimensional attention mechanism of R-SENet effectively strengthens fine-grained point cloud structures, thereby mitigating the feature degradation caused by sparsity in occluded and long-range scenarios.
Building upon this, the introduction of FPB-Net further enhanced model performance, with AP@0.5 and AP@0.7 increasing by 1.1% and 1.4% on DAIR-V2X, and 1.8% and 1.3% on the custom dataset. This improvement underscores the effectiveness of FPB-Net in multi-scale semantic modeling and cross-layer information aggregation, which balances feature requirements for targets at varying distances and shows strong adaptability to complex urban environments. Finally, the inclusion of the SAFF module led to further increases in AP@0.5 and AP@0.7 by 2.3%/2.9% on DAIR-V2X and 3.2%/2.6% on the custom dataset. This boost is primarily attributed to the spatially adaptive fusion mechanism, which alleviates viewpoint biases and sensing coverage disparities between vehicle-side and roadside perceptions, significantly enhancing the complementary representation of cross-source information. Ultimately, the joint application of all three modules achieved total improvements in AP@0.5 and AP@0.7 of 7.3% and 8.6% on DAIR-V2X, and 8.7% and 7.5% on the custom dataset compared to the baseline. These results validate a complete performance closed-loop, ranging from point cloud detail enhancement and multi-scale feature supplementation to spatial alignment and fusion.
5. Conclusions
To address the challenges encountered by intelligent buses and other large vehicles operating in complex urban environments—specifically dynamic occlusion, long-range point cloud sparsity, and the efficient fusion of heterogeneous features—this study proposes a cooperative vehicle–road 3D object detection framework based on point-cloud feature enhancement and spatially adaptive fusion. First, an R-SENet-based attention mechanism is embedded into the conventional PointPillars encoder to reinforce the representation of sparse and occluded point clouds through dual-dimensional feature statistics and channel recalibration at both pillar and intra-pillar levels. Subsequently, the proposed FPB-Net feature-pyramid backbone is incorporated to enable unified multi-scale point-cloud modeling and effectively accommodate the density variation of LiDAR observations over distance. Building upon these components, a spatially adaptive feature fusion module is introduced to dynamically integrate fine-grained vehicle-side structural information with global semantic cues from roadside sensors using spatial attention. This design mitigates perception blind zones inherent in single-vehicle sensing and maintains low communication overhead via feature compression, thereby substantially improving cooperative perception in spatially heterogeneous scenarios. Experimental evaluations demonstrate that the proposed method significantly outperforms both single-vehicle perception baselines and state-of-the-art cooperative approaches on the DAIR-V2X and self-collected datasets, with particularly strong advantages in occluded and long-range scenarios where point clouds become sparse, while maintaining real-time inference. Future work will explore multimodal fusion strategies to further integrate heterogeneous sensing modalities and construct a more comprehensive perception framework.
Author Contributions
Conceptualization, S.Y. and C.X.; Methodology, S.Y. and C.X.; Software, Y.W. and S.Y.; Validation, S.Y., Y.W. and C.X.; Formal Analysis, Y.W.; Investigation, Y.W. and X.C.; Resources, Y.W., C.X. and Z.L.; Data Curation, S.Y. and C.X.; Writing—Original Draft Preparation, S.Y.; Writing—Review and Editing, S.Y. and Y.W.; Visualization, S.Y. and Y.W.; Supervision, Y.W.; Project Administration, Y.W.; Funding Acquisition, S.Y. All authors have read and agreed to the published version of the manuscript.
Funding
This research was funded by the Science and Technology Project of the Henan Provincial Department of Transportation (No. 2023-5-1).
Data Availability Statement
Data are contained within the article.
Conflicts of Interest
The authors declare no conflicts of interest.
References
- Yurtsever, E.; Lambert, J.; Carballo, A.; Takeda, K. A survey of autonomous driving: Common practices and emerging technologies. IEEE Access 2020, 8, 58443–58469. [Google Scholar] [CrossRef]
- Huang, T.; Liu, J.; Zhou, X.; Nguyen, D.C.; Azghadi, M.R.; Xia, Y.; Sun, S. V2X cooperative perception for autonomous driving: Recent advances and challenges. arXiv 2023, arXiv:2310.03525. [Google Scholar] [CrossRef]
- Noor-A-Rahim, M.; Liu, Z.; Lee, H.; Khyam, M.O.; He, J.; Pesch, D.; Poor, H.V. 6G for vehicle-to-everything (V2X) communications: Enabling technologies, challenges, and opportunities. Proc. IEEE 2022, 110, 712–734. [Google Scholar] [CrossRef]
- Ye, X.; Shu, M.; Li, H.; et al. Rope3D: The roadside perception dataset for autonomous driving and monocular 3D object detection task. In Proceedings of the IEEE/CVF Conference on Computer Vision and Pattern Recognition, New Orleans, LA, USA, 19–24 June 2022; pp. 21341–21350. [Google Scholar]
- Wu, J.; Xu, H.; Tian, Y.; Pi, R.; Yue, R. Vehicle detection under adverse weather from roadside LiDAR data. Sensors 2020, 20, 3433. [Google Scholar] [CrossRef]
- Liu, S.; Gao, C.; Chen, Y.; Peng, X.; Kong, X.; Wang, K.; Wang, M. Towards vehicle-to-everything autonomous driving: A survey on collaborative perception. arXiv 2023, arXiv:2308.16714. [Google Scholar]
- Chen, Q.; Ma, X.; Tang, S.; Guo, J.; Yang, Q.; Fu, S. F-Cooper: Feature-based cooperative perception for autonomous vehicle edge computing system using 3D point clouds. In Proceedings of the 4th ACM/IEEE Symposium on Edge Computing, Arlington, VA, USA, 7–9 November 2019; pp. 88–100. [Google Scholar]
- Yu, H.; Tang, Y.; Xie, E.; Mao, J.; Yuan, J.; Luo, P.; Nie, Z. Vehicle–infrastructure cooperative 3D object detection via feature flow prediction. arXiv 2023, arXiv:2303.10552. [Google Scholar]
- Ren, S.; Lei, Z.; Wang, Z.; Dianati, M.; Wang, Y.; Chen, S.; Zhang, W. Interruption-aware cooperative perception for V2X communication-aided autonomous driving. IEEE Trans. Intell. Veh. 2024, 9, 4698–4714. [Google Scholar] [CrossRef]
- Bai, Z.; Wu, G.; Barth, M.J.; Liu, Y.; Sisbot, E.A.; Oguchi, K. PillarGrid: Deep learning-based cooperative perception for 3D object detection from onboard-roadside LiDAR. In Proceedings of the 2022 IEEE 25th International Conference on Intelligent Transportation Systems (ITSC), Macau, China, 8–12 October 2022; pp. 1743–1749. [Google Scholar]
- Xiang, C.; Xie, X.; Feng, C.; Bai, Z.; Niu, Z.; Yang, M. V2I-BEVF: Multi-modal fusion based on BEV representation for vehicle–infrastructure perception. In Proceedings of the 2023 IEEE 26th International Conference on Intelligent Transportation Systems (ITSC), Bilbao, Spain, 24–28 September 2023; pp. 5292–5299. [Google Scholar]
- Qi, C.R.; Su, H.; Mo, K.; Guibas, L.J. PointNet: Deep learning on point sets for 3D classification and segmentation. In Proceedings of the IEEE Conference on Computer Vision and Pattern Recognition, Honolulu, HI, USA, 21–26 July 2017; pp. 652–660. [Google Scholar]
- Qi, C.R.; Yi, L.; Su, H.; Guibas, L.J. PointNet++: Deep hierarchical feature learning on point sets in a metric space. Adv. Neural Inf. Process. Syst. 2017, 30. [Google Scholar]
- Shi, S.; Wang, X.; Li, H. PointRCNN: 3D object proposal generation and detection from point cloud. In Proceedings of the IEEE/CVF Conference on Computer Vision and Pattern Recognition, Long Beach, CA, USA, 15–20 June 2019; pp. 770–779. [Google Scholar]
- Shi, S.; Guo, C.; Jiang, L.; Wang, Z.; Shi, J.; Wang, X.; Li, H. PV-RCNN: Point-voxel feature set abstraction for 3D object detection. In Proceedings of the IEEE/CVF Conference on Computer Vision and Pattern Recognition, Seattle, WA, USA, 14–19 June 2020; pp. 10529–10538. [Google Scholar]
- Yang, Z.; Sun, Y.; Liu, S.; Jia, J. 3DSSD: Point-based 3D single-stage object detector. In Proceedings of the IEEE/CVF Conference on Computer Vision and Pattern Recognition, Seattle, WA, USA, 14–19 June 2020; pp. 11040–11048. [Google Scholar]
- Liu, Z.; Zhang, Z.; Cao, Y.; Hu, H.; Tong, X. Group-free 3D object detection via transformers. In Proceedings of the IEEE/CVF International Conference on Computer Vision, Montreal, QC, Canada, 11–17 October 2021; pp. 2949–2958. [Google Scholar]
- Mao, J.; Xue, Y.; Niu, M.; Bai, H.; Feng, J.; Liang, X.; Xu, C. Voxel transformer for 3D object detection. In Proceedings of the IEEE/CVF International Conference on Computer Vision, Montreal, QC, Canada, 11–17 October 2021; pp. 3164–3173. [Google Scholar]
- Chen, Y.; Liu, J.; Zhang, X.; Qi, X.; Jia, J. VoxelNeXt: Fully sparse VoxelNet for 3D object detection and tracking. In Proceedings of the IEEE/CVF Conference on Computer Vision and Pattern Recognition, Vancouver, BC, Canada, 18–23 June 2023; pp. 21674–21683. [Google Scholar]
- Yan, Y.; Mao, Y.; Li, B. SECOND: Sparsely embedded convolutional detection. Sensors 2018, 18, 3337. [Google Scholar] [CrossRef]
- Yin, T.; Zhou, X.; Krahenbuhl, P. Center-based 3D object detection and tracking. In Proceedings of the IEEE/CVF Conference on Computer Vision and Pattern Recognition, Nashville, TN, USA, 20–25 June 2021; pp. 11784–11793. [Google Scholar]
- Lang, A.H.; Vora, S.; Caesar, H.; Zhou, L.; Yang, J.; Beijbom, O. PointPillars: Fast encoders for object detection from point clouds. In Proceedings of the IEEE/CVF Conference on Computer Vision and Pattern Recognition, Long Beach, CA, USA, 15–20 June 2019; pp. 12697–12705. [Google Scholar]
- Xie, Q.; Zhou, X.; Qiu, T.; Zhang, Q.; Qu, W. Soft actor–critic-based multilevel cooperative perception for connected autonomous vehicles. IEEE Internet Things J. 2022, 9, 21370–21381. [Google Scholar] [CrossRef]
- Guo, A.; Zhang, S.; Tang, E.; Gao, X.; Pang, H.; Tian, H.; Chen, Z. When autonomous vehicle meets V2X cooperative perception: How far are we? arXiv 2025, arXiv:2509.24927. [Google Scholar] [CrossRef]
- Chen, Q.; Tang, S.; Yang, Q.; Fu, S. COOPER: Cooperative perception for connected autonomous vehicles based on 3D point clouds. In Proceedings of the 2019 IEEE 39th International Conference on Distributed Computing Systems (ICDCS), Dallas, TX, USA, 7–9 July 2019; pp. 514–524. [Google Scholar]
- Arnold, E.; Dianati, M.; De Temple, R.; Fallah, S. Cooperative perception for 3D object detection in driving scenarios using infrastructure sensors. IEEE Trans. Intell. Transp. Syst. 2020, 23, 1852–1864. [Google Scholar] [CrossRef]
- Mo, Y.; Zhang, P.; Chen, Z.; Ran, B. A method of vehicle–infrastructure cooperative perception based vehicle state information fusion using improved Kalman filter. Multimed. Tools Appl. 2022, 81, 4603–4620. [Google Scholar] [CrossRef]
- Yu, H.; Luo, Y.; Shu, M.; Huo, Y.; Yang, Z.; Shi, Y.; Nie, Z. DAIR-V2X: A large-scale dataset for vehicle–infrastructure cooperative 3D object detection. In Proceedings of the IEEE/CVF Conference on Computer Vision and Pattern Recognition, New Orleans, LA, USA, 19–24 June 2022; pp. 21361–21370. [Google Scholar]
- Feng, X.; Sun, H.; Zheng, H. LCV2I: Communication-efficient and high-performance collaborative perception framework with low-resolution LiDAR. arXiv 2025, arXiv:2502.17039. [Google Scholar]
- Wang, T.H.; Manivasagam, S.; Liang, M.; Yang, B.; Zeng, W.; Urtasun, R. V2VNet: Vehicle-to-vehicle communication for joint perception and prediction. In Proceedings of the European Conference on Computer Vision, Glasgow, UK, 23–28 August 2020; pp. 605–621. [Google Scholar]
- Xu, R.; Xiang, H.; Xia, X.; Han, X.; Li, J.; Ma, J. OPV2V: An open benchmark dataset and fusion pipeline for perception with vehicle-to-vehicle communication. In Proceedings of the 2022 International Conference on Robotics and Automation (ICRA), Philadelphia, PA, USA, 23–27 May 2022; pp. 2583–2589. [Google Scholar]
- Xu, R.; Xiang, H.; Tu, Z.; Xia, X.; Yang, M.H.; Ma, J. V2X-ViT: Vehicle-to-everything cooperative perception with vision transformer. In Proceedings of the European Conference on Computer Vision, Tel Aviv, Israel, 23–27 October 2022; pp. 107–124. [Google Scholar]
- Hu, Y.; Fang, S.; Lei, Z.; Zhong, Y.; Chen, S. Where2Comm: Communication-efficient collaborative perception via spatial confidence maps. arXiv 2022, arXiv:2209.12836. [Google Scholar]
- Yan, W.; Cao, H.; Chen, J.; Wu, T. FETR: Feature transformer for vehicle–infrastructure cooperative 3D object detection. Neurocomputing 2024, 600, 128147. [Google Scholar] [CrossRef]
- Shao, J.; Li, T.; Zhang, J. Task-oriented communication for vehicle-to-infrastructure cooperative perception. In Proceedings of the 2024 IEEE 34th International Workshop on Machine Learning for Signal Processing (MLSP), London, UK, 25–28 September 2024; pp. 1–6. [Google Scholar]
- Chen, Z.; Shi, Y.; Jia, J. TransIFF: An instance-level feature fusion framework for vehicle–infrastructure cooperative 3D detection with transformers. In Proceedings of the IEEE/CVF International Conference on Computer Vision, Paris, France, 1–8 October 2023; pp. 18205–18214. [Google Scholar]
- Wang, S.; Yuan, M.; Zhang, C.; He, L.; Xu, Q.; Wang, J. V2X-DGPE: Addressing domain gaps and pose errors for robust collaborative 3D object detection. In Proceedings of the 2025 IEEE Intelligent Vehicles Symposium (IV), Munich, Germany, 4–7 June 2025; pp. 2074–2080. [Google Scholar]
- Wang, L.; Lan, J.; Li, M. PAFNet: Pillar attention fusion network for vehicle–infrastructure cooperative target detection using LiDAR. Symmetry 2024, 16, 401. [Google Scholar] [CrossRef]
- Yan, J.; Peng, Z.; Yin, H.; Wang, J.; Wang, X.; Shen, Y.; Cremers, D. Trajectory prediction for intelligent vehicles using spatial-attention mechanism. IET Intell. Transp. Syst. 2020, 14, 1855–1863. [Google Scholar] [CrossRef]
- Mushtaq, H.; Deng, X.; Ullah, I.; Ali, M.; Malik, B.H. O2SAT: Object-oriented-segmentation-guided spatial-attention network for 3D object detection in autonomous vehicles. Information 2024, 15, 376. [Google Scholar] [CrossRef]
- Xu, R.; Tu, Z.; Xiang, H.; Shao, W.; Zhou, B.; Ma, J. CoBEVT: Cooperative bird’s-eye-view semantic segmentation with sparse transformers. arXiv 2022, arXiv:2207.02202. [Google Scholar]
- Lu, Y.; Li, Q.; Liu, B.; Dianati, M.; Feng, C.; Chen, S.; Wang, Y. Robust collaborative 3D object detection in presence of pose errors. arXiv 2022, arXiv:2211.07214. [Google Scholar]
Figure 1.
Framework of the Proposed Vehicle–Infrastructure Cooperative Perception System.
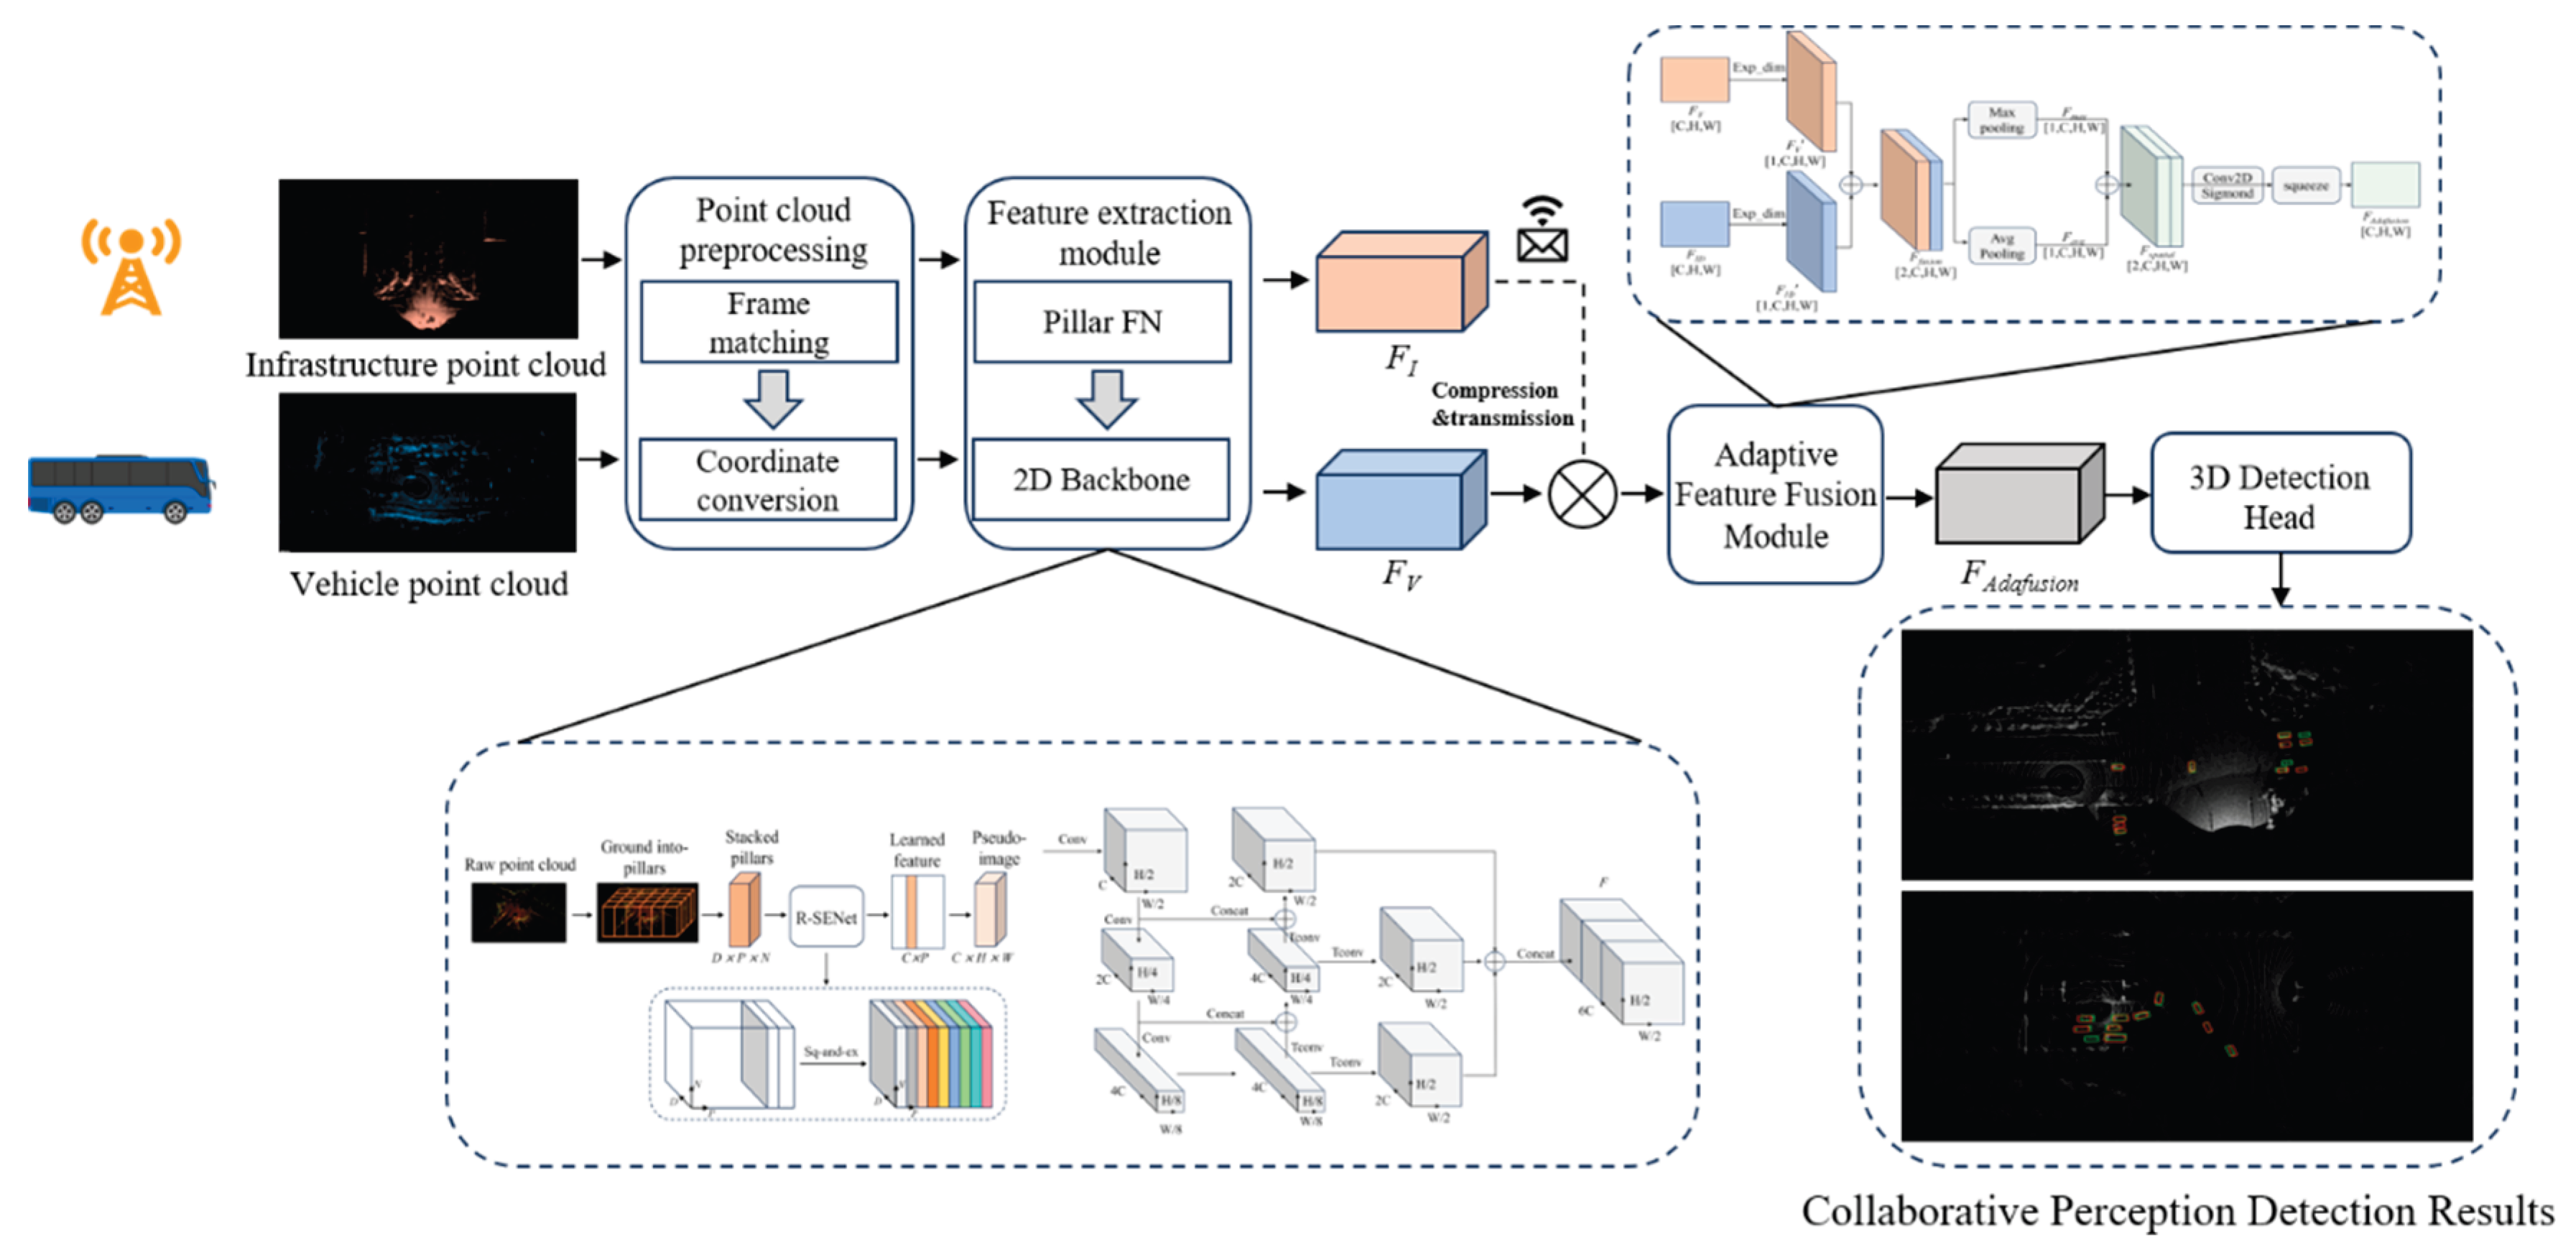
Figure 2.
Schematic Diagram of the Improved PointPillars Feature Extraction Module.
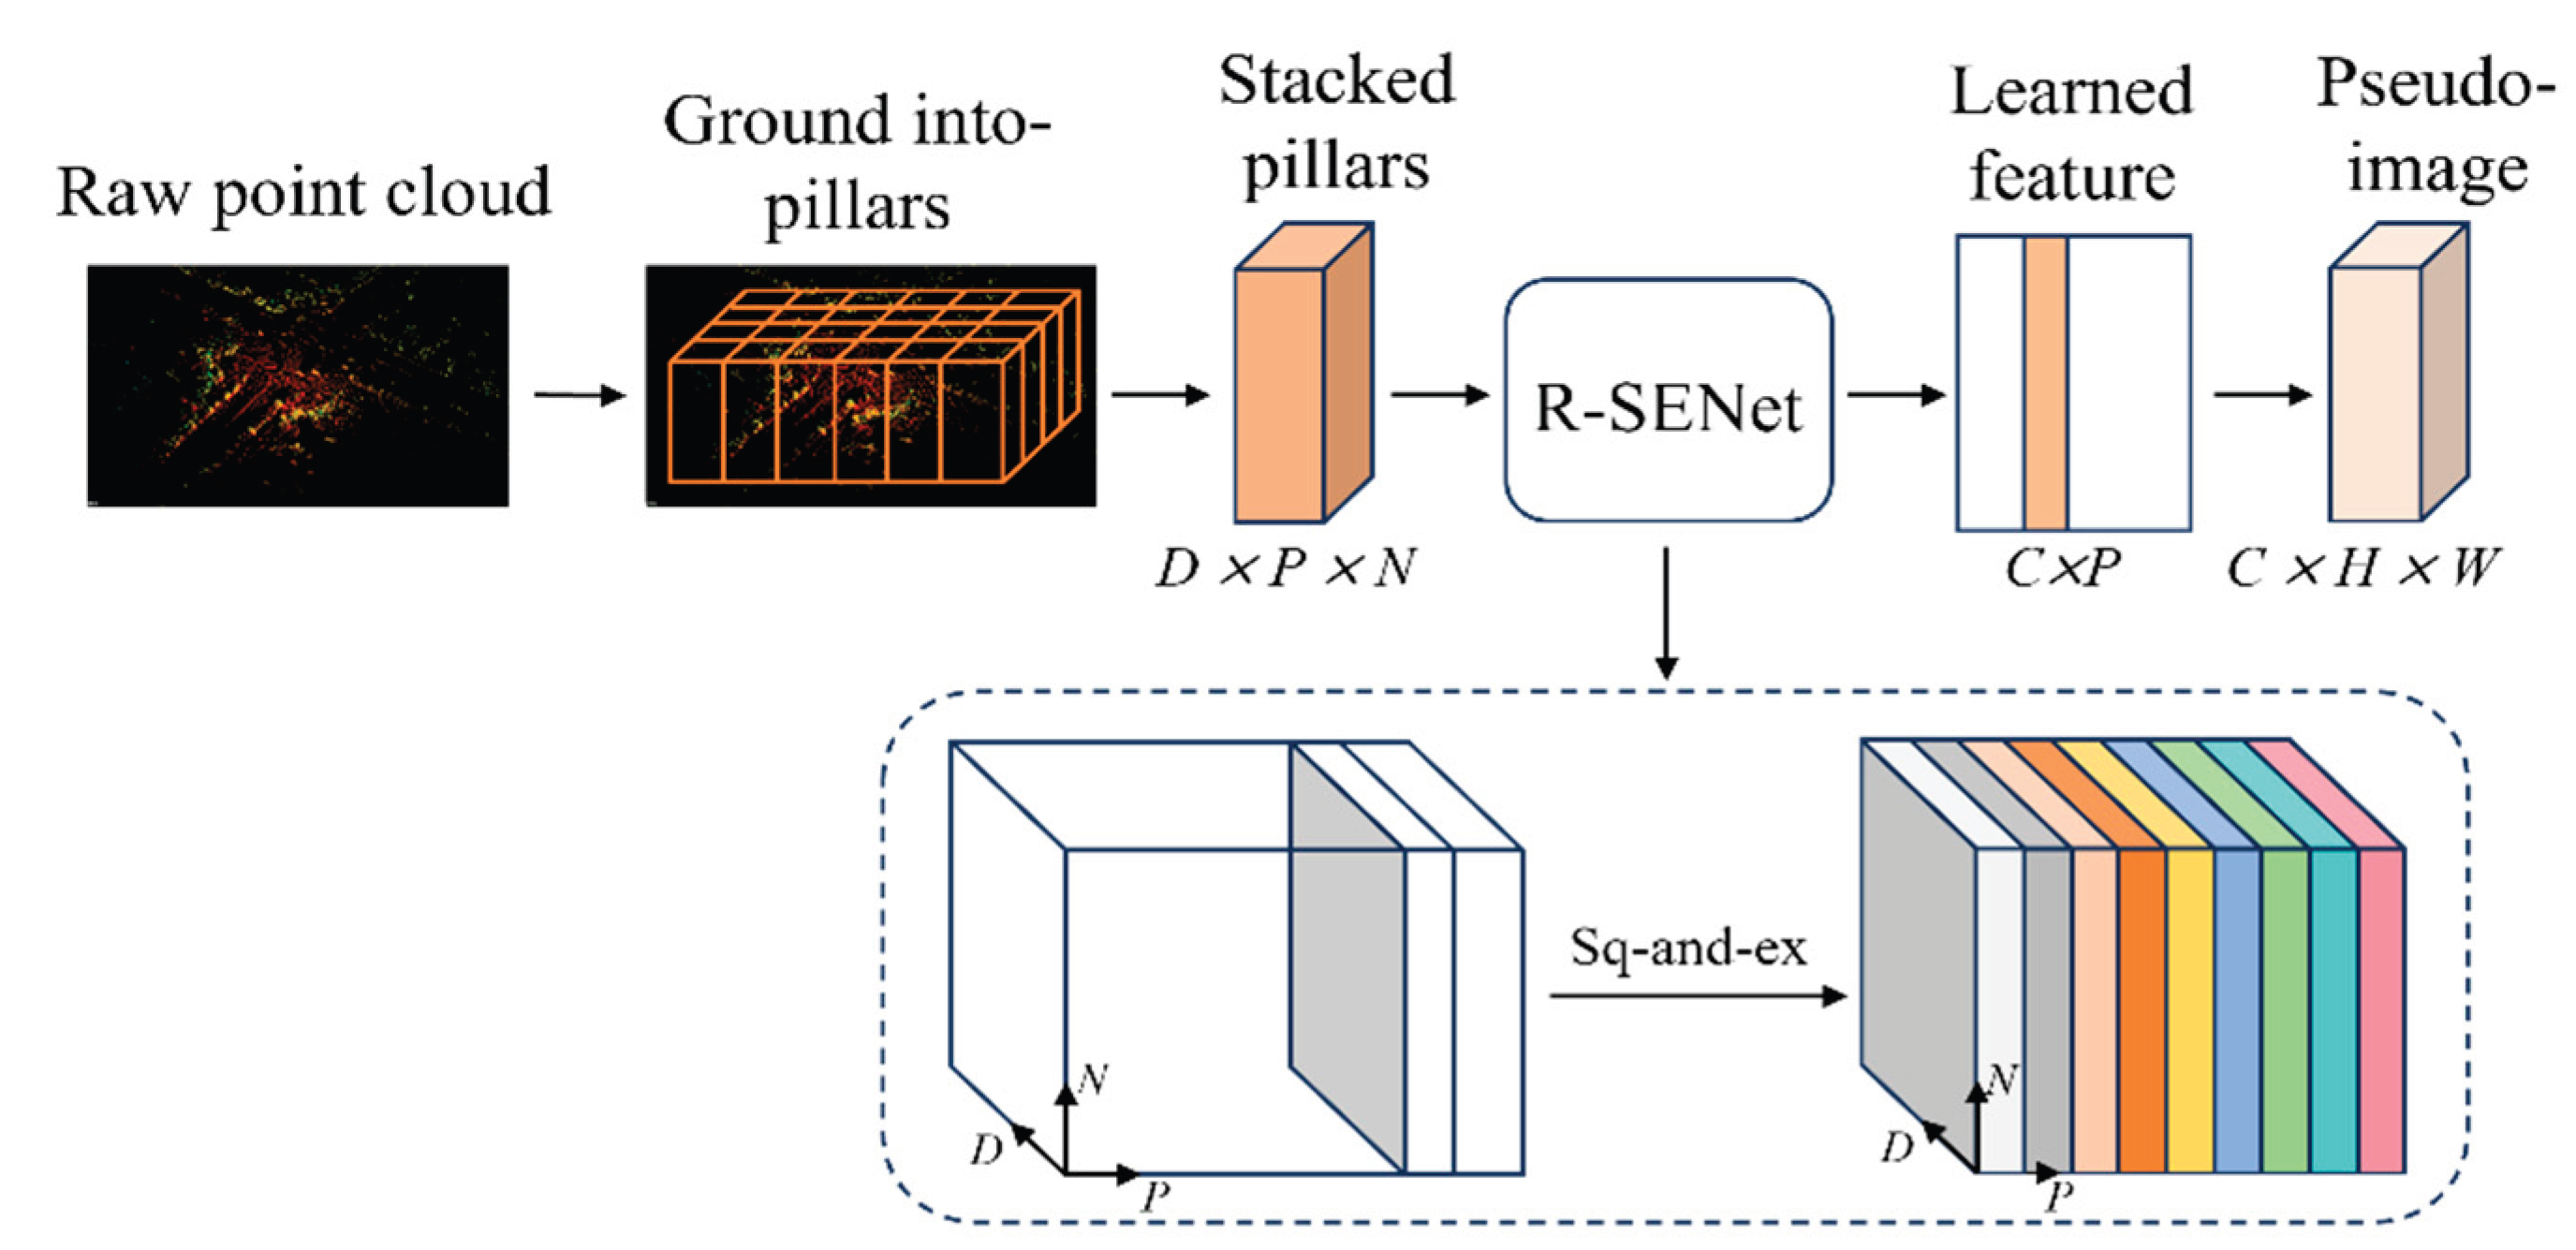
Figure 3.
Schematic Diagram of the R-SENet Structure.
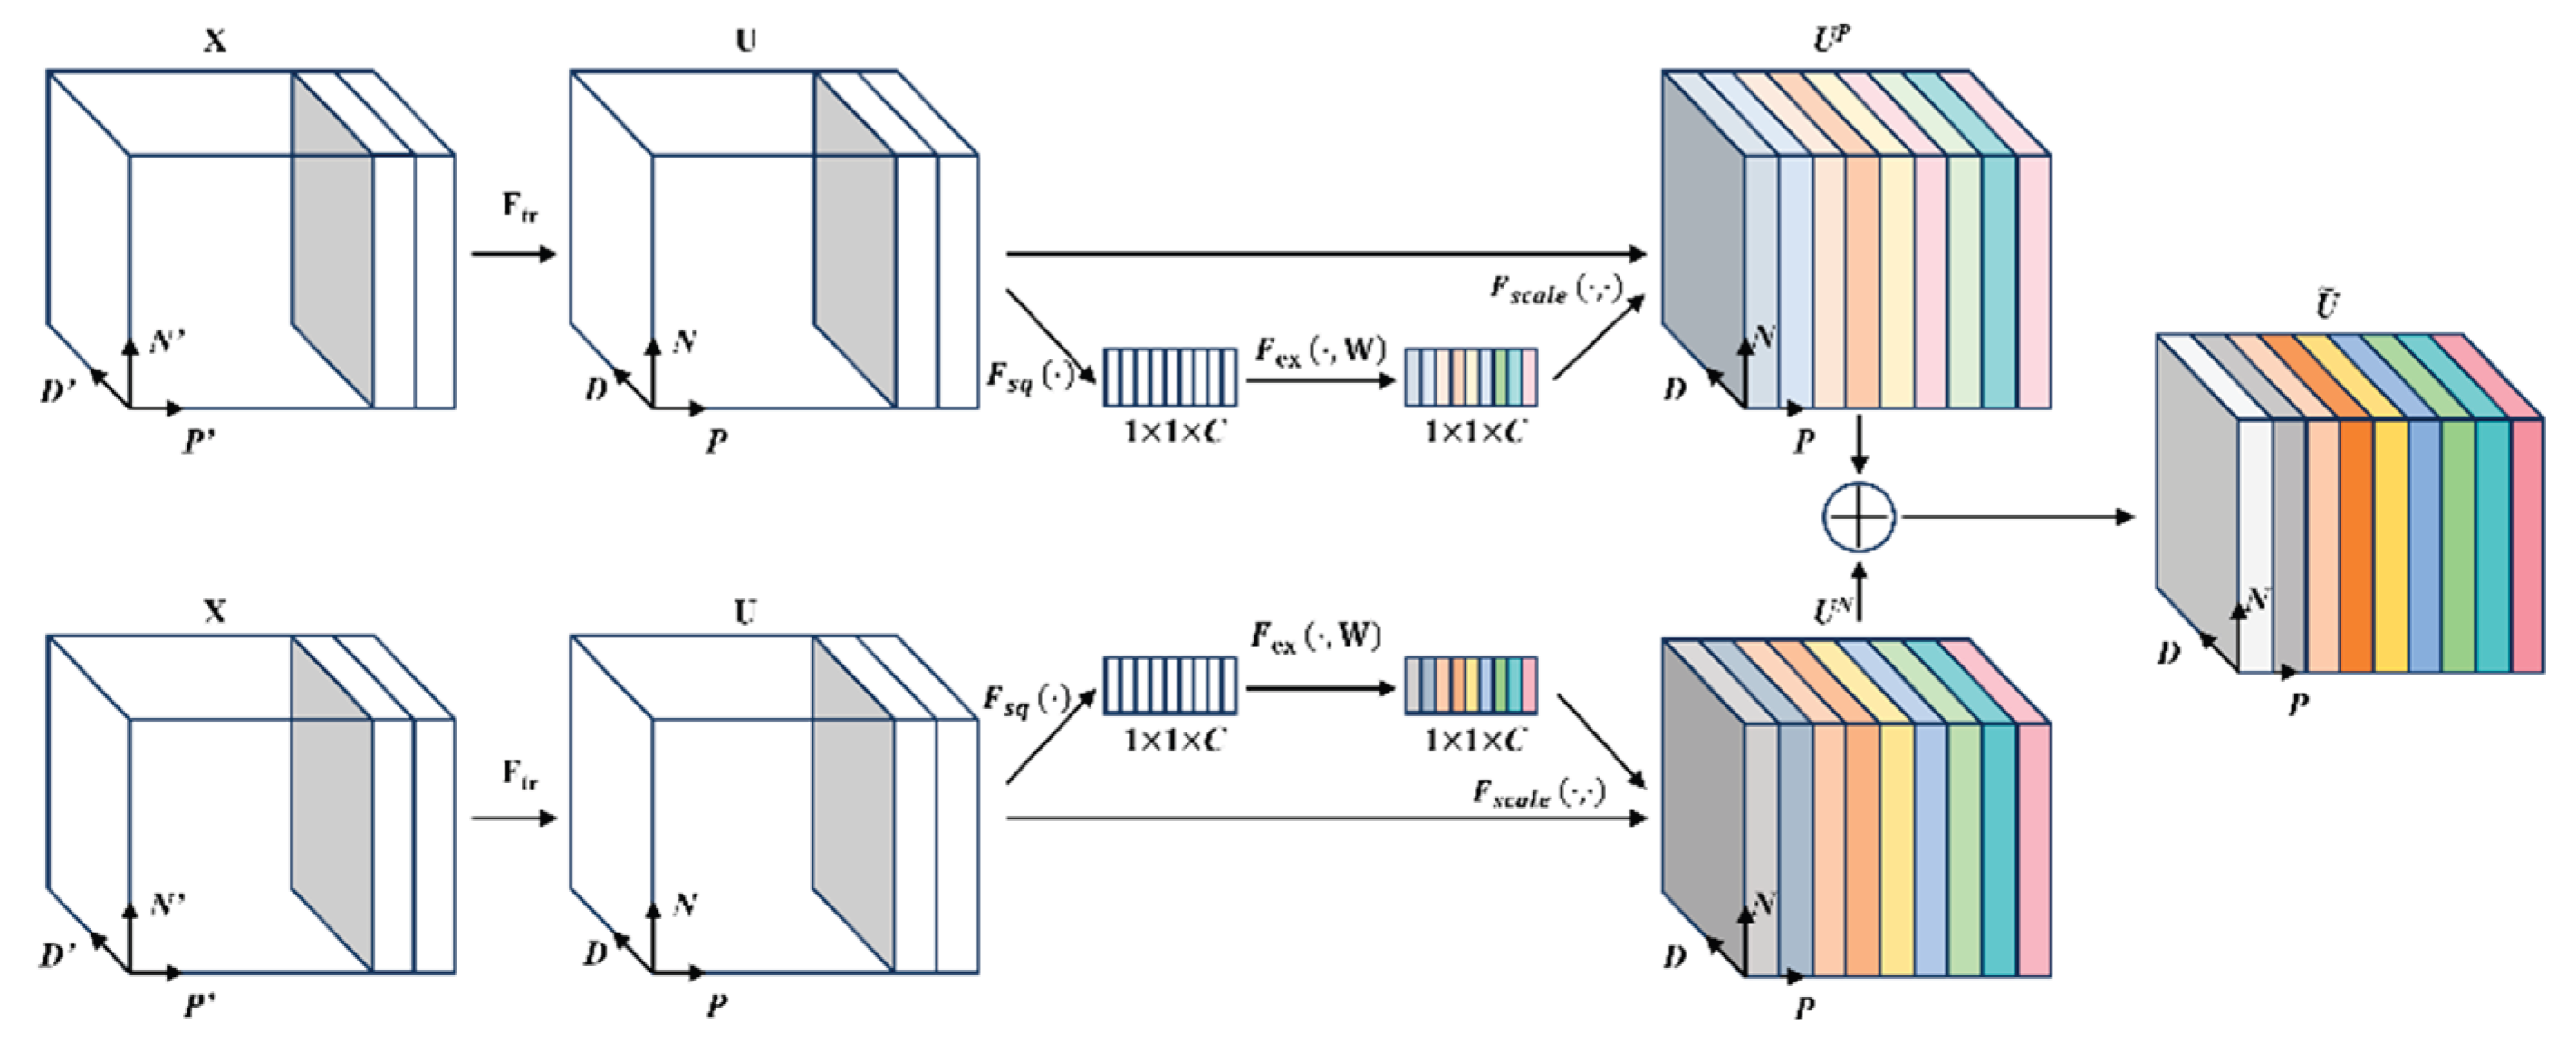
Figure 4.
Schematic Diagram of the Feature Pyramid Backbone Network.
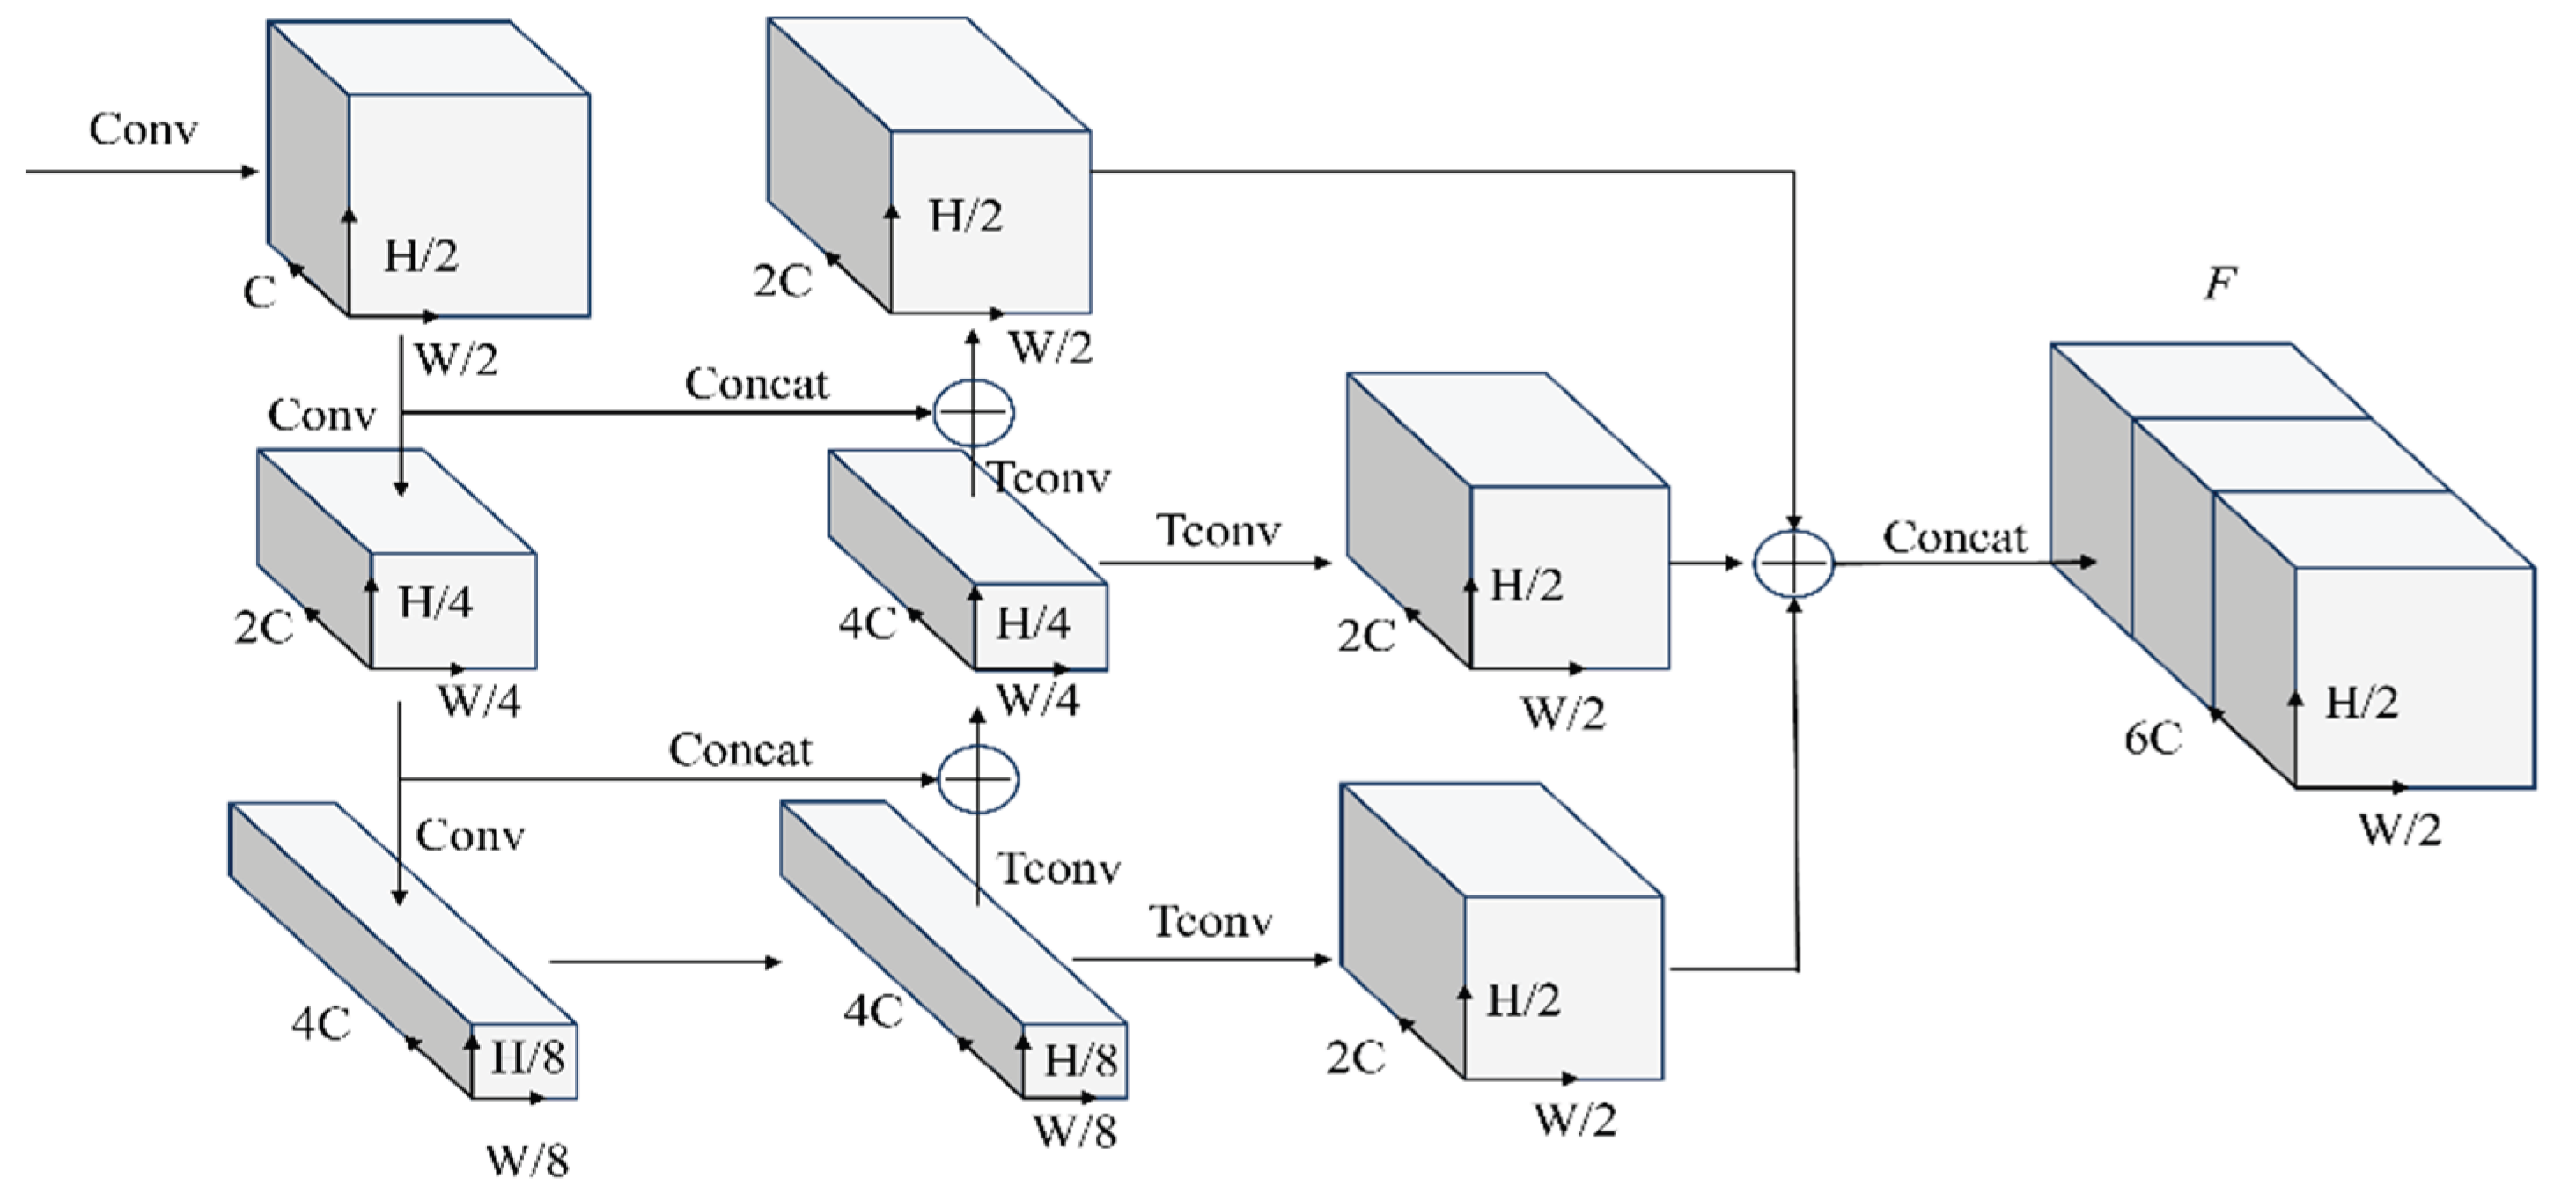
Figure 5.
Spatially Adaptive Feature Fusion Module.
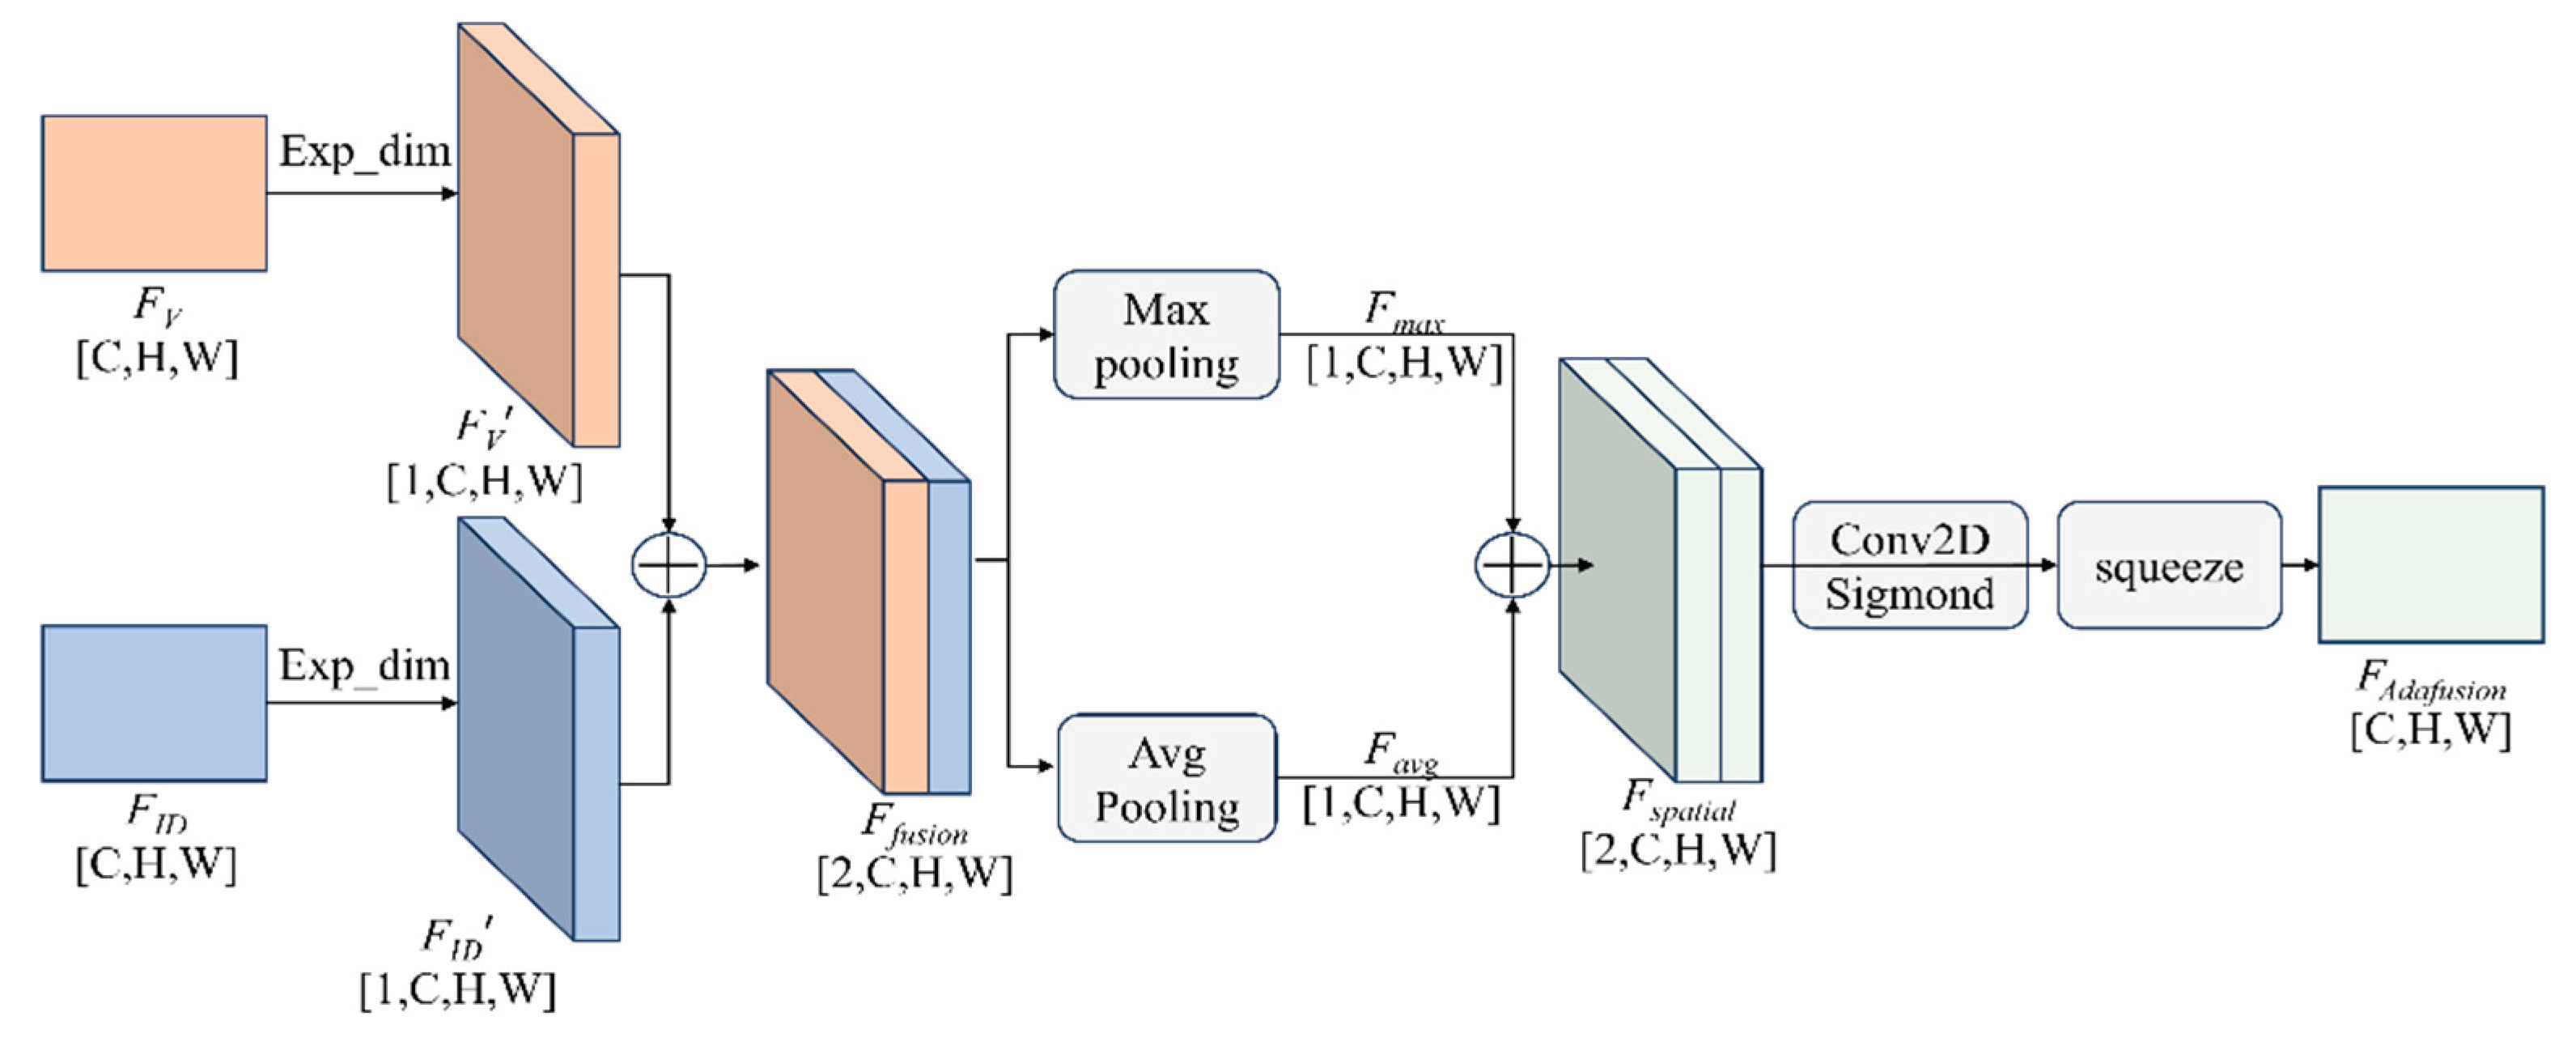
Figure 6.
Self-Collected Dataset Acquisition Platform. (a) On-board data acquisition equipment. (b) Roadside infrastructure data acquisition units. (c) Roadside data collection scene. (d) Roadside point cloud visualization interface. (e) On-board point cloud visualization interface. (f) On-board data collection scene.
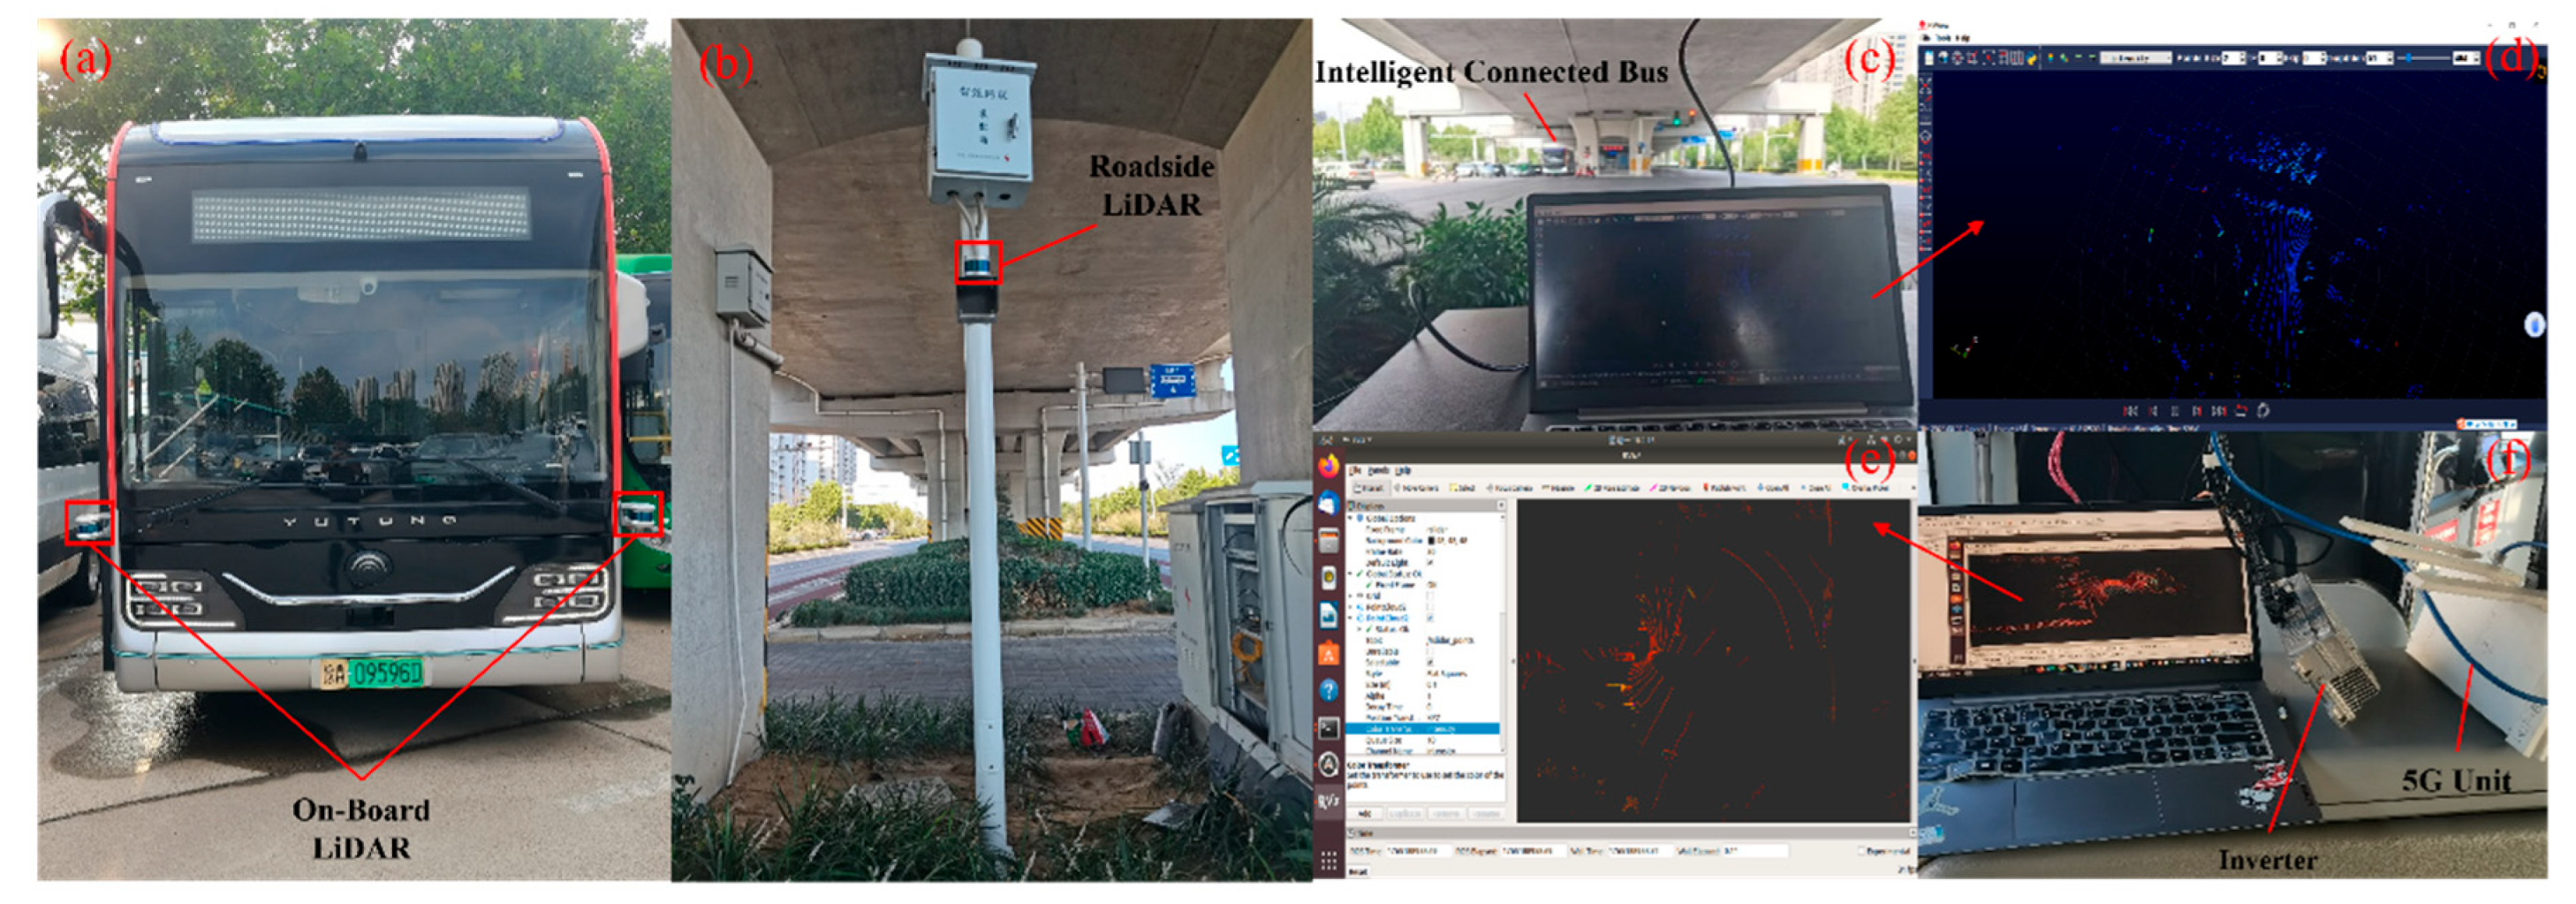
Figure 7.
Comparative visualization of point cloud feature extraction, where "ego" denotes the position of the ego-vehicle.
Figure 7.
Comparative visualization of point cloud feature extraction, where "ego" denotes the position of the ego-vehicle.
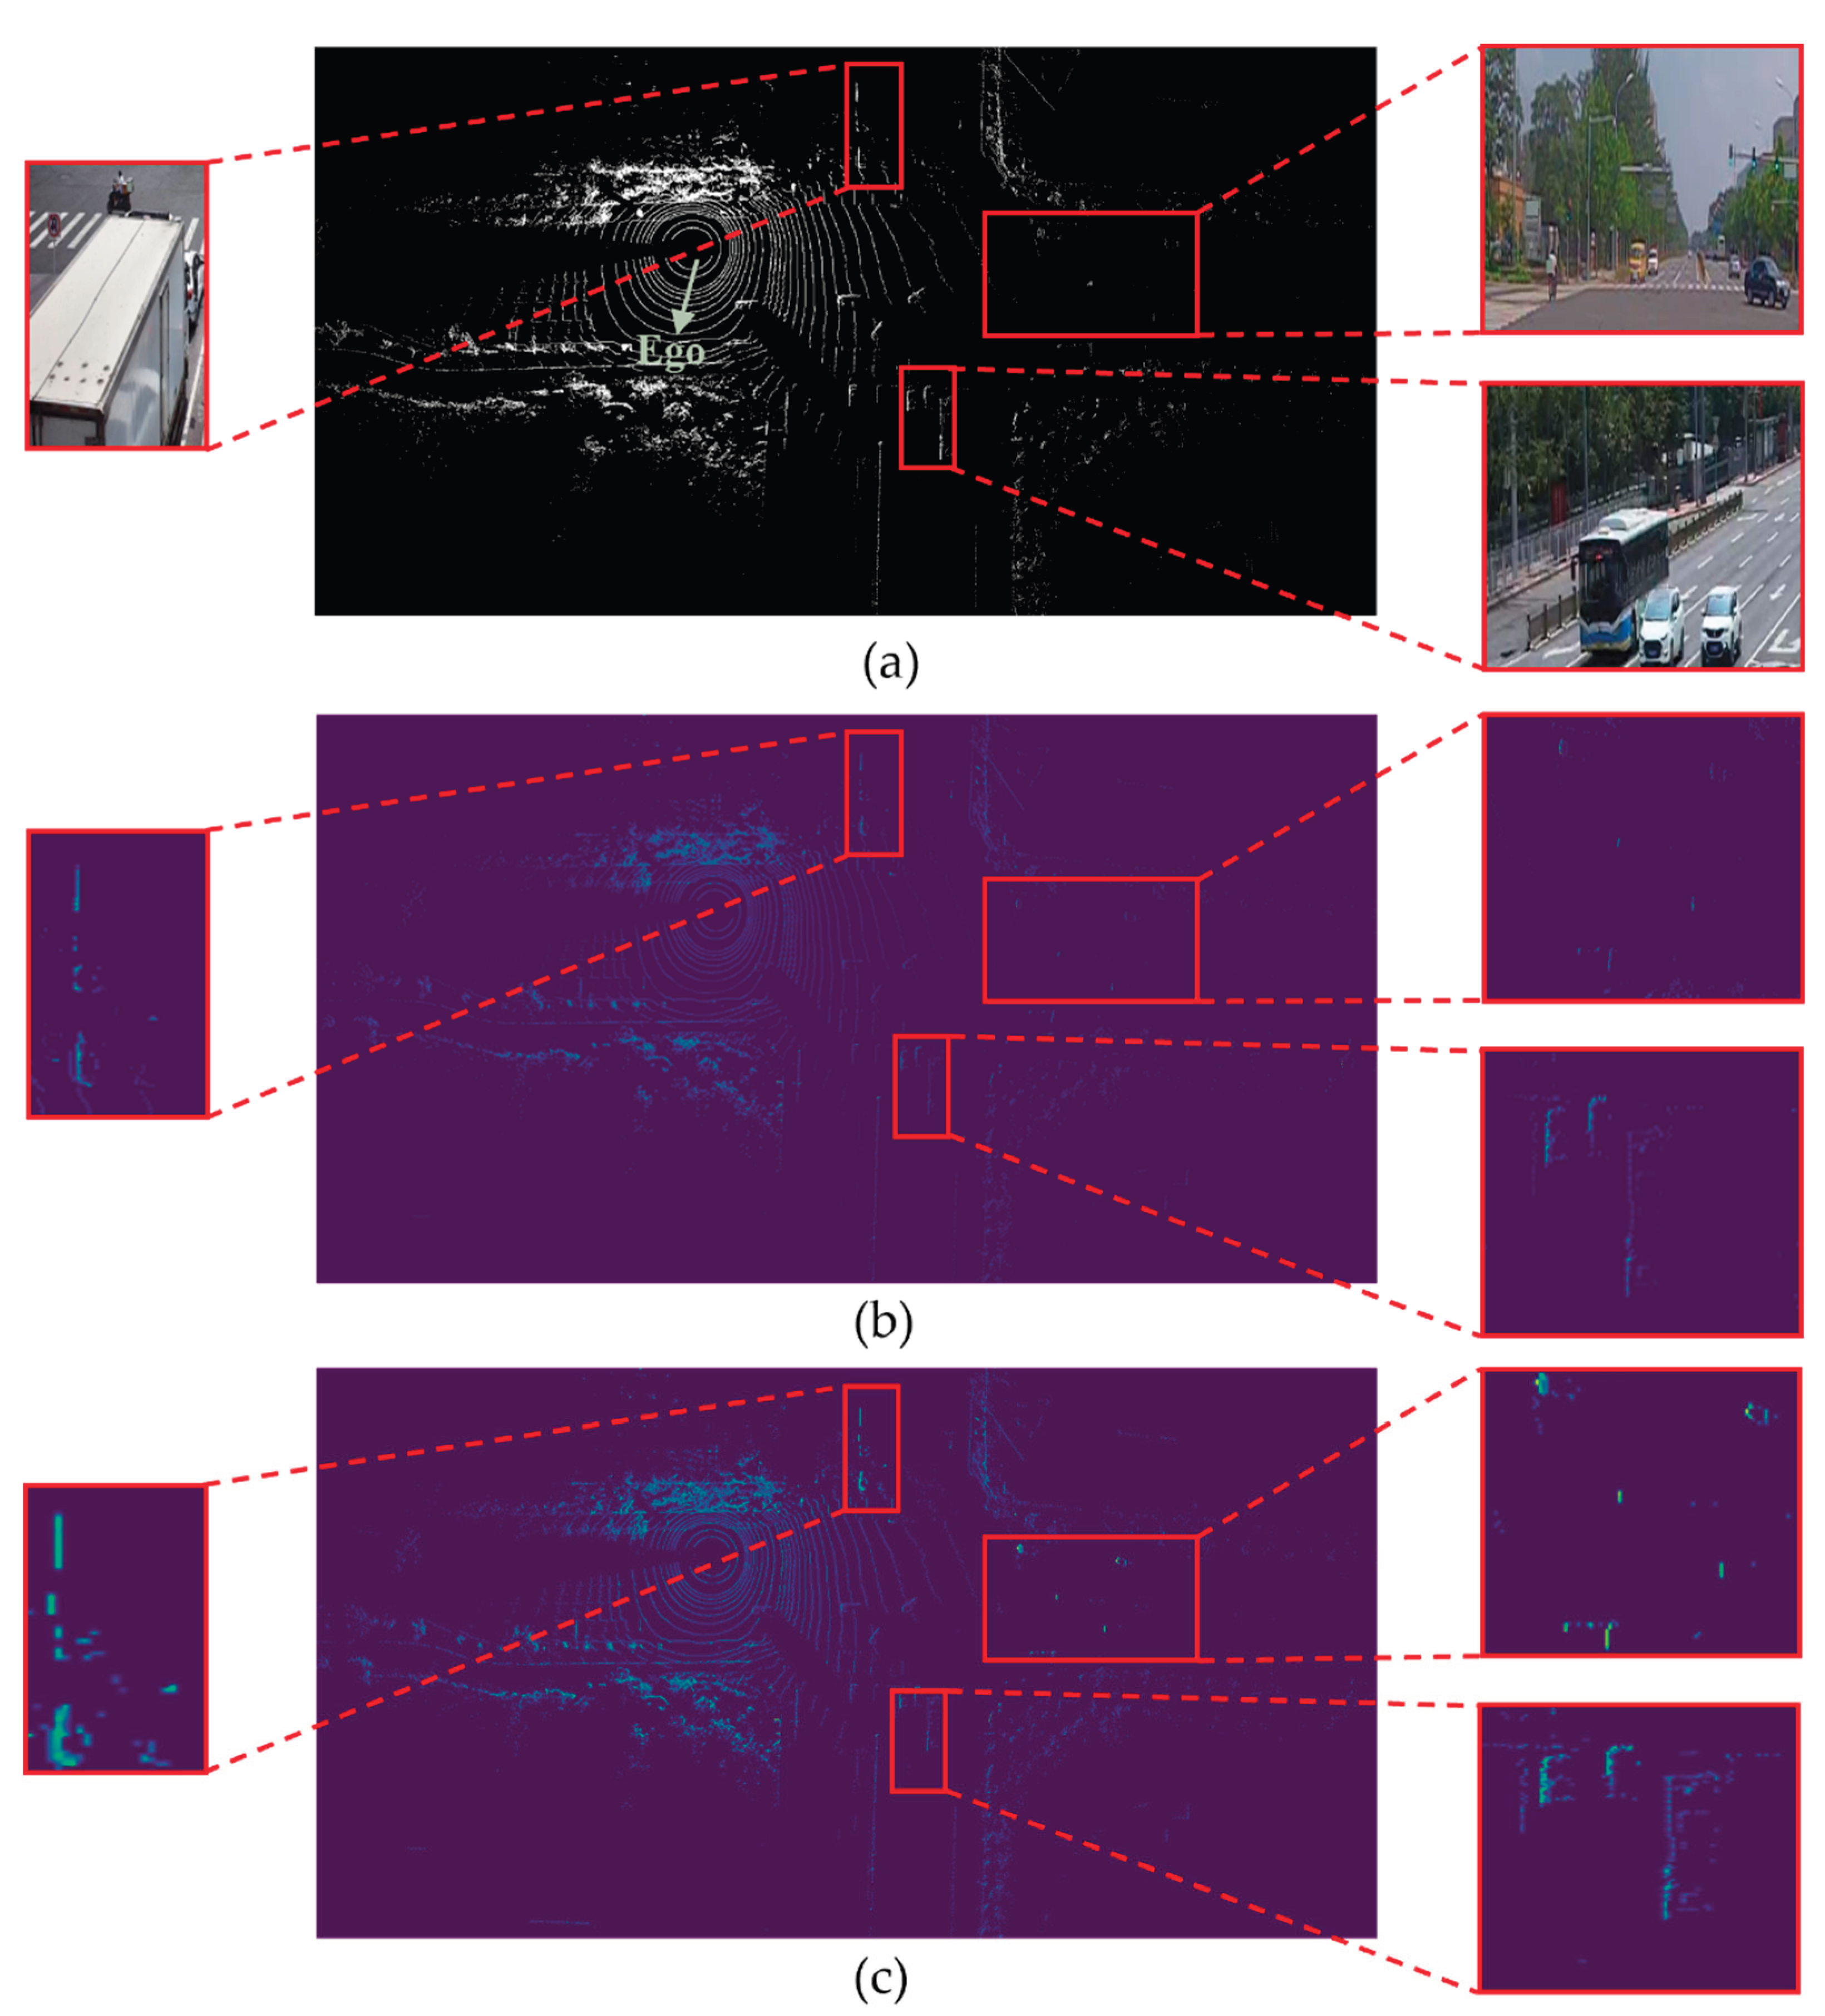
Figure 8.
Visualization Examples Comparing Single-Vehicle Perception and Cooperative Perception on the DAIR-V2X Dataset and the Self-Constructed Dataset.
Figure 8.
Visualization Examples Comparing Single-Vehicle Perception and Cooperative Perception on the DAIR-V2X Dataset and the Self-Constructed Dataset.
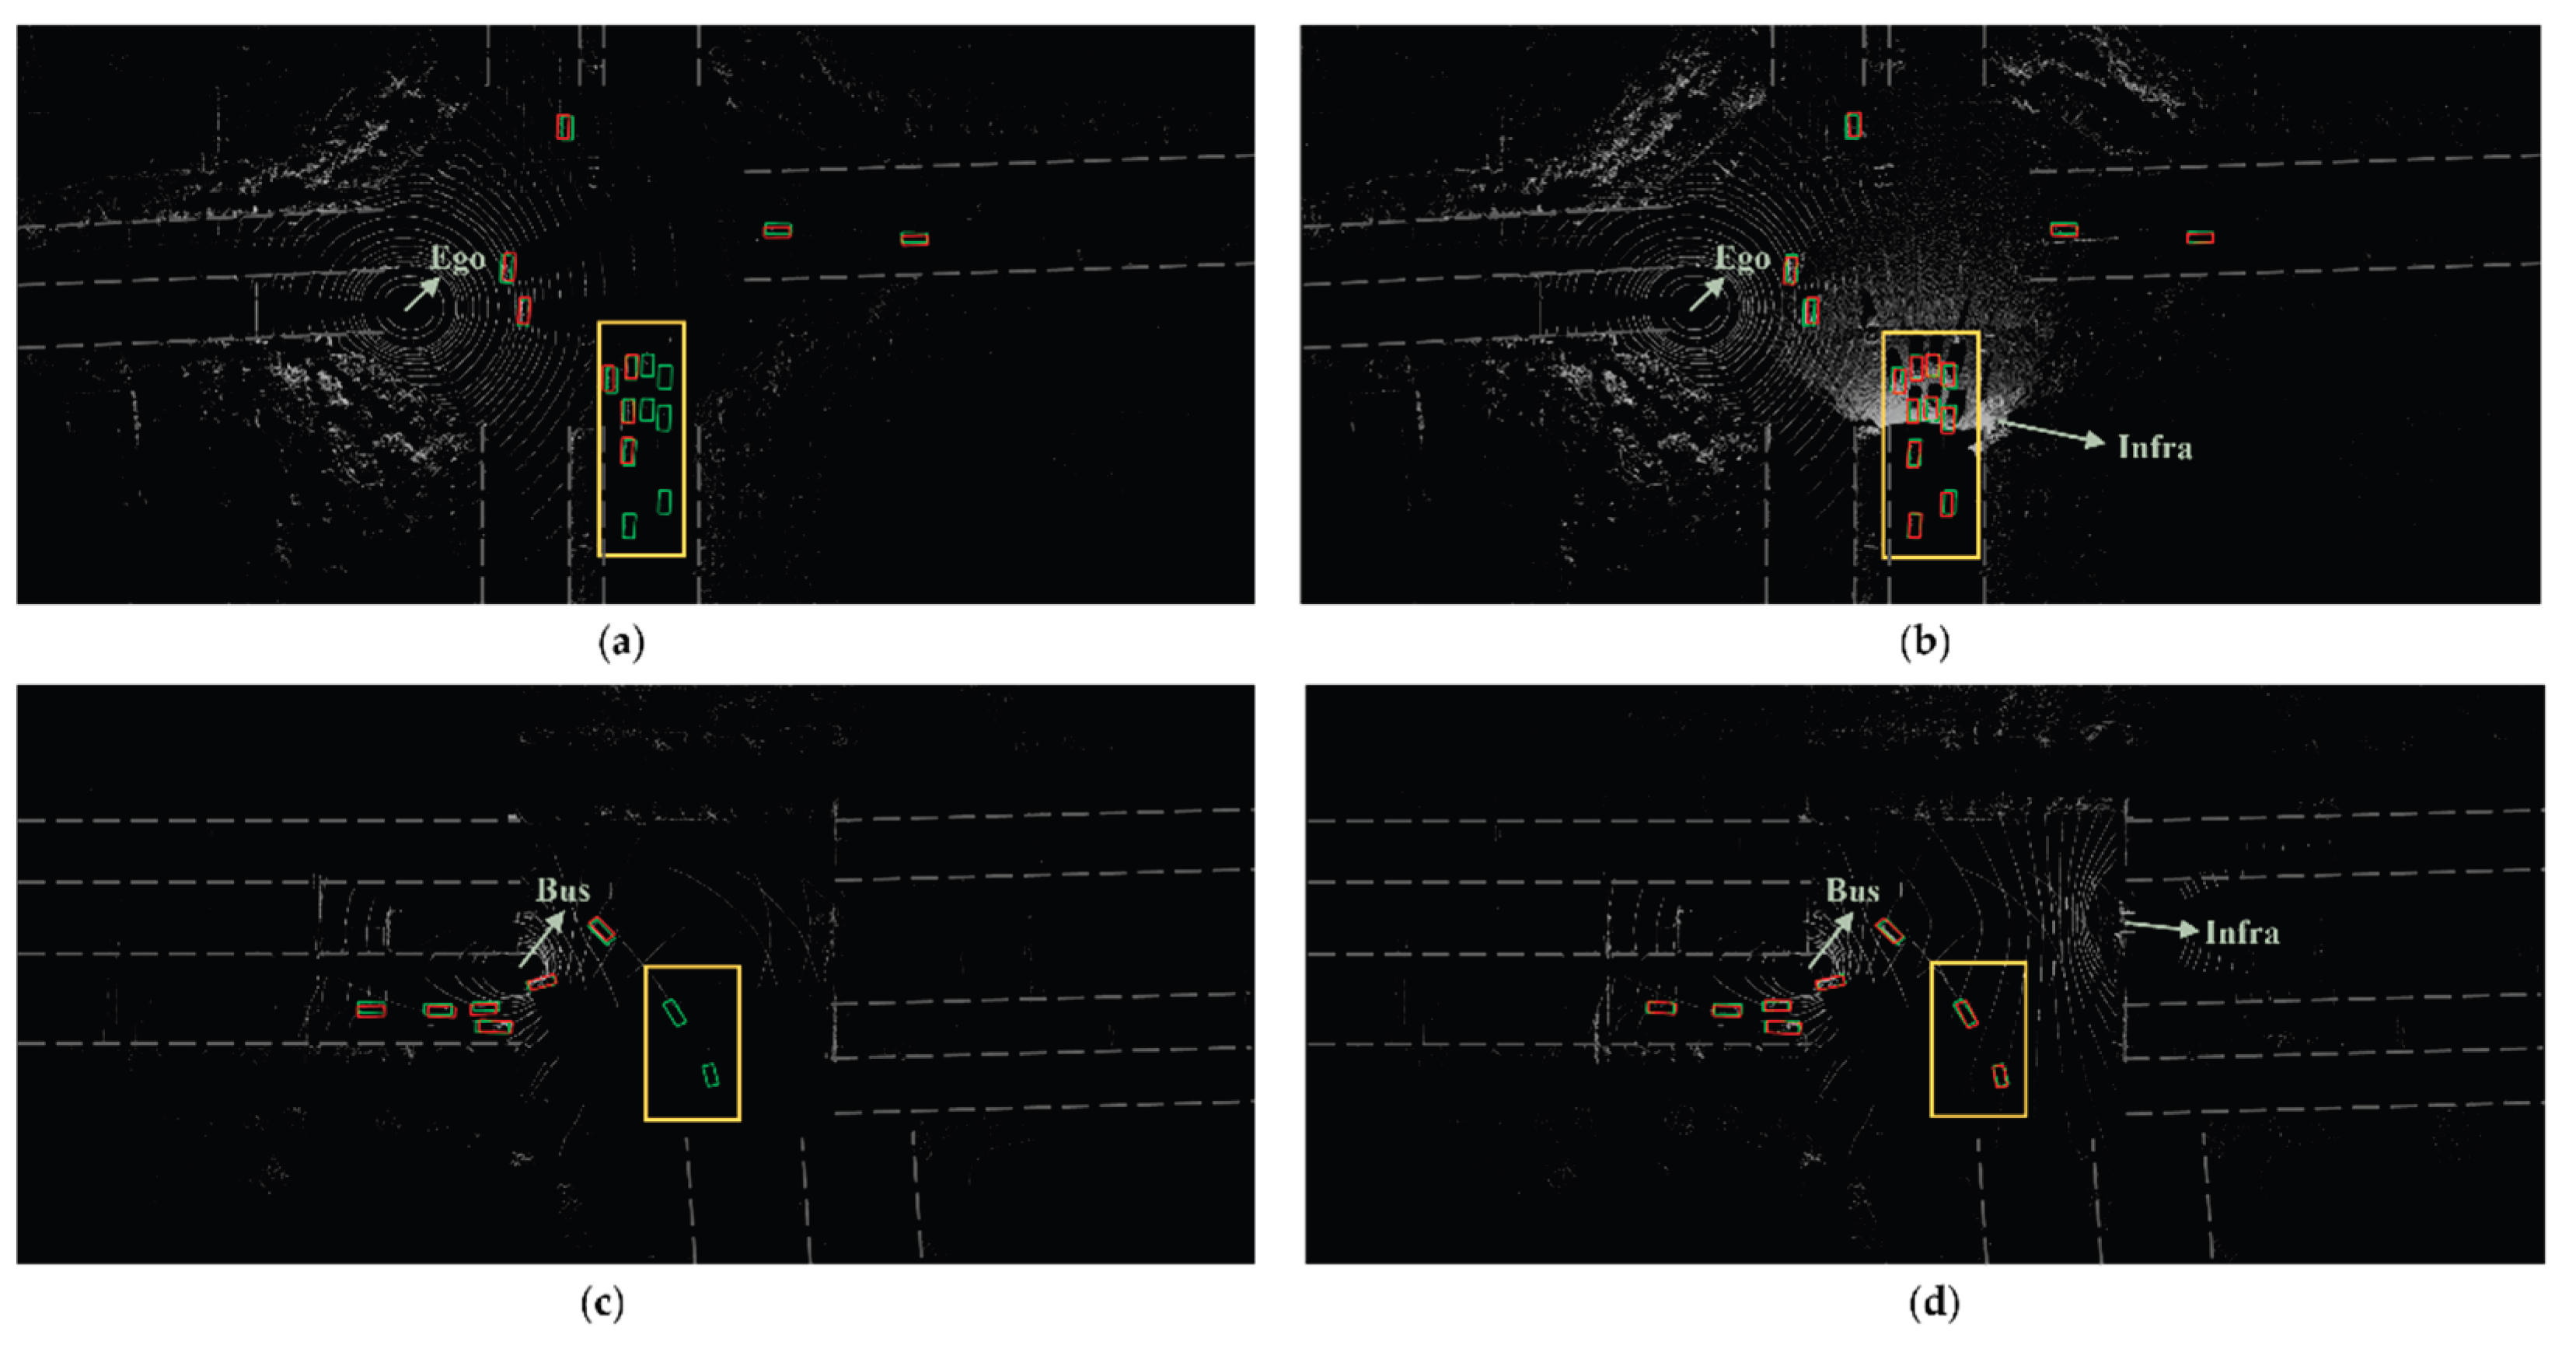
Figure 9.
Visualization of Detection Results of Different Cooperative Perception Methods on the DAIR-V2X Dataset. The rows represent different scenes (Scene 1, Scene 2, and Scene 3).
Figure 9.
Visualization of Detection Results of Different Cooperative Perception Methods on the DAIR-V2X Dataset. The rows represent different scenes (Scene 1, Scene 2, and Scene 3).
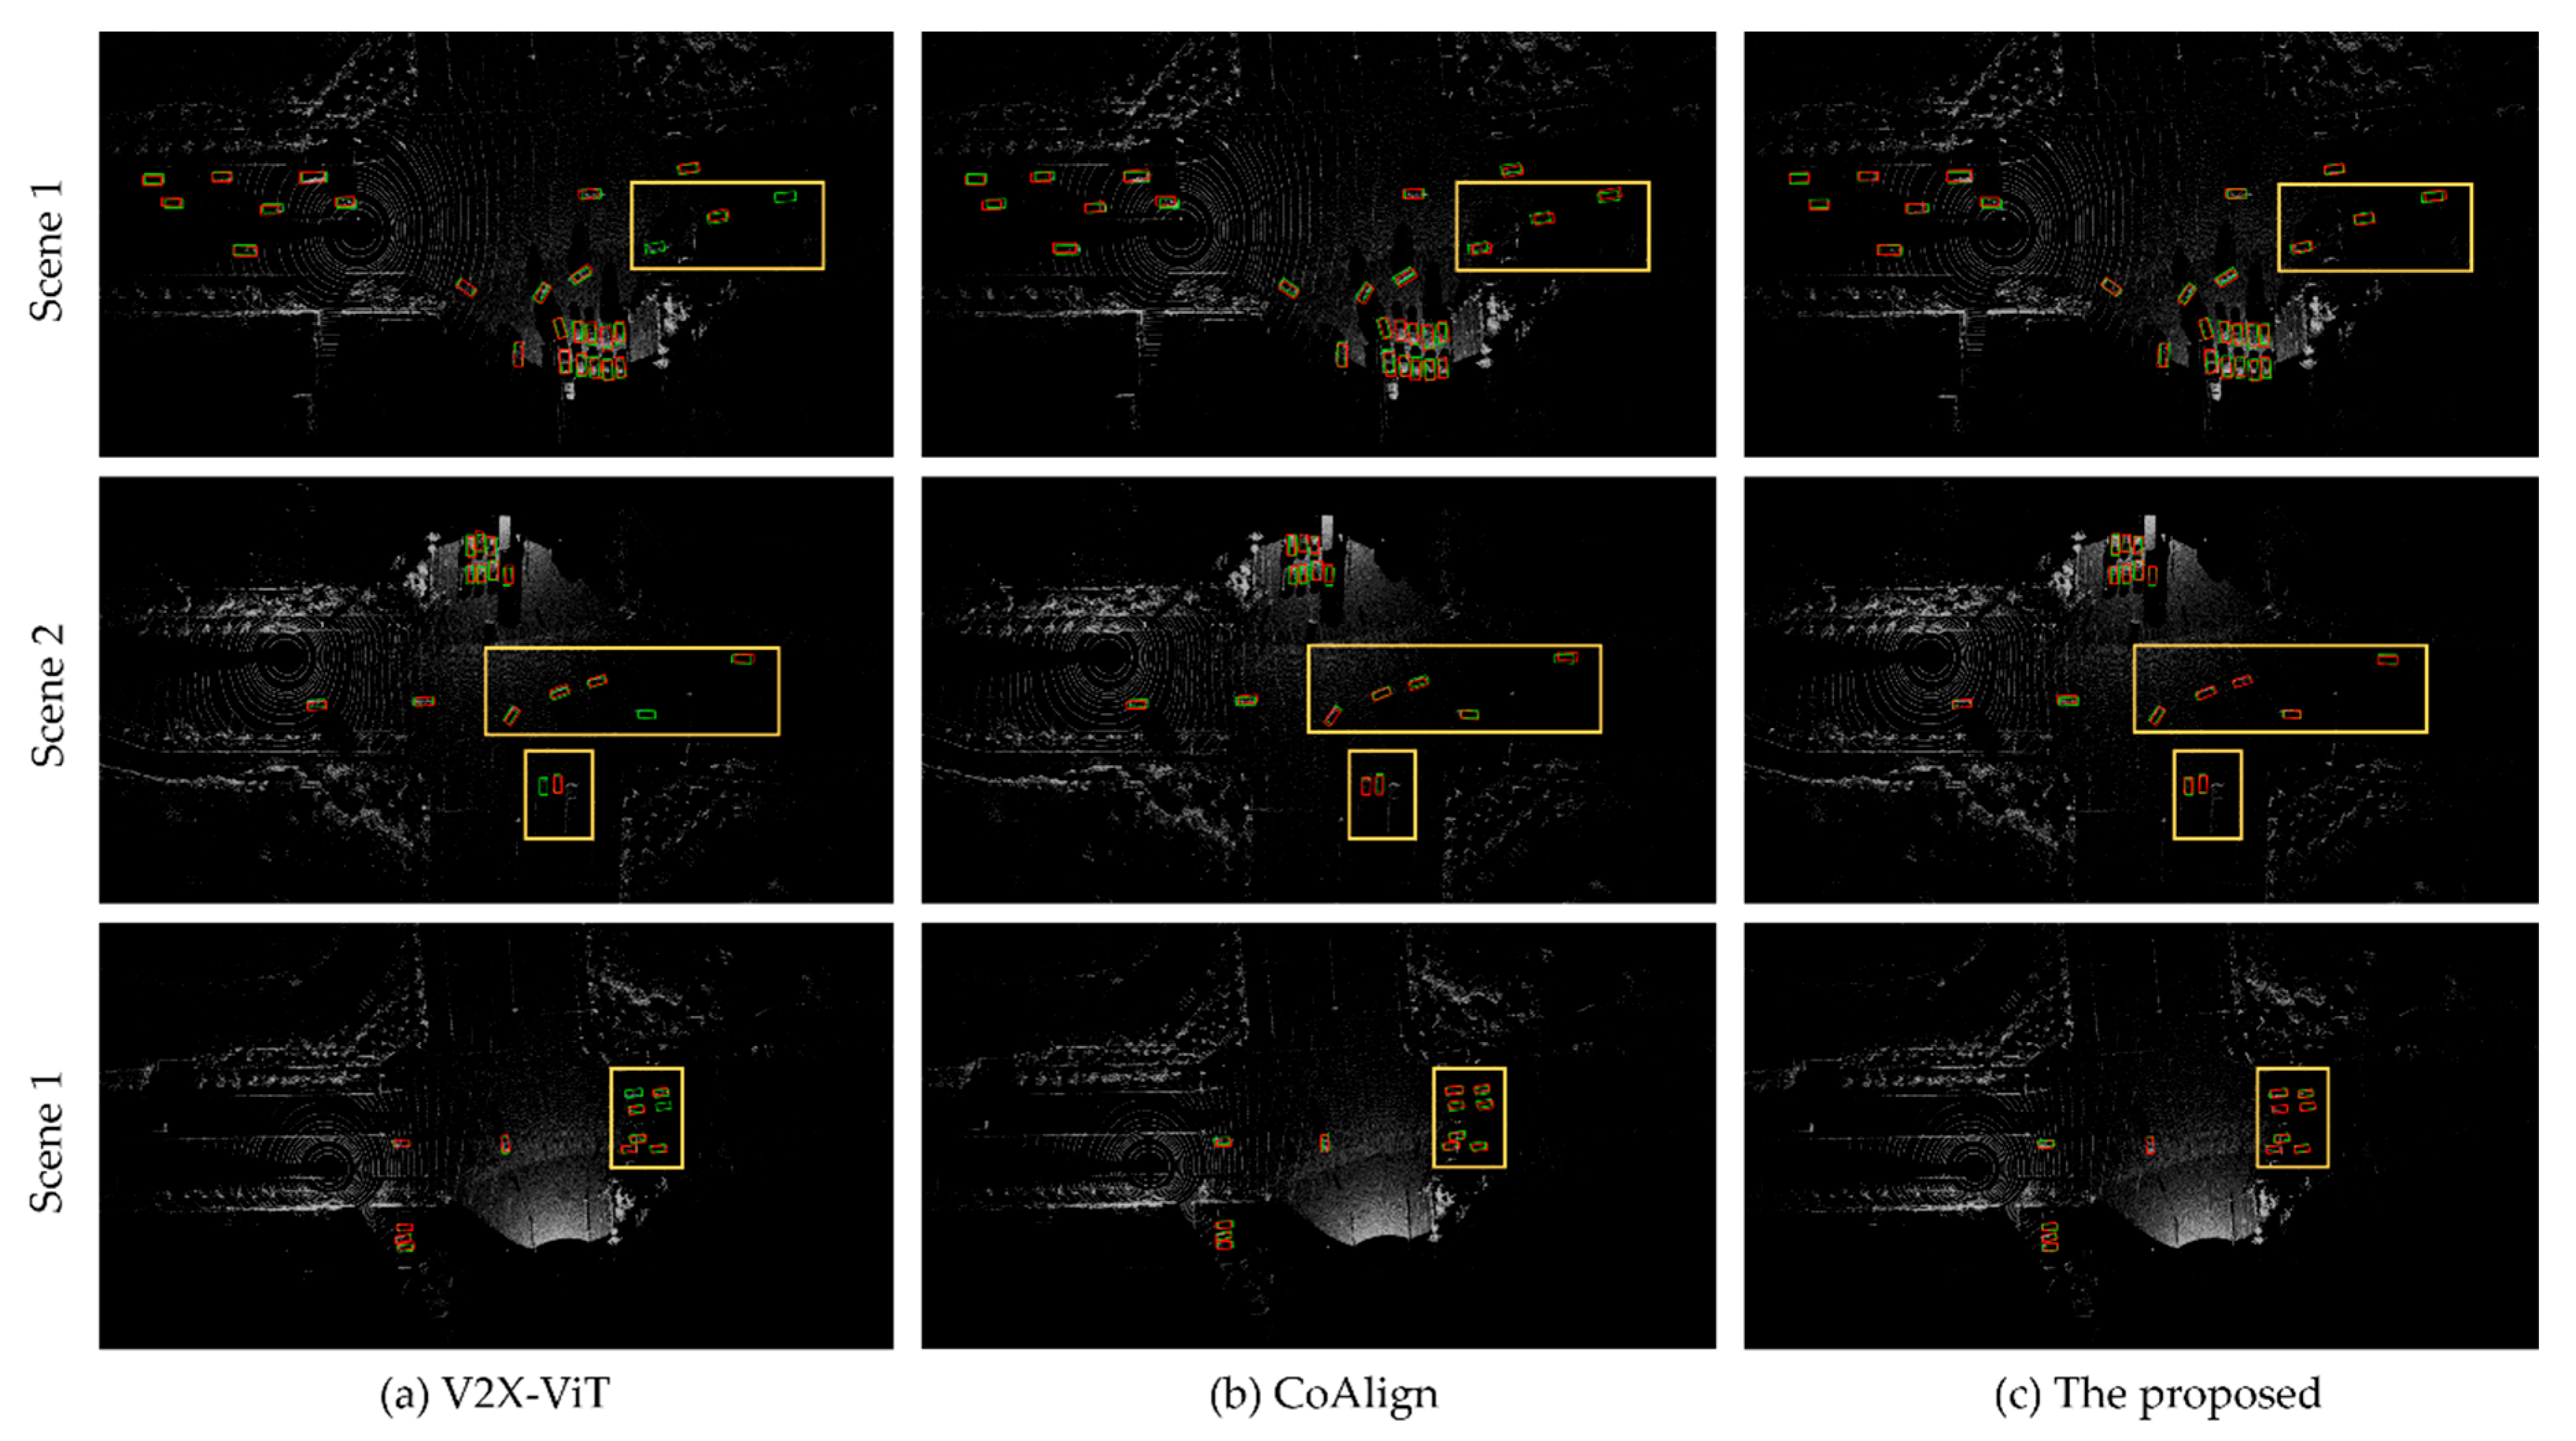
Figure 10.
Visualization of Detection Results Using Different Cooperative Perception Methods on the Self-Collected Dataset. The rows represent different scenes (Scene 1, Scene 2, and Scene 3).
Figure 10.
Visualization of Detection Results Using Different Cooperative Perception Methods on the Self-Collected Dataset. The rows represent different scenes (Scene 1, Scene 2, and Scene 3).
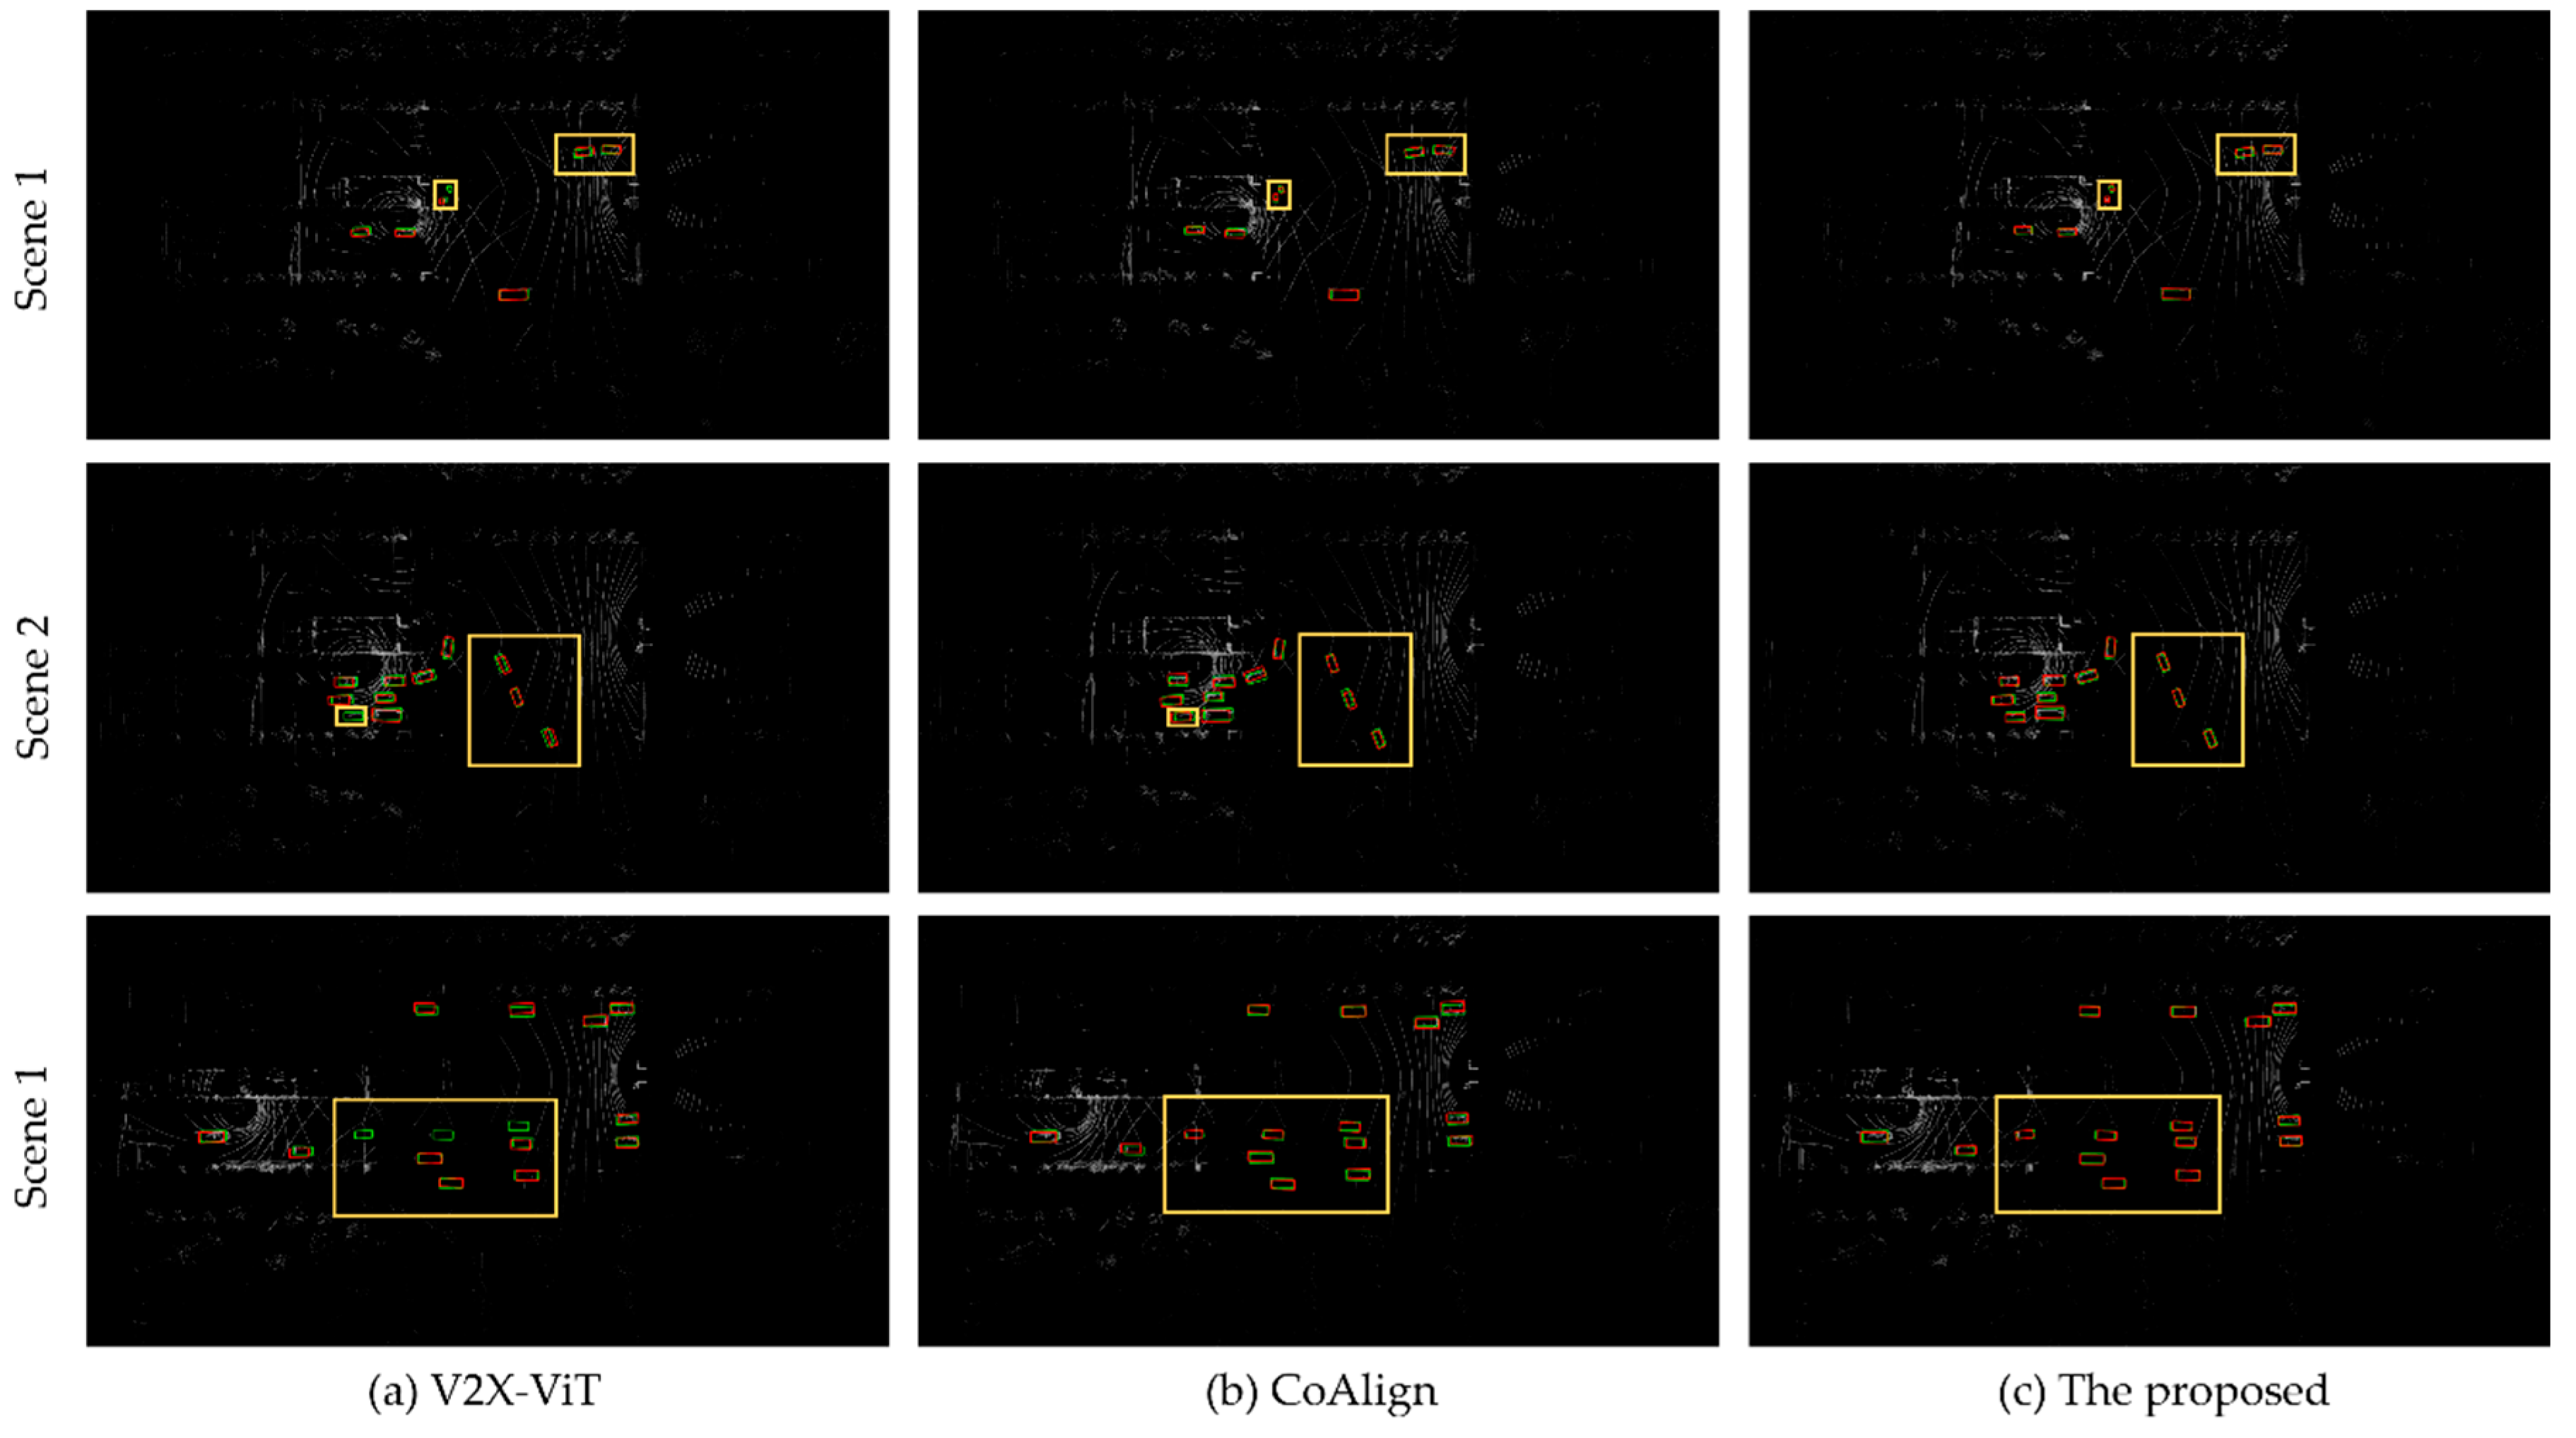

Table 1.
Specifications of the Self-Collected Dataset and Data Acquisition System.
| Category | Device | Description |
|---|---|---|
| Roadside Equipment | LiDAR Sensor | RoboSense 16-beam 10 Hz 360°/30° |
| Vehicle Equipment | LiDAR Sensor | RoboSense 16-beam 20 Hz 360°/30° |
| Positioning system | RTK-based high-precision localization | |
| System Integration | Synchronization | Hardware-trigger via Time Server |
| Calibration | Precise Extrinsic Calibration |
Table 2.
Detection Performance of Different Cooperative Perception Methods.
| Method | Fusion Type | DAIR-V2X | Self-collected | |||
|---|---|---|---|---|---|---|
| AP@0.5 | AP@0.7 | Inference Time (ms) |
AP@0.5 | AP@0.7 | ||
| Pointpillars [22] | None | 0.481 | - | 25.36 | 0.359 | - |
| LateFusion[28] | Late | 0.561 | - | 36.72 | 0.437 | - |
| Cooper[25] | Early | 0.617 | - | 69.86 | 0.561 | - |
| F-Cooper[7] | Intermediate | 0.734 | 0.559 | 35.17 | 0.712 | 0.546 |
| V2VNet[30] | Intermediate | 0.654 | 0.402 | 73.58 | 0.656 | 0.409 |
| CoBEVT[41] | Intermediate | 0.580 | 0.443 | 63.76 | 0.571 | 0.440 |
| V2X-ViT[32] | Intermediate | 0.585 | 0.449 | 161.04 | 0.564 | 0.453 |
| Where2comm[33] | Intermediate | 0.625 | 0.488 | 82.52 | 0.611 | 0.462 |
| CoAlign[42] | Intermediate | 0.741 | 0.594 | 97.41 | 0.668 | 0.547 |
| The proposed | Intermediate | 0.762 | 0.617 | 60.67 | 0.694 | 0.563 |
Table 3.
Ablation Study of the Proposed Modules.
| Ablation Setting | DAIR-V2X | Self-collected | ||||
|---|---|---|---|---|---|---|
| R-SENet | FBF-Net | SAFF | AP@0.5 | AP@0.7 | AP@0.5 | AP@0.7 |
| × | × | × | 0.689 | 0.531 | 0.607 | 0.488 |
| √ | × | × | 0.728 | 0.579 | 0.649 | 0.526 |
| √ | √ | × | 0.739 | 0.593 | 0.667 | 0.539 |
| √ | × | √ | 0.751 | 0.608 | 0.681 | 0.552 |
| √ | √ | √ | 0.762 | 0.617 | 0.694 | 0.563 |
Disclaimer/Publisher’s Note: The statements, opinions and data contained in all publications are solely those of the individual author(s) and contributor(s) and not of MDPI and/or the editor(s). MDPI and/or the editor(s) disclaim responsibility for any injury to people or property resulting from any ideas, methods, instructions or products referred to in the content. |
© 2026 by the authors. Licensee MDPI, Basel, Switzerland. This article is an open access article distributed under the terms and conditions of the Creative Commons Attribution (CC BY) license (http://creativecommons.org/licenses/by/4.0/).
Copyright: This open access article is published under a Creative Commons CC BY 4.0 license, which permit the free download, distribution, and reuse, provided that the author and preprint are cited in any reuse.


