
Submitted:
09 February 2026
Posted:
10 February 2026
You are already at the latest version
Abstract
This research explores the cause of uncertainty of rainfed and irrigated systems’ crop yield in the Philippines, and compares the impacts of nitrogen, phosphorus, and magnesium fertilizers on crop yield. To analyze these relationships, Spearman’s rank correlation coefficient is used to assess the associations among soil fertility, nutrient status, and crop yield. Our results show that an adequate water supply will enable effective nutrient use. Conversely, rainfed systems exhibit a strong negative relationship with nitrogen (r = –0.562, p < 0.001) and phosphorus (r = –0.565, p < 0.001) use, suggesting water-stress limitations. In contrast, irrigation reveals a high positive correlation with nitrogen application (r = 0.773, p < 0.001) and magnesium application (r = 0.346, p = 0.001), among other nutrients. To examine predictive potential, we applied several machine learning algorithms, including Decision Tree, Random Forest, Support Vector Regression (SVR), and K-Nearest Neighbors (KNN). When comparing model performance, the Random Forest model showed high robustness and consistency across both irrigated and rainfed regions, with only a minor increase in MAE (0.3107 to 0.3607), MSE (0.1790 to 0.2391), and RMSE (0.4230 to 0.4890), and still maintaining a high R² (from 0.8661 to 0.8095). These findings point towards the necessity for specific agriculture practices, with a focus on coordinated application management of water and fertilizers in irrigation fields and water conservation in rainfed fields, to improve rice roductivity and food security.
Keywords:
crop yield
; machine learning
; fertilization
1. Introduction
Rice (Oryza sativa L.) is the most valued agricultural product globally. It provides a significant share of global caloric intake and plays a critical role in global food security [1,4,16]. As a staple food for a large proportion of people, rice accounts for up to 50 percent of dietary caloric intake in many Asian countries, strongly linking it to food security. Each year, global rice production reaches approximately 520 million tons. This amounts to approximately 57 kilograms of milled rice per person and provides approximately 20 percent of the world’s calorie needs [11]. Given its social and economic importance, sustaining and improving rice production is essential for global food security. Longer growing seasons can boost annual yields. However, higher temperatures, especially in tropical and subtropical regions, can reduce crop suitability and yields by limiting fruit sets and accelerating crop development [15]. More than 3.5 billion people worldwide rely on rice as their staple food. Rice is cultivated as a versatile crop and consumed in forms such as brown rice, polished rice, and rice-derived protein products. In the Philippines, only 1.7 million of the 3.1 million hectares were irrigated, according to the National Irrigation Administration (NIA). While some farmers use alternate wetting and drying as a preferred irrigation technique to minimize water use, this method can result in lower yields [17].
The soil components cause fluctuations in both qualitative and quantitative features of rice yield. These counteract nitrogen surpluses or deficits, which may affect production. The three most important macronutrients for plants are nitrogen (N), phosphorus (P), and magnesium (Mg). Agricultural producers can make fertilizer practices more environmentally sound. Crop yields are determined by climate, crop type, soil status, and management techniques. Farmers can enhance production and soil health by adjusting fertilization practices to meet their crops’ nutrient requirements. This ensures sustainable agriculture [8]. Maintaining soil quality by applying organic fertilizer and avoiding excessive use of synthetic fertilizers supports healthy rice growth, optimal yields, and long-term sustainability.
Increased rice production in the government’s agricultural sector plays a vital role in improving the country’s economic status and contributes significantly to both the economy and farmers’ livelihoods [9,12,22]. Future challenges in sustainable rice production require effective management strategies and precise timing, including the adoption of alternate wetting and drying [17]. The development of climate-resilient rice varieties requires substantial scientific effort to mitigate the effects of climate change, such as heat, cold, and drought [10]. Enhancing rice’s heat stress tolerance through genetic improvements is particularly crucial; thus, several issues associated with heat stress in crops urgently require attention [24].
In the Philippines, water scarcity and sustainability are pressing concerns for farmers. Implementing Alternative Wetting and Drying (AWD) is a practical approach that uses intervals of soil drying before re-irrigation, significantly reducing overall water use. Various water-saving methods for estimating rice crop water requirements enable farmers to improve the performance of irrigated rice agronomy [2]. This method can save up to 30-40
Achieving long-term agricultural sustainability requires collaborative efforts, including farmer education and supportive government policies that promote the adoption of innovative water-saving technologies [19,21]. Addressing these challenges through climate-smart agricultural practices, balanced nutrient management, and advanced irrigation technologies can enhance rice yield without compromising global food security [14,15]. The integration of machine learning (ML) and new technologies provides valuable insights for agricultural planning. Forecasting crop yield is a complex but essential process, and ML can improve yield prediction depending on various factors [23].
The Philippines is a leading rice producer in Southeast Asia, with a crucial rice sector that includes many traders and retailers, contributing significantly to the nation’s economy [9]. The government emphasizes enhancing rice productivity and competitiveness to improve food security [12]. A study of [7] indicates that while productivity increases, there are no significant differences in ecotoxicity, eutrophication potential, or nutrient balance between irrigated and rainfed farms, suggesting that environmental impacts and data-driven agricultural methods merit further analysis.
Continuing the discussion on environmental and management influences on crop yields, the geographic trend analysis available [13] estimates yields in the Philippines using data from PAGASA and the Philippine Statistics Authority. This approach helps faare not yet available at the time of submission, please indicateops, and improve harvesting efficiency. Crop forecasting not only increases production rates but also has the potential to benefit the Philippine economy, raising questions about the global applicability of these data-driven methods.
[21]. Applying these analytical methods beyond the Philippines, this research seeks to enhance agricultural forecasting in Africa by analyzing five crops and compiling a comprehensive dataset. This data-driven framework simultaneously assesses crop yields across multiple crops, accounting for both positive and negative environmental factors, such as soil properties. For successful ML/AI modeling, it is essential to address overfitting and underfitting to achieve optimal generalization performance. In this regard, lessons from various regions continue to inform advancements in prediction methods.
Similarly, [6] utilized various machine learning techniques—such as ANNs, DNNs, ELMs, RFs, and SVRs—for agricultural predictions, demonstrating their performance across different locations. The evaluation revealed that the second and third test areas showed competitive or superior performance compared to others. Notably, the best results were linked to methods that processed more information, although SVR struggled in zone A. Additionally, incorporating more features, such as air moisture, generally improved outcomes, especially in zone B. While ANN, RF, and ELM excelled with fewer input features, DNNs were superior when a larger feature set was available, highlighting the importance of tailoring algorithms to specific regions and feature configurations.
2. Materials and Methods
This research selects Spearman’s Rank Correlation as the primary statistical method. It assesses the strength and direction of relationships among soil fertility, nutrient levels, and crop yield in irrigated and rainfed regions. The researcher also aims to categorize the data, identify patterns, and make predictions from secondary data. These data are processed using machine learning techniques to develop models based on either the test or the training dataset.
Sampling Technique
The data come from the PalayStat System, a core initiative of the Philippine Rice Research Institute, overseen by the Socioeconomics Division [18], and from the Soil Health Assessment National Soil Sampling [3]. Due to heterogeneity in the dataset, which encompasses various levels of soil fertility, nutrient status, and crop-yield indicators, a stratified sampling method is employed. This technique divides the population into distinct subgroups (strata) based on characteristics such as irrigation type (irrigated and rainfed).

Table 1.
Data Attributes and their Values.
| Attributes | Values |
|---|---|
| Soil Fertility (Irrigated) | 0.0, 9.59, 6.61 |
| Soil Fertility (Rainfed) | 25.00, 15.41, 18.39 |
| Nitrogen (Irrigated) | 21.79, 30.27, 5.91 |
| Nitrogen (Rainfed) | 22, 2,558, 153 |
| Phosphorus (Rainfed) | 00, 2,566, 152 |
| Phosphorus (Irrigated) | 4,394, 6,826, 5.052 |
| Magnesium (Irrigated) | 0, 0, 0, 81.0 |
| Magnesium (Rainfed) | 17,291, 0, 2, 4{,}447 |
| Rainfed Area (HA) | 24,167.00, 17,812.00 |
| Yield Rainfed Area (MT) | 2.74, 3.53, 3.23, 2.25 |
| Irrigated Area (HA) | 54,639.00, 77,589.00 |
Data Source
The import data was collected from various government offices. The primary source was the PalayStat System, a large project of the Philippine Rice Research Institute [18]. Additional data came from the Soil Health Assessment National Soil Sampling [3]. The researcher requested data by emailing the concerned agency. The request adhered to ethical guidelines. After approval, the agency sent an email containing the required research data.
Statistical Analysis
The researcher aims to analyze correlations in rainfed and irrigated rice crop production. Essential characteristics include soil fertility levels, nutrient content (nitrogen, phosphorus, magnesium), and other crop production metrics. The data includes both continuous and possibly ordinal types. To assess the direction and strength of relationships among crop yield, nutrient concentration, and soil fertility, we used Spearman’s Rank Correlation as the primary statistical test.
Pre-Processing
Effective data cleaning is essential for developing precise and credible crop-yield models. This is especially true when dealing with real agricultural data, which may have missing values, outliers, and inconsistencies. For this process, we used the Interquartile Rank, specifically the winsorizing method. This approach identifies extreme values and lessens their influence while keeping the original data points.
Model Selection and Training
The researchers applied several machine learning models, including Decision Trees, Random Forests, Support Vector Regression, and K-Nearest Neighbor. Its accuracy rate determined the best-fit model. We divided the data into 80 percent for training and 20 percent for testing. This approach helps avoid overfitting and improves generalization to new data.
Notation:
Like this,
- and like this.
- yi: Actual (observed) value of the i-th observation.
- yi: Predicted value of the i-th observation.
- y: The mean (average) of the observed values.
- n: The number of training samples (observations).
To determine which model performs best, we compared values across various computational approaches and examined each model’s interpretability, computational efficiency, and risk of overfitting. This careful assessment provides a clear overview of each model’s strengths and weaknesses, helping guide the decision on the best approach.
Figure 1.
Learning Architecture on Crop Yield Variability.
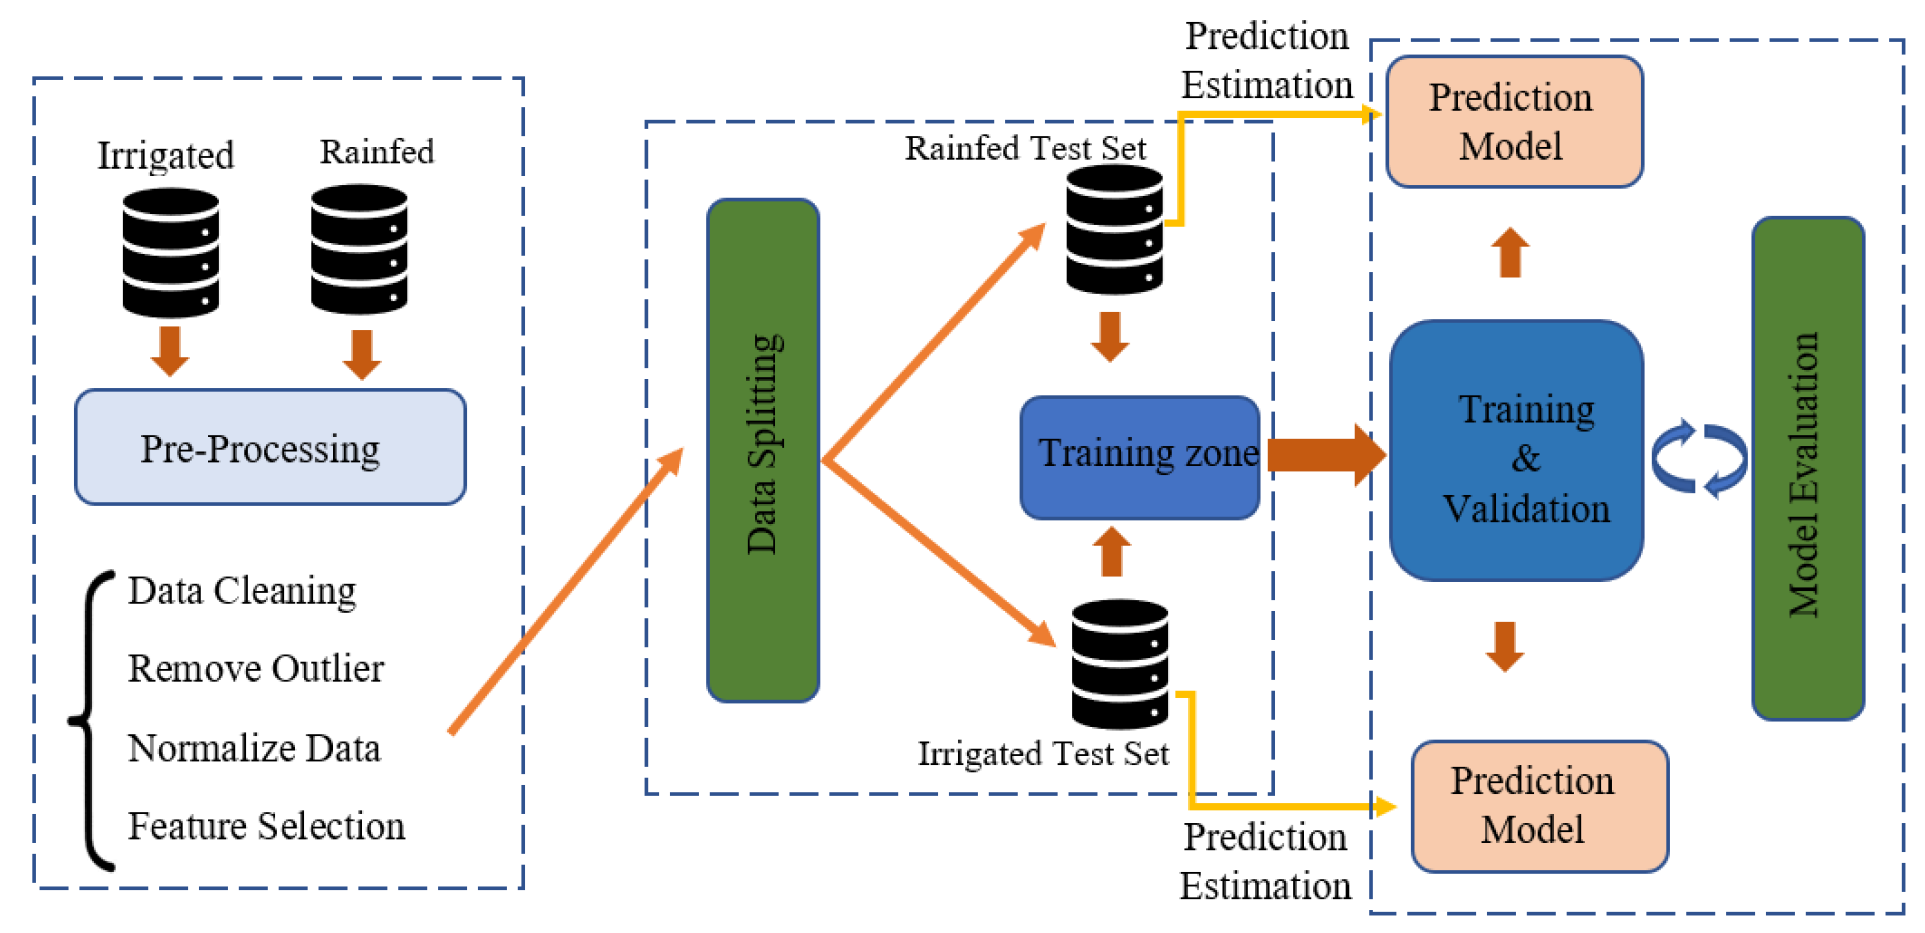
In the final stage, to enhance production and resource estimation under varying environmental conditions, it is essential to evaluate contrasting predictions to assess the model’s effectiveness. This ensures precise, accurate, and dependable agricultural data.
3. Results
Table 2 shows that nitrogen application under irrigated conditions has a strong positive correlation (r = 0.773, p < 0.001), indicating that higher iris strongly positively correlated the higher nit-single-line caption, micronutrient application shows a moderately positive correlation, with greater irrigation associated with higher magnesium content (r = 0.346, p = 0.001). This shows that controlling irrigation positively affects micronutrient application. However, there was no significant correlation between irrigation and crop yield (r = 0.142, p = 0.199), irrigated area (r = 0.116, p = 0.296), or phosphorus application (r = 0.036, p = 0.749). The findings indicate that while irrigation positively impacts micro-nutrients and nitrogen, its effect on crop yield, irrigated area, and phosphorus application is negligible
Table 3.shows that plant density is strongly negatively correlated with both nitrogen fertilization (Rainfed Nitrogen Content, r = -0.562, p < 0.001) and phosphorus fertilization (Rainfed Potassium Content, r = -0.565, p < 0.001). As fertilizer rates rise, rainfed nitrogen and phosphorus concentrations drop, likely due to environmental limits or poor soil fertility. Fertilization was not significantly correlated with micronutrient supplementation (Rainfed Magnesium Content, r = 0.083, p = 0.454), rainfed area (Rainfed Area, r = 0.127, p = 0.251), or crop yield (Rainfed Yield, r = -0.149, p = 0.178). These results highlight the complexity of nutrient management under rainfed conditions and show that macronutrient fertilization has little effect on micronutrient practices.
Figure 2 Illustrates how four regression models, Decision Tree, Random Forest, SVR, and KNN, perform in forecasting rainfed area yield. Mean Absolute Error (MAE), Mean Squared Error (MSE), Root Mean Squared Error (RMSE), and R-squared (R2) are significant regression measures that have been used to compare the models.
Figure 3 shows how well various regression models—Decision Tree, Random Forest, SVR, and KNN—perform in predicting the yield under irrigated conditions based on R-squared (R2), Mean Absolute Error (MAE), Mean Squared Error (MSE), and Root Mean Squared Error (RMSE) values.
Table 4. compares model performance in irrigated and rainfed environments using four criteria: Mean Absolute Error (MAE), Mean Squared Error (MSE), Root Mean Squared Error (RMSE), and R-squared (R²). The Decision Tree model performed worse in rainfed conditions, with MAE increasing from 0.3272 to 0.4568, MSE from 0.1868 to 0.4206, RMSE from 0.4322 to 0.6486, and R2 dropping from 0.8602 to 0.6648. The Random Forest model remained stable, showing high R2 values (0.8661 to 0.8095) and only modest error increases: MAE (0.3107 to 0.3607), MSE (0.1790 to 0.2391), and RMSE (0.4230 to 0.4890). The K-Nearest Neighbors (KNN) method showed inconsistent performance with MSE, RMSE, and R2 changing from 0.5973 to 0.4927, 0.7728 to 0.7020, and 0.5529 to 0.6074, while MAE increased from 0.5186 to 0.5804. Overall, the Random Forest model showed high accuracy and reliability. This is supported by [2] and [23], who note its ability to prevent overfitting and handle unbalanced datasets.
4. Conclusions
Soil nutrients, fertilization, and irrigation are strongly linked in both rainfed and irrigated systems. In irrigated areas, high nitrogen and micronutrient use were tied to adequate water. In rainfed systems, more fertilization was linked to less nutrient availability, likely from water scarcity. These findings suggest adjusting agricultural practices. In irrigated areas, manage water and nutrients together. In rainfed zones, prioritize water saving and soil quality.
The Random Forest model, which combines many decision trees and averages their outcomes, was the most powerful and dependable for both irrigated and rainfed zones. In rainfed areas, the Decision Tree model’s accuracy and fit, referring to how well the model matches observed data, dropped sharply. However, Random Forest still gave strong predictions with only slight changes in performance metrics. The Support Vector Regression (SVR) model, which predicts continuous values by finding the best-fitting line in a high-dimensional space, performed poorly in both cases. The K-Nearest Neighbors (KNN) model, which makes predictions based on the closest data points, showed inconsistent results: it improved in rainfed areas but had higher Mean Absolute Error (MAE), which measures average prediction errors. Based on MAE, Mean Squared Error (MSE), Root Mean Squared Error (RMSE), and R-squared (a measure of prediction quality), Random Forest is the best model for prediction in these settings.
Socioeconomic and policy-oriented research remains essential. Assessing the cost-effectiveness of implementing Random Forest-based decision support systems in agricultural settings can inform strategies for large-scale adoption. Additionally, policy frameworks that promote water-saving technologies and soil health initiatives in rainfed regions facilitate sustainable agricultural development. The development of accessible digital tools that convert complex model outputs into actionable recommendations can enhance the practical application of data science, enabling farmers to make informed decisions in diverse environmental contexts.
References
- Agbowuro, G. O.; Afolabi, M. S.; Olamiriki, E. F.; Awoyemi, S. O. Rice blast disease (Magnaporthe oryzae): A menace to rice production and humanity. 2020. [Google Scholar]
- Arouna, A.; Dzomeku, I. K.; Shaibu, A. G.; Nurudeen, A. R. Water management for sustainable irrigation in rice (Oryza sativa L.) production: A review. Agronomy 2023, 13(6), 1522. [Google Scholar] [CrossRef]
- Bureau of Soils and Water Management. BSWM | Bureau of Soils and Water Management website. https://www.bswm.da.gov.ph/ (accessed on 5 December 2024).
- Chen, T.; Zhao, Y.; Zhang, W.; Yang, S.; Ye, Z.; Zhang, G. Variation of the light stable isotopes in the superior and inferior grains of rice (Oryza sativa L.) with different geographical origins. Food Chemistry 2016, 209, 95–98. [Google Scholar] [CrossRef] [PubMed]
- Choudhary, D.; Banskota, K.; Khanal, N. P.; McDonald, A. J.; Krupnik, T. J.; Erenstein, O. Rice subsector development and farmer efficiency in Nepal: Implications for further transformation and food security. Frontiers in Sustainable Food Systems 2022, 5, 740546. [Google Scholar] [CrossRef]
- Chergui, N. Durum wheat yield forecasting using machine learning. Artificial Intelligence in Agriculture 2022, 6, 156–166. [Google Scholar] [CrossRef]
- Darré, E.; Cadenazzi, M.; Mazzilli, S. R.; Rosas, J. F.; Picasso, V. D. Environmental impacts on water resources from summer crops in rainfed and irrigated systems. Journal of Environmental Management 2019, 232, 514–522. [Google Scholar] [CrossRef] [PubMed]
- Faghih, H.; Behmanesh, J.; Rezaie, H.; Khalili, K. Climate and rainfed wheat yield. Theoretical and Applied Climatology 2021, 144(1), 13–24. [Google Scholar] [CrossRef]
- Hilado, A.; Hugo, J. S.; Kodama, H. D.; Lebite, J. P.; Fronda, J. G. Rice value chain analysis: Rice seed production as a profitable agribusiness in Nueva Ecija. International Journal of Advanced Engineering, Management and Science 2023, 9(6). [Google Scholar] [CrossRef]
- Hussain, Q.; Shi, J.; Scheben, A.; Zhan, J.; Wang, X.; Liu, G.; et al. Genetic and signalling pathways of dry fruit size: Targets for genome editing-based crop improvement. Plant Biotechnology Journal 2020, 18(5), 1124–1140. [Google Scholar] [CrossRef]
- Kontgis, C.; Schneider, A.; Ozdogan, M.; Kucharik, C.; Tri, V. P. D.; Duc, N. H.; Schatz, J. Climate change impacts on rice productivity in the Mekong River Delta. Applied Geography 2019, 102, 71–83. [Google Scholar] [CrossRef]
- Lapada, A. A. Rice production monitoring system in the Philippines. Indian Journal of Science and Technology 2019, 12(2), 1–9. [Google Scholar] [CrossRef]
- Lee, J. E.; Molino, W.; Renegado, F.; Vargas, D. Regional prediction of crop yield success rate in the Philippines using geographic trend analysis algorithm. Journal of Electrical Systems 2024, 20(4s), 703–710. [Google Scholar] [CrossRef]
- Li, H.; Zhang, Y.; Sun, Y.; Liu, P.; Zhang, Q.; Wang, X.; et al. Long-term effects of optimized fertilization, tillage and crop rotation on soil fertility, crop yield and economic profit on the Loess Plateau. European Journal of Agronomy 2023, 143, 126731. [Google Scholar] [CrossRef]
- Mbow, C.; Rosenzweig, C. E.; Barioni, L. G.; Benton, T. G.; Herrero, M.; Krishnapillai, M.; Diouf, A. A. Food security; IPCC: Geneva, 2020; No. GSFC-E-DAA-TN78913. [Google Scholar]
- Muthayya, S.; Sugimoto, J. D.; Montgomery, S.; Maberly, G. F. An overview of global rice production, supply, trade, and consumption. Annals of the New York Academy of Sciences 2014, 1324(1), 7–14. [Google Scholar] [CrossRef] [PubMed]
- Oo, A. Z.; Sudo, S.; Inubushi, K.; Mano, M.; Yamamoto, A.; Ono, K.; et al. Methane and nitrous oxide emissions from conventional and modified rice cultivation systems in South India. Agriculture, Ecosystems and Environment 2018, 252, 148–158. [Google Scholar] [CrossRef]
- PhilRice – Socioeconomics Division. Estimated production, area harvested and yield per hectare (PAY). n.d. https://palaystat.philrice.gov.ph/.
- PhilRice. Policy imperatives to increase uptake of the Alternate Wetting and Drying Technology. Department of Agriculture–Philippine Rice Research Institute, 2022; Vol. 11. https://www.philrice.gov.ph/wp-content/uploads/2022/10/RS4DM-Alternate-Wetting-Drying-Technology-Vol.-11.pdf.
- TraceX Technologies. Sustainable rice farming in Philippines: Enhancing food security. TraceX. 12 February 2025. https://tracextech.com/sustainable-rice-farming-in-philippines/.
- Razavi, M. A.; Nejadhashemi, A. P.; Majidi, B.; Razavi, H. S.; Kpodo, J.; Eeswaran, R.; et al. Enhancing crop yield prediction in Senegal using advanced machine learning techniques and synthetic data. Artificial Intelligence in Agriculture 2024, 14, 99–114. [Google Scholar] [CrossRef]
- Taer, E.; Taer, A. Cultivating tomorrow: A comprehensive review of agricultural innovations in the Philippines (2018–2023). Agricultural Research 2024, 13(4), 623–635. [Google Scholar] [CrossRef]
- Van Klompenburg, T.; Kassahun, A.; Catal, C. Crop yield prediction using machine learning: A systematic literature review. Computers and Electronics in Agriculture 2020, 177, 105709. [Google Scholar] [CrossRef]
- Xing, Y. H.; Lu, H.; Zhu, X.; Deng, Y.; Xie, Y.; Luo, Q.; Yu, J. How rice responds to temperature changes and defeats heat stress. Rice 2024, 17(1), 73. [Google Scholar] [CrossRef] [PubMed]
- Yan, Y.; Wang, Y.; Li, J.; Zhang, J.; Mo, X. Crop yield time-series data prediction based on multiple hybrid machine learning models. arXiv 2025, arXiv:2502.10405. [Google Scholar] [CrossRef]
Figure 2.
Comparison of Different Models on Rainfed Area.
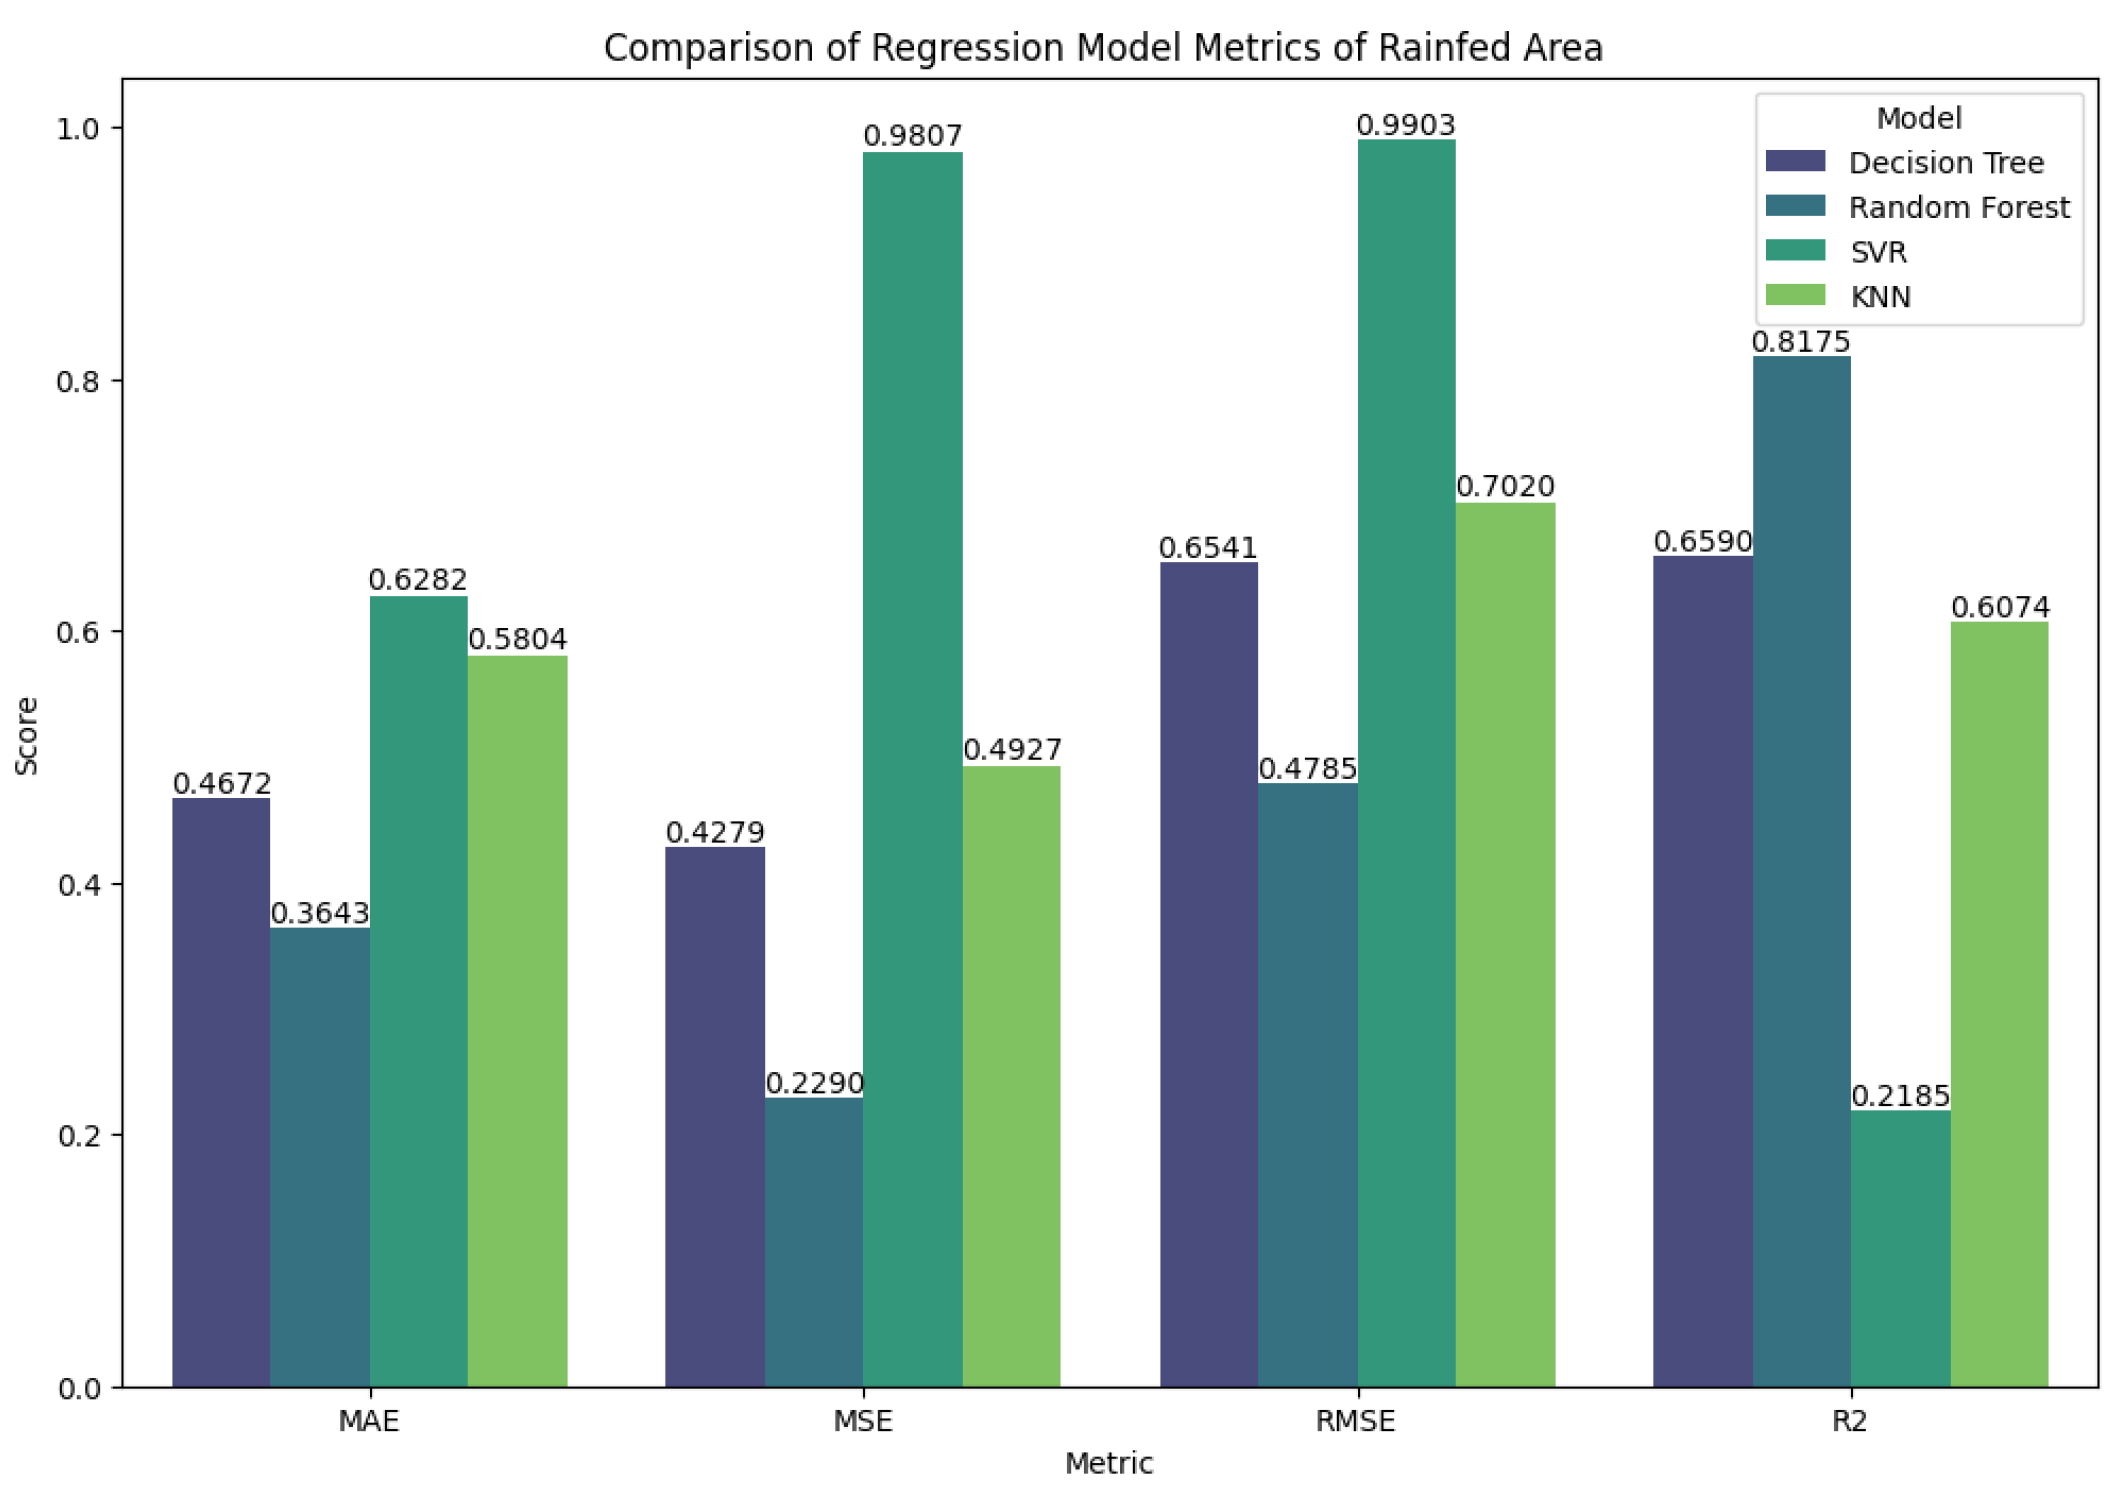
Figure 3.
Comparison of Different Models on Rainfed Area.
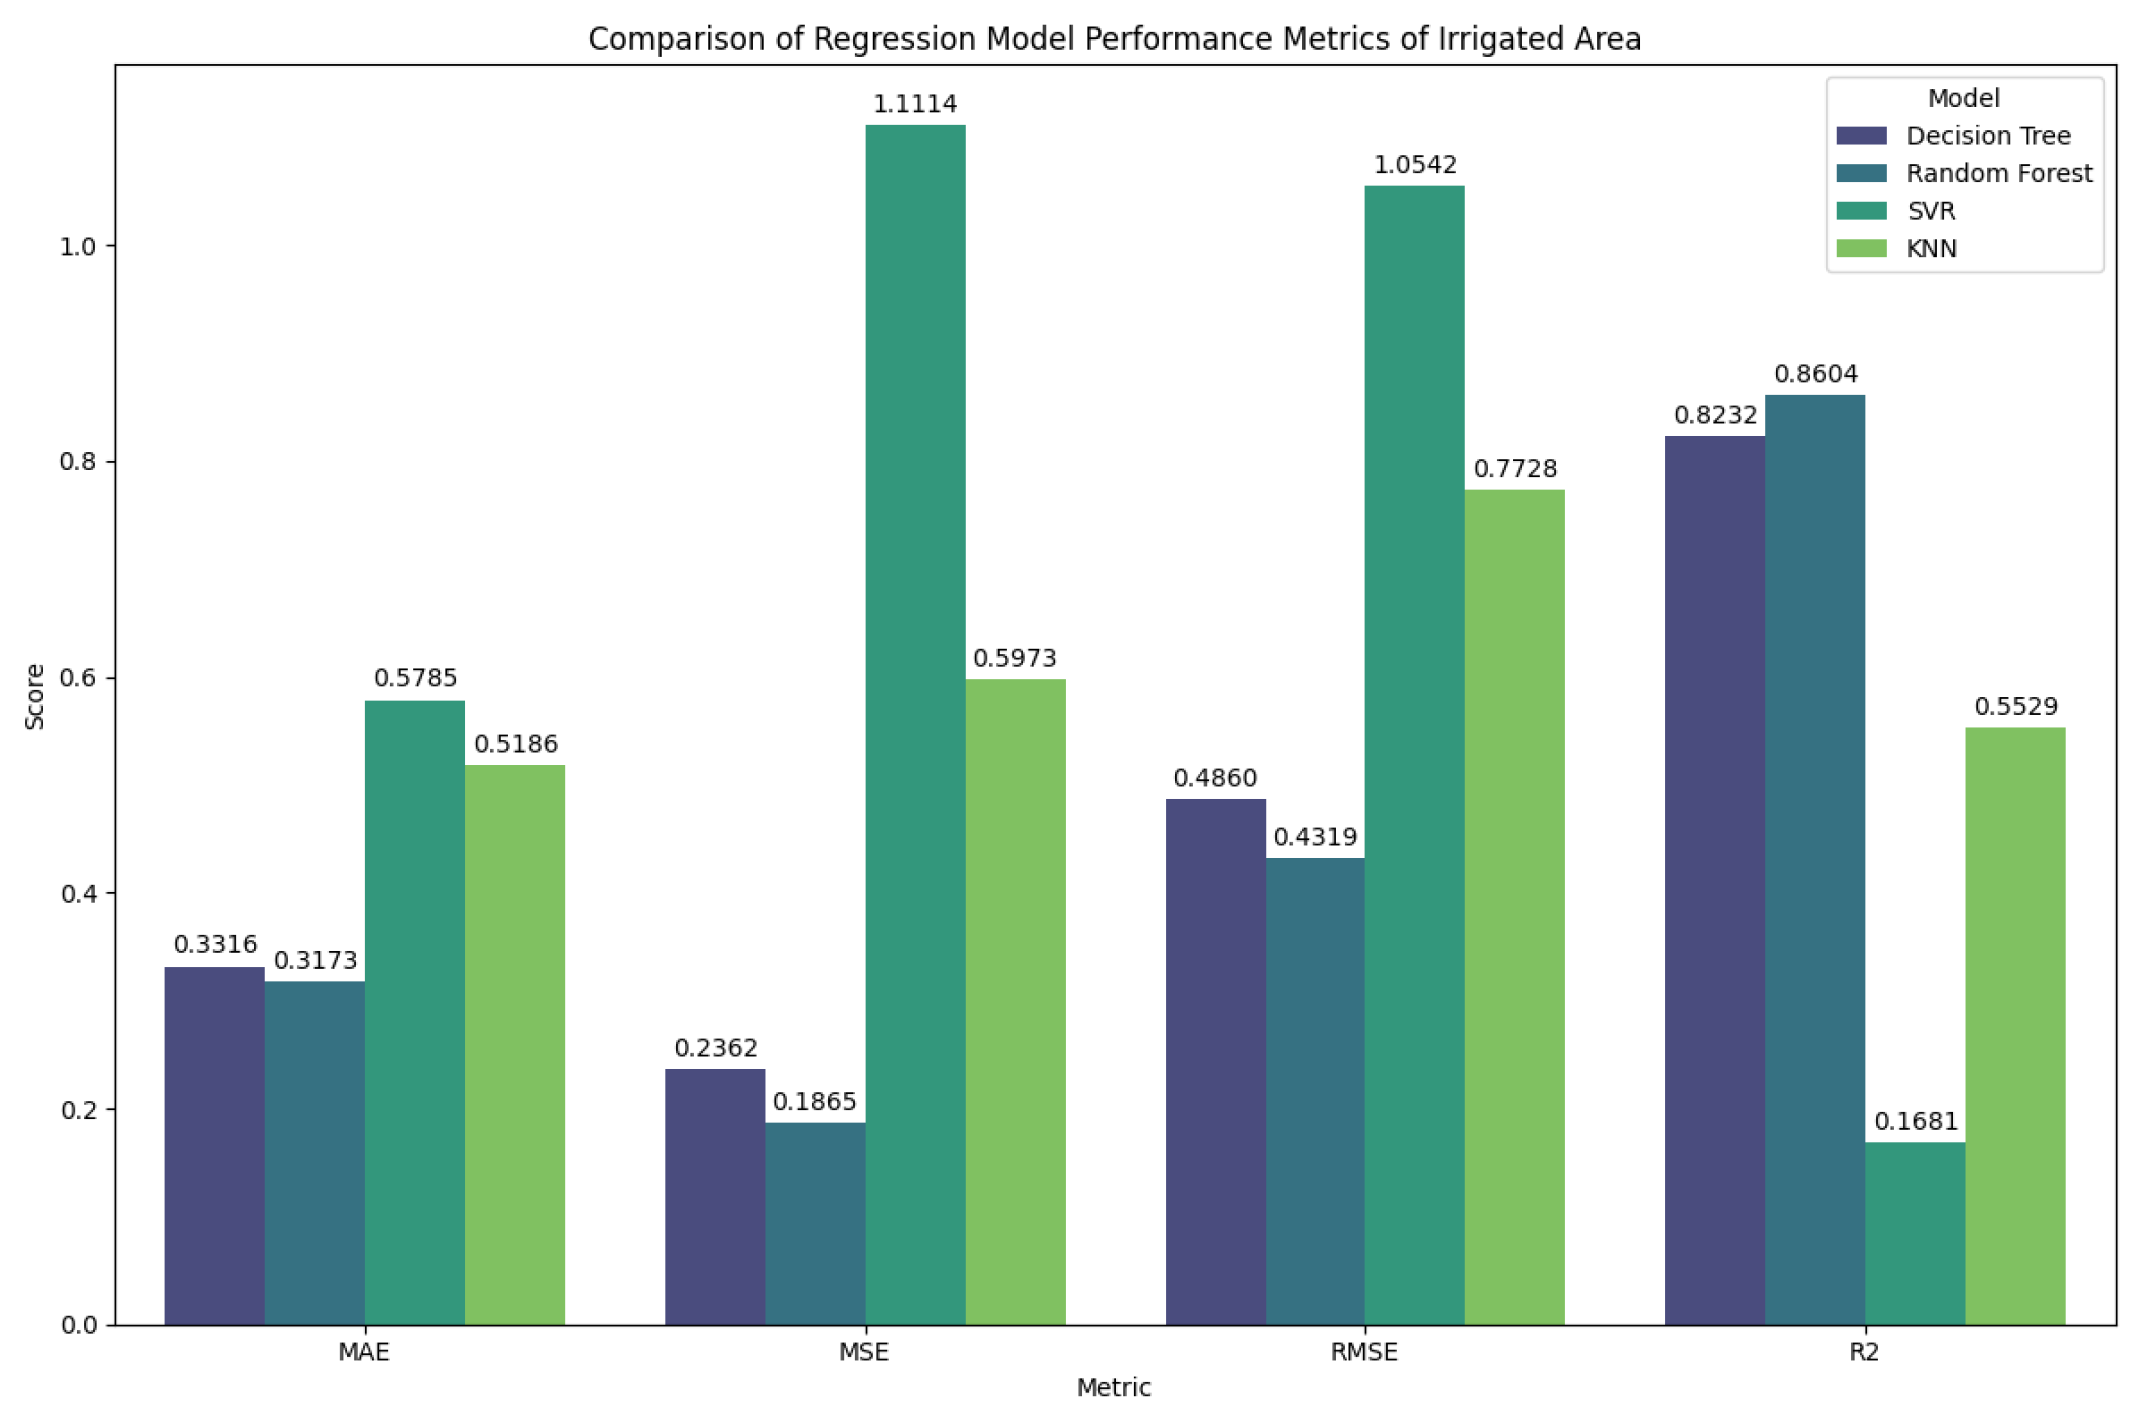
Table 2.
Irrigated Correlational Value.
| Attributes | r | Sig. (2-tailed) | N |
|---|---|---|---|
| Fertility | 1.000 | – | 83 |
| Nitrogen Content | 0.773 | 0.000 | 83 |
| Potassium Content | 0.036 | 0.749 | 83 |
| Magnesium Content | 0.346 | 0.001 | 83 |
| Irrigated Area | 0.116 | 0.296 | 83 |
| Irrigated Crop Yield | 0.142 | 0.199 | 83 |
Table 3.
Rainfed Correlational Value.
| Attributes | r | Sig. (2-tailed) | N |
|---|---|---|---|
| Fertility | 1.000 | – | 83 |
| Nitrogen Content | 0.562 | 0.000 | 83 |
| Potassium Content | 0.565 | 0.000 | 83 |
| Magnesium Content | 0.083 | 0.454 | 83 |
| Irrigated Area | 0.127 | 0.251 | 83 |
| Irrigated Crop Yield | 0.149 | 0.178 | 83 |
Table 4.
Rainfed Correlational Value.
| Model | Metric | Irrigated | Rainfed |
|---|---|---|---|
| Decision Tree | MAE | 0.3272 | 0.4568 |
| MSE | 0.1868 | 0.4206 | |
| RMSE | 0.4322 | 0.6486 | |
| R2 | 0.8602 | 0.6648 | |
| Random Forest | MAE | 0.317 | 0.3607 |
| MSE | 0.1790 | 0.2391 | |
| RMSE | 0.4230 | 0.4890 | |
| R2 | 0.8661 | 0.8095 | |
| SVR | MAE | 0.5785 | 0.6282 |
| MSE | 1.1114 | 0.9807 | |
| RMSE | 1.0542 | 0.9903 | |
| R2 | 0.1681 | 0.2185 | |
| KNN | MAE | 0.5973 | 0.4927 |
| MSE | 0.5973 | 0.4927 | |
| RMSE | 0.7728 | 0.7020 | |
| R2 | 0.5529 | 0.6074 |
Disclaimer/Publisher’s Note: The statements, opinions and data contained in all publications are solely those of the individual author(s) and contributor(s) and not of MDPI and/or the editor(s). MDPI and/or the editor(s) disclaim responsibility for any injury to people or property resulting from any ideas, methods, instructions or products referred to in the content. |
© 2026 by the authors. Licensee MDPI, Basel, Switzerland. This article is an open access article distributed under the terms and conditions of the Creative Commons Attribution (CC BY) license (http://creativecommons.org/licenses/by/4.0/).
Copyright: This open access article is published under a Creative Commons CC BY 4.0 license, which permit the free download, distribution, and reuse, provided that the author and preprint are cited in any reuse.


