
Submitted:
07 February 2026
Posted:
10 February 2026
You are already at the latest version
Abstract
This study presents an academic information management model based on Artificial Intelligence (AI) for early predicting school failure risk. It integrates classical statistical techniques, such as multiple regression and correlation analysis, with advanced machine learning methods, including K-means clustering and Principal Component Analysis (PCA). This methodological combination enables a comprehensive analysis of data related to cognitive skills, executive functions, physical and mental health, emotional well-being, and sociodemographic factors. The model was applied to a sample of 190 students aged 8 to 12 from vulnerable communities in Colombia, with data collected at three key points: mid-school year, end of the cycle, and the beginning of the following academic year. The analysis achieved a predictive accuracy of 85%, highlighting the importance of mental health indicators, especially depression and anxiety, in predicting academic performance and reading comprehension. Significant interactions between emotional and cognitive variables were found, underscoring the need for integrated approaches when designing effective educational interventions. This approach allows for more targeted preventive actions and supports ongoing evaluation of the model’s stability over time. Incorporating more sophisticated AI techniques, such as deep neural networks and boosting models, is proposed as a future direction to enhance the model’s predictive capacity and broaden its applicability across diverse educational contexts.
Keywords:
artificial intelligence
; school risk
; machine learning
; academic management
; inclusive education
1. Introduction
School failure is a global issue that disproportionately affects students in vulnerable environments, perpetuating cycles of poverty and inequality [1]. Traditional strategies often lack the precision needed to identify at-risk students early, highlighting the need for innovative approaches based on educational technology.
In the 2022 PISA assessment by the OECD, more than 50% of students did not reach the basic competency level in reading, mathematics, and science [2]. At the national level, only 44 out of every 100 children who enter the Colombian education system complete upper secondary education, and just 38 immediately transition to higher education after graduation. [3].
UNESCO warns that around 24 million students may permanently leave the education system due to the prolonged effects of the pandemic, with the most severe impacts in low- and middle-income countries [4]. Similarly, the Education Cannot Wait report estimates that 222 million children and adolescents in vulnerable contexts require urgent educational support: 78.2 million are out of school, and 119.6 million attends without achieving minimum competencies [5].
Numerous studies have addressed the multifactorial complexity of school dropouts. A recent meta-analysis [5] Identified key individual, family, and school-related risk factors, such as low academic performance, grade repetition, learning difficulties, negative attitudes toward school, and limited parental involvement.
Colombia, with an average dropout rate of 11% between 2000 and 2021, reflects these challenges. School dropout in the country is linked to poor academic performance, economic hardship, lack of vocational guidance, and perceptions of low educational quality, especially among students from lower socioeconomic backgrounds and regions with limited investment in education [6,7].
2. Related Works and Motivations
Some studies have addressed school dropout from various perspectives, including technological solutions such as automated systems for monitoring and prevention. One example is a platform design that records absenteeism, failing grades, and misconduct while sending computerized reports to parents. This system includes an institutional website, facial recognition software, and a mobile app for notifications [8].
Machine learning approaches and data distillation techniques have also been explored to reduce school dropout while protecting student privacy, as part of a more sustainable educational management framework [9,10].
Academic performance prediction has become essential for designing timely interventions. A study using the OULAD dataset, which includes over 32,000 students, evaluated a Multilayer Perceptron (MLP) model that outperformed other approaches with 90.2% accuracy. Behavioral and academic factors were the most influential predictors, surpassing socioeconomic and demographic variables. These findings validate the use of participation patterns and educational history as the foundation for early intervention systems [11].
In higher education, predictive models have also been applied to anticipate students’ performance in the following semester based on academic records and attendance. Algorithms such as Random Forest, Gradient Boosting, and Voting Regressor have been used, with predictions transformed into grade categories to facilitate metrics like accuracy, recall, and F1-score. These studies show how educators can identify at-risk students and adjust strategies based on data [12].
The AugmentED model has also been developed, combining multi-source data (in-person, online, and on-campus behavior) with advanced techniques such as LSTM and nonlinear analyses (LyE, HurstE, DFA) to accurately predict university student performance. This approach also enables personalized feedback for students with low self-discipline [13].
Through these projects, educators are better equipped to identify students at risk and improve educational strategies, ultimately enhancing student success and institutional reputation [14].
Overall, most of the literature focuses on higher education, with a predominance of cross-sectional studies. In contrast, research at primary and secondary levels remains limited, particularly in the integrated use of psychosocial variables, mental health, reading comprehension, and sociodemographic conditions. The present study proposes a longitudinal approach that enables contextualized monitoring of school risk factors over time [15].
3. Methodology
This study adopts a quantitative, longitudinal design to identify predictors of academic risk over time. It combines traditional statistical techniques (Pearson correlations, ANOVA) with dimensionality reduction methods like PCA [16], and exploratory machine learning approaches, including K-means clustering. This hybrid approach enables modeling of complex relationships among cognitive, emotional, and academic variables.
The research was conducted in public schools in Valledupar, Colombian Caribbean, with students from low socioeconomic strata (1, 2, and 3), using non-probabilistic convenience sampling. Data were collected at three points during the 2024 school year from partial samples of 140, 151, and 190 students aged 8 to 12.
Instruments were selected for psychometric reliability and age appropriateness. Reading comprehension was assessed using the EDICOLE test, which targets textual recall, inference, integration, and metacognitive control. Mental health was measured with an adapted child-friendly version of the DASS-21 focused on depression, anxiety, and stress. Inhibitory control and attention were evaluated using the Simon Task [17], while math performance was measured with selected items from the BERDE battery [17] targeting analog and verbal numerical representation.
3.1. Edicole
Reading comprehension is a key skill from both psychological and educational perspectives, as it is an essential component of cognitive development [18] and one of the main predictors of academic performance [19]. Students with stronger comprehension are better equipped to solve problems and adapt to diverse learning contexts.
To assess this skill, the EDICOLE test (Diagnostic Evaluation of Reading Comprehension) [20] was used. It evaluates four core processes: information retrieval, inference-making, activation of prior knowledge, and integration with the text. The test is administered collectively, estimated at 30 to 40 minutes, and consists of three narrative texts with 18 questions each. Only the first text was used in this phase, with plans to include the others in future stages.
Unlike other assessments, EDICOLE minimizes linguistic bias related to syntactic complexity or vocabulary knowledge, allowing for a more accurate evaluation of cognitive processes [21]. Its structure also supports differential diagnosis by distinguishing whether reading difficulties stem from linguistic issues or more basic cognitive processing deficits [22], making it a valuable tool for guiding targeted pedagogical interventions [23].

Table 1.
Comprehension process assessed in the questions of text 1.
| TYPES OF QUESTIONS | Text 1 |
| Knowledge Questions | 1 y 2 |
| Memory Questions | 3, 4 y 5 |
| Inference Questions | 7, 8, 9 y 11 |
| Integration Questions | 10, 13, 14, 15, 16 y 17 |
| Control questions | 6, 12 y 18 |
The score is compared with the identification criterion based on the mean and standard deviation of the scale obtained for the age of the participants evaluated, in this case, 3rd, 4th, and 5th grades of primary school and 6th grade of basic education. A score less than one standard deviation below the mean will be the criterion for identifying students with problems.
3.2. Control Inhibitorio
Inhibitory control was assessed using the Simon Task [24], designed to measure the ability to ignore irrelevant spatial information. Participants were instructed to respond to the color of a stimulus (red or green), regardless of its position on the screen.
Two types of trials were included:
- ▪
- Congruent: the color and position match the expected response (e.g., green on the right → respond with the right hand).
- ▪
- Incongruent: the position contradicts the response assigned to the color (e.g., green on the left → respond with the right hand).
The task consisted of 10 practice trials and 100 experimental trials. Students were instructed to respond quickly and accurately using the hand corresponding to the color. The Simon effect appears as increased reaction time and error rate in incongruent trials. The inhibitory control index is calculated as the difference in average reaction time between incongruent and congruent trials, with higher values indicating lower control [25,26].
The task was administered individually in a controlled computer lab environment using tablets, under the supervision of the lead researcher, with support from 11th-grade students (as part of their Social Service) and psychology/education interns. Each session lasted approximately 15 minutes, and reaction times were recorded automatically using dedicated software.
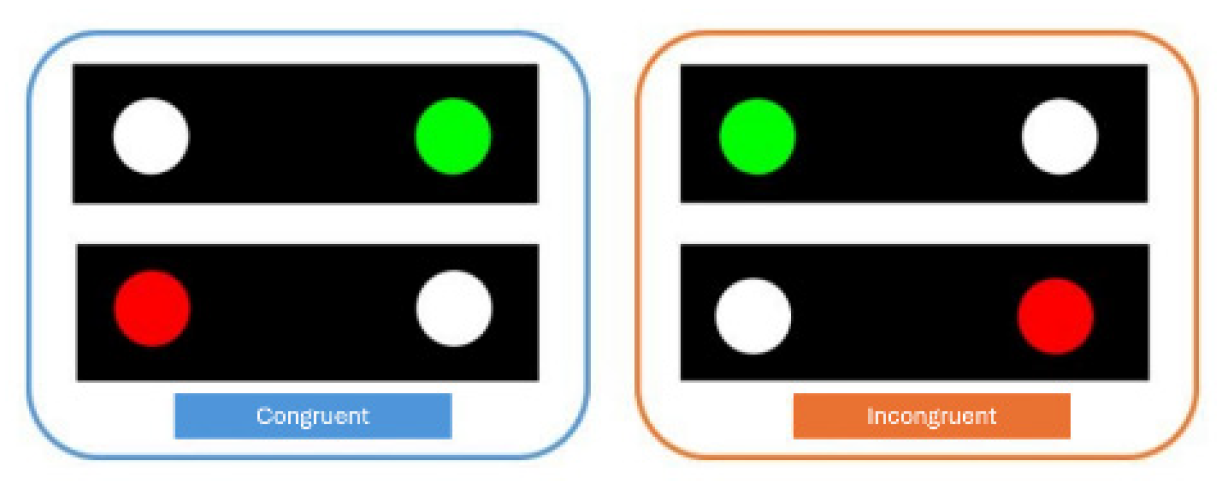
Figure 1.
Image of Simon’s Task.
3.3. Salud Mental Questionnaire DASS-21 (Depression, Anxiety and Stress Scales)
An adapted version of the DASS-21 was used for children aged 8 to 12, validated to assess depression, anxiety, and stress [27] . The adaptation included age-appropriate language, Likert-type items (0–3), visual sliders, and dichotomous and frequency-based questions to explore general emotional state, anticipatory anxiety, and coping capacity.
Each subscale includes 7 items (range: 0–21). Cut-off points were:
- Depression: >5 (sensitivity 88.5%, specificity 86.8%)
- Anxiety: >4 (87.5%, 83.4%)
- Stress: >5 (81.5%, 71.3%) [28].
Additional items addressed sleep quality, hygiene, social support, and subjective well-being, extending the assessment beyond traditional clinical focus and enabling early detection of emotional risks in school settings [29].
3.4. Institutional Database (SIMAT)
Sociodemographic data from the Integrated Enrollment System (SIMAT), including age, sex, grade level, and repetition history, were incorporated. This allowed for a more contextualized analysis of student profiles alongside emotional and academic indicators. The final dataset included 44 quantitative and 6 categorical variables, with mental health scores, reading comprehension, and academic engagement emerging as key predictors.
A rigorous preprocessing pipeline was applied, including scale standardization and handling of missing values through Multiple Imputation (MI) [30], as missing data remained below 5% per variable. Additionally, Mahalanobis distance was used to detect and control outliers, ensuring reliable integration of SIMAT data with the applied assessments.
Table 2.
Summary of variables evaluated in each instrument.
| Variable evaluated | Instrument | Components |
| Reading comprehension | Edicole | Recall, Inferences, Integration |
| Control inhibitorio | Simon | Congruent and Incongruent Essays |
| Mental health | DASS-21 | Depression, Anxiety, Stress |
3.5. Analytical Techniques
The analysis was structured in four stages: data exploration, dimension reduction, predictive modeling, and result validation. This approach made it possible to address the complexity of the phenomenon from a progressive and well-founded approach.
Exploratory Data Analysis (EDA): As an initial phase, descriptive statistics (mean, median, standard deviation) and graphical visualizations (histograms, scatter plots, box plots) were applied to identify patterns and anomalies. Pearson correlations were made between cognitive, emotional, and academic variables, and multivariate techniques such as Mahalanobis distance were used to detect outliers. The analyses were carried out in Python and RStudio.
Dimensionality reduction: was applied after standardization of the variables (z-score). Components that explained 85% of the total variance were retained [31].
Predictive modeling: Although machine learning algorithms were explored, this report mainly presents linear and logistic regression models, adjusted to the data from the first moment of the study. The techniques employed include:
- ▪
- Hierarchical regression: to predict reading comprehension based on demographic, emotional and cognitive variables.
- ▪
- K-means clustering: identifying homogeneous student profiles (high, medium, and low risk).
The supervised models were optimized by variable selection (Gini importance and permutation) and 5-fold cross-validation. The elbow and mean silhouette method determined the optimal number of clusters in K-means.
- ▪
- Cross-validation to reduce the risk of overfitting.
- ▪
- P-values and FDR-adjusted q-values were computed to evaluate the statistical significance of the model coefficients, controlling for multiple testing.
3.6. Tools & Technologies
Statistical analysis and predictive modeling were performed with R and Python, using specialized libraries such as caret, tidyverse, scikit-learn, and NumPy for data processing, as well as ggplot2 and matplotlib to visualize results. The experimental tasks, including the Simon Task and the psychological questionnaires, were implemented in the PsyToolkit platform [34,35] and were compatible with browsers and tablets. This tool allowed automated data collection (CSV formats), including reaction times and responses, which were directly integrated into the analysis flow.
The cognitive and emotional tests were applied on Android tablets, using standardized digital interfaces for school use. The analysis process followed a structured pipeline:
4. Results
This article presents the findings corresponding to the first evaluation moment. Although the research design is longitudinal and data from three different moments are available, longitudinal analyses are still under preparation and will be developed in future publications. The academic information management model is currently in development; the instruments have been applied to a sample of students during the 2024 academic year. This application has generated three independent databases, including the assessed educational, cognitive, emotional, and sociodemographic dimensions. The present manuscript reports the results corresponding to the first moment of measurement.
4.1. First Moment Results
Table 3 presents a structured synthesis of the data matrix obtained from the tasks applied during the initial pilot. The variables are grouped into three main types: Categorical variables: gender, age, and origin, Factors: shift, grade, and socioeconomic stratum, Quantitative variables (n=44): organized in key dimensions such as mental health, subjective well-being, spelling, word and pseudoword reading, reading comprehension, and inhibitory control. Based on this characterization, descriptive analyses (measures of central tendency, dispersion, and percentiles), inferential comparisons between subgroups, and predictive models aimed at identifying factors associated with academic risk were performed. The main quantitative findings corresponding to the first stage of the study are presented below.
Table 3.
Exploring variables in a data matrix.
| Name | datos2 |
| Number of rows | 123 |
| Number of columns | 50 |
| Column Type frecuency | |
| Character | 3 |
| Factor | 3 |
| Numeric | 44 |
| Group variables | None |
Exploratory analyses included descriptive statistics for each indicator. In spelling, the average accuracy was 66% (SD = 13%), with the 25th percentile at 56% and a maximum of 90%. The most frequent errors involved using the letters “b” and “v”, suggesting the need for targeted pedagogical interventions from a metacognitive perspective. In the lexical task, students performed better with real words (86% accuracy) than pseudowords (67%), highlighting a distinction between visual recognition and phonological decoding. Reading times were also analyzed based on syllabic length (bi-, tri-, and four-syllable words), opening the door to future classification using unsupervised algorithms (e.g., K-means).
In reading comprehension, results were broken down by process and total score. Although many students self-identified as “good readers,” their objective results indicated the opposite, revealing a case of metacognitive dissonance. Cognitive function tasks showed high accuracy overall, whereas inhibitory control tasks revealed variability linked to impulsivity, underlining their relevance as a predictor of reading performance.
Table 4.
Sociodemographic characteristics.
| Characteristic | N | % |
| Shift: Morning | 63 | 52% |
| Shift: Afternoon | 59 | 48% |
| Grade: 3rd | 42 | 34% |
| Grade: 4th | 41 | 34% |
| Grade: 5th | 39 | 32% |
| Socioeconomic level: 1 | 51 | 42% |
| Socioeconomic level: 2 | 39 | 32% |
| Socioeconomic level: 3 | 32 | 26% |
| Sex: Female | 52 | 43% |
| Sex: Male | 70 | 57% |
Table 5.
Comparison of the gender between boys and girls.
| Characteristic | N | % |
| Country of origin: Colombia | 104 | 85% |
| Country of origin: Venezuela | 18 | 15% |
| Age: 8 | 16 | 13% |
| Age: 9 | 38 | 31% |
| Age: 10 | 45 | 37% |
| Age: 11 | 16 | 13% |
| Age: 12 | 5 | 4.1% |
| Age: 13 | 2 | 1.6% |
Table 6.
Comparison by Degree.
| Variable | Female (N = 52) | Male (N = 70) | p-value | q-value |
| Shift: Morning | 26 (50%) | 37 (53%) | 0,8 | 0,8 |
| Shift: Afternoon | 26 (50%) | 33 (47%) | 0,8 | 0,8 |
| Grade: 3rd | 15 (29%) | 27 (39%) | 0,04 | 0,2 |
| Grade: 4th | 24 (46%) | 17 (24%) | 0,04 | 0,2 |
| Grade: 5th | 13 (25%) | 26 (37%) | 0,04 | 0,2 |
| Socioeconomic level: 1 | 25 (48%) | 26 (37%) | 0,4 | 0,7 |
| Socioeconomic level: 2 | 14 (27%) | 25 (36%) | 0,4 | 0,7 |
| Socioeconomic level: 3 | 13 (25%) | 19 (27%) | 0,4 | 0,7 |
| Country of origin: Colombia | 42 (81%) | 62 (89%) | 0,2 | 0,6 |
| Country of origin: Venezuela | 10 (19%) | 8 (11%) | 0,2 | 0,6 |
4.2. Comparisons by Degree and Gender in the Level of Depression
Table 7 compares depression levels between the different school grades evaluated. The results show a statistically significant difference, highlighting that third-grade students have higher levels of depression compared to their peers in higher grades. This finding is particularly relevant from an emotional development perspective, as it coincides with a school transition stage that may imply higher levels of insecurity and affective vulnerability in younger students.
Table 7.
Depression Level Comparison by Grade.
| Variable | Grade 3 (N = 42) | Grade 4 (N = 41) | Grade 5 (N = 40) | p-value | q-value |
| EVA_Nervousness, Mean (SD) | 5.8 (3.9) | 5.5 (3.9) | 5.7 (2.4) | 0,9 | >0.9 |
| EVA_Sadness, Mean (SD) | 5.0 (3.5) | 4.8 (4.0) | 4.9 (3.1) | >0.9 | >0.9 |
| EVA_Stress, Mean (SD) | 4.1 (3.5) | 4.0 (3.7) | 5.4 (3.1) | 0,1 | >0.9 |
| DepressionD, Mean (SD) | 16 (8) | 14 (9) | 12 (11) | 0,009 | 0,11 |
| AnxietyD, Mean (SD) | 17 (9) | 14 (10) | 10 (9) | 0,04 | 0,09 |
| StressD, Mean (SD) | 15 (8) | 15 (10) | 16 (10) | >0.9 | >0.9 |
| Well-being, Mean (SD) | 42.0 (5.7) | 41.4 (5.1) | 41.0 (7.1) | >0.9 | >0.9 |
Comparative analysis across school grades reveals significant differences in several mental health indicators. Specifically, third-grade students exhibited higher levels of depression and anxiety, with statistically significant differences on both scales (p = 0.009 and p = 0.04, respectively). Although the adjusted values (q = 0.11 and q = 0.09) reduce statistical significance after correcting multiple comparisons, the trend is clear: lower grade levels are associated with greater emotional vulnerability. This finding highlights the need to implement targeted psychoeducational support strategies in early grades, where students may face greater challenges in school adaptation. In contrast, no significant differences were observed in objective stress, overall well-being, or in the subjective indicators of nervousness and sadness, suggesting a degree of emotional stability across these dimensions in the three grades evaluated.
Additionally, the effect of gender on depression levels was examined using a comprehensive set of statistical tests to strengthen the robustness of the findings. These included: parametric testing (Student’s t-test), non-parametric testing (Wilcoxon test), a robust test, and a Bayesian approach. All analyses confirmed a significant difference, with girls consistently showing higher levels of depression than boys. This convergence across methods [36] reinforces the validity of the conclusion and supports the need for gender-sensitive interventions when addressing psychological distress in school settings.
As shown in Figure 2, the comparative analysis of depression levels by gender, using various statistical approaches (parametric, non-parametric, robust, and Bayesian), consistently indicates that female students exhibit higher levels of depression than their male peers. Across all four methods, the differences are statistically significant, with average scores ranging from 5.85 to 6.00 in girls compared to 4.00 to 4.13 in boys. The parametric t-test (p = 0.006), the non-parametric Mann-Whitney test (p = 0.007), and the robust test (p = 0.006) all confirm a significant difference, while the Bayesian analysis supports this conclusion with a credible interval that excludes the null value. These findings reinforce the evidence of greater emotional vulnerability among girls and underscore the importance of developing gender-sensitive support strategies, particularly concerning emotional guidance within the school environment.
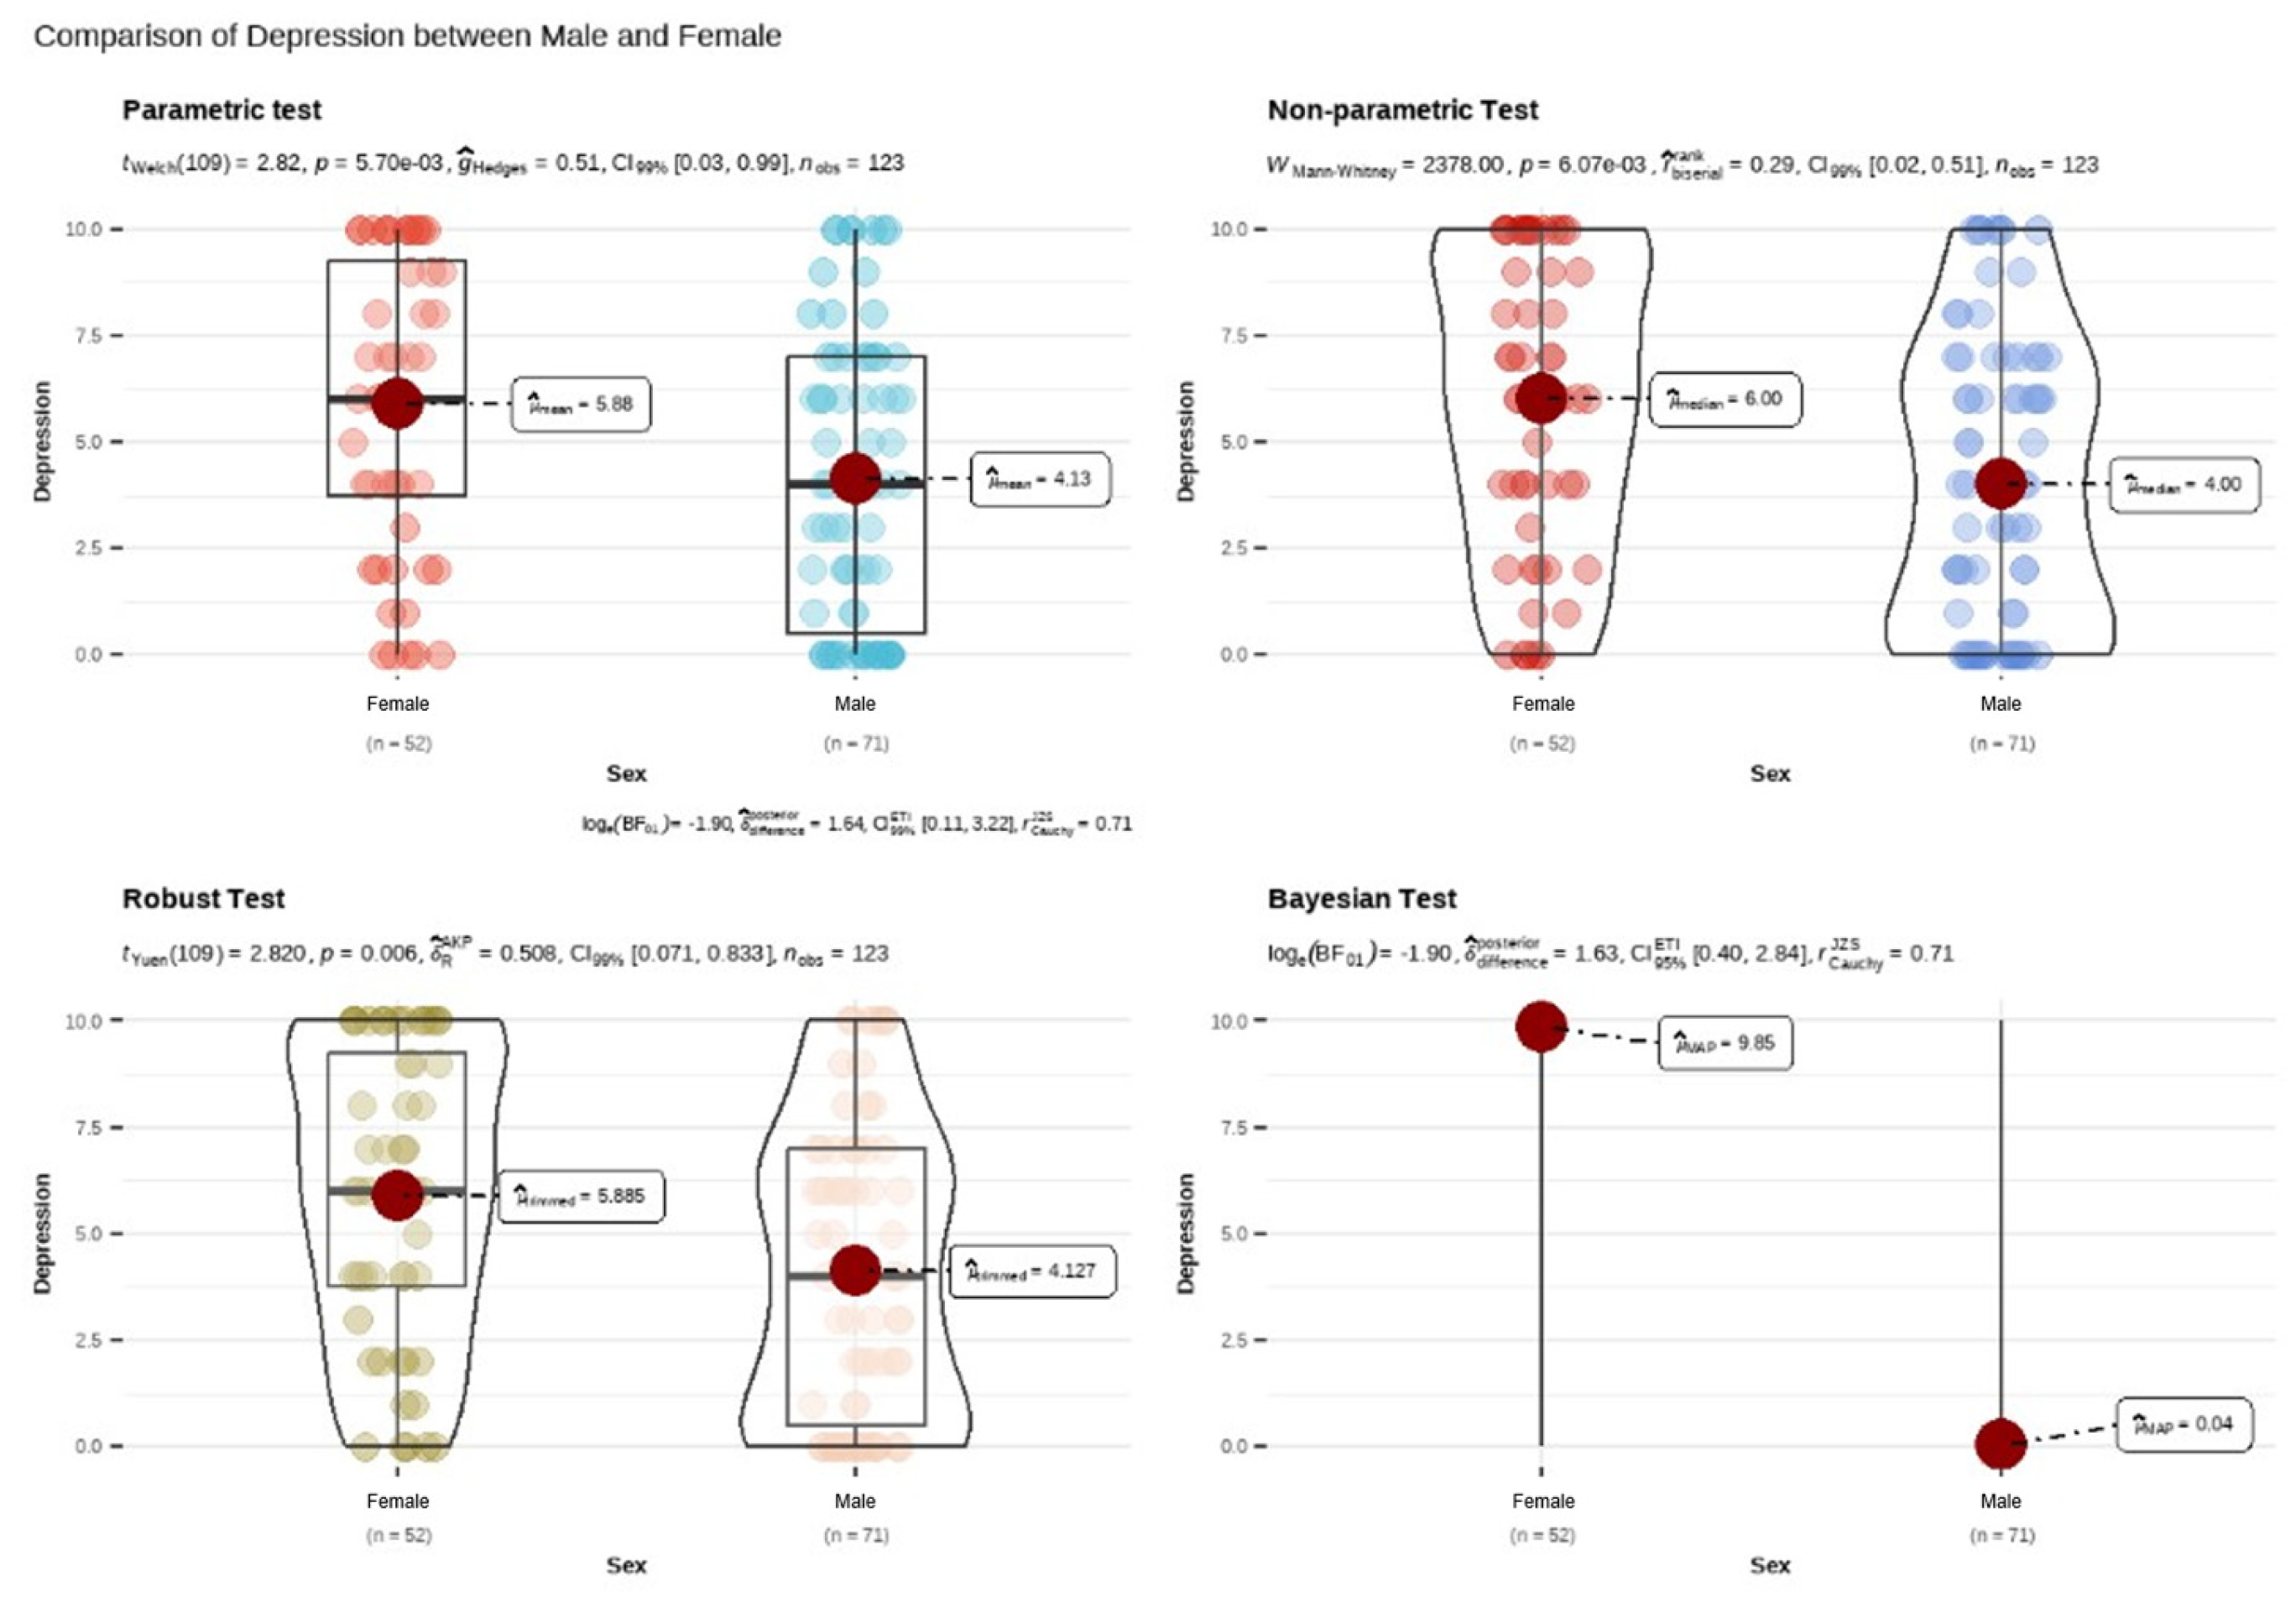
Figure 2.
Gender contrasts in mental health through different tests.
4.3. Prediction of Reading Performance Based on Psychological Variables
The effect of socioeconomic status on anxiety levels was examined, revealing significant differences: students from stratum 3 reported lower levels of anxiety, while those from stratum 2 showed the highest scores. This finding reinforces the well-documented association between social conditions and psychological distress.
Subsequently, a multiple linear regression model was applied to predict performance on the pseudoword reading task, an indicator of phonological route development, based on emotional variables assessed through DASS-21. The results showed a significant relationship: higher levels of depression and anxiety predicted lower performance in phonological decoding, supporting the influence of affective states on phonological access processes.
This model was replicated to predict overall reading comprehension, once again confirming the negative effect of depression: the greater the depressive symptoms, the lower the reading performance. Using the emmeans library to estimate marginal means, notable differences were observed in predicted scores. For example, students with high levels of depression achieved an average comprehension score of 4.29, while those without depressive symptoms scored 9.3 on average.
The model’s interpretation also revealed relevant patterns by gender and socioeconomic status:
- ▪
- Girls had a higher average reading comprehension score (8.03) than boys (7.82).
- ▪
- By socioeconomic stratum, students from stratum 3 achieved an average of 8.17, compared to 7.98 in stratum 1.
These findings allow for identifying risk profiles and provide a strong foundation for designing targeted educational interventions.
Table 8 presents the linear regression analysis, indicating that symptoms of depression and anxiety are significant predictors of academic performance, specifically in reading comprehension. The variable DepressionD shows a negative coefficient (β = -0.01, p = 0.03), indicating that higher levels of depression are associated with lower expected performance. Conversely, AnxietyD exhibits a slightly positive effect (β = 0.01, p = 0.018), suggesting that a certain level of anxious activation may be linked to improved performance in some cases. However, other variables such as perceived stress, loneliness, and hygiene habits did not show significant effects (p > 0.4), implying a lower direct influence at this model stage. Taken together, these results highlight the importance of mental health, particularly depression, as a key factor for anticipating academic difficulties and guiding evidence-based school interventions.
Table 8.
Result of predicting reading performance based on mental health variables.
| Characteristic | Beta | 95% CI | p-value |
| DepressionD | -0,01 | -0.02, 0.00 | 0,03 |
| AnxietyD | 0,01 | 0.00, 0.02 | 0,018 |
| StressD | 0 | -0.01, 0.01 | 0,5 |
| Loneliness | -0,01 | -0.05, 0.02 | 0,4 |
| Teeth brushing | -0,02 | -0.09, 0.04 | 0,5 |
Interpretation of the Regression Model for Reading Comprehension
A multiple linear regression model was constructed with reading comprehension as the dependent variable and psychosocial and demographic predictors (sex, socioeconomic stratum, depression, anxiety, stress, loneliness, and tooth brushing frequency). The general equation of the model is presented below and was extracted directly from the fitted model in R using the equatiomatic package.
Where:
Comprehension = α + β₁(Male_Sex) + β₂(Stratum_2) + β₃(Stratum_3) + β₄(DepressionD) + β₅(AnxietyD) + β₆(StressD) + β₇(Loneliness) + β₈(Teeth_Brushing) +ϵ1
- ▪
- α is the intercept of the model,
- ▪
- βᵢ represents the coefficients associated with each predictor variable,
- ▪
- ϵ is the random error term.
The analysis of the coefficients revealed the following:
- ▪
- The variable “Depression” had a significant negative coefficient, indicating that an increase in depressive symptoms is associated with a decrease in reading performance.
- ▪
- The coefficient associated with tooth brushing frequency positively correlated with reading comprehension, possibly linked to self-care routines and self-regulation.
- ▪
- Marginal differences were also observed by gender and socioeconomic stratum, favoring girls and students from stratum 3.
To facilitate the practical interpretation of the coefficients, estimated marginal means (emmeans) were used. For example:
- ▪
- A student with a depression score of 13 who brushes their teeth four times daily would have an expected reading comprehension score of 7.9.
- ▪
- Girls would have an average score of 8.03, compared to 7.82 for boys.
- ▪
- By stratum, the expected average score would be 7.98 for stratum 1 and 8.17 for stratum 3.
Finally, it is noteworthy that students without depressive symptoms had an expected reading comprehension score of 9.3, while those with high levels of depression dropped to 4.29, reinforcing the hypothesis that depression is a strong negative predictor of reading performance in this population.
Table 9 presents the predicted reading comprehension scores based on the reported level of depressive symptoms. A clear downward trend is observed: as the depression score increases, the estimated reading comprehension decreases. For example, students with a depression score of 0 have an average predicted reading score of 9.37. In contrast, those with a score of 45 show a significantly lower prediction of just 4.29, with a broader and lower confidence interval (95% CI [1.86, 6.73]).
Table 9.
Depression levels vs comprehension score.
| DepressionD | Predicted | 95% CI |
| 0 | 9,37 | 8.29, 10.45 |
| 5 | 8,81 | 8.04, 9.58 |
| 10 | 8,24 | 7.71, 8.78 |
| 15 | 7,68 | 7.17, 8.19 |
| 25 | 6,55 | 5.53, 7.57 |
| 30 | 5,99 | 4.63, 7.35 |
| 35 | 5,42 | 3.71, 7.13 |
| 45 | 4,29 | 1.86, 6.73 |
This negative relationship suggests that depressive symptoms may interfere with key cognitive processes such as attention, working memory, and self-regulation, which are essential for reading performance. These findings underscore the importance of including emotional state, particularly depression, as a key factor in predicting academic risk.
The analysis also revealed that third-grade students report higher levels of loneliness, emphasizing the need to implement psychoeducational interventions tailored to their developmental stage, such as workshops or talks designed for 8-year-old children.
To identify depression risk, the DASS-21 scale was used, and a binary variable (Depre_risk) was created by splitting the sample at the median: a value of “1” was assigned to those above the 50th percentile, and “0” to those below. A logistic regression model was then fitted using this variable to explore predictors of depressive risk.
Since the model coefficients are expressed in log-odds, they were interpreted in probabilities. The results indicate that being female increases the likelihood of being at risk of depression by 71%, compared to male students.
Similarly, the Estimated Marginal Means (EMMs) analysis reveals relevant differences in the probability of academic success according to grade level and gender. The results show that third-grade female students have the highest estimated probability of successful performance (prob = 0.82, 95% CI [0.62 – 0.93]), a statistically significant difference (p < .0001). In contrast, other subgroups, such as fourth-grade males (prob = 0.39) and fifth-grade males (prob = 0.52), show lower probabilities, none of which reached statistical significance (p > 0.05). These findings suggest that gender and grade interact differently in predicting academic performance, highlighting the need for pedagogical strategies tailored to each group’s profile, particularly during school transitions, where certain combinations appear more vulnerable.
The regression model revealed that spelling ability was the strongest positive predictor of reading comprehension (β = 7.48, p < .01), far surpassing other cognitive and emotional variables. This suggests that students with higher spelling skills demonstrate significantly better comprehension performance, potentially due to shared underlying language processing mechanisms.
In contrast, depressive symptoms showed a statistically significant negative effect (β = -0.11, p < .01), indicating that higher levels of depression are associated with lower reading comprehension scores. These findings reinforce the dual importance of academic skills and emotional well-being in predicting reading outcomes in vulnerable school populations
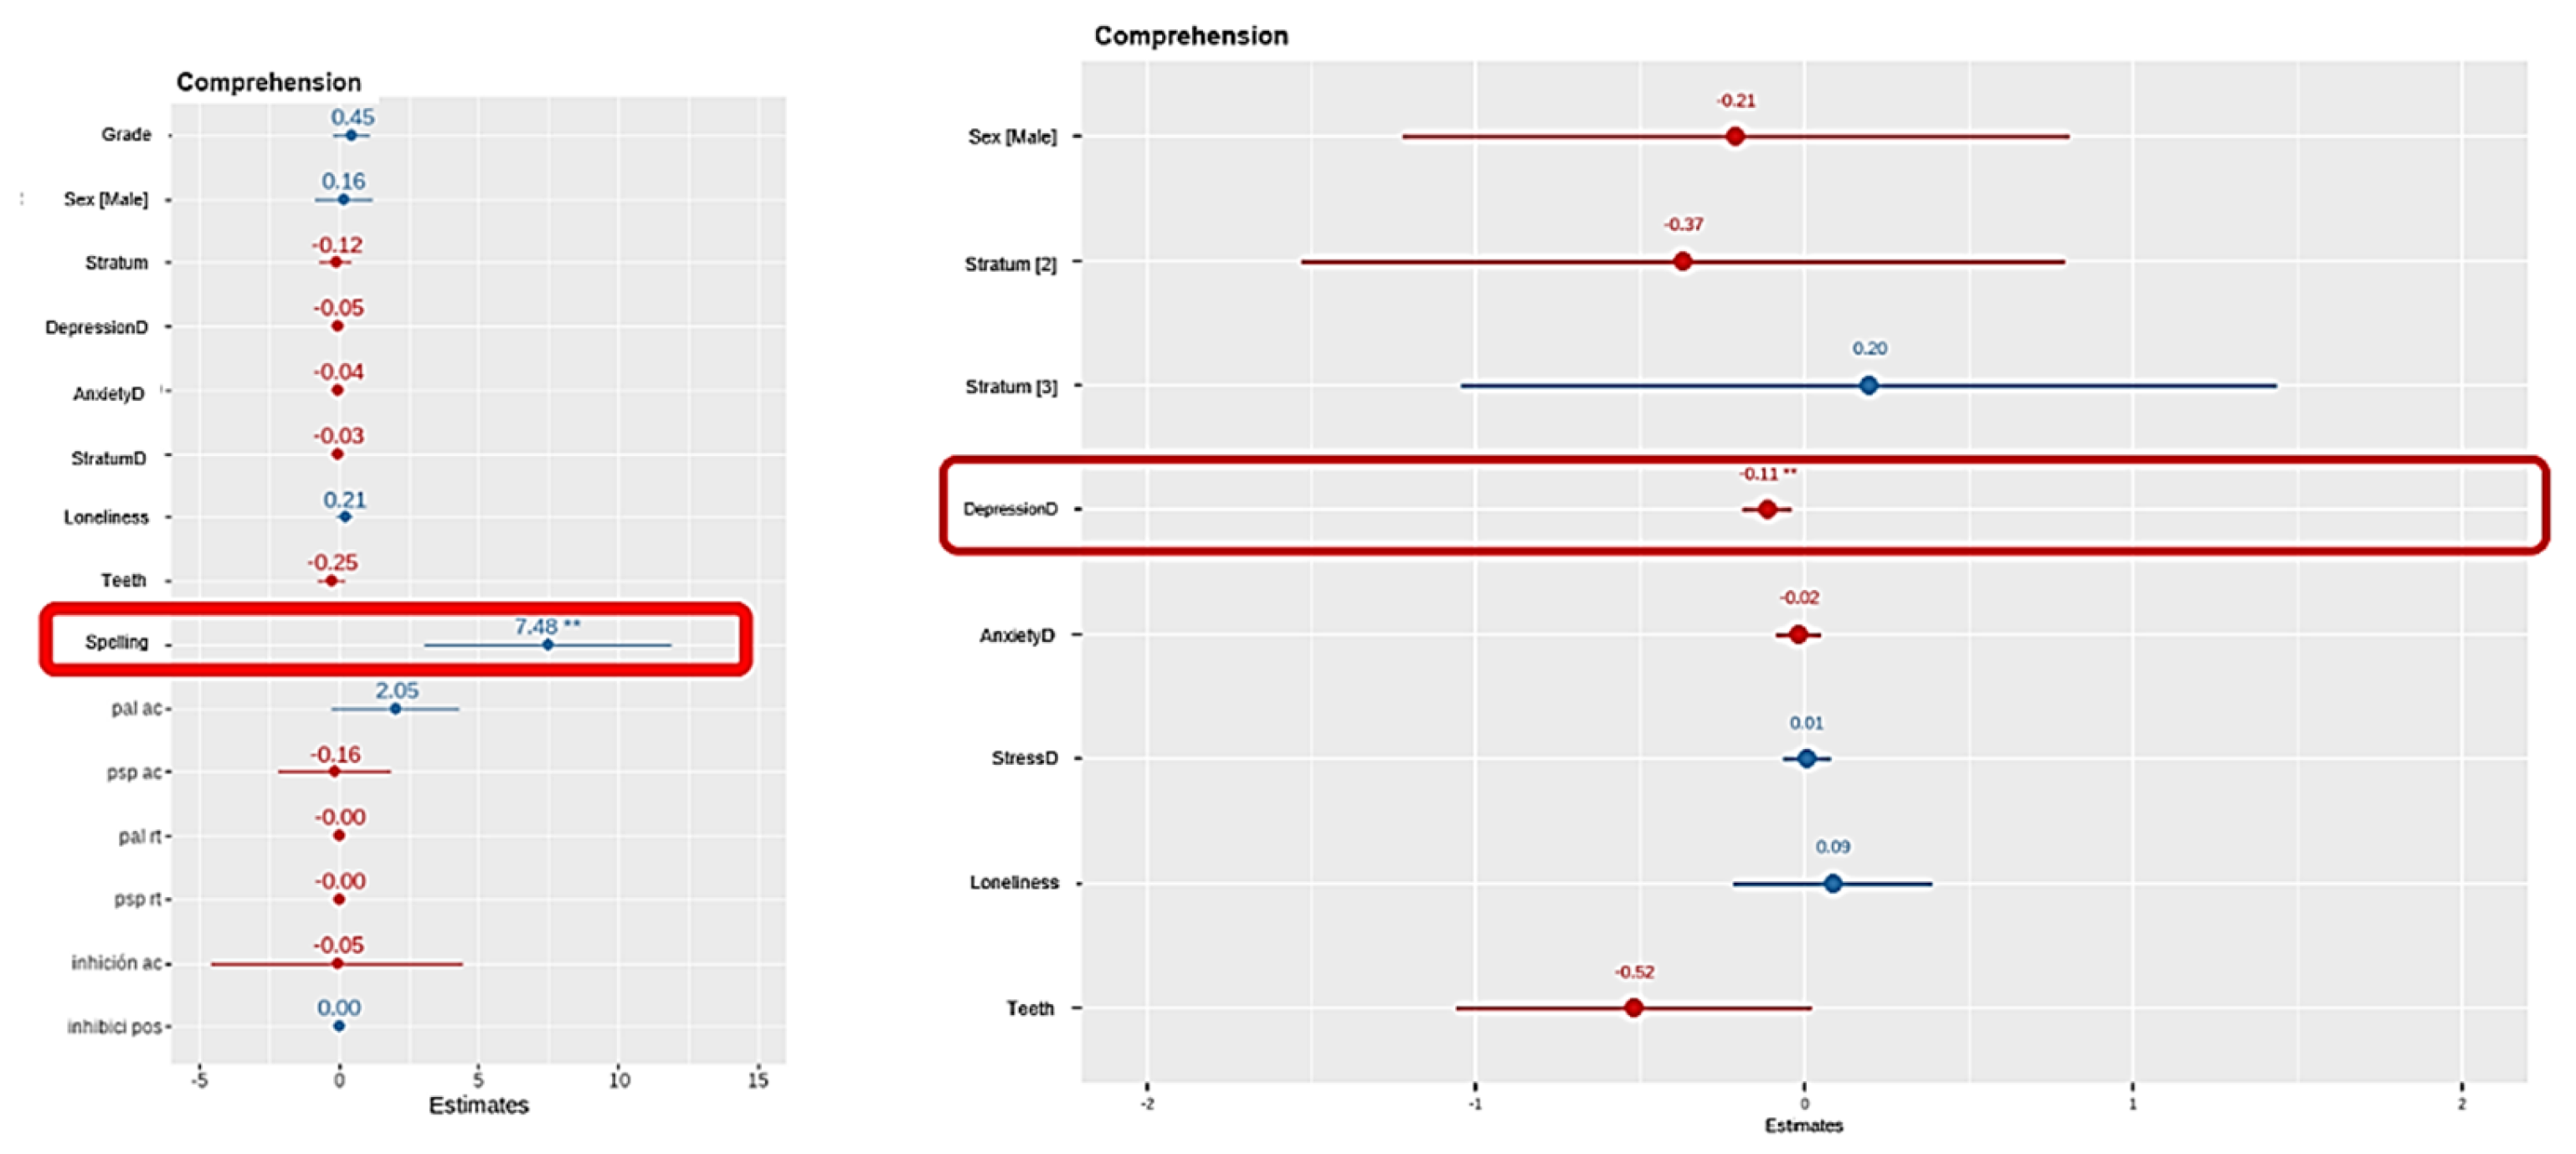
Figure 3.
Predictors of Reading Comprehension: Coefficient Estimates from Regression Models.
4.4. Modeling Emotional Risk and Student Profiles
Figure 4 shows the logistic regression model used to predict the likelihood of presenting depressive symptomatology, based on multiple psychosocial and demographic predictors. The model includes school grade, sex, socioeconomic stratum, place of origin, perceived well-being, loneliness, and sleep quality. The analysis identified significant effects for gender and grade, indicating a higher risk of depression among female students and those in earlier grades.
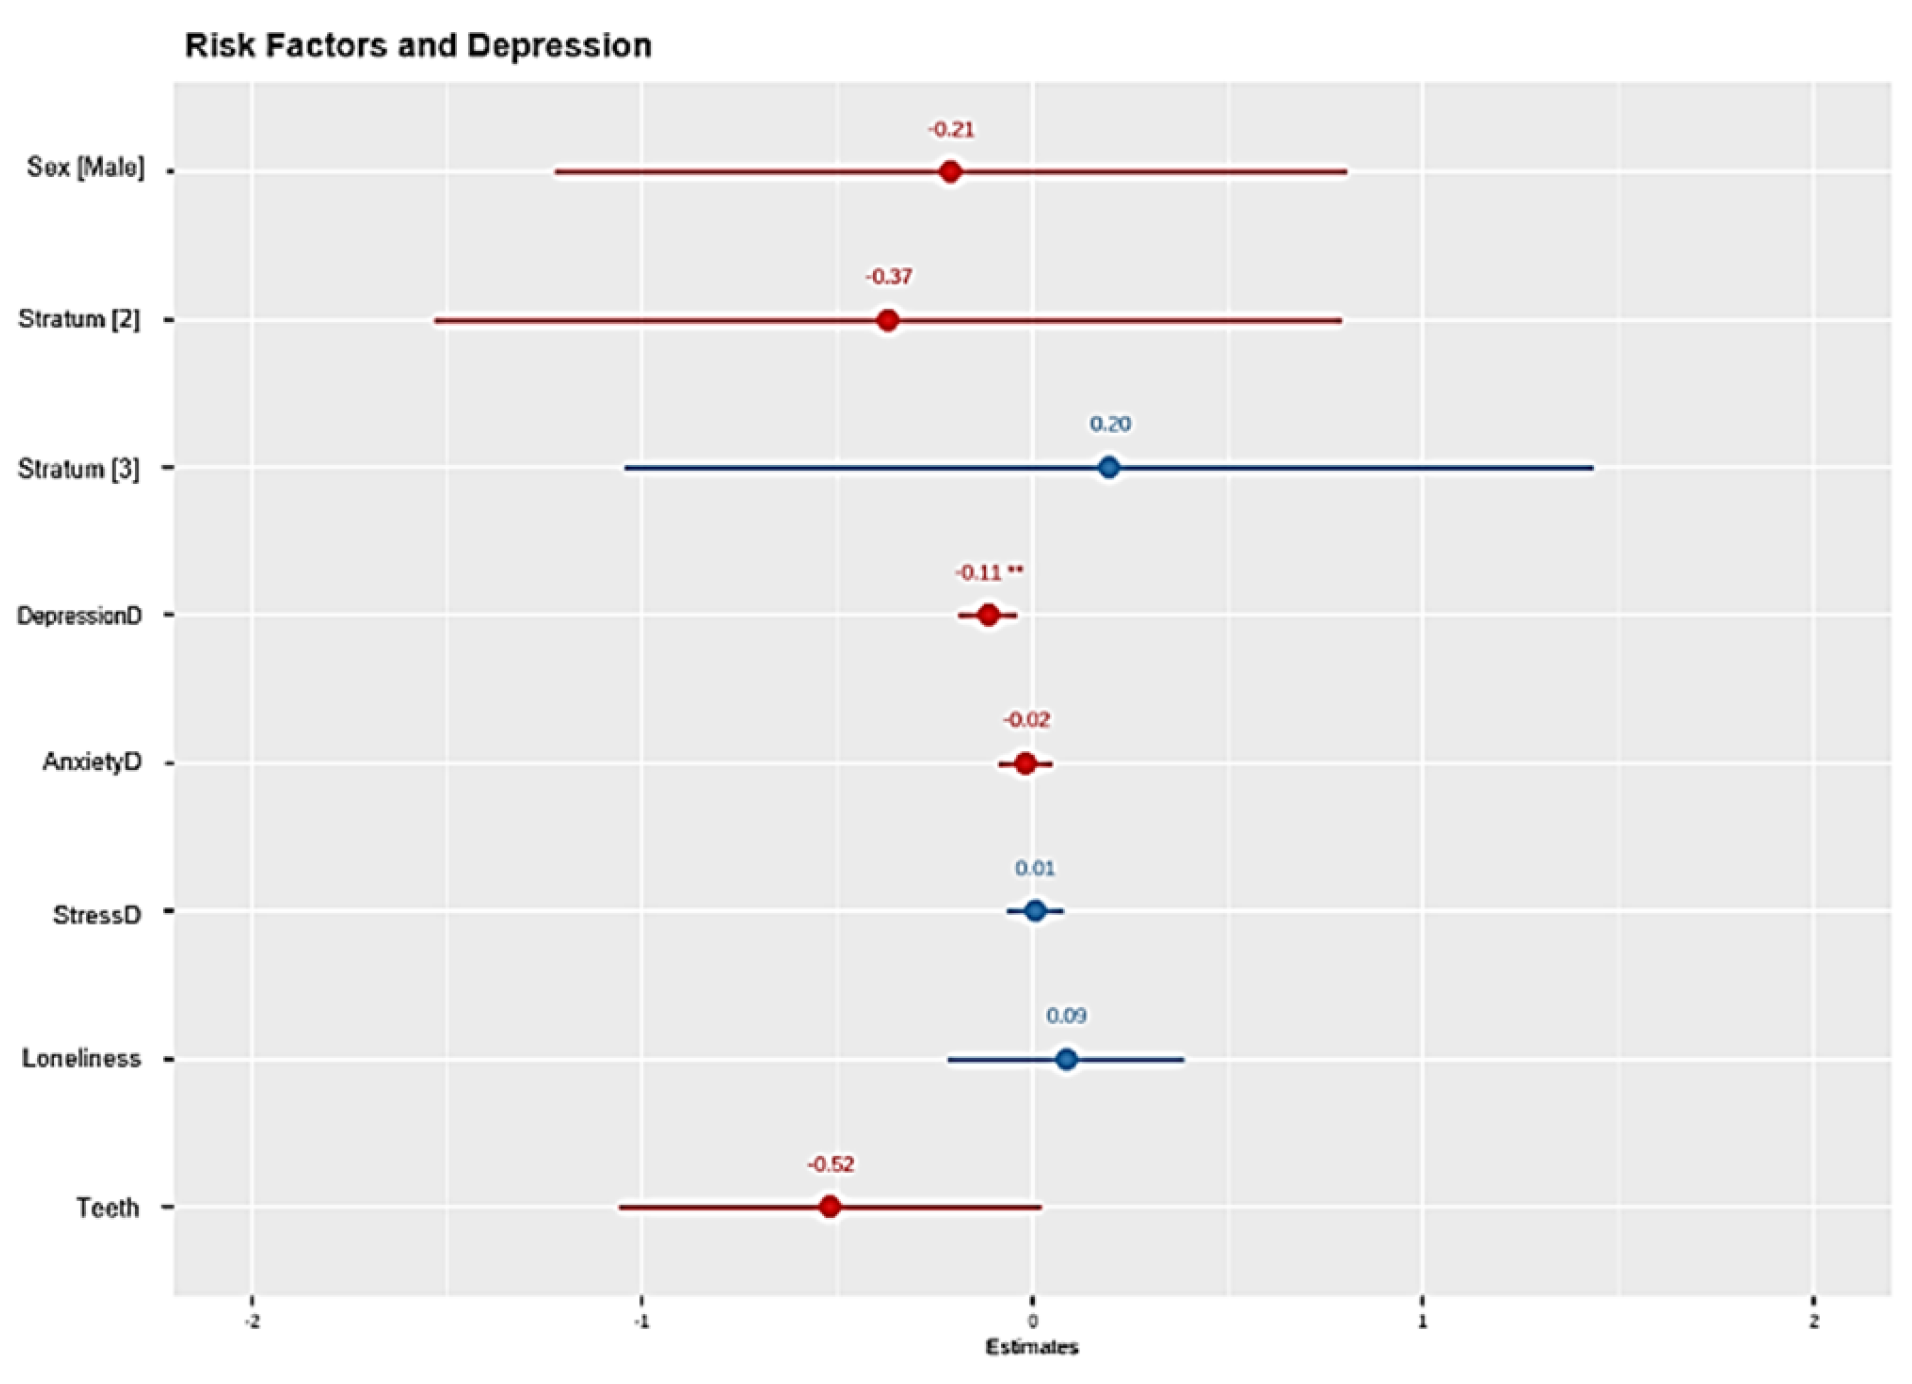
Figure 4.
Odds Ratios from a Logistic Regression Model Predicting Depression Risk.
To facilitate the interpretation of the dataset and reduce its complexity, PCA was applied to continuous variables grouped into three key dimensions: mental health (depression, anxiety, stress), reading performance (comprehension, word and pseudoword reading), and cognitive abilities (inhibitory control, functional spelling).
The PCA allowed for condensing the seven original indicators into three main components, which explained a substantial proportion of the total variance. These components were then used as predictors in a regression model to demonstrate reading comprehension. The results indicated that the mental health component was the most influential predictor: better emotional well-being was associated with higher reading comprehension levels, while lower scores predicted significant difficulties.
Additionally, a K-means clustering algorithm [37,38] was applied to identify latent patterns in the student population. The model suggested the presence of three distinct clusters [39], which are partially aligned with the school grades assessed (3rd, 4th, and 5th grade). Figure 4 illustrates the distribution of these profiles, defined by combinations of academic performance, emotional well-being, and executive functioning. This segmentation provides a valuable foundation for designing personalized intervention strategies.
Reading comprehension was selected as the target variable due to its strong predictive value for overall academic achievement, in line with recent educational research.
Finally, final grades in language, mathematics, and the overall academic average were incorporated into the dataset for external validation. This information will serve as a benchmark for future longitudinal analyses planned for the ongoing project.
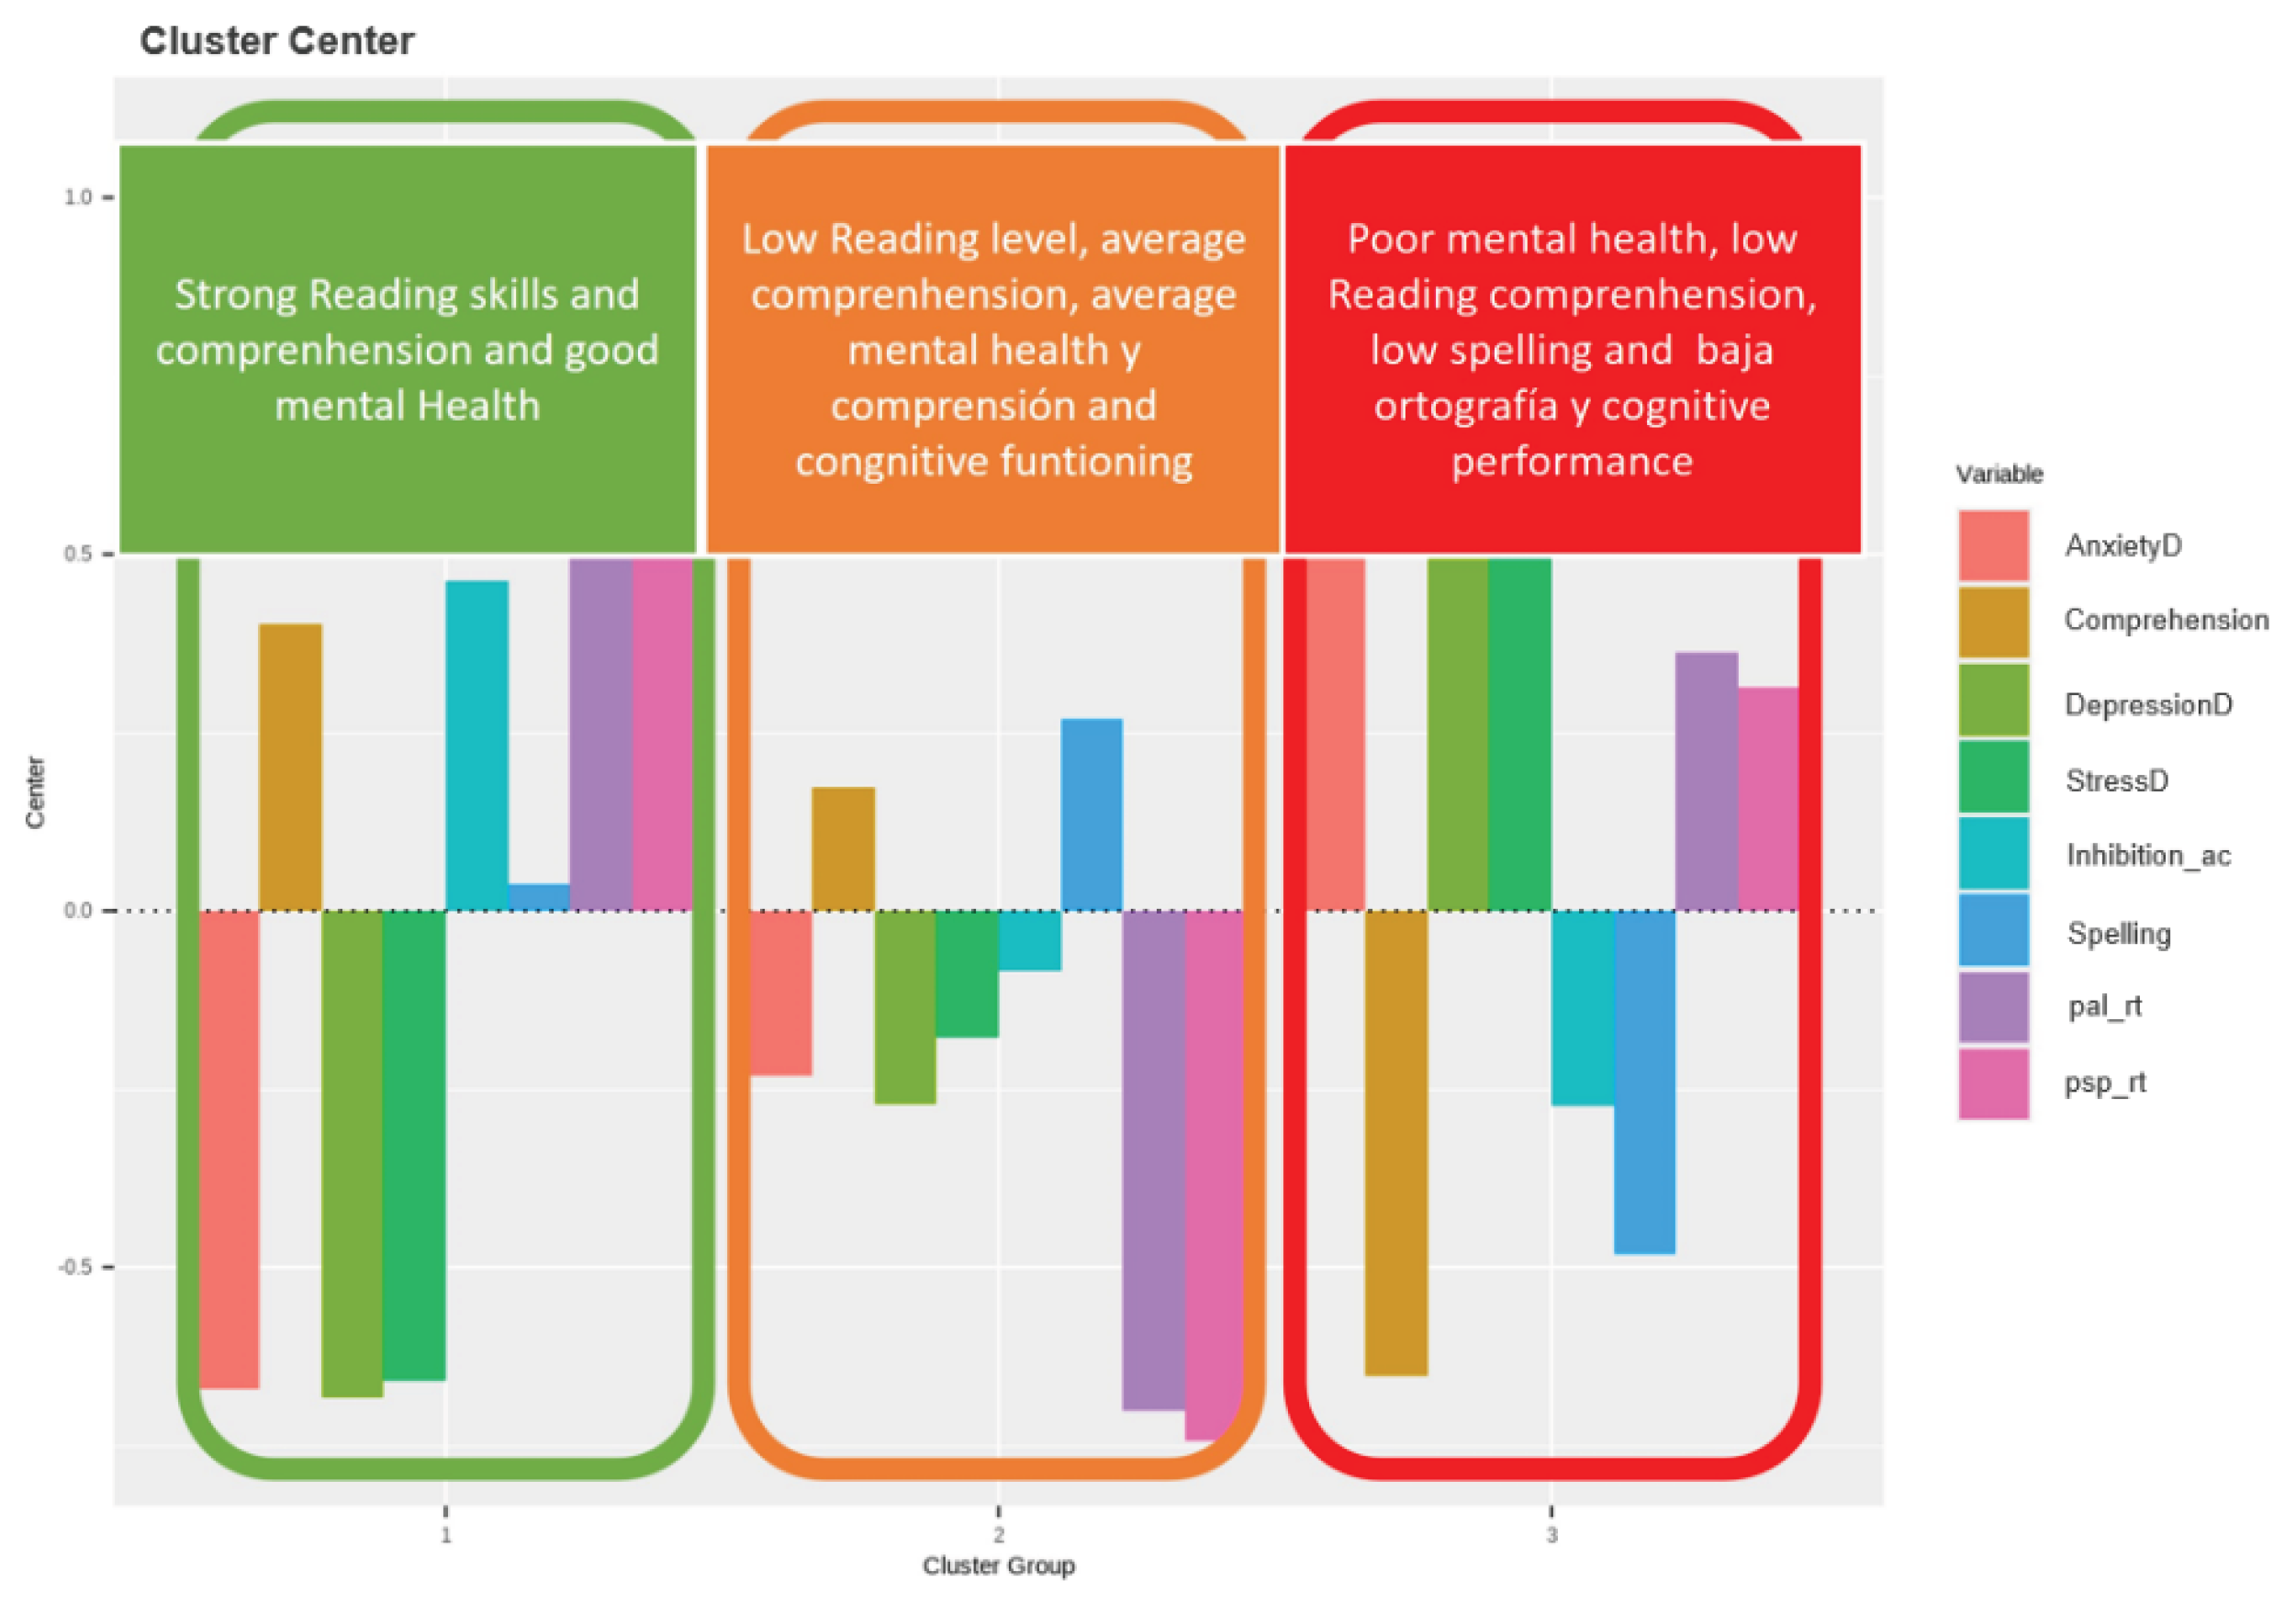
Figure 5.
Student Profiles through K-media.
4.5. Key Findings
Mental Health as a Predictor of Academic Performance
Symptoms of depression and anxiety emerged as significant predictors of school performance. Specifically, students with high levels of depression showed reading comprehension scores approximately 20% lower than their peers with lower emotional distress, highlighting the direct impact of psychological well-being on learning.
Sociodemographic Differences
- ▪
- Gender: Female students reported higher levels of anxiety, which was associated with lower academic engagement.
- ▪
- Socioeconomic status: Students from lower socioeconomic strata faced additional barriers, such as limited access to educational resources, affecting both academic performance and well-being
Student Profiles Identified Through Multivariate Analysis
The combination of PCA and unsupervised clustering (K-means) enabled the identification of three distinct student profiles:
- High performance with emotional stability
- Intermediate performance with mild emotional distress
- Low performance with severe emotional symptoms
These profiles provide a strong foundation for the design of personalized intervention strategies. Schools can allocate resources by prioritizing students at greater psychological risk, while also developing tailored support programs based on the specific characteristics of each group.
5. Discussions
The results of this study provide robust evidence of the predictive value of emotional and sociodemographic variables in academic performance, particularly in reading comprehension. Depression and anxiety are confirmed as significant predictors of school performance, a finding consistent with previous research documenting the inverse relationship between depressive symptoms and academic achievement in school-aged populations [40,41]. In this study, students with higher levels of depression obtained significantly lower scores in reading comprehension, reinforcing the notion that emotional distress directly impairs essential cognitive functions such as attention, working memory, and self-regulation.
Furthermore, the analyses revealed significant gender differences, with female students reporting higher levels of depression and anxiety than males, in line with international findings [42,43]. These results underscore the importance of adopting a gender-sensitive approach to educational intervention, recognizing that emotional risk factors are not evenly distributed across the student population.
In terms of grade level, third-grade students showed higher levels of depression and anxiety compared to those in higher grades. This trend has been described in the literature as a typical emotional response to early school transitions and adaptation challenges [44]. Our findings align with this pattern and suggest the urgency of implementing emotional support strategies from the earliest stages of schooling.
The multivariate analysis using PCA and K-means clustering identified three student profiles: (1) high performance with emotional stability, (2) intermediate performance with mild distress, and (3) low performance with severe emotional symptoms. This typology aligns with existing evidence from academic risk profiling studies based on machine learning approaches [45,46] offers a valuable framework for designing differentiated interventions tailored to the specific needs of each subgroup.
Finally, the use of advanced statistical models, including parametric, robust, non-parametric, and Bayesian tests, consistently validated the observed differences. This methodological diversity strengthens the reliability of the findings and highlights the value of a multi-method approach in educational research.
It is essential to highlight that specific ethical considerations are considered when using AI in education. Applying predictive models based on artificial intelligence in educational settings, especially involving children, requires careful ethical reflection. While these tools offer valuable opportunities to improve early detection of academic risk, they also pose potential risks related to data privacy, the stigmatization of certain students, and the reinforcement of algorithmic bias.
It is essential to ensure that data is collected, stored, and processed according to transparency, informed consent, and harm minimization principles. Likewise, predictive models should undergo regular assessments of fairness and bias, and their implementation must be framed within institutional policies prioritizing student well-being.
Incorporating human oversight mechanisms and teacher feedback can serve as critical safeguards to prevent automated, decontextualized, or exclusionary decisions
6. Conclusions
The findings presented correspond to the baseline of an ongoing longitudinal study, and therefore, inferences regarding temporal evolution should be considered preliminary. Nevertheless, these results provide a solid foundation for developing more complex predictive models that account for individual trajectories and dynamic patterns of academic risk.
The AI-based academic management model proposed in this study represents a significant advancement in predicting and preventing school failure. Its ability to integrate cognitive, emotional, behavioral, and sociodemographic variables with high precision makes it a valuable tool for teachers, school administrators, and education policymakers.
Beyond its impact on individual academic performance, the model is noteworthy for its potential to reduce systemic inequalities by offering personalized interventions in contexts of high vulnerability. Its gradual implementation could lead to greater educational inclusion and improved learning opportunities for at-risk students.
Looking ahead, the model will be enhanced by incorporating additional variables, such as family engagement and continuous teacher feedback, to enrich and contextualize its application. Efforts will also focus on scalability and adaptability across diverse educational settings, ensuring measurable, sustainable, and replicable impact at an international level.
Finally, to capitalize on the longitudinal design and further improve the model’s predictive capacity, more advanced AI techniques such as neural networks, boosting algorithms, and time-series analysis are envisioned to be integrated. In parallel, monitoring and continuous evaluation mechanisms will be developed to ensure the model’s quality, transparency, and sustainability in various educational contexts.
Acknowledgments
This project received financial support from Minciencias through the Becas Bicentenario II program, which funds the doctoral training of the first author within the PhD program in Information and Communication Technology at Universidad de la Costa. The authors also acknowledge the collaboration of the Leeduca Research Group at the University of Málaga. Sincere thanks are extended to the participating schools, teachers, and parents, whose contributions were essential for this research’s data collection, validation, and analysis phases.
Declaration of interests
The authors declare that they have no conflict of interest relevant to the content of this article.
Study Limitations
Although the findings presented offer robust results, it is essential to acknowledge certain limitations inherent to the design of this study. First, the data corresponds to the first wave of an ongoing longitudinal study, which limits the ability to draw causal inferences or conclusions about changes over time. Additionally, the use of non-probabilistic convenience sampling, focused on a specific population of students in vulnerable conditions in Colombia, restricts the generalizability of the results to other educational contexts. While efforts were made to maximize internal validity through statistical control and the use of standardized instruments, future research should aim to include larger, more representative, and geographically diverse samples to strengthen the proposed model’s external validity.
| 1 | (1) Model obtained. |
References
- E. AGENCY, “Prevention of school failure for Special Needs and Inclusive Education,” Agencia Europea para las necesidades educativas especiales la inclusión educativa, 2020.
- Ministerio de Educación Nacional, “Pruebas PISA 2022: Colombia, un sistema educativo resiliente que requiere cambios estructurales para mejorar su calidad,” 2022.
- M. d. E. Nacional, “Deserción_escolar_2022,” Bogotá, 2022.
- UNESCO, “No dejar a ningún niño o niña atrás: informe mundial sobre la desvinculación de la educación de los niños,” 2022.
- J. Gubbels, C. E. v. d. Put and M. Assink, “Risk Factors for School Absenteeism and Dropout: A Meta-Analytic Review,” Journal of Youth and Adolescence, vol. 48, no. 9, p. 1637–1667, 2019. [CrossRef]
- Laboratorio de Economía de la Educación (LEE), “Tasas_Deserción_Aprobación,” 2023.
- J. A. Castro-Martínez and G. Machuca-Téllez, “University dropout in Latin America: An ecological perspective,” Estudios pedagógicos (Valdivia), vol. 49, no. 2, pp. 87–108,, 2023.
- Y. V. F. Vizcaino, O. A. Z. Duran, R. O. D. Garcia and M. G. Duenas, “Architecture of an Automated System for the Monitoring and Preventión of School DropOut,” in Applications in Software Engineering - Proceedings of the 9th International Conference on Software Process Improvement, CIMPS 2020, 2020.
- H. Liu, M. Mao, X. Li and J. Gao, “Model interpretability on private-safe oriented student dropout prediction,” PLoS One, vol. 20, no. 3, Marzo 2025. [CrossRef]
- C. Henríquez Miranda, D. Salcedo Morillo and G. Sánchez Torres, “El aprendizaje automático en entornos educativos universitarios: Caso deserción académica,” Prospectiva, vol. 20, no. 1, 2022.
- Z. Azizah, T. Ohyama, X. Zhao, Y. Ohkawa and T. Mitsuishi, “Predicting at-risk students in the early stage of a blended learning course via machine learning using limited data,” Computers and Education: Artificial Intelligence, vol. 7, no. 1. [CrossRef]
- D. Kanmani, N. Divakar, E. Keshaveni, Ramesh and M. Prathibha, “Machine Learning in Academic Performance Prediction: Analyzing Attendance and Marks to Forecast Future Results,” in COSMIC 2024 - IEEE International Conference on Computing, Semiconductor, Mechatronics, Intelligent Systems and Communications, Proceedings, 2024.
- L. Z. e. al., “Academic Performance Prediction Based on Multisource, Multifeature Behavioral Data,” IEEE Access, p. 5453–5465, 2021.
- S. Tk and Midhunchakkravarthy, “Academic Performance Prediction of At-Risk Students using Machine Learning Techniques,” in 3rd International Conference on Advance Computing and Innovative Technologies in Engineering, ICACITE 2023, 2023.
- H. Brdesee, W. Alsaggaf, N. Aljohani and S. U. Hassan, “Predictive Model Using a Machine Learning Approach for Enhancing the Retention Rate of Students At-Risk,” International Journal on Semantic Web and Information Systems, vol. 18, no. 1, pp. 1-21, 2022. [CrossRef]
- G. H.Dunteman, “Principal Components Analysis,” 1989.
- H. Costa, “Test discalculia: como evaluar las habilidades matemáticas - Discalculia,” 2023.
- J. A. G. Madruga and J. O. V. Cháves, “Capítulo 6. El desarrollo de la compresión lectora y el razonamiento,” in Psicología del desarrollo II, 2011, pp. 205-239.
- C. Meneghetti, B. Carretti and R. D. Beni, “Components of reading comprehension and scholastic achievement,” Learn Individ Differ, vol. 16, no. 4, p. 291–301, 2006. [CrossRef]
- I. Gómez-Veiga, J. Oscar Vila, J. A. García-Madruga and M. R. . A. C. Elosúa, “Comprensión lectora y procesos ejecutivos de la memoria operativa,” Psicol Educ (Madr), vol. 19, no. 2, p. 103–111, 2013.
- C. D. Robinson, “A Framework for Motivating Teacher-Student Relationships,” Educational Psychology Review, vol. 34, no. 4, p. 2061–2094, 2022. [CrossRef]
- I. López and J. Förster, “Trastornos del neurodesarrollo: dónde estamos hoy y hacia dónde nos dirigimos,” Revista Médica Clínica Las Condes, vol. 33, no. 4, p. 367–378, 2022.
- Y. Kita, F. Ashizawa and M. Inagaki, “Prevalence estimates of neurodevelopmental disorders in Japan: A community sample questionnaire study,” Psychiatry Clin Neurosci, vol. 74, no. 2, p. 118–123, 2020. [CrossRef]
- J. R. Simon, “The effects of an irrelevant directional cue on human information processing,” Advances in Psychology, vol. 95, no. C, p. 31–86, 1990.
- H. Li, T. Xia and L. Wang, “Neural correlates of the reverse Simon effect in the Hedge and Marsh task,” Neuropsychologia, vol. 75, p. 119–131, 2015. [CrossRef]
- L. Wang, J. Li, F. L. .Jia, L. and L. Li, “The Development of Response and Interference Inhibition in Children: Evidence from Serious Game Training,” Children, vol. 11, no. 2, 2024. [CrossRef]
- P. F. Lovibond and S. H. Lovibond, “The structure of negative emotional states: Comparison of the Depression Anxiety Stress Scales (DASS) with the Beck Depression and Anxiety Inventories,” Behaviour Research and Therapy, vol. 33, no. 3, p. 335–343, 1995. [CrossRef]
- F. Román, P. Santibáñez and E. V. Vinet, “Uso de las Escalas de Depresión Ansiedad Estrés (DASS-21) como Instrumento de Tamizaje en Jóvenes con Problemas Clínicos,” Acta Investig Psicol, vol. 6, no. 1, p. 2325–2336, 2016.
- J. Lee, E. H. Lee and S. H. Moon, “Systematic review of the measurement properties of the Depression Anxiety Stress Scales–21 by applying updated COSMIN methodology,” Quality of Life Research, vol. 28, no. 9, p. 2325–2339, 2019. [CrossRef]
- S. Van Buuren and K. Groothuis-Oudshoorn, “MICE: Multivariate Imputation by Chained Equations in R,” J Stat Softw, vol. 45, no. 3, p. 1–67, 2011.
- H. Abdi and L. J. Williams, “Principal component analysis,” Wiley Interdiscip Rev Comput Stat, vol. 2, no. 4, p. 433–459, 2010.
- D. Chicco and G. Jurman, “The advantages of the Matthews correlation coefficient (MCC) over F1 score and accuracy in binary classification evaluation,” BMC Genomics, vol. 21, no. 1, pp. 1-13, 2020. [CrossRef]
- C. W. Okonkwo and A. Ade-Ibijola, “Chatbots applications in education: A systematic review,” Computers and Education: Artificial Intelligence, vol. 2, no. 1, 2021. [CrossRef]
- G. Stoet, “PsyToolkit: A software package for programming psychological experiments using Linux,” Behavior Research Methods, vol. 42, p. 096–1104, 2010. [CrossRef]
- G. S. psytoolkit@gmx.com, “PsyToolkit: A Novel Web-Based Method for Running Online Questionnaires and Reaction-Time Experiments,” Teaching of Psychology, vol. 44, no. 1, pp. 24-31, 2016.
- B. Mustapha, “POWER COMPARISON OF SOME PARAMETRIC AND NON- PARAMETRIC TESTS,” International Journal of Modelling & Applied Science ResearchPublished by Cambridge Research and Publications, vol. 3, no. 9, pp. 1-14, 2024.
- F. Liu, D. Yang, Y. Liu, Q. Zhang, S. Chen, W. Li, J. Ren, X. Tian and X. Wang, “Use of latent profile analysis and k-means clustering to identify student anxiety profiles,” BMC Psychiatry, vol. 22, no. 1, pp. 1-12, 2022.
- J. Lei, “An Analytical Model of College Students’ Mental Health Education Based on the Clustering Algorith,” Math Probl Eng, vol. 2022, no. 1, 2022. [CrossRef]
- M. Orsoni, S. Giovagnoli, S. Garofalo, S. Magri, M. Benvenuti, E. Mazzoni and M. Benassi, “Preliminary evidence on machine learning approaches for clusterizing students’ cognitive profile,” Heliyon, vol. 9, no. 6, pp. 1-11, 2023. [CrossRef]
- M. Liu, K. Lu and X. Wang, “Depression symptoms and academic performance: A meta-analysis.,” Journal of Affective Disorders, vol. 276, no. 1, p. 326–334., 2020.
- C. E. Verboom, J. J. Sijtsema, F. C. Verhulst, B. W. Penninx and J. Ormel, “Longitudinal associations between depressive problems, academic performance, and social functioning in adolescent boys and girls.,” Developmental Psychology, vol. 51, no. 1, p. 247–257, 2014. [CrossRef]
- J. M. Twenge and S. Nolen-Hoeksema, “Age, gender, race, socioeconomic status, and birth cohort differences on the Children’s Depression Inventory: A meta-analysis.,” Journal of Abnormal Psychology,, vol. 111, no. 4, p. 578–588, 2002.
- H. Eschenbeck, C. W. Kohlmann and A. Lohaus, “Gender differences in coping strategies in children and adolescents.,” Journal of Individual Differences, vol. 28, no. 1, pp. 18-26, 2007. [CrossRef]
- J. S. M. C. Eccles, A. Wigfield, C. M. Buchanan, D. Reuman, C. Flanagan and D. Mac Iver, “Development during adolescence: The impact of stage–environment fit on young adolescents’ experiences in schools and in families.,” American Psychologist, vol. 48, no. 2, p. 90–101, 1993.
- S. B. Kotsiantis, C. Pierrakeas and P. Pintelas, “Predicting students’ performance in distance learning using machine learning techniques,” Applied Artificial Intelligence, vol. 18, no. 5, p. 411–426., 2013. [CrossRef]
- J. D. Finn and K. S. Zimmer, “Student engagement: What is it? Why does it matter? n S. L. Christenson et al. (Eds.),,” Applied Artificial Intelligence, Vols. 411-426 , p. 97–131, 2012.
- E. C. Wait, “Global Estimates: Number of crisis-affected children and adolescents in need of education support,” 2022.
- T. Castañeda, “Tareas de control cognitivo Simon Task: revisión crítica - Cognitive Control Tasks Simon Task: Critical Review,” Journal of Science, Humanities and Arts - JOSHA, vol. 9, no. 2, 2022.
- M. Brysbaert, “How many words do we read per minute? A review and meta-analysis of reading rate,” J Mem Lang, vol. 109, pp. 104-147, 2019. [CrossRef]
- S. Fresnoza and A. Ischebeck, “Probing Our Built-in Calculator: A Systematic Narrative Review of Noninvasive Brain Stimulation Studies on Arithmetic Operation-Related Brain Areas,” eNeuro, vol. 11, no. 4, 2024. [CrossRef]
- J. Siemann and F. Petermann, “Evaluation of the Triple Code Model of numerical processing—Reviewing past neuroimaging and clinical findings,” Res Dev Disabil, vol. 72, no. 1, p. 106–117, 2018. [CrossRef]
- A. P. Rockhill, H. Tan, C. G. Lopez Ramos, N. C. B. Shafie, M. N. Shahin, A. Fecker, M. Ismail, D. R. Cleary, K. L. Collins and A. M. Raslan, “Investigating the Triple Code Model in numerical cognition using stereotactic electroencephalography,” PLoS One, vol. 19, no. 12, 2024. [CrossRef]
Disclaimer/Publisher’s Note: The statements, opinions and data contained in all publications are solely those of the individual author(s) and contributor(s) and not of MDPI and/or the editor(s). MDPI and/or the editor(s) disclaim responsibility for any injury to people or property resulting from any ideas, methods, instructions or products referred to in the content. |
© 2026 by the authors. Licensee MDPI, Basel, Switzerland. This article is an open access article distributed under the terms and conditions of the Creative Commons Attribution (CC BY) license (http://creativecommons.org/licenses/by/4.0/).
Copyright: This open access article is published under a Creative Commons CC BY 4.0 license, which permit the free download, distribution, and reuse, provided that the author and preprint are cited in any reuse.


