
Submitted:
18 April 2025
Posted:
21 April 2025
You are already at the latest version
Abstract
This study systematically explores Recursive Feature Elimination (RFE) and its variants as effective methods for feature selection within educational data mining (EDM) and healthcare analytics. Feature selection is crucial in predictive modeling due to challenges arising from high dimensionality and data complexity. The paper first reviews foundational principles of the RFE algorithm, highlighting its iterative mechanism for ranking and removing less informative features. Next, it provides a comprehensive narrative review of various RFE modifications, including integration with different machine learning models, utilization of multiple feature importance metrics, algorithmic enhancements through cross-validation and local search techniques, and hybrid approaches combining RFE with other dimensionality reduction methods. Subsequently, an empirical evaluation compares four RFE variants—standard RFE, RF-RFE, Enhanced RFE, and RFE with local search—across two distinct predictive tasks: regression for predicting students’ mathematics achievement using a digital assessment dataset, and classification for predicting chronic heart failure in a clinical dataset. Results indicate that while RF-RFE captured complex feature interactions and improved predictive performance slightly, Enhanced RFE provided substantial dimensionality reduction with minimal loss in accuracy, offering a balanced approach beneficial for practical applications. The study concludes by discussing implications, limitations, and recommendations for effectively applying RFE in educational and clinical contexts.
Keywords:
feature selection
; educational data mining
; dimensionality
; recursive feature elimination
; healthcare
1. Introduction
The adoption of educational technologies and online learning systems has expanded the amount of information available to educational institutions, generating a “goldmine of educational data” ([1], p. 12) that offers new opportunities to enhance learning experiences, improve learning outcomes, and guide efficient administrative decisions [2]. These educational datasets can contain a large number of diverse features, including administrative data, demographic information, digital traces of learners’ online interactions, and affective qualities measured from self-report instruments [1]. To identify meaningful patterns in these massive datasets, educational data mining (EDM) was born as an interdisciplinary research field that applies statistics, data mining, and machine learning (ML) to the investigation of educational research problems. For example, popular areas of research in EDM are concerned with the prediction of student performance, generating personalized recommendations, improving course structures, or informing organizational processes [3,4,5].
Educational datasets offer enormous potential to deepen our understanding of students’ learning experiences and outcomes, significantly informing educational decision-making processes. However, leveraging this potential requires overcoming considerable challenges associated with managing, processing, and analyzing large, heterogeneous datasets. One prominent issue is the feature abundance often found in educational data, which creates unique obstacles when applying standard ML algorithms within EDM tasks. A particularly prevalent challenge arises from scenarios in which researchers work with datasets containing relatively small sample sizes gathered from classroom environments or other limited-scale educational settings, yet featuring a disproportionately large number of features. This issue, commonly known as data sparsity, results in having few observations per feature and frequently leads to poor predictive performance [6].
Furthermore, advances in natural language processing (NLP)—especially the emergence of large language models (LLMs) such as word embeddings [7] and transformer-based architectures [8]—enable the extraction of extensive numerical representations from textual data to capture intricate semantic meanings. For example, recent research has employed textual features derived from student comments to classify sentiments and attitudes toward Massive Open Online Courses (MOOCs) effectively [9]. Despite their utility, these NLP techniques often produce extremely high-dimensional feature spaces, potentially encompassing hundreds or even thousands of numeric values, many of which might hold minimal predictive relevance. Such high dimensionality not only introduces substantial noise but also increases the risk of model overfitting. Hence, the excessive dimensionality of features in educational datasets can negatively impact the performance and generalizability of ML models, making them overly complex, computationally intensive, challenging to interpret, and difficult to maintain [10]. Addressing these challenges requires careful feature selection, dimensionality reduction strategies, and specialized modeling techniques tailored to the unique characteristics of educational data.
Statisticians and data mining researchers have developed diverse methods to effectively manage the challenges associated with high-dimensional datasets. Broadly, these approaches can be categorized into two main groups: (1) dimensionality reduction techniques, which generate p new features through linear or nonlinear transformations of the original n features, with ; and (2) feature selection methods, which identify and retain a subset of the most relevant original features. Dimensionality reduction methods, such as Principal Component Analysis (PCA), are powerful tools for simplifying the feature space by transforming original attributes into fewer composite features. However, a significant limitation of these methods is the potential loss of interpretability, as the transformed features often lack a clear, intuitive relationship with the original variables [11]. Conversely, in educational contexts, the interpretability and explainability of ML models are highly valued because they enhance transparency, build trust, promote fairness, and support informed decision-making among stakeholders who may not have technical expertise [12]. Consequently, feature selection techniques frequently offer more attractive solutions in educational settings compared to dimensionality reduction methods. By building models on carefully chosen subsets of original features, feature selection preserves interpretability while effectively handling high-dimensional data.
Feature selection techniques can be broadly classified into three distinct categories—filter, wrapper, and embedded methods—based on their dependence on ML algorithms for selecting optimal feature subsets. Filter-based methods identify relevant predictors through univariate statistical measures such as correlation coefficients, information gain, and variance thresholds [13]. Because these methods operate independently of ML models, they tend to be computationally efficient. However, their reliance on univariate measures restricts their ability to capture complex interactions between features. Wrapper-based methods, such as recursive feature elimination (RFE), directly utilize specific ML algorithms to evaluate subsets of features based on predictive performance. By iteratively removing the least important features according to model performance, wrapper methods effectively identify feature subsets that significantly enhance prediction accuracy. Although wrapper methods generally require higher computational resources, they are widely recognized for their superior ability to detect the most critical features, resulting in enhanced predictive performance [14]. Embedded methods integrate feature selection directly into the ML algorithm’s training process, making them highly algorithm-specific. A prominent example is the Least Absolute Shrinkage and Selection Operator (LASSO) regression, which incorporates a regularization term to penalize regression coefficients associated with less important features. This penalization causes some coefficients to shrink to zero, effectively removing irrelevant features from the model [15]. Among these approaches, wrapper methods are frequently cited as being particularly effective due to their flexibility and robust performance. While computationally more intensive compared to filter-based methods, wrapper methods do not impose strict statistical assumptions and offer greater versatility in choosing ML algorithms than embedded methods [14,16].
As one of the most widely utilized wrapper-based feature selection methods, RFE operates by iteratively removing the least important features and retaining a subset that best predicts the target variable [17]. This iterative elimination process effectively reduces feature dimensionality while preserving the predictive relevance of the remaining features. Moreover, the transparent and interpretable nature of RFE makes it particularly advantageous in EDM, where researchers frequently encounter challenges related to high dimensionality and limited sample sizes relative to the number of features. Despite these notable strengths, recent review studies indicate that RFE remains underutilized in EDM research, highlighting it as a relatively overlooked yet potentially powerful method for feature selection [12,18]. Motivated by this gap, this paper explores the multifaceted capabilities of RFE as an effective tool for addressing feature selection challenges within EDM. First, we provide a detailed explanation of RFE’s fundamental principles and its systematic, iterative approach to ranking and eliminating features. Next, we present a narrative review of several RFE variations documented in the literature, highlighting how these alternative approaches differ fundamentally from traditional RFE methods. Finally, we undertake a structured empirical evaluation of four distinct RFE algorithms, applying these methods to feature selection tasks for both regression and classification across datasets derived from two diverse domains: education and health. By evaluating multiple RFE variants across different predictive tasks and dataset domains, our goal is to provide clear guidance for researchers, facilitating informed decisions about the selection and implementation of the most appropriate RFE methodologies for their specific EDM research needs.
2. A Narrative Review of RFE Algorithms and Their Applications in EDM
In this section, we begin by outlining the original RFE algorithm as introduced by Guyon et al. [17]. Next, we survey the diverse array of RFE variants developed to enhance its efficacy, scalability, or adaptability to specific contexts. These variants are categorized based on their difference from the original algorithm in terms of (1) the ML models employed for assessing and ranking feature importance, (2) the combinations of ML models and feature importance metrics, (3) the modifications to the RFE process, or (4) the hybrids of RFE with other feature selection or dimensionality reduction methods. Additionally, we showcase some instances of the application of these RFE variants in the context of EDM to review how they have been utilized.
2.1. The Original RFE Algorithm
The RFE algorithm was initially introduced by Guyon et al. [17] in the context of gene selection for disease classification. Figure 1 illustrates the original RFE process. It begins by building an ML predictive model that includes the complete set of features. In the subsequent step, the importance of each feature is identified and assessed. The nature and information of feature importance vary depending on the ML model used (e.g., regression coefficients for linear models and feature relative importance for tree-based models). Once the importance of each feature is determined, the features are ranked accordingly. The least important features are then removed from the dataset. The next step is to check whether the algorithm should be terminated based on stopping criteria, such as the predefined number of features remaining in the dataset or if removing features no longer improves the model’s prediction performance. If the stopping criteria are not met, a new predictive model will be built using the remaining features. Therefore, this process of training the model, determining feature importance, ranking features, and dropping the least important ones is repeated until the stopping criteria are met, leaving a short but the most important subset of features that contribute the most to the predictive model.
The recursive process employed by RFE exemplifies backward feature elimination [17]. Initially, RFE trains ML models using the complete set of features, subsequently iteratively retraining models with progressively fewer features. This iterative process enables a more thorough assessment of feature importance compared to single-pass approaches, as feature relevance is continuously reassessed after removing the influence of less critical attributes [19]. Consequently, RFE is recognized as a greedy search strategy, as it does not explore all possible feature combinations exhaustively but rather selects locally optimal features at each iteration, aiming toward a globally optimal feature subset [20]. This greedy methodology substantially enhances computational efficiency compared to exhaustive evaluations, which can quickly become computationally infeasible due to the exponential growth of potential feature subsets as dataset dimensionality increases [21].
RFE has demonstrated its effectiveness as a feature selection approach, offering advantages such as dimensionality reduction, improved model accuracy and interpretability, and greater computational efficiency relative to exhaustive feature evaluations. These benefits have contributed significantly to RFE’s popularity within EDM research. For instance, Yeung and Yeung [22] utilized a comprehensive educational dataset to predict whether students would pursue STEM or non-STEM careers post-graduation. After augmenting the original dataset with features extracted via deep knowledge tracing, several dimensionality management and overfitting prevention strategies—including PCA, RFE, and multiple oversampling methods—were compared. Among these, RFE emerged as the most effective strategy for mitigating overfitting and enhancing predictive model performance. Similarly, Pereira et al. [23] employed RFE for predicting student dropout rates. After balancing class labels through undersampling to address overfitting concerns, RFE retained only five of the original 20 features, yielding a high classification accuracy of 80%. This reduced feature set also facilitated a meaningful interpretation of student behaviors associated with adverse educational outcomes, enabling targeted recommendations and interventions.
2.2. Variants of the RFE Algorithm
2.2.1. RFE Wrapped with Different ML Models
As mentioned earlier, a key step in the RFE process is to determine feature importance information, which is usually derived from the ML model used for prediction. This can lead to a variety of choices. For instance, the ML model used in the original RFE algorithm was the Support Vector Machine (SVM) [17]. This combination, referred to as SVM-RFE, has also become one of the most commonly used feature selection methods. The SVM-RFE was originally applied to binary classification tasks; to generalize the use of SVM-RFE for multi-class classification prediction, Duan et al. [24] developed multiple SVM-RFE. Also, considering that the original SVM-RFE performed feature selection in a linear way, Mao et al. [25] extended the algorithm for use with nonlinear, complex data. Several additional extensions of RFE have been proposed in this line of research (e.g., [25,26,27,28]).
There are numerous examples of applying SVM-RFE in educational contexts. For instance, Chen et al. [29] classified Grade 4 students’ digital reading performance as either high or non-high performing. The authors used SVM-RFE to identify 20 key contextual factors and then used these factors for prediction. Their model achieved an Area under the ROC Curve (AUC) score of 89% and accuracy, sensitivity, and specificity of over 80%, indicating good prediction accuracy. Hu et al. [30] also combined SVM and SVM-RFE to identify the top 30 predictors of students’ science achievement from 127 candidate variables about school, classroom, and student characteristics and background.
In addition to SVM models, RFE can also be integrated with tree-based models such as Decision Trees (DT) [31] and Random Forests (RF) [32]. With tree-based models, the relative importance of features can be assessed and used to evaluate the importance of each feature. In addition, in linear models, the importance of features can be determined based on regression coefficients [33]. For example, in predicting students’ teamwork style (i.e., collaborative, cooperative, or solo-submit) on programming projects based on GitHub logs, Gitinabard et al. [34] employed both RF and logistic regression (LR) with RFE to select the most important features.
2.2.2. Combinations of ML Models or Feature Importance Metrics
Researchers have expanded the RFE algorithm by considering multiple feature importance metrics instead of relying on a single metric. These metrics can be generated by considering several distinct ML models or using different metrics from the same model. For example, Jeon and Oh [35] employed three ML models (SVM, RF, and generalized boosted regression algorithms) in the RFE process to determine the importance of features. They weighted the feature importance scores obtained from all three models to create their hybrid RFE algorithm, which yielded better performance in terms of feature selection and model performance improvement.
A similar variant of RFE was employed in an EDM study to investigate factors influencing students’ online learning final results (passing or failing) [36]. Before performing RFE, the authors used each individual feature in the complete set to predict the target variable based on a DT classifier. This process led to the identification of the top 40 candidate features that alone were better able to predict the target variable. These 40 features were then used in RFE with three different modes (SVM, LR, and DT) until all but one predictor had been eliminated. Lastly, the feature importance values obtained from the three models were averaged to obtain the final ranking of the candidate features.
In another EDM study, Alarape et al. [37] proposed a hybrid model consisting of an SVM classifier and a Naive Bayes (NB) classifier for predicting student performance. The two models were selected because they complement each other, with NB being resistant to noise and missing values, while SVM is resistant to overfitting issues. The authors first compared the model performance between the NB classifier and the SVM classifier in predicting the target variable. The better-performing model was then used to wrap RFE and select key predictors, while the other algorithm was trained on the selected features to generate predictions. In their study, the SVM-RFE was the winner for model prediction on the first dataset, so it was used to select 18 out of the 50 original features; this subset was later used to train an NB classifier. Similarly, the NB classifier was the winner on the second dataset, with SVM being used to make predictions using the selected features determined by the NB classifier. This way, their hybrid methods can take advantage of both NB and SVM algorithms and reduce the bias introduced due to the algorithms’ nature.
2.2.3. Modifications to the RFE Process
The original RFE process can be modified to achieve more robust, flexible, and effective feature selection performance. For instance, the original RFE algorithm can benefit from the cross-validation (CV) framework to obtain more stable and reliable estimates of feature importance scores [38,39]. In this approach, CV divides the complete data into several subsets, and an ML model is trained with each subset to obtain multiple sets of feature importance scores. These scores are then averaged and used to iteratively eliminate the least important features until a stopping criterion is met. RFE with CV is more advantageous than basic RFE because it provides more robust results, further prevents overfitting, and increases the generalizability of the algorithm’s performance to unseen data [38]. In a similar vein to the CV framework, researchers have also employed resampling and subsampling strategies to enhance the robustness of the feature elimination results [40,41].
In the education context, Chen et al. [42] used SVM-RFE with a 10-fold CV to predict students’ skill mastery level in a game-based assessment. This allows the SVM-RFE algorithm to estimate the feature importance ten times because each fold of data generates a feature importance score. Averaging the ten feature importance scores thus gives a more robust feature elimination decision. To further reduce the randomness of model performance, the authors repeated the 10-fold CV five times. Eventually, they chose to keep the top five features because the model prediction performance peaked at five features. In another example, Sánchez-Pozo et al. [43] predicted students’ mathematics performance based on their socioeconomic backgrounds and personal characteristics. They compared the performance of basic RFE and RFE with CV, showing that the ML classifier with the original RFE algorithm achieved only 60% on all three evaluation metrics (i.e., recall, accuracy, and F1-score), while the classifier with RFE with CV achieved at least 89% on these metrics. Moreover, Sivaneasharajah et al. [44] used user posts in a forum to predict students’ learning behaviors and roles (e.g., information seeker, information giver) in MOOCs. They first extracted linguistic features using a text-mining tool and then applied RFE with a 10-fold CV to select 16 optimal features, which yielded good prediction performance.
A critique of the original RFE algorithm is that it did not consider the case where weak features, which are useless by themselves, may become very useful in predicting the target variable when combined with other important features [16]. Addressing this critique, Chen and Jeong [45] modified the original RFE process. Instead of directly removing the least important features, the authors considered whether the model’s performance improves or worsens after removing those features in the subsequent prediction model. If the model’s performance drops beyond a certain criterion, the least important features are retained instead of being removed outright, as in the original RFE process. In essence, the enhanced RFE removes features based on changes in model performance rather than solely relying on the importance of the features themselves.
Another limitation of the original RFE algorithm is its greedy search strategy, which determines feature importance based on the current feature set within each iteration (i.e., the local optimal choice). This approach does not guarantee the selection of the best possible feature subset because it does not consider all possible combinations of features. To mitigate this limitation, Samb et al. [20] proposed employing local search tools as an additional step following regular RFE to refine the suggested feature subset. These methods iterate through neighboring solutions, providing previously eliminated features an opportunity for reconsideration. If a neighboring solution is found to be superior to the current one, the algorithm updates to the best solution. This additional step in the feature selection process brought slight improvements in model performance in their empirical study. Another strategy to address the limitation of the greedy search strategy is to consider the marginal improvement in model performance. The original and general RFE algorithms calculate feature importance by building a model with the current complete set of features, but Ding et al. [46] proposed determining feature importance by building models with the current complete set of features negating one feature at a time. This approach allows them to measure how the elimination of each feature can influence the model performance: if one feature provides the least marginal improvement in model performance, then that feature is considered the least important feature. This method is more computationally demanding than the original RFE process but still less demanding than the exhaustive search and evaluation of all possible feature combinations.
Many other RFE variants can be categorized under the theme of modifying the original RFE process. For instance, Han et al. [47] proposed a dynamic RFE that allows the elimination of more than one feature per iteration. Their method offers more flexible feature elimination operations.
2.2.4. RFE Hybridized with Other Feature Selection or Dimension Reduction Methods
RFE can not only work by itself but also be flexible when working with other feature selection methods. For example, in sentiment classification tasks in natural language processing, researchers combined Term Frequency-Inverse Document Frequency (TF-IDF) and SVM-RFE to increase the model’s classification accuracy [48]. TF-IDF was used to obtain the importance information of textual features, followed by SVM-RFE, which iteratively evaluates and ranks the textual features. Eventually, only the most important features are used for the sentiment classification model. Additionally, Paddalwar et al. [49] compared the performance of ML models in predicting students’ academic grades under three different settings for feature selection: a filter-based method (chi-square test), basic RFE, and the combination of chi-square test and RFE. They found that using the chi-square test followed by RFE achieved the best classification accuracy.
Most of the RFE variants are more complicated and computationally demanding than the original RFE algorithm; but combining RFE with other feature selection or dimension reduction methods can help to speed up the feature elimination process. For instance, Lei and Govindaraju [50] employed PCA for dimension reduction and then used RFE to eliminate the extracted components, which led to significantly faster results. However, a major disadvantage of this approach is that using PCA for dimension reduction followed by RFE decreases the model’s interpretability. Moreover, Huang et al. [51] incorporated the K-means clustering technique to identify clusters of features and their representations. Then, they used SVM-RFE to rank and select the representations of feature clusters. Therefore, in their algorithm, the representations of feature clusters are used instead of individual features, which reduces the computational complexity while retaining some of the meanings of the original features.
Hybridizing RFE with other feature selection or dimension reduction methods not only accelerates the RFE process but also offers a more effective strategy for identifying the most important features for predicting the target variable. For example, the SVM-RFE algorithm can be combined with the Gini index (GI) to form a hybrid feature selection approach [52]. Many other studies have proposed similar hybrid algorithms, such as those discussed in [53,54].
3. Methods
In addition to providing a narrative review of RFE variants, this paper presents an empirical evaluation of four variants of RFE. These variants are systematically evaluated across two datasets–education and health–each corresponding to a different predictive task type (regression and classification). While this study primarily focuses on RFE within the context of EDM, our secondary analysis involving a health-related dataset offers important methodological insights. Specifically, we aim to evaluate whether the comparative performance of RFE variants observed in educational contexts holds true across diverse problem domains characterized by different feature structures, types of predictive outcomes, and data complexities. By benchmarking their performance in these heterogeneous scenarios, this analysis aims to guide researchers in selecting and employing RFE algorithms.
3.1. Datasets and Data Preprocessing
The educational dataset was sourced from the Problem Solving and Inquiry (PSI) Tasks, a component of the Trends in International Mathematics and Science Study (TIMSS) 2019 study. The PSI tasks are innovative computer-based assessments designed to evaluate students’ higher-order mathematics and science skills (e.g., dynamic features, problem-solving processes) through digitally-based interactive items in various formats [55]. TIMSS 2019 administered these tasks to approximately 22,000 fourth-grade students from 36 educational systems and 20,000 eighth-grade students from 27 educational systems worldwide. In addition to the PSI assessment data, TIMSS collected contextual questionnaire data from students, parents, teachers, and school principals. These questionnaires aim to explore the relationship between student achievement and contextual factors such as home environment, school climate, and attitudes toward learning. Detailed data collection procedures are documented in the TIMSS 2019 Technical Report [56]. Both the assessment and questionnaire datasets, as well as the codebook for the surveyed variables, are publicly available on the IEA’s website (https://timss2019.org/international-database/index.html, [57]).
For this study, the focus was on the Grade 4 mathematics PSI tasks. The target variable was students’ mathematics achievement, a continuous variable representing their performance. Features included variables from the student questionnaire, capturing information such as home environment, attitudes toward learning, and demographic details. To ensure contextual consistency and reduce inter-country variations, data from six Canadian provinces (Alberta, British Columbia, Newfoundland and Labrador, Nova Scotia, Ontario, and Quebec; coded 9132 to 9137) were analyzed. To ensure data reliability, students with more than 30% missing responses were excluded, as high rates of missingness may indicate carelessness or other difficulties in completing the questionnaire [58,59]. Missing values in the remaining records were imputed using the RF algorithm implemented in the mice R package [60]. Features with zero variance were removed, as they provide no predictive value for machine learning models. Numerical variables were scaled to improve the accuracy and efficiency of machine learning algorithms [61]. After preprocessing, the final dataset consisted of 16,137 students and 116 features. The data was split into training (80%) and test (20%) sets, resulting in 12,910 instances in the training set and 3,227 instances in the test set.
The health dataset was obtained from the Myocardial Infarction Complications Database, publicly available at https://doi.org/10.25392/leicester.data.12045261.v3 [62]. This dataset focuses on myocardial infarction (MI), a leading cause of global mortality. It was collected at the Krasnoyarsk Interdistrict Clinical Hospital (Russia) between 1992 and 1995 and contains 1,700 patient records. The dataset comprises 111 features that describe clinical phenotypes and 12 binary variables representing potential myocardial infarction (MI) complications. A detailed description of the variables is available on its website.
For this study, the target variable was chronic heart failure, which is one of the key complications of MI. Chronic heart failure was selected because of its relatively high incidence rate (; 23.18%), which preserves the dataset’s clinical relevance while alleviating data imbalance challenges. Similar preprocessing steps were applied to the health dataset. Missing values were imputed using the RF algorithm in the mice R package. Numerical variables were scaled, and categorical variables were dummy-coded. This leads to 133 features in total. The dataset was then split into training (80%) and test (20%) sets, with 1,360 rows in the training set and 340 rows in the test set. To address the class imbalance in the binary target variable, the Synthetic Minority Oversampling Technique (SMOTE; [63]) was applied using the imbalanced-learn package in Python. SMOTE ensures an equal distribution of classes in the training data, mitigating the risk of poor model generalizability and high classification error rates for rare categories [64]. This approach is empirically supported as superior to alternative resampling methods in various imbalanced scenarios [4,65,66]. After applying SMOTE, the training set contained 945 instances of chronic heart failure and 1,044 instances of no chronic heart failure, resulting in a balanced total of 1,989 rows.
3.2. Model Training, Validation, and Testing
To evaluate the effectiveness of RFE variants across two predictive tasks, the first task involved regression for the educational dataset, where the goal was to predict students’ mathematics achievement. The second task focused on classification for the health dataset, predicting chronic heart failure. As benchmarks without feature selection, the baseline models employed Support Vector Regression (SVR) for regression tasks and SVM for classification tasks. These models were selected because SVM was used in the original RFE algorithm[17], with SVR being the natural extension and comparable counterpart of SVM for regression tasks [67].
In this study, four variants of RFE were examined: the original RFE algorithm, Enhanced RFE [45], RF-RFE [32], and RFE with a Local Search Operator [20]. The differences among the RFE algorithms are briefly recapped here, as detailed in the literature review. The standard SVR/SVM-RFE algorithm ranks features based on the absolute magnitudes of their weights in the SVR or SVM model, iteratively removing the least important features. In contrast, RF-RFE ranks features using importance scores derived from the RF model, which assesses the decrease in performance when a feature’s values are permuted. This approach captures non-linear interactions and demonstrates robustness to noisy data. Enhanced RFE extends the original algorithm by addressing the potential exclusion of weak but complementary features, iteratively reinstating features that significantly enhance performance. Finally, RFE with Local Search Operators introduces an optimization layer that explores neighboring feature subsets at each iteration, dynamically reconsidering features that were previously eliminated.
All models were implemented using the scikit-learn library in Python. Training and evaluation followed a 5-fold CV scheme to ensure robust performance assessment while mitigating overfitting risks. For RFE algorithms, performance was tracked iteratively, and the optimal number of features was identified based on the iteration yielding the highest average performance metric across folds. Default parameters were used for the SVR and SVM models to reduce computational costs, as this study prioritized comparisons of RFE methods over hyperparameter optimization. Performance metrics were chosen to align with the goals of the respective predictive tasks. For regression, Mean Absolute Error (MAE), Root Mean Square Error (RMSE), and R² were utilized to assess error magnitude, variance explanation, and overall accuracy. For classification, Precision, Recall, and F1 scores were used, reflecting the importance of addressing imbalanced class distributions, particularly in chronic heart failure prediction, where false negatives carry significant consequences. Among these metrics, R² (for regression) and F1 (for classification) served as the primary criteria for evaluating model performance and determining the optimal feature subset. Once the models with the optimal number of features were selected, they were applied to holdout test sets to validate their performance.
4. Results
4.1. Results for the Educational Dataset
Table 1 summarizes the number of features selected by each RFE approach and the corresponding performance metrics in predicting students’ mathematics achievement. The dataset used for this analysis comprised 16,137 students drawn from six Canadian provinces, with a preprocessed set of 116 candidate features derived from the TIMSS student questionnaire.
4.1.1. Baseline: SVR-RFE
When applying the traditional SVR-RFE approach, 82 of the 116 initial features were retained for prediction. This feature subset explained approximately 35.9% of the variance in students’ mathematics achievement (). The reduction in dimensionality—while still leaving a substantial number of predictors—highlights the multifaceted nature of the TIMSS questionnaire data, which captures various background, attitudinal, and demographic factors relevant to educational outcomes. The retained features likely included well-known predictors such as home environment indicators, students’ attitudes toward learning, and demographic information.
4.1.2. RF-RFE
By integrating an RF model into the RFE process, RF-RFE selected 108 features, which is 26 more than the baseline. This resulted in a modest improvement in the coefficient of determination (). Although RF’s non-linear feature-importance mechanism captured additional interactions, the overall gain in predictive power was relatively small compared to the larger feature subset. Of the 108 predictors, 76 overlapped with the baseline SVR-RFE, indicating that many core features were similarly influential across both linear (SVR) and non-linear (RF) methods.
4.1.3. RFE with Local Search Operators
When local search operators were introduced, the method retained 85 features—three more than the baseline. However, this marginally increased subset did not yield better performance, as and the error metrics (RMSE or MAE) did not surpass the baseline. While local search can reevaluate and reinstate previously removed features, these results suggest that in this specific context, the additional complexity did not substantially improve predictive accuracy.
4.1.4. Enhanced RFE
Enhanced RFE produced the largest feature reduction, identifying a subset of only 62 features while maintaining an of 0.340—a mere 0.01 decrease compared to the baseline. The partial overlap (51 of the 62 features) with SVR-RFE underscores that Enhanced RFE identifies many of the same key variables while discarding others that appear redundant or weakly predictive. This approach, which reintroduces potentially complementary predictors in its iterative steps, demonstrates that parsimony is achievable with minimal sacrifice in explanatory power, a critical advantage when interpretability and survey length constraints are of concern.
4.1.5. Summary of Regression Findings
Overall, these results highlight the importance of selecting an appropriate RFE strategy based on study objectives. To summarize the findings, SVR-RFE (Baseline) provides a solid default method that explains 35.9% of variance with 82 features. RF-RFE shows slightly higher predictive performance () but retains most features (108), which may be impractical for large-scale surveys. RFE with Local Search yields a similar feature subset (85 features) to the baseline with no improvement in metrics. Finally, Enhanced RFE achieves significant dimensionality reduction (62 features) at minimal cost in accuracy.
From a practical standpoint, Enhanced RFE provides a balanced approach between maintaining accuracy and minimizing the data-collection burden, making it a compelling choice for large-scale educational assessments where interpretability and cost considerations are paramount. Further research could involve combining Enhanced RFE with hyperparameter tuning or advanced modeling techniques to capitalize on its parsimony while potentially improving predictive performance.
4.2. Results for the Health Dataset
Table 2 summarizes the performance of four RFE-based approaches in predicting chronic heart failure from a health dataset containing 144 original features. The primary metrics used to evaluate classification effectiveness were Precision, Recall, and the F1 score. Precision quantifies the proportion of correctly identified positives among all predicted positives, Recall measures the proportion of actual positives correctly identified, and the F1 score provides a single measure balancing both Precision and Recall. Each algorithm’s feature subset and metric results are detailed below.
4.2.1. Baseline: SVR-RFE
Using the baseline SVR-RFE, the model retained 118 out of 144 features, the largest subset among all methods. This comprehensive set yielded an extremely high Recall of 96.2%, underscoring the method’s tendency to include a wide range of potential predictors associated with positive cases. However, Precision was notably low (28.4%), suggesting the model admitted many false positives into its predictions. As a result, the overall F1 score (0.438) reflects a trade-off: while the method excels at capturing actual positive cases (high Recall), it does so at the cost of misclassifying a substantial number of negative cases as positives (low Precision). In practical clinical settings, this approach might be suitable if the primary goal is to not miss any potential chronic heart failure patients; however, it could also generate high false alarm rates, increasing unnecessary follow-up tests or interventions.
4.2.2. RF-RFE
By contrast, the RF-RFE algorithm retained 110 features, with 89 overlapping those from the baseline approach. This subset achieved a higher Precision of 61.9% but a substantially lower Recall of 16.5%. Thus, while RF-RFE more effectively filters out false positives, it also overlooks many true positives, resulting in a low F1 score of 0.260. In a medical diagnosis context, a high-precision but low-recall model risks failing to detect a large proportion of actual chronic heart failure cases, which could be problematic if early detection and intervention are critical. The shift from a Recall-centric strategy (as in SVR-RFE) to a Precision-centric one (RF-RFE) highlights how the underlying model’s feature-importance mechanism and search procedure can drastically change the distribution of classification errors.
4.2.3. Enhanced RFE
Enhanced RFE selected 106 features, with 89 out of 106 features in a preliminary pool overlapping those used by SVR-RFE. Its Recall (66.3%) fell between that of SVR-RFE and RF-RFE, showing a more balanced ability to detect positive cases. Meanwhile, Precision (63.3%) was notably higher than the baseline’s 28.4%. Together, these improvements resulted in an F1 score of 0.640, indicating a significantly better equilibrium between identifying true positives and minimizing false positives. This method’s iterative approach to reinstating features that may have been prematurely discarded appears beneficial in maintaining relevant predictors while eliminating noise. In a clinical context, Enhanced RFE might be particularly valuable if practitioners seek a more balanced outcome, where capturing a reasonable proportion of true positives is crucial, but without incurring excessive false alarms.
4.2.4. RFE with Local Search Operators
RFE with local search operators also retained 106 features, with 97 overlapping with SVR-RFE’s selection. Its Recall (63.8%) and Precision (61.3%) were similar yet slightly lower to Enhanced RFE, resulting in a decreased F1 score of 0.618 compared to Enhanced RFE’s 0.640. Nonetheless, it still substantially outperformed both SVR-RFE and RF-RFE in terms of the overall balance between Precision and Recall. The local search mechanism appears to have helped the model reconsider critical features that might otherwise be excluded, although it did not surpass Enhanced RFE. For settings that require robust detection but also value reducing false positives, RFE with local search can offer a well-rounded strategy that adapts to complex interactions among features.
4.3. Summary of Classification Findings
In medical classification tasks, the choice between maximizing recall versus precision must be tailored to clinical priorities. SVR-RFE (Baseline) yielded very high Recall () but low Precision (), potentially suitable where missing a true case is highly undesirable (e.g., severe conditions needing immediate attention). However, this approach leads to extensive false positives. RF-RFE significantly improves Precision (), but misses many actual positives (Recall of ), which may not be acceptable where early intervention is critical. Enhanced RFE achieves a balanced approach (F1 of ), providing moderately high Recall and Precision. This makes it attractive when both detecting true positives and reducing false alarms are important for patient care. Lastly, RFE with Local Search shows a similar performance (F1 of ) to Enhanced RFE, while being slightly lower overall. Yet, this approach still offers a considerable improvement in balance over baseline and RF-RFE.
Although SVR-RFE successfully captures nearly all true positives, it floods the results with false positives; conversely, RF-RFE sacrifices too many actual positives to achieve higher Precision. In contrast, both Enhanced RFE and RFE with Local Search both strike a favorable balance for most clinical scenarios. In particular, Enhanced RFE’s ability to reintroduce potentially synergistic features can help preserve relevant signals without retaining an overly large subset, while local search operators can refine borderline predictors to optimize classification. Ultimately, the selection of a method depends on the trade-offs among computational cost, desired interpretability, and the clinical consequences of misclassifying patients. Future directions may include combining either approach with hyperparameter optimization, cost-sensitive learning, or ensemble strategies to further refine performance in health-related classification tasks.
5. Discussion
In predictive modeling contexts across multiple domains, ranging from education to healthcare, the volume and complexity of available data have grown exponentially [1,2]. Effective feature selection is crucial in such high-dimensional contexts, as it serves several key purposes: reducing overfitting risk, improving model interpretability, and lowering computational costs [13,14]. By filtering out irrelevant or redundant variables, researchers can isolate the most meaningful predictors, thereby enhancing both the predictive accuracy and the practical utility of their findings [10,16]. In the context of large-scale educational assessments like TIMSS, feature selection can help policymakers focus on the most impactful factors influencing student achievement. In health applications, it can streamline clinical decision support systems by spotlighting significant risk indicators without drowning medical professionals in excessive data.
RFE has consistently emerged as a potent feature selection technique for both regression and classification tasks [14,17]. Its iterative nature—building models, ranking features based on an importance metric, and iteratively removing the least relevant—allows RFE to adapt to varying relationships within the data. Unlike simpler filter-based methods or single-pass embedded methods, RFE closely couples feature selection with model training, maximizing the likelihood of discovering subsets that truly enhance predictive performance. The approach has proven effective even when underlying relationships are complex, particularly when employing algorithms such as SVM/SVR and RF, which offer robust importance metrics for guiding feature elimination [29,32].
While standard RFE is frequently used, the literature presents several enhanced or alternative variants designed to address its known limitations. For example, Enhanced RFE Chen and Jeong [45] can reintroduce features that may have been prematurely discarded, capturing synergistic effects among variables. RF-RFE Granitto et al. [32] uses RF to capture nonlinear interactions, which can be critical in domains like health and education where predictor interactions are often complex. Local search operators [20], on the other hand, allow RFE methods to reevaluate feature subsets dynamically, preventing suboptimal eliminations that could degrade performance. Each variant caters to different priorities: some focus on maximizing accuracy, others on achieving parsimonious models with minimal loss in predictive power.
This study examined four RFE variants—standard SVR/SVM-RFE, RF-RFE, Enhanced RFE, and RFE with local search operators—on two distinct tasks: a regression problem predicting students’ mathematics achievement using TIMSS data, and a classification task identifying chronic heart failure from health data. In the regression problem, RF-RFE offered the highest , though it retained the largest subset of features, indicating that while it could capture additional nonlinear relationships, it did so at the cost of increased model complexity. Enhanced RFE stood out for its substantial reduction in features with only a marginal drop in predictive accuracy compared to the baseline. This result is especially valuable in educational settings where large-scale data collection can be expensive and time-consuming; fewer features can streamline analyses without sacrificing significant explanatory power.
In the classification task, SVR-RFE showed high recall but low precision, indicating it detected most true positives but admitted too many false positives. RF-RFE reversed the baseline trade-off with higher precision but a steep drop in recall. Enhanced RFE and RFE with Local Search both achieved better balance, delivering more balanced F1 scores. Enhanced RFE demonstrated particularly strong performance, reintroducing complementary features that improved classification accuracy. Local Search RFE had similar performance to Enhanced RFE, suggesting that localized iterative refinements can mitigate the pitfalls of prematurely discarding useful variables.
In sum, consistent with earlier studies by Chen and Jeong [45] and Granitto et al. [32], our findings confirm that RFE approaches incorporating nonlinear interactions (e.g., RF-RFE) effectively capture complex patterns in data. However, our results also extend prior research by showing that the substantial feature reduction achievable through Enhanced RFE can be especially beneficial in large-scale, resource-constrained educational settings. For educators and policymakers utilizing large-scale assessments like TIMSS, Enhanced RFE not only reduces the cost and complexity of data collection but also facilitates clearer, more actionable insights for interventions aimed at improving student outcomes. In healthcare, choosing an appropriate RFE variant requires balancing clinical urgency–high recall for early detection of severe conditions–with the need to avoid resource-intensive false alarms, which Enhanced RFE adeptly accomplishes.
5.1. Limitations and Directions for Future Research
This study has several limitations. First, the narrative review of RFE algorithms may be subject to selection bias. While we aimed to comprehensively survey RFE variants and their applications in educational data mining, the narrative review methodology inherently involves subjective interpretation in categorizing approaches into four major types. This classification framework holds the risk of omitting niche or emerging RFE variants and adaptations.
Second, our empirical evaluation focused on a comparison of four RFE-based algorithms. However, many other RFE variants could potentially yield different or even superior results. Additionally, while we used default parameters for SVR and SVM to keep computational demands manageable, this decision inevitably limited our ability to explore optimal configurations for each RFE method. SVM-based models, in particular, are highly sensitive to hyperparameter choices (e.g., kernel type) and may perform quite differently when tuned through systematic searches such as grid, random, or Bayesian optimization. Nonetheless, our primary objective was not to identify the single "best" RFE approach by prediction accuracy but rather to demonstrate how different RFE techniques highlight distinct dimensions, such as variations in performance metrics or degrees of feature reduction.
Third, while we reported the number of retained features for each variant, we did not examine in depth why specific features emerged as important–an aspect that is especially relevant in education and healthcare, where interpretability is critical. For instance, in patient screening or educational policy-making, understanding why a feature is included can be just as important as its contribution to predictive accuracy. Future research should, therefore, incorporate interpretability-focused analyses, such as evaluating feature importance in relation to domain-specific theory, to ensure that selected features are both data-driven and contextually meaningful.
6. Conclusions
This study begins with a narrative review of the original RFE algorithm and its variants. The review identified four major extensions of the original RFE algorithm: RFE wrapped with different ML models, combinations of ML models or feature importance metrics, modifications to the RFE process, and RFE hybridized with other feature selection or dimension reduction methods. These extensions highlight the adaptability of RFE across various machine learning contexts and its potential to enhance feature selection effectiveness.
Building on this review, the structured empirical evaluation compared the performance of four RFE algorithms in two distinct predictive tasks: regression on an educational dataset and classification on a healthcare dataset. The results demonstrated that each RFE variant prioritizes different aspects and suits different contexts. Therefore, choosing a suitable RFE method ultimately depends on the researcher’s or stakeholder’s priorities. If the primary goal is to achieve the highest possible predictive accuracy, methods such as RF-RFE may be appropriate, given sufficient resources to handle larger feature subsets. However, if maintaining strong performance while significantly reducing model complexity is essential—as is often the case in large-scale educational assessments or resource-constrained healthcare settings—Enhanced RFE emerges as a compelling choice. In both the educational and health classification tasks examined here, Enhanced RFE offered a balanced blend of high performance and effective feature reduction. Therefore, Enhanced RFE may be considered preferable when aiming to streamline data collection, reduce model complexity, and preserve interpretability without substantially compromising accuracy.
These findings support the broader perspective in the literature that sophisticated RFE variants can yield substantial benefits over standard approaches by capturing complementary or nonlinear relationships that might be overlooked. Future work could explore integrating hyperparameter tuning or cost-sensitive schemes within Enhanced RFE to further refine its performance and adapt it to specific domain requirements.
Author Contributions
Conceptualization, O.B.; methodology, E.M. and B.T.; software, E.M. and B.T.; validation, E.M., B.T., and A.S.; formal analysis, E.M. and B.T.; investigation, O.B., E.M., B.T., and A.S.; writing—original draft preparation, O.B., E.M., B.T., and A.S.; writing—review and editing, O.B., E.M., B.T., and A.S.; supervision, O.B.. All authors have read and agreed to the published version of the manuscript.
Funding
This research received no external funding.
Institutional Review Board Statement
Not applicable.
Informed Consent Statement
Not applicable.
Data Availability Statement
The datasets used in this study are publicly available. The TIMSS 2019 International Database can be accessed via https://timss2019.org/international-database/. Similarly, the health dataset can be downloaded from the Myocardial Infarction Complications Database, https://doi.org/10.25392/leicester.data.12045261.v3.
Conflicts of Interest
The authors declare no conflicts of interest.
Abbreviations
The following abbreviations are used in this manuscript:
| AUC | Area under the Curve |
| CV | Cross-validation |
| DT | Decision Trees |
| EDM | Educational Data Mining |
| GI | Gini index |
| LASSO | Least Absolute Shrinkage and Selection Operator |
| LR | Logistic Regression |
| LLM | Large Language Models |
| MAE | Mean Absolute Error |
| ML | Machine Learning |
| MOOC | Massive Open Online Courses |
| NLP | Natural Language Processing |
| PCA | Principal Component Analysis |
| PSI | Problem Solving and Inquiry |
| RF | Random Forests |
| RFE | Recursive Feature Elimination |
| RMSE | Root Mean Square Error |
| SMOTE | Synthetic Minority Oversampling Technique |
| SVM | Support Vector Machine |
| SVR | Support Vector Regression |
| TIMSS | Trends in International Mathematics and Science Study |
References
- Romero, C.; Ventura, S. Data mining in education. Wiley Interdisciplinary Reviews: Data mining and knowledge discovery 2013, 3, 12–27. [Google Scholar] [CrossRef]
- Algarni, A. Data mining in education. International Journal of Advanced Computer Science and Applications 2016, 7. [Google Scholar] [CrossRef]
- Romero, C.; Ventura, S. Educational data mining: a review of the state of the art. IEEE Transactions on Systems, Man, and Cybernetics, Part C (applications and reviews) 2010, 40, 601–618. [Google Scholar] [CrossRef]
- Wongvorachan, T.; He, S.; Bulut, O. A comparison of undersampling, oversampling, and SMOTE methods for dealing with imbalanced classification in educational data mining. Information 2023, 14, 54. [Google Scholar] [CrossRef]
- Bulut, O.; Wongvorachan, T.; He, S.; Lee, S. Enhancing high-school dropout identification: a collaborative approach integrating human and machine insights. Discover Education 2024, 3, 109. [Google Scholar] [CrossRef]
- Cui, Z.; Gong, G. The effect of machine learning regression algorithms and sample size on individualized behavioral prediction with functional connectivity features. Neuroimage 2018, 178, 622–637. [Google Scholar] [CrossRef]
- Mikolov, T.; Sutskever, I.; Chen, K.; Corrado, G.S.; Dean, J. Distributed representations of words and phrases and their compositionality. Advances in neural information processing systems 2013, 26. [Google Scholar] [CrossRef]
- Vaswani, A.; Shazeer, N.; Parmar, N.; Uszkoreit, J.; Jones, L.; Gomez, A.N.; Kaiser, Ł.; Polosukhin, I. Attention is all you need. Advances in neural information processing systems. 2017; 30. [CrossRef]
- Shaik, T.; Tao, X.; Dann, C.; Xie, H.; Li, Y.; Galligan, L. Sentiment analysis and opinion mining on educational data: A survey. Natural Language Processing Journal 2023, 2, 100003. [Google Scholar] [CrossRef]
- James, T.P.G.; Karthikeyan, B.Y.; Ashok, P.; Suganya, R.; Maharaja, K.; et al. Strategic Integration of CNN, SVM, and XGBoost for Early-stage Tumor Detection using Hybrid Deep Learning Method. In Proceedings of the 2023 International Conference on Innovative Computing, Intelligent Communication and Smart Electrical Systems (ICSES). IEEE, 2023, pp. 1–6.
- Palo, H.K.; Sahoo, S.; Subudhi, A.K. Dimensionality reduction techniques: Principles, benefits, and limitations. Data Analytics in Bioinformatics: A Machine Learning Perspective 2021, pp. 77–107.
- Alalawi, K.; Athauda, R.; Chiong, R. Contextualizing the current state of research on the use of machine learning for student performance prediction: A systematic literature review. Engineering Reports, 2023; e12699. [Google Scholar]
- Venkatesh, B.; Anuradha, J. A review of feature selection and its methods. Cybernetics and information technologies 2019, 19, 3–26. [Google Scholar] [CrossRef]
- Liu, W.; Wang, J. Recursive elimination–election algorithms for wrapper feature selection. Applied Soft Computing 2021, 113, 107956. [Google Scholar] [CrossRef]
- Tibshirani, R. Regression shrinkage and selection via the lasso. Journal of the Royal Statistical Society Series B: Statistical Methodology 1996, 58, 267–288. [Google Scholar] [CrossRef]
- Guyon, I.; Elisseeff, A. An introduction to variable and feature selection. Journal of machine learning research 2003, 3, 1157–1182. [Google Scholar] [CrossRef]
- Guyon, I.; Weston, J.; Barnhill, S.; Vapnik, V. Gene selection for cancer classification using support vector machines. Machine learning 2002, 46, 389–422. [Google Scholar] [CrossRef]
- Albreiki, B.; Zaki, N.; Alashwal, H. A systematic literature review of student’performance prediction using machine learning techniques. Education Sciences 2021, 11, 552. [Google Scholar] [CrossRef]
- Chen, R.; Manongga, W.; Dewi, C. Recursive Feature Elimination for Improving Learning Points on Hand-Sign Recognition. Future Internet, 14 (12), 352, 2022.
- Samb, M.L.; Camara, F.; Ndiaye, S.; Slimani, Y.; Esseghir, M.A. A novel RFE-SVM-based feature selection approach for classification. International Journal of Advanced Science and Technology 2012, 43, 27–36. [Google Scholar]
- Reunanen, J. Overfitting in making comparisons between variable selection methods. Journal of Machine Learning Research 2003, 3, 1371–1382. [Google Scholar]
- Yeung, C.K.; Yeung, D.Y. Incorporating features learned by an enhanced deep knowledge tracing model for stem/non-stem job prediction. International Journal of Artificial Intelligence in Education 2019, 29, 317–341. [Google Scholar] [CrossRef]
- Pereira, F.D.; Oliveira, E.; Cristea, A.; Fernandes, D.; Silva, L.; Aguiar, G.; Alamri, A.; Alshehri, M. Early dropout prediction for programming courses supported by online judges. In Proceedings of the Artificial Intelligence in Education: 20th International Conference, AIED 2019, Chicago, IL, USA, June 25-29, 2019, Proceedings, Part II 20. Springer, 2019; pp. 67–72.
- Duan, K.B.; Rajapakse, J.C.; Wang, H.; Azuaje, F. Multiple SVM-RFE for gene selection in cancer classification with expression data. IEEE transactions on nanobioscience 2005, 4, 228–234. [Google Scholar] [CrossRef]
- Mao, Y.; Zhou, X.; Yin, Z.; Pi, D.; Sun, Y.; Wong, S.T. Gene selection using Gaussian kernel support vector machine based recursive feature elimination with adaptive kernel width strategy. In Proceedings of the Rough Sets and Knowledge Technology: First International Conference, RSKT 2006, Chongquing, China, July 24-26, 2006. Proceedings 1. Springer, 2006; pp. 799–806.
- Zhou, X.; Tuck, D.P. MSVM-RFE: extensions of SVM-RFE for multiclass gene selection on DNA microarray data. Bioinformatics 2007, 23, 1106–1114. [Google Scholar] [CrossRef]
- Zhang, L.; Zheng, X.; Pang, Q.; Zhou, W. Fast Gaussian kernel support vector machine recursive feature elimination algorithm. Applied Intelligence 2021, 51, 9001–9014. [Google Scholar] [CrossRef]
- Cao, J.; Zhang, L.; Wang, B.; Li, F.; Yang, J. A fast gene selection method for multi-cancer classification using multiple support vector data description. Journal of biomedical informatics 2015, 53, 381–389. [Google Scholar] [CrossRef] [PubMed]
- Chen, F.; Sakyi, A.; Cui, Y. Identifying key contextual factors of digital reading literacy through a machine learning approach. Journal of Educational Computing Research 2022, 60, 1763–1795. [Google Scholar] [CrossRef]
- Hu, J.; Peng, Y.; Ma, H. Examining the contextual factors of science effectiveness: a machine learning-based approach. School Effectiveness and School Improvement 2022, 33, 21–50. [Google Scholar] [CrossRef]
- Lian, W.; Nie, G.; Jia, B.; Shi, D.; Fan, Q.; Liang, Y. An intrusion detection method based on decision tree-recursive feature elimination in ensemble learning. Mathematical Problems in Engineering 2020, 2020, 1–15. [Google Scholar] [CrossRef]
- Granitto, P.M.; Furlanello, C.; Biasioli, F.; Gasperi, F. Recursive feature elimination with random forest for PTR-MS analysis of agroindustrial products. Chemometrics and intelligent laboratory systems 2006, 83, 83–90. [Google Scholar] [CrossRef]
- Zheng, S.; Liu, W. Lasso based gene selection for linear classifiers. In Proceedings of the 2009 IEEE International Conference on Bioinformatics and Biomedicine Workshop. IEEE; 2009; pp. 203–208. [Google Scholar] [CrossRef]
- Gitinabard, N.; Okoilu, R.; Xu, Y.; Heckman, S.; Barnes, T.; Lynch, C. Student Teamwork on Programming Projects: What can GitHub logs show us? arXiv preprint arXiv:2008.11262, 2020. [Google Scholar] [CrossRef]
- Jeon, H.; Oh, S. Hybrid-recursive feature elimination for efficient feature selection. Applied Sciences 2020, 10, 3211. [Google Scholar] [CrossRef]
- Chai, Y.; Lei, C.; Yin, C. Study on the influencing factors of online learning effect based on decision tree and recursive feature elimination. In Proceedings of the Proceedings of the 10th International Conference on E-Education, E-Business, E-Management and E-Learning, 2019, pp. 52–57. [CrossRef]
- Alarape, M.A.; Ameen, A.O.; Adewole, K.S. Hybrid students’ academic performance and dropout prediction models using recursive feature elimination technique. In Advances on Smart and Soft Computing: Proceedings of ICACIn 2021; Springer, 2021; pp. 93–106.
- Nguyen, H.N.; Ohn, S.Y. Drfe: Dynamic recursive feature elimination for gene identification based on random forest. In Proceedings of the International conference on neural information processing. Springer, 2006, pp. 1–10. [CrossRef]
- Artur, M. Review the performance of the Bernoulli Naïve Bayes Classifier in Intrusion Detection Systems using Recursive Feature Elimination with Cross-validated selection of the best number of features. Procedia computer science 2021, 190, 564–570. [Google Scholar] [CrossRef]
- Wottschel, V.; Chard, D.T.; Enzinger, C.; Filippi, M.; Frederiksen, J.L.; Gasperini, C.; Giorgio, A.; Rocca, M.A.; Rovira, A.; De Stefano, N.; et al. SVM recursive feature elimination analyses of structural brain MRI predicts near-term relapses in patients with clinically isolated syndromes suggestive of multiple sclerosis. NeuroImage: Clinical 2019, 24, 102011. [Google Scholar] [CrossRef]
- van der Ploeg, T.; Steyerberg, E.W. Feature selection and validated predictive performance in the domain of Legionella pneumophila: a comparative study. BMC Research Notes 2016, 9, 1–7. [Google Scholar] [CrossRef]
- Chen, F.; Cui, Y.; Chu, M.W. Utilizing game analytics to inform and validate digital game-based assessment with evidence-centered game design: A case study. International Journal of Artificial Intelligence in Education 2020, 30, 481–503. [Google Scholar] [CrossRef]
- Sánchez-Pozo, N.; Chamorro-Hernández, L.; Mina, J.; Márquez, J. Comparative analysis of feature selection techniques in predictive modeling of mathematics performance: An Ecuadorian case study. Educ. Sci. Manag 2023, 1, 111–121. [Google Scholar] [CrossRef]
- Sivaneasharajah, L.; Falkner, K.; Atapattu, T. Investigating Students’ Learning in Online Learning Environment. In Proceedings of the EDM, 2020.
- Chen, X.w.; Jeong, J.C. Enhanced recursive feature elimination. In Proceedings of the Sixth international conference on machine learning and applications (ICMLA 2007). IEEE, 2007, pp. 429–435. [CrossRef]
- Ding, X.; Li, Y.; Chen, S. Maximum margin and global criterion based-recursive feature selection. Neural Networks 2024, 169, 597–606. [Google Scholar] [CrossRef]
- Han, Y.; Huang, L.; Zhou, F. A dynamic recursive feature elimination framework (dRFE) to further refine a set of OMIC biomarkers. Bioinformatics 2021, 37, 2183–2189. [Google Scholar] [CrossRef] [PubMed]
- Nafis, N.S.M.; Awang, S. An enhanced hybrid feature selection technique using term frequency-inverse document frequency and support vector machine-recursive feature elimination for sentiment classification. IEEE Access 2021, 9, 52177–52192. [Google Scholar] [CrossRef]
- Paddalwar, S.; Mane, V.; Ragha, L. Predicting students’ academic grade using machine learning algorithms with hybrid feature selection approach. In Proceedings of the ITM Web of Conferences. EDP Sciences, 2022, Vol. 44, p. 03036. [CrossRef]
- Lei, H.; Govindaraju, V. Speeding up multi-class SVM evaluation by PCA and feature selection. Feature Selection for Data Mining 2005, 72. [Google Scholar]
- Huang, X.; Zhang, L.; Wang, B.; Li, F.; Zhang, Z. Feature clustering based support vector machine recursive feature elimination for gene selection. Applied Intelligence 2018, 48, 594–607. [Google Scholar] [CrossRef]
- Almutiri, T.; Saeed, F. A hybrid feature selection method combining Gini index and support vector machine with recursive feature elimination for gene expression classification. International Journal of Data Mining, Modelling and Management 2022, 14, 41–62. [Google Scholar] [CrossRef]
- Lin, X.; Wang, Q.; Yin, P.; Tang, L.; Tan, Y.; Li, H.; Yan, K.; Xu, G. A method for handling metabonomics data from liquid chromatography/mass spectrometry: combinational use of support vector machine recursive feature elimination, genetic algorithm and random forest for feature selection. Metabolomics 2011, 7, 549–558. [Google Scholar] [CrossRef]
- Louw, N.; Steel, S. Variable selection in kernel Fisher discriminant analysis by means of recursive feature elimination. Computational Statistics & Data Analysis 2006, 51, 2043–2055. [Google Scholar] [CrossRef]
- Mullis, I.V.; Martin, M.O.; Fishbein, B.; Foy, P.; Moncaleano, S. Findings from the TIMSS 2019 problem solving and inquiry tasks. Retrieved from Boston College, TIMSS & PIRLS International Study Center. website: https://timssandpirls. bc. edu/timss2019/psi 2021.
- Martin, M.O.; von Davier, M.; Mullis, I.V. Methods and procedures: TIMSS 2019 Technical Report. International Association for the Evaluation of Educational Achievement 2020.
- Fishbein, B.; Foy, P.; Yin, L. TIMSS 2019 user guide for the international database. Hentet fra https://timssandpirls. bc. edu/timss2019/international-database 2021.
- Ulitzsch, E.; Yildirim-Erbasli, S.N.; Gorgun, G.; Bulut, O. An explanatory mixture IRT model for careless and insufficient effort responding in self-report measures. British Journal of Mathematical and Statistical Psychology 2022, 75, 668–698. [Google Scholar] [CrossRef]
- Wongvorachan, T.; Bulut, O.; Liu, J.X.; Mazzullo, E. A Comparison of Bias Mitigation Techniques for Educational Classification Tasks Using Supervised Machine Learning. Information 2024, 15, 326. [Google Scholar] [CrossRef]
- Zhang, Z. Multiple imputation with multivariate imputation by chained equation (MICE) package. Annals of translational medicine 2016, 4. [Google Scholar]
- Ahsan, M.M.; Mahmud, M.P.; Saha, P.K.; Gupta, K.D.; Siddique, Z. Effect of data scaling methods on machine learning algorithms and model performance. Technologies 2021, 9, 52. [Google Scholar] [CrossRef]
- Golovenkin, S.; Gorban, A.; Mirkes, E.; Shulman, V.; Rossiev, D.; Shesternya, P.; Nikulina, S.Y.; Orlova, Y.V.; Dorrer, M. Complications of myocardial infarction: a database for testing recognition and prediction systems, 2020.
- Chawla, N.V.; Bowyer, K.W.; Hall, L.O.; Kegelmeyer, W.P. SMOTE: synthetic minority over-sampling technique. Journal of artificial intelligence research 2002, 16, 321–357. [Google Scholar] [CrossRef]
- Mao, A.; Huang, E.; Wang, X.; Liu, K. Deep learning-based animal activity recognition with wearable sensors: Overview, challenges, and future directions. Computers and Electronics in Agriculture 2023, 211, 108043. [Google Scholar] [CrossRef]
- Blagus, R.; Lusa, L. SMOTE for high-dimensional class-imbalanced data. BMC bioinformatics 2013, 14, 1–16. [Google Scholar] [CrossRef]
- Van Hulse, J.; Khoshgoftaar, T.M.; Napolitano, A.; Wald, R. Feature selection with high-dimensional imbalanced data. In Proceedings of the 2009 IEEE International Conference on Data Mining Workshops. IEEE, 2009, pp. 507–514.
- Gunn, S.R. Support vector machines for classification and regression. Technical report, Citeseer, 1997.
Figure 1.
The process of the original recursive feature elimination algorithm.
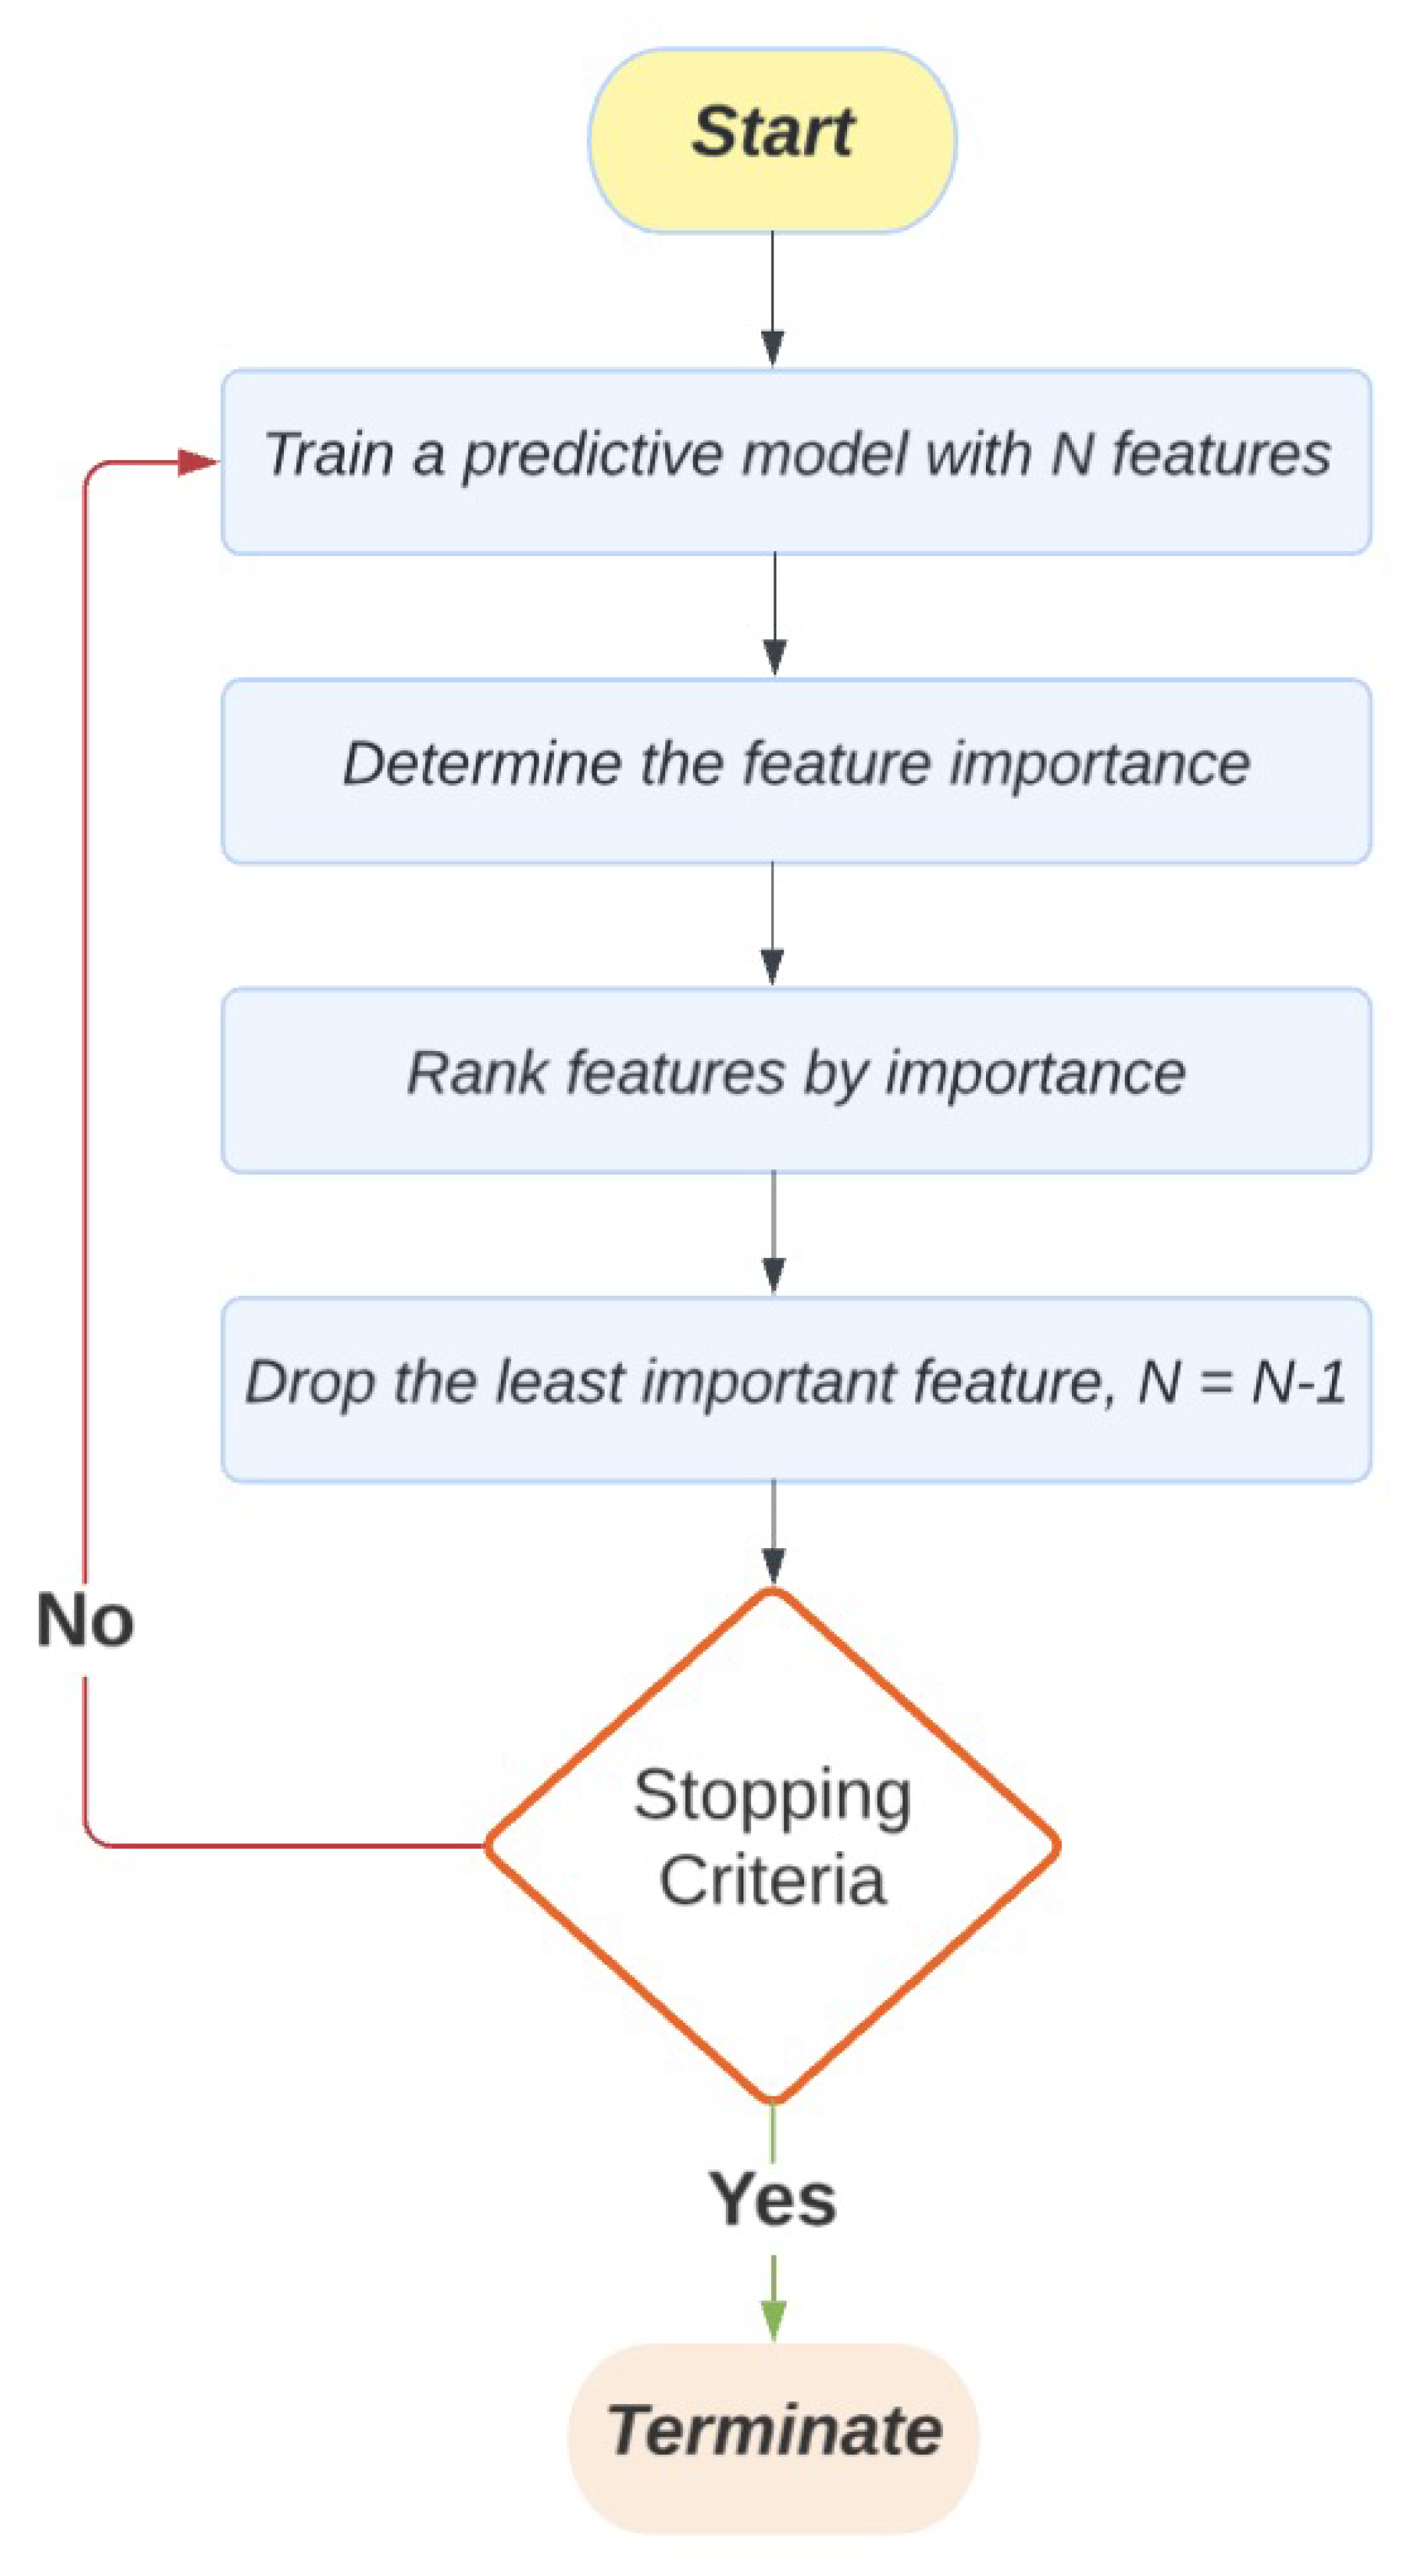

Table 1.
Number of features selected and performance metrics achieved by each RFE approach for the educational (regression) task.
Table 1.
Number of features selected and performance metrics achieved by each RFE approach for the educational (regression) task.
| Algorithm | Number of Features | RMSE | MAE | R2 |
|---|---|---|---|---|
| SVR-RFE (Baseline) | 82 | 57.357 | 45.957 | 0.359 |
| RF-RFE | 108 | 56.474 | 44.377 | 0.379 |
| Enhanced RFE | 62 | 58.234 | 46.577 | 0.340 |
| RFE with local search operator | 85 | 57.442 | 46.091 | 0.357 |
Table 2.
Number of features selected and performance metrics achieved by each RFE approach for the health classification task.
Table 2.
Number of features selected and performance metrics achieved by each RFE approach for the health classification task.
| Algorithm | Number of Features | F1 | Precision | Recall |
|---|---|---|---|---|
| SVR-RFE (Baseline) | 118 | 0.438 | 0.284 | 0.962 |
| RF-RFE | 110 | 0.260 | 0.619 | 0.165 |
| Enhanced RFE | 106 | 0.640 | 0.633 | 0.663 |
| RFE with local search operator | 106 | 0.618 | 0.613 | 0.638 |
Disclaimer/Publisher’s Note: The statements, opinions and data contained in all publications are solely those of the individual author(s) and contributor(s) and not of MDPI and/or the editor(s). MDPI and/or the editor(s) disclaim responsibility for any injury to people or property resulting from any ideas, methods, instructions or products referred to in the content. |
© 2025 by the authors. Licensee MDPI, Basel, Switzerland. This article is an open access article distributed under the terms and conditions of the Creative Commons Attribution (CC BY) license (http://creativecommons.org/licenses/by/4.0/).
Copyright: This open access article is published under a Creative Commons CC BY 4.0 license, which permit the free download, distribution, and reuse, provided that the author and preprint are cited in any reuse.


