Submitted:
09 February 2026
Posted:
10 February 2026
You are already at the latest version
Abstract
This study investigates the effects of two process parameters (dispense delay and recoat speed) on green part density and powder bed density in binder jetting additive manufacturing using silicon carbide powder. These two process parameters control the amount of powder dispensed on the powder bed for each powder layer. Experiments were conducted at three levels of dispense delay (0.2, 1, and 5 s) and three levels of recoat speeds (5, 10, and 20 mm/s). The one-way ANOVA results reveal that both dispense delay and recoat speed have statistically significant effects on green part density and powder bed density. Experimental results show that increasing dispense delay or decreasing recoat speed leads to higher green part density and powder bed density. These findings provide useful insights into optimizing binder jetting additive manufacturing process parameters to achieve desired green part density without employing powder bed compaction.
Keywords:
binder jetting
; dispense delay
; green part density
; powder bed density
; recoat speed
; silicon carbide
1. Introduction
Binder jetting additive manufacturing involves binder jetting as well as several post-printing processing steps, as shown in Figure 2. Binder jetting forms printed parts by jetting a liquid binder onto selected regions of a powder bed. After going through curing and depowdering, the printed parts are referred to as green parts. These green parts usually need to go through debinding and sintering to achieve the desired properties. More detailed descriptions of binder jetting and its post-printing processing steps can be found in the literature [1].
Figure 1 shows the schematic diagram of roller-powder interaction at varying dispense delay. A counter-rotating roller is used to distribute dispensed powder across the powder bed. The amount of powder dispensed and subsequently spread by the roller significantly affects powder packing, which in turn governs both the powder bed density and green part density. While spreading, some excess powder is pushed off the powder bed by the roller, a portion of the excess powder is also pushed downward into the powder layers below. When a relatively large amount of powder is dispensed prior to spreading, a higher powder pile forms in front of the roller during the spreading process. As the roller advances, higher pile of powder in front of roller causes more powder to be pushed downward. Dispensing too much powder onto the powder bed can lead to waste of powder and cause the powder pile in front of the roller to reach the screen, making it difficult for the roller to spread and remove the excess powder effectively. In binder jetting, the screen refers to the perforated plate located at the bottom of the powder dispensing hopper. The powder in the hopper is dispensed through the screen on to the build plate or powder bed. Conversely, if too little powder is dispensed, it may result in uneven powder distribution across the powder bed.
Published studies have examined the effects of some printing parameters (such as layer thickness, binder saturation, drying time, roller speed, and compaction thickness) on green part density. A summary of reported studies on green part density is presented in Table 1.
Published studies have shown that spreading-related parameters, such as roller rotation speed and recoat speed, strongly influence powder packing behavior and green part density. For instance, it was experimentally demonstrated that increasing recoat speed results in a decrease in green part density and a larger variation in density among printed parts within each print [17]. A previous study investigated roller-based powder spreading of Al2O3 ceramic powder with a particle size of 48 µm [22]. The study showed that particles undergo shear-induced rearrangement and avalanche-type flow ahead of the roller during spreading. Increasing roller traverse speed reduces the time available for particle settling and void filling, causing a decrease in powder bed density. A previous DEM-based study on roller-based spreading of 316L stainless steel powder with a particle size of 53 µm showed that particles accumulate in front of the roller during spreading [23]. The powder is transported through a free-flow region ahead of the roller and a compression region beneath the roller. In the compression region, roller–powder contact promotes particle rearrangement, which governs the resulting powder bed density. There are no reported studies focusing on powder pile formation influenced by dispense delay and dynamic interactions governed by roller traverse speed. However, no systematic experimental investigation has been reported to quantify how dispense delay and recoat speed influence green part density in binder jetting. This study aims to fill the gap in literature.
2. Materials and Methods
2.1. Feedstock Powder
The silicon carbide (SiC) powder used in this study was supplied by Electro Abrasives LLC (Buffalo, NY, USA). Its particle size distribution (PSD) was analyzed using a laser scattering particle size analyzer (Horiba LA-960, Kyoto, Japan). The PSD was characterized by D10, D50, and D90 values of 6 µm, 14 µm, and 70 µm, respectively. After drying, the raw powder was sieved through a 100-µm sieve (ASTM Mesh No. 140) to remove large agglomerates prior to binder jetting.
2.2. Binder Jetting of Printed Parts
A binder jetting 3D printer (Innovent+, ExOne, North Huntington, PA, USA) along with an aqueous binder (BA005, ExOne, North Huntington, PA, USA) was employed to fabricate printed parts. The 3D model of the printed parts—20 mm in length, 22 mm in width, and 3.5 mm in thickness—was designed using Creo Parametric v9.0 (Boston, MA, USA). This CAD software was also used to export the 3D model as an STL file, which was then converted into G-code to guide the printer with detailed instructions for printing.
The binder jetting process, illustrated in Figure 2, began with lowering the build plate by a predefined layer thickness (LT). A heat lamp then passed over the build plate to dry the powder bed, as shown in Figure 2 (a). Next, the feedstock powder was dispensed from a horizontally moving hopper and spread across the powder bed by a counter-rotating roller, as shown in Figure 2 (b). The print head then selectively deposited the binder onto specified regions of the powder bed (according to the STL files) to bind the powder particles together, as shown in Figure 2 (c).
Figure 2.
Illustration of steps in binder jetting 3D printing (LT stands for layer thickness).
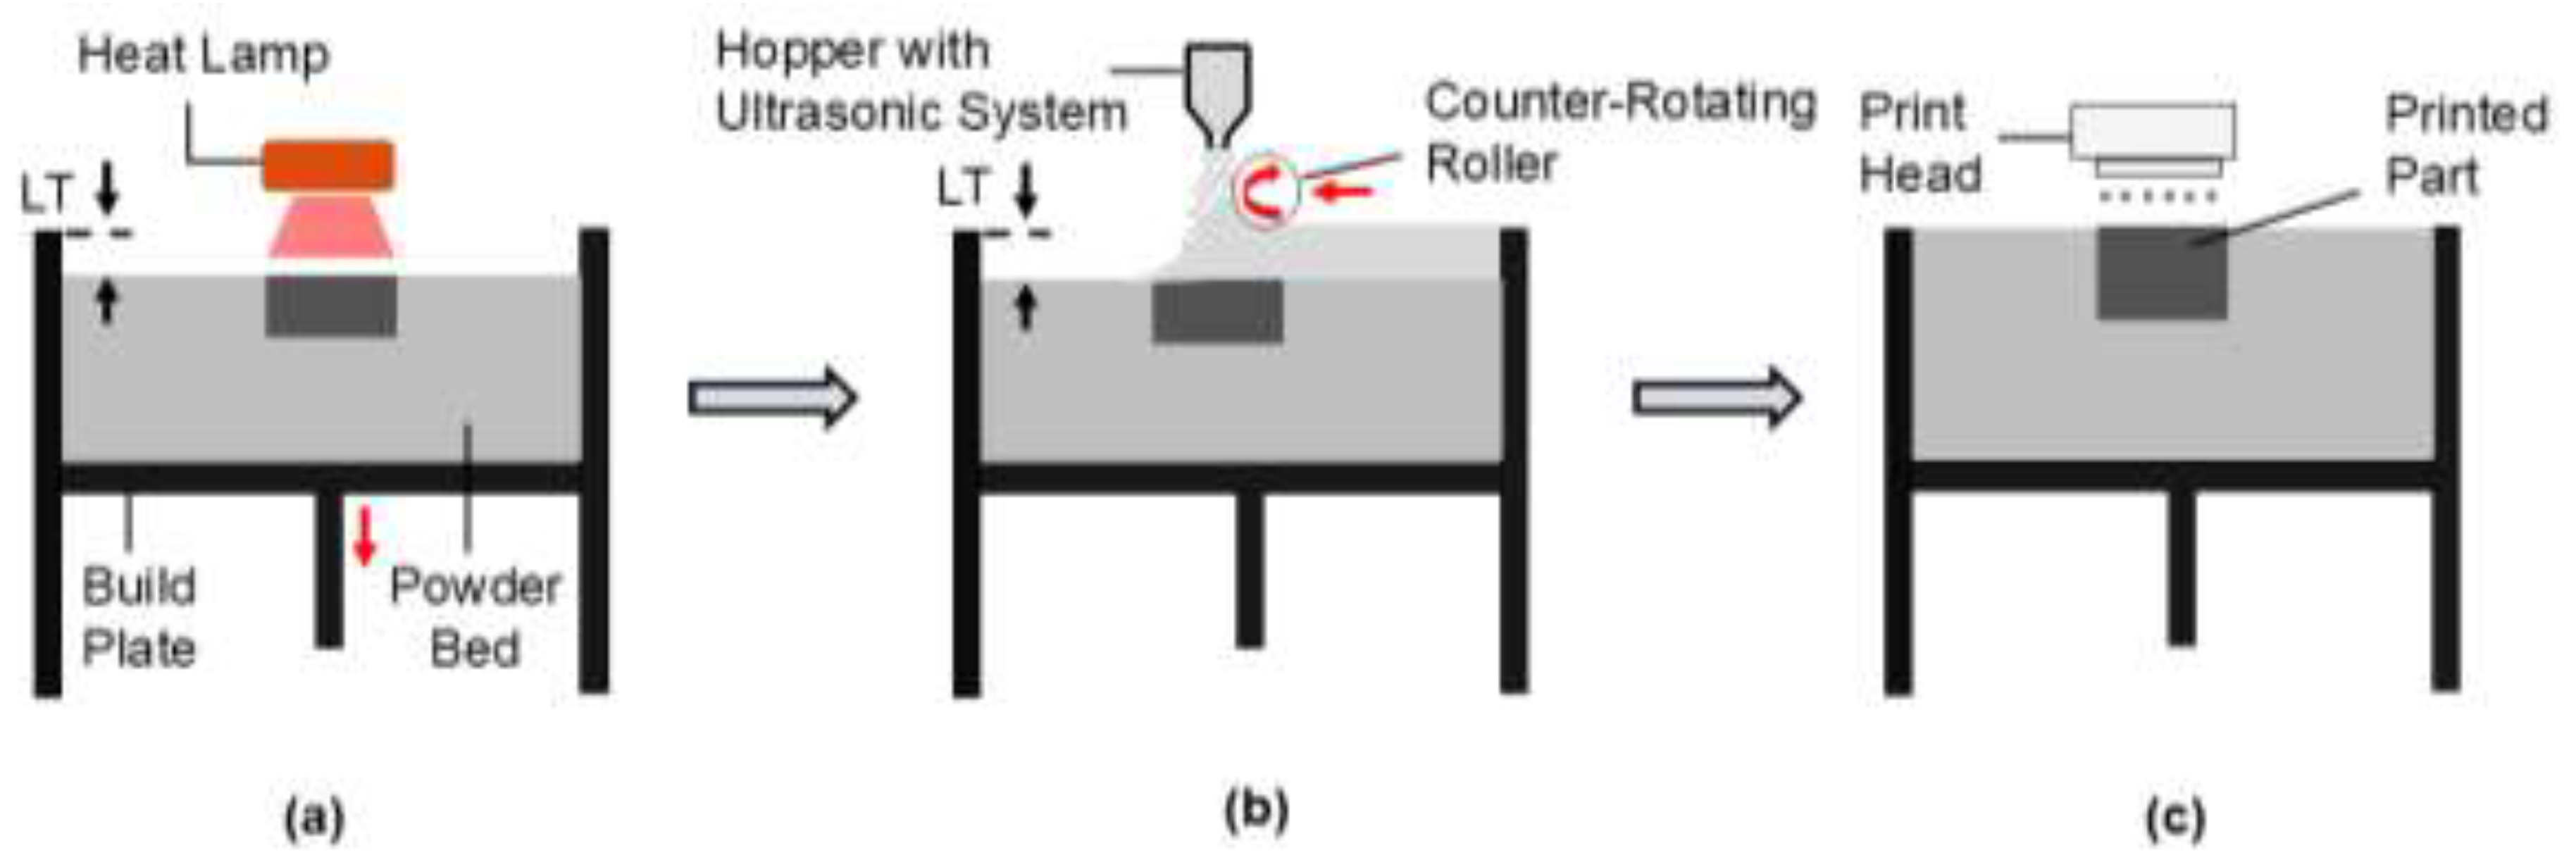
Table 2 presents the fixed parameters used during the printing process. The definitions of these printing parameters are available in the literature [24]. While these printing parameters were kept constant, the recoat speed and dispense delay were systematically varied, as summarized in Table 3. It is worth noting that roller traverse speed and recoat speed are two different parameters. The roller traverse speed corresponds to the speed of the roller that moves across the powder bed, while the recoat speed refers to the speed at which the hopper traverses across the build plate while dispensing powder onto the powder bed [25].
The positions of printed parts on the XY plane are shown in Figure 3. These parts were labelled as M1 through M8. Their thickness direction was aligned with the direction of the build (Z) direction. In the figure, the X-direction is the direction in which the roller spreads the dispensed powder from right to left.
After printing, the build plate, along with the printed parts and loose powder, was placed in an oven (DX402C, Yamato Scientific, Tokyo, Japan) at 125°C for 5h to cure the binder in the printed parts. After curing, green parts were obtained by depowdering.
2.3. Experimental Design of Printing to Study the Effects on Printed Part Density
To investigate the effects of dispense delay and recoat speed on green part density and powder bed density, the one-factor-at-a-time (OFAT) approach was employed. In this method, one parameter was varied while the other was held constant to isolate its effect on the response variables. Three levels of dispense delay (0.2 s, 1 s, and 5 s) and three levels of recoat speed (5 mm/s, 10 mm/s, and 20 mm/s) were individually evaluated. There were five unique experimental conditions based on the OFAT design, each representing a distinct combination of dispense delay and recoat speed. Because this was not a full factorial design, no interaction effects could be revealed. Table 3 displays the values of parameters at each experimental condition. There were two replications under each experimental condition.
2.4. Measurement of Green Part Density
Green part density , the density of a green part, was calculated using Equation (1), where m is the mass of the part, and l, w, and t represent its length, width, and thickness, respectively.
The dimensions—length, width, and thickness—were measured with a digital slide caliper (500-196-30 Digimatic, 0–6″/150 mm, Mitutoyo, Japan). The mass was measured using a precision scale (300g/0.001g) with a resolution of 0.001 g.
2.5. Measurement of Powder Bed Density
Powder bed density was measured in a set of experiments separate from the experiments used for green part density measurement. In this set of experiments, no printing was performed and, hence, some parameters associated with printing (like binder saturation, binder set time, bed temperature, and drying time) were not applicable.
Figure 4 illustrates the steps in powder bed density measurement. Three rectangular paper sheets (65 mm x 40 mm) were placed on the build plate at three locations (Front, middle, and back) labelled as P1, P2, and P3 respectively, as shown in Figure 4 (a). Feedstock powder was then dispensed and then spread over the powder bed, as shown in Figure 4 (b). This dispensing and spreading process was repeated for 30 layers, each with a layer thickness of 60 μm to build a powder bed of 1.8 mm above the paper sheets, as shown in Figure 4 (c). Three cylindrical cups were inserted into the powder bed at the three locations where the three paper sheets were, respectively, as shown in Figure 4 (d). The powder outside the cylindrical cups were removed, leaving only the powder confined within the cylindrical cups, as shown in Figure 4 (e). The cylindrical cups were then lifted, leaving the powder (to be collected) resting on the paper sheets, as shown in Figure 4 (f). The retained powder as each location was the sample to be weighed using a precision balance, as shown in Figure 4 (g).
The following equation was used in calculation of powder bed density at each location.
where m is the mass of the sample (g), and V is the geometric volume (cm3) of the sampled region bounded by the cylindrical cup and calculated by the following equation:
where d (= 25 mm) is the inner diameter of the cup, and is the height of the powder bed. Here, n (= 30) is the number of layers and LT (= 60 is the layer thickness of each layer.
3. Results and Discussion
3.1. Effects of Dispense Delay on Green Part Density
Table 4 presents the experimental data of green part density under varying dispense delay (0.2, 1, and 5 s) and a constant recoat speed of 5 mm/s. For each experimental condition, green part density was measured on sixteen green parts (eight build plate locations × two replications). The average green part density and standard deviation were calculated from these 16 green part density data.
Figure 5 (drawn from the data in Table 4) presents graphically the results regarding the effects of dispense delay on green part density. Figure 5, the mean indicates the arithmetic mean of the green part density dataset, referred to as the average green part density. The median line represents the 50th percentile of each green part density dataset, indicating the midpoint which half of the data lie below, and half lie above. The bottom and top edges of box correspond to the 25th (Q1) percentile and 75th (Q3) percentile of the green part density dataset, and the box height represents the interquartile range (IQR = Q3 – Q1). The two ends of the ranges represent the lower extreme and upper extreme of green part density values within the dataset, extending from the lower quartile (Q1) to the smallest value that is ≥ (Q1 – 1.5 × IQR) and from the upper quartile (Q3) to the largest value that is ≤ (Q3 + 1.5 × IQR). Both the interquartile range (box height) and the range within 1.5 IQR show the overall spread of the green part density dataset at each of the three dispense delay values.
As dispense delay increased, the average green part density shifted upward. Among the experimental data, the highest average green part density was recorded at the longest dispense delay of 5 s. The median line of green part density followed an identical trend. The interquartile range was the largest at the dispense delay of 0.2 s, while the range within 1.5 IQR was the largest at the dispense delay of 5 s and the smallest at the dispense delay of 1 s. The lowest standard deviation was observed at the dispense delay of 1 s, indicating more consistent green part density values at this experimental condition compared with the dispense delay of 0.2 s and the dispense delay of 5 s.
Table 5 shows the one-way analysis of variance (ANOVA) results regarding the effects of dispense delay on green part density. Minitab Statistical Software (version 22.1.0) was used to perform one-way ANOVA [26]. The low P-value (P < 0.05) indicates that dispense delay has a statistically significant effect on green part density, whereas the error term represents only random variation. A dispense delay of 0.2 s and a recoat speed of 5 mm/s were used as the baseline condition. Increasing the dispense delay to 1 s and 5 s while keeping recoat speed as constant resulted in green part density improvements of approximately 1.9% and 5.8%, respectively. It should be noted that these comparisons are based on an OFAT design and do not account for interaction effects. The corresponding effect size (η² = 0.623) indicates a large magnitude of influence of dispense delay on green part density.
A longer dispense delay results in a larger amount of powder being dispensed prior to spreading, leading to a higher powder pile in front of the roller. During the spreading process, as the roller moves across the powder bed, the powder pile in front of the roller causes more powder to be pushed downward and promotes powder particle rearrangement, resulting in more effective powder packing and higher green part density [27]. Conversely, a shorter dispense delay dispenses less powder, producing a lower powder pile in front of the roller. The reduced pile height limits powder to be pushed downward and powder particle rearrangement during spreading, leading to lower powder packing and, consequently, lower green part density compared with conditions with a higher powder pile. A previous study on binder jetting (performed on a ExOne Innovent+ printer) using copper powder with a particle size of 5 µm [5] provides support for this interpretation. Specifically, this study showed that increasing the ultrasonic intensity of the powder hopper from 25% to 75% increased the amount of powder deposited onto the powder bed, which led to a higher green part density [6].
3.2. Effects of Dispense Delay on Powder Bed Density
Table 6 presents the experimental data of powder bed density under varying dispense delay (0.2, 1, and 5 s) and a constant recoat speed of 5 mm/s. For each experimental condition, powder bed density was measured on six samples (obtained at three locations on build plate × two replications). The average powder bed density and standard deviation were calculated from those six samples.
Figure 6 (drawn from the data in Table 6) presents graphically the results regarding the effects of dispense delay on powder bed density. As dispense delay increased, the average powder bed density shifted upward. Among the experimental data, the highest average powder bed density was recorded at the longest dispense delay of 5 s. The median line of powder bed density followed an identical trend. Both the interquartile range and the range within 1.5 IQR were the largest at the dispense delay of 1 s and the smallest at the dispense delay of 5 s. The lowest standard deviation was observed at the dispense delay of 5 s, indicating more consistent powder bed density values at this experimental condition compared with the dispense delay of 0.2 s and the dispense delay of 1 s.
Table 7 shows the one-way ANOVA results regarding the effects of dispense delay on powder bed density. The low P-value (P < 0.05) indicates that dispense delay has a statistically significant effect on powder bed density whereas the error term represents only random variation. A dispense delay of 0.2 s and a recoat speed of 5 mm/s were used as the baseline condition. Increasing the dispense delay to 1 s and 5 s while keeping recoat speed as constant resulted in powder bed density improvements of approximately 4.9% and 18.3%, respectively. The corresponding effect size (η² = 0.8140) indicates a large magnitude of influence of dispense delay on powder bed density.
A longer dispense delay dispenses a larger amount of powder on the powder bed, resulting in a higher powder pile in front of the roller during spreading. This higher powder pile allows the roller to push the higher amount of powder downward and promotes powder particle rearrangement, thereby improving powder bed density. This denser powder bed in turn contributes to a higher green part density. A reported study showed that increasing the ultrasonic intensity of the hopper from 25 % to 75 % deposited more powder across the powder bed, which led to a higher green part density in binder jetting (performed on a ExOne Innovent+ printer) using copper powder with a particle size of 5 µm [6]. Another reported study on binder jetting (performed on a ComeTrue T10 printer) using alumina powder with a particle size of 20 µm further showed that an increase in powder bed density led to an increase in green part density [28]. One more study on shell printing on an ExOne Innovent+ printer using alumina powder with a particle size of 70 µm showed similar trends [29]. It showed that regions on the powder bed with higher powder packing exhibited higher green part density. It was also reported that the green part density was lower than the powder bed density, through combined experimental and numerical investigations of binder jetting (performed on an ExOne Innovent+ printer) using alumina powder with a particle size of 70 µm [30].
3.3. Effects of Recoat Speed on Green Part Density
Table 8 presents the experimental data of green part density under varying recoat speed (5, 10, and 20 mm/s) and a constant dispense delay of 1 s.
Figure 7 (drawn from the data in Table 8) presents graphically the results regarding the effects of recoat speed on green part density. As recoat speed increased, the average green part density shifted downward. Among the experiment data, the highest average green part density was recorded at the lowest recoat speed of 5 mm/s. The median line of green part density followed an identical trend. Both the interquartile range and the range within 1.5 IQR were the largest at the recoat speed of 20 mm/s and the smallest at the recoat speed of 10 mm/s. The lowest standard deviation was observed at the recoat speed of 10 mm/s, indicating more consistent green part density values at this experimental condition compared with the recoat speed of 5 mm/s and the recoat speed of 20 mm/s.
Table 9 shows the one-way ANOVA results regarding the effects of recoat speed on green part density. The low P-value (P < 0.05) indicates that recoat speed has a statistically significant effect on green part density whereas the error term represents only random variation. A recoat speed of 20 mm/s and a dispense delay of 1 s were used as the baseline condition. Decreasing the recoat speed to 10 mm/s and 5 mm/s while keeping dispense delay as constant resulted in green part density improvements of approximately 2.6% and 4.6%, respectively. The corresponding effect size (η² = 0.726) indicates a large magnitude of influence of recoat speed on green part density, which is higher than that of dispense delay (η² = 0.623).
A lower recoat speed results in a larger amount of powder being dispensed across the powder bed, leading to a higher powder pile in front of the roller. During the spreading process, as the roller moves across the powder bed, the powder pile in front of roller causes more powder to be pushed downward and promotes powder particle rearrangement, resulting in more effective powder particle packing and higher green part density [27]. Higher green part density at lower recoat speed may occur because the slower roller can better push larger particles downward into the powder bed instead of dragging them across the powder bed surface. Conversely, a higher recoat speed dispenses less powder, producing a lower powder pile in front of the roller. The reduced pile height limits powder particles to be pushed downward and powder particle rearrangement during spreading, leading to lower powder particle packing and, consequently, lower green part density compared with conditions with a higher powder pile.
3.4. Effects of Recoat Speed on Powder Bed Density
Table 10 presents the experimental data of powder bed density under varying recoat speed (5 , 10, and 20 mm/s) and a constant dispense delay of 1 s.
Figure 8 (drawn from the data in Table 10) presents graphically the results regarding the effects of recoat speed on powder bed density. As recoat speed increased, the average powder bed density shifted downward. Among the experiment data, the highest average powder bed density was recorded at the lowest recoat speed of 5 mm/s. The median line of powder bed density followed an identical trend. The interquartile range was the largest at the recoat speed of 10 mm/s and the smallest at the recoat speed of 20 mm/s, while the range within 1.5 IQR was the largest at the recoat speed of 5 mm/s and the smallest at the recoat speed of 20 mm/s. The lowest standard deviation was observed at the recoat speed of 20 mm/s, indicating more consistent powder bed density values at this experimental condition compared with the recoat speed of 5 mm/s and the recoat speed of 10 mm/s.
Table 11 shows the one-way ANOVA results regarding the effects of dispense delay on powder bed density. The low P-value (P < 0.05) indicates that recoat speed has a statistically significant effect on powder bed density whereas the error term represents only random variation. A recoat speed of 20 mm/s and a dispense delay of 1 s were used as the baseline condition. Decreasing the recoat speed to 10 mm/s and 5 mm/s while keeping dispense delay as constant resulted in powder bed density improvements of approximately 13.3% and 20.7%, respectively. The corresponding effect size (η² = 0.8996) indicates a large magnitude of influence of recoat speed on powder bed density, which is higher than that of dispense delay (η² = 0.8140).
The increase in powder bed density with lower recoat speed can be attributed to the larger amount of powder dispensed from a horizontally moving hopper. A lower recoat speed allows more powder to accumulate on the powder bed, and the roller subsequently compacts the powder layer by removing loose excess powder and filling surface voids. This process improves powder packing and reduces interparticle voids, resulting in a denser powder bed.
Figure 9 presents condition-level scatter plot of green part density (g/cm3) and powder bed density (g/cm3) for all the data collected from this study. With the increase in powder bed density, an increase in green part density is observed, indicating a positive relationship between the two density values. This observation is consistent with a reported study on binder jetting (performed on a ComeTrue T10 printer) using alumina powder with a particle size of 20 µm [6]. That study showed that an increase in powder bed density led to an increase in green part density [28]. A linear regression line is included in Figure 9 to illustrate this overall trend, although the relationship is not strictly linear. It should be noted that powder bed density was measured without binder deposition, whereas green part density included the binder. Consequently, the observed relationship of green part density and powder bed density should be interpreted as indicative rather than strictly causal.
4. Conclusion
This study is the first to investigate the effects of dispense delay and recoat speed on green part density and powder bed density in binder jetting additive manufacturing. These effects have been largely underreported in the literature despite extensive research on other process parameters.
The results showed that varying dispense delay and recoat speed significantly enhanced both green part density and powder bed density. At a fixed recoat speed of 5 mm/s, increasing the dispense delay from 0.2 to 5 s led to an improvement in green part density and powder bed density. Similarly, decreasing the recoat speed from 20 to 5 mm/s at a constant dispense delay of 1 s increased the green part density and powder bed density. One-way ANOVA results showed that both dispense delay and recoat speed had statistically significant effects on green part density and powder bed density.
Future studies will investigate the interaction effects of dispense delay, recoat speed, and other process parameters to better understand their combined influence on green part density and powder bed density under conditions with and without powder bed compaction.
Author Contributions
Conceptualization, Fahim Khan, Zhijian Pei and Yi-Tang Kao; Methodology, Fahim Khan, Zhijian Pei, Md Shakil Arman and Yi-Tang Kao; Validation, Fahim Khan, Zhijian Pei and Yi-Tang Kao; Formal analysis, Fahim Khan, Zhijian Pei, Md Shakil Arman, Steven Kuntzendorf and Yi-Tang Kao; Investigation, Fahim Khan, Md Shakil Arman and Steven Kuntzendorf; Data curation, Fahim Khan, Zhijian Pei and Yi-Tang Kao; Writing – original draft, Fahim Khan; Writing – review & editing, Fahim Khan, Zhijian Pei, Md Shakil Arman and Yi-Tang Kao; Visualization, Fahim Khan, Zhijian Pei and Yi-Tang Kao; Supervision, Zhijian Pei and Yi-Tang Kao.
Funding
This research was not financially supported by any specific grants from funding agencies in the public, commercial, or not-for-profit sectors.
Data Availability Statement
The original contributions presented in this study are included in the article/supplementary material. Further inquiries can be directed to the corresponding authors.
Declaration of generative AI use: During the preparation of this article the authors used Chat GPT 5.0 in order to improve writing. After using this tool/service, the authors reviewed and edited the content as needed and take full responsibility for the content of the published article.
Conflicts of Interest
The authors have nothing to declare.
References
- Khan, F.; Sanders, J.; Arman, M.S.; Pasha, M.M.; Kachur, S.; Pei, Z. Fabrication of SiC–Aluminum Composites via Binder Jetting 3D Printing and Infiltration: A Feasibility Study . Journal of Composites Science 2025. 9, 3, 111. [Google Scholar]
- Jimenez, E.M.; Ding, D.; Su, L.; Joshi, A.R.; Singh, A.; Reeja-Jayan, B.; Beuth, J. Parametric analysis to quantify process input influence on the printed densities of binder jetted alumina ceramics . Additive Manufacturing 2019, 30, 100864. [Google Scholar] [CrossRef]
- Chen, Q.; Juste, E.; Lasgorceix, M.; Petit, F.; Leriche, A. Binder jetting process with ceramic powders: Influence of powder properties and printing parameters . Open Ceramics 2022, 9, p. 100218. [Google Scholar] [CrossRef]
- Moghadasi, M.; Miao, G.; Li, M.; Pei, Z.; Ma, C. Combining powder bed compaction and nanopowders to improve density in ceramic binder jetting additive manufacturing . Ceramics International 2021, 47(24), 35348–35355. [Google Scholar] [CrossRef]
- Chavez, L.A.; Ibave, P.; Wilburn, B.; Alexander, D., IV; Stewart, C.; Wicker, R.; Lin, Y. The influence of printing parameters, post-processing, and testing conditions on the properties of binder jetting additive manufactured functional ceramics . Ceramics 2020, 3(1), 65–77. [Google Scholar] [CrossRef]
- Miyanaji, H.; Rahman, K.M.; Da, M.; Williams, C.B. Effect of fine powder particles on quality of binder jetting parts . Additive Manufacturing 2020, 36, 101587. [Google Scholar] [CrossRef]
- Jiang, R.; Monteil, L.; Kimes, K.; Mostafaei, A.; Chmielus, M. Influence of powder type and binder saturation on binder jet 3D–printed and sintered Inconel 625 samples . The International Journal of Advanced Manufacturing Technology 2021, 116(11), 3827–3838. [Google Scholar] [CrossRef]
- Bertolini, F.; Mariani, M.; Mercadelli, E.; Baldisserri, C.; Galassi, C.; Capiani, C.; Ardito, R.; Lecis, N. 3D printing of potassium sodium niobate by binder jetting: Printing parameters optimisation and correlation to final porosity . Journal of Materials Research and Technology 2024, 29, 4597–4606. [Google Scholar] [CrossRef]
- Pasha, M.M.; Arman, M.S.; Pei, Z.; Khan, F.; Sanders, J.; Kachur, S. Effects of Compaction Thickness on Density, Integrity, and Microstructure of Green Parts in Binder Jetting Additive Manufacturing of Silicon Carbide . Journal of Manufacturing and Materials Processing 2025. 9, 4, 136. [Google Scholar] [CrossRef]
- Paudel, B.J.; To, A.C. Spatial green density variation and its effect on distortion prediction in binder jet additive manufacturing . Additive Manufacturing 2025. 98, 104640. [Google Scholar]
- Mao, Y.; Li, J.; Li, W.; Cai, D.; Wei, Q. Binder jetting additive manufacturing of 316L stainless-steel green parts with high strength and low binder content: Binder preparation and process optimization . Journal of Materials Processing Technology 2021, 291, 117020. [Google Scholar] [CrossRef]
- Lecis, N.; Mariani, M.; Beltrami, R.; Emanuelli, L.; Casati, R.; Vedani, M.; Molinari, A. Effects of process parameters, debinding and sintering on the microstructure of 316L stainless steel produced by binder jetting . Materials Science and Engineering: A 2021, 828, 142108. [Google Scholar] [CrossRef]
- Barthel, B.; Janas, F.; Wieland, S. Powder condition and spreading parameter impact on green and sintered density in metal binder jetting . Powder Metallurgy 2021, 64(5), 378–386. [Google Scholar] [CrossRef]
- Crane, N.B. Impact of part thickness and drying conditions on saturation limits in binder jet additive manufacturing . Additive Manufacturing 2020, 33, 101127. [Google Scholar] [CrossRef]
- Chen, W.; Chen, Z.; Chen, L.; Zhu, D.; Fu, Z. Optimization of printing parameters to achieve high-density 316L stainless steel manufactured by binder jet 3D printing . Journal of Materials Engineering and Performance 2023, 32(8), 3602–3616. [Google Scholar] [CrossRef]
- Zago, M.; Segata, G.; Perina, M.; Molinari, A. Binder jet 3D printing of 316L stainless steel: A Taguchi analysis of the dependence of density and mechanical properties on the printing parameters . Journal of Materials Research and Technology 2025. 34, 337–347. [Google Scholar] [CrossRef]
- Myers, K.; Paterson, A.; Iizuka, T.; Klein, A. The effect of print speed on surface roughness and density uniformity of parts produced using binder jet 3D printing. 2021.
- Enneti, R.K.; Prough, K.C. Effect of binder saturation and powder layer thickness on the green strength of the binder jet 3D printing (BJ3DP) WC-12% Co powders . International Journal of Refractory Metals and Hard Materials 2019, 84, 104991. [Google Scholar] [CrossRef]
- Mostafaei, A.; De Vecchis, P.R.; Kimes, K.A.; Elhassid, D.; Chmielus, M. Effect of binder saturation and drying time on microstructure and resulting properties of sinter-HIP binder-jet 3D-printed WC-Co composites . Additive Manufacturing 2021, 46, 102128. [Google Scholar] [CrossRef]
- Mariani, M.; Mariani, D.; De Gaudenzi, G.P.; Lecis, N. Effect of printing parameters on sintered WC-Co components by binder jetting . European Journal of Materials 2022, 2(1), 365–380. [Google Scholar] [CrossRef]
- Du, W.; Li, M.; Pei, Z.; Ma, C. Roller-compaction-assisted binder jetting with different granulated zirconia powders . Manufacturing Letters 2023, 35, 576–582. [Google Scholar]
- Zhang, J.; Tan, Y.; Bao, T.; Xu, Y.; Xiao, X.; Jiang, S. Discrete element simulation of the effect of roller-spreading parameters on powder-bed density in additive manufacturing . Materials 2020, 13(10), 2285. [Google Scholar]
- Wu, S.; Yang, Y.; Huang, Y.; Han, C.; Chen, J.; Xiao, Y.; Li, Y.; Wang, D. Study on powder particle behavior in powder spreading with discrete element method and its critical implications for binder jetting additive manufacturing processes . Virtual and Physical Prototyping 2023, 18(1), p. e2158877. [Google Scholar] [CrossRef]
- Li, M.; Du, W.; Elwany, A.; Pei, Z.; Ma, C. Metal binder jetting additive manufacturing: a literature review . Journal of Manufacturing Science and Engineering 2020, 142(9), p. 090801. [Google Scholar] [CrossRef]
- Mostafaei, A.; Elliott, A.M.; Barnes, J.E.; Li, F.; Tan, W.; Cramer, C.L.; Nandwana, P.; Chmielus, M. Binder jet 3D printing—Process parameters, materials, properties, modeling, and challenges . Progress in Materials Science 2021, 119, 100707. [Google Scholar] [CrossRef]
- Mathews, P.G. Design of Experiments with MINITAB; Quality press, 2004. [Google Scholar]
- Haeri, S.; Wang, Y.; Ghita, O.; Sun, J. Discrete element simulation and experimental study of powder spreading process in additive manufacturing . Powder Technology 2017, 306, 45–54. [Google Scholar] [CrossRef]
- Porter, Q.; Li, M.; Pei, Z.; Ma, C. Binder jetting additive manufacturing: the effect of feed region density on resultant densities . Journal of Manufacturing Science and Engineering 2022, 144(9), 094503. [Google Scholar] [CrossRef]
- Miao, G.; Moghadasi, M.; Li, M.; Pei, Z.; Ma, C. Binder jetting additive manufacturing: powder packing in shell printing . Journal of Manufacturing and Materials Processing 2022, 7(1), 4. [Google Scholar] [CrossRef]
- Li, M.; Miao, G.; Du, W.; Pei, Z.; Ma, C. Difference between powder bed density and green density for a free-flowing powder in binder jetting additive manufacturing . Journal of Manufacturing Processes 2022, 84, 448–456. [Google Scholar] [CrossRef]
Figure 1.
Schematic diagram of the of roller-powder interaction at varying dispense delay.
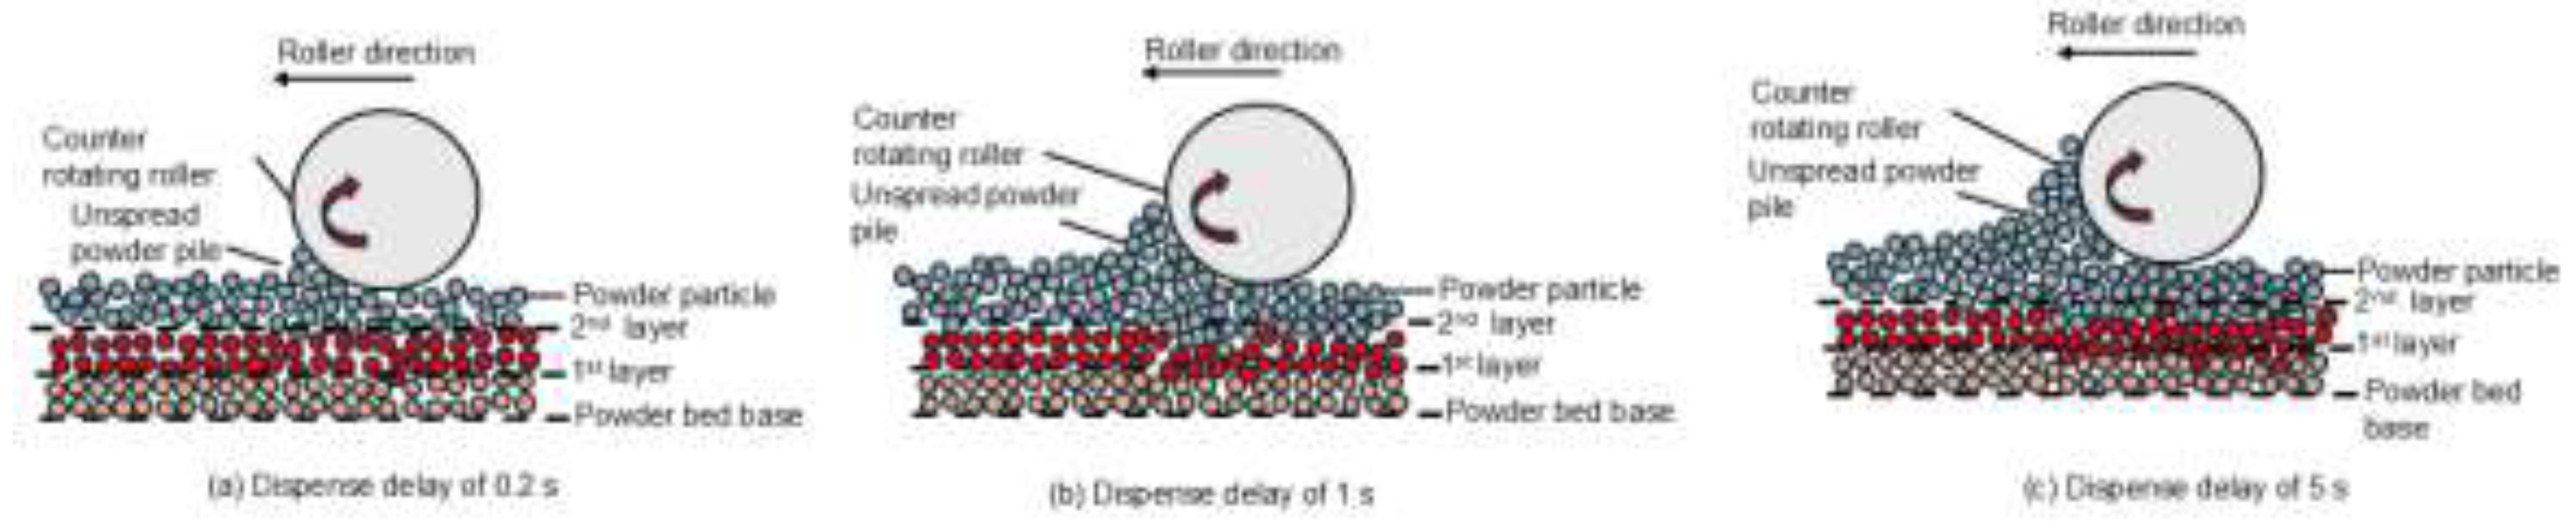
Figure 3.
Layout and labels of the printed parts on the build plate.
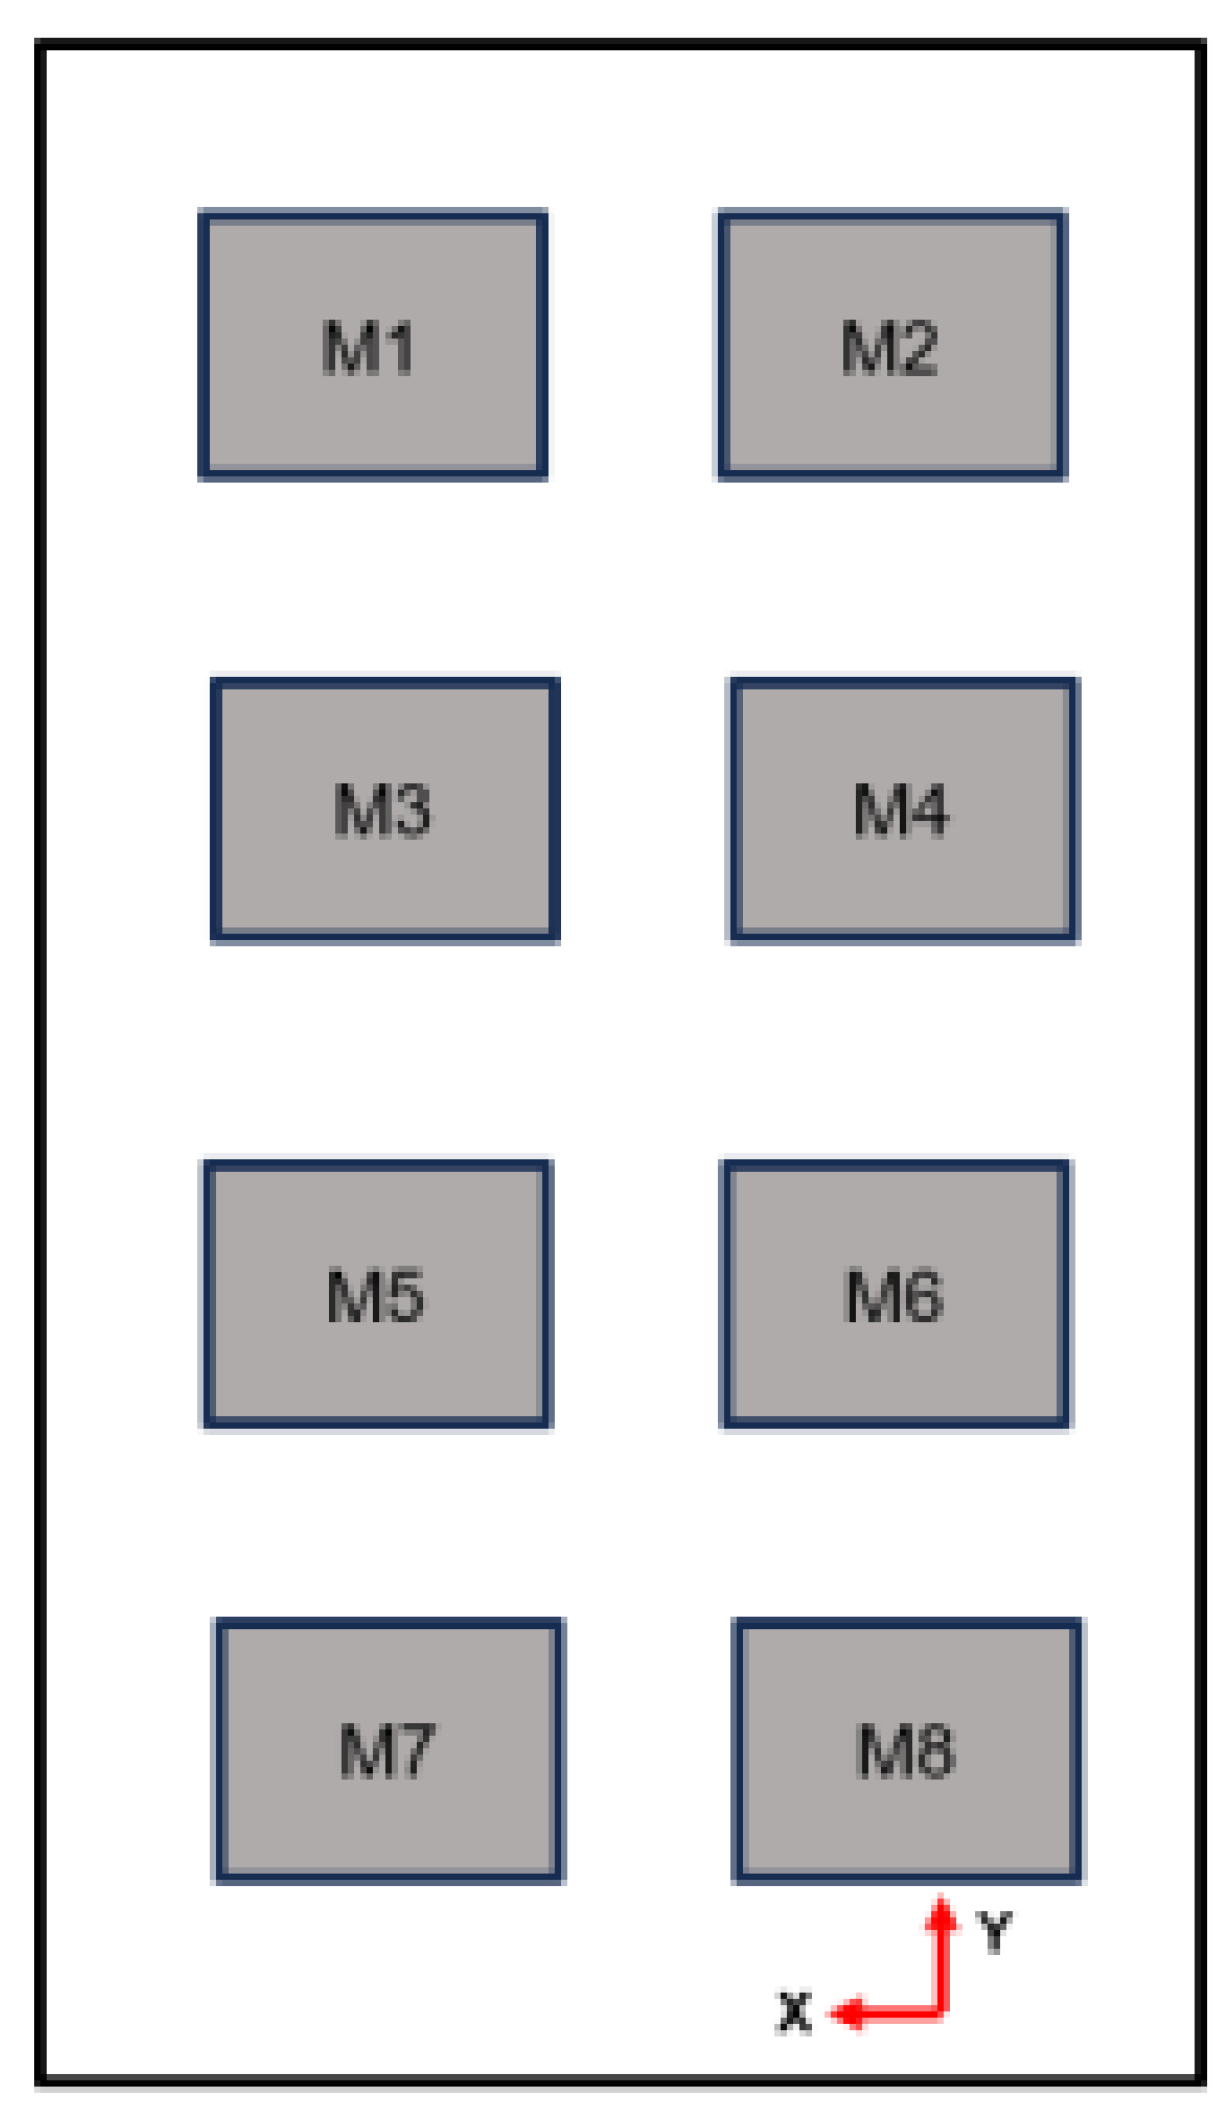
Figure 4.
Illustration of steps in powder bed density measurement (LT stands for layer thickness).
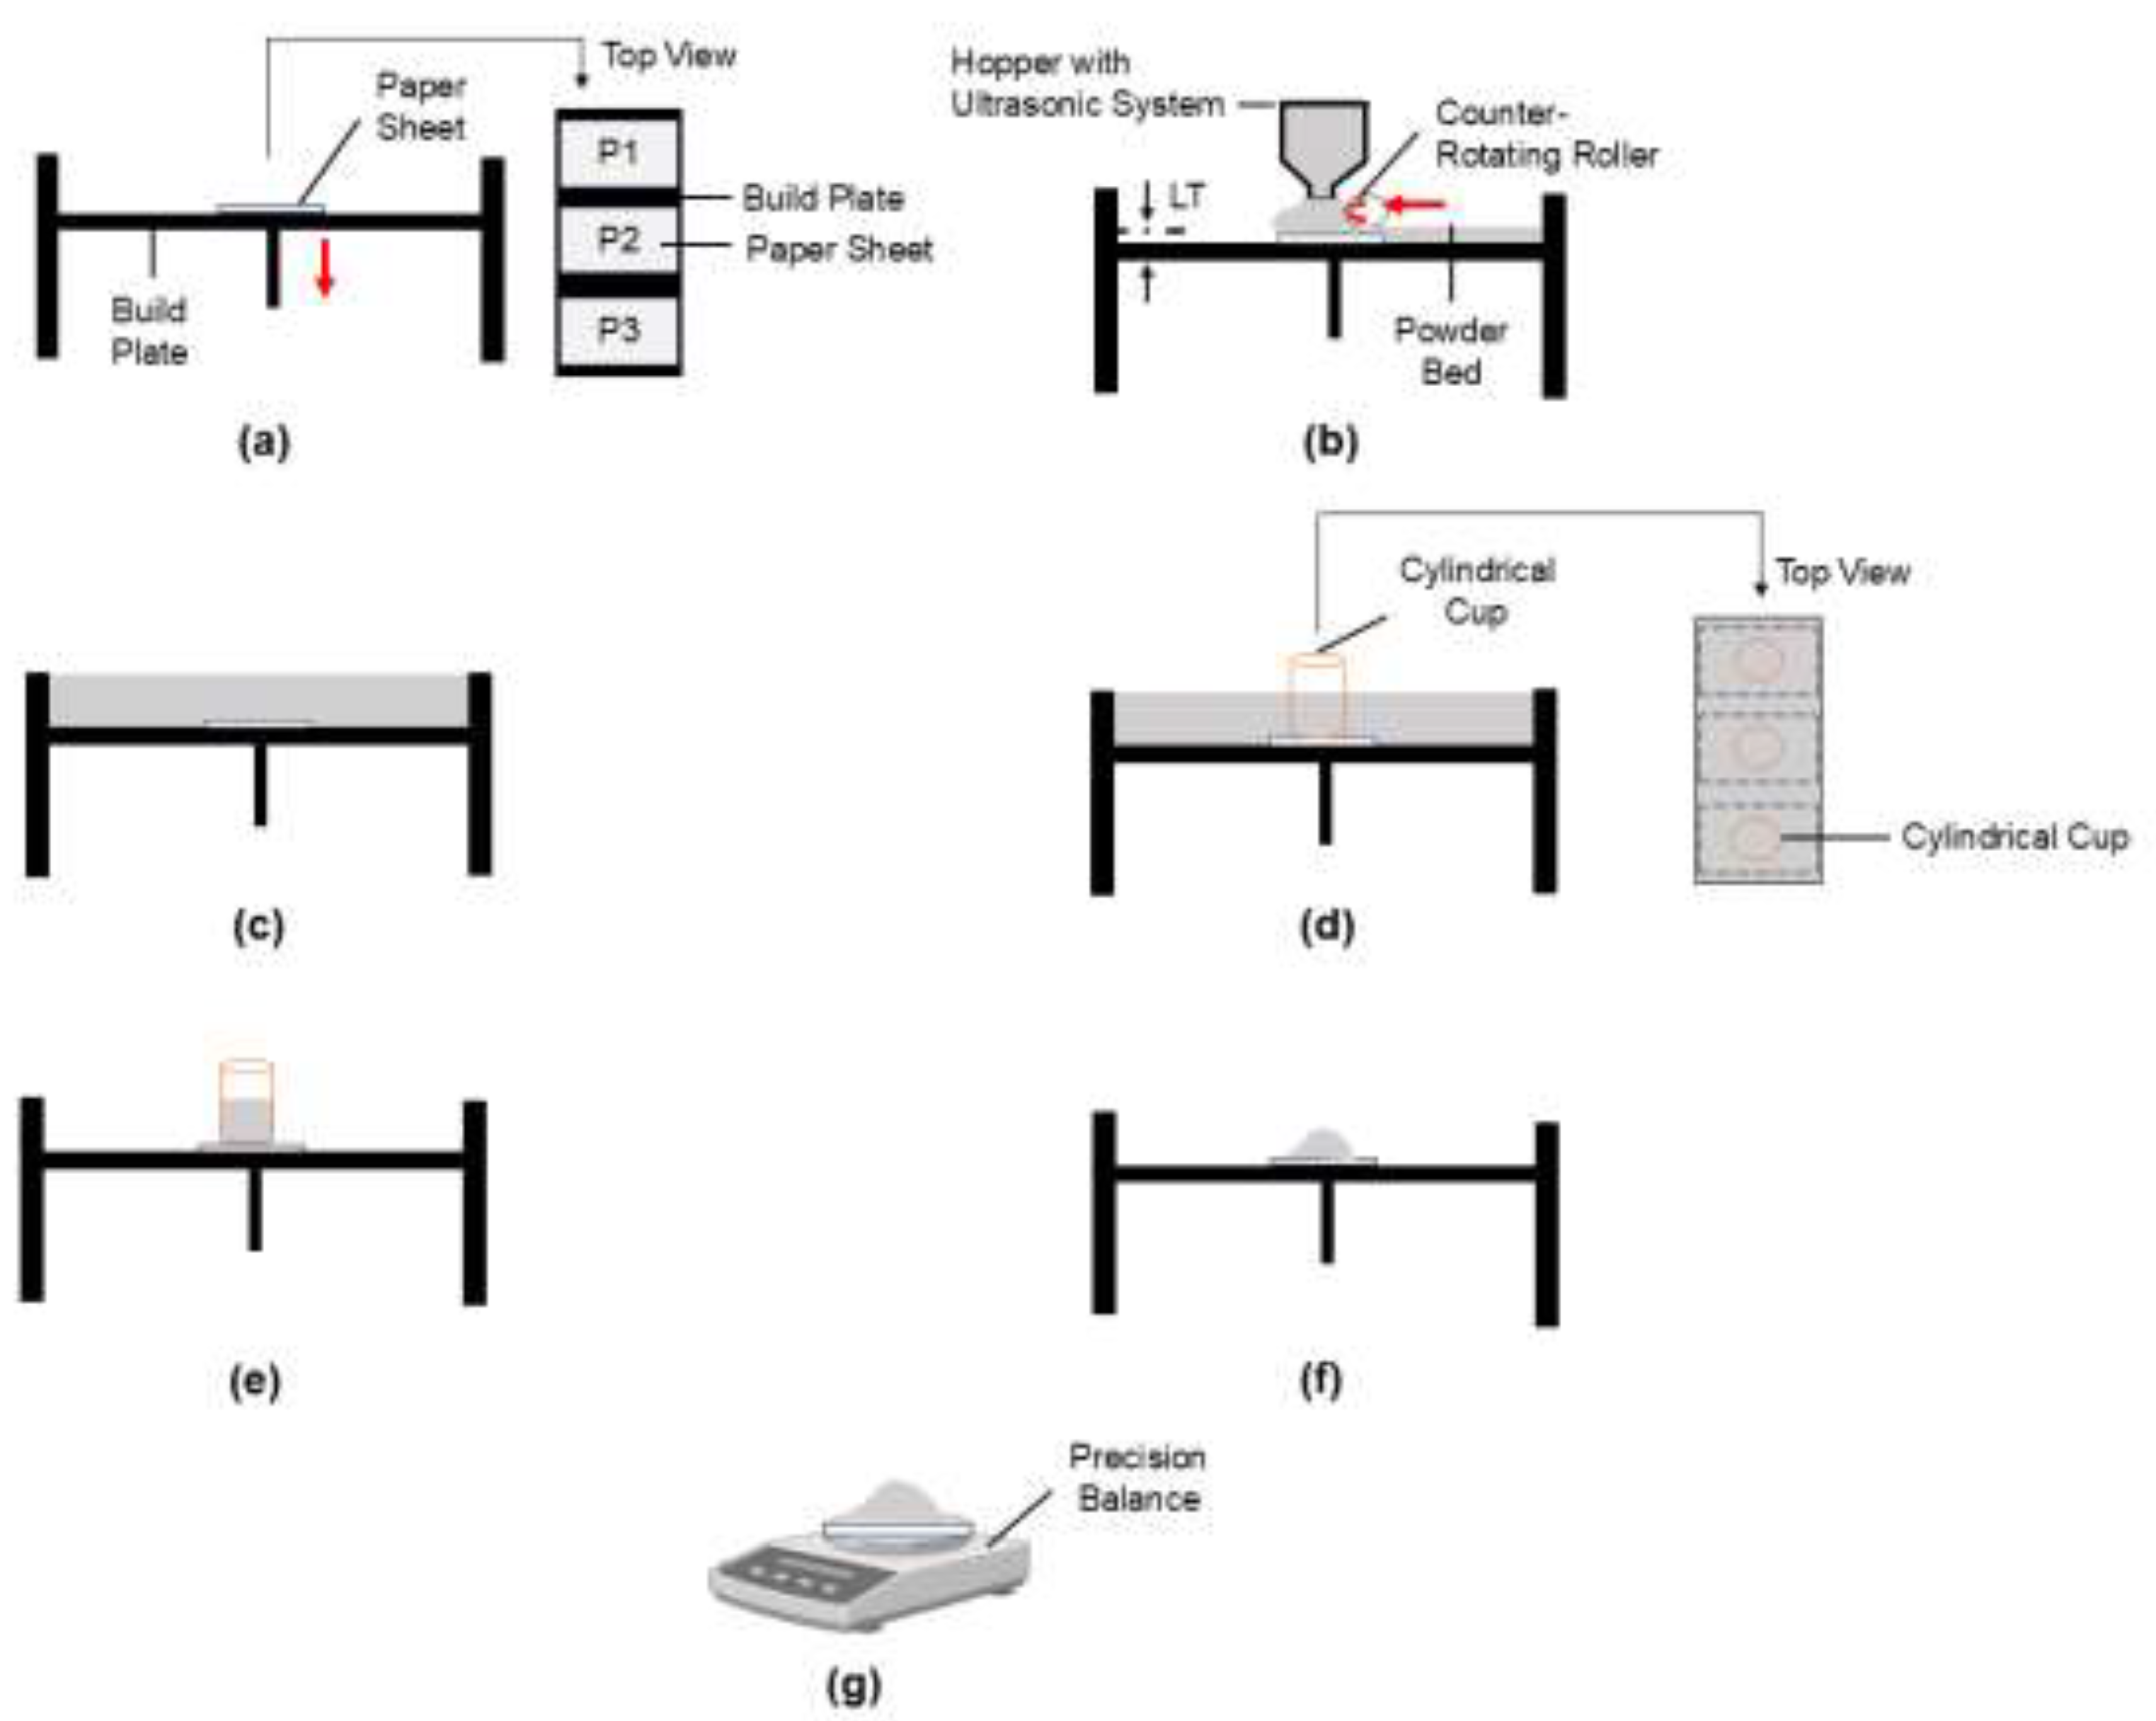
Figure 5.
Effects of dispense delay on green part density at a recoat speed of 5 mm/s.
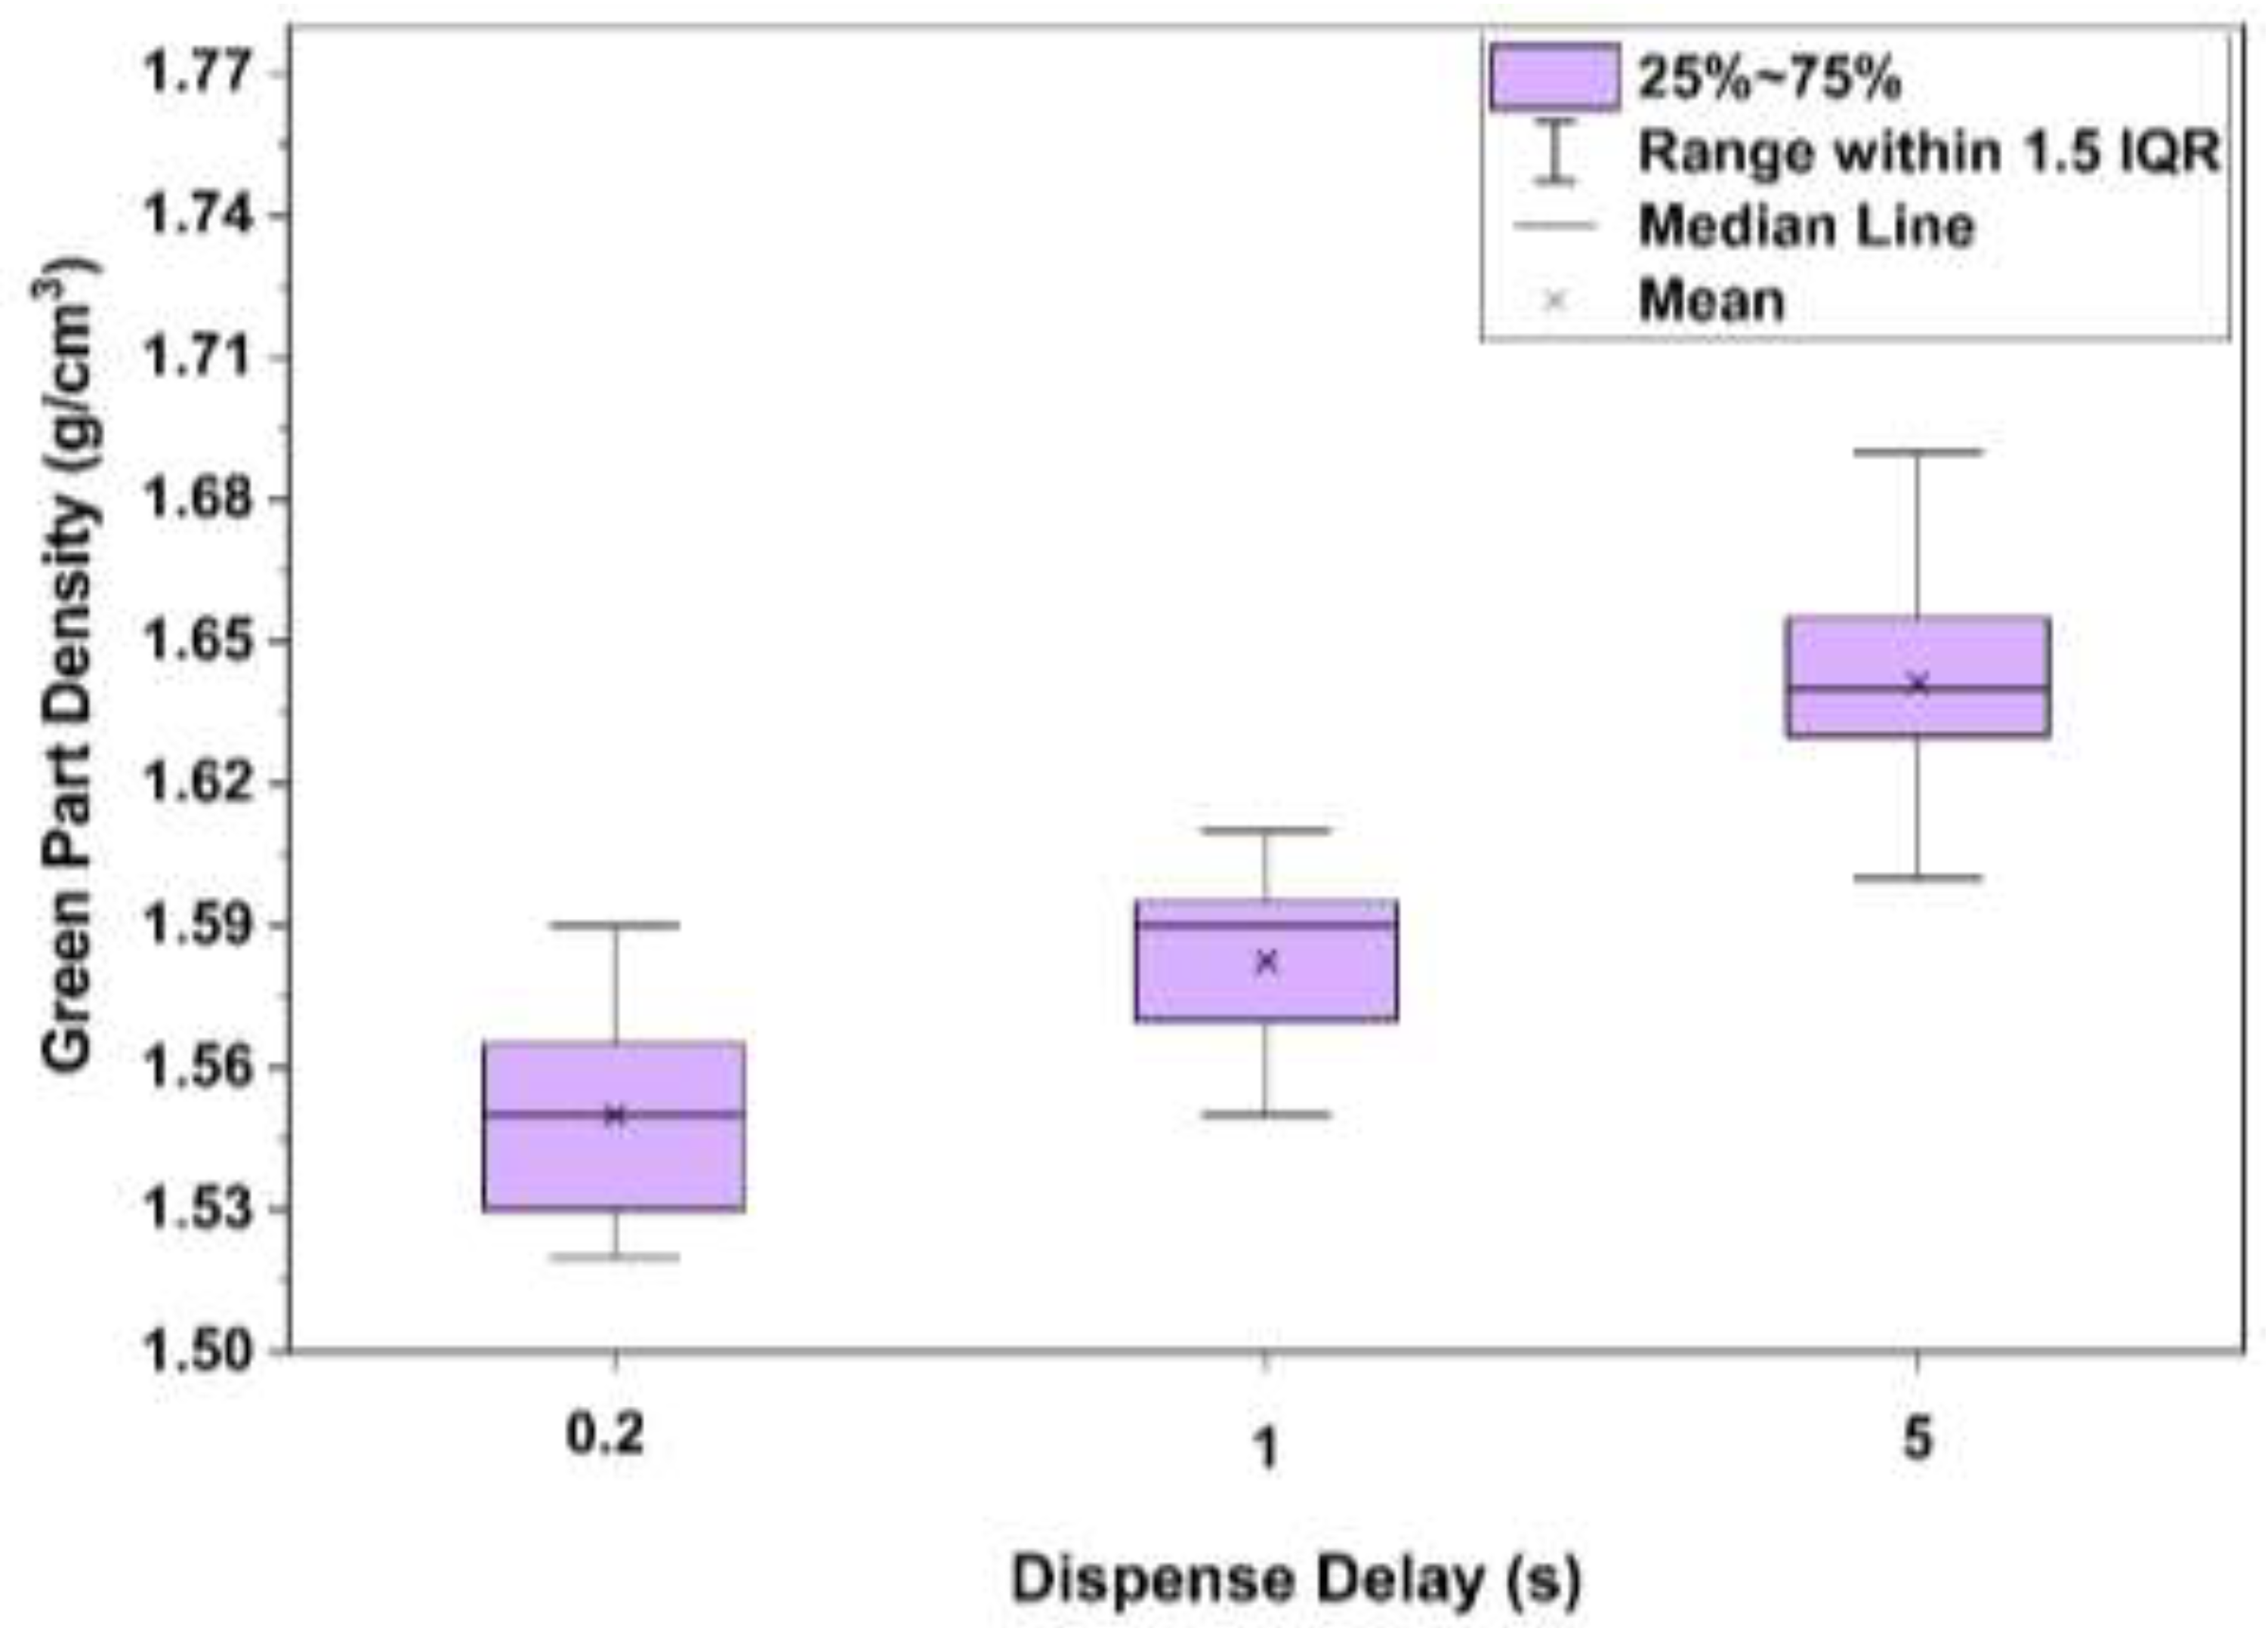
Figure 6.
Effects of dispense delay on powder bed density at a recoat speed of 5 mm/s.
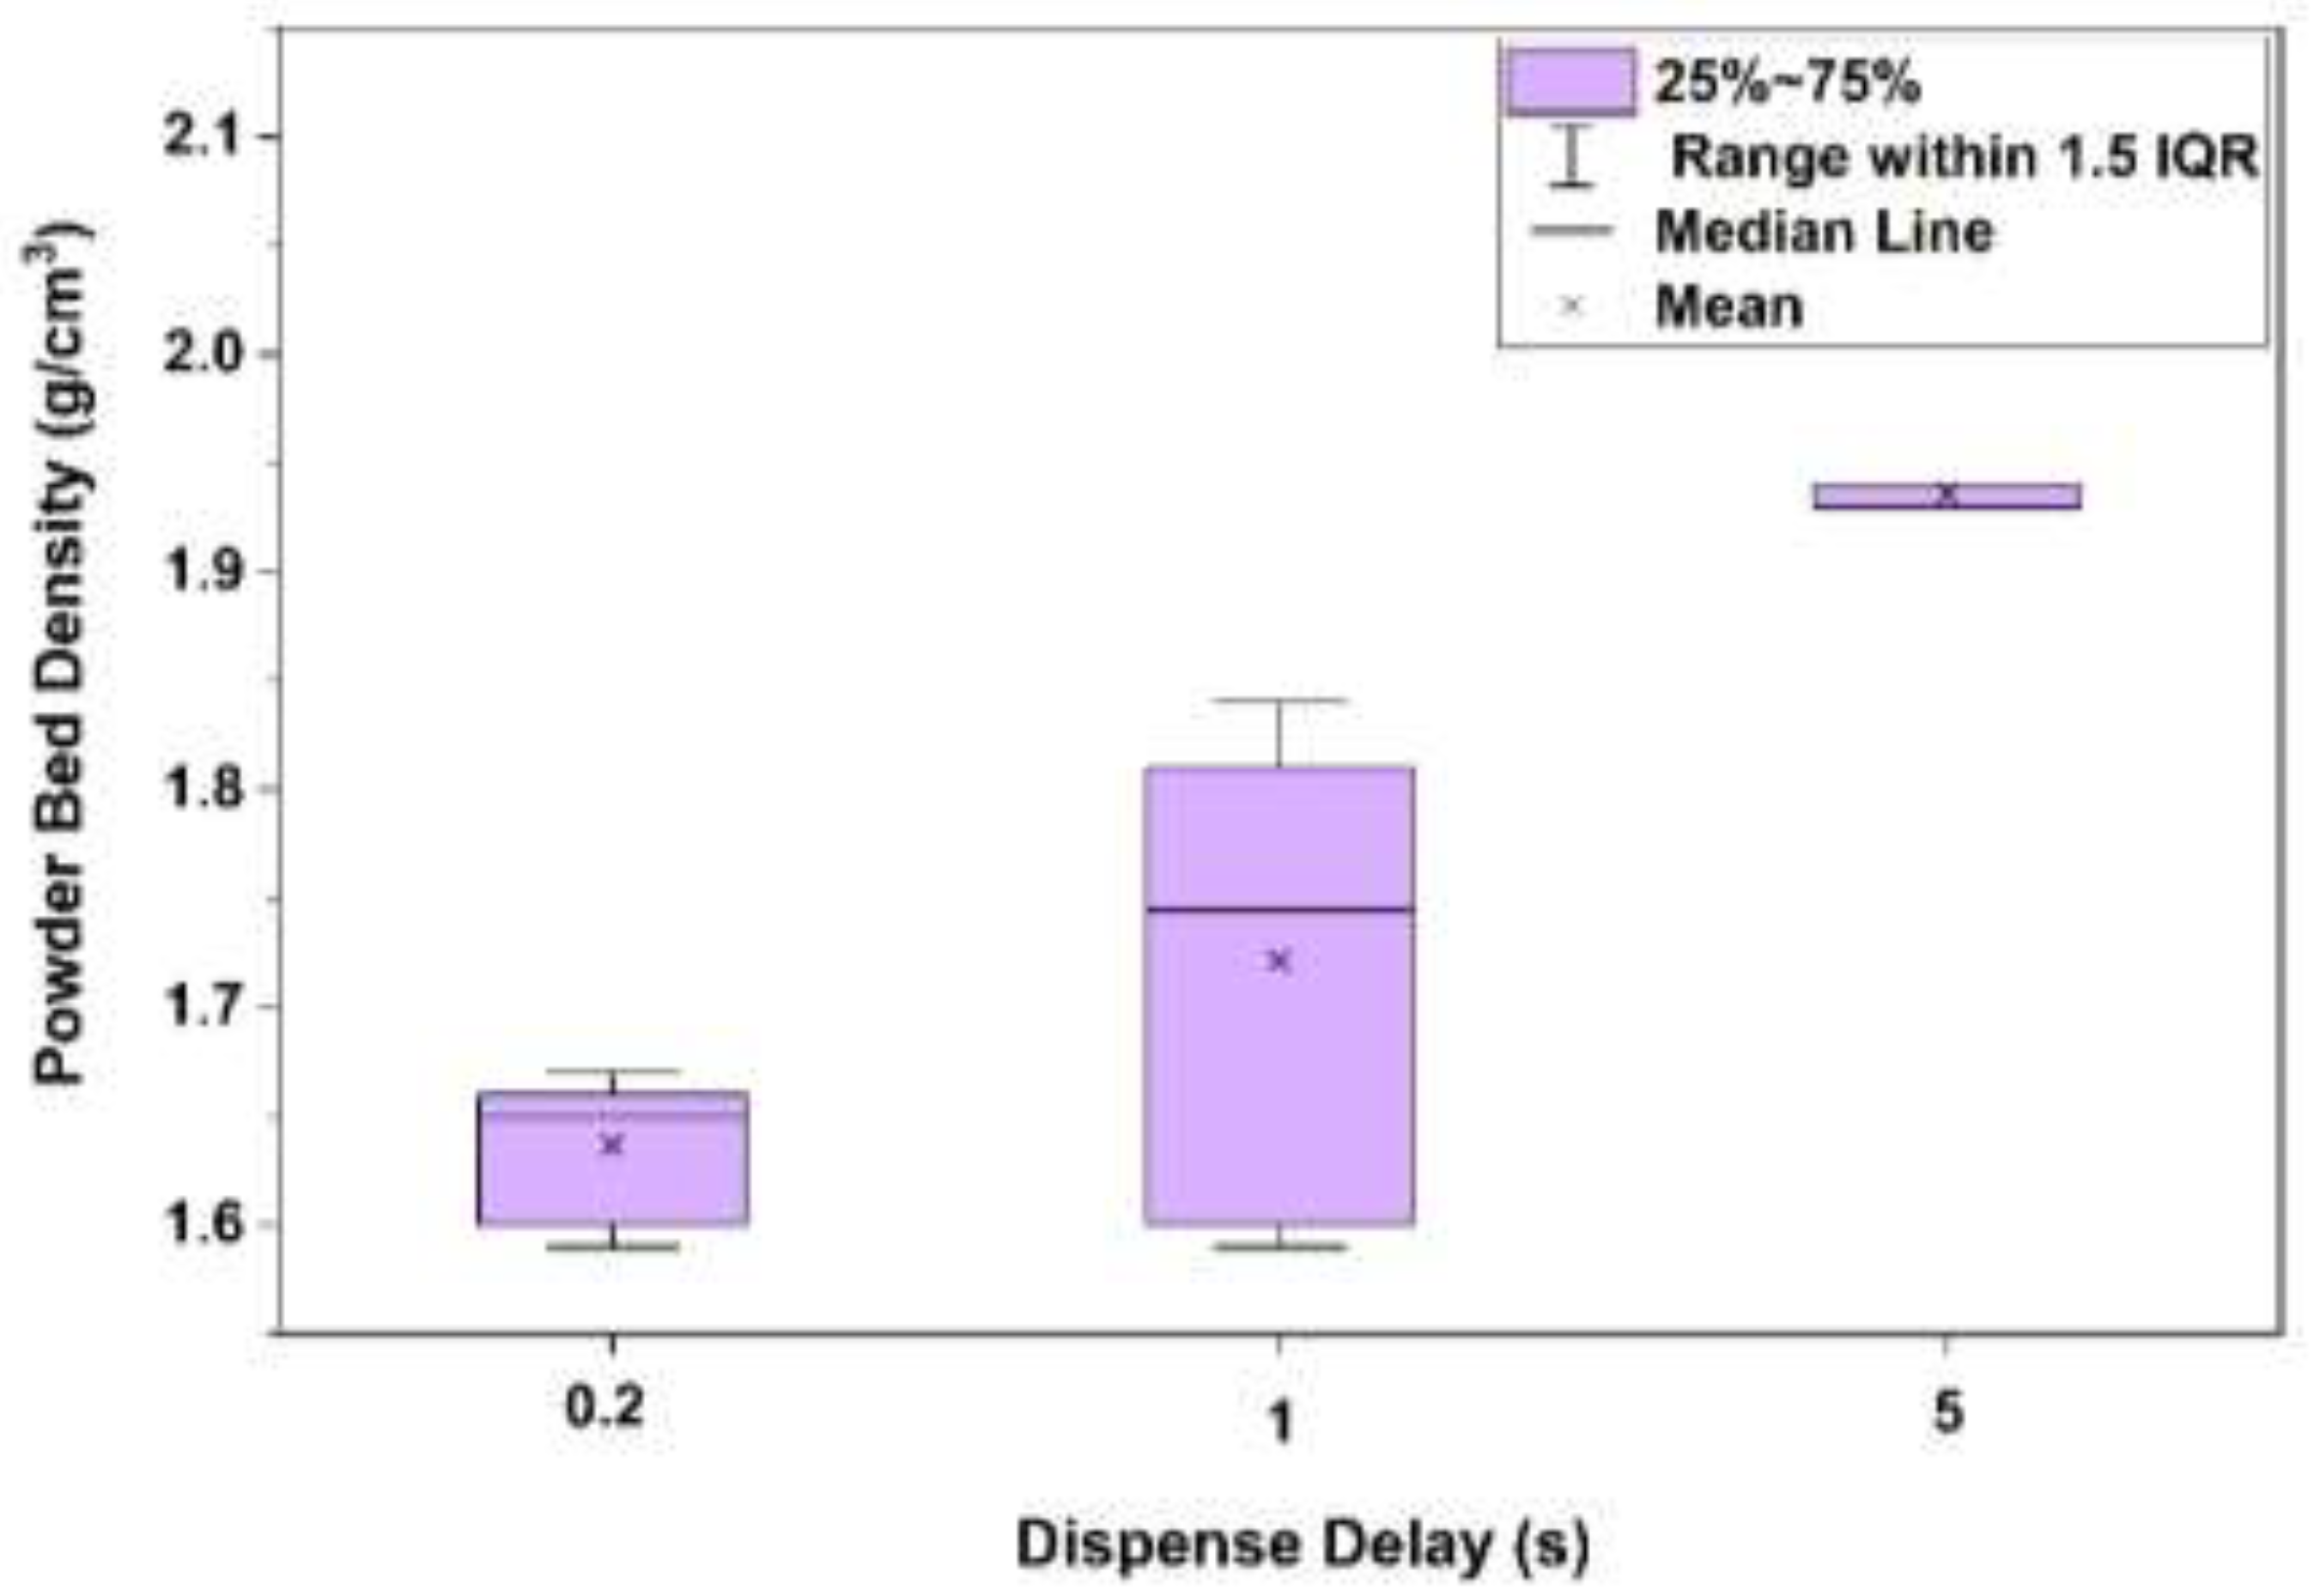
Figure 7.
Effects of recoat speed on green part density at a dispense delay of 1 s.
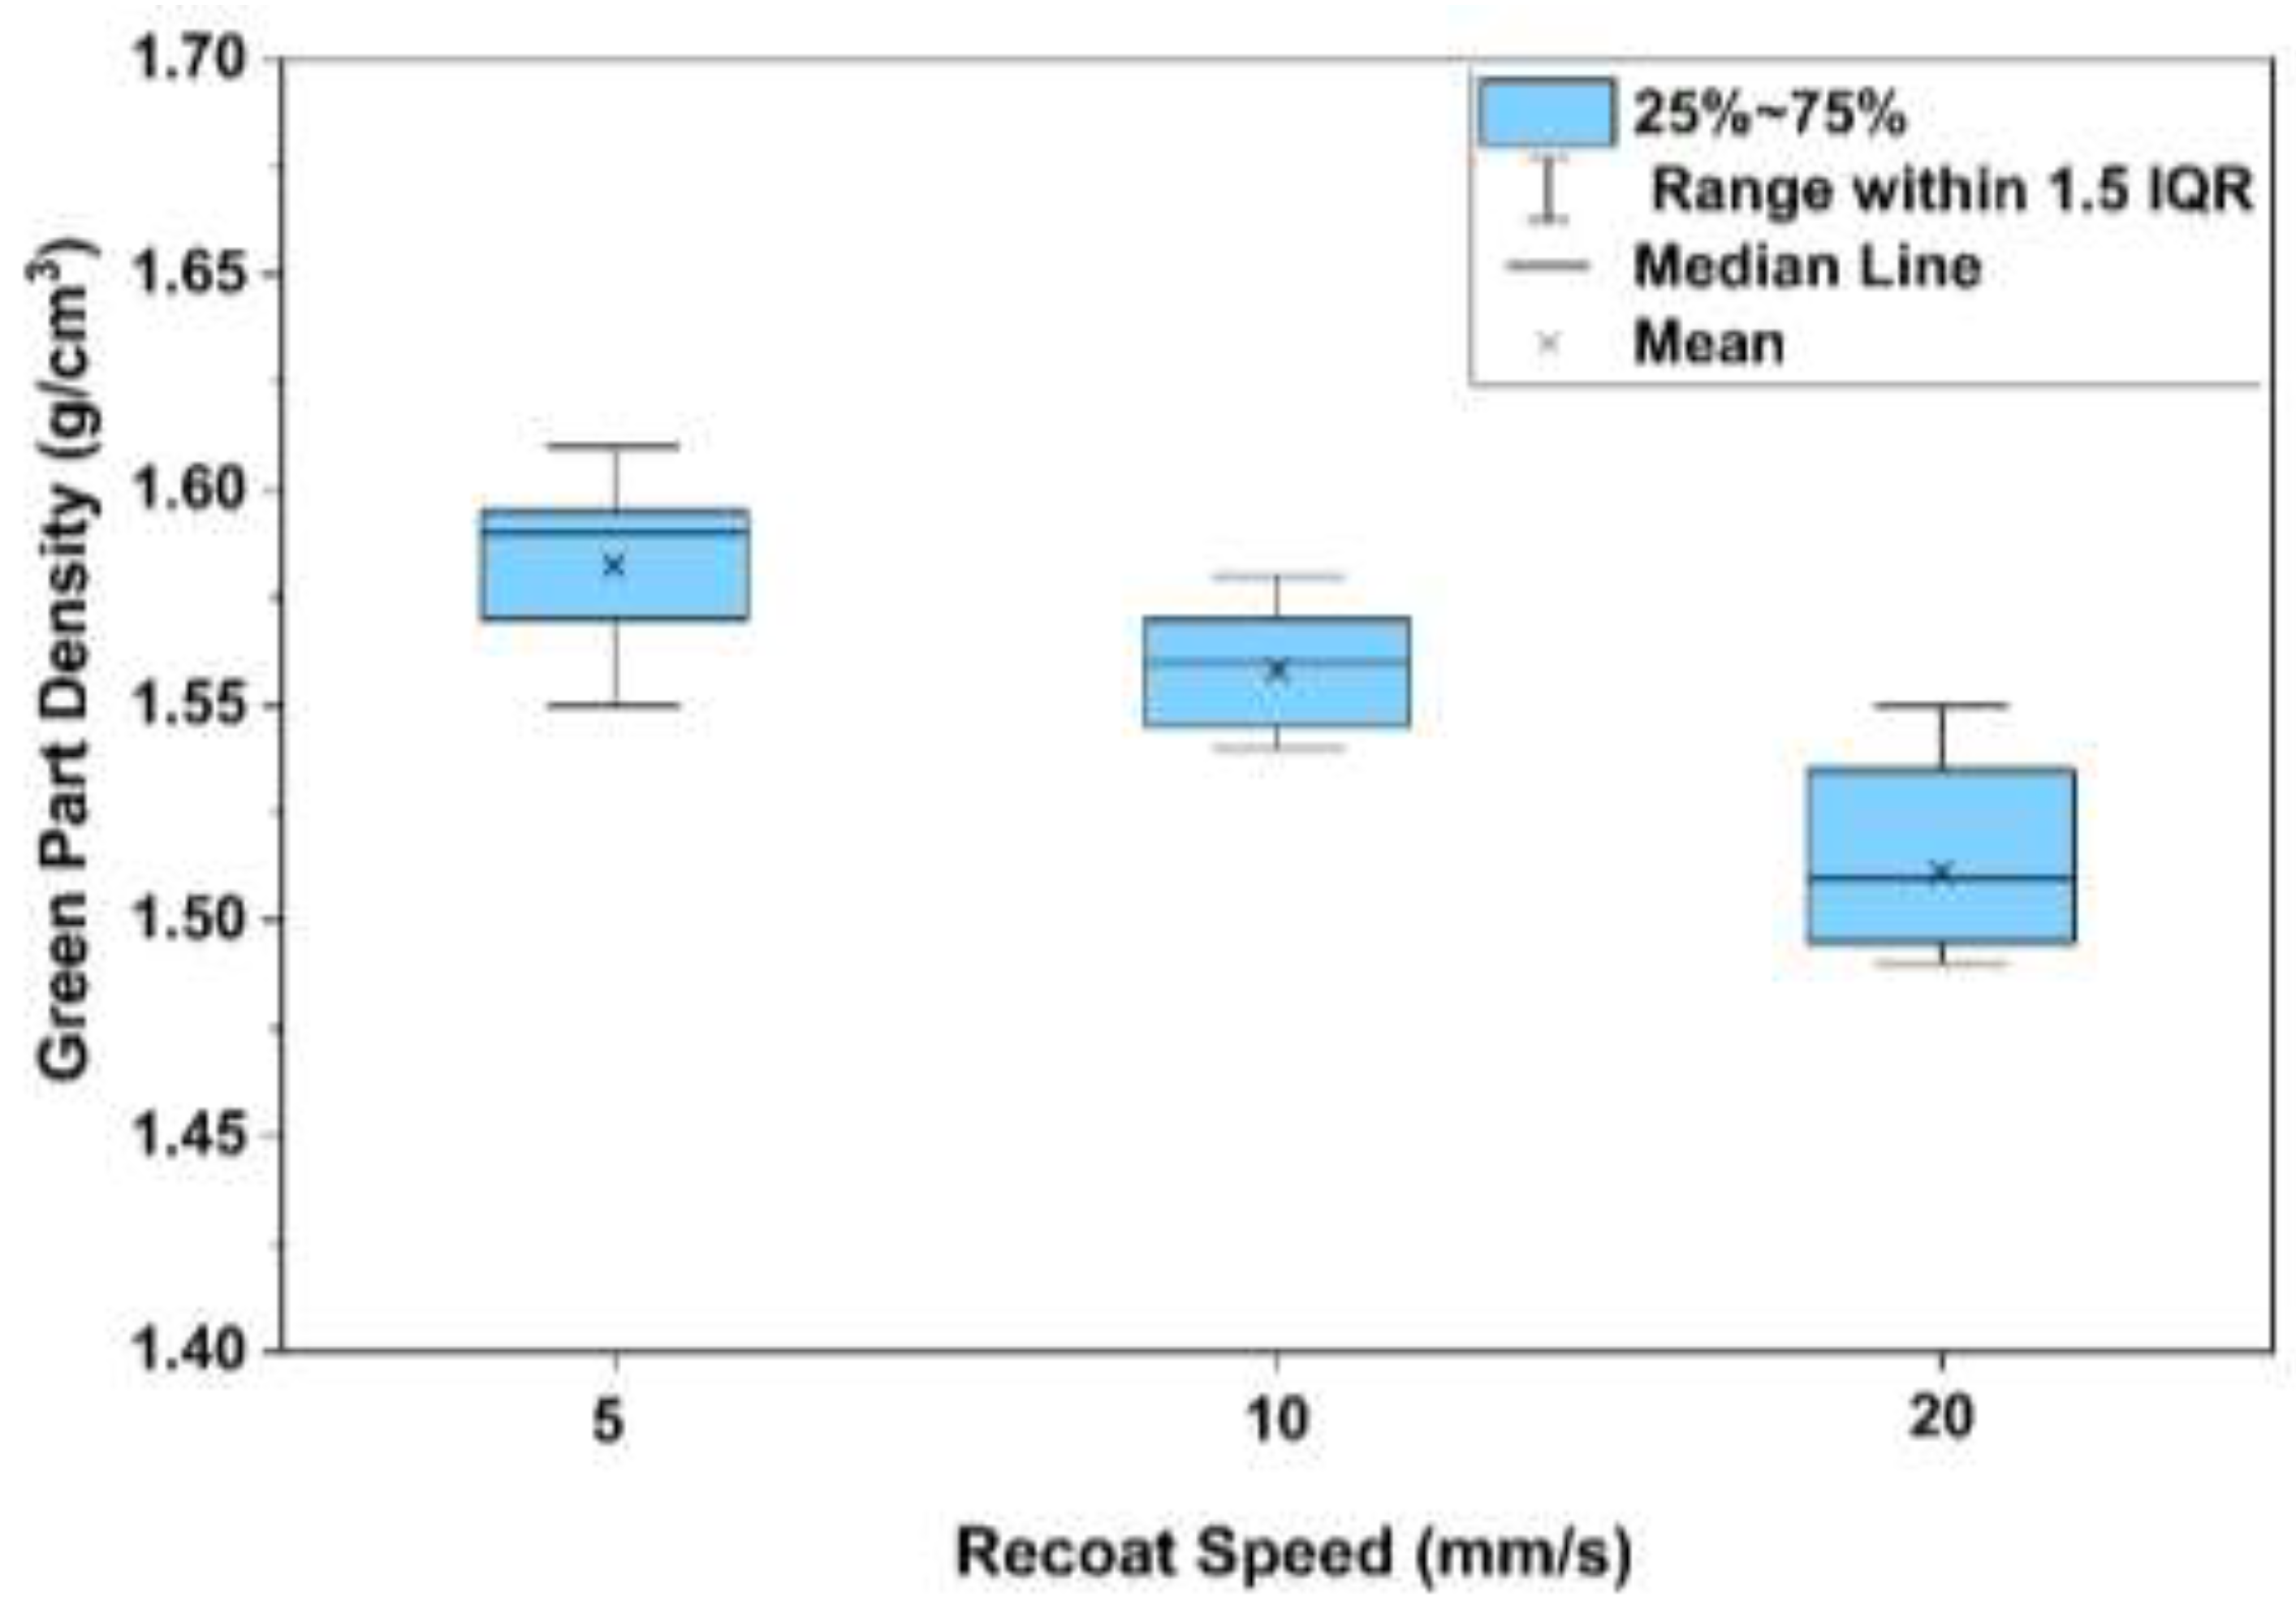
Figure 8.
Effects of recoat speed on powder bed density at a dispense delay of 1s.
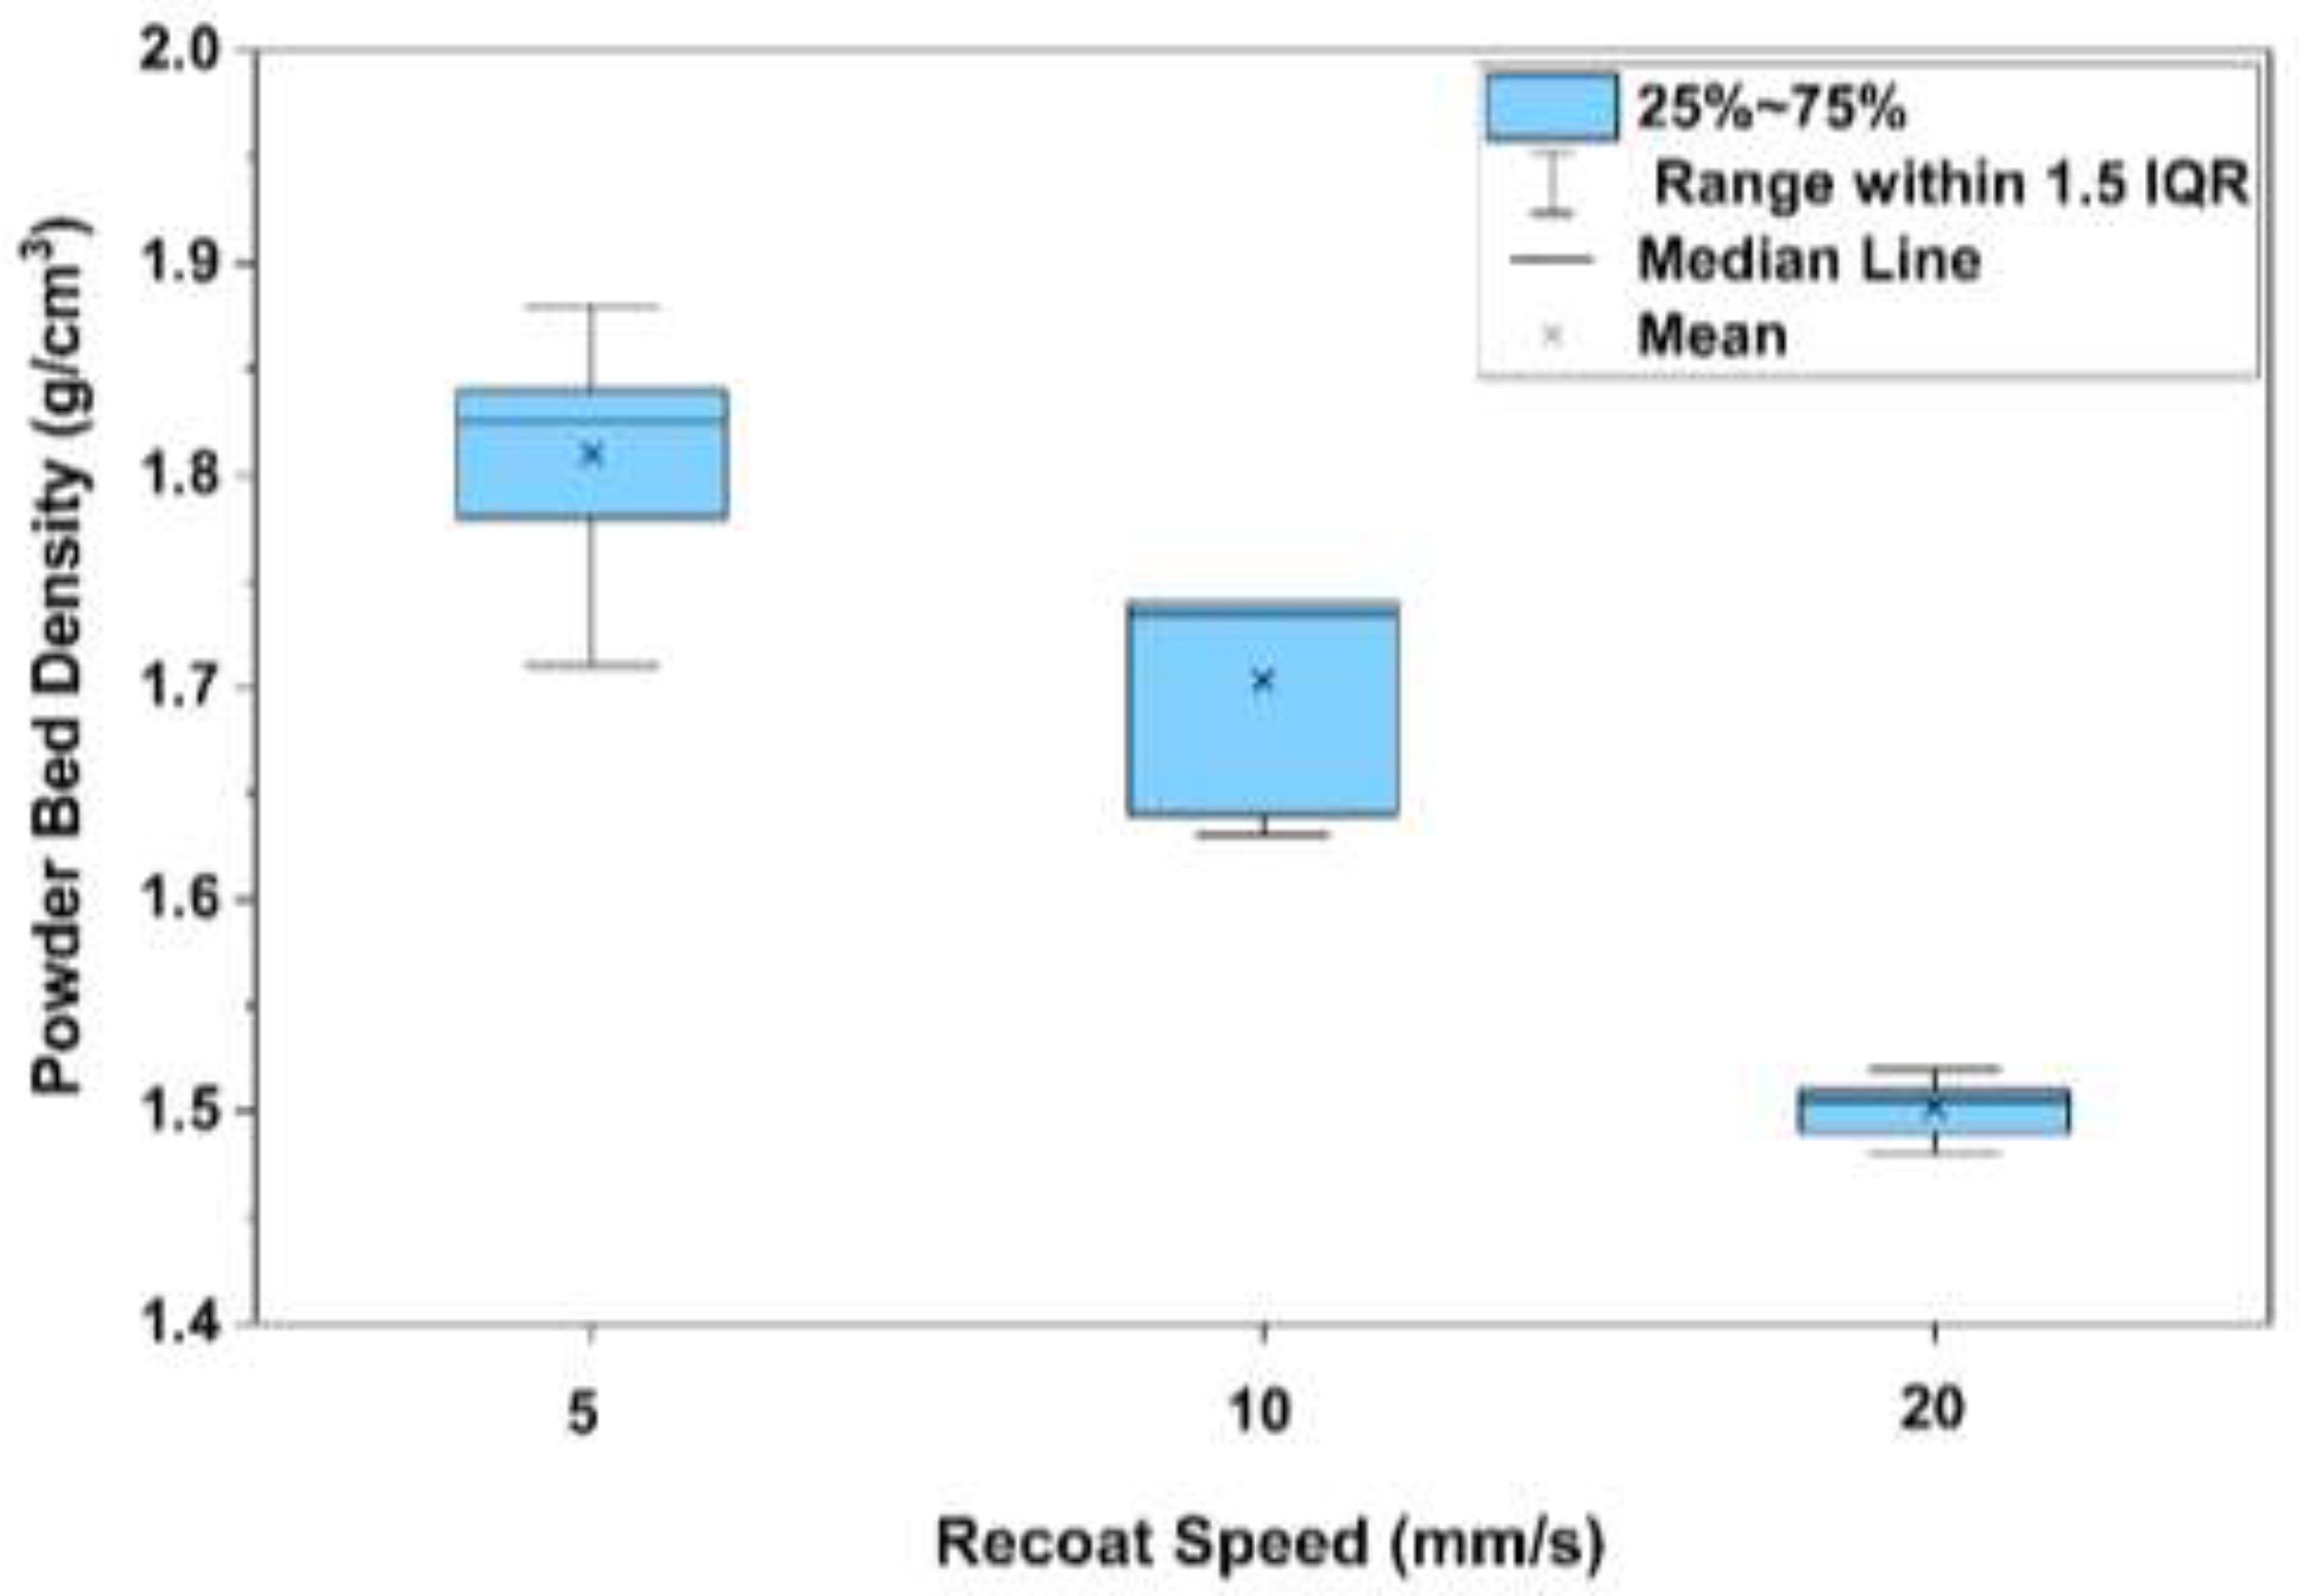
Figure 9.
Condition-level scatter plot of green part density (g/cm3) and powder bed density (g/cm3).
Figure 9.
Condition-level scatter plot of green part density (g/cm3) and powder bed density (g/cm3).
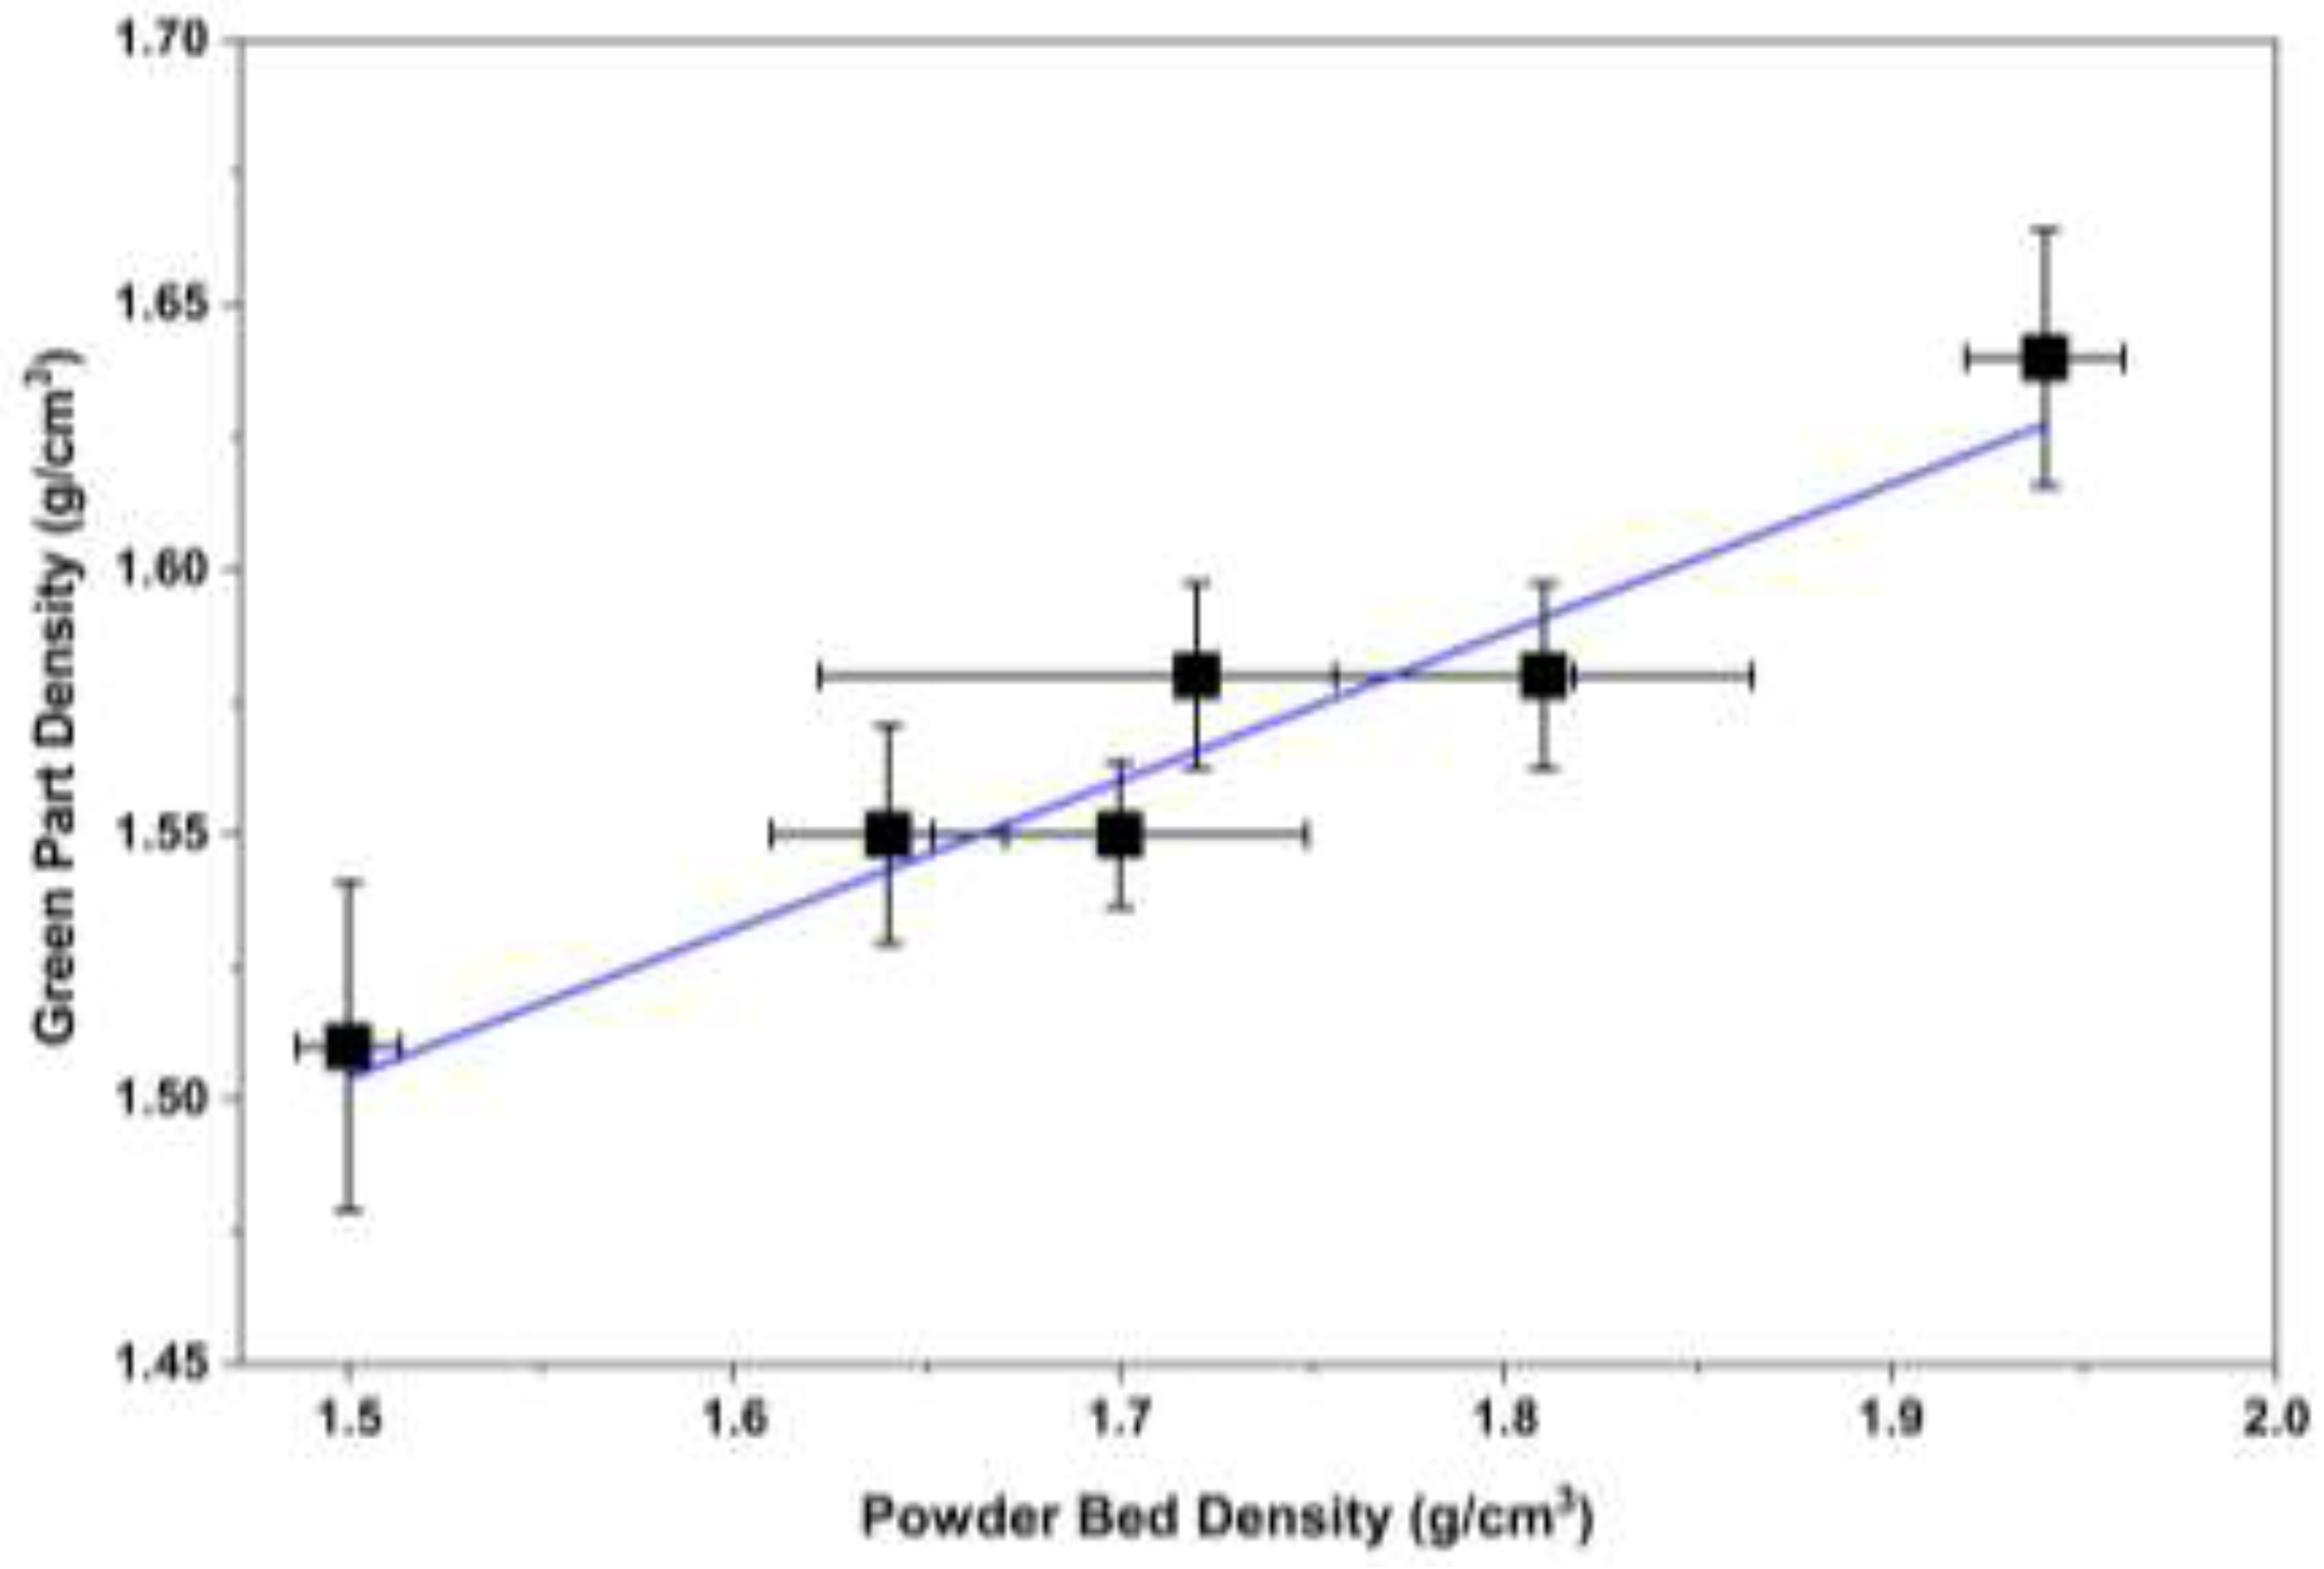

Table 1.
Reported studies on green part density in binder jetting.
| Material | Printing Parameter | Reference |
| Alumina | Layer thickness, recoat speed, binder saturation, drying time | [2] |
| Alumina | Layer thickness, binder saturation | [3] |
| Alumina | Layer thickness, compaction thickness | [4] |
| Barium Titanate | Binder saturation | [5] |
| Copper | Ultrasonic intensity, roller traverse speed | [6] |
| Inconel 625 | Binder saturation | [7] |
| Potassium sodium niobate | Binder saturation, binder set time, drying time, target bed temperature | [8] |
| Silicon Carbide | Layer thickness, compaction thickness | [9] |
| Stainless steel 316L | Layer thickness | [10] |
| Stainless steel 316L | Layer thickness, binder saturation | [11,12] |
| Stainless steel 316L | Layer thickness, roller diameter, roller speed | [13] |
| Stainless steel (316, 420) | Layer thickness, binder saturation | [14] |
| Stainless steel | Layer thickness, binder saturation, roller traverse speed | [15] |
| Stainless steel 316L | Print head speed | [16] |
| Stainless steel 316L | Layer thickness, droplet volume, printhead speed | [17] |
| Stainless steel 316L | Recoat speed | [17] |
| Tungsten carbide–cobalt | Layer thickness, binder saturation | [18] |
| Tungsten carbide–cobalt | Binder saturation, drying time | [19] |
| Tungsten carbide–cobalt | Layer thickness, binder saturation | [20] |
| Zirconia | Compaction thickness | [21] |
Table 2.
Fixed printing parameters and their values.
| Printing Parameter | Value |
| Layer thickness (µm) | 60 |
| Compaction Thickness (µm) | 0 |
| Ultrasonic intensity (%) | 100 |
| Roller traverse speed during spreading (mm/s) | 5 |
| Roller rotation speed during spreading (rpm) | 200 |
| Binder saturation (%) | 60 |
| Binder set time (s) | 20 |
| Bed temperature (°C) | 50 |
| Drying time (s) | 30 |
| Packing rate (%) | 50 |
Table 3.
Values of parameters at each experimental condition.
| Experimental Condition | Dispense Delay (s) | Recoat Speed (mm/s) |
| 1 | 0.2 | 5 |
| 2 | 1 | 5 |
| 3 | 1 | 10 |
| 4 | 1 | 20 |
| 5 | 5 | 5 |
Table 4.
Green part density under varying dispense delay and a recoat speed of 5 mm/s.
| Dispense Delay (s) | Location | Green Part Density (g/cm3) | Average Green Part Density (g/cm3) | Standard Deviation (g/cm3) | |
| Replication 1 | Replication 2 | ||||
| 0.2 | M1 | 1.58 | 1.57 | 1.55 | 0.0206 |
| M2 | 1.56 | 1.55 | |||
| M3 | 1.57 | 1.59 | |||
| M4 | 1.54 | 1.53 | |||
| M5 | 1.56 | 1.56 | |||
| M6 | 1.55 | 1.53 | |||
| M7 | 1.54 | 1.52 | |||
| M8 | 1.53 | 1.52 | |||
| 1 | M1 | 1.60 | 1.61 | 1.58 | 0.0175 |
| M2 | 1.59 | 1.58 | |||
| M3 | 1.60 | 1.59 | |||
| M4 | 1.60 | 1.55 | |||
| M5 | 1.59 | 1.56 | |||
| M6 | 1.58 | 1.55 | |||
| M7 | 1.59 | 1.57 | |||
| M8 | 1.57 | 1.59 | |||
| 5 | M1 | 1.68 | 1.66 | 1.64 | 0.0242 |
| M2 | 1.67 | 1.63 | |||
| M3 | 1.64 | 1.64 | |||
| M4 | 1.63 | 1.60 | |||
| M5 | 1.63 | 1.65 | |||
| M6 | 1.69 | 1.64 | |||
| M7 | 1.60 | 1.64 | |||
| M8 | 1.64 | 1.62 | |||
Table 5.
One-way ANOVA results regarding the effects of dispense delay on green part density.
| Source | Degree of Freedom | Adjusted Sum of Squares | Adjusted Mean Squares | F-Value | P-Value | η² |
| Dispense Delay | 2 | 0.05265 | 0.026327 | 37.26 | 0.000 | 0.6234 |
| Error | 45 | 0.03179 | 0.000707 | |||
| Total | 47 | 0.08445 |
Table 6.
Powder bed density under varying dispense delay and a recoat speed of 5 mm/s.
| Dispense Delay (s) | Location | Powder Bed Density (g/cm3) | Average Powder Bed Density (g/cm3) | Standard Deviation (g/cm3) | |
| Replication 1 | Replication 2 | ||||
| 0.2 | P1 | 1.59 | 1.60 | 1.64 | 0.0303 |
| P2 | 1.65 | 1.65 | |||
| P3 | 1.66 | 1.67 | |||
| 1 | P1 | 1.78 | 1.71 | 1.72 | 0.0978 |
| P2 | 1.84 | 1.81 | |||
| P3 | 1.60 | 1.60 | |||
| 5 | P1 | 1.94 | 1.94 | 1.94 | 0.0205 |
| P2 | 1.94 | 1.97 | |||
| P3 | 1.93 | 1.90 | |||
Table 7.
One-way ANOVA results regarding the effects of dispense delay on powder bed density.
| Source | Degree of Freedom | Adjusted Sum of Squares | Adjusted Mean Squares | F-Value | P-Value | η² |
| Dispense Delay | 2 | 0.28690 | 0.143450 | 32.83 | 0.000 | 0.8140 |
| Error | 15 | 0.06555 | 0.004370 | |||
| Total | 17 | 0.35245 |
Table 8.
Green part density under varying recoat speed and a dispense delay of 1 s.
| Recoat Speed (mm/s) | Location | Green Part Density (g/cm3) | Average Green Part Density (g/cm3) | Standard Deviation (g/cm3) | |
| Replication 1 | Replication 2 | ||||
| 5 | M1 | 1.60 | 1.61 | 1.58 | 0.0175 |
| M2 | 1.59 | 1.58 | |||
| M3 | 1.60 | 1.59 | |||
| M4 | 1.60 | 1.55 | |||
| M5 | 1.59 | 1.56 | |||
| M6 | 1.58 | 1.55 | |||
| M7 | 1.59 | 1.57 | |||
| M8 | 1.57 | 1.59 | |||
| 10 | M1 | 1.56 | 1.57 | 1.55 | 0.0137 |
| M2 | 1.58 | 1.54 | |||
| M3 | 1.58 | 1.55 | |||
| M4 | 1.57 | 1.54 | |||
| M5 | 1.57 | 1.55 | |||
| M6 | 1.57 | 1.55 | |||
| M7 | 1.56 | 1.54 | |||
| M8 | 1.56 | 1.54 | |||
| 20 | M1 | 1.53 | 1.55 | 1.51 | 0.0309 |
| M2 | 1.42 | 1.50 | |||
| M3 | 1.54 | 1.51 | |||
| M4 | 1.49 | 1.52 | |||
| M5 | 1.55 | 1.50 | |||
| M6 | 1.49 | 1.51 | |||
| M7 | 1.53 | 1.49 | |||
| M8 | 1.54 | 1.51 | |||
Table 9.
One-way ANOVA results regarding the effects of recoat speed on green part density.
| Source | Degree of Freedom | Adjusted Sum of Squares | Adjusted Mean Squares | F-Value | P-Value | η² |
| Recoat Speed | 2 | 0.05025 | 0.025127 | 59.69 | 0.000 | 0.7262 |
| Error | 45 | 0.01894 | 0.000421 | |||
| Total | 47 | 0.06920 |
Table 10.
Powder bed density under varying recoat speed and a dispense delay of 1 s.
| Recoat Speed (mm/s) | Location | Powder Bed Density (g/cm3) | Average Powder Bed Density (g/cm3) | Standard Deviation (g/cm3) | |
| Replication 1 | Replication 2 | ||||
| 5 | P1 | 1.78 | 1.71 | 1.81 | 0.0541 |
| P2 | 1.84 | 1.81 | |||
| P3 | 1.88 | 1.84 | |||
| 10 | P1 | 1.64 | 1.63 | 1.70 | 0.0485 |
| P2 | 1.74 | 1.74 | |||
| P3 | 1.73 | 1.74 | |||
| 20 | P1 | 1.49 | 1.48 | 1.50 | 0.0134 |
| P2 | 1.51 | 1.52 | |||
| P3 | 1.51 | 1.50 | |||
Table 11.
One-way ANOVA results regarding the effects of recoat speed on powder bed density.
| Source | Degree of Freedom | Adjusted Sum of Squares | Adjusted Mean Squares | F-Value | P-Value | η² |
|---|---|---|---|---|---|---|
| Recoat Speed | 2 | 0.29423 | 0.147117 | 67.24 | 0.000 | 0.8996 |
| Error | 15 | 0.03282 | 0.002188 | |||
| Total | 17 | 0.32705 |
Disclaimer/Publisher’s Note: The statements, opinions and data contained in all publications are solely those of the individual author(s) and contributor(s) and not of MDPI and/or the editor(s). MDPI and/or the editor(s) disclaim responsibility for any injury to people or property resulting from any ideas, methods, instructions or products referred to in the content. |
© 2026 by the authors. Licensee MDPI, Basel, Switzerland. This article is an open access article distributed under the terms and conditions of the Creative Commons Attribution (CC BY) license (http://creativecommons.org/licenses/by/4.0/).
Copyright: This open access article is published under a Creative Commons CC BY 4.0 license, which permit the free download, distribution, and reuse, provided that the author and preprint are cited in any reuse.


