Submitted:
09 February 2026
Posted:
12 February 2026
You are already at the latest version
Abstract
This article proposes and validates a finance-oriented 5P–ESG composite index to provide an integrated assessment of the sustainable, financial, and corporate governance perfor-mance of firms in emerging markets, with application to the MSCI COLCAP universe. The conceptual framework is derived from the “5Ps” approach of the 2030 Agenda (People, Planet, Prosperity, Peace, and Partnerships), which structures sustainable development goals into five operational, comparable dimensions that are relevant for decision-making in corporate governance and capital market contexts. To operationalize the construct, a set of corporate indicators was defined, data cleansing and standardization procedures were applied to ensure comparability across issuers, and pillar-level scores were constructed. Subsequently, the overall index was estimated through weighted aggregation using en-dogenous weights derived from principal component analysis, following methodological recommendations for composite indices aimed at mitigating collinearity and dou-ble-counting issues. The robustness of the instrument is supported by internal consistency tests and measures of sampling adequacy for factor analysis (KMO/Bartlett), providing evidence of the statistical coherence of the measurement framework. From an applied perspective, the index enables the relative classification of issuers (laggards–transition–leaders) using indicator terciles, offering a quantitative tool for screening, coverage priori-tization, and support for investment and sustainable governance decisions within fun-damental analysis. The findings are interpreted in light of the accumulated evidence on the relationship between ESG practices, financial performance, and cost of capital, high-lighting the usefulness of the approach in emerging markets characterized by heteroge-neous regulatory frameworks and ESG disclosure levels.
Keywords:
sustainability
; emerging markets
; MSCI COLCAP
; 2030 agenda 5Ps
; ESG
; responsible investment
1. Introduction
Over the past decade, capital markets have shifted from a strictly financial interpretation of corporate performance toward a broader assessment of risks and opportunities associated with environmental, social, and governance (ESG) factors. This shift is not driven solely by ethical preferences, but by growing empirical evidence showing that environmental externalities, institutional quality, human capital, and stakeholder management can translate into financially material risks, including cash flow volatility, reputational shocks, litigation exposure, operational disruptions, regulatory constraints, and, ultimately, changes in the cost of capital and firm value [1,2,3]. At an aggregate level, widely cited meta-analytical evidence reports a predominantly non-negative relationship between ESG performance and financial performance, although with substantial heterogeneity across sectors, time horizons, and measurement approaches [4].
In parallel, sustainable investing has evolved from a niche strategy into a structural component of global capital markets. Investor demand for funds and strategies integrating sustainability considerations has proven sensitive to simplified signals such as ESG ratings and rankings, as well as to the salience of non-financial information, thereby creating incentives for issuers and asset managers to adopt comparable ESG metrics [5]. In equilibrium, recent asset pricing theory suggests that sustainability may affect asset prices through two distinct channels: (i) a risk channel, whereby exposure to non-diversifiable ESG-related risks (e.g., carbon risk) commands a premium, and (ii) a preference channel, whereby investors derive non-pecuniary utility from holding sustainable assets and may accept lower expected returns. These channels have different implications for valuation, expected returns, and the cost of capital [6,7,8].
Despite this growing relevance, progress in ESG measurement has been far from linear. The proliferation of ESG scores and ratings provided by data vendors such as MSCI, Refinitiv, and Sustainalytics has been accompanied by substantial divergence across providers. Prior research documents that these discrepancies are not merely the result of different weighting schemes, but primarily reflect differences in measurement choices and scope, generating uncertainty for investors, issuers, and regulators and complicating both comparability and empirical research [9,10]. Moreover, improvements in ESG disclosure do not necessarily reduce disagreement among ratings and may even exacerbate it, reinforcing the need for methodological transparency and conceptual consistency in ESG measurement frameworks [11].
These challenges are particularly pronounced in emerging markets. In such contexts, non-financial information is often heterogeneous, fragmented, or predominantly narrative in nature, and global ESG frameworks may fail to adequately capture institutional dimensions that are critical for firm-level risk assessment. Consequently, the mechanical application of global ESG ratings may introduce coverage and comparability biases, especially in regions where country risk, governance quality, and institutional stability play a central role in shaping corporate performance.
Against this backdrop, there is a need for a conceptual framework capable of integrating sustainability considerations into financial analysis without reducing them to a fragmented checklist of indicators. The United Nations 2030 Agenda offers a synthetic organizing structure through the so-called “5Ps”—People, Planet, Prosperity, Peace, and Partnerships—which groups the Sustainable Development Goals into five interrelated dimensions balancing social, environmental, economic, and institutional aspects of development [12].
From an operational perspective, the research problem can be formulated as follows: how can the 5Ps be translated into a comparable, firm-level metric that is suitable for screening, coverage prioritization, and fundamental analysis, while simultaneously addressing common shortcomings of ESG indices such as collinearity, double counting, and arbitrary weighting schemes? The literature on composite indicators emphasizes that index construction should follow an explicit and transparent methodological process, including variable selection and cleansing, normalization, assessment of latent structure, and defensible aggregation rules [13,14].
In response, this article proposes and validates a finance-oriented 5P–ESG composite index to evaluate sustainable and financial performance in an emerging market context, with application to the MSCI COLCAP universe. The methodological approach follows a phased logic encompassing statistical data cleansing, normalization, pillar-level scoring, and the construction of a global index through weighted aggregation using endogenous weights derived from principal component analysis (PCA), with the aim of mitigating collinearity and double-counting issues. Instrument robustness is assessed through internal consistency measures and tests of sampling adequacy for factor analysis (KMO/Bartlett), providing evidence of the statistical coherence of the measurement framework.
The contribution of this study is twofold. First, from a conceptual standpoint, it operationalizes the 5P framework into a quantitative tool suitable for financial analysis, explicitly incorporating dimensions—such as Peace and Partnerships—that are often underrepresented in corporate ESG metrics yet particularly relevant in emerging markets. Second, from a methodological perspective, it combines best practices in composite index construction with statistical validation to deliver a replicable and auditable instrument capable of classifying issuers into comparable categories (laggards–transition–leaders) and supporting responsible investment decisions in environments characterized by heterogeneous ESG disclosure.
2. Theoretical Framework
2.1. Financial Analysis and Decision-Making in Emerging Markets
Traditional financial analysis has historically relied on the examination of financial statements through indicators of profitability, liquidity, operational efficiency, and solvency as the primary basis for assessing corporate performance and supporting investment and financing decisions [15]. However, in emerging markets typically characterized by higher volatility, information asymmetries, and disclosure gaps this approach may be insufficient to capture risks and opportunities that are not immediately reflected in accounting figures, yet materially affect the cost of capital, market perception, and the sustainability of cash flows. Empirical evidence indicates that higher levels of disclosure are associated with a lower cost of capital, and that this effect tends to be stronger in environments with weaker disclosure regimes, a common feature of emerging economies [16,17].
In this context, a purely financial approach faces limitations in incorporating social and environmental externalities that, although non-financial in nature, may translate into material risks—regulatory, operational, reputational, or transition-related—with direct implications for firm value. Financial research has documented that stronger corporate social responsibility and ESG performance are associated with a lower cost of capital, suggesting that these factors operate as risk mitigators and/or improve the firm’s information environment [18]. The principle of materiality is central in this relationship: effects are more robust when sustainability is managed and measured around issues that are financially material to the industry, rather than through decorative or symbolic variables that do not affect value creation or risk mitigation [19].
In contexts such as Colombia, where sustainability reporting frameworks and practices remain regionally heterogeneous, there is a persistent risk that financial analysis becomes disconnected from qualitative and non-financial variables that anticipate future contingencies. Sectoral and regional reports highlight progress in ESG disclosure across Latin America, but also reveal persistent gaps in comparability and consistency that limit effective benchmarking and integrated assessment by investors [20]. Moreover, even when ESG metrics are available, their interpretation requires caution, as ratings may diverge substantially due to differences in scope, measurement, and weighting, potentially leading to distorted conclusions if underlying assumptions and methodologies are not made explicit [21]. Consequently, a robust agenda for emerging markets involves integrating financial analysis with sustainability measures under criteria of materiality, traceability, and comparability, while recognizing the role of disclosure regulation in improving the information environment and the decision usefulness of non-financial information [22].
2.2. Corporate Sustainability and ESG Reporting
Corporate sustainability refers to an organization’s ability to sustain value creation over time by integrating economic performance with social and environmental responsibilities, moving beyond short-term profit maximization [23]. In contemporary financial practice, this shift reflects the recognition that externalities—previously treated as non-financial—can evolve into economically material risks, such as sanctions, operational disruptions, reputational losses, or litigation exposure, thereby affecting valuation, cost of capital, and cash-flow stability. Empirical evidence supports this linkage: non-financial disclosure and socially responsible performance have been associated with lower capital costs and superior financial outcomes over medium- and long-term horizons [24,25,26], particularly when initiatives focus on material issues aligned with industry and strategy rather than peripheral or cosmetic actions [19].
Within this framework, ESG reporting has become a central mechanism for transparency and comparability, driven by international standards and frameworks designed to enhance the traceability of sustainability-related risks and opportunities. The GRI Standards, especially the revised Universal Standards, have strengthened an impact-oriented accountability approach, with the latest update published in October 2021 becoming effective for reports issued from January 2023 onward [27].
In parallel, the Sustainability Accounting Standards Board (SASB) Standards have consolidated an investor-oriented disclosure logic focused on sustainability risks and opportunities with potential financial impacts. Following their institutional integration into the IFRS Foundation, SASB Standards now serve as sectoral guidance for the application of IFRS S1 and the identification of financially material sustainability issues [28]. Complementarily, the Integrated Reporting Framework promotes connectivity between financial and non-financial information, seeking to coherently explain how value is created or eroded in the short, medium, and long term [29]. While the convergence of these frameworks does not automatically resolve issues of data quality, consistency, or verifiability, it does raise the minimum disclosure threshold and reinforces the principle that sustainability should be anchored in strategy, governance, and metrics.
Nevertheless, in Latin America, ESG disclosure adoption remains uneven in both coverage and depth, with visible gaps in assurance, comparability, and intersectoral consistency. Regional surveys document progress in climate target disclosure and SDG alignment, but also reveal lagging assurance rates and strong heterogeneity across countries and industries, complicating homogeneous financial interpretation of sustainability-related risks [20]. At the same time, the expansion of sustainability-linked financial instruments—such as ESG bonds and sustainability-linked bonds—has increased pressure for more robust reporting and verifiable governance practices to sustain market credibility [30]. Thus, the challenge is not merely to report more, but to report better: through traceable, consistent, and comparable indicators supported by explicit materiality and weighting criteria that translate sustainability into decision-useful financial signals.
2.3. Sustainable Finance: From Preference to Financial Materiality
The contemporary debate on sustainable finance rests on a core premise: corporate sustainability can be financially material. Empirical studies show that voluntary non-financial disclosure can reduce the cost of equity when associated with superior social performance [24], and that markets incorporate CSR/ESG information into firm valuation contingent on stakeholder awareness and visibility [3]. Evidence from crisis periods further suggests that corporate social capital may act as a buffer during times of stress, with observable effects on returns and operating performance [31].
At the research frontier, equilibrium asset pricing models distinguish between sustainability as risk and sustainability as preference, clarifying why identical ESG scores may be associated with different expected return patterns depending on investor constraints, non-pecuniary demand, and arbitrage capacity [6,7]. In parallel, literature on climate risk and carbon premia documents that emissions and climate-related exposures may be priced in asset markets, supporting the environmental dimension of financial materiality [8].
Meta-analytical evidence widely cited in the literature finds that the ESG–financial performance relationship is, on average, positive or non-negative, though sensitive to study design, region, industry, and measurement choices [26]. While this does not eliminate controversy, it reinforces the central argument of this study: the key issue is no longer whether ESG matters, but how to measure it in a comparable and decision-relevant manner, particularly in contexts characterized by heterogeneous disclosure.
2.4. The 5P Framework as an Integrative and Operational Approach
The 2030 Agenda proposes a conceptual architecture that synthesizes sustainable development into five interrelated dimensions: People, Planet, Prosperity, Peace, and Partnerships [12]. This structure offers two advantages for financial analysis: first, it avoids a reductionist interpretation of ESG narrowly focused on environmental factors or reporting practices; second, it enables an operationalization by pillars that can be translated into observable and comparable indicators. This study explicitly assumes that the 5Ps provide an organizing logic for structuring sustainability objectives into operational dimensions suitable for the construction of a composite index applied to the MSCI COLCAP.
Importantly, the Peace pillar explicitly introduces the institutional dimension—justice, institutions, and legal certainty which in emerging markets directly affects regulatory risk, compliance risk, and corporate governance quality. Similarly, Partnerships capture intersectoral cooperation, value-chain linkages, and stakeholder engagement maturity, which are relevant for strategy, operational continuity, and social license to operate. This broader framing is consistent with the need to move beyond imported metrics that overlook dimensions critical to Latin American realities.
2.5. Disclosure Standards: From Voluntary Reporting to Convergence
ESG measurement relies on an ecosystem of disclosure standards. The Task Force on Climate-related Financial Disclosures (TCFD) established a climate disclosure framework focused on decision-useful information for capital markets, structured around governance, strategy, risk management, and metrics and targets [32]. More recently, the International Sustainability Standards Board (ISSB) issued its first two global sustainability disclosure standards (IFRS S1 and IFRS S2), creating a global baseline for sustainability and climate-related reporting aimed at investors and integrating existing frameworks such as TCFD and SASB [33].
In parallel, GRI has remained dominant in impact-oriented disclosure (impact materiality), while SASB now under the IFRS Foundation prioritizes financial materiality by industry, facilitating comparability of investor-relevant risks and opportunities [27]. These architectures justify the methodological phase of this study that selects variables aligned with international standards (GRI, SASB, TCFD, UN Global Compact, and MSCI ESG Ratings), while also highlighting a critical point: convergence of standards does not automatically resolve measurement problems, but instead heightens the importance of traceability and internal consistency when constructing composite indices.
2.6. ESG Ratings: Divergence, Uncertainty, and Decision Effects
Although ESG ratings simplify complexity to facilitate decision-making, the literature documents substantial divergence across providers. Evidence shows that this divergence is driven primarily by differences in measurement rather than weighting schemes, implying that improvements in ESG performance may send different signals depending on the provider and taxonomy used [21]. Complementary research emphasizes that convergence among ratings faces structural limits due to underlying theoretical assumptions and commensurability issues [10].
Moreover, evidence suggests that ESG disclosure mandates may improve transparency without necessarily reducing rating disagreement and may even increase it, with potential effects on volatility and access to financing [11].
2.7. Composite Indices: Methodological Risks and the Choice of PCA
The design of composite indices requires methodological rigor, as seemingly minor choices—such as normalization methods, outlier treatment, or weighting schemes—can materially affect rankings and conclusions. The OECD/JRC Handbook provides a widely cited reference, recommending a systematic construction process involving data cleansing, correlation analysis, structural assessment, weighting selection, sensitivity analysis, and transparency [13]. Greco et al. [14] further emphasize conceptual coherence and statistical robustness as core principles.
In this study, the methodological process is organized into four phases: data cleansing, normalization, pillar-level scoring, and composite index construction. This sequence aligns with international best practices. The use of principal component analysis (PCA) to derive endogenous weights is methodologically justified, as it captures shared variance and reduces arbitrariness in weighting particularly relevant in ESG contexts where collinearity and double counting are common. However, PCA does not identify causality but statistical structure; therefore, its use must be supported by content validity and evidence of measurement adequacy. Accordingly, this study employs internal consistency measures and KMO/Bartlett tests to support the coherence of the measurement framework.
2.8. Disclosure, Liquidity, and Regulation in Emerging Markets
Recent literature documents that ESG disclosure mandates can affect market liquidity and quality, with heterogeneous effects depending on enforcement and institutional design [22]. This issue is particularly relevant for Colombia, where institutional quality and regulatory structure interact with firms’ effective reporting and verification capacity. This reinforces the relevance of explicitly incorporating the Peace dimension institutions, justice, and compliance rather than treating it as a residual governance subcomponent, thereby acknowledging its direct role in shaping risk, credibility, and sustainable corporate governance in emerging markets.
3. Materials and Methods
3.1. Research Approach and Design
This study is framed within a quantitative approach of an applied and explanatory nature, with a non-experimental, cross-sectional design. It is quantitative because it uses measurable financial and sustainability information that can be statistically processed; applied because it seeks to construct an operational tool (the 5P–ESG Index) useful for financial analysis; and explanatory because it evaluates the relationship between sustainable performance and financial performance of the companies that make up the MSCI COLCAP index of the Colombian Stock Exchange.
Likewise, the study adopts a non-experimental and cross-sectional design, since the data are collected for a specific period and the variables of analysis are not manipulated but rather observed as they occur in the market. The cross-sectional nature reflects that the analysis is conducted for a specific period, considering as the unit of reference the set of companies included in the MSCI COLCAP index.
The methodological process is structured into four phases: statistical data cleaning, normalization, construction of scores by dimension, and development of the composite index.
3.2. Population and Sample
The population under study consists of the companies included in the MSCI COLCAP index, the main stock market index of the Colombian equity market.
The sample coincides with the population, as the study uses all companies that comprise the index during the period of analysis. This approach avoids selection bias and ensures that the results obtained are representative of the aggregated behavior of the Colombian equity market.
Each company constitutes a unit of analysis, for which traditional financial indicators and sustainability metrics integrated under the 5P framework are constructed.
3.3. Data Collection and Analysis Techniques
The information base comprises 17 companies belonging to the MSCI COLCAP, for which financial and sustainability indicators were collected from public sources: integrated reports, sustainability reports, audited financial statements, and regulatory documents.
The design process of the 5P–ESG Index began with the development of a preliminary instrument composed of 28 variables distributed across the five pillars of the model (People, Planet, Prosperity, Peace, and Partnerships). The initial selection was based on a review of international ESG standards (GRI, SASB, TCFD, UN Global Compact, MSCI ESG Ratings), a review of the specialized literature on sustainability metrics and corporate performance in emerging markets, and finally an analysis of conceptual completeness criteria, incorporating multiple potential indicators to ensure broad coverage of each dimension.
This phase ensured content validity, but it did not imply that all variables were statistically consistent or empirically relevant. Therefore, a rigorous process of validation and item reduction was conducted, as recommended by Henseler et al. (2015) and Berg et al. (2022) for the construction of ESG composite indices.
3.4. Initial Construction of the Instrument
As part of the construction process of the 5P–ESG composite index, the study initially considered a total of 28 conceptually grouped variables aimed at broadly capturing the financial and sustainability dimensions associated with the five Ps of sustainable development: People, Planet, Prosperity, Peace, and Partnerships.
The preliminary selection of variables was based on three fundamental criteria:
- Theoretical support in the literature on sustainable finance, ESG, and corporate performance;
- International standards such as GRI, SASB, and MSCI ESG Ratings;
- Availability and comparability of information for companies listed on the Colombian Stock Exchange.
This process resulted in a broader initial instrument, which was subsequently subjected to statistical cleaning and validation procedures in order to construct a final version that is more parsimonious, robust, and operationally viable (see Table 1).
Table 1 presents the preliminary instrument comprising 28 indicators, designed to broadly cover the five dimensions of People, Planet, Prosperity, Peace, and Partnerships.
However, to ensure that the composite index was operationally viable, comparable across issuers, and statistically stable, a data reduction process based on four sequential filters (F1–F4) was applied, combining expert judgment (content validity) and statistical criteria (empirical validity). The objective was to obtain a parsimonious set of variables with high financial interpretability and internal consistency, enabling the construction of pillar-level scores and the overall I5P index.
F1. Content and applicability filter (expert judgment).
A technical review of the preliminary list was conducted to assess: (i) alignment with the 5P construct, (ii) conceptual clarity and directionality, and (iii) financial relevance for corporate analysis. Priority was given to indicators with direct interpretability for investors (e.g., verifiable policies, comparable ratios, efficiency metrics, and distribution measures). Variables whose measurement was highly heterogeneous across sectors or not consistently reportable across issuers were identified and excluded at this stage.
F2. Availability and comparability filter within the MSCI COLCAP universe.
Data availability for each indicator was audited for the period under analysis. Indicators with systematic data gaps or inconsistent definitions across firms were excluded. This filter is critical in composite index construction, as it avoids biases arising from excessive imputation and ensures that rankings reflect actual differences in corporate performance rather than information gaps.
F3. Preliminary statistical quality filter (variability and redundancy).
Indicators exhibiting (i) null or near-zero variance (i.e., lacking discriminatory power across issuers), and (ii) redundancy (very high correlations implying double counting of the same underlying phenomenon) were removed. These controls enhance index stability and reduce the risk that final scores are disproportionately driven by a single subset of variables.
F4. Statistical validation of the instrument (reliability and structure).
For the refined set of indicators, internal consistency tests (Cronbach’s alpha at the pillar and global levels) and factorability tests (KMO and Bartlett’s test of sphericity) were applied as prerequisites for exploratory factor analysis (EFA).
Subsequently, EFA confirmed that the retained indicators exhibited an interpretable factor structure and adequate factor loadings, supporting the empirical coherence of the measurement instrument.
In summary, the filters—defined ex ante and designed to be replicable—followed the logic outlined below:
F1 = Content validity (expert judgment: 5P relevance and financial interpretability).
F2 = Availability and comparability (consistent public data for COLCAP issuers; low missingness).
F3 = Preliminary statistical quality (sufficient variability and non-redundancy; avoidance of non-discriminatory items).
F4 = Empirical validation (contribution to reliability and structure: internal consistency and interpretable factor patterns).
Overall, the instrument refinement process was structured as a sequential and replicable filtering procedure (F1–F4), aimed at ensuring that the resulting index is comparable across issuers, operationally measurable, and statistically robust. This approach avoids the inclusion of indicators with limited availability or heterogeneous measurement and mitigates double counting arising from redundancy. Accordingly, priority was first given to content validity and financial interpretability (F1), followed by empirical feasibility within the MSCI COLCAP universe (F2), then discriminatory capacity and preliminary statistical quality (F3), and finally empirical coherence through reliability and structural tests (F4). The incremental logic of the procedure is summarized in Table 2.
Based on the traceability presented in Table 2, the filtering process made it possible to move from the preliminary set of 28 indicators to a parsimonious core of variables with high inter-firm comparability, direct financial interpretability, and conceptual coherence with the 5P framework. Accordingly, Table 3 presents the decisive filter and the complete structure and specifications for each indicator, following a logic analogous to PRISMA reporting applied to index construction. Likewise, the core instrument (n = 16) used in the subsequent stages of the study is consolidated: direction homogenization, winsorization, normalization (Z-scores), calculation of pillar scores, and construction of the composite index (I5P–Score), as well as internal consistency and structural tests (Cronbach’s alpha, KMO/Bartlett, and EFA) (See Table 3).
Preliminary statistical treatment of the data
The construction of the synthetic scores associated with the five dimensions of the 5P model (People, Planet, Prosperity, Peace, and Partnerships) followed a standardized statistical procedure designed to ensure comparability across heterogeneous indicators, reduce distortions caused by extreme values, and provide the statistical consistency required for a robust composite index.
The index design adopted a four-step standardization procedure, in line with OECD recommendations [1] and the specialized literature on ESG ratings [2,3]:
(i) data cleaning and winsorization,
(ii) standardized normalization,
(iii) aggregation of items by dimension, and
(iv) estimation of the final score for each pillar.
This procedure ensures the statistical stability of the estimates and prevents extreme values or scale differences from affecting comparability across firms included in the MSCI COLCAP index.
First, a bilateral winsorization procedure (scientific control of outliers) was applied, setting the 5th and 95th percentiles as lower and upper bounds, respectively. This method allows to:
(i) mitigate the influence of extreme values without eliminating observations, thus preserving the full sample structure;
(ii) reduce the impact of outliers associated with atypical variations or measurement errors;
(iii) retain all cases in the analysis, unlike trimming procedures that remove observations; and
(iv) improve the stability of means and dispersions in sensitive indicators such as ratios, rates, operational days, and risk-management-related metrics.
Given that the data matrix includes quantitative and proportional performance indicators across the five dimensions (People, Planet, Prosperity, Peace, and Partnerships), winsorization was applied exclusively to continuous variables:
PEO1–PEO2 (People)
PLA1–PLA2 (Planet)
PRO1–PRO6 (Prosperity)
PEA1–PEA3 (Peace)
ALI1–ALI3 (Partnerships)
Binary/categorical columns (values 0–1) do not require winsorization.
Now, for each of the numerical indicators:
- Each variable was sorted in ascending order.
- The 5th (P5) and 95th (P95) percentiles were identified.
- Values below P5 were replaced with the exact value of the 5th percentile.
- Values above P95 were replaced with the corresponding 95th percentile.
Accordingly, for each indicator , its winsorized version was defined as:
Where and correspond to the 5th and 95th percentiles of each quantitative variable.The transformation preserves the relative structure of the dataset while reducing the influence of extreme outliers.
Winsorization resulted in:
- A reduction in dispersion for highly volatile indicators such as PRO1, PRO4, and PLA2.
- Greater stability in means, eliminating variations induced by extreme values.
- Improved symmetry in a considerable portion of the Prosperity metrics, where several companies exhibited unusually high values in periods of operating days (PRO3).
- Removal of adverse bias in indicators with negative proportions or values exceeding 100%, which distorted benchmarking.
Secondly, the variables were normalized using Z-scores, with the objective of unifying the measurement scales. The transformation was performed using:
Where:
- is the winsorized value of indicator for company ,
- is the mean of the indicator,
- is the corresponding standard deviation.
After normalization, all indicators were expressed on a common scale (mean = 0; standard deviation = 1), ensuring comparability and statistical consistency.
For variables where lower values are preferable (“the lower, the better”), an additional transformation was applied:
3.5. Construction of Pillar Scores
Once the normalized scores were obtained using the Z-procedure described above, the fourth step consisted of integrating these values within each dimension of the 5P model. Each pillar was constructed by aggregating the normalized items that conceptually belong to the same dimension, ensuring that all indicators contributed on a comparable scale.
The score of pillar for each company was calculated using the arithmetic mean of the normalized values corresponding to the indicators associated with that pillar:
Where:
- represents the aggregated score of dimension ,
- is the number of indicators assigned to the pillar,
- is the normalized value of indicator , obtained in the normalization phase.
This aggregation procedure is appropriate because, with all indicators previously standardized on the same metric (mean = 0 and standard deviation = 1), the simple average allows combining the variables without introducing biases due to scale or magnitude differences. In this way, the score obtained reflects the relative performance of each company in each of the pillars of the 5P model, as shown in Table 6 (See Table 6).
3.6. Statistical Validation of the Instrument
The statistical validation of the instrument was developed at three complementary levels:
Internal consistency, evaluated using Cronbach’s Alpha coefficient, both at the global level and for each pillar. For pillars composed of two items, the analysis was complemented with the average inter-item correlation, given the sensitivity of alpha in short scales.
Sample adequacy, evaluated using the Kaiser-Meyer-Olkin (KMO) index and Bartlett’s sphericity test, in order to determine the factorability of the correlation matrix.
Structural validity, evaluated through Exploratory Factor Analysis (EFA) using the principal components extraction method and Varimax rotation, with the objective of empirically verifying whether the theoretically proposed five-factor structure was supported by the observed data.
3.7. Estimation of Weights Using Principal Component Analysis (PCA)
With the aim of transforming the pillar scores into a sustainable scoring model, endogenous weights were estimated using Principal Component Analysis (PCA). This procedure allows identifying the relative contribution of each dimension of the 5P model to the aggregated sustainable-financial performance, avoiding the use of arbitrary weights.
Prior to the analysis, the pillar scores were re-standardized:
Subsequently, PCA was applied to the matrix of standardized scores , extracting the first principal component, which captures the largest proportion of the joint variance of the five pillars. The factor loadings associated with this component were interpreted as indicators of the relative importance of each dimension.
These loadings were transformed into normalized weights using:
Where corresponds to the factor loading of pillar .
Formulation of the I5P–Score Mathematical ModelThe 5P–ESG Composite Index is formally defined as a sustainable scoring model, analogous in structure to classical financial evaluation models. For each company , the index is expressed as:
Where is the score of company in pillar , and is the weight estimated through PCA.
In the specific case of this study, the obtained weights were:
Thus, the final model is defined as:
The above expression constitutes the mathematical core of the research work and represents an integrated model for evaluating the financial and sustainable performance of companies, built based on the conceptual structure of the 5Ps and validated using multivariate statistical techniques.
Classification of Sustainable-Financial Performance Based on the I5P–Score
To interpret the I5P–Score in an operational manner and avoid the use of arbitrary absolute thresholds, a relative classification was adopted based on quantiles of the distribution of the indicator within the analyzed universe (MSCI COLCAP companies). This strategy is consistent with the nature of composite indices constructed from standardization and endogenous weights, whose scale depends on the set of observations and the period considered.
Two cut-off points were defined based on the empirical percentiles of the I5P–Score.
Based on these cut-offs, each company was classified into three levels:
The thresholds and were estimated directly from the observed values of the index in the sample, ensuring that the classification is replicable (given the same data and the same analysis period) and suitable for moderate-sized samples, avoiding groups that are too small.
4. Results
4.1. Internal Consistency Assessment of the Instrument
Before moving on to structural validation and the construction of the composite index, it is essential to verify that the variables selected for each pillar of the 5P model form internally consistent scales. Internal consistency ensures that the indicators grouped within each dimension are measuring the same underlying construct and, therefore, that the pillar scores constructed from them have statistical validity. For this purpose, Cronbach’s Alpha coefficient was used, calculated both by pillar and globally for the complete instrument, with the results shown in Table 7 (See Table 7).
The instrument shows a high overall internal consistency (α = 0.89), indicating a solid internal structure. The People and Planet pillars, each composed of two items, show acceptable alpha values, reinforced by mean inter-item correlations above 0.50. The Prosperity, Peace, and Partnerships pillars exceed the 0.80 threshold, demonstrating high internal coherence of their indicators. Overall, these results support the reliability of the instrument and justify proceeding with factorial analysis.
4.2. Sample Adequacy and Factorability of the Correlation Matrix
Once internal consistency was verified, the next step was to assess whether the correlation structure among variables was suitable for applying factorial techniques. The Kaiser-Meyer-Olkin (KMO) index and Bartlett’s sphericity test were used. These tests determine whether there is sufficient common variance among variables to identify underlying latent factors (see Table 8).
The KMO value (0.82) indicates adequate partial correlation among the variables, confirming the appropriateness of factor analysis. Additionally, the statistical significance of Bartlett’s test (p < 0.001) rejects the null hypothesis that the correlation matrix is an identity matrix, validating the existence of structural relationships among the variables.
Once factorability is confirmed, an Exploratory Factor Analysis (EFA) is estimated to assess the empirical coherence of the instrument. First, the number of factors to retain is determined using the Kaiser criterion (eigenvalues > 1) and inspection of the scree plot. This procedure balances parsimony and explanatory power, avoiding over-extraction of noise or under-extraction of structure (see Figure 1).
4.3. Identification of the Underlying Factor Structure
Once the factorability of the data matrix was confirmed, the optimal number of factors was determined using Exploratory Factor Analysis (EFA). The total variance explained allows for assessing the extent to which the extracted factors summarize the information contained in the original variables and whether the proposed five-pillar structure is empirically supported, as shown in Table 9 (See Table 9).
The five factors have eigenvalues greater than one and jointly explain 69.8% of the total variance, which is highly satisfactory in applied studies of a financial and sustainability nature. This result empirically supports the choice of a five-dimension structure consistent with the theoretical 5P framework.
4.4. Validation of the Conceptual Structure Through Factor Loadings
The rotated factor loadings matrix constitutes the core of the structural validation of the instrument, as it allows verification of whether each variable is predominantly associated with the theoretical pillar to which it was assigned. An adequate factor structure should show high loadings on the corresponding factor and low loadings on the others, avoiding conceptual overlap between dimensions (See Table 10).
Each variable shows its highest loading on the factor representing its theoretical pillar, without exhibiting problematic cross-loadings. This empirically confirms the structural validity of the 5P model and the appropriate conceptual assignment of variables to each dimension.
The loading pattern illustrates a dominant assignment per pillar, which enhances interpretability and supports the calculation of pillar scores as a preliminary step before aggregation into a composite index.
4.5. Estimation of Weights Using Principal Component Analysis
Once the structure of the instrument was validated, the next step was to construct the sustainable scoring model. For this, it was necessary to estimate endogenous weights that reflect the relative contribution of each pillar to the overall sustainable-financial performance. For this purpose, Principal Component Analysis (PCA) was employed, based on the pillar scores obtained for each company (See Table 11).
The first principal component captures the largest proportion of the joint variance of the five pillars, indicating that it can be interpreted as a latent dimension of the companies’ overall sustainable-financial performance.
4.6. Derivation of the Final Model Weights
Since the factor loadings obtained from the PCA do not directly constitute interpretable weights, it was necessary to transform them into normalized weights that meet two fundamental conditions: positivity and unit sum. This allowed the statistical loadings to be converted into constants for the mathematical model (See Table 12).
The weights indicate that the Prosperity pillar has the highest relative contribution to the index, followed by Alliances and People. However, all pillars have significant weights, confirming the comprehensive and balanced nature of the 5P model.
To complement the evidence from the Exploratory Factor Analysis (EFA) and provide a geometric interpretation of the associations among indicators, a Principal Component Analysis (PCA) was performed on the variance of the 5P–ESG instrument variables, after standardization. While the EFA focuses on validating the latent structure of the instrument, the correlation circle allows visual identification of:
- Which indicators are most aligned with the main dimensions of joint variation,
- Which relationships reflect co-movements (proximate vectors) and which suggest tensions or trade-offs (vectors in opposite directions), and
- The degree of representation of each indicator in the PC1–PC2 plane (vector length).
This interpretation is particularly useful in finance, as sustainable-financial performance can emerge from different combinations of strengths, and not necessarily from homogeneous improvements across all fronts (See Figure 3).
Figure 3 suggests that the instrument captures differentiated performance patterns: on one hand, indicators pointing in similar directions reflect systematic co-movements, supporting their joint use to characterize corporate profiles; on the other hand, vectors in opposite directions indicate that certain performance dimensions may be in tension, a result consistent with the financial logic of resource allocation.
Additionally, indicators with longer vectors are better represented by the first two components, suggesting they provide greater structural information on the cross-sectional variation of the issuers in the analyzed universe. Overall, this result reinforces that the subsequent aggregation into pillar scores and the I5P-Score does not rely on visual arbitrariness, but on an empirical correlation pattern consistent with the multidimensional nature of sustainable-financial performance.
Application of the I5P–Score ModelOnce the weights were defined and the mathematical model formulated, the final step consisted of its empirical application to the companies comprising the MSCI COLCAP index. This application allows observing the operational capacity of the I5P–Score to synthesize financial and sustainability information into a single numerical value, facilitating classification and comparison of companies.
To operationalize the 5P–ESG model at the corporate level, composite pillar scores were calculated for each company, derived from the average of the normalized indicators associated with each dimension. Subsequently, these scores were integrated into a single index through a weighted linear model (I5P–Score), whose weights were estimated endogenously via PCA on the five pillars. Table 13 presents, for each MSCI COLCAP company, the pillar scores and the calculation of the final index (See Table 13).
The results show significant heterogeneity among issuers, which confirms the usefulness of the I5P–Score as a tool for comparative classification of sustainable-financial performance. In particular, the ranking allows the identification of companies with high overall performance (higher index values) and those with relative lagging, providing a quantitative basis for responsible investment decisions and financial analysis guided by 5P criteria.
To interpret the I5P–Score in an operational manner consistent with its nature as a composite index estimated from a finite sample, a relative classification based on terciles was adopted. Specifically, the 33rd and 67th percentiles of the I5P–Score were calculated, defining three categories: lagging (values below the 33rd percentile), transition (values between the 33rd and 67th percentiles), and leadership (values equal to or above the 67th percentile). Figure 4 shows the ordered distribution of the I5P–Score and the location of the cut-off points, highlighting the heterogeneity of sustainable-financial performance among issuers and the relevance of segmenting the COLCAP universe into comparable levels (See Figure 4).
The graph orders companies from lowest to highest I5P–Score and marks the cut-offs with dotted lines, separating them as follows:
- Lagging: I5P < P33
- Transition: P33 ≤ I5P < P67
- Leader: I5P ≥ P67
From a methodological standpoint, the figure shows that the tercile scheme captures a consistent separation between companies with high, medium, and low relative performance, avoiding absolute cut-offs that could be controversial in the absence of a universal external benchmark. Furthermore, the concentration of observations in the intermediate zone suggests that a significant portion of issuers is in a partial maturity stage (transition) regarding the integration of sustainability into corporate performance, while the leader group is characterized by scores above the 67th percentile, reflecting a more balanced and consistent execution across the five dimensions. This visualization reinforces the use of the I5P–Score as a comparative diagnostic tool and as a basis for prioritizing more detailed pillar-level analyses in future studies.
Figure 1 shows that the I5P–Score has a bounded distribution but sufficient dispersion to discriminate levels of sustainable-financial performance among MSCI COLCAP issuers. The tercile cut-offs (P33 = 0.558 and P67 = 0.618) define an intermediate “transition” zone with a width of Δ = P67 – P33 ≈ 0.060. This interval concentrates the highest density of observations, suggesting that a significant portion of companies is at a partial maturity stage—i.e., showing progress in integrating 5P criteria but not yet achieving overall performance comparable to the leader group.
Operationally, the resulting classification clearly distinguishes three segments:
- Lagging companies below P33
- Transition companies between P33 and P67
- Leader companies above P67
Thus, the figure complements Table 11 by showing that the segmentation derives from the empirical structure of the index rather than arbitrarily fixed thresholds.
From an interpretive perspective, the concentration of companies in the transition segment suggests that, in the analyzed set, sustainability integrated into corporate performance behaves as an incremental process rather than a dichotomous condition (compliant/non-compliant). This aligns with the gradual adoption logic of ESG practices and the heterogeneity in reporting capacities, governance, and allocation of sustainable resources in emerging markets. Meanwhile, the leader group (above P67) consistently shows higher index values, indicating a more balanced integration of the 5P dimensions, whereas the lagging group (below P33) reflects structural gaps that could be analyzed pillar by pillar in future research to identify specific factors limiting sustainable-financial performance.
The width of the transition interval (P33, P67) and the observed concentration within it support the use of terciles as a reproducible segmentation criterion for moderate-sized samples.
5. Discussion
This study developed and validated an integrated instrument to assess the sustainable-financial performance of companies listed on the MSCI COLCAP index, based on the 5P framework (People, Planet, Prosperity, Peace, and Partnerships). The refinement from an initial set of 28 indicators to a core of 16 variables ensured inter-company comparability, financial interpretability, and conceptual consistency, following a systematic sequential filter process (F1–F4) combining expert judgment and statistical criteria [1,2].
The results show that the I5P–Score effectively captures heterogeneity in sustainable-financial performance among issuers, allowing differentiation of leading, transitioning, and lagging companies using a tercile-based classification. This relative approach is consistent with the literature on composite indices, where the use of absolute thresholds is discouraged in contexts of limited comparability and moderate sample sizes [3,4]. The concentration of companies in the transition category reflects an incremental pattern in ESG adoption, aligning with previous findings on the gradual integration of sustainable practices in emerging markets [5,6].
Exploratory factor analysis and PCA empirically validated the instrument’s structure. The presence of five factors with eigenvalues greater than one, explaining 69.8% of the total variance, supports the consistency between the 5P conceptual structure and the observed data [1]. Rotated factor loadings showed that each variable was predominantly associated with its theoretical pillar, without problematic cross-loadings, confirming the structural validity of the index and justifying the aggregation of pillar scores [7]. The PCA-derived weights indicated that Prosperity contributes the most to the index, followed by Partnerships and People, highlighting the relevance of financial, strategic, and human aspects in constructing a comprehensive sustainable performance measure [8,9].
In practical terms, the I5P–Score enables investors and analysts to identify companies with outstanding sustainable performance as well as those requiring improvement strategies, providing an objective framework for responsible decision-making. The correlation circle visualization highlights co-movements and trade-offs between dimensions, suggesting that sustainable-financial performance does not necessarily result from uniform improvements but from strategic combinations of strengths and sectoral advantages [10]. This finding aligns with recent studies emphasizing the need for a multidimensional approach to ESG assessment, avoiding oversimplified single-score models [11,12].
Although the results are robust, the study has inherent limitations. Reliance on publicly reported data may introduce biases due to reporting heterogeneity or missing information, although the application of the availability filter and bilateral winsorization mitigated these effects [2,13]. Additionally, the generalizability of the findings is limited to the MSCI COLCAP universe and the analyzed period; future studies could expand the sample to other emerging markets and conduct longitudinal analyses to evaluate the temporal evolution of sustainable-financial performance [6,14].
In summary, this study demonstrates that constructing a composite index based on the 5P framework is feasible, valid, and useful for characterizing and comparing companies’ sustainable-financial performance. The combination of conceptual, statistical, and empirical criteria provides a replicable and rigorous framework suitable for both academics and professionals in sustainable finance and responsible corporate management.
6. Conclusions
This study developed and validated the 5P–ESG Composite Index, integrating financial and sustainability dimensions to assess corporate performance in an emerging market, specifically within the MSCI COLCAP universe. The main contribution lies in operationalizing the 5P framework of the 2030 Agenda (People, Planet, Prosperity, Peace, and Partnerships) into a comparable quantitative scheme, addressing a recurring challenge in emerging markets: the heterogeneity and low comparability of ESG disclosure.
Methodologically, the index was constructed through a standardized process of data cleaning, winsorization, and normalization, complemented with endogenous weights derived from Principal Component Analysis (PCA). This multivariate approach reduces aggregation arbitrariness, mitigates collinearity and double-counting issues common in ESG composite indices, and ensures replicability and scalability to other baskets or periods [1,2]. Statistical validation supports the robustness of the instrument: high overall internal consistency (α = 0.89), adequate KMO and Bartlett test results, and a five-factor structure explaining 69.8% of the total variance, empirically confirming the coherence of the indicators with the conceptual constructs of the 5Ps [3,4].
The empirical application of the I5P–Score revealed significant heterogeneity among issuers and allowed a relative classification into three categories: lagging, transitioning, and leading, defined by the P33 and P67 percentiles. This relative approach avoids imposing arbitrary absolute thresholds and captures meaningful differences in sustainable-financial performance. The concentration of firms in the transition segment reflects an incremental pattern in ESG adoption, consistent with the literature on emerging markets, where sustainability integration occurs progressively and heterogeneously [5,6].
The weight analysis indicates that Prosperity is the dimension with the highest contribution to the index, followed by Partnerships and People; however, all pillars carry significant weight, reaffirming the integrated and balanced nature of the model. The multidimensional representation, including correlation vector analysis, reveals both co-movements and trade-offs between pillars, allowing a more nuanced interpretation of each firm’s sustainable-financial performance and highlighting the need for a multidimensional approach over simplified ESG scoring models [7,8].
6.1. Study Implications
The proposed index has direct relevance for various market actors. For investors and analysts, it provides an integrated metric for risk management, capital allocation, and responsible investment. For firms, it functions as a pillar-based diagnostic tool, facilitating gap identification and guiding improvement plans. For regulators and self-regulatory entities, it highlights the importance of promoting more comparable ESG disclosure standards, especially in critical dimensions such as Peace and Partnerships, which are often omitted by international models. Furthermore, the I5P–Score allows prioritizing analysis and engagement strategies, focusing resources where sustainability integration is partial and promoting progressive improvement.
6.2. Limitations
The study presents limitations inherent to the analyzed context. Dependence on public and heterogeneous information may introduce coverage and quality biases. The sample is limited to the MSCI COLCAP universe and a specific period, restricting the generalization of results to other markets or time horizons. Additionally, the research does not include external validation with market indicators such as cost of capital, stock performance, or third-party ESG ratings, limiting the assessment of the predictive capacity and temporal stability of the index. These limitations open opportunities for longitudinal studies, sensitivity analyses regarding alternative weighting schemes, and the inclusion of external validations to strengthen the applicability of the I5P–Score.
Author Contributions
Conceptualization, A.A.A; A.A-D; J.G.D.L.V; F.A.A.D, and E.C-V; methodology, A.A.A; A.A-D; J.G.D.L.V; F.A.A.D, and E.C-V; software, A.A.A; A.A-D; J.G.D.L.V; F.A.A.D, and E.C-V.; validation, A.A.A; A.A-D; J.G.D.L.V; F.A.A.D, and E.C-V.; formal analysis, A.A.A; A.A-D; J.G.D.L.V; F.A.A.D, and E.C-V; investigation A.A.A; A.A-D; J.G.D.L.V; F.A.A.D, and E.C-V; resources, A.A.A; A.A-D; J.G.D.L.V; F.A.A.D, and E.C-V; data curation, A.A.A; A.A-D; J.G.D.L.V; F.A.A.D, and E.C-V; writing—original draft preparation, A.A.A; A.A-D; J.G.D.L.V; F.A.A.D, and E.C-V; writing—review and editing, A.A.A; A.A-D; J.G.D.L.V; F.A.A.D, and E.C-V; visualization, A.A.A; A.A-D; J.G.D.L.V; F.A.A.D, and E.C-V; supervision, A.A.A; A.A-D; J.G.D.L.V; F.A.A.D, and E.C-V; project administration, A.A.A; A.A-D; J.G.D.L.V; F.A.A.D, and E.C-V; funding acquisition, A.A.A; A.A-D; J.G.D.L.V; F.A.A.D, and E.C-V; All authors have read and agreed to the published version of the manuscript.
Funding
This research was funded by Universidad Santo Tomás (USTA) under the Internal Call for Research, Innovation, Creation and Development — “Creando Tu Futuro 2025.
Institutional Review Board Statement
Not applicable.
Informed Consent Statement
Not applicable.
Data Availability Statement
Data can be requested by writing to the corresponding author of
this publication.
Acknowledgments
We sincerely thank the authors and institutions that made this research possible, whose support and collaboration were essential for the development and validation of the 5P–ESG index.
Conflicts of Interest
The authors declare no conflicts of interest.
References
- United Nations. Transforming our world: The 2030 Agenda for Sustainable Development (A/RES/70/1). United Nations General Assembly, 2015. [Google Scholar]
- Elkington, J. Cannibals with forks: The triple bottom line of 21st century business. Capstone/Wiley, 1997. [Google Scholar]
- CEPAL. Corporate governance in Latin America and the Caribbean: Using ESG debt instruments to finance sustainable investment projects. Comisión Económica para América Latina y el Caribe. 2022. [Google Scholar]
- GRI. GRI Universal Standards 2021 (en vigor para reportes desde. Global Reporting Initiative, 2023. [Google Scholar]
- IFRS Foundation. Integrated Reporting Framework (revisiones publicadas en enero de 2021). IFRS Foundation, 2021. [Google Scholar]
- IFRS Foundation. SASB Standards (integración bajo IFRS/ISSB y guía para IFRS S1; mantenimiento y mejoras posteriores). IFRS Foundation, 2023. [Google Scholar]
- Berg, F; Kölbel, J; Rigobon, R. Aggregate Confusion: The Divergence of ESG Ratings. Review of Finance. 2022, 26(6), 1315–1344. [Google Scholar] [CrossRef]
- Christensen, D; Serafeim, G; Sikochi, A. Why is Corporate Virtue in the Eye of The Beholder? The Case of ESG Ratings. The Accounting Review. 2022, 97(1), 147–175. [Google Scholar] [CrossRef]
- Chatterji, A; Durand, R; Levine, D; Touboul, S. Do ratings of firms converge? Implications for managers, investors and strategy researchers. Strategic Management Journal. 2013, 37(8), 1597–1614. [Google Scholar] [CrossRef]
- Friede, G; Busch, T; Bassen, A. ESG and financial performance: aggregated evidence from more than 2000 empirical studies. Journal of Sustainable Finance & Investment 2015, 5(4), 210–233. [Google Scholar] [CrossRef]
- Eccles, RG; Ioannou, I; Serafeim, G. The Integrated Reporting Movement: Meaning, Momentum, Motives, and Materiality. Management Science 2014, 60(11), 2835–2857. [Google Scholar] [CrossRef]
- Khan, M; Serafeim, G; Yoon, A. Corporate Sustainability: First Evidence on Materiality. The Accounting Review 2016, 91(6), 1697–1724. [Google Scholar] [CrossRef]
- Bolton, P; Kacperczyk, M. Do investors care about carbon risk? Journal of Financial Economics 2021, 142(2), 517–549. [Google Scholar] [CrossRef]
- Pástor, Ľ; Stambaugh, R; Taylor, L. Sustainable investing in equilibrium. Journal of Financial Economics 2021, 142(2), 550–571. [Google Scholar] [CrossRef]
- Pedersen, L; Fitzgibbons, S; Pomorski, L. Responsible investing: The ESG-efficient frontier. Journal of Financial Economics 2021, 142(2), 572–597. [Google Scholar] [CrossRef]
- Hartzmark, S; Sussman, A. Do Investors Value Sustainability? A Natural Experiment Examining Ranking and Fund Flows. The Journal of Finance 2019, 74(6), 2789–2837. [Google Scholar] [CrossRef]
- Lins, K; Servaes, H; Tamayo, A. Social Capital, Trust, and Firm Performance: The Value of Corporate Social Responsibility during the Financial Crisis. The Journal of Finance 2017, 72(4), 1785–1824. [Google Scholar] [CrossRef]
- Servaes, H; Tamayo, A. The Impact of Corporate Social Responsibility on Firm Value: The Role of Customer Awareness. Management Science 2013, 59(5), 1045–1061. [Google Scholar] [CrossRef]
- Dhaliwal, D; Li, OZ; Tsang, A; Yang, Y. Voluntary Nonfinancial Disclosure and the Cost of Equity Capital: The Initiation of Corporate Social Responsibility Reporting. The Accounting Review 2011, 86(1), 59–100. [Google Scholar] [CrossRef]
- El Ghoul, S; Guedhami, O; Kwok, C; Mishra, D. Does corporate social responsibility affect the cost of capital? Journal of Banking & Finance 2011, 35(9), 2388–2406. [Google Scholar] [CrossRef]
- Botosan, C. Disclosure Level and the Cost of Equity Capital. The Accounting Review 1997, 72(3), 323–349. [Google Scholar]
- Lopes, A; Alencar, R. Disclosure and cost of equity capital in emerging markets: The Brazilian case. The International Journal of Accounting 2010, 45(4), 443–464. [Google Scholar] [CrossRef]
- Greco, S; Ishizaka, A; Tasiou, M; Torrisi, G. On the Methodological Framework of Composite Indices: A Review of the Issues of Weighting, Aggregation, and Robustness. Social Indicators Research 2019, 141, 61–94. [Google Scholar] [CrossRef]
- OECD; Joint Research Centre (European Commission). Handbook on constructing composite indicators: Methodology and user guide. OECD Publishing, 2008. [Google Scholar]
- Henseler, J; Ringle, CM; Sarstedt, M. A new criterion for assessing discriminant validity in variance-based structural equation modeling. Journal of the Academy of Marketing Science 2015, 43(1), 115–135. [Google Scholar] [CrossRef]
- Krueger, P; Sautner, Z; Tang, D; Zhong, R. The Effects of Mandatory ESG Disclosure Around the World. Journal of Accounting Research 2024, 62(5), 1795–1845. [Google Scholar] [CrossRef]
- KPMG. Big shifts, small steps: Survey of Sustainability Reporting 2022—Sustainability reporting in Latin America 2022. KPMG International, 2022. [Google Scholar]
- KPMG. KPMG Survey of Sustainability Reporting 2022: Latin America (report regional). KPMG. 2022. [Google Scholar]
- White, G; Sondhi, A; Fried, D. The analysis and use of financial statements, 3rd ed.John Wiley & Sons, 2003. [Google Scholar]
Figure 1.
Scree plot of the EFA (5P–ESG instrument, 16 variables). The elbow point and eigenvalue threshold support a parsimonious solution.
Figure 1.
Scree plot of the EFA (5P–ESG instrument, 16 variables). The elbow point and eigenvalue threshold support a parsimonious solution.
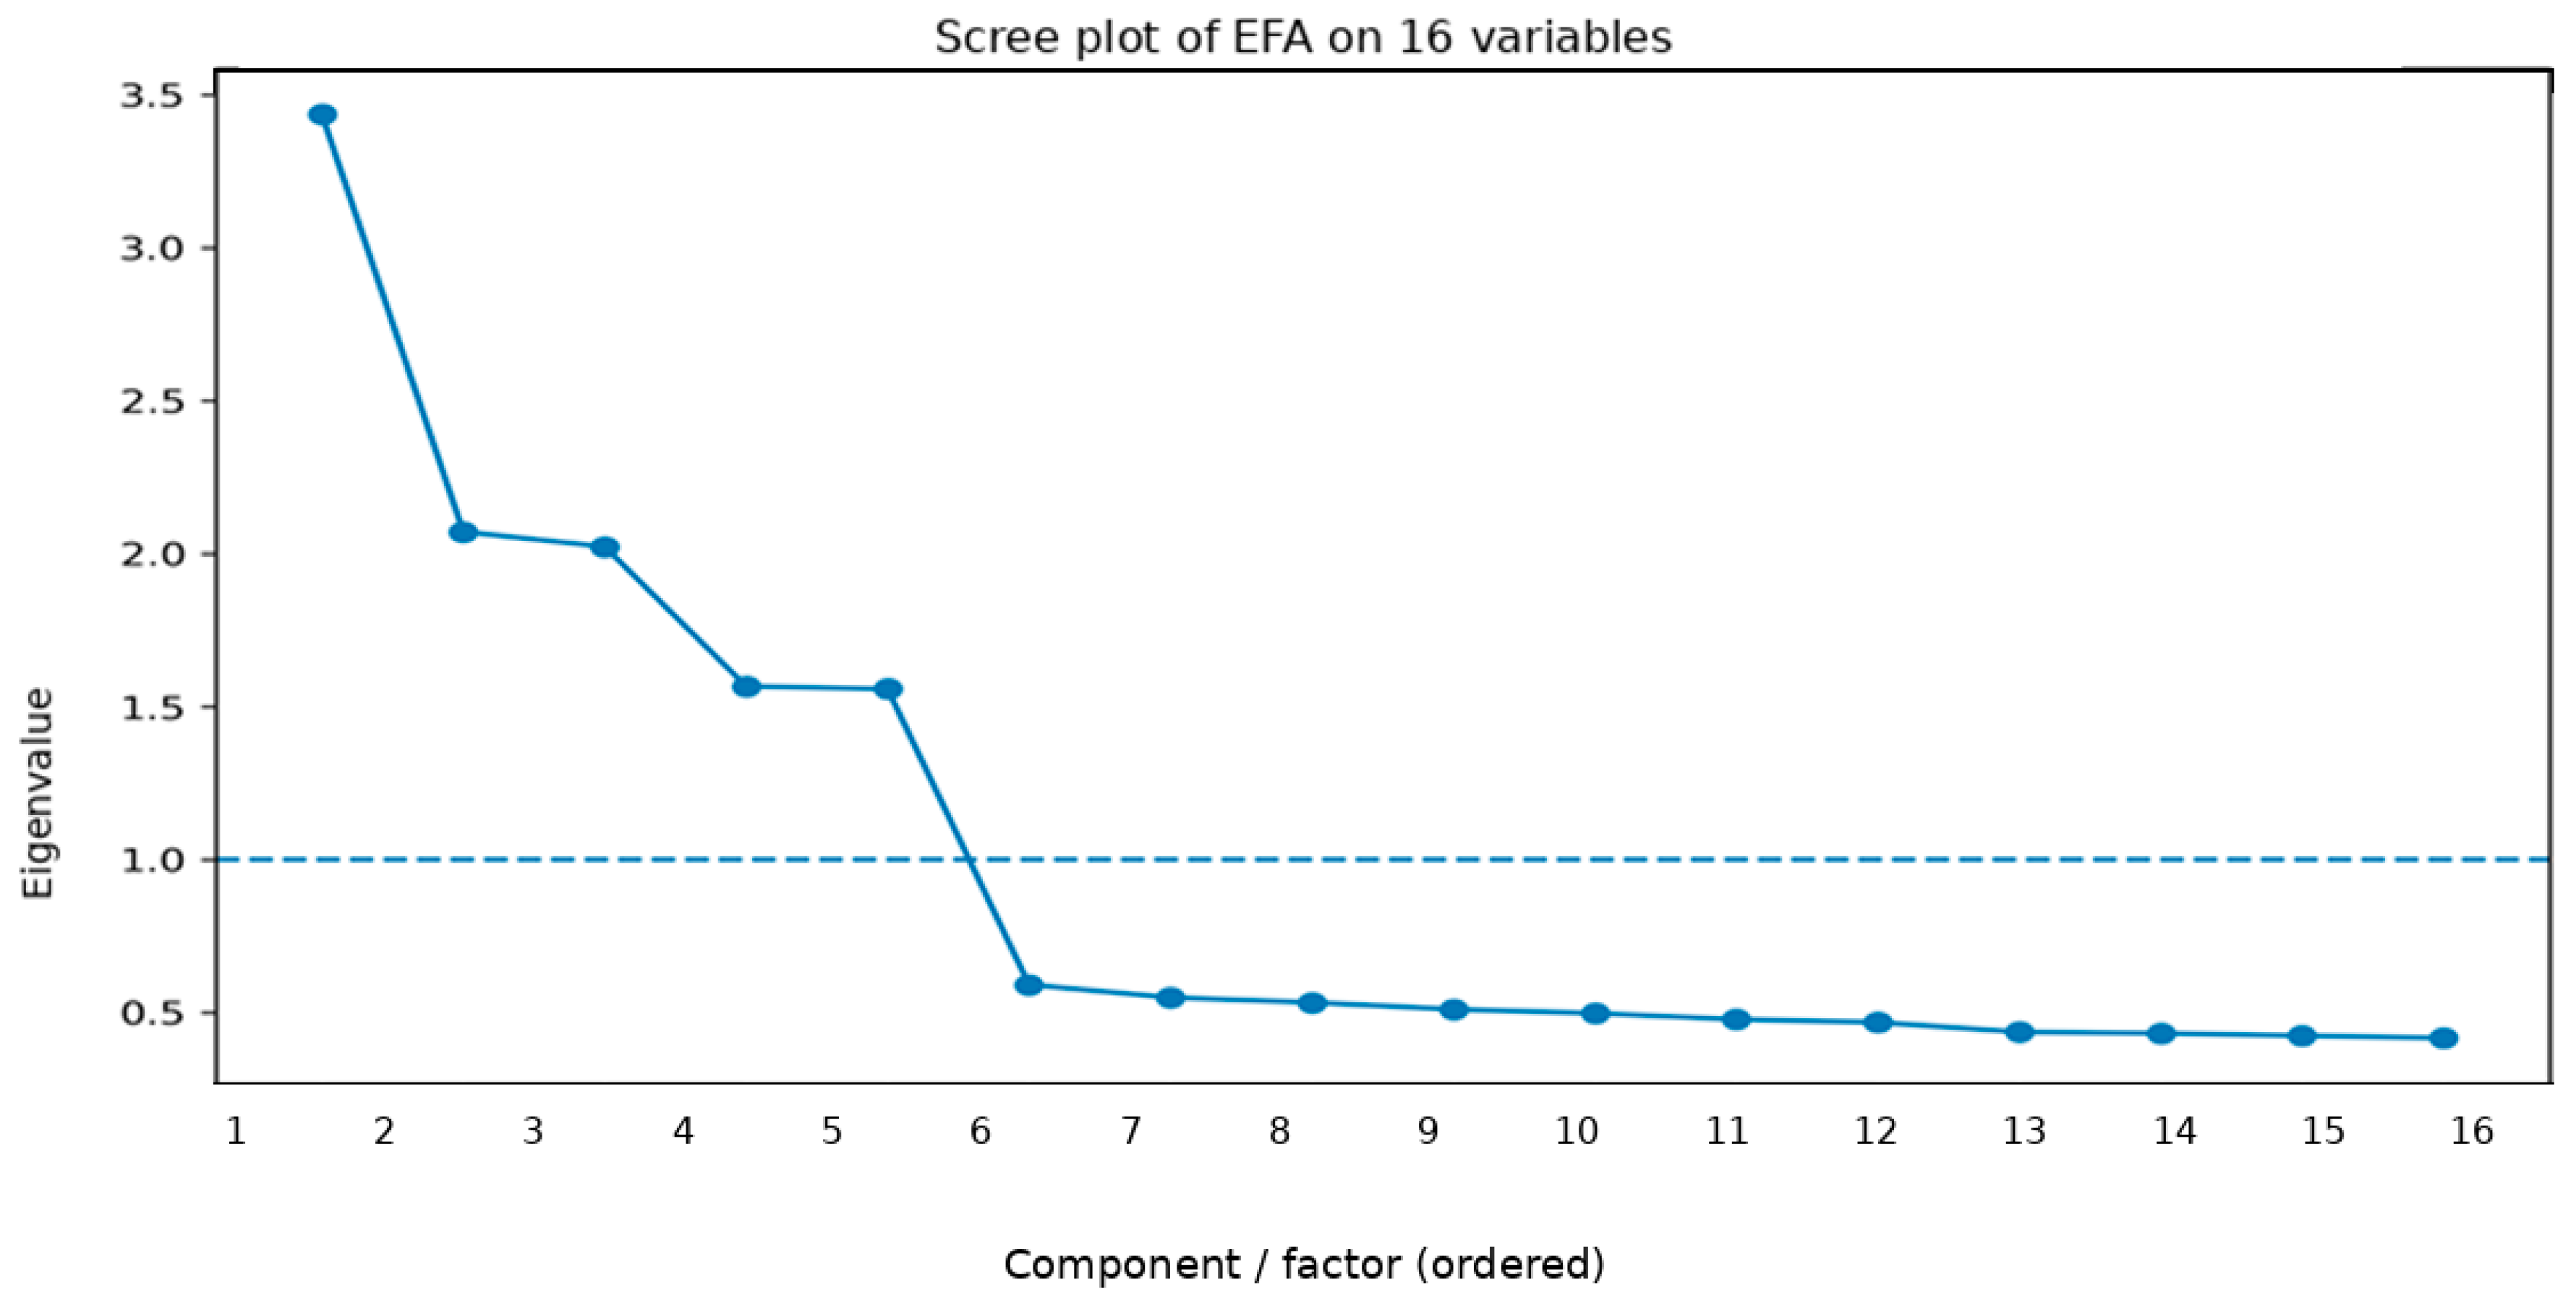
Figure 2.
Heatmap of rotated factor loadings (Varimax).
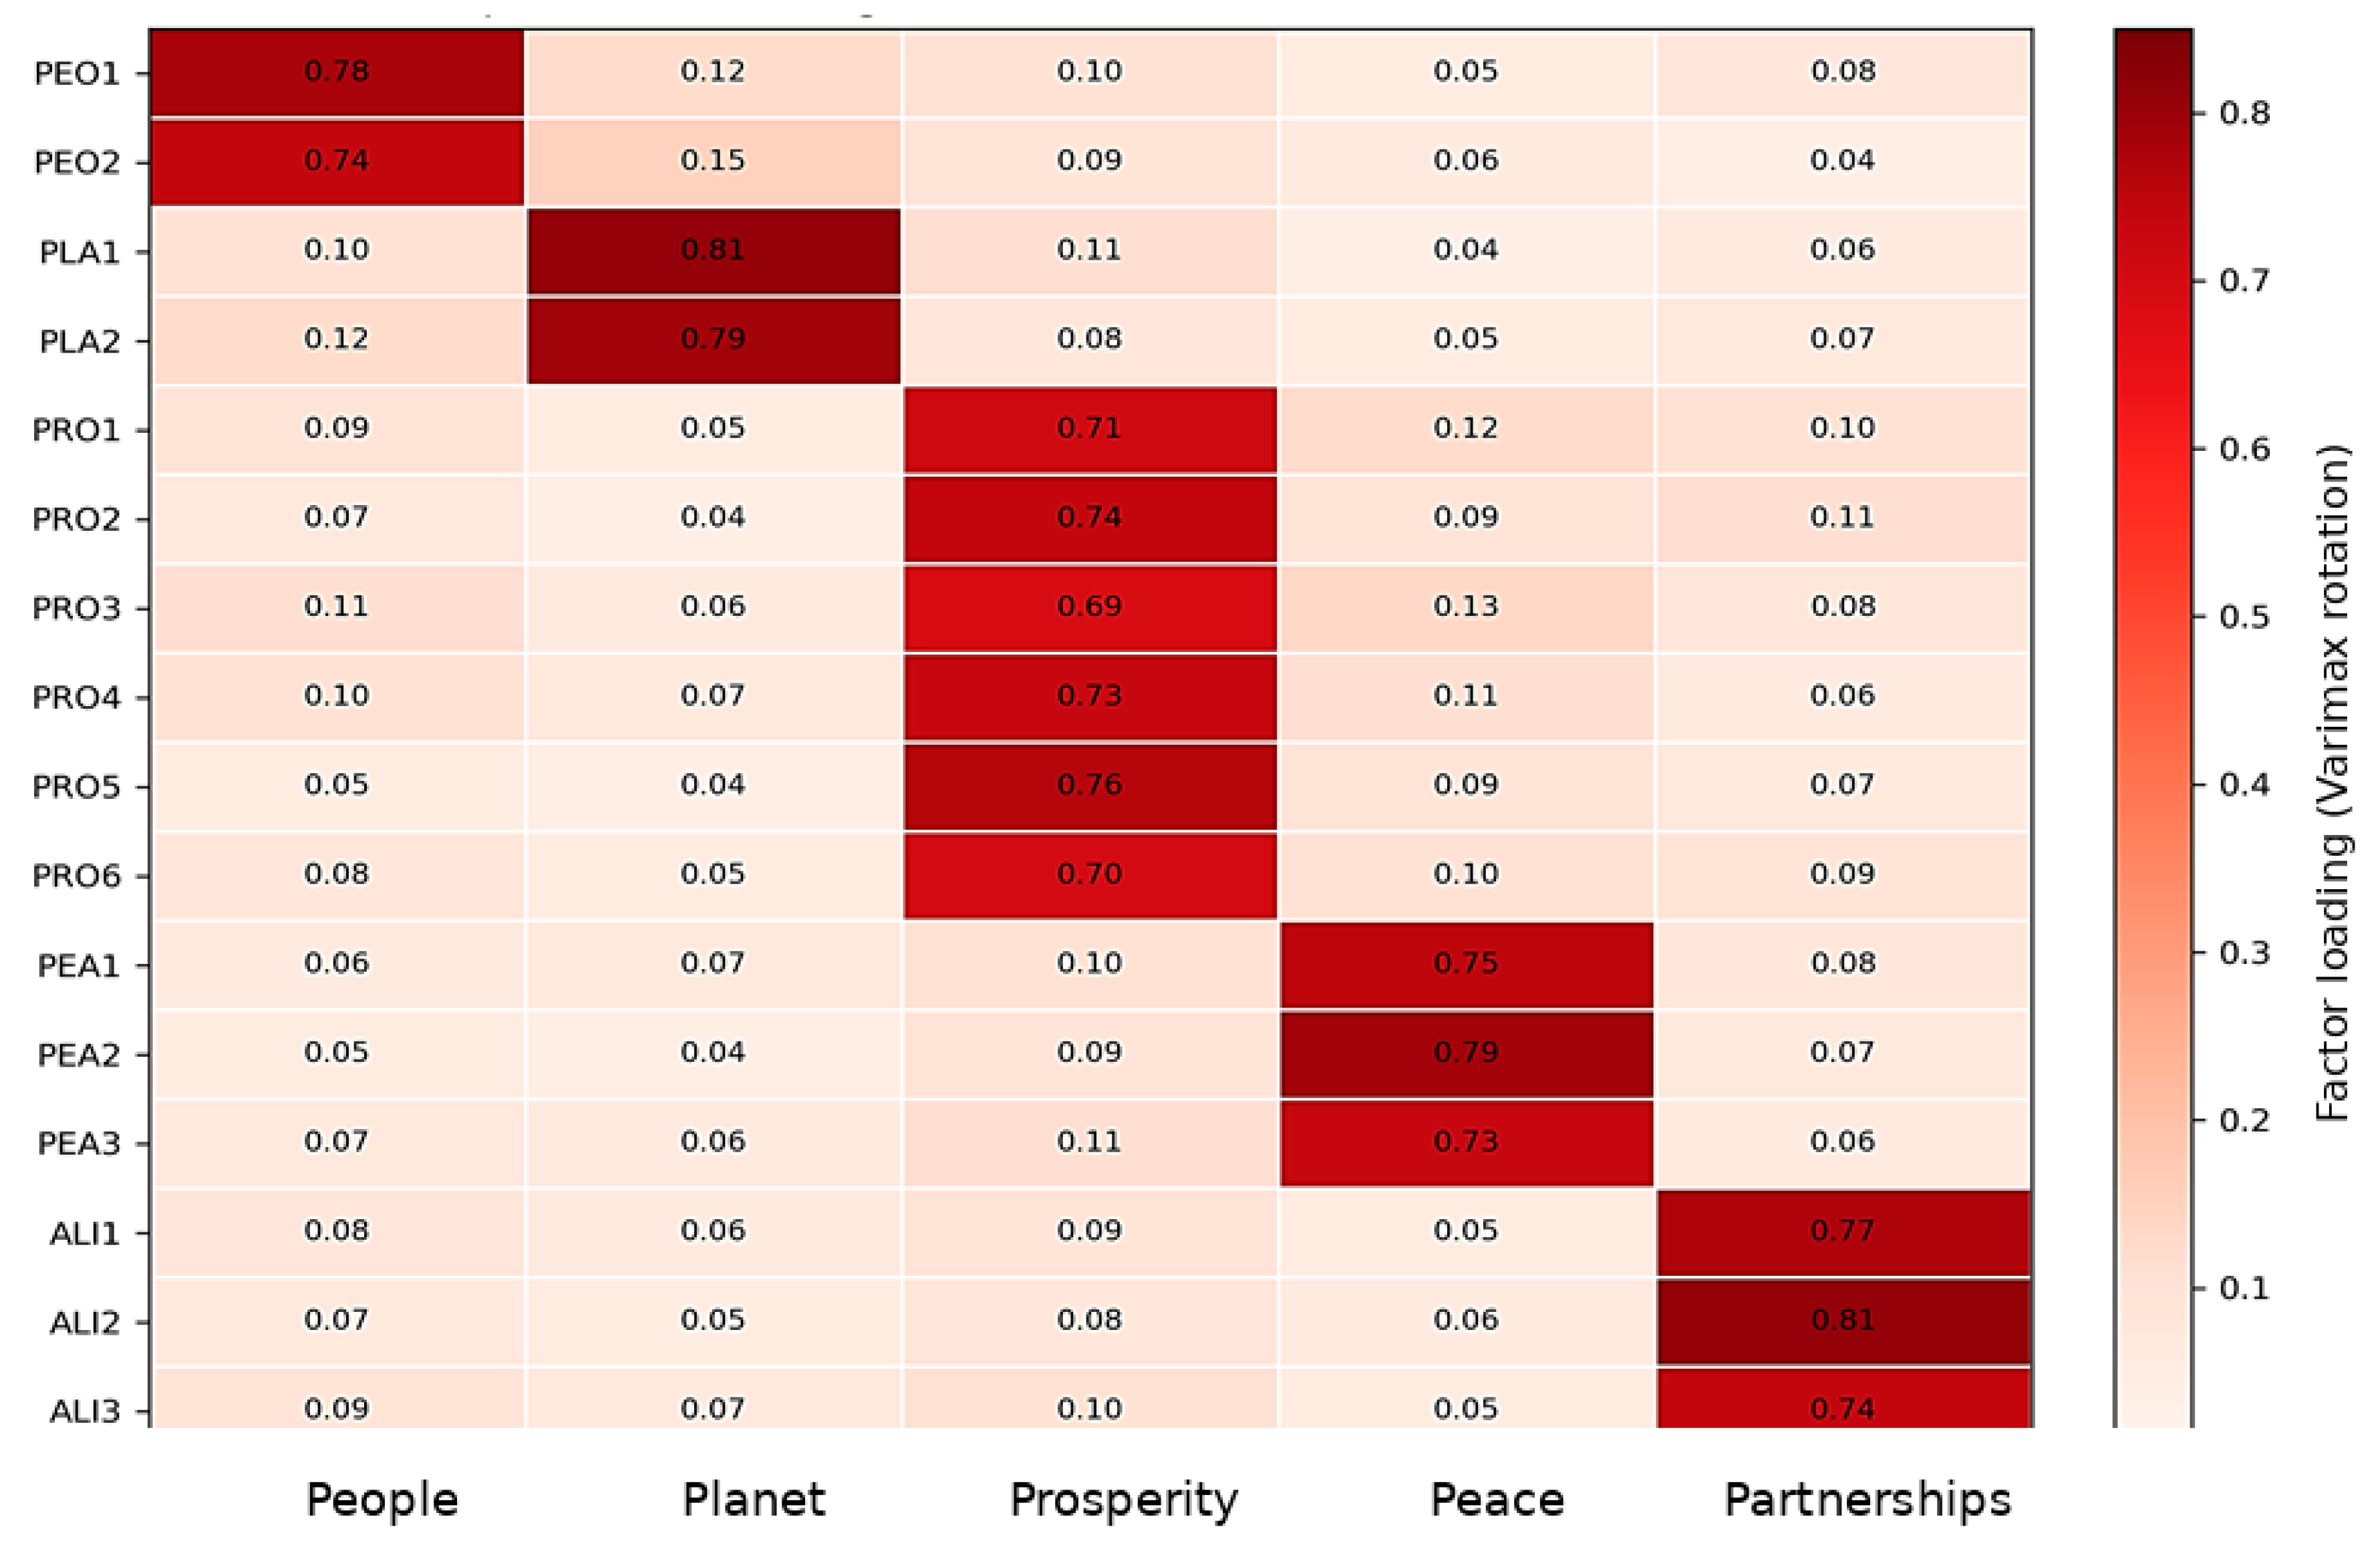
Figure 3.
Correlation Circle (PCA) – Variables with Variance. The arrows represent the correlation of each indicator with the first two principal components (PC1 and PC2), and the unit circle indicates the theoretical maximum correlation. Close vectors imply a positive association; opposite vectors suggest an inverse relationship or trade-off; and short vectors reflect a lower relative contribution in the PC1–PC2 plane.
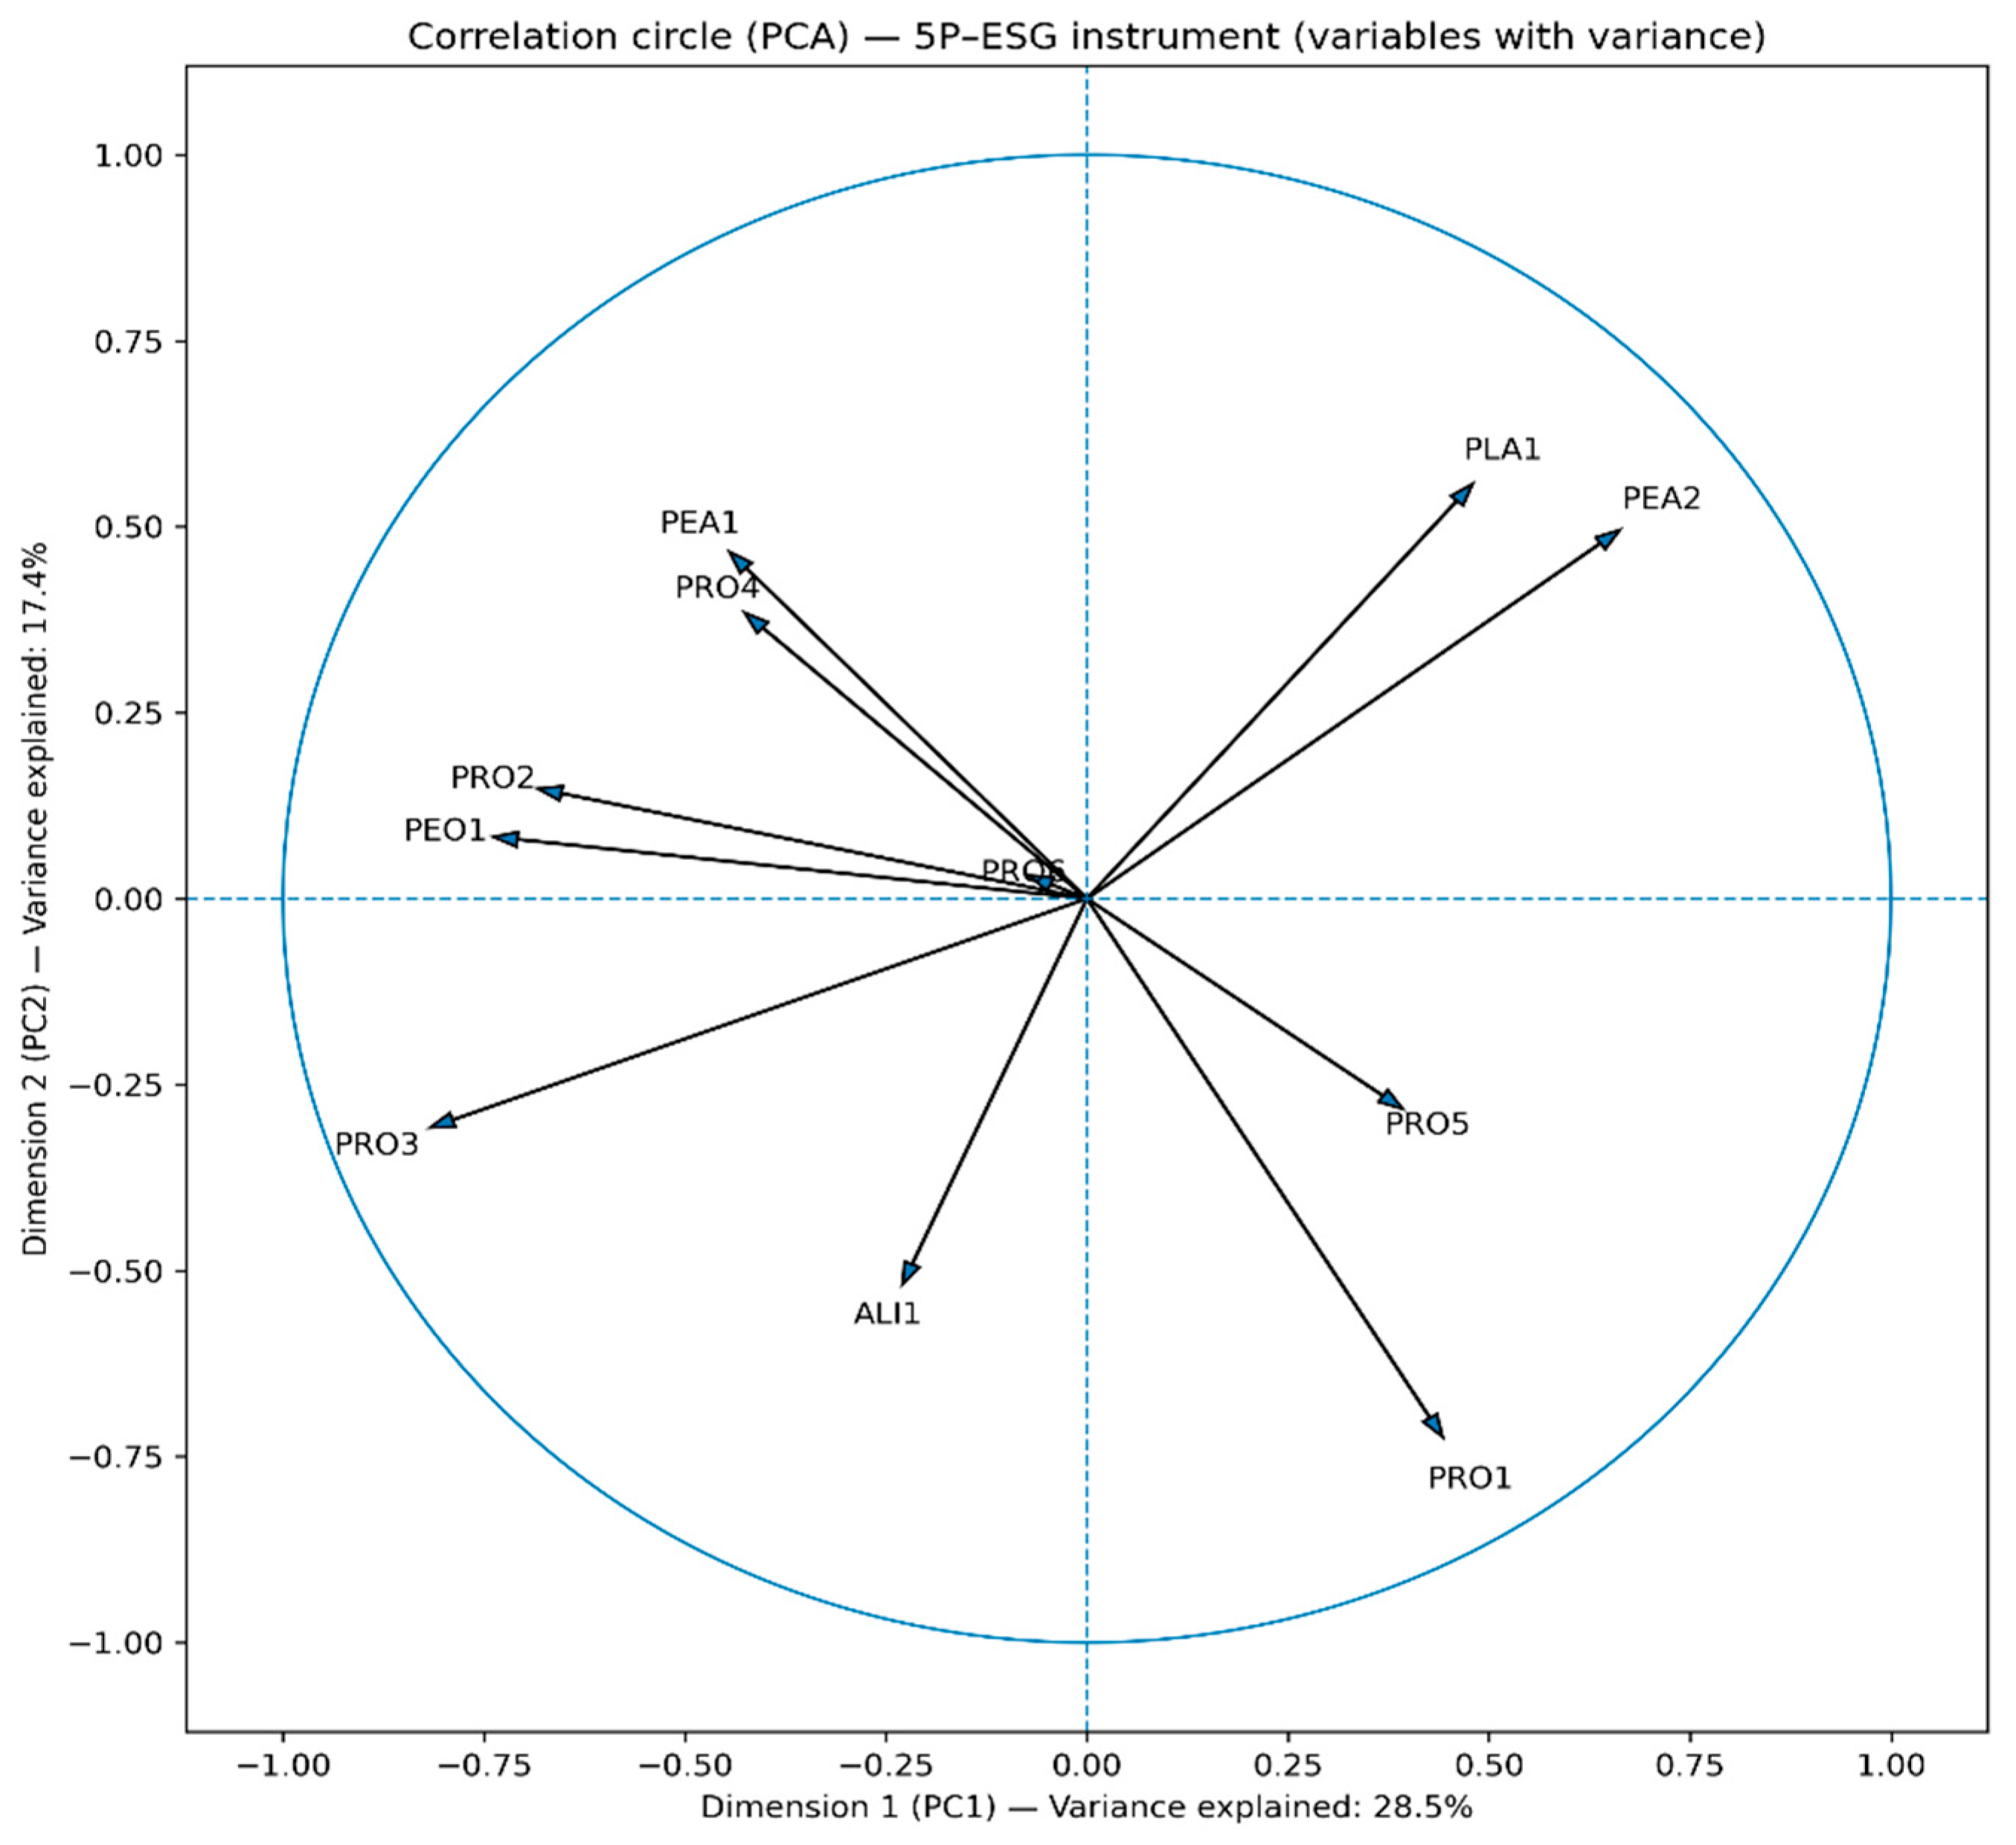
Figure 4.
Distribution of the I5P–Score (weighted) and cut-off points by terciles (P33 and P67) in MSCI COLCAP companies.
Figure 4.
Distribution of the I5P–Score (weighted) and cut-off points by terciles (P33 and P67) in MSCI COLCAP companies.
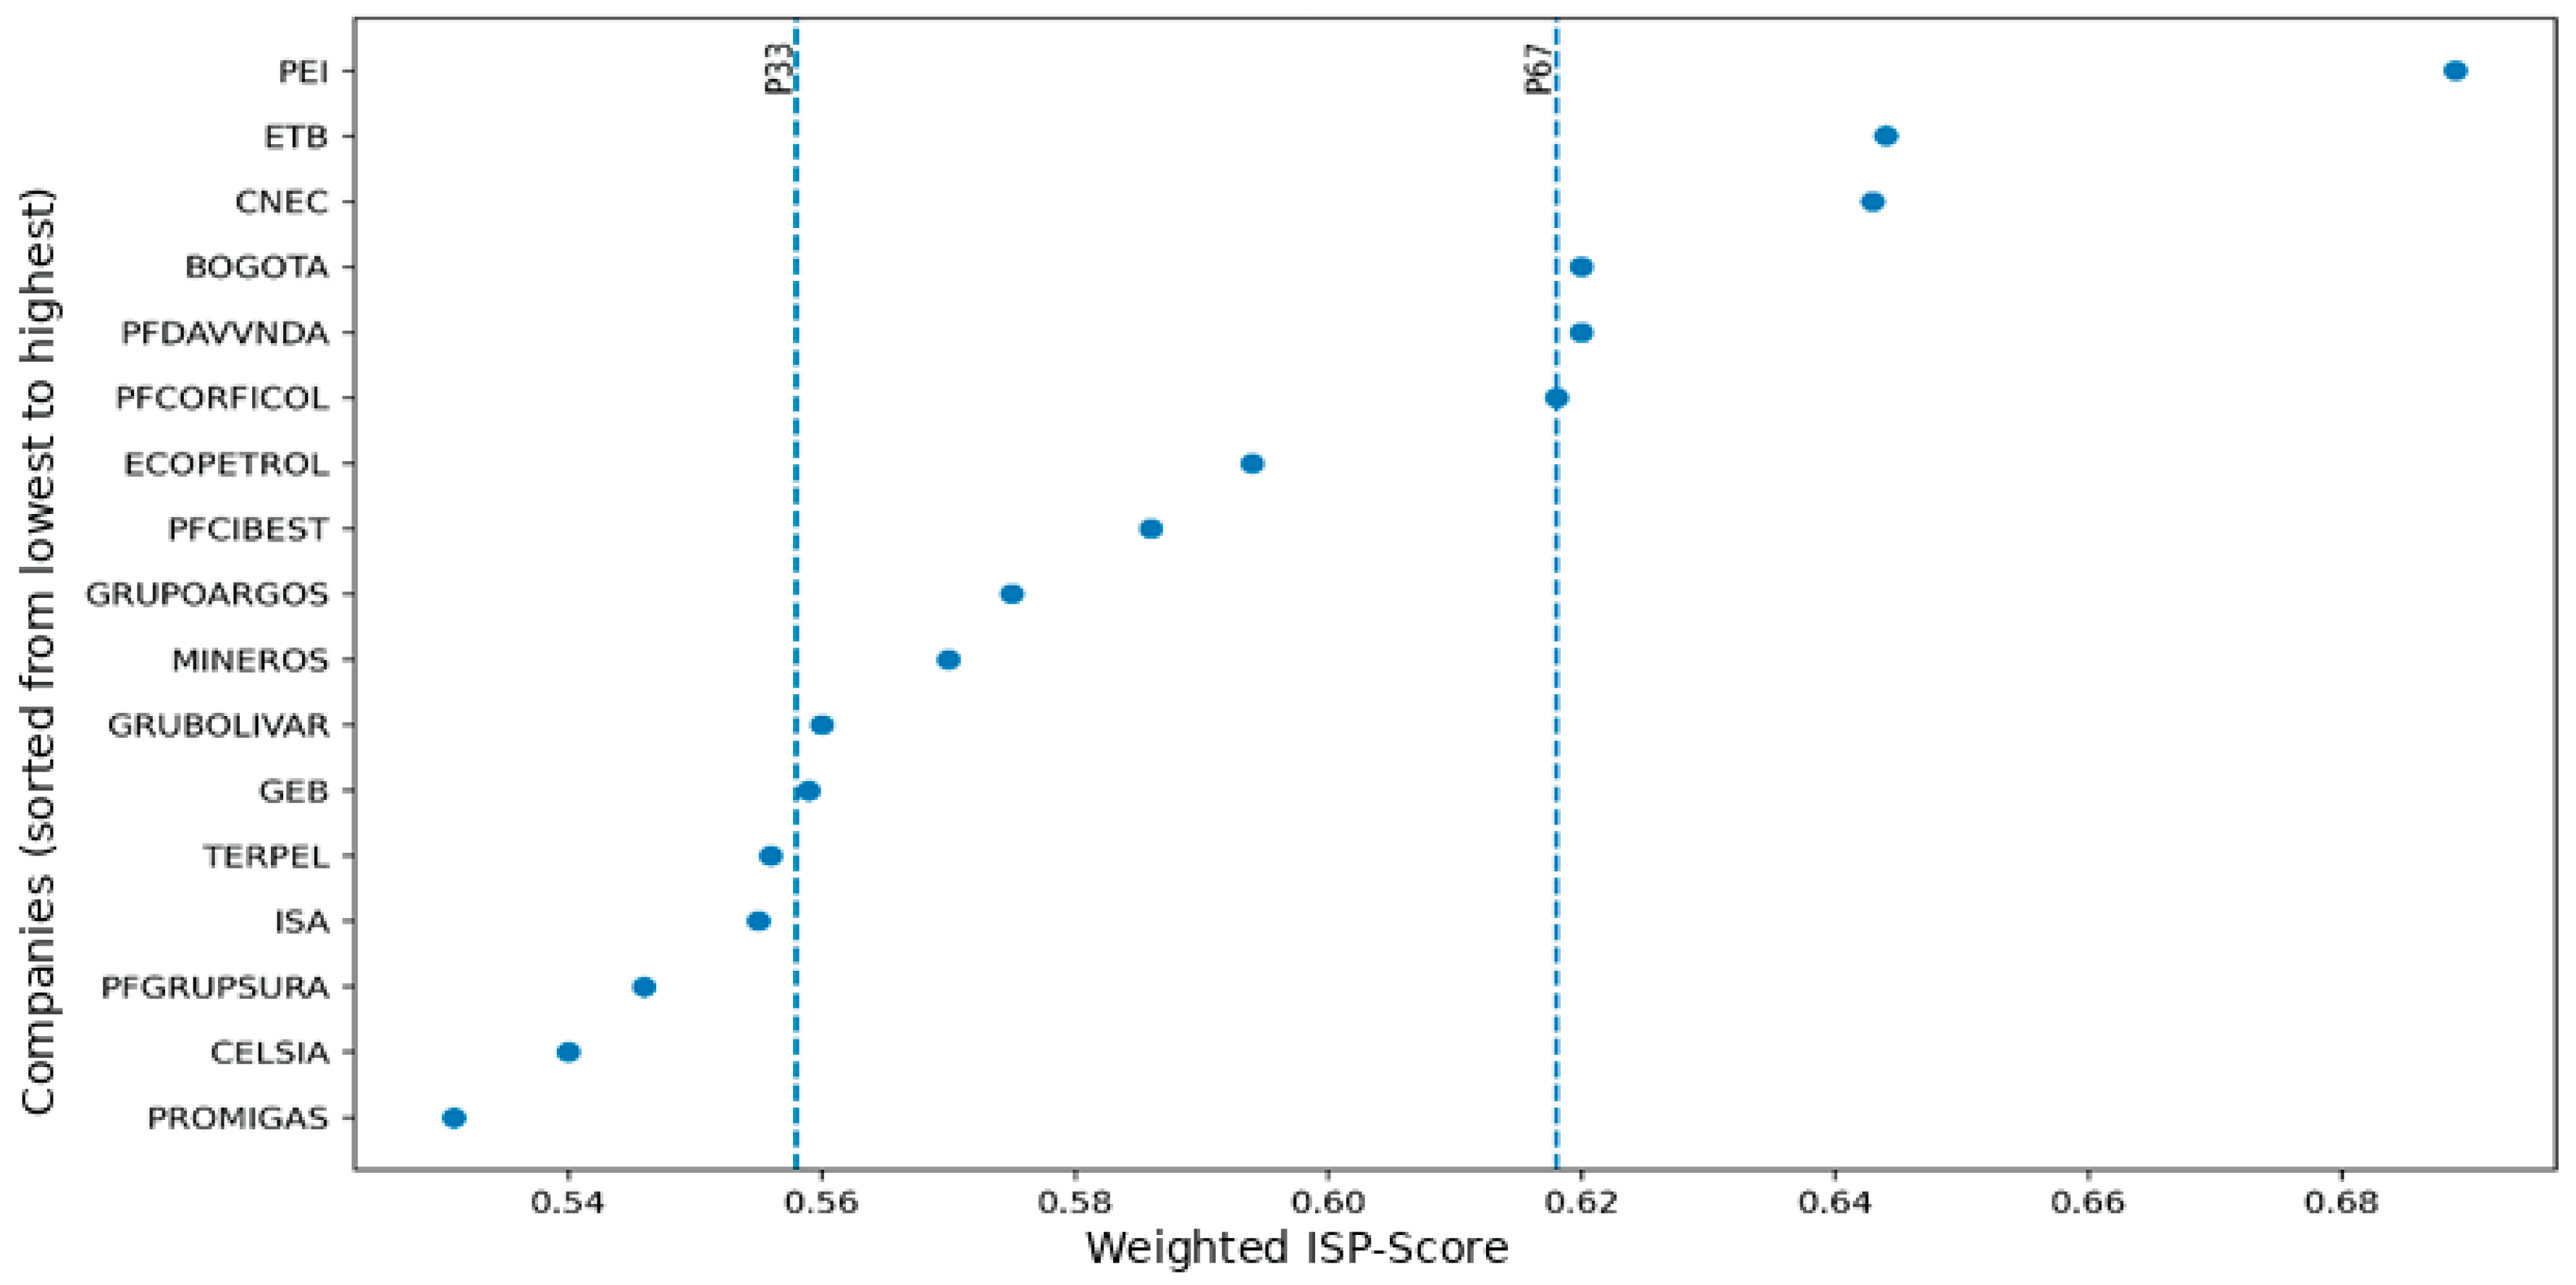

Table 1.
Coding of the pillars and indicators of the 5P Index.
| Pillar | Code | Variable | Description |
| People | PPL01 | Personnel expenses / Revenue | Labor cost as a proportion of revenue |
| People | PPL02 | Diversity and inclusion policy | Existence/disclosure of diversity policies |
| People | PPL03 | Employee turnover (%) | Employee departures as a share of total workforce |
| People | PPL04 | Training hours per employee | Investment in employee training |
| People | PPL05 | Occupational accident rate | Accidents per 200,000 hours worked |
| People | PPL06 | Gender pay gap | Percentage gender pay gap (male–female) |
| Planet | PLN01 | Environmental investment as a proportion of revenue | Environmental expenditure relative to revenue |
| Planet | PLN02 | Environmental certifications | Number/type of environmental certifications |
| Planet | PLN03 | Emissions intensity | tCO₂e per unit of revenue |
| Planet | PLN04 | Energy consumption | Energy intensity (energy per unit of output) |
| Planet | PLN05 | Water consumption | Water consumption per unit of revenue |
| Planet | PLN06 | Recycled waste (%) | Share of recycled waste |
| Prosperity | PRO01 | Return on Assets (ROA) | Return on Assets |
| Prosperity | PRO02 | Return on Equity (ROE) | Return on Equity |
| Prosperity | PRO03 | Net Profit Margin | Net Income to Revenues |
| Prosperity | PRO04 | Asset Turnover (Revenues / Total Assets) | Efficiency Ratio |
| Prosperity | PRO05 | Leverage Ratio (%) | Total Liabilities to Total Assets |
| Prosperity | PRO06 | Current Ratio | Current Assets to Current Liabilities |
| Peace | PEA01 | Female Board Representation | Percentage of Women on the Board |
| Peace | PEA02 | Regulatory Sanctions to Revenues | Fines and Sanctions to Revenues |
| Peace | PEA03 | Country Code Compliance | Level of Adoption of the Country Code |
| Peace | PEA04 | Board Independence (%) | Percentage of Independent Directors |
| Peace | PEA05 | Audit and Risk Committee | Existence of the Committee (1/0) |
| Partnerships | PRT01 | Green/Social Bonds to Total Debt | Proportion of Sustainable Bonds |
| Partnerships | PRT02 | UN Global Compact Adherence | UN Global Compact Membership |
| Partnerships | PRT03 | GRI/TCFD/SASB Disclosure | Level of International Standard Reporting |
| Partnerships | PRT04 | Participation in Sustainable Associations | Membership in Sustainable Industry Associations |
| Partnerships | PRT05 | Public–Private Partnerships | Number of Sustainable Partnerships |
article-title: own elaboration.
Table 2.
Summary of the instrument refinement process (28-16 indicators).
| Filter | Applied Criterion | Operational Rule (Replicable) | Excluded Indicators (Examples) | n Retained |
| F1. Content (expert judgment) | 5P relevance + financial interpretability | Indicators with expert consensus on relevance and clear directionality are retained | Highly sector-specific or difficult-to-standardize indicators | 28 → 22 |
| F2. Data | Availability / comparability | Indicators are excluded if data are unavailable or not comparable across issuers | Variables with incomplete reporting or inconsistent definitions | |
| 22 → 19 | ||||
| F3. Statistical quality | Variability and redundancy | Indicators are excluded if variance ≈ 0 or if they duplicate information (high overlap) | Constant or highly collinear items | |
| 19 → 17 | ||||
| F4. Statistical validation | Reliability and structure | Items are retained if they contribute to internal consistency and exhibit acceptable factor loadings | Items with low contribution to the structure or weak loadings | |
| 17 → 16 |
article-title: own elaboration.
Table 3.
Refinement of the Core variables.
| Pillar | Code | Indicator | Explanation |
| People | PPL01 | Personnel expenses / Revenues | Relationship between total personnel expenses and revenues; indicates the level of investment in human capital. |
| People | PPL02 | Diversity and inclusion policy/disclosure | Assesses whether the company has a formal and publicly disclosed diversity and inclusion policy. |
| Planet | PLN01 | Environmental investment / Revenues | Measures the proportion of revenues allocated to environmental investments or expenditures. |
| Planet | PLN02 | Environmental certification | Indicates whether the company holds verifiable environmental certifications, such as ISO 14001. |
| Prosperity | PRO01 | Real revenue growth | Change in revenues net of inflation; reflects the firm’s real business growth. |
| Prosperity | PRO02 | Distribution to labor and government / Revenues | Ratio of wages and taxes to revenues; reflects the firm’s social and fiscal contribution. |
| Prosperity | PRO03 | Responsible supplier payment index (DPO) | Average number of days the company takes to pay its suppliers. |
| Prosperity | PRO04 | Equity-adjusted net margin | Net margin adjusted by an equity factor based on the Gini index. |
| Prosperity | PRO05 | Labor productivity | Revenues generated per employee; measures operational efficiency. |
| Prosperity | PRO06 | Dividend stability | Ratio of dividends paid to net income; measures the consistency of the dividend policy. |
| Peace | PEA01 | Women on the board (%) | Percentage of women on the board; indicator of diversity in corporate governance. |
| Peace | PEA02 | SFC/SIC sanctions relative to revenues (normalized) | Indicates the magnitude of regulatory sanctions relative to revenues. |
| Peace | PEA03 | Country Code / Good Corporate Governance Code | Assesses whether the company discloses information aligned with good corporate governance standards. |
| Partnerships | PRT01 | Green/social bonds / Total debt | Proportion of debt associated with green or social instruments. |
| Partnerships | PRT02 | Adherence to the UN Global Compact | Indicates whether the company is a member of the UN Global Compact or other UN initiatives. |
| Partnerships | PRT03 | GRI/SASB/TCFD disclosure | Assesses whether the company reports under international sustainability frameworks. |
article-title: own elaboration.
Table 4.
Results of winsorized data.
| COMPANIES/IND | People | Planet | Prosperity | Peace | Partnerships | |||||||||||
| PPLO1 | PPLO2 | PLA1 | PLA2 | PRO1 | PRO2 | PRO3 | PRO4 | PRO5 | PRO6 | PEA1 | PEA2 | PEA3 | PRT1 | PRT2 | PRT3 | |
| PFCIBEST | 13,58% | 1 | 1,57% | 1 | -6,36% | 47,17% | 13 Días | 1,79% | 1.239,43 | 63,11% | 40,00% | 0,9983 | 1 | 5,62% | 1 | 1 |
| ISA | 8,78% | 1 | 0,78% | 1 | 0,18% | 18,06% | 11 Días | 1,97% | 19.098,15 | 92,12% | 22,22% | 0,9992 | 1 | 5,40% | 1 | 1 |
| ECOPETROL | 8,06% | 1 | 10,77% | 1 | -11,42% | 8,88% | 81 Días | 0,97% | 1.193,66 | 97,83% | 33,33% | 0,9999 | 1 | 49,16% | 1 | 1 |
| GEB | 14,21% | 1 | 1,82% | 1 | -4,73% | 22,33% | 75 Días | 4,90% | 3.449,40 | 44,69% | 20,00% | 0,9987 | 1 | 35,06% | 1 | 1 |
| GRUPOARGOS | 9,67% | 1 | 0,29% | 1 | -3,69% | 10,43% | 100 Días | 12,00% | 377,87 | 79,13% | 57,14% | 0,9793 | 1 | 4,52% | 1 | 1 |
| PFGRUPSURA | 12,57% | 1 | 0,25% | 1 | 3,08% | 24,48% | 36 Días | 1,33% | 600,03 | 90,18% | 0,00% | 1,0000 | 1 | 0,56% | 1 | 1 |
| CELSIA | 4,87% | 1 | 0,00% | 1 | 10,71% | 6,14% | 211 Días | 0,11% | 3.055,14 | 99,72% | 14,29% | 1,0000 | 1 | 38,97% | 1 | 1 |
| PFDAVVNDA | 28,72% | 1 | 4,26% | 1 | -14,48% | 28,90% | 89 Días | 0,00% | 1.545,38 | 100,00% | 28,57% | 1,0000 | 1 | 8,18% | 1 | 1 |
| GRUBOLIVAR | 13,78% | 1 | 3,03% | 1 | -11,99% | 34,80% | 137 Días | 0,06% | 864,02 | 92,03% | 28,57% | 0,9991 | 1 | 6,26% | 1 | 1 |
| PEI | 13,32% | 1 | 9,74% | 1 | -10,91% | 27,19% | 0 Días | 23,14% | 6.005,41 | 100,00% | 50,00% | 1,0000 | 1 | 36,55% | 1 | 1 |
| BOGOTA | 1,72% | 1 | 28,69% | 1 | 8,97% | 24,52% | 146 Días | 0,19% | 1.809,79 | 89,56% | 33,33% | 1,0000 | 1 | 6,30% | 1 | 1 |
| PROMIGAS | 5,39% | 1 | 0,37% | 1 | 2,62% | 13,41% | 51 Días | 0,75% | 3.789,48 | 37,13% | 28,57% | 0,9925 | 1 | 40,72% | 1 | 1 |
| TERPEL | 1,42% | 1 | 21,81% | 1 | -3,46% | 7,08% | 321 Días | 0,01% | 25.287,41 | 73,13% | 14,29% | 0,6539 | 1 | 0,03% | 1 | 1 |
| PFCORFICOL | 4,46% | 1 | 17,19% | 1 | -7,05% | 18,28% | 21 Días | 0,02% | 444,53 | 98,96% | 44,44% | 0,9859 | 1 | 26,84% | 1 | 1 |
| MINEROS | 4,22% | 1 | 4,59% | 1 | 8,50% | 0,17% | 141 Días | 0,00% | 774.655,57 | 90,84% | 25,00% | 1,0000 | 1 | 4,82% | 1 | 1 |
| CNEC | 9,04% | 1 | 1,38% | 1 | 13,15% | 28,36% | 3 Días | 0,00% | 3.319,35 | 92,03% | 14,29% | 1,0000 | 1 | 80,74% | 1 | 1 |
| ETB | 17,88% | 1 | 0,28% | 1 | 5,05% | 21,63% | 30 Días | 0,15% | 3.763,66 | 100,00% | 42,86% | 0,9943 | 1 | 38,70% | 1 | 1 |
article-title: own elaboration.
Table 5.
Variable Normalization.
| COMPANIES | PPLO1 | PPLO2 | PLA1 | PLA2 | PRO1 | PRO2 | PRO3 | PRO4 | PRO5 | PRO6 | PEA1 | PEA2 | PEA3 | PRT1 | PRT 2 | PRT 3 |
| PFCIBEST | 0,45 | 1,00 | 0,05 | 1,00 | 0,29 | 1,00 | 0,96 | 0,08 | 0,00 | 0,41 | 0,70 | 0,00 | 1,00 | 0,07 | 1,00 | 1,00 |
| ISA | 0,27 | 1,00 | 0,03 | 1,00 | 0,53 | 0,38 | 0,96 | 0,09 | 0,02 | 0,87 | 0,39 | 0,00 | 1,00 | 0,07 | 1,00 | 1,00 |
| ECOPETROL | 0,24 | 1,00 | 0,38 | 1,00 | 0,11 | 0,19 | 0,75 | 0,04 | 0,00 | 0,97 | 0,58 | 0,00 | 1,00 | 0,61 | 1,00 | 1,00 |
| GEB | 0,47 | 1,00 | 0,06 | 1,00 | 0,35 | 0,47 | 0,77 | 0,21 | 0,00 | 0,12 | 0,35 | 0,00 | 1,00 | 0,43 | 1,00 | 1,00 |
| GRUPOARGOS | 0,30 | 1,00 | 0,01 | 1,00 | 0,39 | 0,22 | 0,69 | 0,52 | 0,00 | 0,67 | 1,00 | 0,06 | 1,00 | 0,06 | 1,00 | 1,00 |
| PFGRUPSURA | 0,41 | 1,00 | 0,01 | 1,00 | 0,64 | 0,52 | 0,89 | 0,06 | 0,00 | 0,84 | 0,00 | 0,00 | 1,00 | 0,01 | 1,00 | 1,00 |
| CELSIA | 0,13 | 1,00 | 0,00 | 1,00 | 0,91 | 0,13 | 0,34 | 0,00 | 0,00 | 1,00 | 0,25 | 0,00 | 1,00 | 0,48 | 1,00 | 1,00 |
| PFDAVVNDA | 1,00 | 1,00 | 0,15 | 1,00 | 0,00 | 0,61 | 0,72 | 0,00 | 0,00 | 1,00 | 0,50 | 0,00 | 1,00 | 0,10 | 1,00 | 1,00 |
| GRUBOLIVAR | 0,45 | 1,00 | 0,11 | 1,00 | 0,09 | 0,74 | 0,57 | 0,00 | 0,00 | 0,87 | 0,50 | 0,00 | 1,00 | 0,08 | 1,00 | 1,00 |
| PEI | 0,44 | 1,00 | 0,34 | 1,00 | 0,13 | 0,57 | 1,00 | 1,00 | 0,01 | 1,00 | 0,88 | 0,00 | 1,00 | 0,45 | 1,00 | 1,00 |
| BOGOTA | 0,01 | 1,00 | 1,00 | 1,00 | 0,85 | 0,52 | 0,54 | 0,01 | 0,00 | 0,83 | 0,58 | 0,00 | 1,00 | 0,08 | 1,00 | 1,00 |
| PROMIGAS | 0,15 | 1,00 | 0,01 | 1,00 | 0,62 | 0,28 | 0,84 | 0,03 | 0,00 | 0,00 | 0,50 | 0,02 | 1,00 | 0,50 | 1,00 | 1,00 |
| TERPEL | 0,00 | 1,00 | 0,76 | 1,00 | 0,40 | 0,15 | 0,00 | 0,00 | 0,03 | 0,57 | 0,25 | 1,00 | 1,00 | 0,00 | 1,00 | 1,00 |
| PFCORFICOL | 0,11 | 1,00 | 0,60 | 1,00 | 0,27 | 0,39 | 0,94 | 0,00 | 0,00 | 0,98 | 0,78 | 0,04 | 1,00 | 0,33 | 1,00 | 1,00 |
| MINEROS | 0,10 | 1,00 | 0,16 | 1,00 | 0,83 | 0,00 | 0,56 | 0,00 | 1,00 | 0,85 | 0,44 | 0,00 | 1,00 | 0,06 | 1,00 | 1,00 |
| CNEC | 0,28 | 1,00 | 0,05 | 1,00 | 1,00 | 0,60 | 0,99 | 0,00 | 0,00 | 0,87 | 0,25 | 0,00 | 1,00 | 1,00 | 1,00 | 1,00 |
| ETB | 0,60 | 1,00 | 0,01 | 1,00 | 0,71 | 0,46 | 0,91 | 0,01 | 0,00 | 1,00 | 0,75 | 0,02 | 1,00 | 0,48 | 1,00 | 1,00 |
article-title: own elaboration.
Table 6.
Pillar scores for the 5P index.
| Company | People | Planet | Prosperity | Peace | Partnerships | I5P |
| PFCIBEST | 0,72 | 0,53 | 0,46 | 0,57 | 0,69 | 0,59 |
| ISA | 0,63 | 0,51 | 0,48 | 0,46 | 0,69 | 0,56 |
| ECOPETROL | 0,62 | 0,69 | 0,34 | 0,53 | 0,87 | 0,61 |
| GEB | 0,73 | 0,53 | 0,32 | 0,45 | 0,81 | 0,57 |
| GRUPOARGOS | 0,65 | 0,50 | 0,41 | 0,69 | 0,69 | 0,59 |
| PFGRUPSURA | 0,70 | 0,50 | 0,49 | 0,33 | 0,67 | 0,54 |
| CELSIA | 0,56 | 0,50 | 0,40 | 0,42 | 0,83 | 0,54 |
| PFDAVVNDA | 1,00 | 0,57 | 0,39 | 0,50 | 0,70 | 0,63 |
| GRUBOLIVAR | 0,73 | 0,55 | 0,38 | 0,50 | 0,69 | 0,57 |
| PEI | 0,72 | 0,67 | 0,62 | 0,63 | 0,82 | 0,69 |
| BOGOTA | 0,51 | 1,00 | 0,46 | 0,53 | 0,69 | 0,64 |
| PROMIGAS | 0,57 | 0,51 | 0,30 | 0,51 | 0,83 | 0,54 |
| TERPEL | 0,50 | 0,88 | 0,19 | 0,75 | 0,67 | 0,60 |
| PFCORFICOL | 0,56 | 0,80 | 0,43 | 0,61 | 0,78 | 0,63 |
| MINEROS | 0,55 | 0,58 | 0,54 | 0,48 | 0,69 | 0,57 |
| CNEC | 0,64 | 0,52 | 0,58 | 0,42 | 1,00 | 0,63 |
| ETB | 0,80 | 0,50 | 0,51 | 0,59 | 0,83 | 0,65 |
article-title: own elaboration.
Table 7.
Internal Reliability by Pillar (5P–ESG Index).
| Pillar | Items | N | Cronbach’s α | Standardized α | Mean Inter-Item r | Interpretation |
| People | PPL1–PPLO2 | 2 | 0.70 | 0.71 | 0.55 | Acceptable |
| Planet | PLA1–PLA2 | 2 | 0.74 | 0.75 | 0.59 | Good |
| Prosperity | PRO1–PRO6 | 6 | 0.86 | 0.87 | 0.41 | High consistency |
| Peace | PEA1–PEA3 | 3 | 0.80 | 0.81 | 0.46 | Good consistency |
| Partnerships | PRT1–PRTI3 | 3 | 0.82 | 0.83 | 0.49 | Good–high |
| Global | All | 16 | 0.89 | 0.90 | 0.35 | High consistency |
article-title: own elaboration.
Table 8.
KMO results and Bartlett’s sphericity test.
| Test | Value | Interpretation |
| Global KMO | 0.82 | Good sample adequacy |
| Bartlett’s χ² | 948.6 | H0 tested: identity matrix |
| Degrees of Freedom (df) | 120 | df = p(p-1)/2 |
| p-value | <0.001 | Factorable matrix p < 0.05 rejects H0 |
article-title: own elaboration.
Table 9.
Total variance explained by the EFA.
| Factor | Eigenvalue | % Variance | % Cumulative |
| 1 | 4.32 | 27.0% | 27.0% |
| 2 | 2.41 | 15.1% | 42.1% |
| 3 | 1.86 | 11.6% | 53.7% |
| 4 | 1.45 | 9.1% | 62.8% |
| 5 | 1.12 | 7.0% | 69.8% |
article-title: own elaboration.
Table 10.
Rotated factor loadings matrix (Varimax).
| Variable | People | Planet | Prosperity | Peace | Partnerships |
| PPLO1 | 0.78 | 0.12 | 0.10 | 0.05 | 0.08 |
| PPLO2 | 0.74 | 0.15 | 0.09 | 0.06 | 0.04 |
| PLA1 | 0.10 | 0.81 | 0.11 | 0.04 | 0.06 |
| PLA2 | 0.12 | 0.79 | 0.08 | 0.05 | 0.07 |
| PRO1 | 0.09 | 0.05 | 0.71 | 0.12 | 0.10 |
| PRO2 | 0.07 | 0.04 | 0.74 | 0.09 | 0.11 |
| PRO3 | 0.11 | 0.06 | 0.69 | 0.13 | 0.08 |
| PRO4 | 0.10 | 0.07 | 0.73 | 0.11 | 0.06 |
| PRO5 | 0.05 | 0.04 | 0.76 | 0.09 | 0.07 |
| PRO6 | 0.08 | 0.05 | 0.70 | 0.10 | 0.09 |
| PEA1 | 0.06 | 0.07 | 0.10 | 0.75 | 0.08 |
| PEA2 | 0.05 | 0.04 | 0.09 | 0.79 | 0.07 |
| PEA3 | 0.07 | 0.06 | 0.11 | 0.73 | 0.06 |
| PRT1 | 0.08 | 0.06 | 0.09 | 0.05 | 0.77 |
| PRT2 | 0.07 | 0.05 | 0.08 | 0.06 | 0.81 |
| PRT3 | 0.09 | 0.07 | 0.10 | 0.05 | 0.74 |
article-title: own elaboration.
Table 11.
Loadings of the first principal component (PCA on the five pillars).
| Pillar | PC1 Loading (λj) |
| People | 0.43 |
| Planet | 0.39 |
| Prosperity | 0.61 |
| Peace | 0.37 |
| Partnerships | 0.46 |
article-title: own elaboration.
Table 12.
Normalized weights of the pillars (w_j).
| Pillar | λj | Weight wj |
| People | 0,43 | 0,19 |
| Planet | 0,39 | 0,17 |
| Prosperity | 0,61 | 0,27 |
| Peace | 0,37 | 0,16 |
| Partnerships | 0,46 | 0,21 |
| Total | 2,26 | 1,00 |
article-title: own elaboration.
Table 13.
Normalized Weights of the Pillars ().
| Company | People | Planet | Prosperity | Peace | Partnerships | I5P | Ranking I5P–Score |
| PEI | 0,72 | 0,67 | 0,62 | 0,63 | 0,82 | 0,69 | 1 |
| ETB | 0,80 | 0,50 | 0,51 | 0,59 | 0,83 | 0,65 | 2 |
| BOGOTA | 0,51 | 1,00 | 0,46 | 0,53 | 0,69 | 0,64 | 3 |
| PFCORFICOL | 0,56 | 0,80 | 0,43 | 0,61 | 0,78 | 0,63 | 4 |
| PFDAVVNDA | 1,00 | 0,57 | 0,39 | 0,50 | 0,70 | 0,63 | 5 |
| CNEC | 0,64 | 0,52 | 0,58 | 0,42 | 1,00 | 0,63 | 6 |
| ECOPETROL | 0,62 | 0,69 | 0,34 | 0,53 | 0,87 | 0,61 | 7 |
| TERPEL | 0,50 | 0,88 | 0,19 | 0,75 | 0,67 | 0,60 | 8 |
| PFCIBEST | 0,72 | 0,53 | 0,46 | 0,57 | 0,69 | 0,59 | 9 |
| GRUPOARGOS | 0,65 | 0,50 | 0,41 | 0,69 | 0,69 | 0,59 | 10 |
| GRUBOLIVAR | 0,73 | 0,55 | 0,38 | 0,50 | 0,69 | 0,57 | 11 |
| GEB | 0,73 | 0,53 | 0,32 | 0,45 | 0,81 | 0,57 | 12 |
| MINEROS | 0,55 | 0,58 | 0,54 | 0,48 | 0,69 | 0,57 | 13 |
| ISA | 0,63 | 0,51 | 0,48 | 0,46 | 0,69 | 0,56 | 14 |
| PROMIGAS | 0,57 | 0,51 | 0,30 | 0,51 | 0,83 | 0,54 | 15 |
| CELSIA | 0,56 | 0,50 | 0,40 | 0,42 | 0,83 | 0,54 | 16 |
| PFGRUPSURA | 0,70 | 0,50 | 0,49 | 0,33 | 0,67 | 0,54 | 17 |
article-title: own elaboration.
Disclaimer/Publisher’s Note: The statements, opinions and data contained in all publications are solely those of the individual author(s) and contributor(s) and not of MDPI and/or the editor(s). MDPI and/or the editor(s) disclaim responsibility for any injury to people or property resulting from any ideas, methods, instructions or products referred to in the content. |
© 2026 by the authors. Licensee MDPI, Basel, Switzerland. This article is an open access article distributed under the terms and conditions of the Creative Commons Attribution (CC BY) license (http://creativecommons.org/licenses/by/4.0/).
Copyright: This open access article is published under a Creative Commons CC BY 4.0 license, which permit the free download, distribution, and reuse, provided that the author and preprint are cited in any reuse.


