
Submitted:
09 February 2026
Posted:
10 February 2026
You are already at the latest version
Abstract
Hydrogen sulfide (H2S) is essential for renal function; however, it is toxic at high concentrations. H2S is increased during reductive stress (RS). Increased antioxidant capacity and reduced/oxidized glutathione (GSH/GSSG) characterize a rat model of RS associated with chronic consumption of 6 % Hibiscus sabdariffa Linnaeus (HSL). Here, we evaluate if chronic consumption of an infusion of HSL causes kidney damage associated with an increase in H2S. Twenty-one Wistar rats were divided into three groups, Group 1: rats received plain tap water ad libitum (G1). Group 2: rats received an ad libitum infusion of 6% HSL for one month (G2) and Group 3: rats consumed a 6% HSL infusion for one month and were then given natural water for another month (G3). We evaluated renal vasodilatation, expression of cystathionine–β–synthase (CBS), cystathionine–γ–lyase (CSE), 3–mercaptopyruvate-sulfur-transferase (3–MST), γ-glutamylcysteine synthetase (GCLC), Nrf2, total OXPHOS, H2S concentration, GSH/GSSG and oxidized/reduced thiols in the kidney. Renal vasodilatation, total OXPHOS in the complex IV, I and oxidized/reduced thiols were decrease (p≤0.01) but H2S, CBS, SCE, GCLC, NrF2 expressions and GSH/GSSG were increased (p≤0.04). The HSL infusion provides cysteine that is metabolized by CBS and CSE elevating chronic H2S and favoring renal damage.
Keywords:
hydrogen sulfide
; Hibiscus sabdariffa Linnaeus
; reductive stress
; kidney
; reducing couples
1. Introduction
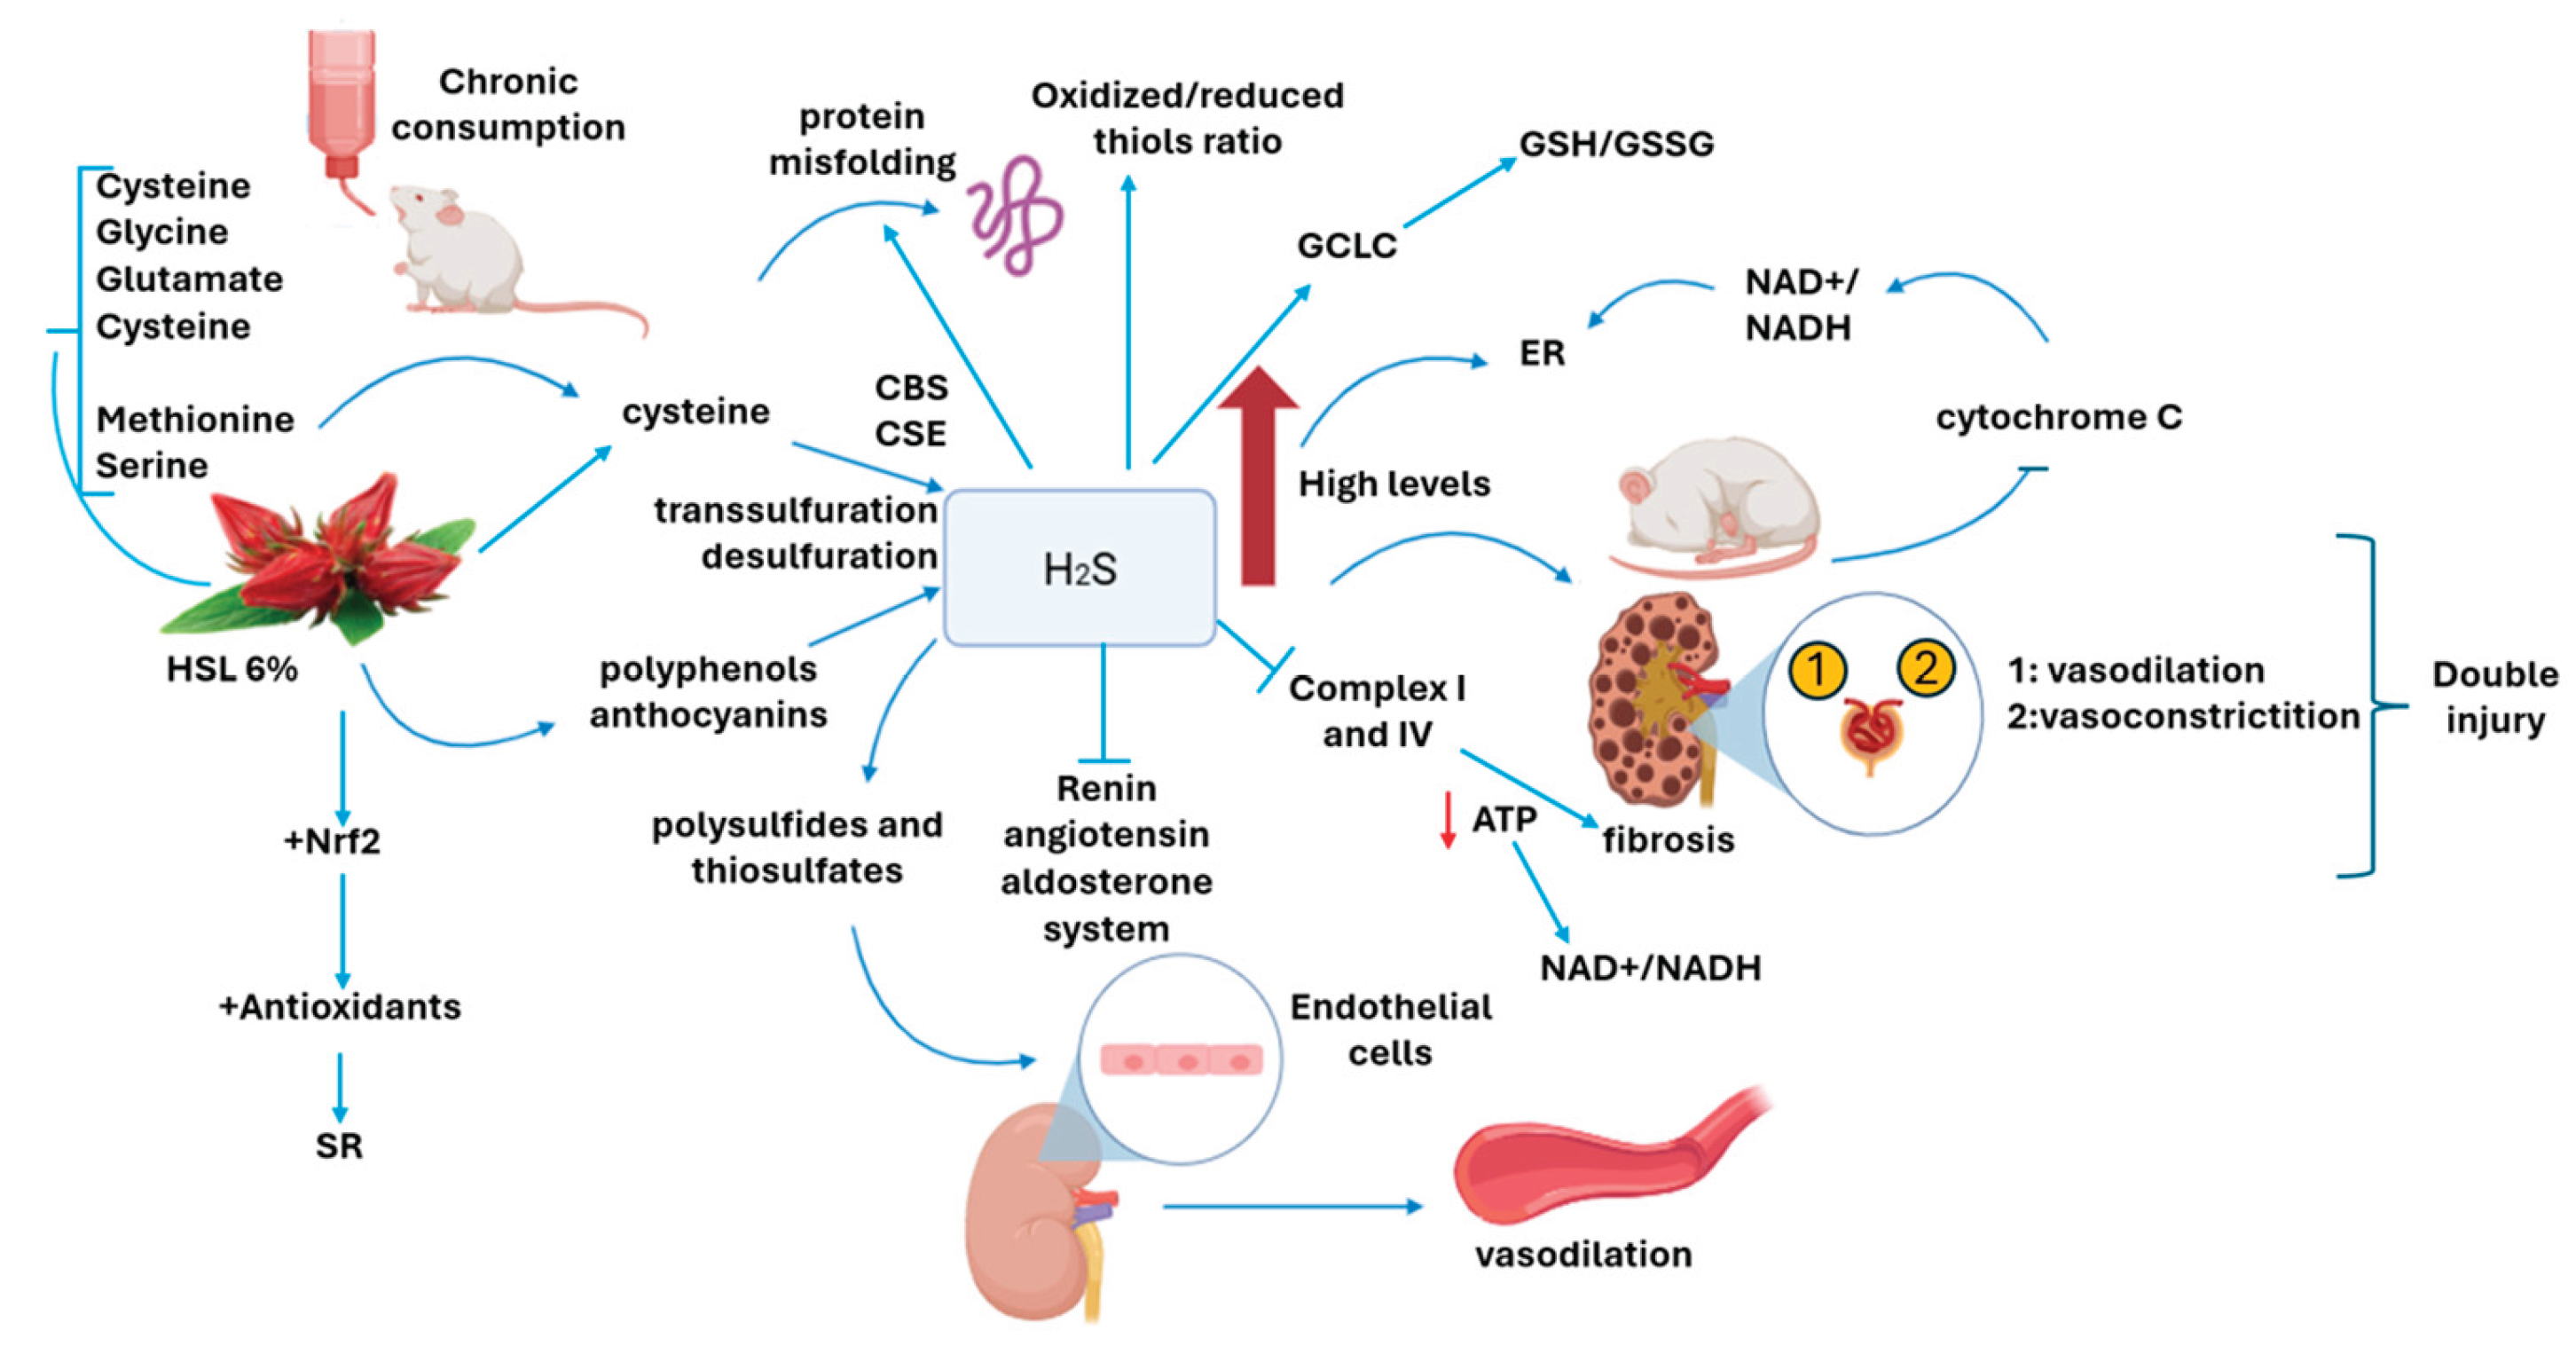
Hydrogen sulfide (H2S) is a gaseous signaling molecule with vasodilator properties, that resembles in some ways nitric oxide. Its synthesis occurs in the cytosol with the participation of two enzymes. The first one is cystathionine–β–synthase (CBS) that utilizes to L-homocysteine and serine amino acids to produce L-cystationine. Then, this molecule is used by the second enzyme, cystathionine–γ–lyase (CSE) to form L-cysteine. H2S is produced by transsulfuration and direct desulfuration of the metabolites of these two enzymes. In contrast to the synthesis of H2S in the cytosol, its synthesis in mitochondria depends on 3-mercaptopyruvate, which derives from L-cysteine and is used as a substrate of the 3–mercaptopyruvate sulfur transferase (3–MST). This enzyme has to be imported into the mitochondria and the import process is a limiting and critical step for this pathway [1]. Once formed, H2S, can react with the cysteine residues of proteins to form persulfide bonds (sulfhydration process). H2S may also increase the activity of the key enzyme, γ-glutamylcysteine synthetase (GCLC) that participates in the synthesis of glutathione (GSH) starting from cysteine, and it may directly act by reducing glutathione disulfide (GSSG). This allows, in part, for the maintenance of constant levels of GSH [2].
H2S plays an important role in the renal system which is in charge of removing toxic substances produced by cellular metabolism through glomerular filtration [3]. In this context, the three enzymes responsible for the synthesis of H2S are present in the renal proximal tubules, glomeruli, interstitium and interlobular arteries [4], and their physiological levels are crucial for renal physiology. For example, at nanomolar concentrations H2S participates as an oxygen sensor, it releases renin, it inhibits the Na+–K+ ATPase enzyme, and the Na1+ –K1+ –Cl2– cotransporter in the ascending limb of the loop of Henle, increasing the Na+ and K+ excretion and the reabsorption of approximately 20-25% of Na+ Cl– [5].
H2S is also a hyperpolarizing vasodilator in endothelial cells through activation of the ATP–sensitive channels and the S–sulfhydration channel which lowers blood pressure [6]. In several pathologies such as glomerular sclerosis and glomerulonephritis it is decreased. However, in diabetic nephropathy associated to type I diabetes, there is an increase in the H2S concentrations [6,7], which is associated with overexpression of CSE that leads to endoplasmic reticulum stress (ERS) [7].
Furthermore, at high concentrations, this gas has toxic effects. For example, at 1 µM concentration it may inhibit the cytochrome c oxidase (Complex IV) in the mitochondrial transport chain (MTC) [8]. This causes the electrons to accumulate in complex I (indirect inhibition), and then, NADH cannot be oxidized to NAD+ leading to an increased ratio of NADH/NAD+. Therefore, a state of reductive stress (RS) is favored [9].
Furthermore, H2S may act as a mutagen, damaging DNA and generating cleavage that promotes single-strand DNA. This involves H2S autoxidation which generates reactive sulfur radicals (RSR) such as: sulfanyl, persulfide, sulfur dioxide and sulfite through the trace metal-mediated Fenton-Weiss reaction [10]. In turn, the cleavage of the DNA strand is associated with the increase of H2S and favors the formation of elemental sulfur that reacts with HS– to generate polysulfides that give rise to more RSS [11]. In other words, H2S produces two different responses when at low and high concentrations being cytoprotective or cytotoxic respectively [12].
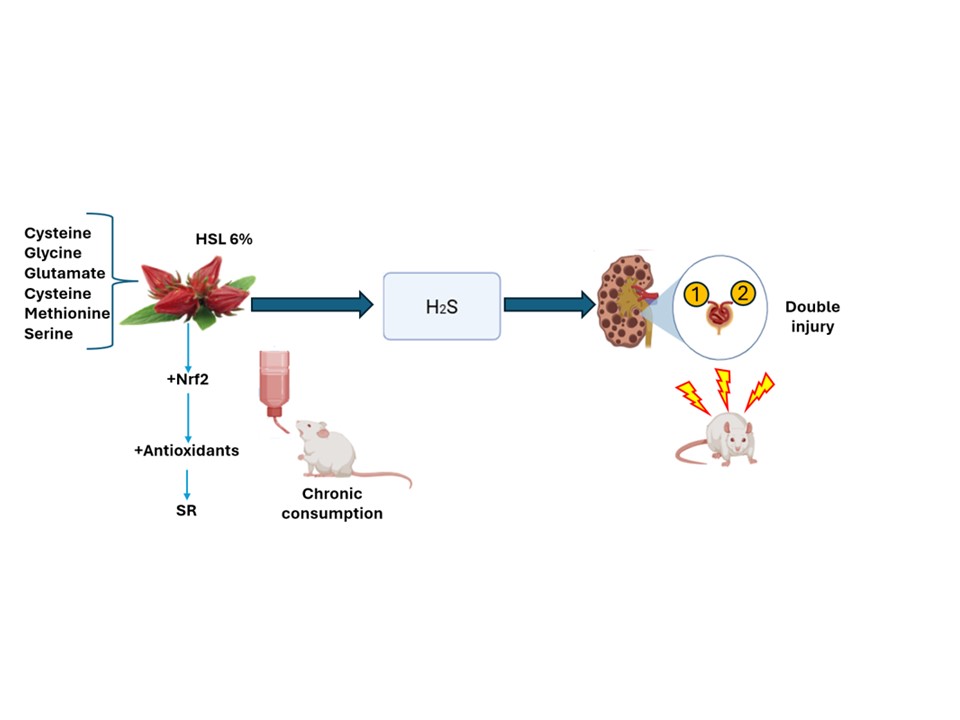
It is also important to recall that reductive stress (RS) is characterized by the excess in the reducing equivalents couples, such as reduced/oxidizes nicotinamide adenine di-nucleotide (NADH/NAD+) reduced/oxidized nicotinamide adenine dinucleotide phosphate (NADPH+/NADP+), and reduced/oxidized glutathione (GSH/GSSG), or the overex-pression of the enzymatic and non-enzymatic antioxidant systems, which can decreases reactive oxygen species (ROS). Three studies by our investigation group have demonstrated that RS can be induced in rats by chronic excess consumption of Hibiscus sabdariffa Linnaeus (HSL) at 6%. This model is characterized by an increase in the total antioxidant capacity that favors the increase in the redox couples GSH/GSSG, NADPH+/NADP+ and overactivity of the antioxidant enzymes, thus contributing to decrease ROS. This results in hypertension associated with an increase in the vasoconstriction response and anatomic changes both in the thoracic aorta and in the efferent renal artery and with elevated inflammation markers in plasma. These changes are related with deterioration of the renal function [13,14,15].
In this regard, HSL also called Jamaica flower, is employed in gastronomy and it is considered a functional food. According to traditional medicine, it may help against different pathologies such as kidney diseases [15]. Its beneficial effects are attributed to a high content of several antioxidant molecules such as polyphenols, flavonoids, minerals, essential and no essential amino acids, including cysteine, serine, methionine, glycine and glutamate [16]. In this sense, the anthocyanins and polyphenols present in the HSL can oxidize H2S to more stable forms, such as polysulfides and thiosulfates, and this results in H2S remaining available for the vasodilation process and mitochondrial protection [17].
Despite the aforementioned, there are few studies in the literature that provide information on whether the intake de HSL favors the synthesis of H2S and on whether it may cause a permanent chronic increase in the synthesis of H2S resulting in kidney damage. Therefore, the objective of this study was to evaluate if chronic excess consumption of a 6 % HSL infusion results in kidney damage associated with the increase in the H2S concentration.
2. Results
2.1. Renal Function Markers and General Characteristics of Experimental Rats
Table 1 shows the markers of renal function and general characteristics of the rats that formed the experimental groups. The rats of the G2 group that consumed the 6% HSL infusion did not show significant changes in body weight but there was a decrease in urine volume, creatinine clearance (CCr), and water consumption (p ≤ 0.01), and an increase in the systolic blood pressure (SBP) and albuminuria (p = 0.001), when compared with the rats of the G1 and G3 groups respectively.
2.2. Effect of the H2S on Δ-Perfusion Pressure (Δ-PP) and H2S Concentration in the Kidney Homogenate
Figure 1 shows the effect of the H2S on the perfusion and on the Δ-PP in the left kidney. A significant decrease in perfusion was observed when H2S (80 μM) was perfused into the left kidney of the rats of the G2 group in comparison with the G1 and G2 respectively (p=0.003 and p=0.01) panel (a). In the same figure, in panel (b) shows the total H2S concentration in kidney homogenate, illustrating that there was a statistically increase in the G2 group in comparison with rats in the G1 and G3 groups (p=0.03 and p=0.02) respectively.
2.3. Anatomical Changes of the Kidney Evidenced by Histology
Figure 2 panels a (G1), b (G2) and c (G3) show the representative histological sections of two glomeruli, and panels d (G1), e (G2) and f (G3) present the representative histological sections of tubules in the renal cortex of the experimental groups. The rats of the G2 group presented retraction of the glomerular tuft, fibrosis, increase in urinary space and thickening of the tubular membrane in the tubular interstitium in comparison with the kidneys of the rats of the G1 and G3 groups. The density analysis area of the glomeruli in the rats of the G2 was decreased (p<0.001) in comparison with the G1, but without significant difference vs. the G3 group.
2.4. Immunolabeling Analyzed Area of the Enzymes Involved in H2S Pathway
Figure 3 shows representative photomicrographs of the immunolabeling area in the kidney cortex when an antibody against CBS (panels a, b and c), CSE (panels d, e and f), 3-MST (panels g, h and i) and GCLC (panels j, k and l) were used. The brown mark shows the location of the enzymes of interest. In the G2 group the signal was more intense in CBS, CSE and GCLC with respect to the G1 and G3 groups but whitout changes in the 3-MTS. The intensity of the mark was located in the basal membrane of the cortical tubules, which resulted in a significant increase when performing densitophotometry. In this sense, Figure 4 show the density analysis of the area in the kidney cortex of the enzymes involved in H2S pathway. The rats of the G2 present significant increases in CBS, CSE and GCLC (p≤0.004 and p≤0.01 ) in comparison with the G1 and G3 respectively, but without significant difference in the 3-MST.
2.5. Expression of the Enzymes Involved in H2S Pathway
Figure 5 shows the expressions of the enzymes that participate in H2S synthesis pathway in the kidney homogenate. A similar tendency as in the immunohistochemistry is shown. The expressions of CBS, CSE and GCLC show significant increases in the G2 (p≤ 0.04, p≤0.04 and p≤0.03 respectively) in comparison with the G1 and G3.
2.6. Ratios of the Reduced and Oxidized Glutathione and Thiols
Figure 6 shows the GSH/GSSG ratio (panel a) and oxidized thiols/reduced thiols ratio (panel b) in the kidney homogenate of the experimental groups, where an increase (p=0.03) and decrease (p=0.01) respectively were present in the G2 group in comparison with the G1. In the G3 there was also an increase (p=0.04), but in comparison with G1.
2.7. Expression of Nrf2 and Total OXPHOS
Figure 7 shows the expression of Nrf2 (Panel a) where there was an increase (p= 0.03) in G2 group vs. G1. However, the total OXPHOS mitochondrial complexes (Panel b) presented a significant decrease (p=0.03 and p=0.01) in the Complex (C) I and CIV complexes respectively in G2 vs. G1.
3. Discussion
Low doses of HSL have antioxidant properties that decrease the pathological consequences of metabolic syndrome and kidney damage among other diseases. However, damaging effects may be expected at high doses. The elevated ingestion of HSL induces RS characterized by an increase in the GSH/GSSG, NADP+/NADPH+ couples and the total antioxidant capacity, and can favor renal damage, arterial hypertension and inflammation [13,14,15]. H2S penetrates cell membranes without using transporters since it has lipophilic characteristics and it participates as a signaling messenger regulating important metabolic pathway in the organism such as the expression of antioxidant response elements through the Kelch-like ECH-associated protein 1 (Keap1) / nuclear transcription factor erythroid related factor (Nrf2) pathway [1]. However, few studies have shown if the elevated intake of HSL favors the synthesis of H2S and if this permanent chronic increase may be associated with renal damage. Therefore, the aim of this study was to evaluate if chronic consumption of a 6 %HSL infusion results in renal damage related with the chronic increase in the H2S.concentration.
HSL is a source of cysteine, serine, glycine, glutamate and methionine among other molecules [18]. These amino acids are essential substrates for the enzymes involved in the H2S synthesis pathways. Under physiological conditions, the CSE level in renal cortex is 20-fold higher than CBS, which suggest that it is the first enzyme that participates in the H2S synthesis in the kidney. Our results show an increase in this enzyme of 3 to 1 with respect to the CBS. [19]. Our results by using immunohistochemistry and western blot also show that the expression of CBS and CSE are increased in the renal cortex. This suggests that the chronic consumption of the 6% infusion of HSL provides the methionine, serine and cysteine, that favor the overexpression of CBS and CSE. CBS requires serine to produce homocysteine which then leads to the formation of cysteine, through transsulphuration. Cysteine is then reused by CBS and CSE for the production of H2S [2]. Therefore, a chronic elevated supply of these amino acids directly contributes to H2S synthesis. The methionine amino acid supplied by the HSL infusion results in cysteine by a transmethylation process and this molecule is then used for the synthesis of H2S [20]. Therefore, the excess H2S concentration supplied by these metabolic pathways, may result in toxic effects because it favors an increase of the cysteine persulfide residue (–CySSH, sulfhydration process) and oxidation of GSH that leads to GSSG. This may decrease reactive oxygen species (ROS) which, at normal physiological concentrations, are necessary for the regulation of different cellular pathways but that are depleted in RS. Furthermore, in a RS state the sulfhydrylation process may increase as a compensatory response due to the imbalance in the RSR production [21]. Moreover, the increase in cysteine may also be toxic because it induces protein misfolding and ERS [22].
Our results regarding 3-MST showed no significant difference, and this suggests that chronic intake of a 6% HSL infusion does not modulate the overexpression of this enzyme. In this regard, the expression/activity of this enzyme depends on D-cysteine rather than on L-cysteine and D-cysteine is present in the kidney in rats. [23]. This pathway produces 60 times more H2S from D–cysteine than from L–cysteine. [24], Nevertheless HSL does not contribute to the amount of this enantiomer of cysteine, and this could be a possible explanation for the lack of significant differences in this enzyme.
However, our results show that the cysteine excess directly provided by the chronic consumption of 6% HSL in rats or metabolized by different pathway after its ingestion, results in elevated pathological concentrations of H2S in the kidney which translate into systemic physiological conditions such as a decreased Δ–PP and an elevated GSH/GSSG ratio in the kidney homogenate.
The excess H2S favors vasodilatation in the afferent arteriole that contributes to the decrease of the Δ-PP. However, this condition can be reversible if the insult is removed. This was evidenced by the Δ-PP restoration in the kidney of G3 group. In this sense, H2S is considered an endothelium–derived hyperpolarizing factor that acts through the activation of the ATP–sensitive intermediate and small conductance K+ channels. For the activation of these channels there is an essential step of S–sulfhydration [6]. Vasodilation increases renal blood flow [6,25]. H2S can also directly inhibit the renin angiotensin aldosterone system interfering with zinc, at the active center of angiotensin converting enzyme. This results in a decrease of the SBP and an increase of the glomerular filtration rate [25].
RS is associated with chronic HSL consumption, and there exists an increase in the vasoconstrictor response to norepinephrine which favors Δ-PP in the perfused isolated kidney. This condition leads to an increase of the SBP and a decreased glomerular filtration rate [13]. Hence, our results seem contradictory. However, chronic vasodilation of the renal afferent arteriole and vasoconstriction of the efferent arterioles originate a scenario of double injury on the glomerulus and renal tubules [26]. The increased blood flow associated with vasodilation of the afferent arteriole causes increases in pressure in the glomerular tuft, which are kept constant by vasoconstriction in the efferent arteriole, maximizing glomerular pressure, destroying the filtration barrier and causing scarring and a dynamic imbalance at different points of the renal microcircuit. This condition perpetuates renal failure and this altered physiological mechanism may lead to glomerular sclerosis that impairs perfusion to the peritubular capillaries [27] This causes chronic ischemia in the interstitial tissue and thickening of the tubular membranes associated with the lack of oxygen [28]. This dynamic imbalance at different points of the renal microcircuit perpetuates renal failure which is characterized by an increase in proteinuria and low CCr that are shown in our results [29].
On the other hand, H2S induces Nrf2 dissociation from Keap1 through S–sulfhydration which favors the translocation of Nrf2 to the nucleus inducing downstream inhibition of the antioxidant enzymes involved in the decrease of ROS [30] Our results show an increase in the expression of the phosphorylated NrF2. This suggests that the increase of H2S contributes to the expression of phosphorylated NrF2, and to a state of RS, caused by overstimulation of Nrf2 which leads to a positive feedback process [31]. This, in turn, favors the transcription of various antioxidant enzymes [32], such as CBS, CSE, and expression of the two subunits of the GCLC enzyme that catalyzes the first step in GSH synthesis. Therefore, the GSH/GSSG ratio remains constant [33]. The S–sulfhydration process also induces sulfhydration of tyrosine phosphatase–1β located on the cytoplasmic face of the endoplasmic reticulum (ER) and this contributes to perpetuate the ERS [34]. In addition, the 6% infusion of HSL can, by itself, contribute to increase GSH since it provides the essential amino acids for its synthesis, namely: cysteine, glycine, and glutamic acid, and this may contribute to maintain the increase of the GSH/GSSG ratio.
Furthermore, our results show a decrease in the oxidized/reduced thiols ratios in the G2 group. In this regard, RS decreases the content of thiol groups, resulting in misfolding of proteins in the ESR which leads to their accumulation with a loss of disulfide bridges [31]. In this sense, the equilibrium between the oxidized/reduced thiols is very important since it regulates the functionality and activity of enzymes and proteins, and low concentrations of H2S favor a reductive state on thiols. However, in high concentrations, it promotes an oxidized state [35]. Therefore, our results suggest that the increase in H2S is related to the increase in oxidized/reduced thiols ratio, adding another redox couple to the RS state.
On the other hand, one of the main effects of the increase in the concentration of H2S is the inhibition of complex IV in the mitochondrial ETC, since it binds to the heme-copper active site blocking oxygen reduction and decreasing the proton translocation. It consequently decreases ATP production by complex V (ATPase) which leads to a non-canonical operation of the ETC, which triggers a secondary and retrograde inhibition of complex I. In this condition the decrease and increase of the coupling redox NAD+/NADH is drastically altered [36]. This contributes to the positive feedback loop that leads to a RS state. Our results show that the expression of CIV and CI complexes in total OXPHOS was decreased in the kidney homogenate in the G2 group. In this sense, the second organ with the highest number of mitochondria in the body is the kidney, and these organelles are most concentrated in the renal tubules [37]. The fibrosis present in the tubular interstitium has a strong relation with the ETC decoupling and the decrease in ATP production [38]. This causes an inflammatory process that perpetuates tubulointerstitial fibrosis, because in this state macrophages are activated and they secrete pro-inflammatory interleukins such as TNF-α and IL-1β [15]. The figure 8 shows the possible mechanism by which the chronic consumption of the HSL infusion at 6 % may over-regulate the H2S pathway and contribute to a SR state which favors renal damage.
Figure 8.
The chronic consumption of a 6% infusion of HSL provides serine, that by transsulfuration and direct desulfuration produced cysteine, also provide methionine that by transmethylation also results in cysteine but the same way apports by herself cysteine. the increase of this amino acid favors the overexpression the CBS and CSE that drive to high H2S. that may elevation of trancription factor Nrf2. Furthermore, the increase in the concentration of H2S, even can elevate the reducing equivalents, GSH/GSSG and oxidized thiols/reduced thiols and damages the ETC favoring the accumulation of the NAD+/NADH redox couple in complex I. All these alterations add up to the RS which is characterized by depletion of ROS and result in kidney damage.
4. Materials and Methods
4.1. Rat Groups
Twenty-one male Wistar rats were used to form 3 groups with 7 animals each. Group 1: rats that received plain tap water ad libitum for one month (G1). Group 2: rats that received an ad libitum a 6% infusion HSL to for one month (G2) and Group 3: rats that received ad libitum a 6%infusion HSL to for one month, after which they were given tap water for another month (G3). The animals were housed for 4 weeks under the following conditions, a 12-hour light/12-hour dark cycle, room temperature from 18–26°C, and relative humidity ranging from 40–70%. The commercial food the rodents consumed was solid rodent kibble supplemented with 23% crude protein, 4.5% crude fat, 6% crude fiber, 8% ash, and 2.5% minerals (Labdiet 5008; PMI Nutrition International, Richmond, IN) ad libitum. The study was designed and carried out in compliance with the Laboratory Animal Care Committee of the National Institute of Cardiology Ignacio Chávez (INC/CICUAL/009/2023).
4.2. Preparation of the HSL Infusion
60 g of HSL calyces were added to one liter of boiling water. It was kept boiling for 10 min, allowed to cool and filtered. This solution was provided ad libitum to the rats. The 6% HSL infusion contained cyanidin-3-glucoside (549.67 ± 26.75 mg/L), quercetin (198.48 ± 31.56 mg/L), and polyphenols (52.82 ± 0.38 mol/L).
4.3. Systolic Blood Pressure Measurement and Urine Collection
At the end of treatment and before euthanizing the animals, SBP was measured using a plethysmograph (Narco Bio-system). Before euthanasia, the rats were weighed and placed in metabolic cages after fasting for 24 hours. Urine was collected and stored at –30°C. The albuminuria was subsequently determined using the bromocresol green method, and urinary creatinine (UCr) and serum creatinine (SCr) concentrations were determined to calculate creatinine clearance (CCr) Using the formula: CCr = (SCr/UCr (Urine Volume)/1440 min [13].
4.4. Isolated and Perfused Kidney
Rats were anesthetized by an intraperitoneal injection of sodium pentobarbital (63 mg/kg of body weight). The right kidney was exposed via a midline laparotomy, and the mesenteric and renal arteries and surrounding tissue were cleared. The right renal artery was cannulated via the mesenteric artery to avoid interruption of blood flow, and the kidney was removed, suspended, and perfused at a constant flow rate using a peristaltic pump (MasterFlex Easy-load II, no. 77200-50; Cole-Parmer Instrument Co., Vermon Hills, IL, USA) at 37°C and oxygenated with 95% O2 and 5% CO2 with Krebs solution at pH 7.4. The basal perfusion pressure (PP) was adjusted to 80–90 mmHg. The average flow rate of the perfusion solution was 8–9 mL/min. PP was measured with a transducer (Grass Telefactor, Grass Technologies, Astro Med, West Warwick, RI), coupled with a Grass model 79D polygraph and online software (Grass PolyView). Data are expressed as changes (Δ) in PP in millimeters of mercury (mmHg). After at least 15 min of perfusion and once a stable Δ-PP was obtained, vasodilator responses to H2S were determined. The bolus concentration was 80 μM H2S. Changes in Δ-PP due to H2S were calculated by taking the mean of the pulsatile tracings before administration and the mean of the tracings at the peak Δ-PP value after administration. Data are expressed as changes in Δ-PP in mmHg. The concentrations of H2S were selected from published data, as they seemed the most suitable after obtaining changes in Δ-PP [13].
4.6. Anatomical Changes in the Kidney by Histological Process
To demonstrate the anatomical and structural changes in the renal tissue, the left kidney was dissected and washed with 0.9% saline solution for 30 sec. The capsule was removed and cut in half. One half was processed for light microscopy according to standard techniques, which are briefly described below. One half of the kidney was fixed in 10% formalin solution for 24 hours, gradually dehydrated in ethanol, cleared in xylene, embedded in paraffin, and cut into 5 µM-thick slices using a microtome (Leica RM212RT, Wetzlar, Germany). The paraffin sections were stained with Masson's trichrome and Jones’s methenamine technique. For immunohistochemistry the antibodies were: CBS antibody mouse IgG1κ sc-133154, CSE antibody mouse (F-1): sc-374249, MST-3 antibody mouse (47): sc-135993, GCLC antibody [EP13475]. Histological and immunohistochemistry sections were analyzed at 25× and 12.5× magnification using a model 63300 optical microscope (Carl Zeiss, Oberkochen, Germany) equipped with a Tucsen digital camera (18 megapixels) coupled with TSview 7.3.1 software. The glomerular area was analyzed by densitometry using Sigma Scan Pro 5 Image Analysis software (Systat Software Inc., San Jose, CA, USA). Density values are expressed in arbitrary pixel units. The other half of the kidney was homogenized in a cold sucrose buffer consisting of 25 mM sucrose, 10 mM Tris, 1 mM EDTA at pH 7.35 with protease inhibitors (1 mM PMSF, 2 μM pepstatin, 2 μM leupeptin, and 0.1% aprotinin). The homogenate was then centrifuged at 900× g for 10 min at 4°C, and the supernatant was separated and stored at -30°C until used. Total protein was determined using the Bradford method.
4.7. Determination of Polyphenols, Total Flavonoids and Anthocyanins in HSL Infusion
100 μL of the HSL infusion were diluted 1:10 in distilled water. Then, 500 μL of Folin-Ciocalteu reagent (2 N) were added, the mixture was homogenized, and incubated for 3 min at room temperature. Then, 3 ml of 2% sodium bicarbonate were added, the mixture was incubated for 15 min at room temperature, and the absorbance was read at 750 nm. The total flavonoids present in the HSL infusion were determined using the Jia method and the absorbance was determined at 510 nm [39]. The anthocyanins were determined according to the method described by Lee, and the absorbance was measured at 520 nm and 700 nm [40].
4.8. GSH/GSSG and Oxidized Thiols/Reduced Thiols Ratios
To 100 μg of protein from the kidney homogenate, 100 μL of 0.05 M KH2PO4 pH 7.35, plus 100 μL of 5% Na2WO4) were added and then 100 μL of H2SO4 were added. The mixture was homogenized, and centrifuged for 5 min at 5000 rpm. The supernatant was recovered, and 700 μL of KH2PO4 plus 100 μL of 10 M Ellman's reagent were added. The mixture was incubated at room temperature for 5 min, and the absorbance was read at 412 nm [13]. To quantify GSSG, the procedure was the same as for quantifying GSH, but after deproteinizing the kidney homogenate, 4 µL of 8-vinylpyridine were added to oxidize the present GSH. For the reduced thiols ratio 100 µg of protein from the kidney homogenate were used, to which 100 µL of KBH4 dissolved in a 10 mM methanol/water (1:1 v/v) mixture were added. The mixture was homogenized and incubated for 3 min. Then, 750 μL of buffer containing 6.7 mM formaldehyde, 10 mM EDTA, and 100 mM TRIS at pH 8.2 were incorporated and the mixture was incubated for 3 min. Then, 100 μL of 10 mM Ellman's reagent were added. The samples were incubated at room temperature for 4 min, and the absorbance was read at 415 nm [13,41]. To quantify oxidized thiols, the procedure was the same as for quantifying reduced thiols, but without KBH4.
4.9. Nuclear Factor Erythroid 2 and Total OXPHOS
50 μg of protein from the kidney homogenate were separated on an 8% SDS-PAGE gel and transferred to polyvinylidene difluoride membranes. The blot was blocked for 1 h at room temperature using Tris-buffered saline (TBS)-0.01% Tween plus 5% skim milk. The membranes were incubated overnight at 4 °C with the primary anti-phospho-NrF2-S40 monoclonal antibody produced in rabbit SAB5701902-100UL and Total OXPHOS rodent WB Antibody Cocktail ab110413. The blot was then incubated with β-actin antibody (sc-81178) and ANT1 Antibody (E-7), as a loading control. sc-518268, mouse IgG1κ. For Western-blot the antibodies were: CBS antibody mouse IgG1κ sc-133154, CSE antibody mouse (F-1): sc-374249, MST-3 antibody mouse (47): sc-135993, GCLC antibody [EP13475].
Images of the films were digitally acquired using a GS-800 densitometer with Quantity One software (Bio-Rad Laboratories, Inc., Hercules, CA, USA) and were reported as arbitrary units (AU).
4.10. Statistical Analysis
Statistical analysis and graphs were performed using Sigma Plot software (SigmaPlot® version 15.0, Jamdel Corporation). Data are presented as mean ± standard error. Statistical significance was determined using one-way ANOVA and Tukey's post hoc test. A p≤0.05 was considered significant.
5. Conclusions
The chronic consumption of a 6% infusion of HSL provides the essentials com-pounds that increase the presence of cysteine which is the substrate of CBS and CSE. These enzymes increase the concentration of H2S due to their overexpression caused by the increase in the substrate and the elevation of trancription factor Nrf2. This results in an increase in the concentration of H2S, which favors the reducing equivalents, GSH/GSSG and oxidized thiols/reduced thiols and damages the ETC favoring the accumulation of the NAD+/NADH redox couple in complex I. All these alterations add up to the RS which is characterized by depletion of ROS and result in kidney damage.
Author Contributions
Conceptualization and methodology, L.M.-P.; made the guaranteed analysis determination, M.E.S.; revision and structuring of the manuscript, V.G.-L. and V.C.-T.; performed the western blot, M.E.H.; methodology and cared for experimental animals, S.C.-C.; performed the GSH experiments, R.M.-M.; software analysis, J.C.T.-N.; cared for experimental animals, I.P.-T.; designed the study, wrote the manuscript, and then performed the statistical study. All authors have read and agreed to the published version of the manuscript.
Funding
This research received no external funding.
Institutional Review Board Statement
The Laboratory Animal Care Committee of the National Institute of Cardiology Ignacio Chávez in México (protocol # INC/CICUAL/009/2023) approved the experiments on animals, which were conducted in compliance with the Guide for the Care and Use of Laboratory Animals of the National Institutes of Health (NIH).
Informed Consent Statement
Not applicable.
Data Availability Statement
The datasets generated and analyzed during the current study are available from the corresponding author on reasonable request.
Acknowledgments
We thank to Postgraduate Section of the Universidad Nacional Autónoma México Posdoctoral Program (POSDOC) for a scholarship to Linaloe Manzano Pech. We thank Benito Chávez Rentería for his histology technical support.
Conflicts of Interest
The authors declare no conflicts of interest.
Abbreviations
| H2S | Hydrogen sulfide |
| RS | Reductive stress |
| HSL | Hibiscus sabdariffa Linnaeus |
| CBS | Cystathionine–β–synthase |
| CSE | Cystathionine–γ–lyase |
| 3–MST | 3–mercaptopyruvate-sulfur-transferase |
| GCLC | γ-glutamylcysteine synthetase |
| GSH/GSSG | Reduced/oxidized glutathione |
| ROS | Reactive oxygen species |
| ERS | Endoplasmic reticulum stress |
| MTC | Mitochondrial transport chain |
| NADH/NAD+ | Reduced/oxidizes nicotinamide adenine di-nucleotide |
| NADPH+/NADP+) | Reduced/oxidized nicotinamide adenine dinucleotide phosphate |
| CCr | Creatinine clearance |
| SBP | Systolic blood pressure |
| Δ-PP | Δ-perfusion pressure |
| Keap1 | Kelch-like ECH-associated protein 1 |
| RSR | Reactive sulfur radicals |
| ER | Endoplasmic reticulum |
References
- Jianan, F.; Xiangxue, L.; Han, L.; Shixiang, W. The roles of hydrogen sulfide in renal physiology and disease states. Ren. Fail. 2022, 44, 1289–1308. [Google Scholar] [CrossRef] [PubMed]
- Beck, K.F.; Pfeilschifter, J. The pathophysiology of H2S in renal glomerular diseases. Biomolecules 2022, 12, 207. [Google Scholar] [CrossRef]
- Pérez-Torres, I.; Ibarra, B.; Soria-Castro, E.; Torrico-Lavayen, R.; Pavón, N.; Diaz-Diaz, E.; Flores, P.L.; Infante, O.; Baños, G. Effect of glycine on the cyclooxygenase pathway of the kidney arachidonic acid metabolism in a rat model of metabolic syndrome. Can. J. Physiol. Pharmacol. 2011, 89, 899–910. [Google Scholar] [CrossRef] [PubMed]
- Uyy, E.; Iulian, V.; Raluca, S.; Boteanu, M.; Safciuc, F.; Cerveanu-Hogas, A.; Ivan, L.; Stavaru, C.; Simionescu, M.; Antohe, F. Diabetic nephropathy associates with deregulation of enzymes involved in kidney sulphur. J. Cell. Mol. Med. 2020, 24, 12131–12140. [Google Scholar] [CrossRef] [PubMed]
- Xia, M.; Chen, L.; Muh, R.W.; Pin-Lan, L.; Ningjun, L. Production and actions of hydrogen sulfide, a novel gaseous bioactive substance, in the kidneys. J. Pharmacol. Exp. Ther. 2009, 329, 1056–1062. [Google Scholar] [CrossRef]
- Mustafa, A.K.; Sikka, G.; Gazi, SK, Steppan, J.; Jung, S.M.; Bhunia, A.K.; Barodka, V.M. Gazi, F.K. Barrow, R.K. Wang, R.; L.M.; Berkowitz, D.E.; Snyder, S.H Hydrogen sulfide as endothelium-derived hyperpolarizing factor sulfhydrates potassium channels. Circ. Res. 2011, 109, 1259–1268. [CrossRef]
- Yang, G.; Yang, W.; Wu, L. Wang, R. H2S, endoplasmic reticulum stress, and apoptosis of insulin-secreting β cells. J. Biol. Chem. 2007, 282, 16567–16576. [CrossRef]
- Hildebrandt, T.M. Modulation of sulfide oxidation and toxicity in rat mitochondria by dehydroascorbic acid. Biochim. Biophys. Acta. 2011, 1807, 1206–1213. [Google Scholar] [CrossRef]
- Kumar, R.; Banerjee, R. A Metabolic paradigm for hydrogen sulfide signaling via electron transport chain plasticity. Antioxid. Redox. Signal. 2023, 38, 57–67. [Google Scholar] [CrossRef]
- Benchoam, D.; Cuevasanta, E.; Möller, M.N.; Alvarez, B. Hydrogen sulfide and persulfides oxidation by biologically relevant oxidizing species. Antioxidants (Basel). 2019, 8, 48. [Google Scholar] [CrossRef]
- Han, S.; Li, Y.; Gao, H. Generation and physiology of hydrogen sulfide and reactive sulfur species in bacteria. Antioxidants (Basel). 2022, 11, 2487. [Google Scholar] [CrossRef]
- Szabo, C. Roles of hydrogen sulfide in the pathogenesis of diabetes mellitus and its complications. Antioxid. Redox. Signal. 2012, 17, 68–80. [Google Scholar] [CrossRef]
- Manzano-Pech, L.; Soto, M.E.; Castrejón-Tellez, V.; Guarner-Lans, V.; Pérez-Flores, A.A.; Caballero-Chacón, S.; Martínez-Memije, R.; Rubio-Ruiz, M.E.; Rodríguez-Fierros, F.L.; Torres-Narváez, J.C.; Ibarra-Lara, L.; Pérez-Torres, I. Impaired renal function due to reductive stress is associated with excessive consumption of Hibiscus sabdariffa Linnaeus. Antioxidants. (Basel). 2025, 984. [Google Scholar] [CrossRef]
- Manzano-Pech, L.; Guarner-Lans, V.; Soto, M.E.; Díaz-Díaz, E.; Pérez-Torres, I. Alteration of the aortic vascular reactivity associated to excessive consumption of Hibiscus sabdariffa Linnaeus: Preliminary findings. Heliyon. 2023, 9, e20020. [Google Scholar] [CrossRef] [PubMed]
- Manzano-Pech, L.; Guarner-Lans, V.; Soto, M.E.; Díaz-Díaz, E.; Caballero-Chacón, S.; Díaz-Torres, R.; Rodríguez-Fierros, F.L.; Pérez-Torres, I. Excessive consumption Hibiscus sabdariffa L. Increases inflammation and blood pressure in male wistar rats via high antioxidant capacity: The Preliminary findings. Cells. 2022, 11, 2774. [Google Scholar] [CrossRef]
- Shagal, M.H.; Kubmarawa, D.; Ndahi, J.A.; Samson, P.E. Amino acid profile of Hibiscus Sabdariffa. J. Chem. Bio. Phy. Sci. Sec. B 2014, 4, 2310–2319. [Google Scholar]
- Kenneth, R.O.; Gao, Y.; Briggs, A.; Devireddy, M.; Iovino, N.A.; Licursi, M.; Skora, N.C.; Whelan, J.; Villa, B.P.; Strarub, K.D. Antioxidant’ berries, anthocyanins, resveratrol and rosmarinic acid oxidize hydrogen sulfide to polysulfides and thiosulfate: A novel mechanism underlying their biological actions. Free. Radic. Biol. Med. 2021, 165(2021), 67–78. [Google Scholar] [CrossRef]
- Pérez-Torres, I.; Ruiz-Ramírez, A.; Baños, G.; El-Hafidi, M. Hibiscus sabdariffa Linnaeus (Malvaceae), curcumin and resveratrol as alternative medicinal agents against metabolic syndrome. Cardiovasc. Hematol. Agents. Med. Chem. 2013, 11, 25–37. [Google Scholar] [CrossRef] [PubMed]
- Dugbartey, G.J. Diabetic nephropathy: a potential savior with ‘rotten-egg’ smell. Pharmacol. Rep. 2017, 69, 331–339. [Google Scholar] [CrossRef] [PubMed]
- Qian, L.L.; Liu, X.Y.; Chai, Q.; Wang, R.X. Hydrogen Sulfide in Diabetic Complications: Focus on Molecular Mechanisms. Endocr. Metab. Immune. Disord. Drug. Targets. 2018, 18, 470–476. [Google Scholar] [CrossRef]
- Pérez-Torres, I.; Guarner-Lans, V.; Rubio-Ruiz, E.E. Reductive stress in inflammation-associated diseases and the pro-oxidant effect of antioxidant agents. Int. J. Mol. Sci. 2017, 18, 2098. [Google Scholar] [CrossRef]
- Correia, M.J.; Pimpão, A.B.; Fernandes, D.G.F.; Morello, J.; Sequeira, C.O.; Calado, J.; Alexandra, M.M.; Antunes, Almeida, M.S.; Branco, P.; Monteiro, E.C.; Vicente, J.B.; Serpa, J.;m. S.A.; Cysteine as a Multifaceted player in kidney, the Cysteine-Related Thiolome and its implications for precision medicine Molecules. 2022, 27, 1416. [CrossRef]
- Glazenburg, E.J.; Halsema, I.M.; Jekel, Baranczyk-Kuzma, A.; Krijgsheld, K.R. Mulder, G.J. D-cysteine as a selective precursor for inorganic sulfate in the rat in vivo. Effect of D-cysteine on the sulfation of harmol. Biochem. Pharmacol. 1984, 33, 625–628. [CrossRef]
- Shibuya, N.; Koike, S.; Tanaka, M.; Ishigami-Yuasa, M.; Kimura, Y.; Ogasawara, Y.; Fukui, K.; Nagahara, N.; Kimura, H. A novel pathway for the production of hydrogen sulfide from D-cysteine in mammalian cells. Nat. Commun. 2013, 4, 1366. [Google Scholar] [CrossRef]
- Laggner, H.; Hermann, M.; Esterbauer, H.; Muellner, M.K.; Exner, M.; Gmeiner, B.M.; Kapiotis, S. The novel gaseous vasorelaxant hydrogen sulfide inhibits angiotensin-converting enzyme activity of endothelial cells. J. Hypertens. 2007, 25, 2100–2104. [Google Scholar] [CrossRef]
- Nishiyama, A.; Abe, Y. Molecular structure and function of afferent and efferent arterioles. Nihon. Rinsho 2006, 64, 107–112. [Google Scholar]
- Nakagawa, T.; Duk-Hee, Kang.; Ohashi, R.; Shin-ichi, Suga; Herrera-Acosta, J.; Rodriguez-Iturbe, B.; Johnson, R.J. Tubulointerstitial disease: role of ischemia and microvascular disease. Curr. Opin. Nephrol. Hypertens. 2003, 12, 233–241. [Google Scholar] [CrossRef] [PubMed]
- Ren, Y.; Garvin, J.L.; Liu, R.; Carretero, O.A. Cross-talk between arterioles and tubules in the kidney. Pediatr. Nephrol. 2009, 24, 31–35. [Google Scholar] [CrossRef]
- Fine, L.G.; Norman, J.T. Chronic hypoxia as a mechanism of progression of chronic kidney diseases: from hypothesis to novel therapeutics. Kidney. Int. 2008, 74, 867–872. [Google Scholar] [CrossRef] [PubMed]
- Xie, L.; Gu, Y.; Wen, M.; Wang, W.; Ma, Y.; Meng, G.; Han, Y.; Wang, Y.; Liu, G.; Moore, P.K.; Wang, X.; Wang, H.; Zhang, Z.; Yu, Y.; Ferro, A.; Huang, Z.; Ji, Y. Hydrogen sulfide induces Keap1 S-sulfhydration and suppresses diabetes-accelerated atherosclerosis via Nrf2 activation. Diabetes. 2016, 65, 3171–3184. [Google Scholar] [CrossRef] [PubMed]
- Wang, S.; Kaufman, R.J. The impact of the unfolded protein response on human disease. J. Cell. Biol. 2012, 197, 857–867. [Google Scholar] [CrossRef]
- Dai, X.; Yan, X.; Wintergerst, K.A.; Cai, L.; Keller, B.B.; Tan, Y. Nrf2: Redox and metabolic regulator of stem cell state and function. Trends Med. Mol. 2020, 26, 185–200. [Google Scholar] [CrossRef]
- Harvey, C.J.; Thimmulappa, R.K.; Singh, A.; Blake, D.J.; Ling, G.; Wakabayashi, N.; Fujii, J.; Myers, A.; Biswal, S. Nrf2-regulated glutathione recycling independent of biosynthesis is critical for cell survival during oxidative stress. Free Radic. Biol. Med. 2009, 46, 443–453. [Google Scholar] [CrossRef]
- Krishnan, N.; Fu, C.; Pappin, D.J.; Tonks, N.K. H2S-Induced sulfhydration of the phosphatase PTP1B and its role in the endoplasmic reticulum stress response. Sci. Signal. 2011, 4, ra86. [Google Scholar] [CrossRef]
- Curieses-Andrés, C.M.; José Pérez de la Lastra, M.; Andrés-Juan, C.; Plou, F.J.; Pérez-Lebeña, E. Chemistry of hydrogen sulfide-pathological and physiological functions in mammalian cells. Cells 2023, 12, 2684. [Google Scholar] [CrossRef]
- Kumar, R.; Ruma-Banerjee, A. Metabolic paradigm for hydrogen sulfide signaling via electron transport chain. Antioxid. Redox. Signal. 2023, 38, 57–67. [Google Scholar] [CrossRef]
- Bhatia, D.; Capili, A.; Choi, M.C. Mitochondrial dysfunction in kidney injury, inflammation, and disease: potential therapeutic approaches Kidney. Res. Clin. Pract. 2020, 39, 244–258. [Google Scholar] [CrossRef]
- Zhang, X.; Wang, Y.; Guo, X.; Xiao, Y.; Wan, W.; Zou, H.; Yang, X. Mitochondrial dysfunction in fibrotic diseases: Research progress and MSC-exos therapy. Exp. Mol. Pathol. 2025, 143, 104983. [Google Scholar] [CrossRef] [PubMed]
- Jia, Z.; Tang, M.; Wu, J. The determination of flavonoid contents in mulberry and their scavenging effects on superoxide radicals. Food. Chem. 1999, 64, 555–559. [Google Scholar] [CrossRef]
- Lee, J.; Durst, R.; Wrolstad, R. Determination of total monomeric anthocyanin pigment content of fruit juices, beverages, natural colorants, and wines by the Ph differential method: collaborative study. J. AOAC. Int. 2005, 88, 1269–1278. [Google Scholar]
- Erel, O.; Neselioglu, S. A novel and automated assay for thiol/disulphide homeostasis. Clin. Biochem. 2014, 49, 326–332. [Google Scholar] [CrossRef] [PubMed]
Figure 1.
Effect of the H2S on Δ-perfusion pressure (Δ-PP) and H2S concentration in kidney homogenate. Abbreviations: H2S= Hydrogen sulfide, HSL= Hibiscus sabdariffa Linnaeus. Data are presented as the mean ± SE, n= 7 per group.
Figure 1.
Effect of the H2S on Δ-perfusion pressure (Δ-PP) and H2S concentration in kidney homogenate. Abbreviations: H2S= Hydrogen sulfide, HSL= Hibiscus sabdariffa Linnaeus. Data are presented as the mean ± SE, n= 7 per group.
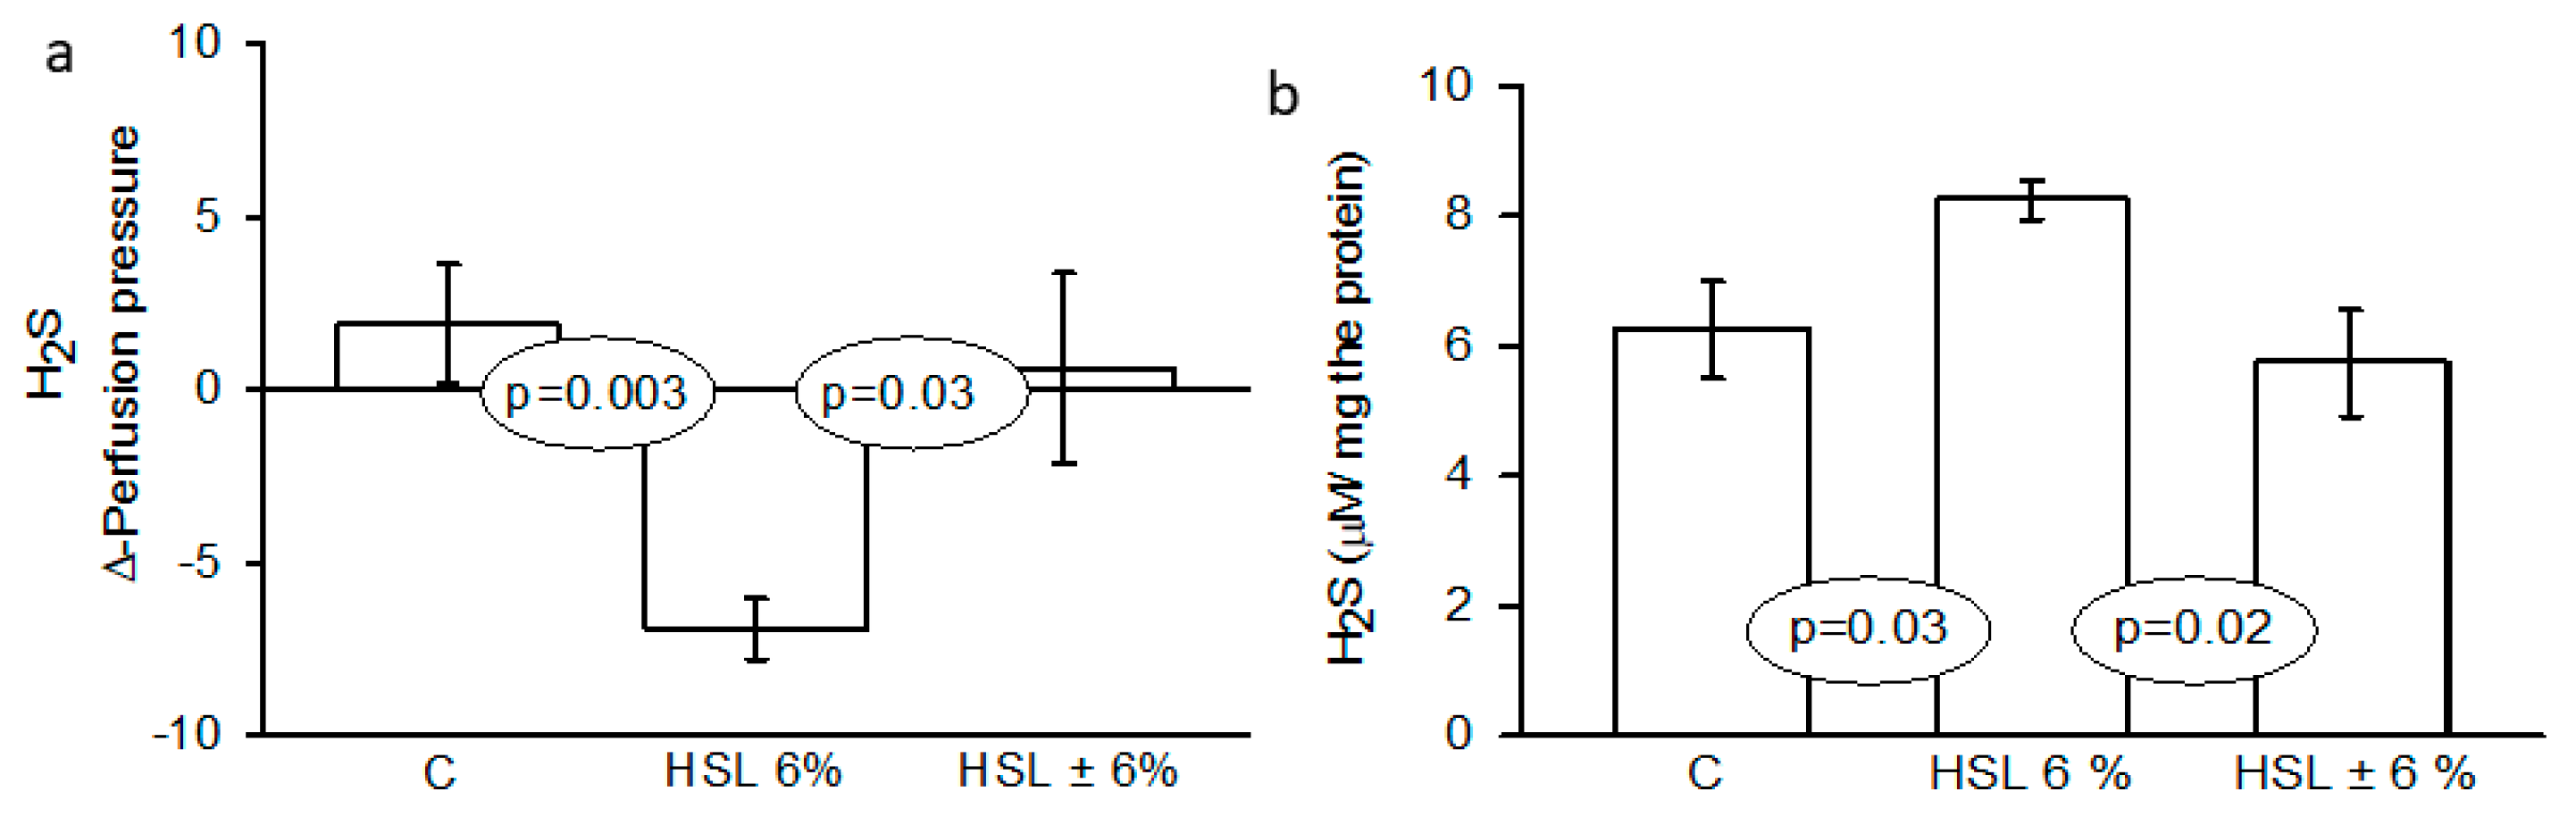
Figure 2.
Representative photomicrographs of two glomeruli, panel (a) rats of the G1, panel (b) rats of the G2 and panel (c) rats of the G3. No abnormalities were observed under light microscopy in the G1 and G3, where glomerular spaces and loops with their fine and delicate membrane are preserved. However, in the glomeruli from the rats of the G2 group, fibrosis was present, retracted glomerular tufts, and increased urinary spaces were observed. The panels e, f and g show the representative histological sections of the tubules in the G1, G2 and G3 respectively, where there is a thickening of the tubular membrane in the interstitium in the rats of the G2 group in comparison with the rats of the G1 and G3 respectively. Masson’s trichrome stain in the panels a, b and c was used, and photomicrographs at 25×. The densitometer analysis is shown in arbitrary units at the top of panels a, b and c where a significant decrease was observed in the size of the glomerulus in the rats of the G2 (p < 0.001) vs. the rats of the G1 and G3 respectively. Jones’s methenamine technique was used in the panels e, f and g, and photomicrographs at 12.5. Abbreviations: BC= Bowman capsule, G= Glomerulus, T= Tubule, PT= Proximal tubule, DT= Distal tubule, TM= Tubular membrane.
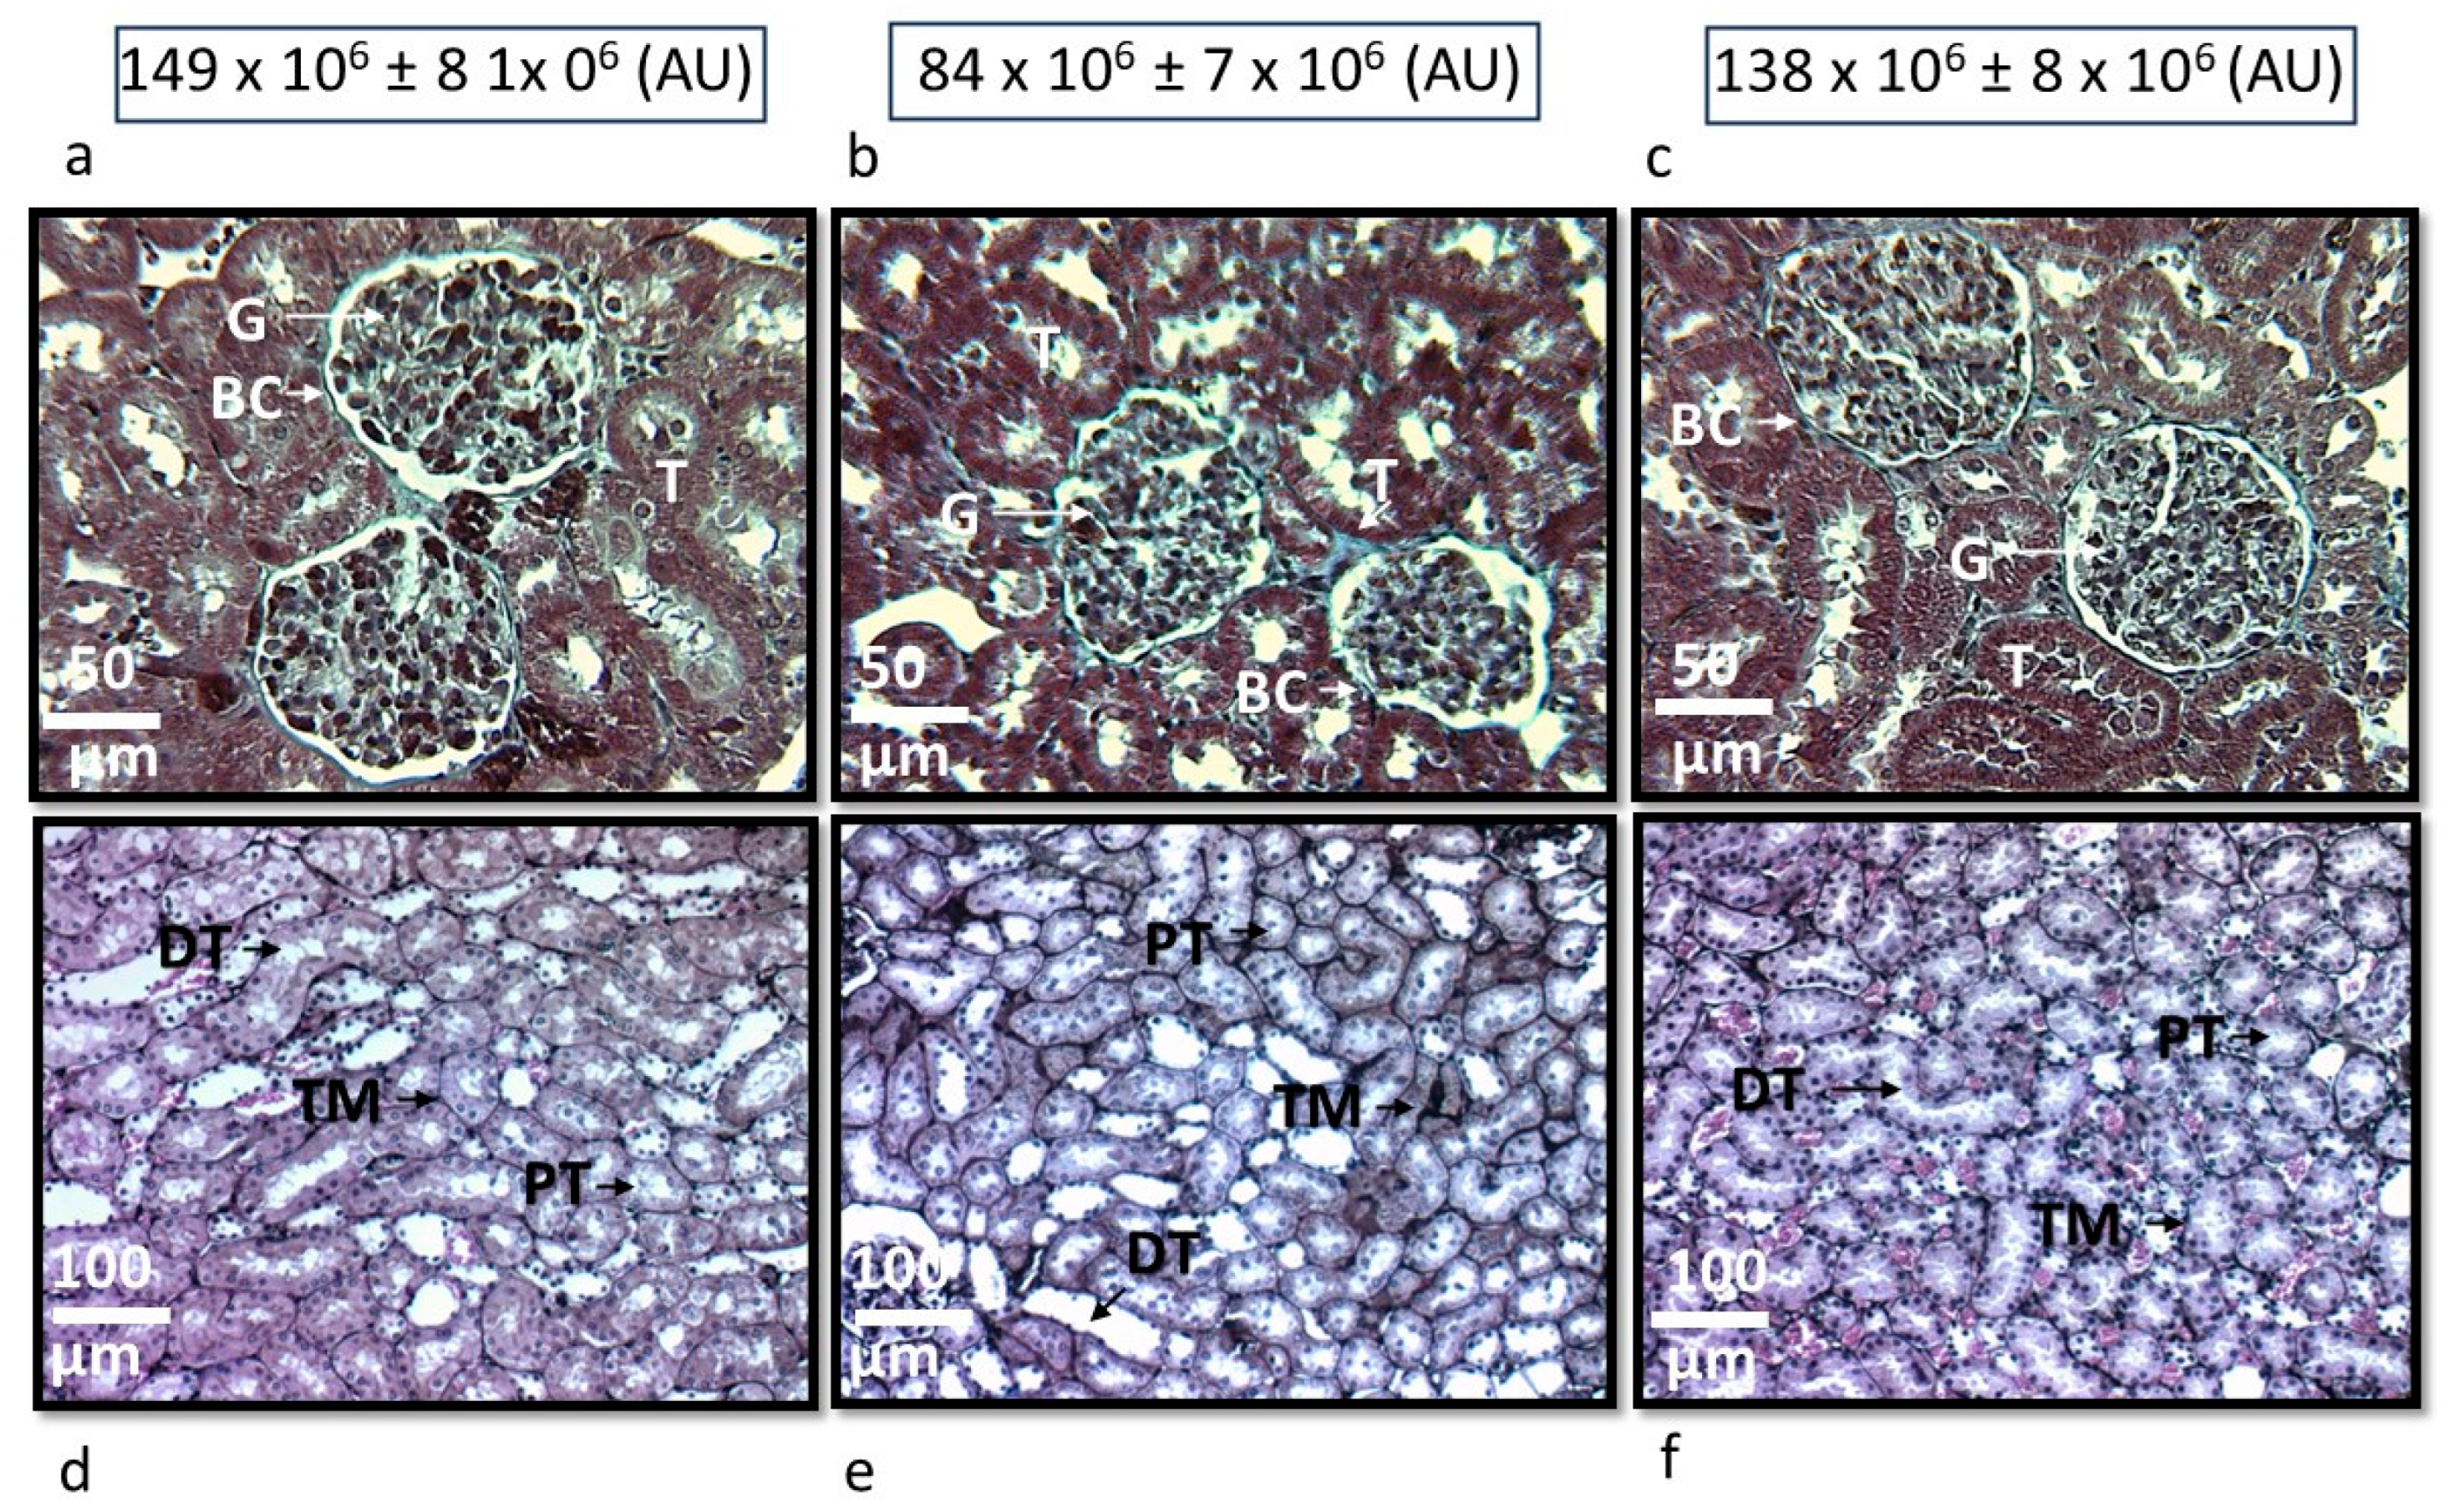
Figure 3.
Representative photomicrographs of the immunolabelling area in the kidney cortex at 12.5×. The panels (a, b and c) show the immunolabelling for CBS in the experimental groups. The panels (d, e and f) show the immunolabelling for CSE. The panels (g, h and i) show the immunolabelling for MST. The panels (j, k and l) show the immunolabelling for GCLC.
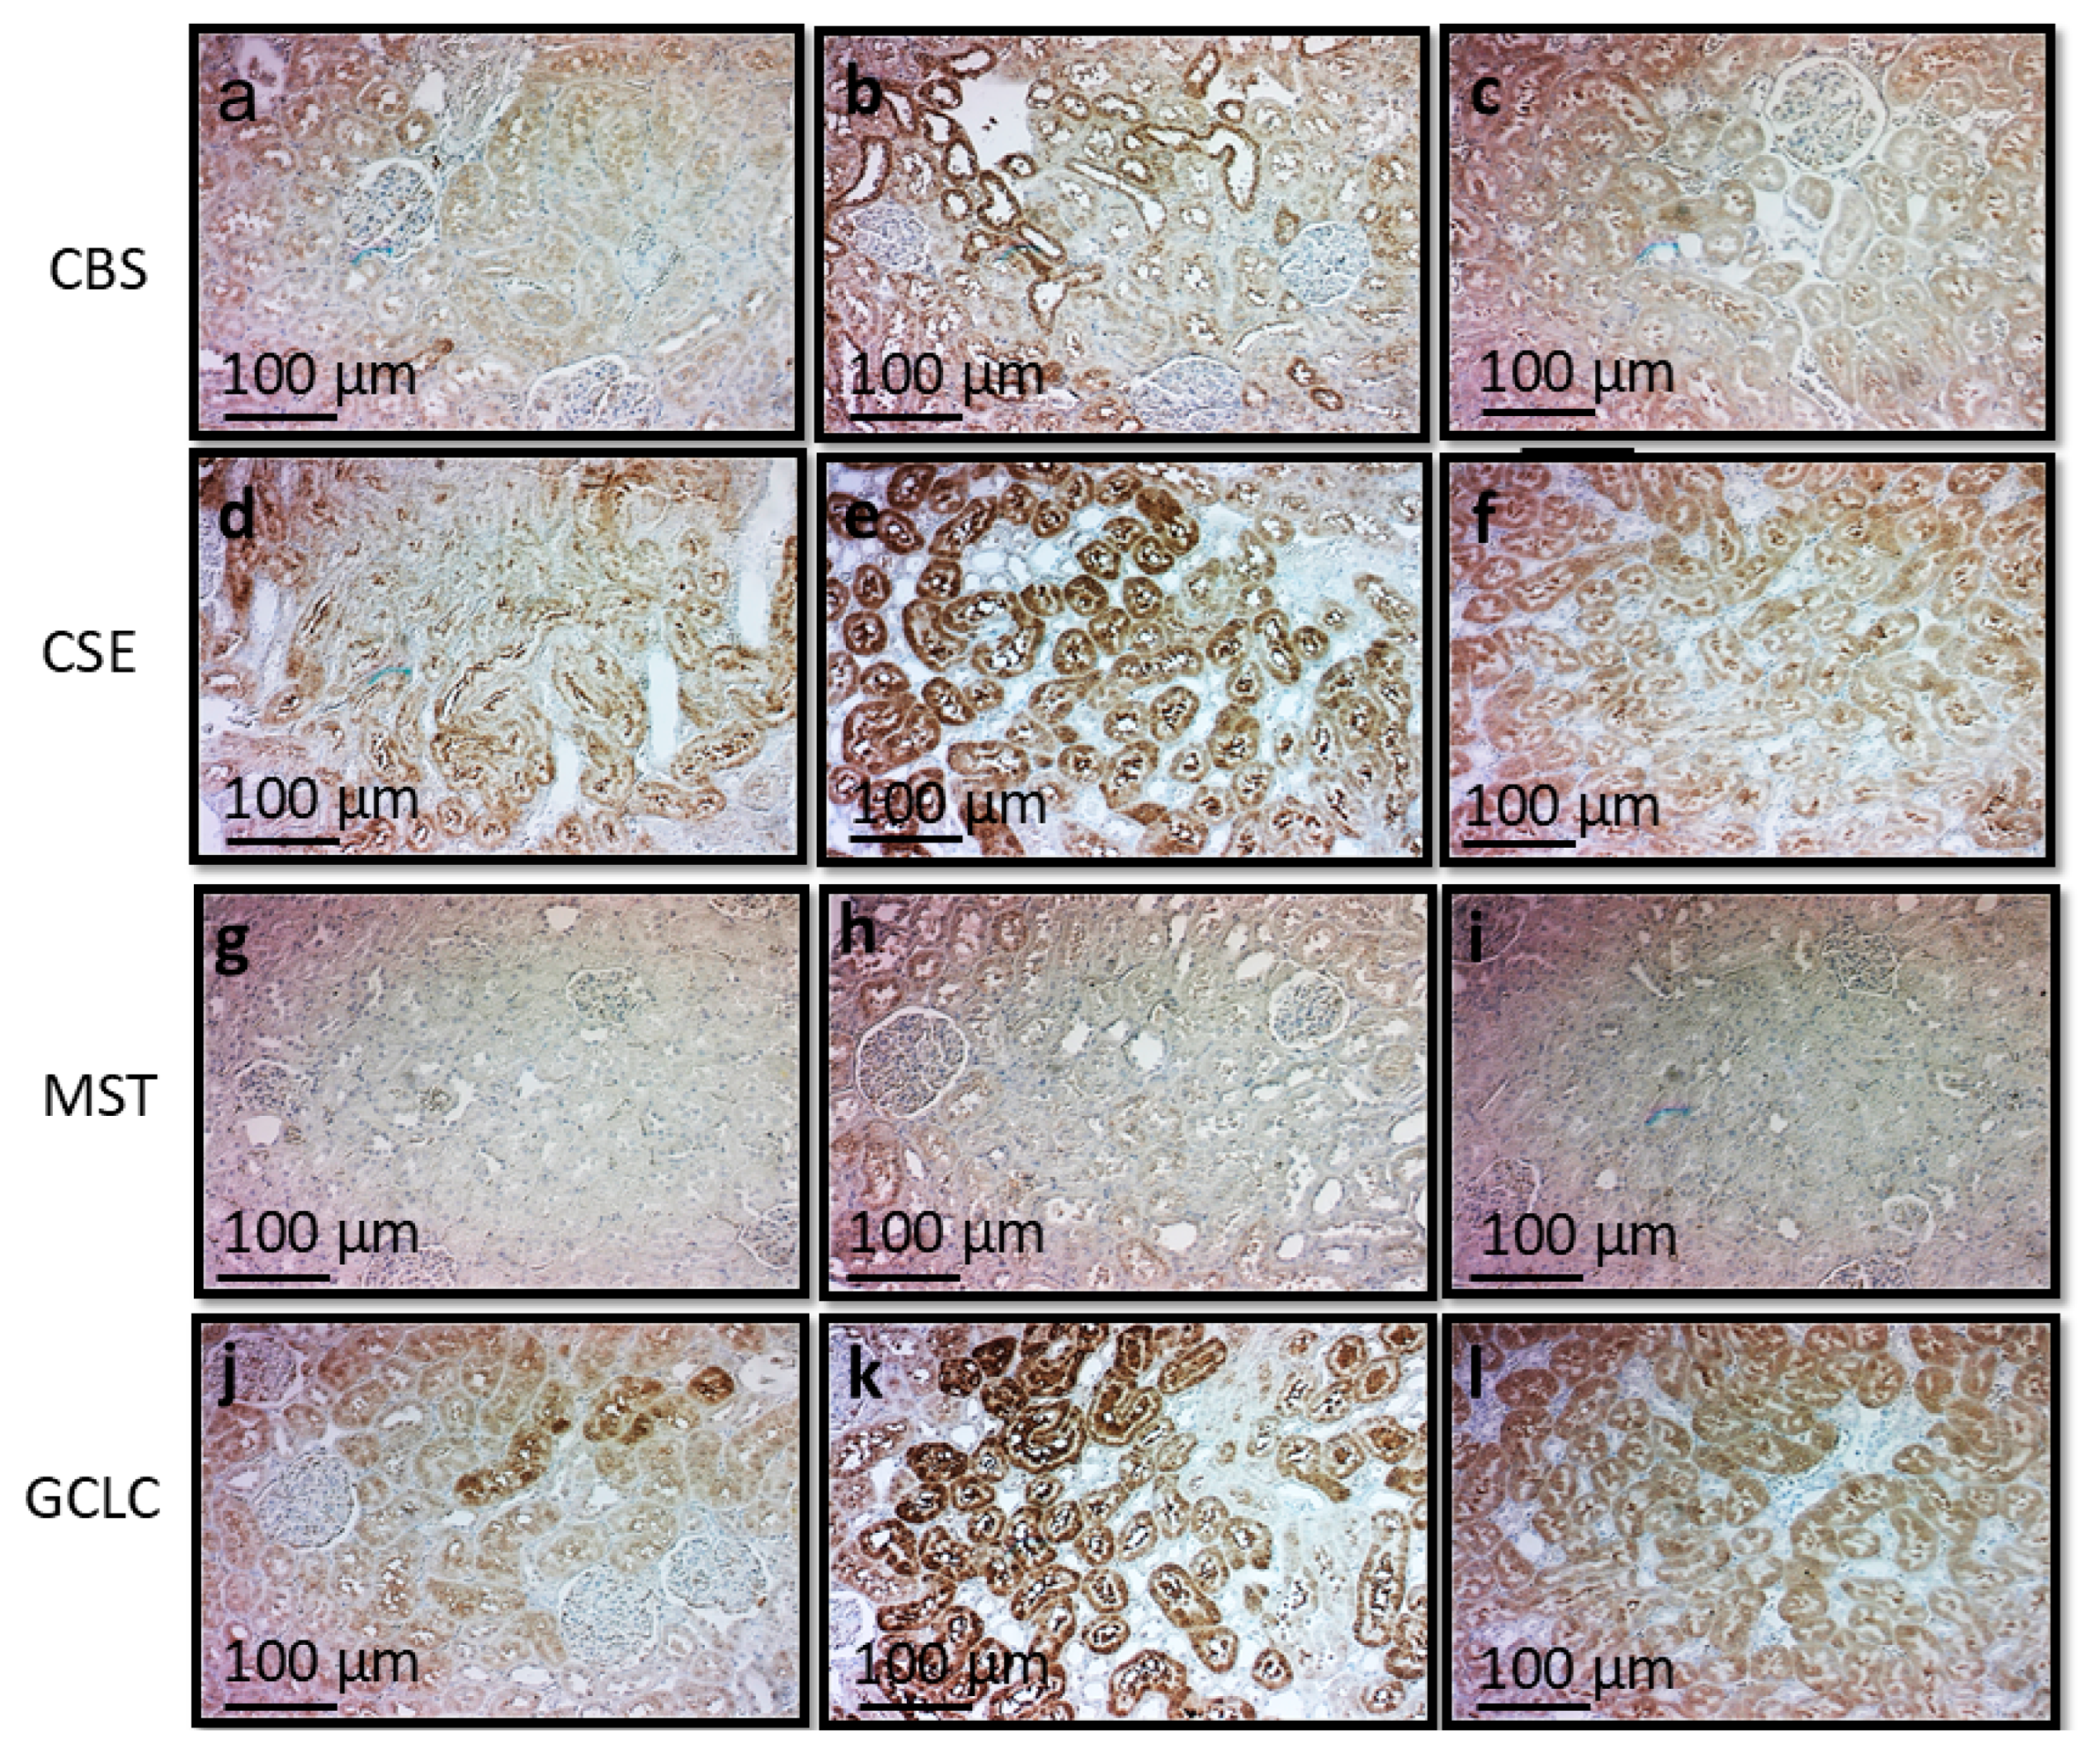
Figure 4.
Immunohistochemistry analysis of areas marked in the kidney cortex on the expression of the enzymes involved in H2S pathway, Panels (a)= CBS, (b)= CSE, (c)= 3MST and (d)= GCLC. Abbreviations: CBS= cystathionine–β–synthase, CSE=cystathionine–γ–lyase, 3-MST= 3–mercaptopyruvate, GCLC= γ-glutamylcysteine synthetase. Data are means ± SE, n=7 each group. AU= Arbitrary units.
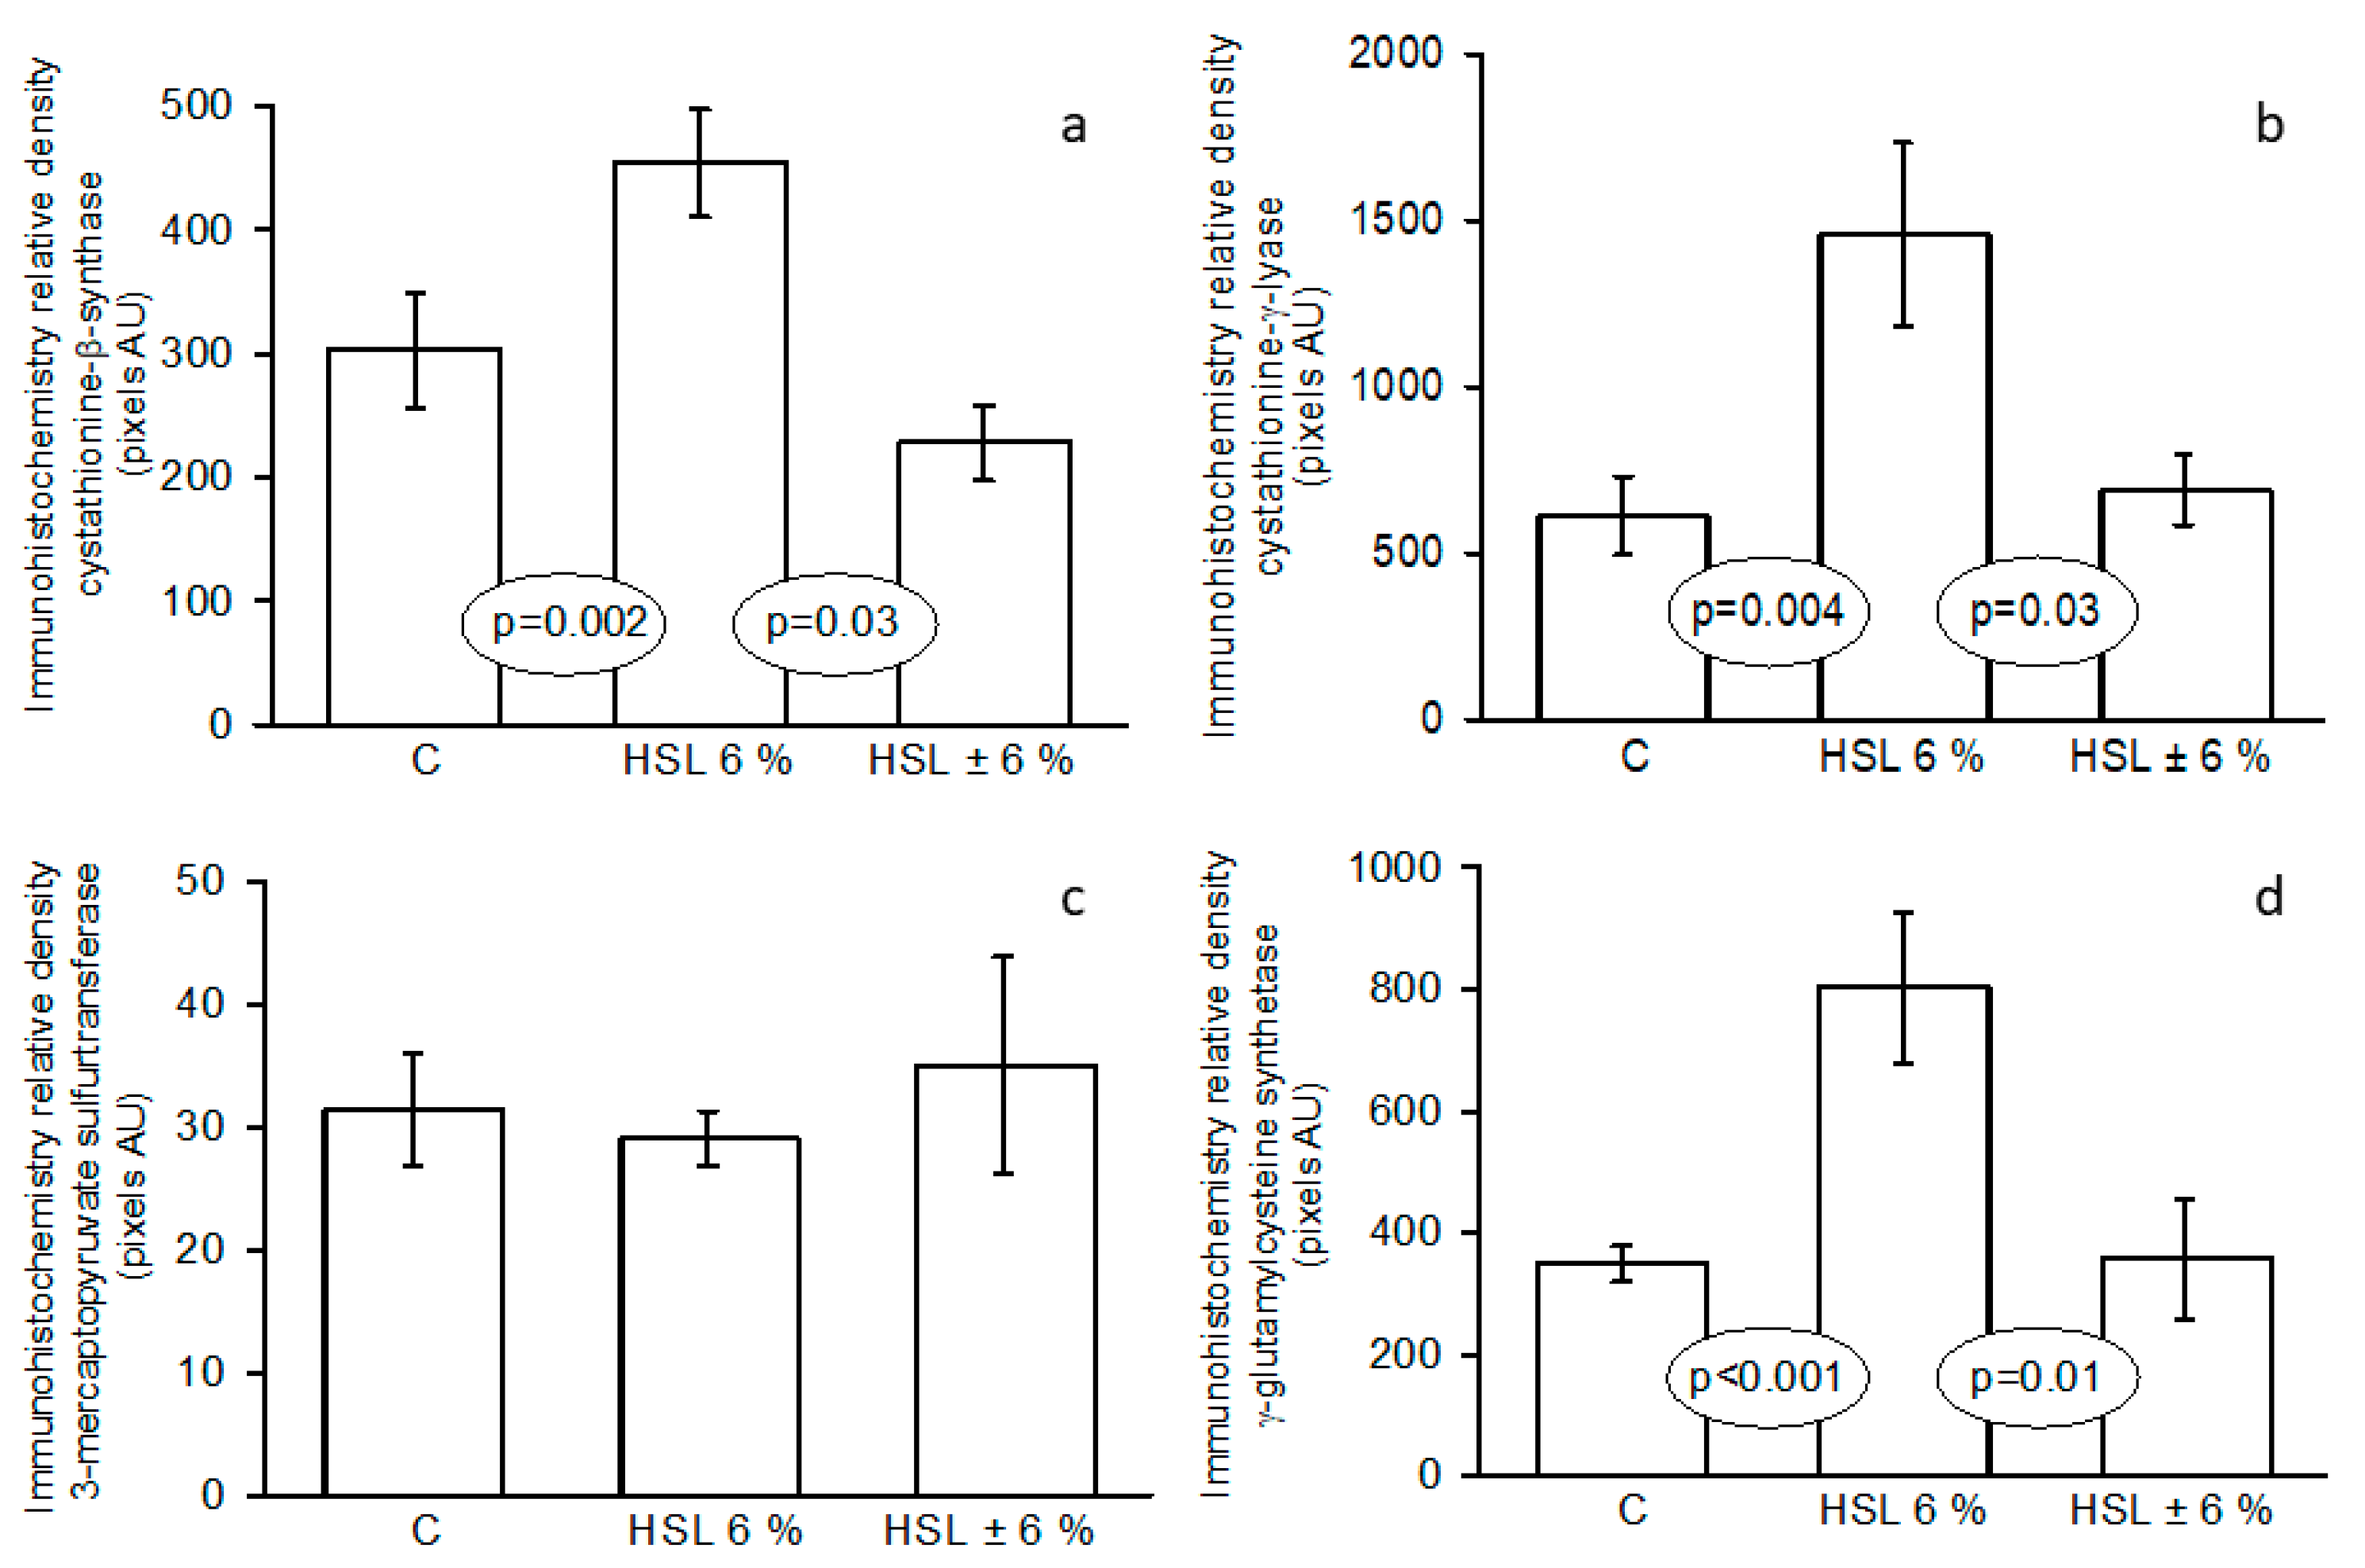
Figure 5.
Representative western blot images that represent the expression of the enzymes involved in H2S synthesis pathway in the three experimental groups. Panels (a)= CBS, (b)= CSE, (c)= 3-MST and (d)= GCLC. Abbreviations: CBS= cystathionine–β–synthase, CSE= cystathionine–γ–lyase, 3-MST= 3–mercaptopyruvate, GCLC= γ-glutamylcysteine synthetase. Data are means ± SE, n=7 each group. AU= Arbitrary units.
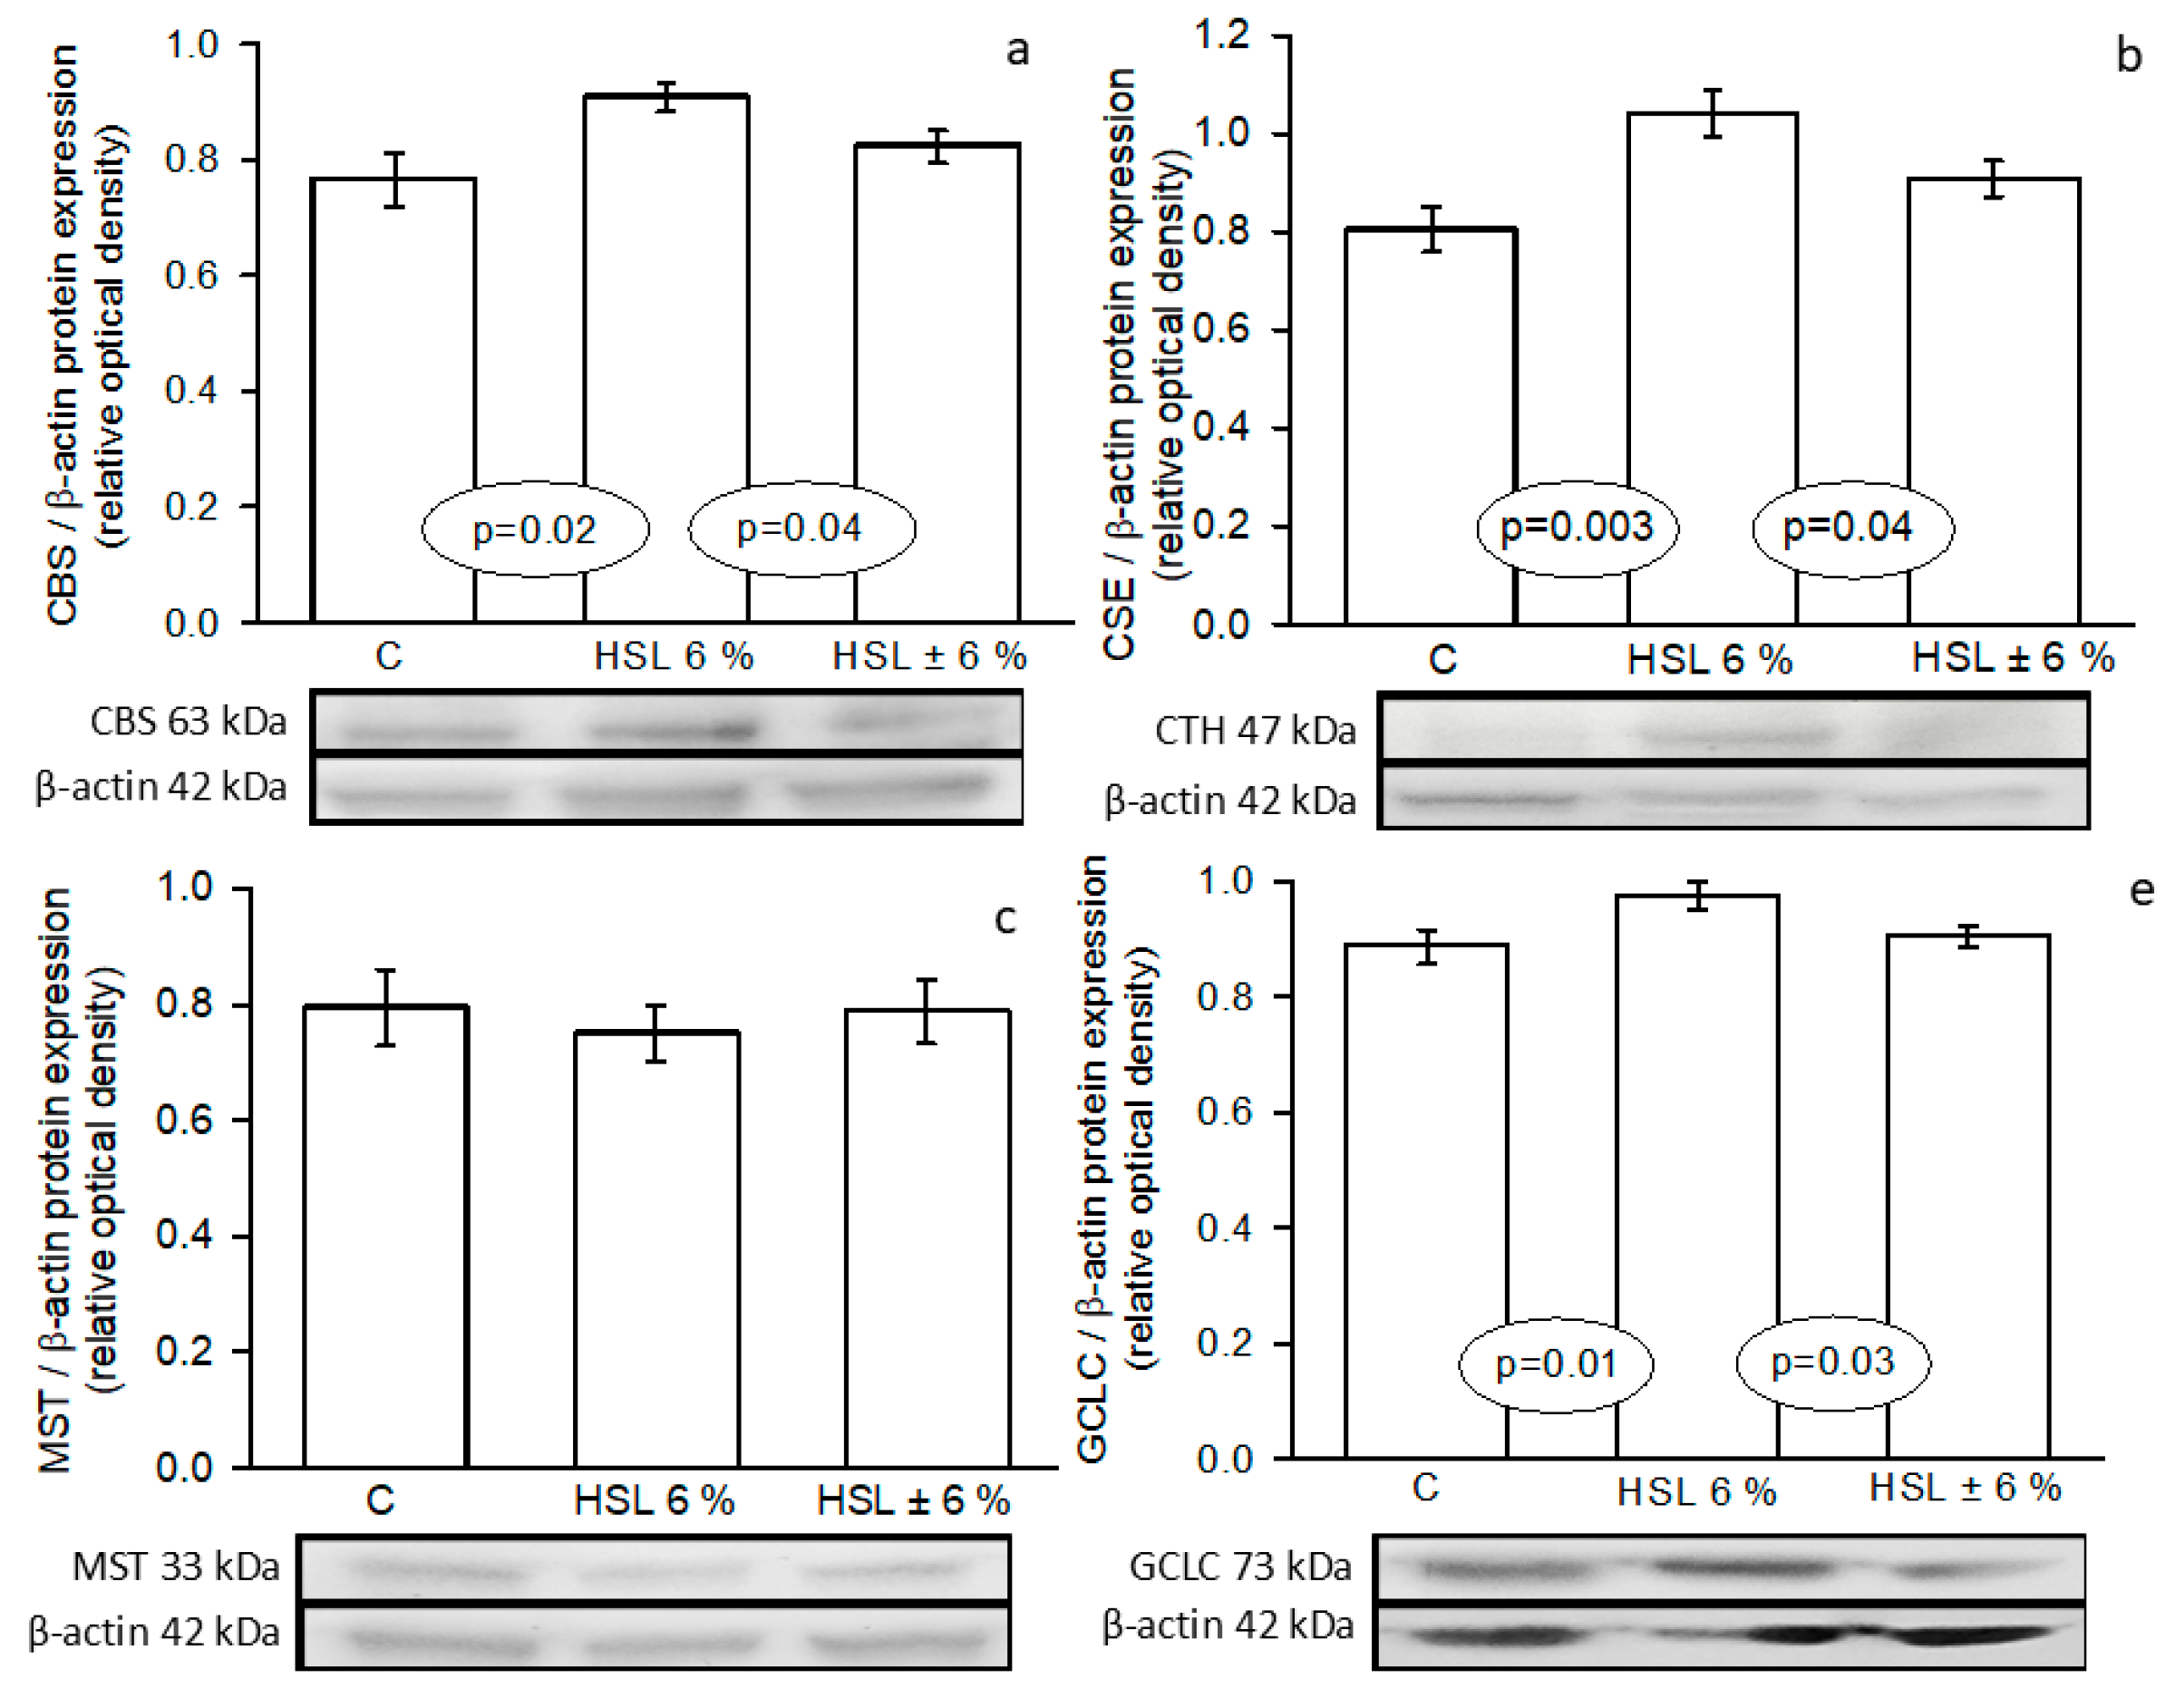
Figure 6.
GSH/GSSG ratio (panel a) and oxidized/reduced thiols ratio (panel b) in the three experimental groups Abbreviations: GSH= reduced glutathione and GSSG= oxidized glutathione, means ± SE, n=7 each group. AU= Arbitrary units.
Figure 6.
GSH/GSSG ratio (panel a) and oxidized/reduced thiols ratio (panel b) in the three experimental groups Abbreviations: GSH= reduced glutathione and GSSG= oxidized glutathione, means ± SE, n=7 each group. AU= Arbitrary units.
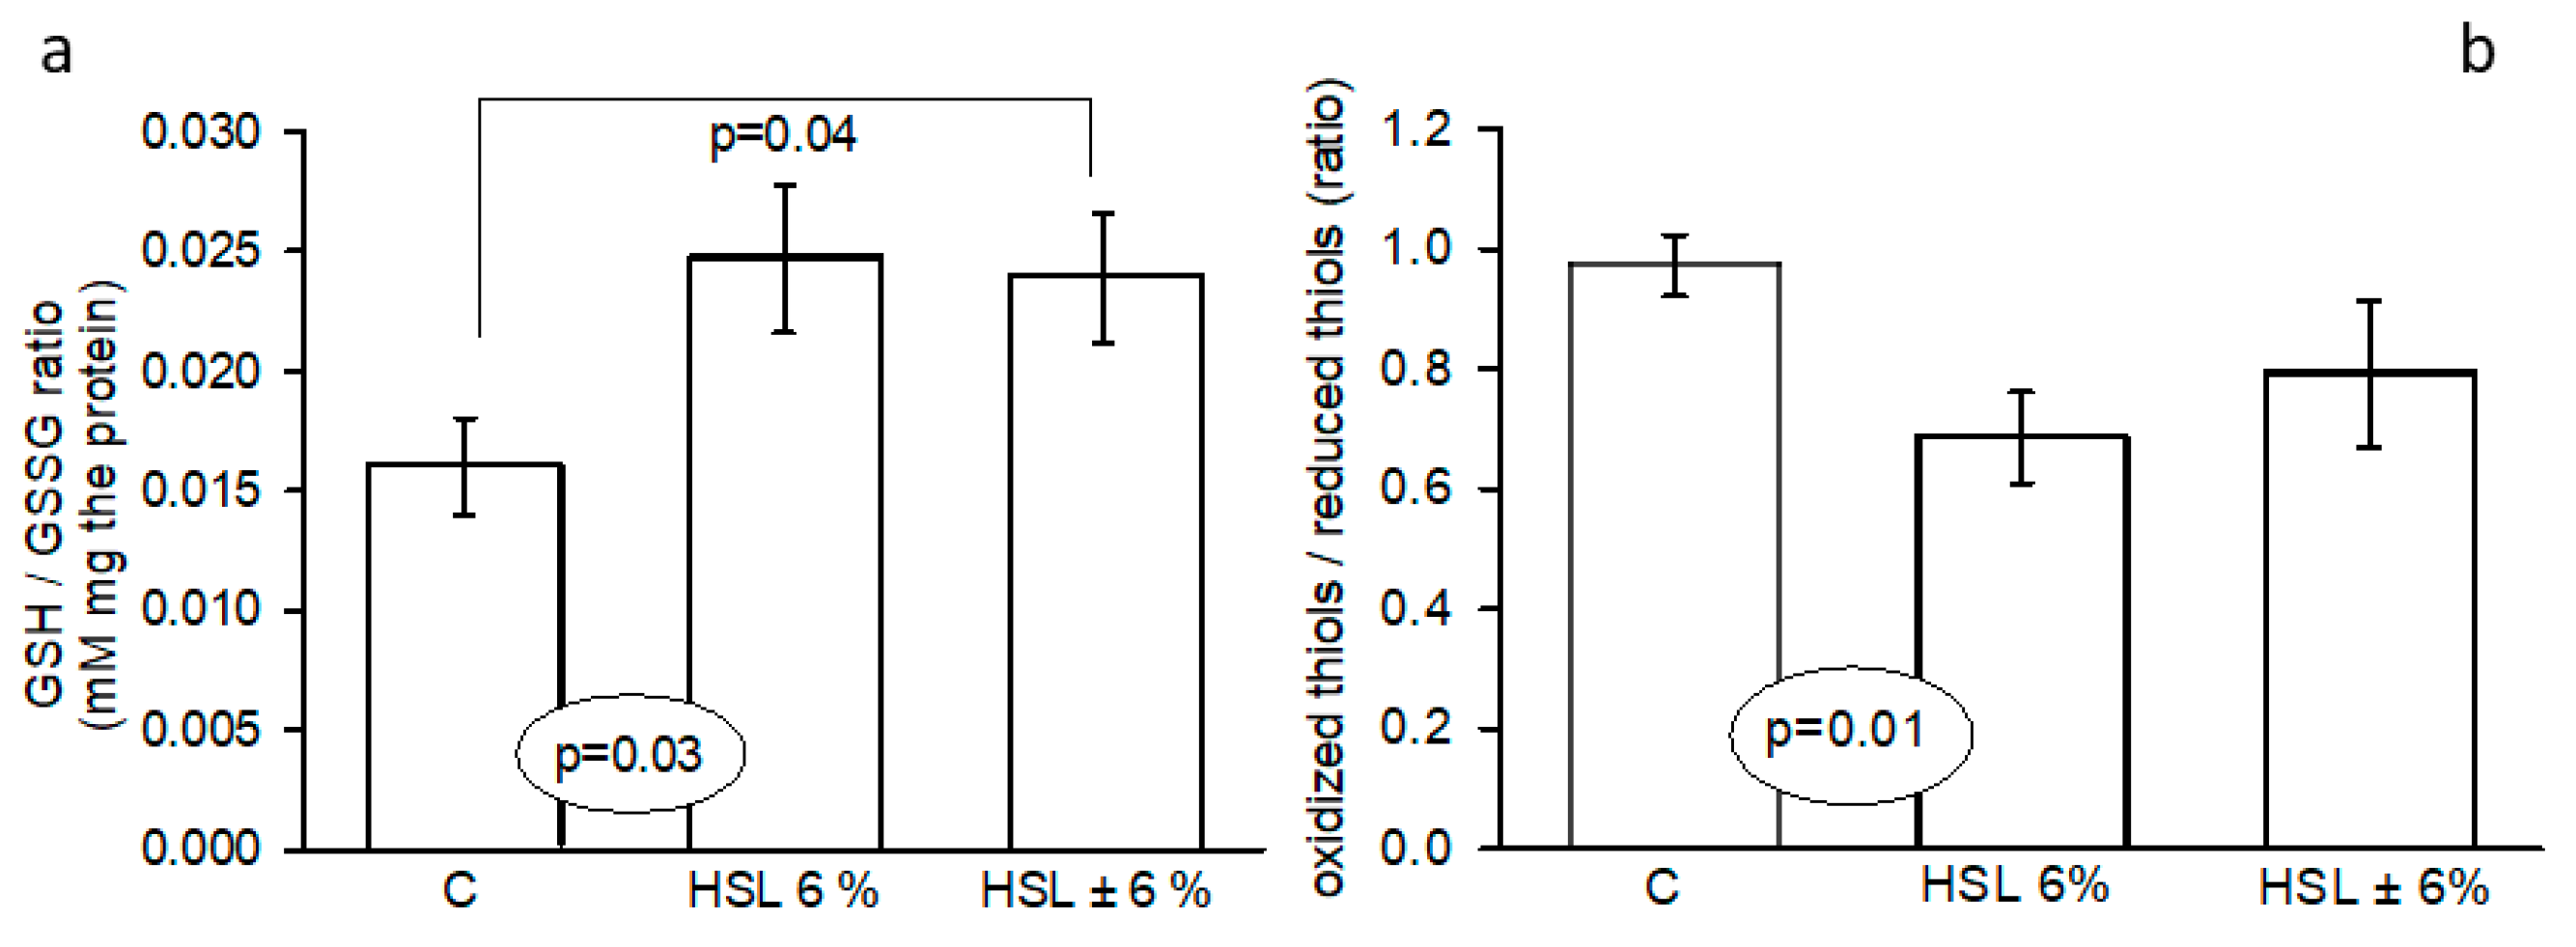
Figure 7.
Representative western blot images that represent the expression of the Nrf2/β-actin and total OXPHOS/ANT ratios in the panels (a and b, respectively) in the kidney homogenate in experimental groups. *C vs. HSL p=0.01, Abbreviations: CI= NADH dehydrogenase β subcomplex 8 of complex I, CII= Succinate dehydrogenase β of complex II, CIII= cytochrome b-c1 complex subunit 2 of complex III, CIV= cytochrome coxidase subunit 1 of complex IV and ATP synthase subunit alpha of complex V. Nrf2= nuclear transcription factor erythroid related factor, means ± SE, n=7 each group. AU= Arbitrary units.
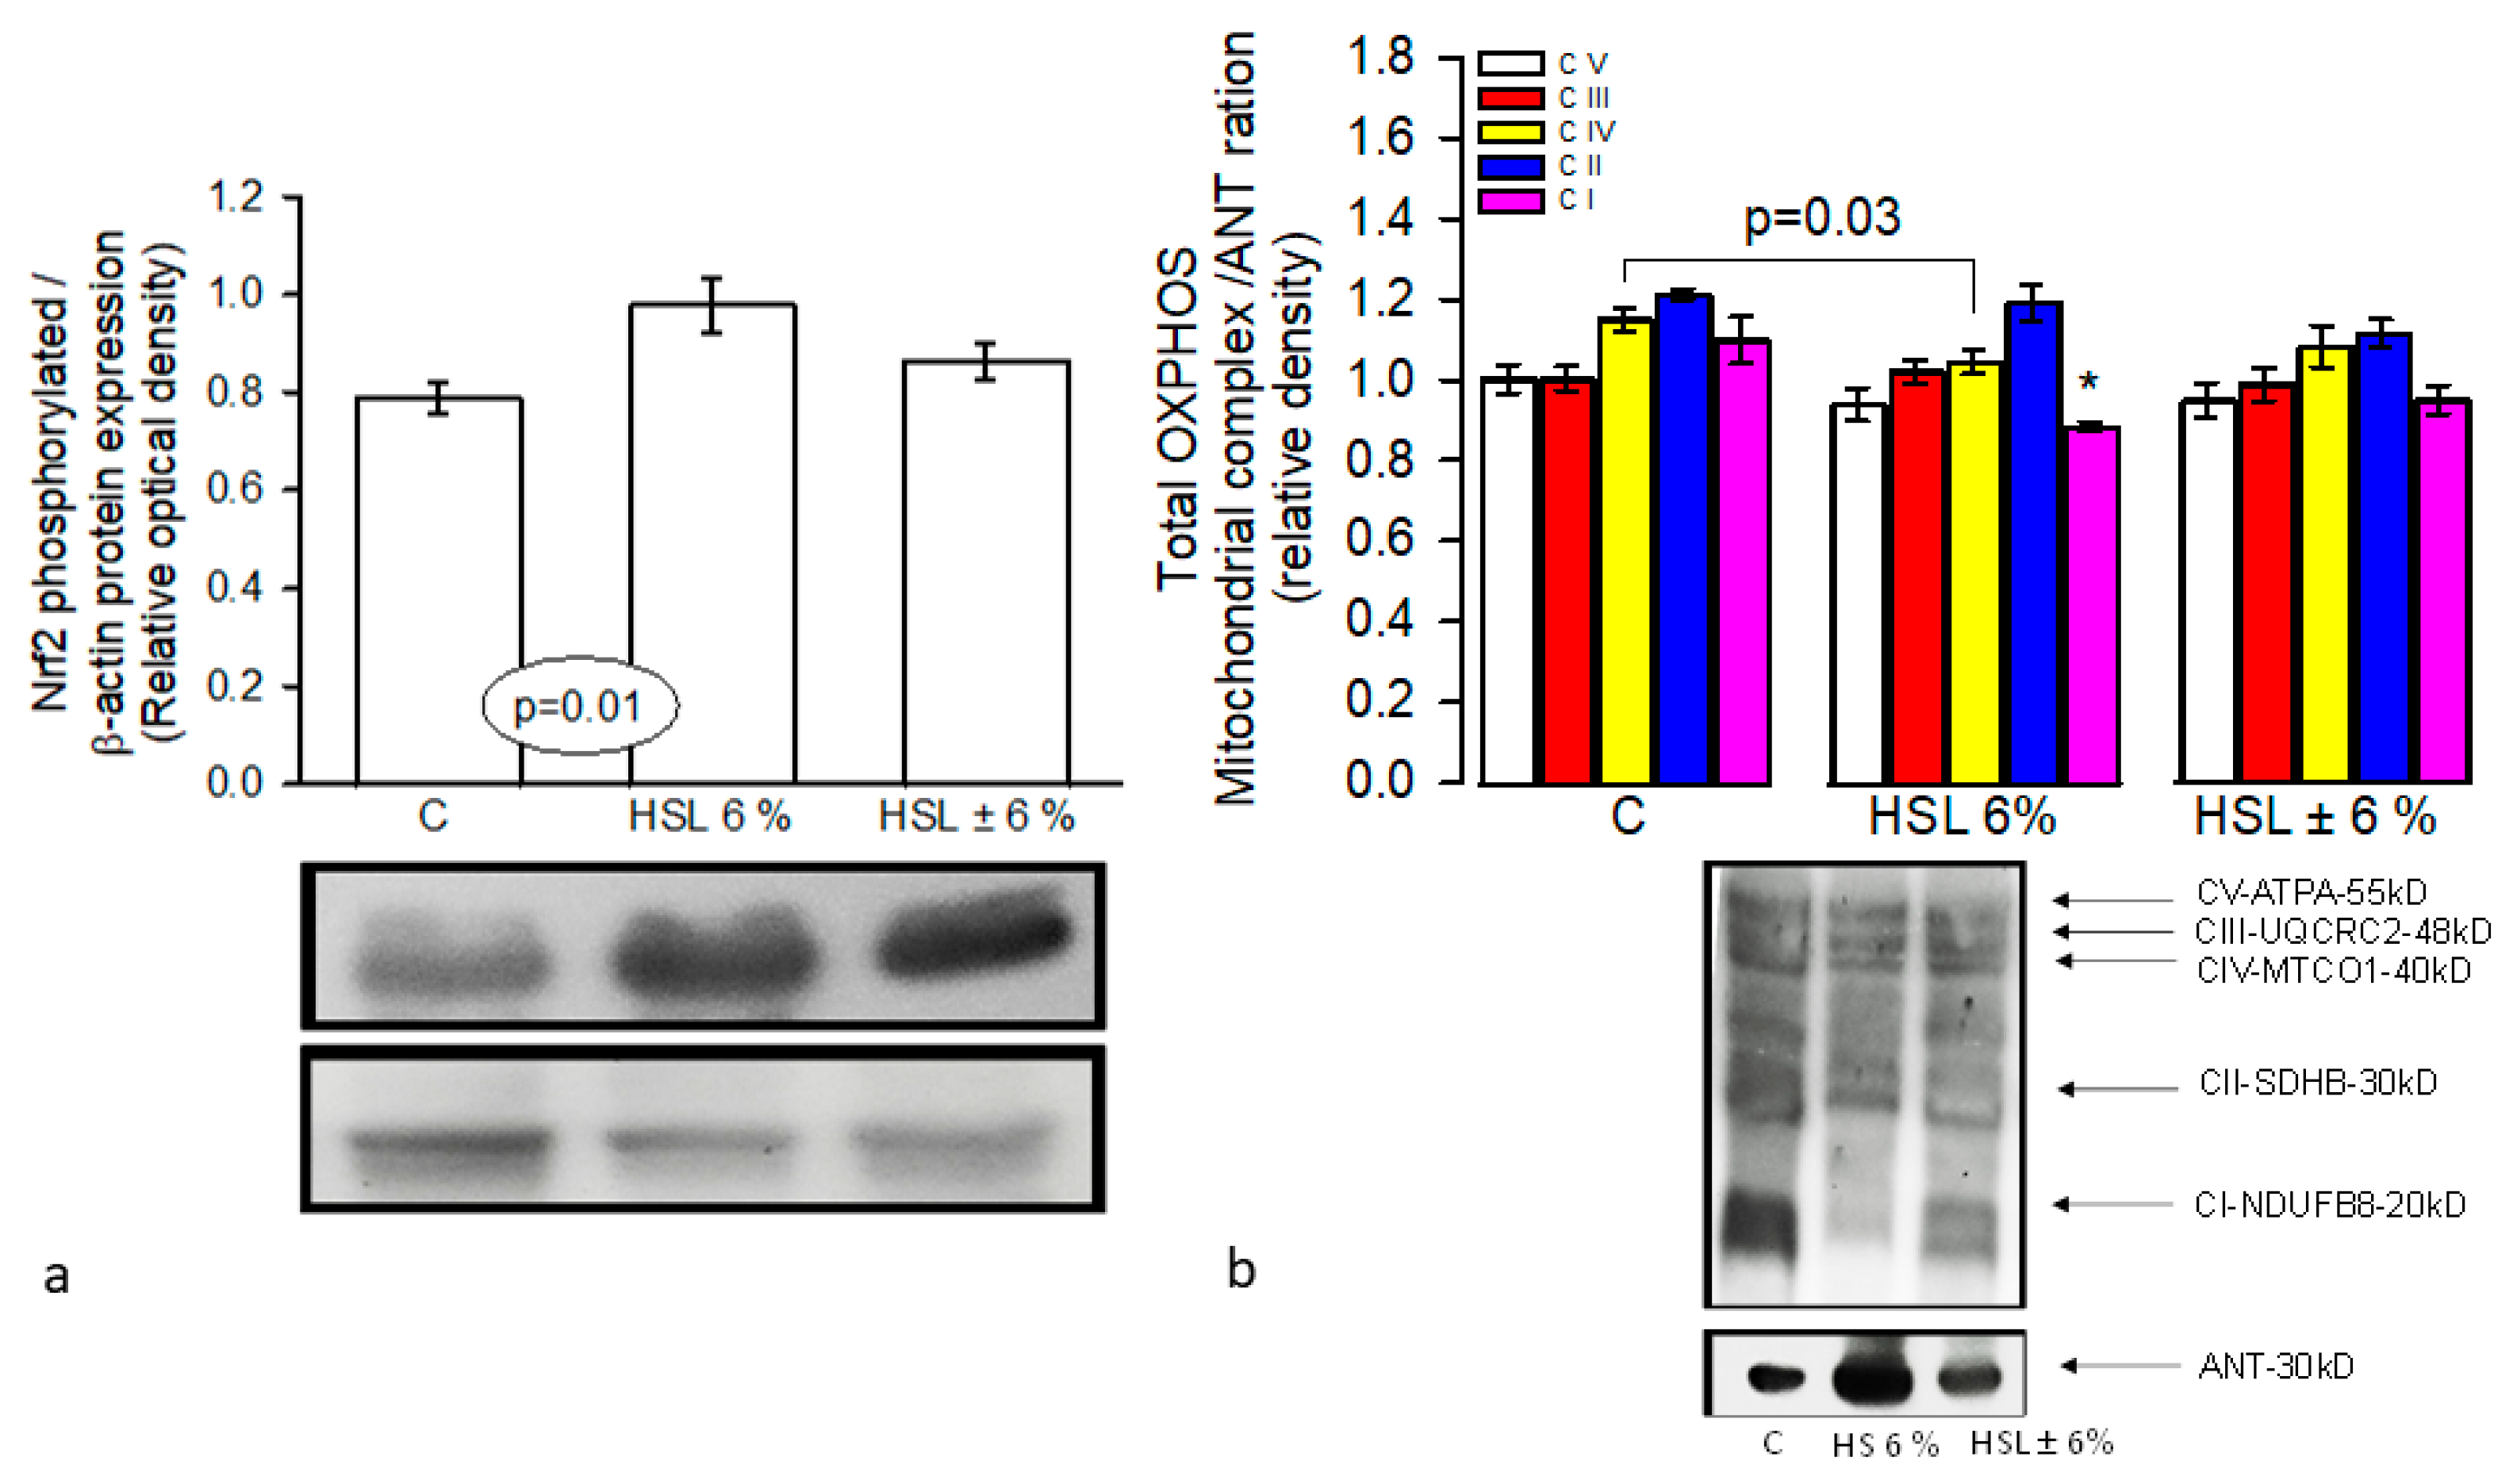

Table 1.
General characteristics and renal function markers in the groups of rats included inf the experimental groups.
Table 1.
General characteristics and renal function markers in the groups of rats included inf the experimental groups.
| Variables | C | HSL 6% | HSL± 6% |
| Body weight (g) | 351.2 ± 53.3 | 368.1 ± 36.9 | 348.1 ± 19.3 |
| Drinking water (mL/24 h) | 21.8 ± 8.9 | 13.7± 2.6** | 20.0 ± 5.9 |
| SBP (mmHg) | 124.2 ± 2.2 | 142.4± 4.9** | 122.9 ± 2.6 |
| Right kidney weight (g) | 1.1 ± 0.02 | 1.1 ± 0.04 | 1.1 ± 0.05 |
| Urine (mL/24 h) | 20.14 ± 4.1 | 9.2± 1.3* | 18.2 ± 3.1 |
| CCr (mL/min) | 0.79 ± 0.05 | 0.05± 0.01** | 0.07 ± 0.01 |
| Albuminuria (mg/mL) | 0.76 ± 0.06 | 1.14± 0.08** | 0.80 ± 0.08 |
*C and HSL ± 6% vs. HSL 6% p=0.01, **C and HSL ± 6% vs. HSL 6% p=0.001, Abbreviations: CCr= Creatinine clearance, SBP= Systolic blood pressure. Data are present as the mean ± SE, n= 7 per group.
Disclaimer/Publisher’s Note: The statements, opinions and data contained in all publications are solely those of the individual author(s) and contributor(s) and not of MDPI and/or the editor(s). MDPI and/or the editor(s) disclaim responsibility for any injury to people or property resulting from any ideas, methods, instructions or products referred to in the content. |
© 2026 by the authors. Licensee MDPI, Basel, Switzerland. This article is an open access article distributed under the terms and conditions of the Creative Commons Attribution (CC BY) license (http://creativecommons.org/licenses/by/4.0/).
Copyright: This open access article is published under a Creative Commons CC BY 4.0 license, which permit the free download, distribution, and reuse, provided that the author and preprint are cited in any reuse.


