
Submitted:
26 June 2025
Posted:
27 June 2025
You are already at the latest version
Abstract
Reductive stress (RS) results from the overactivity of the enzymatic and non-enzymatic antioxidant systems and from excess antioxidant agents that neutralize reactive oxygen species. Hibiscus sabdariffa Linnaeus (HSL), is a natural source of antioxidant molecules which can overload the antioxidant system. Twenty-one Wistar rats were divided into three groups: G1: rats that consumed 6% HSL infusion for one month (HSL + 6 %), G2: rats that consumed 6 % HSL infusion for one month and were then given natural water for another month (HSL ± 6%), and G3: rats with natural drinking water (C). Renal vascular resistance (RVR) was evaluated through the responses to norepinephrine (Ne), acetylcholine (Ach), O2–, H2O2 and ONOO–. The activity of antioxidant enzymes and oxidative stress markers were evaluated in the kidney. RVR was increase by Ne and H2O2 (p=0.03), but it was decreased by Ach, O2–and ONOO– (p=0.01). GSH/GSSG and nitrates/nitrites, the total antioxidant capacity, and the activities of SOD, catalase, peroxidases, GPx, GR, glucose-6-phosphate, and the Nrf2 expression were increased (p≤0.04). However, thiol groups, adenochrome, and glutathione-S-transferase were decreased (p=0.01) in the G1 vs. G2 and G3. Excessive consumption antioxidants provided by 6 % HSL infusion results in RS contributing to decrease ROS.
Keywords:
HSL
; reactive oxygen species
; antioxidant enzymes
; reductive stress
; kidney
; reducing couples
1. Introduction
Redox balance is essential for maintaining cellular homeostasis and while moderate production of reactive oxygen species (ROS) leads to beneficial effects since these molecules act as second messengers [1], overproduction leads to oxidative stress (OS). However, decreased ROS, excessive antioxidant molecules and/or overproduction of enzymatic and non-enzymatic antioxidant systems could lead to reductive stress (RS) with pathological consequences [2].
The super oxide anion (O2–) is a ROS that is formed by the univalent reduction of O2 through various enzymes within the cell [3]. Once formed, it rapidly dismutates to H2O2 by enzymatic and non-enzymatic mechanisms. H2O2 is capable of easily crossing cell membranes in high levels (generally ≥50 μM) and it is cytotoxic in culture cells [4]. The rate of the reaction that produces it is limited only by the diffusion coefficient of the molecule in the presence of SOD isoforms. Intracellular H2O2 levels are tightly regulated by different enzymes responsible for oxidizing it into water and molecular O2, such as catalase (CAT), glutathione peroxidase (GPx) and peroxidases [5,6]. The O2– that does not dismutate is less reactive with proteins, DNA and lipids, and it mainly reacts with nitric oxide (NO) to form peroxynitrite (ONOO–) and with transition metals. Therefore, it practically only reacts with proteins containing iron-sulfur centers [5]. However, H2O2 is more stable than O2– and the hydroxyl radical (OH–). OH–which has a very short half-life (approximately 1x10⁻⁹ s) is formed from H2O2 when it reacts with a transition metal, usually iron and it is considered as a very toxic molecule [5,6]. In addition, other ROS include peroxynitrites (ONOO–), alkoxyl radical (RO•), peroxy radical (ROO•), hypochlorous acid (HOCl–), nitric oxide (NO) and nitric monoxide (•ON), which are generated in peroxisomes, the plasma membrane, the endoplasmic reticulum and the cytoplasm [7].
The moderate production of ROS is important in different metabolic pathways because they act as second messengers regulating post-translational modification of protein conformation, the stability and activity of proteins and they intervene in cellular function, thus modulating cellular function [8]. In this sense, NO and •ON act as messenger molecules that contribute to aortic vasodilation [9]. H2O2 modulates signal transduction by reversible oxidation of cysteines that have redox activity [10]. Moreover, H2O2 can activate at least 40 gene products in mammalian cells [11]. Furthermore, the non-cytotoxic level of ROS (pico molar concentrations) is ensured by enzymatic and non-enzymatic antioxidant systems, which participate importantly in the homeostasis of cellular redox processes [12]. If the redox balance is modified by 30 millivolts, it will represent a 10-fold change between the proportion of reducing species, such as the GSH/GSSG ratio vs. pro-oxidants such as O2– [13].
RS is characterized by an excess of reducing equivalents in the form of redox couples such as reduced nicotinamide adenine dinucleotide/oxidized nicotinamide adenine dinucleotide (NADPH+/NADP+), NAD+/NADH+, and GSH/GSSG or the overexpression of antioxidant enzyme systems which can deplete ROS [14]. In this regard, excess reducing equivalents decrease cell growth, induce alteration in the formation of disulfide bonds between proteins, reduce mitochondrial function, decrease cellular metabolism and contribute to the development of some diseases that are closely associated with inflammatory conditions such as protein aggregation cardiomyopathy, hypertrophic cardiomyopathy, muscular dystrophy, pulmonary hypertension, rheumatoid arthritis, cancer and metabolic syndrome, among others [14,15]. Also, chronic RS can induce OS by positive feedback regulation [14]. NADPH+ is a cofactor responsible for donating protons in various reactions catalyzed by enzymes. The NADH+ overproduction puts pressure on mitochondrial complex I, which responds within its capacity to oxidize and convert NADH+ to NAD+. This event causes increased electron leakage and consequently decreases the oxygen available to produce O2–. However, elevated NADH+ levels favor an oxidizing environment but also achieve the transition to RS via the polyol pathway (PPP) [14]. This pathway is an alternative route of glucose metabolism, where the conversion of glucose to glucose-6-phosphate by glucose-6- dehydrogenase (G6PD) depends exclusively on the available concentration of unphosphorylated glucose [16]. In addition, nuclear factor erythroid-derived 2 (Nrf2) is involved in signaling the transcription of antioxidant enzymes [17] such as the super oxide dismutase isoforms (SOD), glutathione-s-transferase (GST), GPx, and glutathione reductase (GR) [18,19]. Despite the above, RS is a poorly explored field of study.
Regarding the enzymatic anti-oxidant system, SOD isoforms are metalloenzymes because they utilize metal cofactors, catalyzing the reduction of the free radical O2– to O2 and H2O2. SOD isoforms are classified according to their metal cofactors and location, being divided into copper-zinc (Cu-Zn) SOD located in the cytoplasm, manganese (Mn) SOD located in the mitochondria, and extracellular (-ex) SOD in the plasma [20].
The enzymatic antioxidant system also comprises, enzymes that use selenium (Se) as a cofactor. One of them is the GPx which catalyze the reduction of H2O2 and/or organic hydroperoxides to water or alcohol, respectively, using GSH as the reducing agent. Each GPx isoform is distributed at different cell sites [21]. Another enzyme is thioredoxin reductase (TrxR), which is responsible for reducing thiol groups between protein cysteines and of provide electrons to thiol-dependent peroxidases using NADPH+ as a cofactor [22,23,24]. It is located in different cellular sites, as the nucleus and mitochondria [25]. Another enzyme is GST which is involved in the detoxification of xenobiotics and in protection against damage caused by peroxides. It catalyzes the ionization of GSH to the nucleophilic thiolate anion (GS-), which is capable of spontaneously reacting with closely related nucleophilic components, followed by substrate conjugation. This conjugation increases the solubility of the product, facilitating its excretion from the cell [26]. GR is a flavoprotein that catalyzes the reduction of GSSG to GSH. It is a critical molecule in the defense against OS by maintaining the reducing environment of the cell. It is necessary to regenerate GSSG to GSH, allowing GSH to be reused by other enzymes such as GPx and GST. A decrease in the activity of this enzyme leads to a decrease in GSH and the accumulation of GSSG [27]. Other enzymes that no are Se proteins but utilized to H2O2 are the peroxidases that decompose various hydroperoxides (ROOH mainly H2O2) to oxidize organic and inorganic substrates [28]. CAT, another member of the enzymatic antioxidant system, is involved in the destruction of H2O2. This enzyme is characterized by its high reactive capacity but relatively low affinity for the substrate and it is located in the kidney [29].
In addition to the enzymatic antioxidant system there is the non-enzymatic antioxidant system which is constituted by a series of compounds that intervene by delaying the production and the action of ROS, and include GSH, flavonoids, resveratrol, and polyphenols among others. GSH is a tripeptide composed of three amino acids: cysteine, glycine, and glutamic acid [30]. It is abundant in the cytosol, nucleus, and mitochondria. It is a soluble antioxidant in cellular compartments and protects cells from oxidative damage to lipids, proteins, and nucleic acids. GSH exhibits synergistic interactions with other antioxidants such as vitamins C and E, and hydrogen sulfide and it acts by trapping OH–, O2–, and ONOO– and by reactivating enzymes that are inhibited at high oxygen concentrations, such as TrxR or GST [31]. In the presence of ROS, GSH is oxidized to GSSG and subsequently reduced by GR to GSH; therefore, the GSH/GSSG ratio is a marker of cellular toxicity. However, this index in redox balance concentrations is essential for some cellular functions such as cell proliferation, differentiation and apoptosis [32]. However, if increased, it could decrease the ROS and favor the RS affecting the cellular pathways described above [14].
On the other hand, Hibiscus sabdariffa Linnaeus (HSL), also known as Jamaica flower, is native to tropical Africa [35], and it is used in gastronomy in various foods such as beverages, sweets, and jams. In traditional medicine is used to treat pyrexia, hypertension, liver damage, kidney diseases, reduces cholesterol and blood pressure. This effect is attributed to its polyphenol content, which includes anthocyanins, protocatechuic acid, epigallocatechin’s, resveratrol, and flavonoids, that protect against the various pathologies [36,37].
In another order of things, the function of the kidney is to remove toxic substances produced by cellular metabolism through glomerular filtration. It also regulates blood pressure, hemodynamics, and the body’s acid-base balance [38]. The fundamental unit of the kidney is the nephron, made up of the renal corpuscles, that integrate the glomerulus, Bowman’s capsule, and the afferent and efferent arterioles [39]. These arterioles present both sympathetic (adrenergic) and parasympathetic (cholinergic) innervation. Sympathetic activity releases norepinephrine (Ne) and it is through adrenergic receptors located in the arteries, that the glomerulus and the renal tubules contribute to vasoconstriction, regulate blood flow, the glomerular filtration rate and the Na+ reabsorption and water. It also stimulates the release of renin in the juxtaglomerular zone that participates in blood pressure and renal perfusion [40]. In contrast, the parasympathetic system through the secretion of acetylcholine (Ach), activates eNOS, which generates NO, that acts on soluble guanylate cyclase decreasing both afferent and efferent arterial resistance, being one of the physiological mechanisms of renal vasodilation [41,42]. Therefore, having mentioned the above, there is justification for the evaluation of whether a decrease in ROS could lead to RS since this condition is associated with increased redox equivalents and/or overexpression of the enzymatic and non-enzymatic antioxidant system. The chronic consumption of HSL is a natural source of antioxidants that could promote overexpression of the enzymatic and non-enzymatic antioxidant system and decrease ROS.
Therefore, the aim of this study was to evaluate the effect of chronic consumption of a 6 % HSL infusion on the potential alteration of the enzymatic and non-enzymatic antioxidant system associated with probable renal damage and the possible RS generation in male Wistar rats.
2. Materials and Methods
2.1. Rat Groups
The study was designed and carried out in compliance with the Laboratory Animal Care Committee of the National Institute of Cardiology Ignacio Chávez (INC/CICUAL/009/2023) approved for experiments in animals. Experiments were conducted in compliance with the Guide for the Care and use of laboratory animals of the National Institutes of Health (NIH). Twenty-one male Wistar rats were used to form 3 groups with 7 animals each, as follows: Group 1: rats that received an ad libitum infusion HSL to 6% for one month (HSL 6%). Group 2 rats received ad libitum infusion HSL to 6% for one month, after which they were removed and given tap water for another month (HSL ± 6%). Group 3 rats received plain tap water ad libitum for one month (C). The animals were housed for 4 weeks under the following conditions: a 12-hour light/12-hour dark cycle, ambient temperature, and relative humidity ranging from 18–26°C and 40–70%, respectively. The commercial food the rodents consumed was solid rodent kibble supplemented with 23% crude protein, 4.5% crude fat, 6% crude fiber, 8% ash, and 2.5% minerals (Labdiet 5008; PMI Nutrition International, Richmond, IN) ad libitum.
2.2. Preparation of the HSL Infusion
60 g of HSL calyces were added to one liter of boiling water. It was kept boiling for 10 min, allowed to cool and filtered. This solution was provided ad libitum to the rats.
2.3. Systolic Blood Pressure Measurement and Urine Collection
At the end of treatment and before euthanizing the animals, SBP was measured using a plethysmograph (Narco Bio-system). Before euthanasia, the rats were weighed and placed in metabolic cages after fasting for 24 hours. Urine was collected and stored at –30°C. The presence of albuminuria was subsequently determined using the bromocresol green method, and urinary creatinine (UCr) and serum creatinine (SCr) concentrations were determined to calculate creatinine clearance (CCr) [43].
2.4. Quantification of Renal Function
Blood was obtained directly from the aorta prior to performing the isolated and perfused kidney technique. It was centrifuged at 3,000 rpm for 20 min at 4°C. Serum was obtained. SCr and UCr levels were determined. Using the collected 24-hour urine volume, UCr clearance was calculated using the following formula: CCr= (SCr/UCr (Urine Volume)/1440 min.
2.5. Isolated and Perfused Kidney
Rats were anesthetized by an intraperitoneal injection of sodium pentobarbital (63 mg/kg of body weight). The right kidney was exposed via a midline laparotomy, and the mesenteric and renal arteries and surrounding tissue were cleared. The right renal artery was cannulated via the mesenteric artery to avoid interruption of blood flow, and the kidney was removed, suspended, and perfused at a constant flow rate using a peristaltic pump (MasterFlex Easy-load II, no. 77200-50; Cole-Parmer Instrument Co., Vemon Hills, IL, USA) at 37°C and oxygenated with 95% O2 and 5% CO2 with Krebs solution at pH 7.4. The basal perfusion pressure (PP) was adjusted to 80–90 mmHg. The average flow rate of the perfusion solution was 8–9 mL/min. PP was measured with a transducer (Grass Telefactor, Grass Technologies, Astro Med, West Warwick, RI), coupled with a Grass model 79D polygraph and online software (Grass PolyView). Data are expressed as changes (Δ) in PP in millimeters of mercury (mmHg). After at least 15 min of perfusion and once a stable Δ-PP was obtained, vasoconstrictor responses to Ne and vasodilator responses to Ach were determined, both of which were given at intervals long enough to allow Δ-PP to return to baseline (between 75 and 90 mmHg). The bolus sequences and concentrations were: 20 μM Ne and 20 μM Ach, 2 μM potassium superoxide (KO2), 1.7 μM hydrogen peroxide (H2O2), and 0.75 μM peroxynitrite (ONOO–). Changes in PP due to Ne, Ach, and ROS were calculated by taking the mean of the pulsatile tracings before administration and the mean of the tracings at the peak Δ-PP value after administration. Data are expressed as changes in Δ-PP in mmHg. After each infusion bolus, the kidneys were left to recover for 20 min with Krebs solution to allow them to return to baseline Δ-PP (75–90 mmHg) and to detect signs of tachyphylaxis. The concentrations of Ne, Ach, and ROS were selected from published data, as they seemed the most suitable after obtaining changes in Δ-PP.
2.6. Anatomical Changes in the Kidney by Histological Process
To demonstrate the anatomical and structural changes in the renal tissue, the left kidney was dissected and washed with 0.9% saline solution for 30 sec. The capsule was removed and cut in half. One half was processed for light microscopy according to standard techniques, which are briefly described below. One half of the kidney was fixed in 10% formalin solution for 24 hours, gradually dehydrated in ethanol, cleared in xylene, embedded in paraffin, and cut into 5 µM-thick slices using a microtome (Leica RM212RT, Wetzlar, Germany); the paraffin sections were stained with Masson’s trichrome. Histological sections were analyzed at 25× magnification using a model 63300 optical microscope (Carl Zeiss, Oberkochen, Germany) equipped with a Tucsen digital camera (18 megapixels) coupled with TSview 7.3.1 software. The glomerular area was analyzed by densitometry using Sigma Scan Pro 5 Image Analysis software (Systat Software Inc., San Jose, CA, USA). Density values are expressed in arbitrary pixel units. The other half of the kidney was homogenized in a cold sucrose buffer consisting of 25 mM sucrose, 10 mM Tris, 1 mM EDTA at pH 7.35 with protease inhibitors (1 mM PMSF, 2 μM pepstatin, 2 μM leupeptin, and 0.1% aprotinin). The homogenate was then centrifuged at 900× g for 10 min at 4°C, and the supernatant was separated and stored at -30°C until use. Total protein was determined using the Bradford method [44].
2.7. Determination of Polyphenols, Total Flavonoids and Anthocyanins in HSL infusion
100 μL of the HSL infusion were diluted 1:10 in distilled water. Then, 500 μL of Folin-Ciocalteu reagent (2 N) were added, the mixture was homogenized, and incubated for 3 min at room temperature. Then, 3 ml of 2% sodium bicarbonate were added, the mixture was incubated for 15 min at room temperature, and the absorbance was read at 750 nm. The total flavonoids present in the HSL infusion were determined using the Jia method [45] and the absorbance was determined at 510 nm. The anthocyanins were determined according to the method described by Lee, and the absorbance was measured at 520 nm and 700 nm [46].
2.8. Determination of Non-Enzymatic Antioxidant System Markers
2.8.1. NO3–/ NO2– Ratio
To 100 μg of protein from the previously deproteinized kidney homogenate, 25 μL of 10% ZnSO4 were added, then 25 μL of 0.5 N NaOH were added, the sample was homogenized and centrifuged at 5,000 rpm for 15 min. After centrifuging the samples, the supernatant was recovered and 50 μL of 0.14 M KH2PO4 at pH 7.35, plus 5 μL of NO3– reductase, were added, and the sample was incubated at 37°C for 45 min. Subsequently, 50 μL of 1% sulfanilamide were added, and the sample was incubated for 10 min in the dark. Then, 50 μL of 0.1% 1-naphthylethylenediamine were added, the total volume was adjusted to 1 mL. The absorbance was read at 540 nm [47].
2.8.2. GSH/GSSG Ratio
To 100 μg of protein from the kidney homogenate, 100 μL of 0.05 M KH2PO4 pH 7.35, plus 100 μL of 5% Na2WO4) were added and then 100 μL of H2SO4 were added, the mixture was homogenized, and centrifuged for 5 min at 5000 rpm. The supernatant was recovered, and 700 μL of KH2PO4 plus 100 μL of 10 M Ellman’s reagent were added. The mixture was incubated at room temperature for 5 min, and the absorbance was read at 412 nm [48]. To quantify GSSG, the procedure was the same as for quantifying GSH, but after deproteinizing the kidney homogenate, 4 µL of 8-vinylpyridine were added to oxidize the GSH present.
2.8.3. Determination of Total Thiol Groups
100 µg of protein from the kidney homogenate were used, to which 100 µL of KBH4 dissolved in a 10 mM methanol/water (1:1 v/v) mixture were added. The mixture was homogenized and incubated for 3 min. Then, 750 μL of buffer containing 6.7 mM formaldehyde, 10 mM EDTA, and 100 mM TRIS at pH 8.2 were incorporated and the mixture was incubated for 3 min. Then, 100 μL of 10 mM Ellman’s reagent were added. The samples were incubated at room temperature for 4 min, and the absorbance was read at 415 nm [49,50].
2.8.4. Total Antioxidant Capacity
Evaluation of the total antioxidant capacity of the system (TAC) was performed by adding to 100 µg of protein from the kidney homogenate, 1.5 mL of reaction mixture. The mixture consisted of 300 mM acetate buffer pH 3.6, 20 mM FeCl3, 10 mM TPTZ in HCl in a ratio of 10:2:1 v/v respectively; it was mixed in the vortex for 5 sec and incubated at 37 ° C for 15 min in the dark, subsequently centrifuged at 5000 rpm. The absorbance was measured at 593 nm [51].
2.8.5. Superoxide Anion Detection
The O2– anion in kidney homogenates was determined by the irreversible oxidation of adrenaline to adenochrome as follows: 50 μg of protein were added to 2 mL of glycine buffer (50 mM) at pH 10.2, plus 50 μL of epinephrine (60 mM), and incubated and monitored at 30 °C for 6 min at 480 nm with an extinction coefficient of 4.0 mM−1 cm−1 [52].
2.9. Markers of the Enzymatic Antioxidant System
2.9.1. GST, GPx, GR and TrxR Enzymes Activities
To evaluate the activities of GR, GST, GPx, and TrxR, 100 µg of homogenized kidney, were used and treated as previously described [51]. All the samples were incubated and monitored at 340 nm, except the TxrR which was to 412 nm, by 6 min at 37°C. The GR activity was expressed as µmol of reduced GSSG/min/mg of protein, with an extinction coefficient of 6220 M− 1 cm− 1. The GST activity was expressed as units of GS-TNB mol/min/mg of protein, with an extinction coefficient of 14,150 M− 1 cm− 1. The GPx activity was expressed as nmol of NADPH+ oxidized/min/mg of protein, with an extinction coefficient of 6220 M− 1cm− 1. The activity TrxR is expressed as TNB nmol/min/mg of protein, with an extinction coefficient of 13,600 M− 1 cm− 1.
2.9.2. SOD Isoforms, CAT and Peroxidases Activities
The super oxide dismutase (SOD) isoform, catalase and peroxidase activities were determined through non-denaturing gel electrophoresis [51]. 100µg of homogenized kidney were applied directly in non-denaturing 10% polyacrylamide gels. The electrophoresis was carried out at 120 volts for 4 h. For SOD isoform’s activity, the gel was incubated with nitro blue tetrazolium at 2.45 mM for 20 min, then incubated with buffer of the KH2PO4 at 36 mM, EDTA at 28 mM, and riboflavin at 28 mM pH 7.8 (20 mL) and exposed for 10 min to UV light. Purified SOD from bovine erythrocytes with a specific activity of 112 U/mg of protein (Sigma-Aldrich, St. Louis, MO, USA) and purified was used as a control. For catalase activity the gel was incubated with a mixture of 1% K3Fe (CN)6 and 1% of FeCl3 6H2O for 10 min in the dark and then washed with distilled water to stop the reaction. CAT from a bovine liver having a specific activity of 60 U/mg (Sigma-Aldrich) were used as positive control to calculate the activity of these enzymes. For the peroxidase activity, the gel was washed with distilled water three times, for 5 min, after being incubated with 3 mg/mL 3,3,5,5-tetramethylbenzidine dissolved in CH3-OH/CH3COOH/H2O (1:1:1 v/v) with H2O2 (300 µL) total volume 20 mL, for 10 min. A quantity of 35 µL of horseradish peroxidase was loaded to a final concentration of 178.5 µg as a standard. The activities of the SOD isoforms, catalase and peroxidase gels were analyzed using densitometry with a Kodak Image® 3.5 system. The gels were analyzed by densitometry with image Sigma Scan Pro 5.1 software (Systat Software, Inc., San Jose, CA, USA). and are expressed as U of activity per mg of protein.
2.9.3. Glucose-6-Phosphate Dehydrogenase Activity (G6PD)
G6PD activity was quantified using the kit provided by Sigma-Aldrich (MAR015-1KT) and, according to the manufacturer’s specifications, 50 μg of protein from the kidney homogenate were used and monitored at a wavelength of 450–490 nm using a visible-light microplate reader (Stat Fax 3200 Awareness Technology, Palm City, FL, USA).
2.10. Nuclear factor erythroid 2 (NrF2)
50 μg of protein from the kidney homogenate were separated on an 8% SDS-PAGE gel and transferred to polyvinylidene difluoride membranes. The blot was blocked for 1 h at room temperature using Tris-buffered saline (TBS)-0.01% Tween plus 5% skim milk. The membranes were incubated overnight at 4 °C with the primary anti-phospho-NrF2-S40 monoclonal antibody produced in rabbit SAB5701902-100UL. The blot was then incubated with β-actin antibody (sc-81178) as a loading control. Images of the films were digitally acquired using a GS-800 densitometer with Quantity One software (Bio-Rad Laboratories, Inc., Hercules, CA, USA) and were reported as arbitrary units (AU).
2.11. Statistical Analysis
Statistical analysis and graphs were performed using Sigma Plot software (SigmaPlot® version 15.0, Jamdel Corporation). Data are presented as mean ± standard error. Statistical significance was determined using one-way ANOVA and Tukey’s post hoc test. A p≤0.05 was considered significant.
3. Results
3.1. Guaranteed Analysis
The 6% HSL infusion contained cyanidin-3-glucoside (495.40 ± 43.47 mg/L), quercetin (148.48 ± 15.13 mg/L), and polyphenols (27.65 ± 0.76 mol/L).
3.2. General Characteristics and Markers of Kidney Function
Table 1 shows the general characteristics and markers of renal function of the rats in the experimental groups. Rats receiving the 6% HSL infusion showed decreased water consumption, 24-hour urine volume, and CCr clearance, but increased albuminuria and SBP compared to the C and HSL ± 6% groups (p = 0.001). However, in the HSL ± 6% group, the significant difference in CCr clearance and SBP was lower than in the C group (p = 0.01).
3.3. Markers of the Non-Enzymatic Antioxidant System
Table 2 shows some markers of the non-enzymatic antioxidant system in the experimental groups. Rats receiving the 6% HSL infusion showed significant increases in the GSH/GSSG, NO3–/NO2– ratios, total antioxidant capacity, and thiol groups compared to the C and HSL ± 6% groups (p = 0.01). However, the total antioxidant capacity and thiol groups showed significant differences between the C and HSL ± 6% groups (p = 0.02).
3.4. Changes in Δ-PP in the Kidney
Figure 1 (a). shows the changes in Δ-PP in the kidney, which increased significantly (p=0.001) when 20 μM Ne was perfused into the kidney of rats that consumed the 6% HSL infusion compared to rats C. Eliminating HSL treatment for one month in the HSL ± 6% rat group showed a significant reduction (p=0.04). Figure 1 (b). presents the changes in Δ-PP in the kidney when infusing 20 μM of Ach. The results showed that the group of rats that consumed the 6% HSL infusion had increased vascular resistance in Δ-PP compared to the control group and the HSL group ± 6% (p=0.001), since in these last groups there was greater vasodilation.
When 2 μM KO2 was infused into rats consuming 6% HSL infusion, Δ-PP was significantly decreased compared to the control and HSL ± 6% groups (p = 0.01 and p = 0.001, respectively, Figure 2 (a). When 1.7 μM H2O2 was infused into rats consuming 6% HSL infusion, Δ-PP was significantly increased compared to group C (p = 0.03), but remained unchanged in group HSL ± 6% (Figure 2 (b). When ONOO– was infused into rats consuming 6% HSL infusion, Δ-PP was significantly decreased compared to group C and HSL ± 6% (p = 0.01 and p = 0.03, respectively, Figure 2 (c).
3.5. Anatomical Changes the Kidney
Figure 4 in panels (a), (b) and (c) show the representative histological sections of a glomerulus from each of the experimental groups of rats. The rats that consumed the 6% HSL infusion presented retraction of the glomerular tuft, fibrosis, cellular debris and an increase in urinary space compared to groups C and HSL ± 6%. The same Figure 4, shows in panel (d), the photometric density analysis of the area of the glomeruli in the experimental groups. There was a smaller area in the group of rats that consumed the 6% HSL infusion in relation to group C (p <0.001). In the group of HSL ± 6% rats, there was no significant difference compared to the group of HSL ± 6% rats.
3.6. Enzyme Activity of the Enzymatic Antioxidant System in Native Polyacrylamide Gels
Figure 5 (a). shows the enzymatic activity of CAT in kidney homogenates. There is a significant increase in the group of rats that consumed the 6% HSL infusion (p=0.04) compared to group C, but without significant difference compared to the ±6% HSL group. The same figure presents in panel (b) the enzymatic activity of peroxidases in the kidney homogenate in the experimental groups, where there was a significant difference between the group that consumed the 6% HSL infusion compared to the HSL ± 6% groups and group C (p<0.001).
The Figure 6. Shows that the activity of SOD isoforms (Mn and Cu-Zn respectively) was significantly increased in rats of the HSL 6% group (p≤0.001) compared to rats of the C and HSL ± 6% groups.
3.7. Activity of GSH-Using Enzymes in the Enzymatic Antioxidant System by Spectrophotometry
Figure 7. shows GST activity in panel (a), where a significant increase was observed between the HSL + 6% group versus group C (p = 0.02). However, no significant changes were observed in the HSL ± 6% group. Panel (b) shows differences in the activity of GR in the kidney homogenates between the experimental groups, where a significant increase was observed between the HSL 6% and HSL ± 6% groups (p = 0.05 and p = 0.01, respectively) compared to group C. The GPx activity showed a significant increase (p= 0.02) in the kidney homogenates of the group of rats that consumed the 6% infusion compared to rats in group C, but no significant changes compared to the HSL ± 6% group C (c). Finally, in panel (d) of the same figure the enzymatic activity of TrxR in the HSL + 6% group with respect to HSL ± 6%, is shown and there is a decrease with a significant difference (p=0.04) between the group of rats with HSL 6% vs. HSL ± 6% but without changes among group C.
3.8. G6PD Activity and NrF2expression
Figure 8 (a). Shows G6PD activity in kidney homogenates in the three experimental groups. The group receiving the 6% HSL infusion showed a significantly increased G6PD activity (p=0.01) compared to group C, but the activity remained unchanged when compared to the ± 6% HSL group. In the same figure in panel (b) the expression of Nrf2 in the kidney homogenate in the three groups of rats where is shown and it is observed that the group of rats that consumed the 6% HSL infusion showed a significant increase (p=0.01) compared to group C, but without significant changes with respect to the HSL ± 6% group.
3.9. O2– Anion Quantification
Figure 9. shows the oxidation of epinephrine to adenochrome by the action of the O2– anion, which is an accepted method for measuring the generation of this radical. The results showed a significant decrease (p=0.02 and p=0.01, respectively) in the kidney homogenate of rats in the group that consumed the 6% HSL infusion compared to groups C and HSL ± 6%.
4. Discussion
The redox balance that is established between ROS and enzymatic and non-enzymatic antioxidant systems is essential for maintaining homeostasis in the organisms. RS is a concept that is currently not well defined; however, like OS, it may result in detrimental effects [17]. Some studies have reported increases in reducing equivalents and enzymatic and non-enzymatic antioxidant systems, but the mechanisms of action, the cellular response involved, and the biological consequences of these changes remain unknown. A reducing environment is associated with beneficial effects on cellular functions and biological processes, but chronic increases in these components could disrupt redox homeostasis and lead to detrimental effects on ROS signaling, participation, and production in different cellular pathways [53]. At normal concentrations, ROS play a key role in cellular defense, hormone synthesis and signaling, spermatogenesis, activation of G protein-coupling of receptors, transcription factors, modulating vascular reactivity, regulating electrolyte balance in the renal tubules, and gene expression [54]. However, at high concentrations, they lead to OS
On the other hand, HSL is a functional food because it provides various components with biological activity; for example, it provides different antioxidant molecules, minerals, and essential amino acids. However, these beneficial characteristics could become harmful if this plant is consumed for a prolonged period of time, and in excess. Its excessive consumption may promote an increase of the antioxidant enzymes and reducing equivalents, which could lead to RS and, consequently, to an imbalance in redox homeostasis. This could lead to alterations in different organs such as the kidneys since the balance between prooxidants and antioxidant molecules is essential for proper renal function [55].
Therefore, the objective of this study was to generate a RS state associated with excessive and chronic consumption of a 6% HSL infusion that may alter the renal system and to demonstrate how the decrease in ROS due to the overexpression of the enzymatic and non-enzymatic antioxidant systems may contribute to the deterioration of the renal function.
The results showed an increase in Δ-PP in the presence of Ne, but a decrease with Ach. That is, by keeping the kidney with a constant flow, a slight increase in Δ-PP caused by both vasoconstrictors or vasodilators represents changes in the resistance of the afferent arteriole. According to the biogenic theory that postulates that renal blood flow is equal to the blood pressure divided by the renal vascular resistance (RVR), as the Δ-PP increases or decreases the vessels modify the resistance. This mechanism is intrinsic and self-regulatory in normal renal conditions, but when there is an imbalance in pathological conditions, an increase or decrease of the resistance in the pre-glomerular afferent arteriole by the action of vasoconstriction or vasodilation, modifies the glomerular filtration rate [56]. This might contribute to the decrease in glomerular filtration rate, CCr clearance, and the presence of proteinuria in rats that consumed the 6% HSL infusion vs. the group C and HSL ± 6%. Furthermore, these changes could be associated with anatomical changes in the nephron, resulting in increased intraglomerular pressure. However, these alterations begin to disappear after discontinuation of the treatment.
The histological results showed glomerular retraction, fibrosis, cellular debris, and increase in the urinary space between Bowman’s capsule and the glomerulus in rats that consumed the 6% HSL infusion. Moreover, the effect of Ne on renal function is mediated through α2-adrenergic receptors by regulating the passage of intracellular Ca2+ after cAMP signaling. This stimulation causes contraction of the smooth muscle of the afferent arteries and leads to the decrease in the caliber of the renal blood vessels resulting in the increase of the RVR, as observed when perfusing both Ne and Ach in the 6%HSL group. These results suggest that chronic consumption of 6% HSL modulates the increase in RVR in the kidney associated with anatomical changes thus contributing to an increase in SBP. In this regard, a recent study showed that chronic consumption of 6% HSL infusion in rats favored vasoconstriction, decreased relaxation and increased thickness of elastic fiber layers associated with hypertrophy of the vascular wall in the thoracic aorta which contributed to increase SBP [57]. Furthermore, HSL could provide excess tyrosine, the substrate for Ne synthesis by the sympathetic nerve endings, which could contribute to increase the SBP [58]. In addition, the ROS participation is well demonstrated in the renal system. They stimulate Na+ reabsorption, Cl–/HCO3– exchange, Na+/K+ ATPase, the increase in Cl– channels, tubule glomerular feedback in the macula dense, in the collecting duct. They stimulate the activity of epithelial Na+ channels that cause dilation of the afferent arteriole and the K+ transport which, in turn, increases tyrosine kinases and the synthesis of renal gluconeogenesis [59].
Another example of the beneficial participation of ROS is found in cardiac function. In mouse models with myocardial damage the NOX4 overexpression prevented the H2O2 depletion and improved cardiac function after an ischemic period [60]. In this sense, our results showed that the infusion of different ROS such as KO2 and ONOO– decreases Δ-PP, but H2O2 favored the increase in the 6%HSL group when compared with groups C and HSL ± 6%. This indicates that the antioxidant enzyme overexpression is involved in the detoxification of these ROS. It is also associated with the excessive intake of antioxidants provided by the 6% HSL infusion that contributes to the reduction of these ROS, which are partly involved in modulating vascular reactivity. In this sense, H2O2 has vasodilatory effects on arterioles. Furthermore, H2O2 activates 4-aminopyridine-sensitive K+ channels, which leads to the closure of Ca2+ voltage-dependent channels, producing hyperpolarization in arterial smooth muscle. Furthermore, H2O2 synthesis via the NOX4 pathway may contribute to RVR by increasing hyperpolarization of the vascular endothelial membrane in the kidney, which may promote activation of endothelial nitric oxide synthase (eNOS), thereby increasing nitric oxide (NO) synthesis [60]. Similarly, it is essential to maintain redox homeostasis in the endothelium since excessive production or decreased production of ROS contributes to impaired renal vascular function [13].
The ROS effects on vessels are not uniform, since they depend on which ROS is acting and at what concentration [61]. Therefore, our results suggest that O2–, ONOO–, and H2O2 participate in RVR modulation and that the excess of antioxidant molecules provided by the 6% HSL infusion decreases these ROS. After discontinuing HSL treatment, this tended to normalize. In this regard, a recent study showed that when aortic rings of rats that consumed 6% HSL infusion and were incubated in the presence of Ne and Ach, and KO2, vasoconstriction and vasodilation were normalized [57]. KO2 reacts violently with water to form KOH and, in this process, O2− is formed, which can act on renal function. Therefore, the results highlight the ROS participation in renal vascular response at normal concentrations. Furthermore, as previously mentioned, H2O2 promotes vasodilation and produces NO through the activation of different signaling pathways such as PI3K/Akt, Erk1/2 and p38MAPK [62]. Recently, it has been described that H2O2 not only stimulates eNOS but can also increase its expression. Another protein involved in the regulation of vasodilation is PKG1α, a protein kinase that is sensitive to the oxidation by H2O2 through the formation of a disulfide bond. The vasodilation that occurs is independent of cGMP levels [61]. The results obtained in our study show that the increase in Δ-PP in the 6% HSL group, might involve the participation of H2O2 in the modulation of RVR. They also suggest that the excess of antioxidants provided by the HSL infusion decreases the H2O2 concentration, thereby altering vasorelaxation.
Furthermore, the O2– anion can oxidize NO generating ONOO–. At normal concentrations, these molecules can oxidize disulfide bridges (thiol groups) between protein cysteines. The balance between the oxidation and reduction processes between thiol groups is very important since it regulates the activity and functionality of proteins and enzymes [17]. Our results showed that the treatment with the 6% HSL infusion favored the decrease of thiol groups compared to group C. However, when the treatment was replaced by plain water, thiol groups increased. A predominant feature in RS is the decrease in thiol groups, a condition caused by misfolding of proteins in the endoplasmic reticulum, which leads to the accumulation of misfolded proteins with loss of disulfide bridges in a state of stress. Furthermore, reticulum stress is caused by overstimulation of Nrf2 [63]. The results of our study showed that the Nrf2 expression is increased in the kidney homogenate in the group of rats that consumed the 6% HSL infusion compared to group C. In this regard, the accumulation of misfolded proteins induces an alternate mechanism of Nfr2 activation through the autophagy adapter p62 which competes with Keap-1 for the Nrf2 binding site, thus increasing its release and translocation to the nucleus [17]. This may lead to the overexpression of antioxidant phase II detoxification enzymes such as GPx, SOD isoforms, CAT, GST and TrxR among others. This was also found in this work since the activities of these enzymes increased in the kidney homogenate of rats that consumed the 6% HSL infusion.
In addition, several studies in the cardiovascular system have demonstrated the role of the NO3–/NO2– ratio in the inflammatory process and in RVR, suggesting that these agents can increase mitochondrial biogenesis when there is some injury to the vascular wall [13]. In this process, xanthine oxidoreductase can be overexpressed, which reduces these molecules to NO [14]. Furthermore, the excess antioxidants provided by the 6% HSL infusion can also reduce them to form NO thus generating ONOO– [64]. However, the overactivation of SOD isoforms may depress this molecule. In this sense, only a few studies have shown the beneficial effect that the ONOO– could have on different cellular pathways. For example, low concentrations may induce the phosphorylation of band 3 tyrosine, a signaling pathway that activates glucose metabolism. Also, ONOO– may cross the red blood cell membrane and react with hemoglobin producing mainly metHb, which is reduced again to ferrous Hb by the reducing equivalents NADH+/NADPH+. Also, the low concentration of ONOO– is catabolized by peroxiredoxins, leaving marginal levels of oxidative modifications in target biomolecules that can exert favorable redox signaling actions [65]. In this sense, the increased NO3–/NO2– ratio concentration in the kidney homogenate of rats that consumed the 6% HSL infusion may indirectly suggest that there is overexpression/activity of iNOS or eNOS uncoupling. These situations are mainly present in pro-inflammatory situations [66] and can be associated with the Δ-PP decrease when ONOO– was perfused into the isolated kidney in rats from the 6% HSL group. In our conditions, ONOO– is being detoxified by the overactivity of SOD isoforms [58]. Therefore, the beneficial effect that ONOO– at low concentrations on RVR is demonstrated in this study. In this sense, ONOO– transiently increases the reducing equivalents, promoting a protective response in the organism, improving the PPP pathway through the stimulation of the activity G6PD, which increases the NADPH+ production.
However, this mechanism can be harmful if maintained for a prolonged period of time [67]. G6PD located in the vascular endothelium is an enzyme with antioxidant effect responsible for providing the NADPH+ and controlling the ROS concentration [67]. In this regard, a study showed that the G6PD overexpression decreased the excess ROS in endothelial cells treated with H2O2 or with tumor necrosis factor alpha. It also increased the GSH concentration [68]. In vascular cells, inflammatory processes, such as hypertrophy of the vascular wall, may increase the G6PD expression associated with the increase in the activity of the PPP [68]. The results of our study showed an increase in G6PD activity, which was significant in the group that consumed the 6% HSL infusion compared vs. group C. These results could be attributed to the increase of the RVR, which could lead to hypertrophy of the afferent arteriole wall, causing a proinflammatory process. However, further studies are required to confirm this hypothesis. A recent study showed that rats that consume 6% HSL infusion course with a proinflammatory state [58], and another study showed that there was an increase in G6PD activity in the thoracic aorta associated with thickening of the elastic fibers in the thoracic aorta [57]. Therefore, our results suggest that the excess antioxidants provided by the 6% HSL infusion may contribute to a proinflammatory process and to the RVR alteration. This could activate the G6PD and generate the increase of NADPH+ that is used by phase II detoxification enzymes [69], such as the GPx and CAT were able to attenuate the harmful effects of H2O2 on blood vessels [70].
Our results showed that the activities of CAT, GPx and peroxidases were increased in kidney homogenate in the group of rats that consumed the 6% HSL infusion. These enzymes detoxify and utilize H2O2 as a substrate and in this process, they reduce it to H2O and molecular O2. In addition, HSL can provide Se [71], and favor activities increase of the enzymes depending as the GPx and TrxR [72]. In this sense, a recent work reported that rats that consumed the 6%, HSL infusion showed an increase in plasma Se which was associated with an increase in the activities of GPx and TrxR that neutralize H2O2. Moreover, the TrxR, which is able of reducing ascorbyl ROS by recycling ascorbate, in addition to participating in the regulation of gene expression of some transcription factors such as NF-kβ, AP-1, p-53, glucocorticoid receptor and apoptosis regulatory kinase -1 [73]. TrxR are essential to maintain the homeostasis of thioredoxins, which are important thiol mediators in antioxidant systems, since they provide H+ protons through NADPH+ for the thiol groups reduction. The results of the present study showed a significant increase in the group that consumed the 6% HSL infusion in the activity of this enzyme. These results suggest that TrxR overactivity could be attributed to excess Se and constitute a compensatory mechanism of the TrxR system attempting to increase the reduction of thiol groups between protein cysteines, which were found to be decreased.
Likewise, various studies have observed synergistic effects between GSH and TrxR [73]. Therefore, high GSH concentrations could, in turn, favor an increase in the TrxR activity [74]. Furthermore, as previously mentioned, TrxR depends on NADPH+, which is provided in part by the activity of G6PD, to generate more reducing equivalents that are necessary for the altered functioning of this system associated with the increased percentage of HSL infusion. On the other hand, GST is an antioxidant enzyme that conjugates GSH with electrophilic and xenobiotic agents such as drugs, toxins, and carcinogens, and detoxifies the body [75]. The results of our study show a significant decrease in the activity of this enzyme in the kidney homogenate in the group of rats that consumed the 6% HSL infusion compared to groups C and HSL ± 6%. The administration of protocatechuic and tannic acids found in HSL at doses of 80 mg/kg, reduces the activity of the mu, alpha and pi subunits of GST in the liver [75]. Another study observed that the high concentrations of flavonoids also present in HSL, could inhibit the GST activity [76]. Therefore, the results suggest that the lower GST activity could contribute to decrease in the detoxification of some phenolic acids provided by HSL, thereby contributing to a positive feedback process that would continue perpetuating the concentration of these antioxidants systemically, favoring damage to renal physiology.
In another order of things, H2O2 is the product of SOD isoforms when detoxifying O2– and NADPH oxidases, however, when there is an elevated activity of SOD, this produces an H2O2 increase with a decrease of O2– which can lead to elevate the enzymes that detoxify it. This is in part due to the increase in the H2O2 substrate [77]. Our results showed overactivity of the SOD-Mn and Cu-Zn isoforms in the kidney homogenate of rats that consumed the 6% HSL infusion when compared to group C; however, when the treatment was replaced with plain water, this effect was normalized. These results suggest that the overactivity of the two SOD isoforms is lowering the O2– concentration since this ROS were significantly decreased. This was also evidenced by the irreversible oxidation of adrenaline to adenochrome in the kidney homogenate of rats that consumed the 6% HSL infusion.
In addition to the above mentioned, H2O2 excess may be neutralized by the overactivity of the enzymes as CAT, peroxidases and GPx are predominantly localized in the renal tubules. This suggests that overactivity of these enzymes generates harmful effects on renal physiology by decreasing or eliminating H2O2, which favors RS and leads to altered RVR associated with physiological and anatomical changes in the kidney. In this regard, polyphenols, anthocyanins, cyanidin, and delphinidin-3-glucoside, which are provided by HSL infusion, induce the activation of both SOD isoforms and GPx, acting as H+ proton donors in renal tissue. In addition, peroxidase activity was also increased in our experimental group treated with HSL. Peroxidases, present in the renal tubules and in the glomerulus can reduce H2O2 production by a reaction that resembles that of CAT [77], that is, by the heterolysis. In this catalytic reaction two protons are transferred from NADPH+ through the catalytic center of the enzyme and H2O2 is used as a substrate to form important amounts of hypochlorous acid/hypochlorite in the presence of Cl–, in addition, to H2O. This prevents the formation of the OH– radical [77]. Therefore, the overexpression of this enzyme leads to a quantity of adducts in proteins and chlorinated lipids that cause dysfunction of the cells in different kidney compartments [78]. Therefore, these results suggest that the overactivity of CAT, GPx and peroxidases contributes to the decrease in the H2O2 concentration, which participate in renal physiology when at normal concentrations.
In addition, one characteristic reducing couples of RS is the GSH/GSSG ratio. HSL extract can increase the GSH concentration by providing the amino acids cysteine, glycine and glutamic acid. Our results show that rats treated with 6% HSL showed a significant increase in the GSH/GSSG ratio when compared to group C. This increase may be due to the increased activity of G6PD, which provides the reducing equivalent NADPH+, that is then used as a cofactor by the GR selenoenzyme for the regeneration of GSH [67]. Our results showed an increase in the activity of this enzyme. This suggests that the increase in GSH may be due to regeneration through the GR overactivity or by de novo synthesis by the amino acids provided by HSL through γ-glutamyl cysteine synthetase and glutathione synthetase. In this regard, increased GSH favors the mitochondrial membrane potential by increasing the reverse electron flow from succinate to NAD+ to increase ROS production by the mitochondria [79]. Moreover, the increase in the GSH/GSSG ratio could elevate the reducing couple NADH/NADPH+ through G6PD and boost the electron transport chain in subunits I and III in the O2– production [80,81]. However, this increase would be paradoxical since it would lead to a state OS and not to RS. However, the O2– anion can be depleted by the overactivity of the SOD isoforms.
5. Conclusions
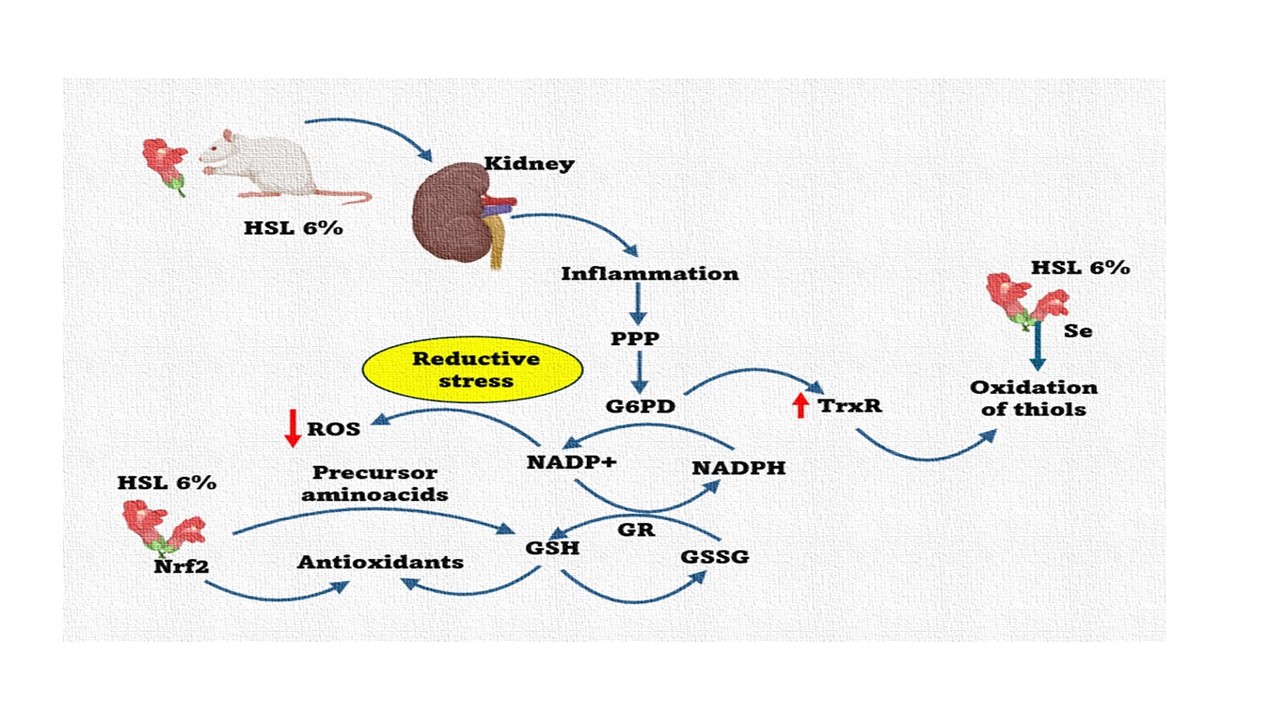
Based on the results of this study, we conclude that excess antioxidants such as flavonoids, and polyphenols among others provided by 6 % HSL infusion, increase the total antioxidant capacity. This capacity is comprised by the enzymatic and non-enzymatic antioxidant system, resulting in a RS state that favors the increase of the reducing couples GSH/GSSG and NADP+/NADPH+ thus contributing to decrease ROS. This decrease impairs kidney function. However, the RS state can be reversible if the antioxidant intake provided by the HSL infusion is discontinued. Figure 10. summarizes the effect that have the 6% HSL infusion treatment in the rats for one month.
Author Contributions
Conceptualization and methodology, L.M.-P.; Made the guaranteed analysis determination, M.E.S.; Revised and structured the manuscript; V.G.-L.; V.C.-T.; Performed the western blot; A.A.P.-F.; Methodology and cared for experimental animals; S.C.-C.; performed the experiments of antioxidant total capacity; R.M.-M.; Software analysis; M.E.R.-R.; performed the GSH experiments; F.L.R.-F.; performed the ELISA essays; J.C.T.-N.; cared for experimental animals; L.I.-L; performed the western blot; I.P.-T.; Designed the study, wrote the manuscript and the performed the statistical study. All authors have read and agreed to the published version of the manuscript.
Funding
This research received no external funding.
Institutional Review Board Statement
The Laboratory Animal Care Committee of the National Institute of Cardiology “Ignacio Chávez” in México (protocol # INC/CICUAL/009/2023) approved the experiments in animals, which were conducted in compliance with the Guide for the Care and use of laboratory animals of the National Institutes of Health (NIH).
Informed Consent Statement
Not applicable.
Data Availability Statement
The datasets generated and analyzed during the current study are available from the corresponding author on reasonable request.
Acknowledgments
We thank the Postgraduate Section de Becas PosDoctorales en la UNAM for a scholarship to Dra. Linaloe Manzano Pech. We thank the Facultad de Estudios Superiores Zaragoza. UNAM by the studies Biology bachelor’s the Alan Axel Pérez-Flores. We thank Benito Chávez Rentería for histology technical support.
Conflicts of Interest
The authors declare no conflicts of interest.
Abbreviations
| ROS | Reactive oxygen species |
| OS | Oxidative stress |
| GSH | Reduced glutathione |
| GSSG | Oxidized glutathione |
| O2– | Super oxide radical |
| O2 | Molecular oxygen |
| H2O2 | Hydrogen peroxide |
| ONOO– | peroxynitrite |
| NO | Nitric oxide |
| OH– | hydroxyl radical |
| CAT | Catalase |
| GPx | glutathione peroxidase |
| RS | Reductive Stress |
| NADPH+ | reduced nicotinamide adenine dinucleotide |
| NADP+, | oxidized nicotinamide adenine dinucleotide |
| NAD | nicotinamide adenine dinucleotide |
| G6PD | glucose-6- dehydrogenase |
| Nrf2 | nuclear factor erythroid-derived 2 |
| SOD | super oxide dismutase |
| GST | glutathione-s-transferase |
| GR | Glutathione reductase |
| Cu-Zn | copper-zinc |
| Mn | manganese |
| TrxR | thioredoxin reductase |
| HSL | Hibiscus sabdariffa Linnaeus |
| Ne | norepinephrine |
| Ach | acetylcholine |
| SBP | Systolic blood pressure |
| SCr | serum creatinine |
| CCr | creatinine clearance |
| UCr | urinary creatinine |
| KO2 | potassium superoxide |
| PP | perfusion pressure |
| TAC | total antioxidant capacity |
| RVR | renal vascular resistance |
| PPP | pentose phosphate pathway |
| NO3–/NO2– | Nitrates and nitrites |
References
- Singh, S. Oxidative stress and sarcomeric proteins. Cir. Res. 2013, 112, 393–405. [Google Scholar]
- Singh, F.; Charles, A.; Schlagowski, A.; Bouitbir, J.; Bonifacio, A.; Piguard, F.; Krähenbühl, S.; Geny, B.; Zoll, J. Reductive stress impairs myoblast’s mitochondrial function and triggers mitochondrial hormesis. Biochim. Biophys. Acta. 2015, 7, 1574–1585. [Google Scholar] [CrossRef] [PubMed]
- Favier, A. Oxidative stress in human diseases. Ann. Pharm. Fr. 2006, 64, 390–396. [Google Scholar] [CrossRef] [PubMed]
- Sies, H. Oxidative stress: a concept in redox biology and medicine. Redox. Biol. 2015, 4, 180–183. [Google Scholar] [CrossRef]
- Pérez-Torres, I.; Soto, M.E.; Castrejón-Tellez, V.; Rubio-Ruiz, M.E.; Manzano-Pech, L.; Guarner-Lans, V. ; Oxidative, reductive, and nitrosative stress effects on epigenetics and on posttranslational modification of enzymes in cardiometabolic diseases. Oxid Med. Cell. Longev. 2020, 2020, 8819719. [Google Scholar] [CrossRef]
- Pérez-Torres, I.; Castrejón-Téllez, V.; Soto, M.E.; Rubio-Ruiz, M.E.; Manzano-Pech, L.; Guarner-Lans, V. Oxidative stress, plant natural antioxidants, and obesity. Int. J. Mol. Sci. 2021, 22, 1786. [Google Scholar] [CrossRef]
- Valko, M.; Leibfritz, D.; Moncol, J.; Cronin, M.; Mazur, M.; Telser, J. Free radicals and antioxidants in normal physiological functions and human disease. Int. J. Biochem. Cell. Biol. 2007, 39, 44–84. [Google Scholar] [CrossRef]
- Taverne, Y.; Bogers, A.; Duncker, B.; Merkus, D. Reactive oxygen species and the cardiovascular system. Oxid Med. Cell. Longev. 2013, 2013, 1–15. [Google Scholar] [CrossRef]
- Benhar, M.; Stamler, J. A central role for S-nitrosylation in apoptosis. Nat. Cell. Biol. 2005, 7, 645–646. [Google Scholar] [CrossRef]
- Rhee, S.; Kang, S.; Jeong, W.; Chang, T.; Yang, K.; Woo, H. Intracellular messenger function of hydrogen peroxide and its regulation by peroxiredoxins. Curr. Opin. Cell. Biol. 2005, 17, 183–189. [Google Scholar] [CrossRef]
- Grune, T. Oxidants and antioxidative defense. Hum. Exp. Toxicol. 2002, 2, 61–62. [Google Scholar] [CrossRef] [PubMed]
- Filaire, E.; Toumi, H. Reactive oxygen species and exercise on bone metabolism: friend or enemy? Joint. Bone. Spine. 2012, 79, 341–346. [Google Scholar] [CrossRef] [PubMed]
- Pérez-Torres, I.; Manzano-Pech, L.; Rubio-Ruíz, M.E.; Soto, M.E.; Guarner-Lans, V. Nitrosative stress and Its association with cardiometabolic disorders. Molecules. 2020, 25, 2555. [Google Scholar] [CrossRef] [PubMed]
- Pérez-Torres, I.; Guarner-Lans, V.; Rubio-Ruiz, M.E. Reductive stress in inflammation-associated diseases and the pro-oxidant effect of antioxidant agents. Int. J. Mol. Sci. 2017, 18, 2098. [Google Scholar] [CrossRef]
- Zhang, H.; Limphong, P.; Pieper, J.; Liu, Q.; Rodesch, C.; Christians, E.; Benjamin, I. Glutathione-dependent reductive stress triggers mitochondrial oxidation and cytotoxicity. FASEB. J. 2012, 26, 1442–1451. [Google Scholar] [CrossRef]
- Meng, Q.; Zhang, Y.; Hao, S.; Sun, H.; Liu, B.; Zhou, H.; Wang, Y.; Xu, Z.X. Recent findings in the regulation of G6PD and its role in diseases. Front. Pharmacol. 2022, 13, 932154. [Google Scholar] [CrossRef]
- Bellezza, I.; Giambanco, I.; Minelli, A.; Donato, R. Nrf2 -Keap1 signaling in oxidative and reductive stress. BBA. Mol. Cell Res. 2018, 1865, 721–733. [Google Scholar] [CrossRef]
- Keum, Y.; Choi, B. Molecular and chemical regulation of the Keap1-Nrf2 signaling pathway. Molecules. 1007. [Google Scholar]
- Dong, J.; Kathleen, K.; Shao-yu, C. Nrf2-Mediated transcripcional induction of antioxidant response in mouse embryos exposed to ethanol in vivo: Implications for the prevention of fetal alcohol spectrum disorders. Antioxid. Redox. Signal. 2008, 10, 2023–2033. [Google Scholar] [CrossRef]
- Birben, E.; Sahiner, U.; Sackesen, C.; Erzurum, S.; Kalayci, O. Oxidative stress and antioxidant defense. World. Allergy. Organ. J. 2012, 5, 9–19. [Google Scholar] [CrossRef]
- Flohé, R.; Maiorino, M. Glutathione peroxidases. Biochim. Biophys. Acta. 2013, 1830, 3289–3303. [Google Scholar] [CrossRef]
- Branco, V.; Carvalho, V. The thioredoxin system as a target for mercury compounds. Biochim. Biophys. acta. Gen. Subj. 2019, 1863, 129255. [Google Scholar] [CrossRef] [PubMed]
- Lu, J. and Holmgren A. The thioredoxin antioxidant system. Free Radical Biology and Medicine. 7: 2014; 66, 2014. [Google Scholar]
- Arnér, E. Focus on mammalian thioredoxin reductases-Important selenoproteins with versatile functions. Biochim. biophys acta. Gen. Subj. 2009, 1790, 495–526. [Google Scholar] [CrossRef] [PubMed]
- Kameritsch, P.; Singer, M.; Nuernbergk, C.; Rios, N.; Reyes, A.; Schmidt, K.; Kirsch, J.; Schneider, H.; Muller, S.; Pogoda, K.; Cui, R.; Kirchner, T.; Wit, C.; Lange-Sperandio, B.; Pohl, U.; Conrad, M.; Radi, R.; Beck, H. The mitochondrial thioredoxin reductase system (TrxR2) in vascular endothelium controls peroxynitrite levels and tissue integrity. Proc. Natl. Acad. Sci. USA. 2021, 118, e1921828118. [Google Scholar] [CrossRef]
- Vararattanavech, A.; Ketterman, A.J. Multiplerolesof glutathionebinding-siteresiduesof glutathione s-transferase. Protein. Pept. Lett. 2003, 10, 441–448. [Google Scholar] [CrossRef]
- Deponte, M. Glutathione catalysis and the reaction mechanisms of glutathione-dependent enzymes. Biochim. Biophys. Acta. 2013, 1830, 3217–3266. [Google Scholar] [CrossRef]
- O’Brien, P.J. Peroxidases. Chem. Biol. Interact. 2000, 129, 113–119. [Google Scholar] [CrossRef]
- Nandi, A.; Yan, L.J.; Jana, C.K.; Das, N. Role of catalase in oxidative stress- and age-associated degenerative diseases. Oxid. Med. Cell. Longev. 2019, 9613090. [Google Scholar] [CrossRef]
- Bartosz, G. Non-enzymatic antioxidant capacity assays. Limitations of use in biomedicine. Free. Radic. Res. 2010, 44, 711–720. [Google Scholar] [CrossRef]
- Alisik, M.; Alisik, T.; Nacir, B.; Neselioglu, S.; Genc-Isik, I.; Koyuncu, P.; Erel, O. Erythrocyte reduced/oxidized glutathione and serum thiol/disulfide homeostasis in patients with rheumatoid arthritis. Clin. Biochem. 2021, 94, 56–61. [Google Scholar] [CrossRef]
- Zitka, O.; Skalickova, S.; Gumulec, J.; Masarik, M.; Adam, V.; Hubalek, J.; Trnkova, L.; Kruseova, J.; Eckschlager, T.; Kizek, R. Redox status expressed as GSH:GSSG ratio as a marker for oxidative stress in paediatric tumour patients. OncoL. lett. 2012, 4, 1247–1253. [Google Scholar] [CrossRef]
- DeMartino, A.; Kim-Shapiro, D.; Patel, R.; Gladwin, M. Nitrite and nitrate chemical biology and signaling. Brit. J. Pharmacol. 2019, 176, 228–245. [Google Scholar] [CrossRef] [PubMed]
- Waltz, P.; Escobar, D.; Botero, A.; Zuckerbraun, B. Nitrate/Nitrite as critical mediators to limit oxidative injury and inflammation. Antioxid. Redox. Signal. 2015, 23, 328–339. [Google Scholar] [CrossRef] [PubMed]
- Baños, G.; Pérez-Torres, I.; El Hafidi, M. Medicinal agents in the metabolic syndrome. Cardiovasc. Hematol. Agents. Med. Chem. 2008, 6, 237–252. [Google Scholar] [CrossRef] [PubMed]
- Pérez-Torres, I.; Ruiz-Ramírez, A.; Baños, G.; El-Hafidi, M. Hibiscus sabdariffa Linnaeus (Malvaceae), curcumin and resveratrol as alternative medicinal agents against metabolic syndrome. Cardiovasc. Hematol. Agents. Med. Chem. 2013, 11, 25–37. [Google Scholar] [CrossRef]
- Sanou, A.; Konate, K.; Dakuyo, R.; Kabore, K.; Sama, H.; Dicko, M.H. Hibiscus sabdariffa: Genetic variability, seasonality and their impact on nutritional and antioxidant properties. PLoS. One. 2022, 17, e0261924. [Google Scholar] [CrossRef]
- Poletajew, S.; Antoniewicz, A.A.; Borówka, A. Kidneyr emoval: the past, presence, and perspectives: a historical review. Urol. J. 2010, 7, 215–223. [Google Scholar]
- Kishi, S.; Matsumoto, T.; Ichimura, T.; Brooks, C.R. In Human reconstructed kidney models. In Vitro. Cell. Dev. Biol. Anim. 2021, 57, 133–147. [Google Scholar] [CrossRef]
- Linz, D.; Hohl, M.; Elliot, A.D.; Lau, D.H.; Mahfoud, F.; Esler, M.D.; Sander, P.; Böhm, M. Modulation of renal sympathetic innervation: recent insights beyond blood pressure control. Clin Auton Res. 2018, 28, 375–384. [Google Scholar] [CrossRef]
- Sata, Y.; Head, G.A.; Denton, K.; May, C.N.; Schlaich, M.P. Role of Sympathetic Nervous System and Its Modulation in Renal Hypertension. Front. Med. 2018, 5, 82–92. [Google Scholar] [CrossRef]
- Pérez-Torres, I.; Guarner, V.; El Hafidi, M.; Baños, G. ; Baños, G. Sex hormones, metabolic syndrome and kidney. Curr. Top. Med. Chem. 2011, 11, 1694–705. [Google Scholar]
- BenGershom, E. Screening for albuminuria: A case for estimation of albumin in urine. Clin Chem. 1975, 21, 1795–1798. [Google Scholar] [CrossRef] [PubMed]
- Kruger, N.J. The Bradford method for protein quantitation Methods. Mol. Biol. 1994, 32, 9–15. [Google Scholar]
- Jia, Z.; Tang, M.; Wu, J. The determination of flavonoid contents in mulberry and their scavenging effects on superoxide radicals. Food. Chem. 1999, 64, 555–559. [Google Scholar]
- Lee, J.; Durst, R.; Wrolstad, R. Determination of total monomeric anthocyanin pigment content of fruit juices, beverages, natural colorants, and wines by the Ph Differential Method: collaborative study. J. AOAC. Int. 2005, 88, 1269–1278. [Google Scholar] [CrossRef]
- Tsikas, D. Analysis of nitrite and nitrate in biological fluids by assays based on the Griess reaction: Appraisal of the Griess reaction in the L-arginine/nitric oxide area of research. J. Chromatogr. B. Analyt. Technol. Biomed. Life. Sci. 2007, 851, 51–70. [Google Scholar] [CrossRef]
- Griess, J. Patents Relating to Chemistry:213,563. And 213,564 Coloring matters. J. Am. Chem. Soc. 1879, 1879, 1. [Google Scholar] [CrossRef]
- Rahman, I.; Kode, A.; Biswas, S. Assay for quantitative determination of glutathione and glutathione disulfide levels using enzymatic recycling method. Nat. Protoc. 2006, 6, 3159–3165. [Google Scholar] [CrossRef]
- Erel, O.; Neselioglu, S. A novel and automated assay for thiol/disulphide homeostasis. Clin. Biochem. 2014, 47, 326–332. [Google Scholar] [CrossRef]
- Pérez-Torres, I.; Soto, M.; Manzano-Pech, L.; Díaz-Díaz, E.; Soria-Castro, E.; Rubio-Ruíz, M.; Guarner-Lans, V. Oxidative stress in plasma from patients with Marfan syndrome is modulated by deodorized garlic. Preliminary findings. Oxid. Med. Cell. Longev. 2022, 2022, 5492127. [Google Scholar] [CrossRef]
- Costa, V.M.; Silva, R.; Ferreira, L.M.; Branco, P.S.; Carvalho, F.; Bastos, M.L.; Carvalho, R.A.; Carvalho, M.; Remião, F. Oxidation process of adrenaline in freshly isolated rat cardiomyocytes: formation of adrenochrome, quinoproteins, and GSH adduct. Chem. Res. Toxicol. 2007, 20, 1183–1191. [Google Scholar] [CrossRef]
- Xiao, W.; Loscalzo, J. Metabolic responses to reductive stress. Antioxid. Redox. Signal. 2020, 32, 1330–1347. [Google Scholar] [CrossRef] [PubMed]
- Sedeek, M.; Nasrallah, R.; Touyz, R.M.; Hébert, R.L. NADPH Oxidases, Reactive Oxygen Species, and the Kidney: Friend and Foe. J. Am. Soc. Nephrol. 2013, 24, 1512–1518. [Google Scholar] [CrossRef] [PubMed]
- Mladenov, M.; Lubomirov, L.; Grisk, O.; Avtanski, D.; Mitrokhin, V.; Sazdova, I.; Keremidarska-Markova, M.; Danailova, Y.; Nikolaev, G.; Konakchieva, R.; Gagov, H. Oxidative stress, reductive stress and antioxidants in vascular pathogenesis and aging. Antioxidants. (Basel). 2023, 12, 1126. [Google Scholar] [CrossRef]
- Pérez-Torres, I.; El Hafidi, M.; Pavón, N.; Infante, O.; Avila-Casado, M.C.; Baños, G. Effect of gonadectomy on the metabolism of arachidonic acid in isolated kidney of a rat model of metabolic syndrome. Metabolism. 2010, 59, 414–423. [Google Scholar] [CrossRef]
- Manzano-Pech, L.; Guarner-Lans, V.; Elena Soto, M.; Díaz-Díaz, E.; Pérez-Torres, I. Alteration of the aortic vascular reactivity associated to excessive consumption of Hibiscus sabdariffa Linnaeus: Preliminary findings. Heliyon. 2023, 9, e20020. [Google Scholar] [CrossRef]
- Manzano-Pech, L.; Guarner-Lans, V.; Soto, M.E.; Díaz-Díaz, E.; Caballero-Chacón, S.; Díaz-Torres, R.; Rodríguez-Fierros, F.L.; Pérez-Torres, I. Excessive Consumption Hibiscus sabdariffa L. Increases inflammation and blood pressure in male wistar rats via high antioxidant capacity: The preliminary findings. Cells. 2022, 11, 2774. [Google Scholar] [CrossRef]
- Nlandu, K.S.; Dizin, E.; Sossauer, G.; Szanto, I.; Martin, P.Y.; Feraille, E.; Krause, K.H. de Seigneux, S.J. NADPH-oxidase 4 protects against kidney fibrosis during chronic renal injury. Am. Soc. Nephrol. 2012, 23, 1967–7196. [Google Scholar] [CrossRef]
- Handy, D.E.; Loscalzo, J. Responses to reductive stress in the cardiovascular system. Free. Radic. Biol. Med. 2017, 109, 114–124. [Google Scholar] [CrossRef]
- Bretón, R.; Lamas, S. Hydrogen peroxide signaling in vascular endothelial cells. Redox. Biol. 2014, 2, 529–534. [Google Scholar] [CrossRef]
- Touyz, R.; Ríos, F.; Lopes, R.; Neves, K.; Camargo, L. Montezano, A. Oxidative stress: a unifying paradigm in hypertension. Can. J. Cardiol. 2020, 36, 659–670. [Google Scholar] [CrossRef]
- Wang, S.; Kaufman, R.J. The impact of the unfolded protein response on human disease. J. Cell. Biol. 2012, 197, 857–867. [Google Scholar] [CrossRef] [PubMed]
- Gago, B.; Lundberg, J.O.; Barbosa, R.M.; Laranjinha, J. Red wine-dependent reduction of nitrite to nitric oxide in the stomach. Free. Radic. Biol. Med. 2007, 43, 1233–1242. [Google Scholar] [CrossRef] [PubMed]
- Piacenza, L.; Zeida, A.; Trujillo, M.; Radi, R. The superoxide radical switch in the biology of nitric oxide and peroxynitrite. Physiol. Rev. 2022, 102, 1881–1906. [Google Scholar] [CrossRef] [PubMed]
- Nose F, Ichikawa T, Fujiwara M, Okayasu I. Up-regulation of cyclooxygenase-2 expression in lymphocytic thyroiditis and thyroid tumors: significant correlation with inducible nitric oxide synthase. Am J Clin Pathol. 2002, 117, 546–551. [Google Scholar] [CrossRef]
- Pérez-Torres, I.; Soto, M.E.; Guarner-Lans, V.; Manzano-Pech, L.; Soria-Castro, E. The possible role of glucose-6-phosphate dehydrogenase in the SARS-CoV-2 Infection. Cells. 2022, 11, 1982. [Google Scholar] [CrossRef]
- Peiró, C.; Romacho, T.; Azcutia, V.; Villalobos, L.; Fernández, E.; Bolaños, J.; Moncada, S; Sánchez-Ferrer, C. Inflammation, glucose, and vascular cell damage: the role of the pentose phosphate pathway. Cardiovasc. Diabetol. 2016, 15, 82. [Google Scholar] [CrossRef]
- Ajiboye, T.; Raji, H.; Adeleye, A.; Adigun, N.; Giwa, O.; Ojewuji, O.; Oladiji, A. Hibiscus sabdariffa calyx palliates insulin resistance, hyperglycemia, dyslipidemia and oxidative rout in fructose-induced metabolic syndrome rats. J. Sci. Food. Agric. 2016, 96, 1522–1531. [Google Scholar] [CrossRef]
- Modrick, M.; Didion, S.; Lynch, C.; Dayal, S.; Lentz, S.; Faraci, F. Role of hydrogen peroxide and the impact of the glutathione peroxidase-1 in regulation of cerebral tone vascular. J. Cereb. Blood. Flow. Metab. 2009, 29, 1130–1137. [Google Scholar] [CrossRef]
- White, P. Selenium accumulation by plants. Ann. Bot. 2016, 117, 217–235. [Google Scholar] [CrossRef]
- Hariharan, S.; Dharmaraj, S. Selenium and selenoproteins: it’s role in regulation of inflammation. Inflammopharmacology. 2020, 28, 667–695. [Google Scholar] [CrossRef]
- Du, Y.; Zhang, H.; Lu, J.; Holmgren, A. Glutathione and glutaredoxin act as a backup of human thioredoxin reductase 1 to reduce thioredoxin 1 preventing cell death by aurothioglucose. J. Biol. Chem. 2012, 287, 38210–38219. [Google Scholar] [CrossRef] [PubMed]
- Krajka-Kuzniak, V.; Szaefer, H.; Baer-Dubowska, W. Hepatic and extrahepatic expression of glutathione S-transferase isozymes in mice and its modulation by naturally occurring phenolic acids. Environ. Toxicol. Pharmacol. 2008, 25, 27–32. [Google Scholar] [CrossRef] [PubMed]
- Hayeshi, R.; Mutingwende, I.; Mavengere, W.; Masiyanise, V.; Mukanganyama, S. The inhibition of human glutathione S- transferases activity by plant polyphenolic compounds ellagic acid and curcumin. Food. Chem. To.
- Terada, A.; Yoshida, M.; Seko, Y.; Kobayashi, T.; Yoshida, K.; Nakada, M.; Nakada, K.; Echizen, H.; Ogata, H.; Rikihisa, T. Active oxygen species generation and cellular damage by additives of parenteral preparations: Selenium and sulfhydril compounds. Nutr. J. 1999, 15, 651–655. [Google Scholar] [CrossRef] [PubMed]
- Roth, J.P.; Cramer, C.J. Direct examination of H2O2 activation by a heme peroxidase. J. Am. Chem. Soc. 2008, 130, 7802–7803. [Google Scholar] [CrossRef]
- Malle, E.; Buch, T.; Hermann-Josef, G. Myeloperoxidase in kidney disease. Kidney Int. 2003, 64, 1956–1967. [Google Scholar] [CrossRef]
- Aisa-Alvarez, A.; Soto, M.; Guarner-Lans, V.; Camarena-Alejo, G.; Franco-Granillo, J.; Martínez-Rodríguez, E.; Gamboa, R.; Manzano, L.; Pérez-Torres, I. Usefulness of antioxidants as adjuvant therapy for septic shock: A randomized clinical trial. Medicina. 2020, 56, 619. [Google Scholar] [CrossRef]
- Shen, D.; Dalton, T.P.; Nebert, D.W.; Shertzer, H.G. Glutathione redox state regulates mitochondrial reactive oxygen production. J. Biol. Chem. 2005, 280, 25305–25312. [Google Scholar] [CrossRef]
- Handy, D.E.; Loscalzo, J. Responses to Reductive Stress in the Cardiovascular System Free. Radic. Biol. Med. 2017, 109, 114–124. [Google Scholar] [CrossRef]
Figure 1.
Values of Δ-PP in the kidney exerted by Ne on renal vascular resistance (a), and Δ-PP in the kidney exerted by Ach on renal vascular resistance (b). (n=7), results expressed as mean ± standard error.
Figure 1.
Values of Δ-PP in the kidney exerted by Ne on renal vascular resistance (a), and Δ-PP in the kidney exerted by Ach on renal vascular resistance (b). (n=7), results expressed as mean ± standard error.
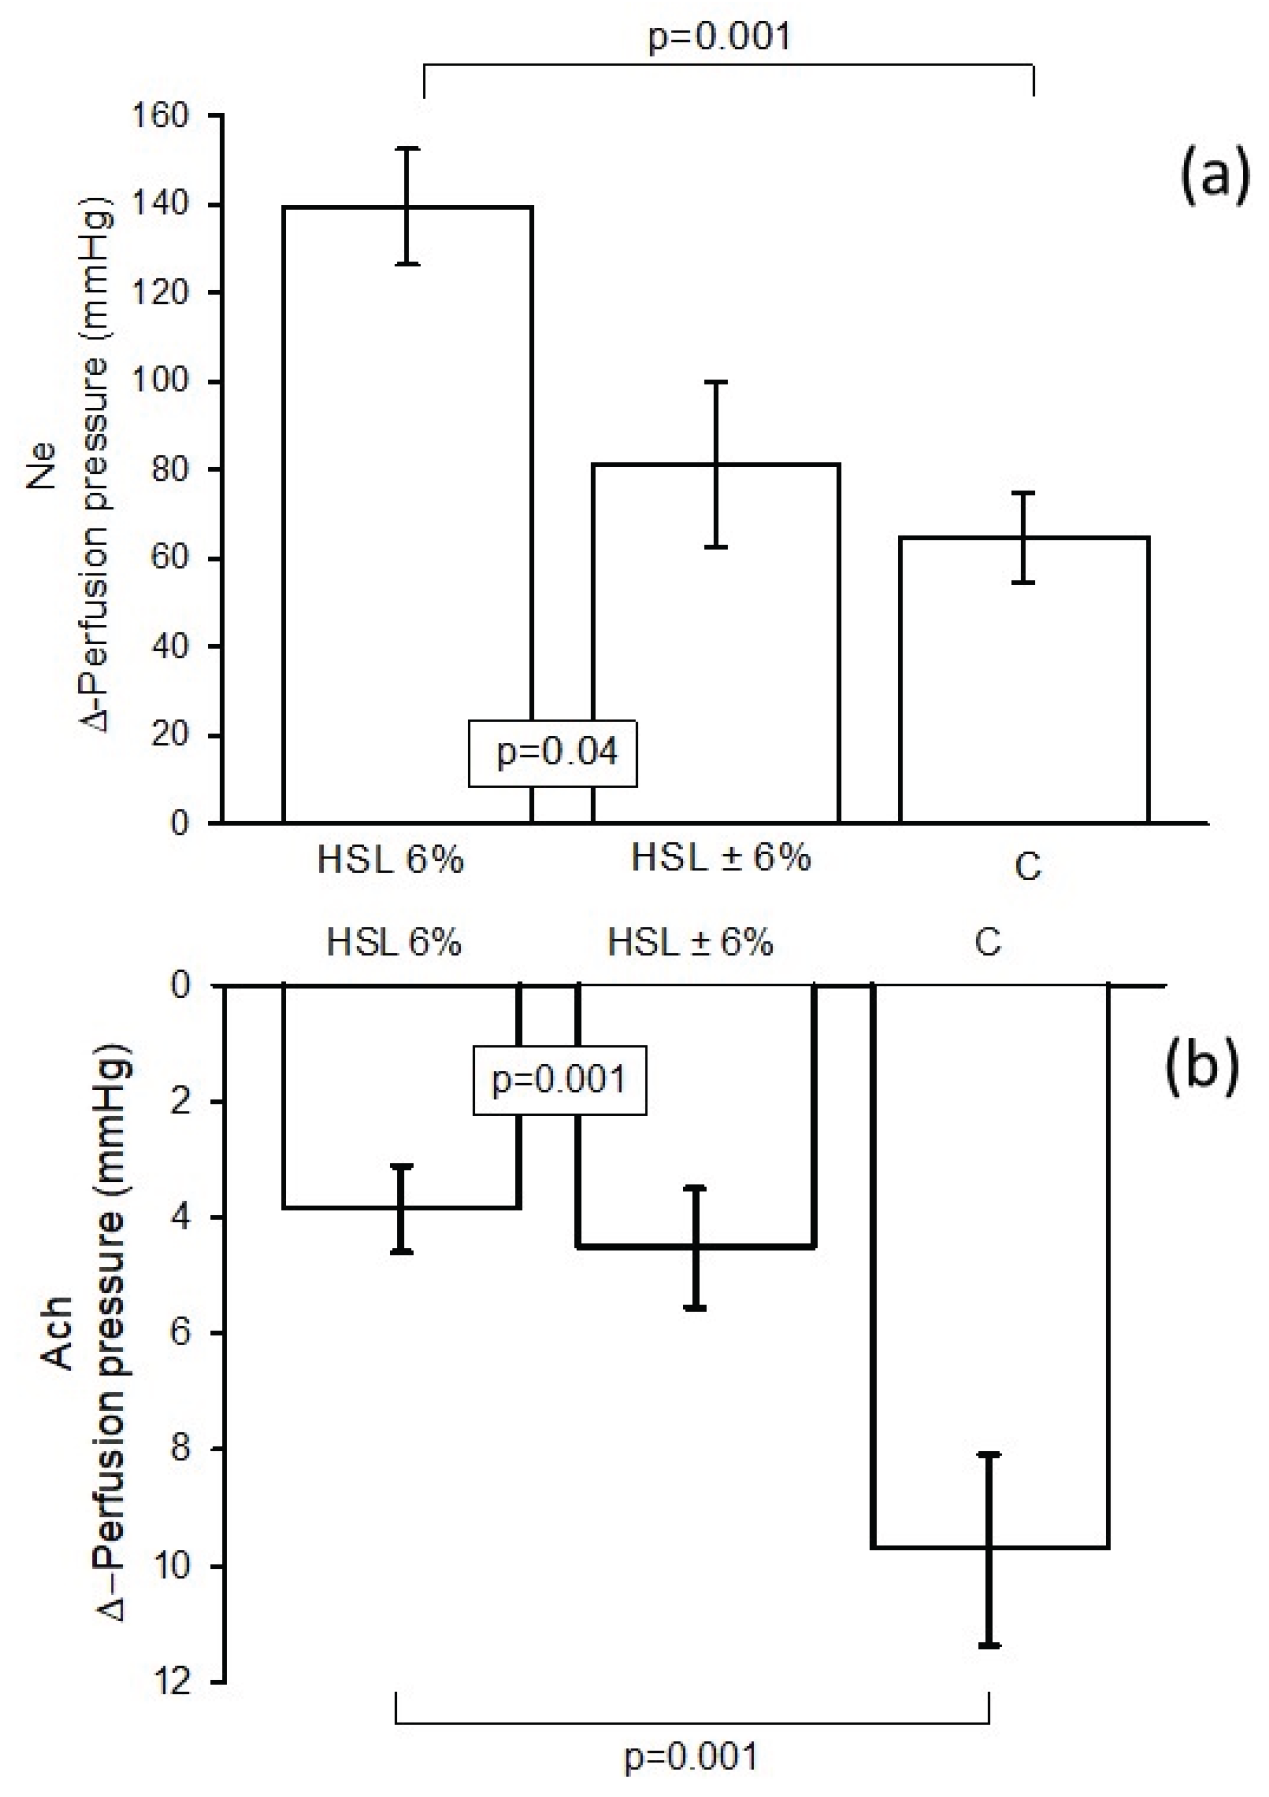
Figure 2.
Values of Δ-PP in the kidney when exposed to O2–(a), H2O2 (b) and ONOO– (c), on renal vascular resistance in the experimental groups (n=7), results expressed as mean ± standard error.
Figure 2.
Values of Δ-PP in the kidney when exposed to O2–(a), H2O2 (b) and ONOO– (c), on renal vascular resistance in the experimental groups (n=7), results expressed as mean ± standard error.
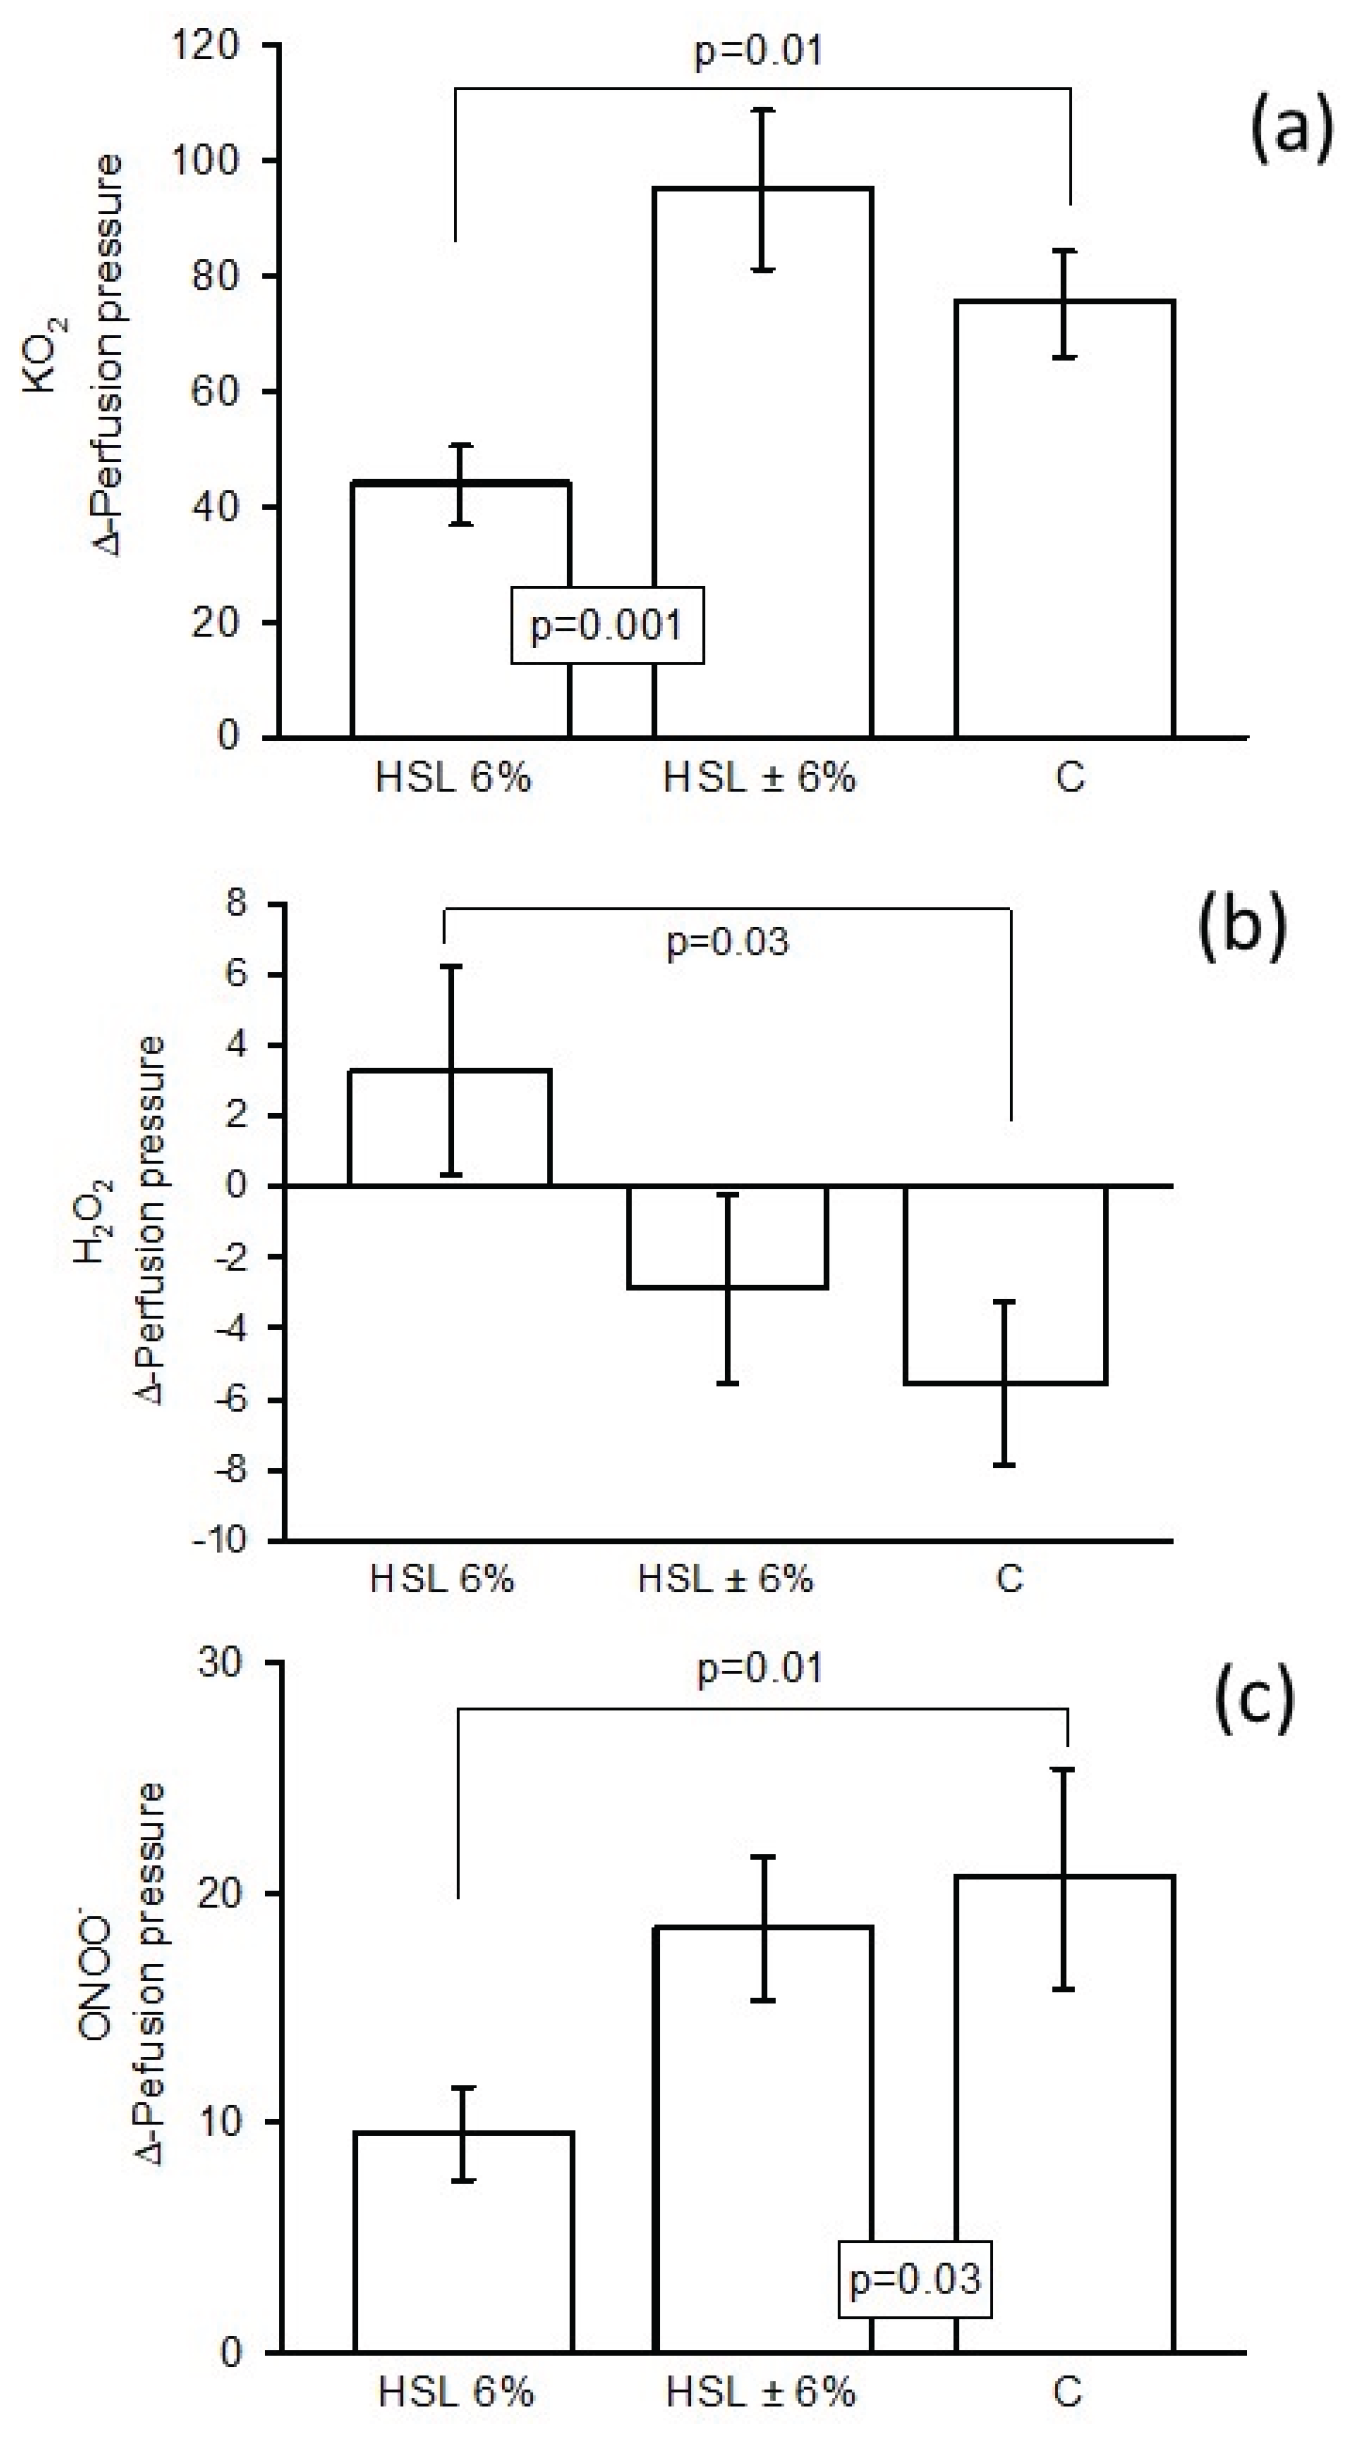
Figure 4.
Panels (a), (b), (c) show the representative histological sections of a glomerulus in each of the 3 experimental groups. Panel (d) shows the area of the glomeruli analyzed by densitometry in the experimental groups. Masson’s trichrome technique (25x). Abbreviations: A = HSL 6%, B = HSL ± 6% and C = Control. The dark bar represents 50 µM.
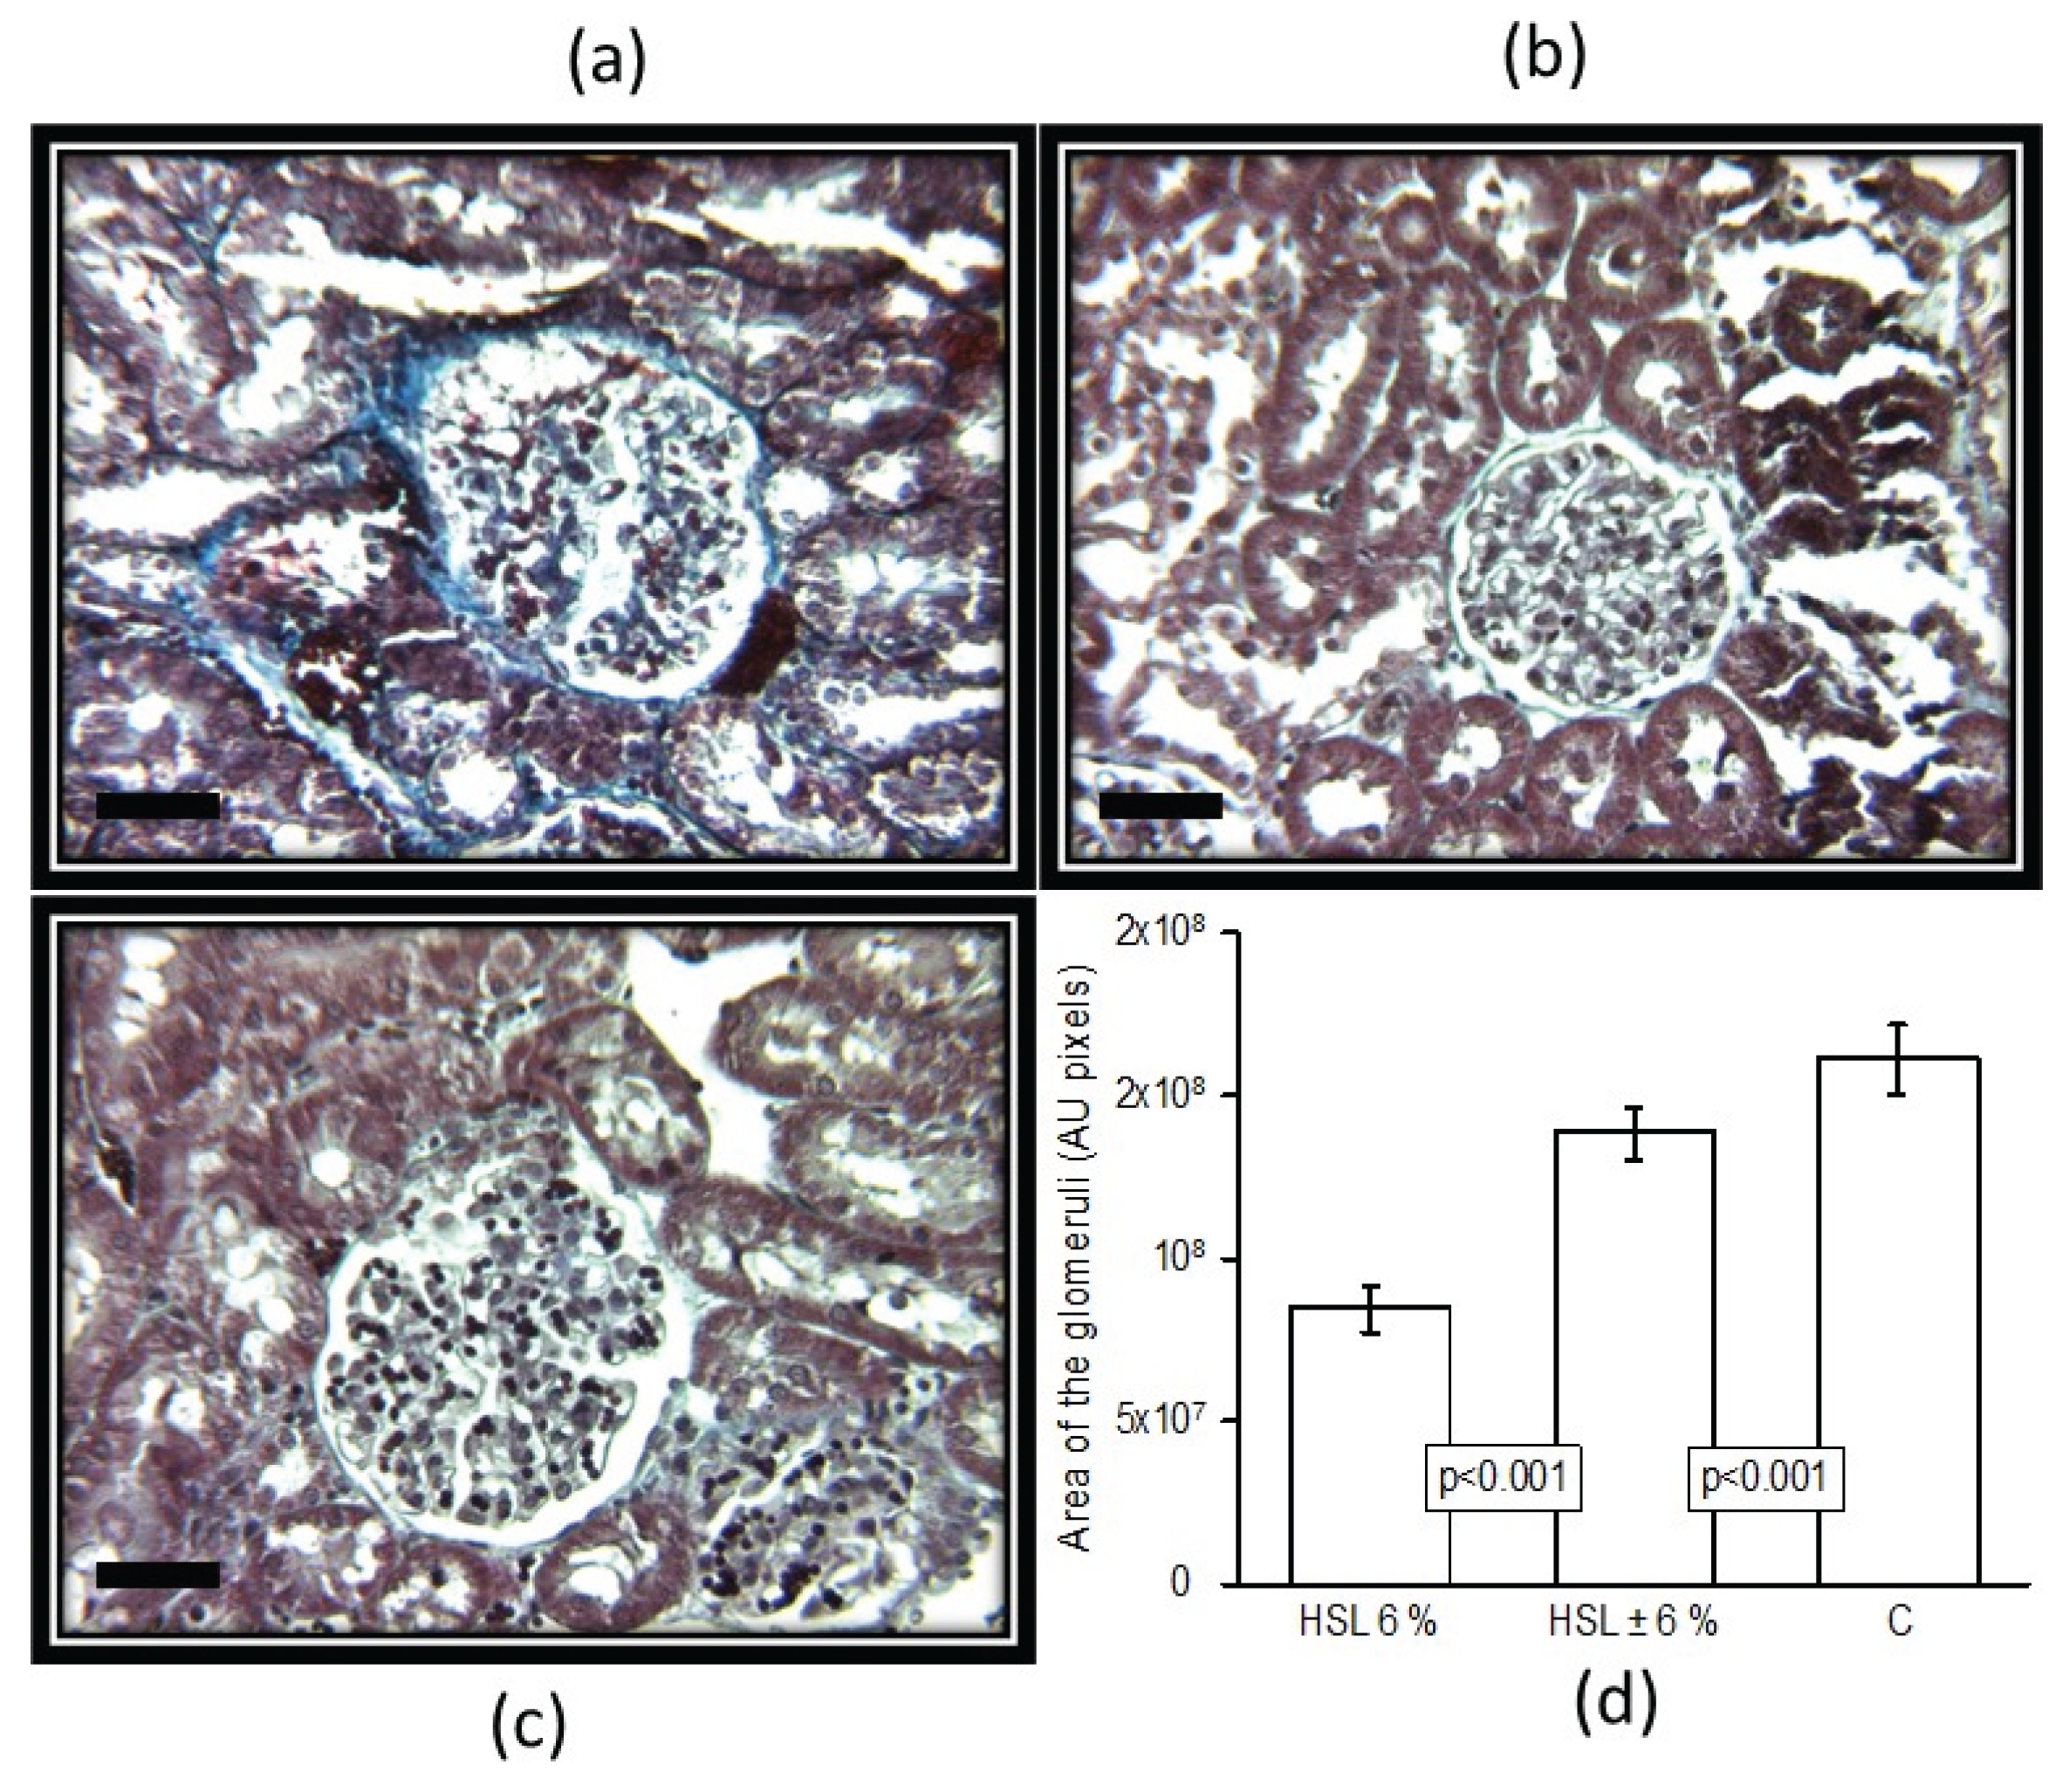
Figure 5.
Enzymatic activities of CAT (a) and peroxidases (b) in an 8% native polyacrylamide gel. The images below the histograms represent the activity levels. Values are expressed as mean ± standard error (n=7).
Figure 5.
Enzymatic activities of CAT (a) and peroxidases (b) in an 8% native polyacrylamide gel. The images below the histograms represent the activity levels. Values are expressed as mean ± standard error (n=7).
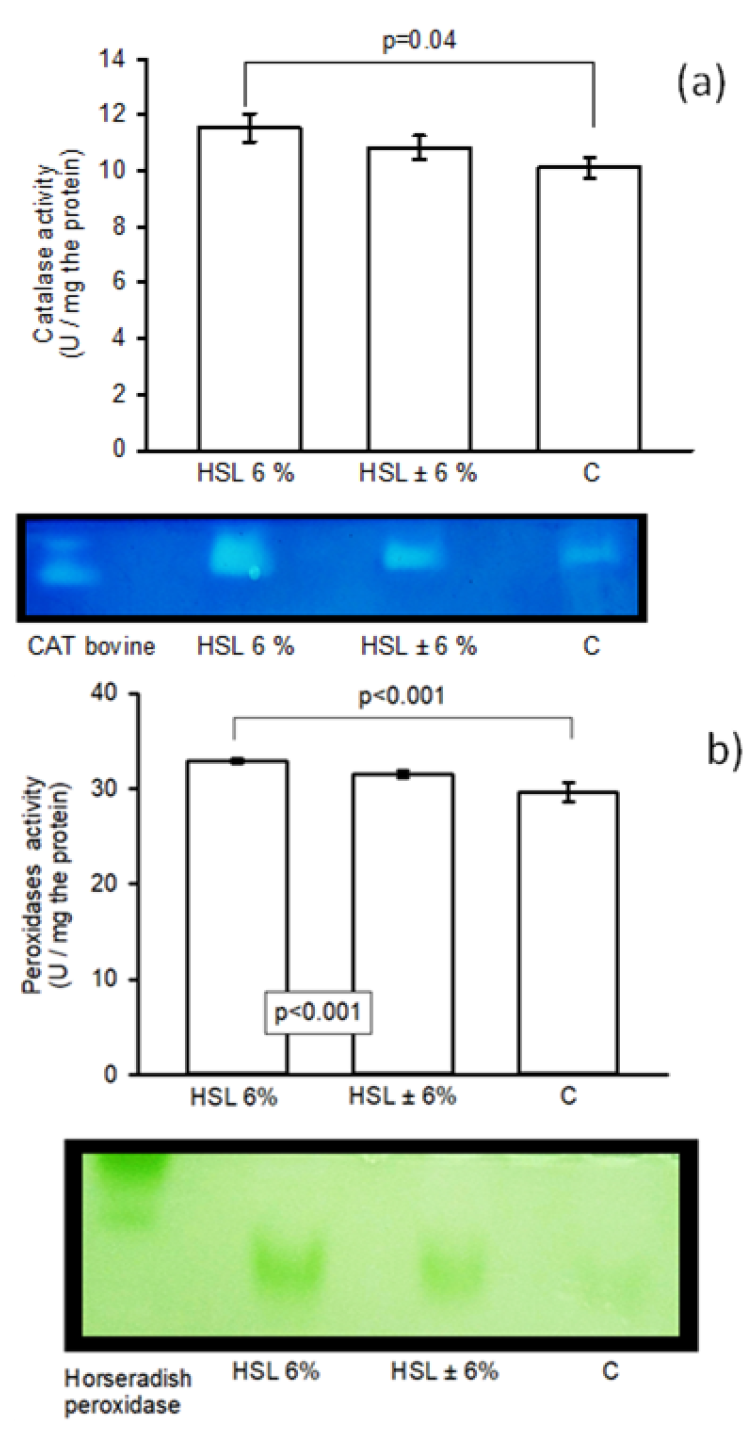
Figure 6.
Enzymatic activity of SOD isoforms in an 8% native polyacrylamide gel. The image in the center of the histogram shows the activity of both isoforms. Values are expressed as mean ± standard error (n=7).
Figure 6.
Enzymatic activity of SOD isoforms in an 8% native polyacrylamide gel. The image in the center of the histogram shows the activity of both isoforms. Values are expressed as mean ± standard error (n=7).
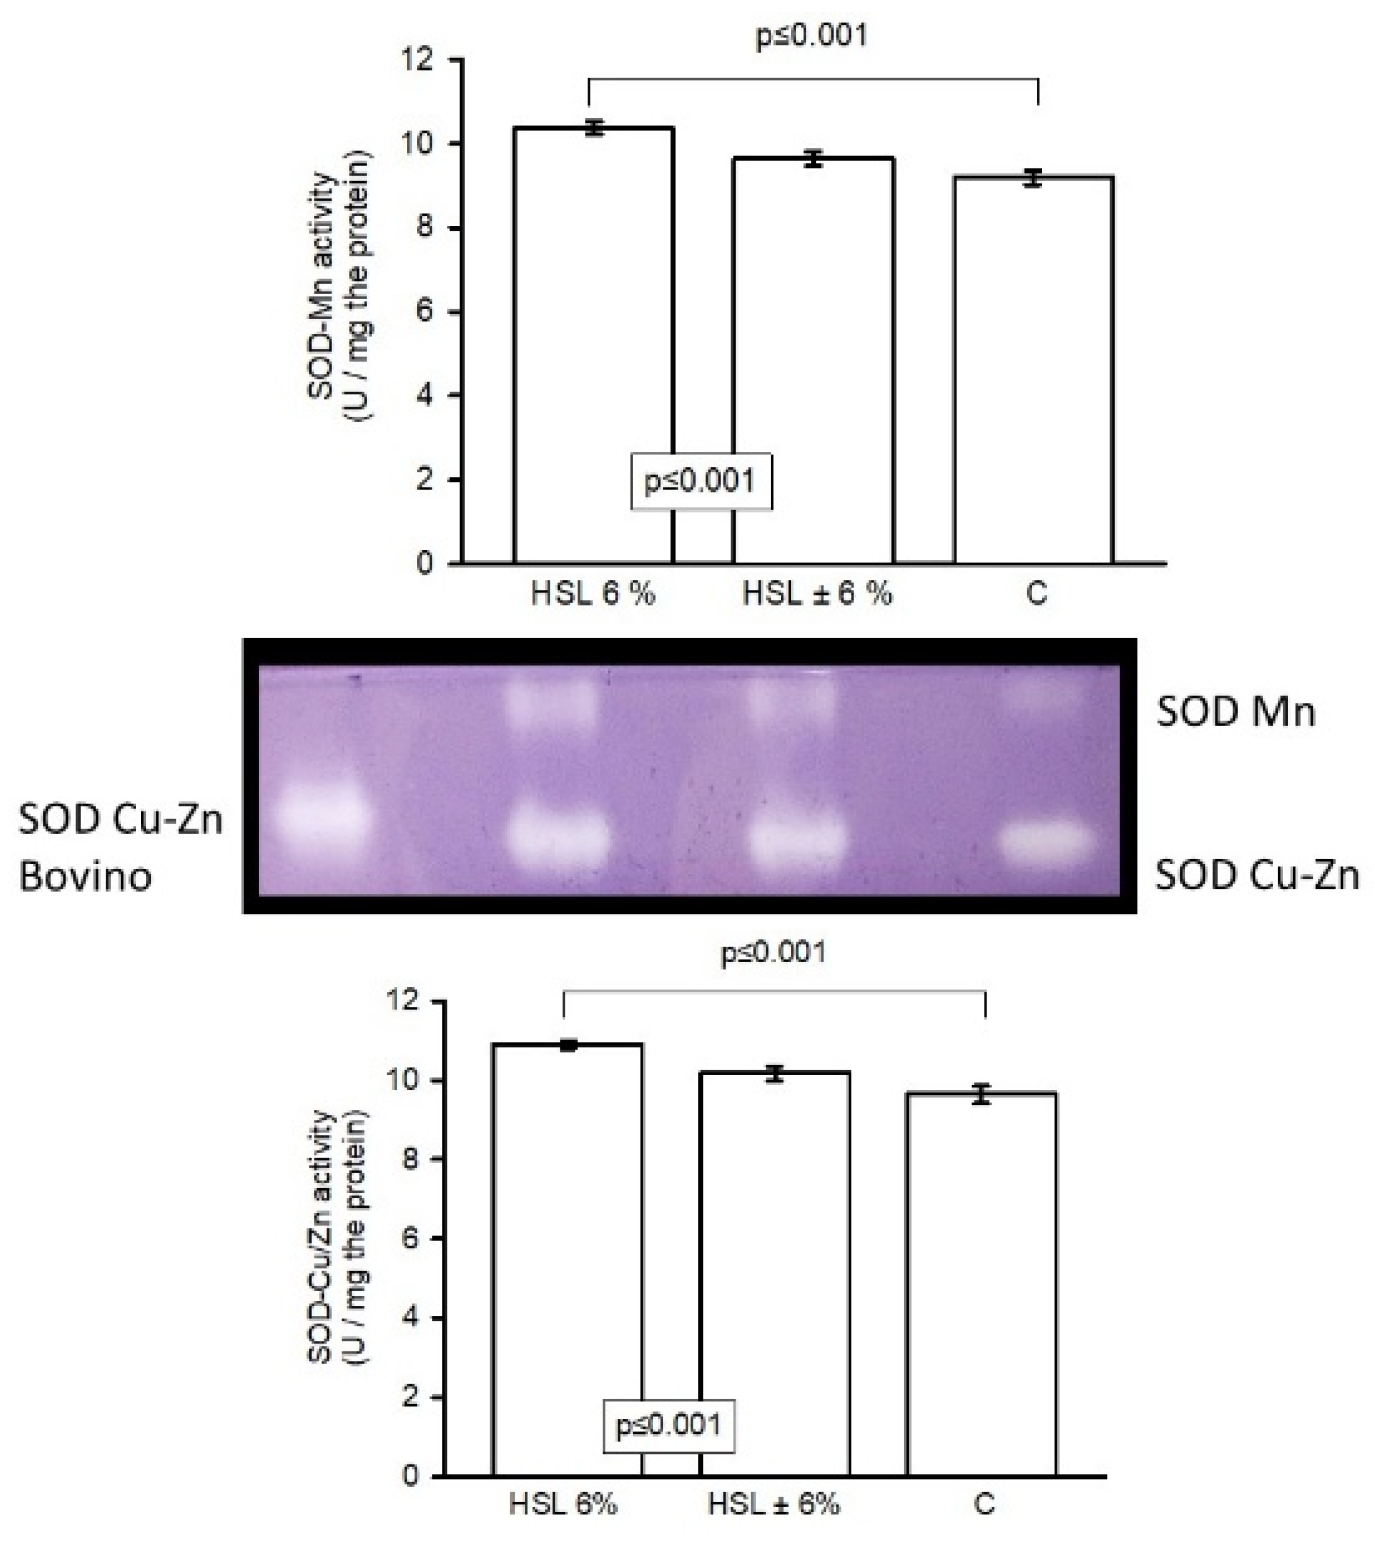
Figure 7.
Activities of GST, GR, GPx and TrxR (Panels a, b, c and d, respectively) of antioxidant enzymes that employ GHS as a cofactor in the ROS detoxification process in the three experimental groups. Values are expressed as mean ± standard error (n=7).
Figure 7.
Activities of GST, GR, GPx and TrxR (Panels a, b, c and d, respectively) of antioxidant enzymes that employ GHS as a cofactor in the ROS detoxification process in the three experimental groups. Values are expressed as mean ± standard error (n=7).
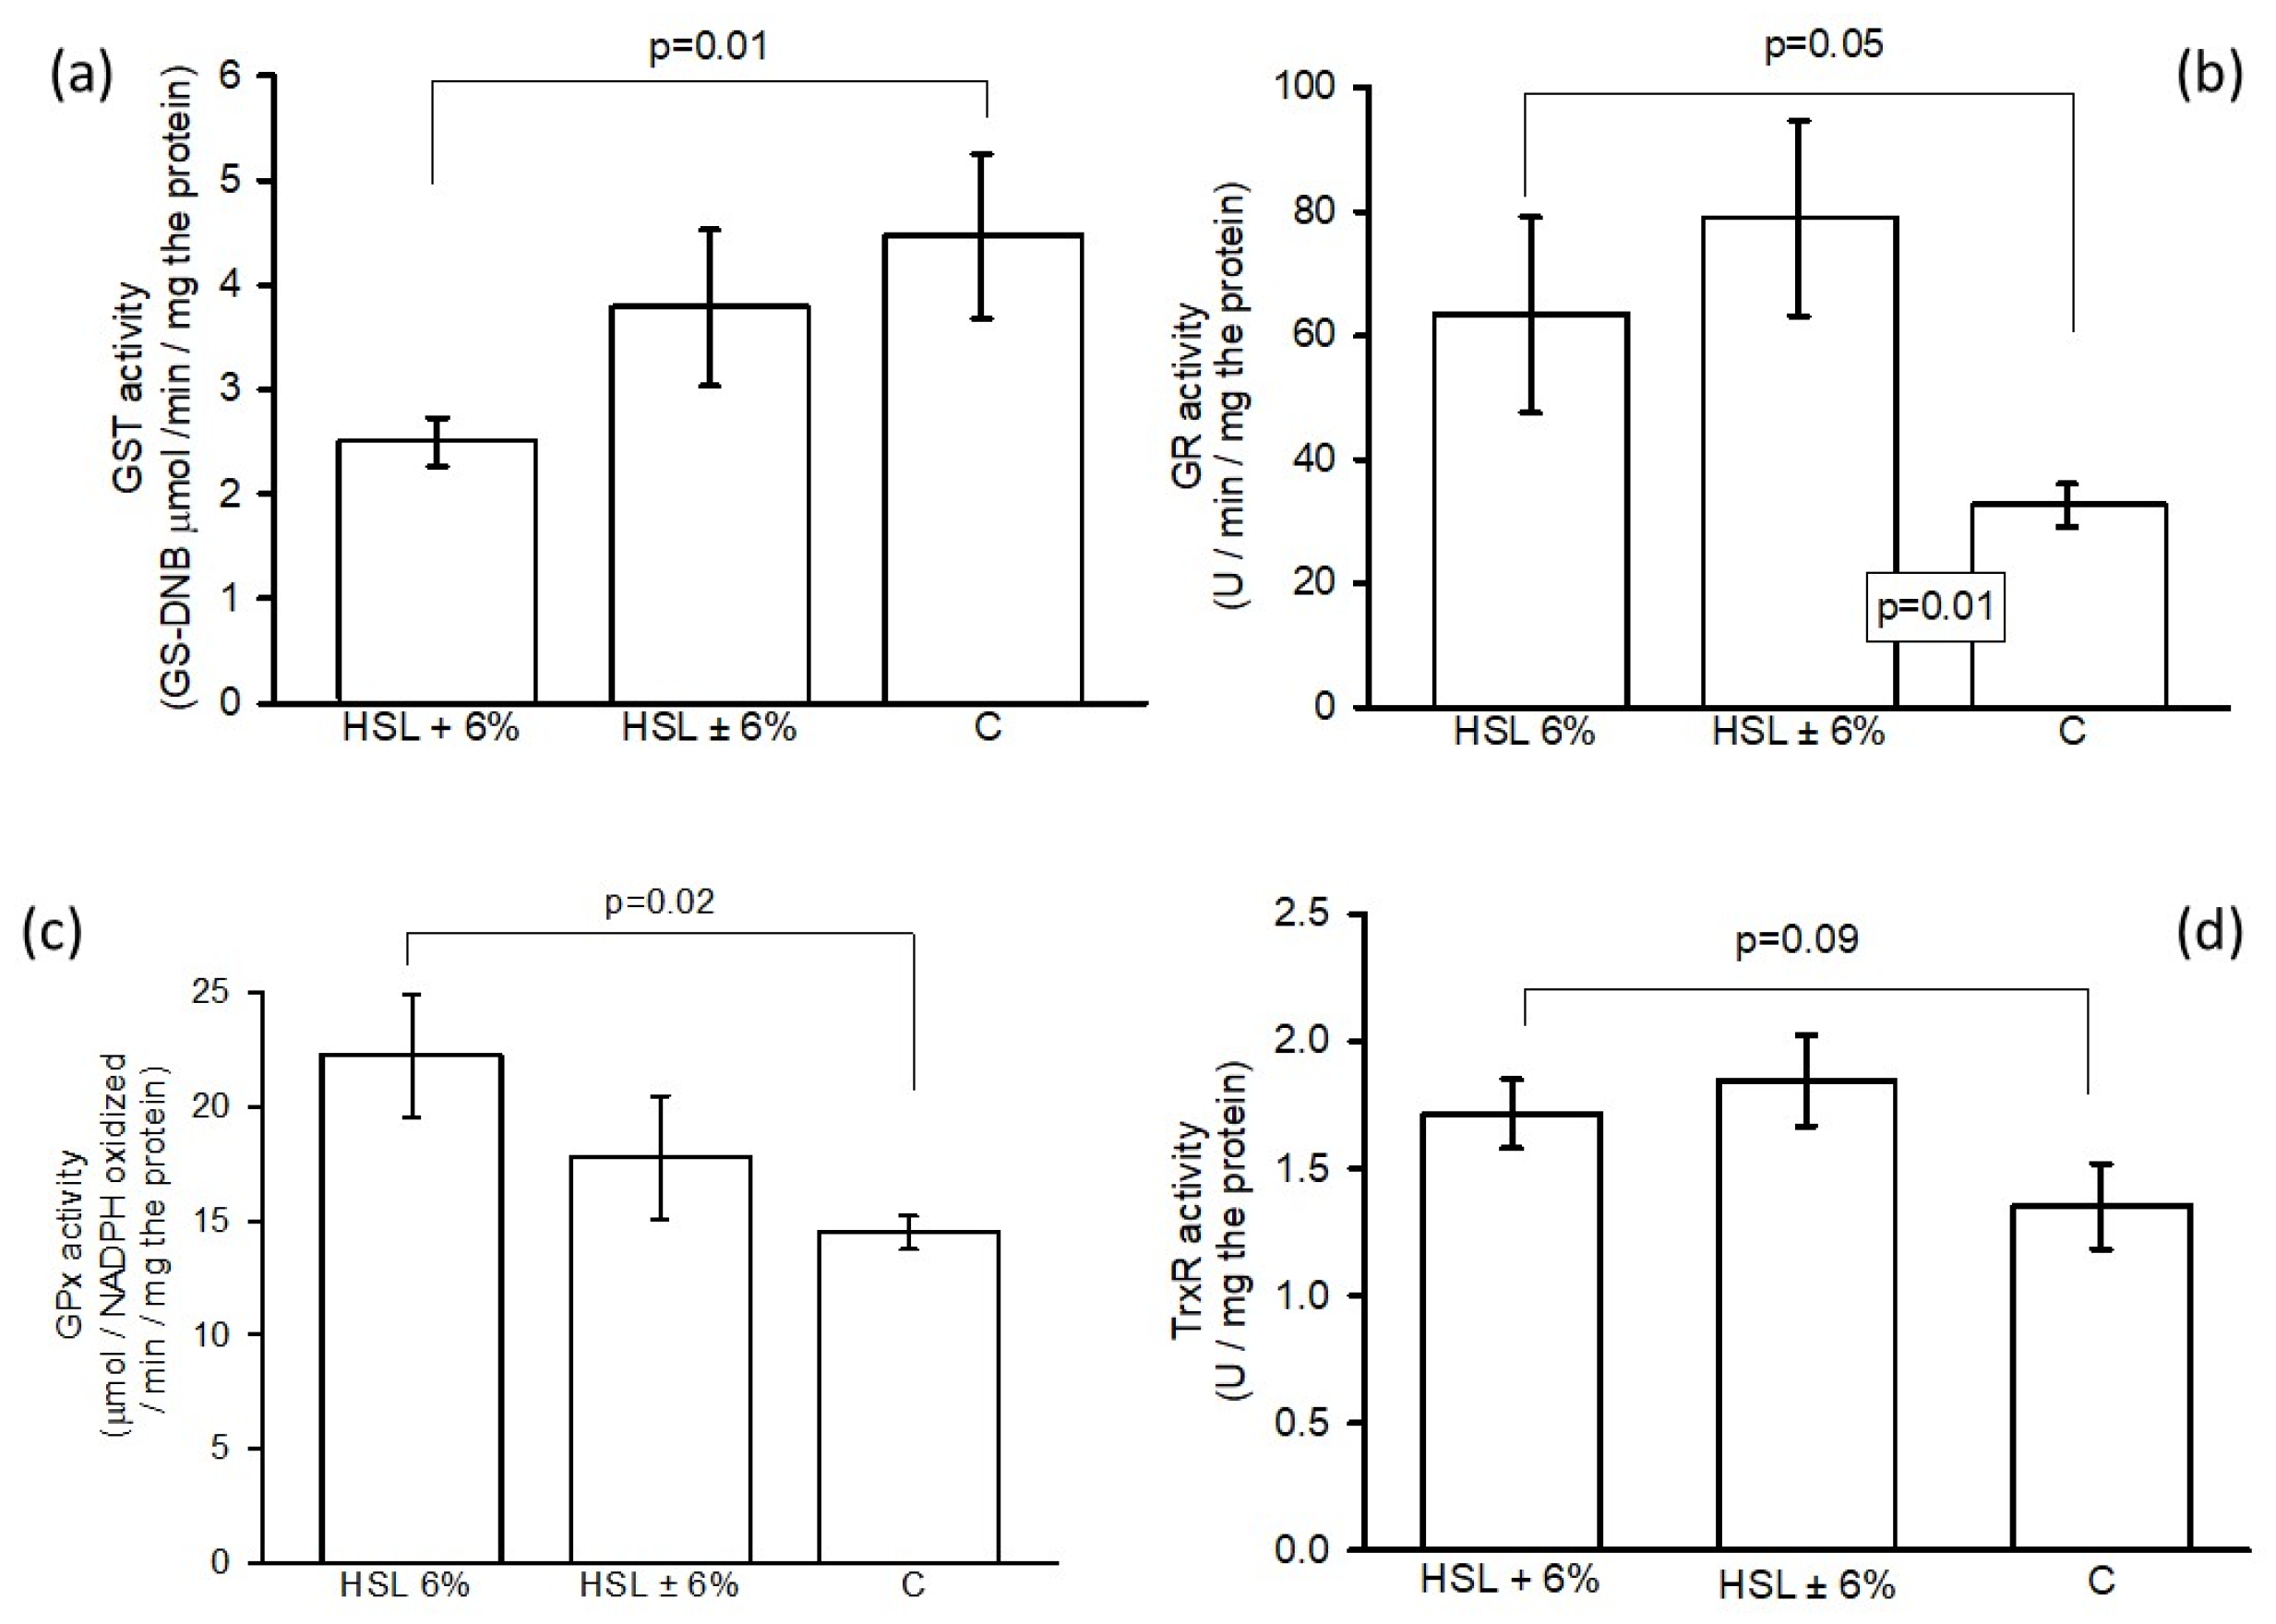
Figure 8.
G6PD activity (a) and NrF2/β-actin ratio expression (b) in the three experimental groups in kidney homogenate. Values are expressed as mean ± standard error (n=7).
Figure 8.
G6PD activity (a) and NrF2/β-actin ratio expression (b) in the three experimental groups in kidney homogenate. Values are expressed as mean ± standard error (n=7).
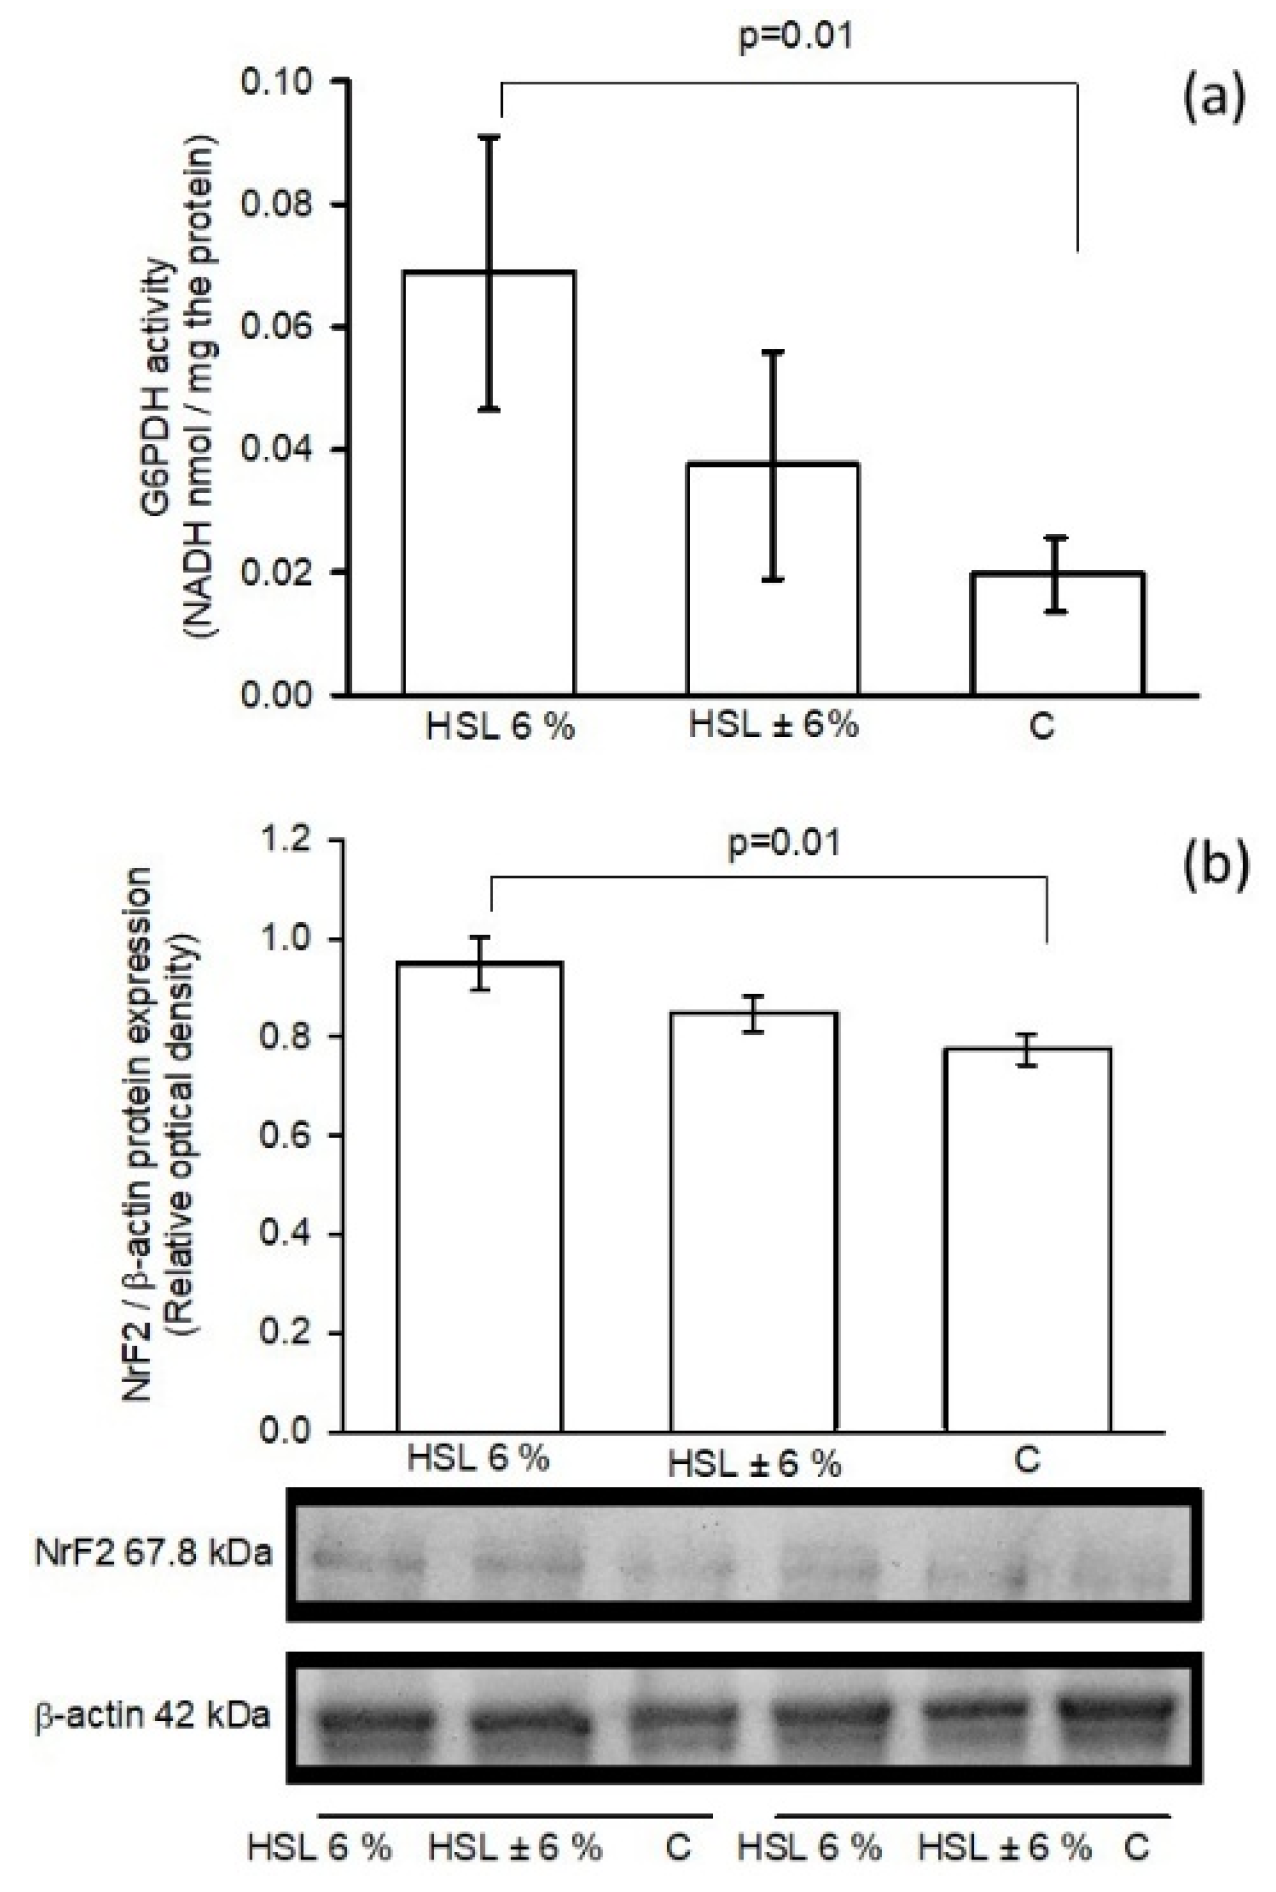
Figure 9.
Indirect determination of O2– anion production by the irreversible oxidation of epinephrine to adenochrome in kidney homogenates in the three experimental groups. Values are expressed as the mean ± standard error of the relative optical density, (n=7).
Figure 9.
Indirect determination of O2– anion production by the irreversible oxidation of epinephrine to adenochrome in kidney homogenates in the three experimental groups. Values are expressed as the mean ± standard error of the relative optical density, (n=7).
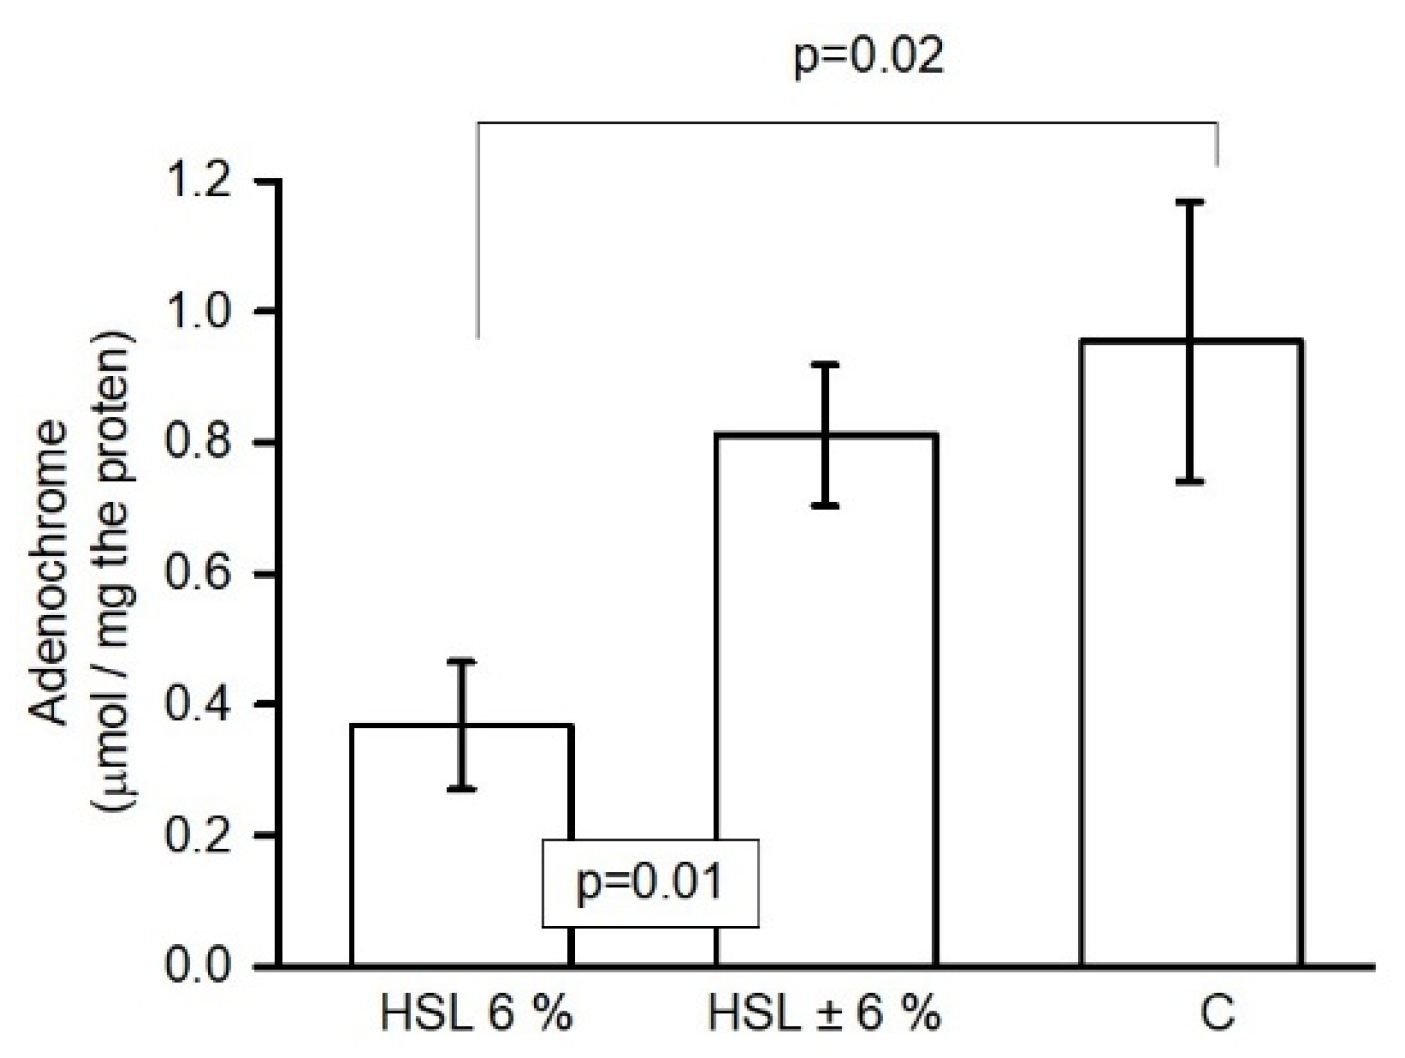
Figure 10.
Summary of the alteration in physiological and anatomical changes in the kidney in response to 6 % HSL infusions. These changes are accompanied by alterations of the enzymatic and non-antioxidant systems that contribute to the RS generation which results in elevated systemic blood pressure in rats. Abbreviations; CAT= Catalase, Nrf2 = nuclear factor erythroid 2-related factor 2, TrxR = thioredoxin reductase, GPx = glutathione reductase, GST = glutathione-S-transferase, SOD = superoxide dismutase, PPP= Polyol pathway, CCr = Creatinine clearance, G6PD = Glucose-6-phosphate dehydrogenase, GR = glutathione reductase, GSH = glutathione, GSSG = oxidized glutathione, GST = glutathione-S-transferase, H2O2 = hydrogen peroxide, HSL= Hibiscus Sabdariffa Linnaeus, iNOS = inducible nitric oxide synthase, NADPH+ = nicotinamide adenine dinucleotide phosphate, NO3−/NO2− = nitrate/nitrite ratio, O2− = superoxide anion, PAS = systolic blood pressure, Se = selenium. Up arrow = increase, down arrow = decresease.
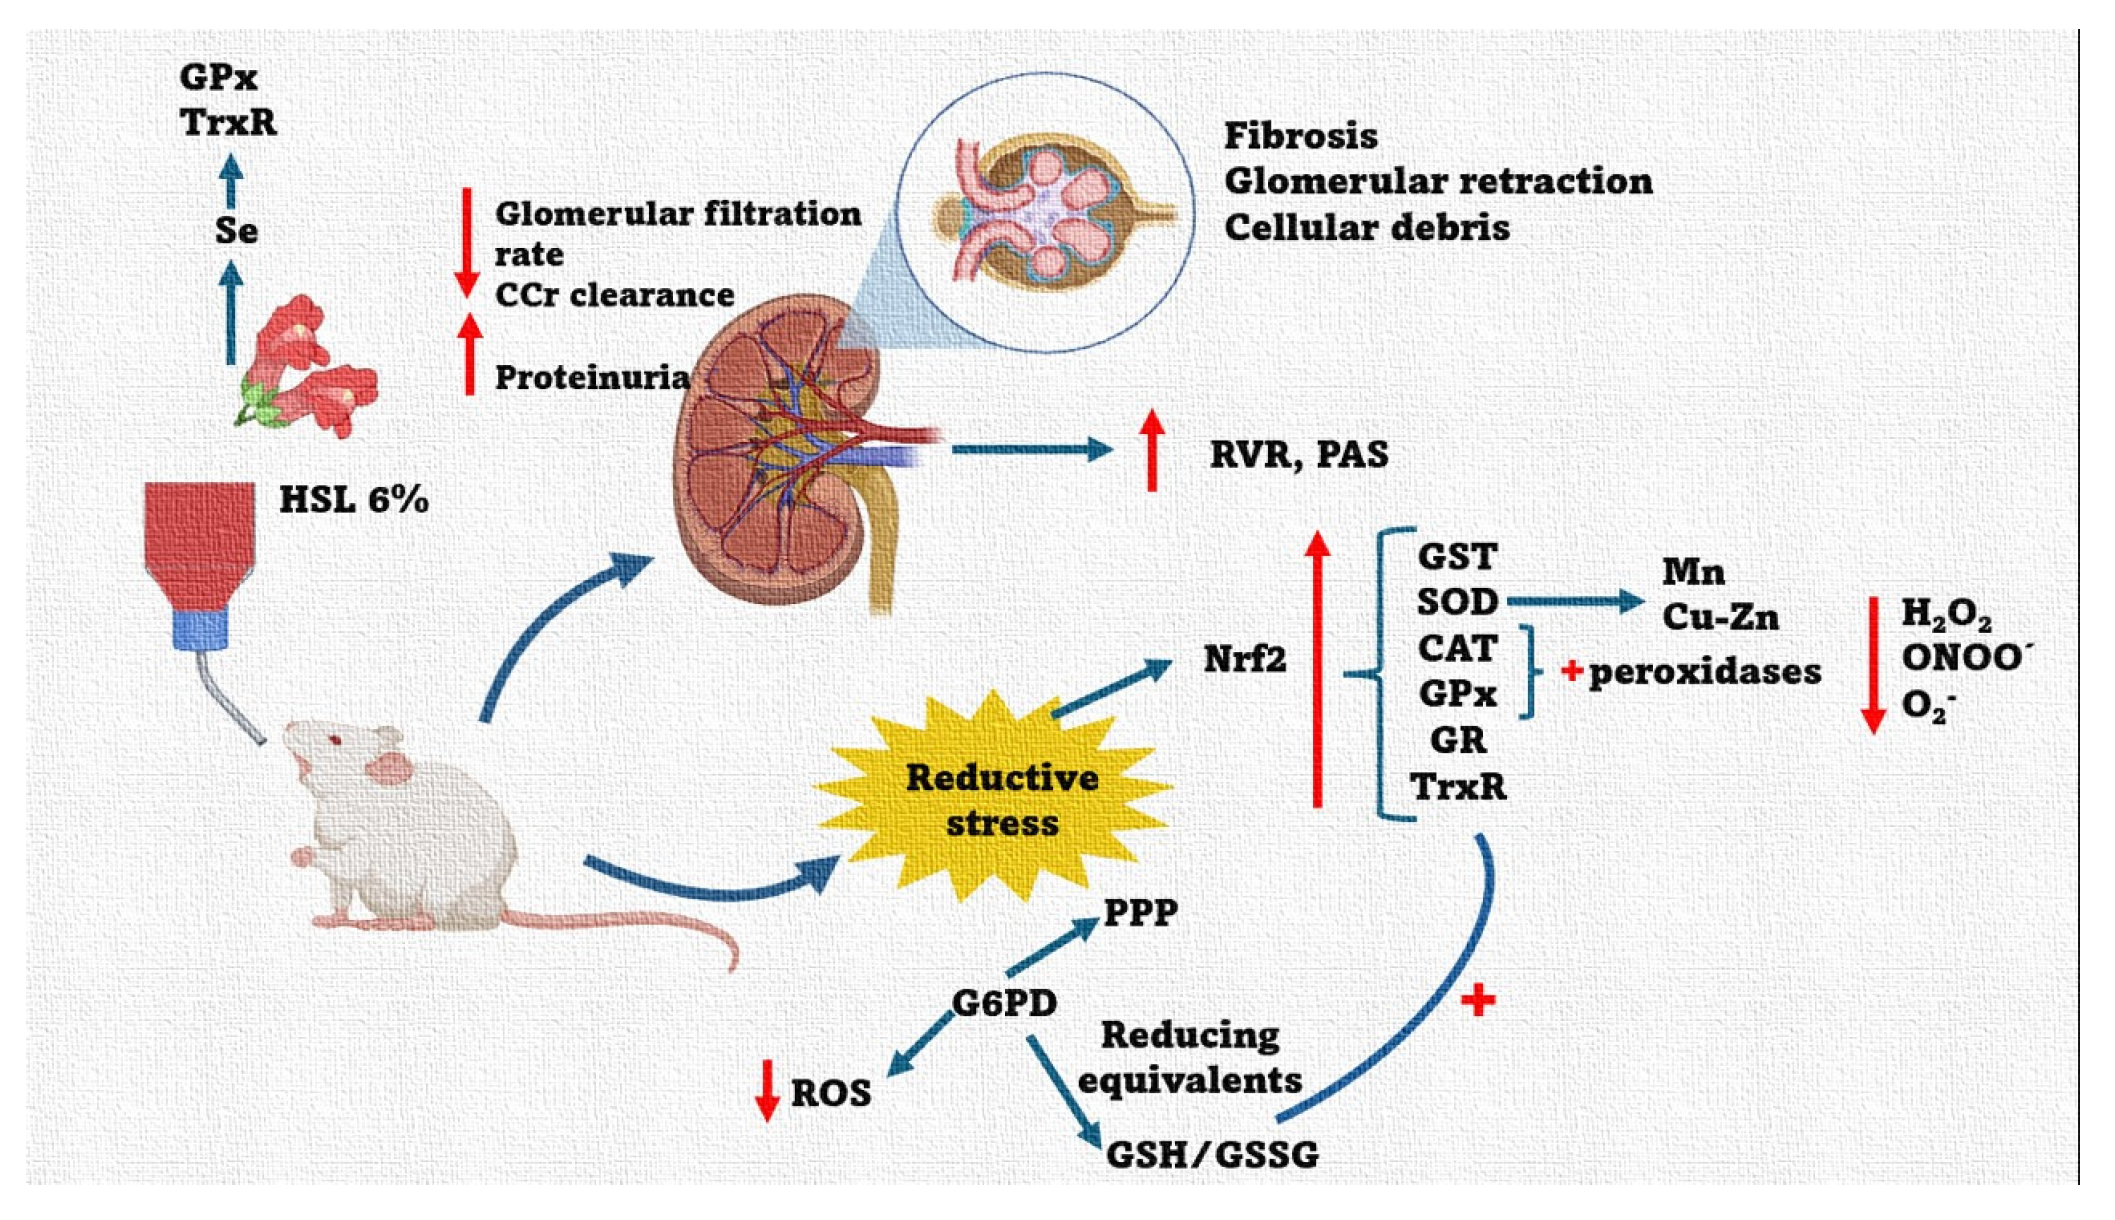

Table 1.
General characteristics and renal function markers in the groups of rats of the experimental groups.
Table 1.
General characteristics and renal function markers in the groups of rats of the experimental groups.
| Variables | HSL 6% | HSL ± 6% | C |
|---|---|---|---|
| Drinking water (mL/24 h) | 13.4 ± 1.3** | 29.8 ± 2.7 | 25.4 ± 2.6 |
| Weight of the right kidney (g) | 1.2 ± 0.05 | 1.1 ± 0.05 | 1.2 ± 0.03 |
| Urine (mL/24 h) | 7.7 ± 0.8* | 21.1 ± 1.8 | 18.7 ± 4.5 |
| CCr (mL/min) | 0.05 ± 0.015** | 0.93 ± 0.29* | 1.61 ± 0.86 |
| Albuminuria (mg/mL) | 2.12 ± 0.30** | 0.98 ± 0.17 | 1.38 ± 0.26 |
| Systolic blood pressure (mmHg) | 145.2 ± 4.4** | 126.6 ± 2.1* | 118.7 ± 2.2 |
| Body weight (g) | 351.7 ± 17.0 | 341.0 ± 6.3 | 324.6 ± 6.9 |
**C and HSL ± 6% vs. HSL 6% p=0.001, * C and HSL ± 6% vs. HSL 6% p=0.01. Abbreviations: CCr= Creatinine clearance.
Table 2.
Markers of the non-enzymatic antioxidant system in experimental groups.
| Variables (mg the protein) | HSL 6% | HSL ± 6% | C |
|---|---|---|---|
| GSH/GSSG ratio (μM) | 0.024 ± 0.003* | 0.023 ± 0.002† | 0.016 ± 0.002 |
| TAC (nM) | 148.3 ± 21.9** | 136.6 ± 12.2* | 100.9 ± 8.4† |
| NO3–/NO2– ratio (nM) | 0.19 ± 0.01** | 0.06 ± 0.02** | 0.04 ± 0.01† |
| Thiols (μM) | 74.6 ± 35.8** | 120.2 ± 10.5** | 142.4 ± 30.6† |
**C and HSL ± 6% vs. HSL 6% p=0.01, * HSL ± 6% vs. HSL 6% p=0.04 †C vs. HSL ± 6% p=0.02.
Disclaimer/Publisher’s Note: The statements, opinions and data contained in all publications are solely those of the individual author(s) and contributor(s) and not of MDPI and/or the editor(s). MDPI and/or the editor(s) disclaim responsibility for any injury to people or property resulting from any ideas, methods, instructions or products referred to in the content. |
© 2025 by the authors. Licensee MDPI, Basel, Switzerland. This article is an open access article distributed under the terms and conditions of the Creative Commons Attribution (CC BY) license (http://creativecommons.org/licenses/by/4.0/).
Copyright: This open access article is published under a Creative Commons CC BY 4.0 license, which permit the free download, distribution, and reuse, provided that the author and preprint are cited in any reuse.


