Submitted:
07 February 2026
Posted:
10 February 2026
You are already at the latest version
Abstract
Municipal solid waste (MSW) management remains a persistent sustainability chal-lenge in low- and middle-income countries, where uneven service coverage and rapid spatial change produce heterogeneous household disposal behaviours and substantial environmental externalities. This study develops a spatially explicit Bayesian network framework to map and explain six dominant household solid-waste disposal pathways across Eswatini using enumeration areas (EAs; n = 2,326) and nationally consistent census-linked predictors. Separate Tree-Augmented Naïve Bayes (TAN) models were trained for regular collection, irregular collection, open burning, public dumping, backyard pit disposal, and undesignated disposal, integrating socio-demographic, in-frastructural, accessibility, environmental, and neighbourhood-context variables, while explicitly quantifying predictive uncertainty using posterior entropy and Kull-back–Leibler (KL) divergence. Hold-out evaluation (465 test EAs; 1,861 training EAs) shows strong pathway-specific performance, with overall accuracy ranging from 0.497-0.989 across targets and ex-pected-value prediction errors of RMSE = 0.148-0.289 and MAE = 0.141-0.242. Uncer-tainty surfaces reveal low entropy in structurally homogeneous, well-served urban cores and elevated uncertainty in peri-urban transition zones where disposal behav-iours are mixed and services are unreliable. KL divergence highlights a limited subset of EAs where local conditions strongly update national expectations—priority loca-tions for targeted interventions and improved data collection. The framework provides policy-ready, uncertainty-aware evidence to support area-based service planning and sub-national monitoring relevant to SDG 11.6.1 in data-constrained contexts.
Keywords:
municipal solid waste
; household waste disposal
; spatial bayesian networks
; uncertainty mapping
; neighbourhood effects
; peri-urban sustainability
; SDG 11.6.1
; open burning
; waste governance
; Eswatini
1. Introduction
Municipal solid waste (MSW) management is widely recognised as a foundational public service for sustainable development, linking environmental protection, public health, climate mitigation, urban liveability, and social equity. Yet globally, MSW systems remain under severe strain. The World Bank estimates that the world generated 2.01 billion tonnes of municipal solid waste in 2016, projected to rise to 3.40 billion tonnes by 2050, with at least 33% of waste currently mismanaged through open dumping or open burning under conservative assumptions [1]. These trends are especially acute in rapidly urbanising regions where infrastructure expansion and service financing lag behind population growth, resulting in persistent exposure to unmanaged waste, uncontrolled dumpsites, and household-level coping practices such as burning or informal disposal [1,2,3]. The sustainability implications are multi-dimensional: mismanaged waste contributes to local air pollution and toxic emissions (notably from plastic burning), surface- and groundwater contamination, biodiversity impacts, and increased disaster risk through blocked drainage and flood amplification in urban and peri-urban settings [2,3,4,5].
A critical feature of MSW challenges in low- and middle-income countries is not only the inadequacy of formal collection and treatment, but also the heterogeneity of household behaviours and service environments within the same country or even within the same municipality. Households often switch among multiple disposal methods depending on distance to collection points, service reliability, affordability, enforcement, availability of private or municipal operators, and local norms [2,3,6]. As a result, the distribution of disposal behaviours tends to be strongly spatial: clusters of open dumping, illegal dumping, and burning often coincide with infrastructure gaps, marginalised settlements, and peri-urban expansion zones where governance, planning, and land tenure may be contested or rapidly changing [2,3,7].
Within this context, evidence-based waste governance requires decision-support tools that can: (i) identify where different disposal behaviours dominate; (ii) explain the most plausible drivers in each setting; and (iii) quantify uncertainty so that interventions can be targeted efficiently and ethically. Deterministic "single-value" maps can be useful but may obscure uncertainty arising from measurement limitations, missing data, mixed household practices, and non-linear relationships between predictors and behaviours [8,9,10]. For countries such as Eswatini-where policy ambitions increasingly intersect with circular economy discourse, Extended Producer Responsibility (EPR), and broader environmental sustainability mandates-planning tools that explicitly represent uncertainty are particularly valuable for prioritisation and accountability [2,11,12,13].
Eswatini's waste sector reflects many of these broader challenges. Waste governance is anchored within national environmental legislation and regulations, including the Environment Management Act (2002), which prohibits waste management practices that result in adverse environmental or health effects and establishes general obligations for responsible handling, storage, and disposal [11,12]. In addition, national waste regulations provide further operational guidance on waste management standards and responsibilities [13]. Institutional mandates have historically been shared among environmental authorities, local governments/municipalities, and sector ministries, with enforcement and service provision uneven across settlement types [11,12,13,14].
On the ground, households in Eswatini exhibit a spectrum of disposal behaviours that include (but are not limited to): regular collection (typically in urban cores and serviced neighbourhoods), irregular or intermittent collection, disposal in backyard pits, open burning, disposal at undesignated sites, and dumping in public spaces. Such behaviours are shaped by infrastructure access (roads, electricity, housing density), socio-economic conditions, and geographical accessibility (travel time to cities/towns, distance to main roads and service centres). Importantly, behavioural patterns also reflect neighbourhood influence and shared service environments-households often face the same constraints as surrounding communities, and practices can diffuse spatially through norms and service availability.
Nationally representative household and community datasets-particularly census-based datasets-provide a powerful foundation to analyse these patterns at fine administrative scales. The 2017 Population and Housing Census, for example, offers rich information on socio-demographics and living conditions that can be spatially summarised and linked to enumeration-area (EA) polygons [14]. When combined with spatial indicators (e.g., night-time lights, road density, land cover context, accessibility metrics), such data can support nationally consistent modelling and mapping of disposal behaviours. However, two limitations persist in typical applications. First, most analyses rely on linear or weakly non-linear models that may not capture complex interactions (e.g., electricity access interacting with urban proximity and neighbourhood behaviour). Second, uncertainty is seldom mapped explicitly, even though uncertainty is often highest in precisely the areas where decisions are most contested-peri-urban transition zones, rapidly transforming settlements, and marginalised communities [2,8,9,10].
Waste disposal behaviour is inherently uncertain for at least four reasons.
- Measurement and reporting uncertainty: household-reported disposal practices may reflect primary practices, seasonal behaviours, or socially desirable responses.
- Service variability: collection reliability can vary over time, leading households to alternate between collection and informal disposal.
- Complex causality: predictors such as poverty, density, accessibility, and tenure can operate through multiple pathways and interact non-linearly.
- Spatial dependence: disposal behaviours often cluster, not only because of shared infrastructure and enforcement, but also because of social diffusion and shared constraints.
Bayesian networks (BNs) provide a principled framework for modelling complex systems under uncertainty. BNs encode conditional dependencies among variables using a directed acyclic graph and quantify relationships using conditional probability tables, enabling probabilistic inference even with missing predictor values and allowing analysts to trace the influence of particular variables on outcomes [8,9,10,15]. BNs have been applied across environmental management domains-including land-use change, ecosystem risk assessment, hydrology, and climate-related decision support-precisely because they combine interpretability with probabilistic reasoning and explicit uncertainty representation [8,9,10,15,16,17].
A key advantage of BN-based approaches for sustainability planning is the ability to produce posterior distributions rather than only point predictions, enabling diagnostics such as entropy (uncertainty), divergence from prior expectations (information gain), and evidence usage metrics (how much information was actually available for a location). This matters for policy: uncertainty-aware maps can guide where to invest in improved data collection, where to prioritise "no-regrets" interventions, and where adaptive management is necessary due to high behavioural variability [8,9,10,18]. Moreover, BN structures can help communicate plausible drivers to non-technical decision makers, strengthening the science-policy interface.
For waste governance specifically, probabilistic modelling is especially valuable where multiple disposal pathways compete and where interventions may shift behaviours from one pathway to another (for example, reducing dumping might inadvertently increase burning if collection services remain unreliable) [2,3,6]. This aligns with sustainability planning principles that emphasise system-wide thinking rather than single-outcome optimisation.
Despite the relevance of probabilistic approaches, there remains limited published work in Southern Africa applying spatially explicit BNs to national-scale waste disposal behaviours at fine administrative units with explicit uncertainty mapping. Existing waste studies often focus on city-level audits, limited case-study communities, or generation estimates, and frequently lack a unified, transferable modelling framework capable of representing complex dependencies, handling missing data gracefully, and producing interpretable uncertainty layers for planning [2,3,6,19]. In Eswatini, although previous technical work has used census-linked approaches to characterise waste generation and related risks (including open burning inventories), there remains a need for national, EA-level behavioural modelling designed explicitly as a decision-support tool for sustainable waste management interventions [19,20].
This study addresses that gap by developing a Spatial Bayesian network (SBN) workflow using Tree-Augmented Naïve Bayes (TAN) models-one model per disposal pathway-trained on enumeration-area data. TAN offers a pragmatic balance between expressiveness and stability: it preserves the interpretability and efficiency of naïve Bayes while allowing dependencies among predictors via a maximum spanning tree structure [21,22,23]. In addition, this study incorporates a spatial lag predictor for each disposal target, explicitly capturing neighbourhood influence and shared service environments-an important but often omitted component of behavioural waste modelling. Beyond prediction, the framework generates multiple uncertainty diagnostics (entropy and KL divergence), performance metrics, and model-structure artefacts to support transparency and reproducibility.
The overarching aim of this research is to develop and demonstrate an uncertainty-aware, spatially explicit modelling framework for household solid waste disposal behaviours in Eswatini that is scientifically robust and directly usable for sustainability policy and planning. The specific objectives are to:
- Model and map six dominant household waste disposal pathways at enumeration-area level using census-linked socio-economic, infrastructural, accessibility, environmental, and neighbourhood predictors.
- Quantify uncertainty in predicted disposal behaviours using posterior entropy and posterior-versus-prior divergence (KL) and identify spatial patterns of high uncertainty and high information gain.
- Evaluate predictive performance using a held-out test design and report both categorical and expected-value metrics suitable for ordinal outcomes.
- Extract and interpret drivers of each disposal pathway using mutual information-based feature selection and network structure diagnostics.
- Provide policy-relevant insights for Eswatini, highlighting priority geographies and intervention levers aligned with sustainability goals, including improved service coverage, risk reduction, and environmentally sound waste governance.
The contributions of this study are threefold. First, it provides the first (to the authors' knowledge) national-scale, EA-level probabilistic maps of major waste disposal behaviours for Eswatini that include explicit uncertainty layers. Second, it introduces a reproducible SBN/TAN modelling workflow that integrates neighbourhood effects and produces transparent model artefacts suitable for review, audit, and re-use. Third, it translates model outputs into sustainability-relevant insights, supporting practical prioritisation for waste management, environmental health protection, and sub-national monitoring of waste-related development targets.
2. Materials and Methods
2.1. Study Area
The study was conducted for the entire Kingdom of Eswatini, a landlocked country in southern Africa covering approximately 17,364 km² and administratively divided into four regions: Hhohho, Manzini, Lubombo, and Shiselweni. Eswatini exhibits marked spatial heterogeneity in settlement structure, infrastructure provision, and access to public services, ranging from dense urban centres (e.g., Mbabane and Manzini) to dispersed rural homesteads and rapidly expanding peri-urban settlements. These contrasts make the country an appropriate case for analysing spatial variability in household waste disposal behaviours.
The primary spatial unit of analysis is the Enumeration Area (EA), the smallest geographical unit used in the national population census. EAs are designed to be relatively homogeneous in terms of settlement and population size and therefore represent a policy-relevant scale for local planning and service delivery. A total of 2,326 EAs were included in the analysis, covering the entire national territory. EA polygon boundaries were used for spatial mapping and aggregation, while EA centroids were derived for distance-based and neighbourhood computations.
2.2. Data Sources
2.2.1. Population and Housing Census Data
The core dataset for this study is the 2017 Population and Housing Census of Eswatini, obtained from the Central Statistical Office (CSO). The census provides nationally consistent information on household characteristics, access to services, and waste disposal practices. For each EA, household-level responses were aggregated to produce proportional indicators (e.g., proportion of households using a specific waste disposal method).
- Census-derived variables used in the analysis include:
- Waste disposal methods reported by households;
- Access to electricity and basic services;
- Demographic structure (e.g., youth population, dependency ratios);
- Socio-economic proxies (e.g., asset ownership indicators);
- Housing and settlement characteristics.
2.2.2. Spatial and Accessibility Indicators
To complement census data and capture spatial drivers of waste disposal behaviour, several spatially derived indicators were incorporated (Table 1):
- Road network density and traffic proxies, derived from national road datasets and OpenStreetMap;
- Travel time to towns and cities, calculated using cost-distance modelling based on road networks and terrain;
- Night-time light (NTL) intensity, used as a proxy for economic activity and service availability;
- Land-use and settlement context indicators, used to characterise urban–rural gradients.
2.3. Definition of Target Variables
This study focuses on six dominant household solid waste disposal pathways (dataset abbreviations in brackets), identified from census responses:
- Regular waste collection (Regularly_)
- Irregular waste collection (Irregularl)
- Open burning of waste (Burning)
- Public or communal dumping (Dumping_pu)
- Backyard (rubbish) pit disposal (Rubbish_pi)
- Undesignated disposal (disposal in open spaces without designated pits or facilities - Undesignat)
For each EA, the proportion of households using each method was calculated. To facilitate probabilistic classification and uncertainty analysis, each target variable was discretised into ordered ordinal bins representing increasing dominance or intensity of the disposal practice. Discretisation thresholds were chosen using data-driven quantiles, ensuring sufficient representation in each class while preserving interpretability. Ordinal modelling is particularly appropriate for waste disposal behaviours, which often exist along a continuum rather than as mutually exclusive binary states [30].
2.4. Predictor Variable Selection and Pre-Processing
2.4.1. Initial Predictor Pool
An initial pool of predictors was assembled from census and spatial datasets, representing four broad categories:
- Socio-demographic factors (e.g., age structure, household composition);
- Infrastructure and service access (e.g., electricity access, housing density);
- Accessibility and connectivity (e.g., travel time to towns, road density);
- Environmental and settlement context (e.g., night-time lights).
Variables with excessive missing values, near-zero variance, or strong multicollinearity were excluded prior to modelling to improve stability and interpretability.
2.4.2. Spatial Neighbourhood Effects
To explicitly account for spatial dependence, a neighbourhood-context variable was constructed for each disposal target. Using EA centroids, a k-nearest-neighbour (kNN) approach was applied to identify neighbouring EAs. For each EA, the dominant disposal category among its neighbours was computed and included as a predictor.
This approach captures spatial diffusion and shared service environments without directly introducing geographic coordinates into the model, thereby maintaining interpretability and transferability. Similar neighbourhood-lag strategies have been shown to be effective in modelling spatially clustered socio-environmental behaviours [31,32,33].
2.5. Bayesian Network Modelling Framework
2.5.1. Overview of Bayesian Networks
Bayesian networks (BNs) are probabilistic graphical models that represent variables as nodes and conditional dependencies as directed edges in a directed acyclic graph. Each node is associated with a conditional probability table (CPT) that quantifies the relationship between the node and its parents. BNs are particularly well suited to sustainability applications due to their ability to:
2.5.2. Tree-Augmented Naïve Bayes (TAN)
For this study, a Tree-Augmented Naïve Bayes (TAN) classifier was adopted for each waste disposal target. TAN relaxes the strong conditional independence assumption of naïve Bayes by allowing each predictor to have at most one additional parent, forming a tree structure among predictors. This improves predictive performance while retaining computational efficiency and interpretability [37,38].
Separate TAN models were trained for each disposal pathway, allowing pathway-specific drivers and dependencies to be identified.
2.5.3. Discretisation and Parameter Learning
Continuous predictors were discretised into a limited number of ordinal bins using entropy-based or quantile-based thresholds, depending on variable distribution. Discretisation facilitates stable CPT estimation and improves interpretability for policy audiences [39]. Conditional probability tables were estimated using Bayesian parameter learning with smoothing to avoid zero-probability issues in sparsely populated states.
2.6. Feature Selection and Model Learning
To reduce dimensionality and avoid overfitting, mutual information (MI) was used to quantify the strength of association between each predictor and the target variable. Predictors with MI values below a predefined threshold were excluded from the final model. MI-based selection is well suited to BN learning because it is non-parametric and captures non-linear dependencies [40].
The TAN structure was then learned using a maximum spanning tree algorithm, conditioned on the selected predictors. This process yields both a predictive model and an interpretable network structure illustrating dominant dependencies (Figure 1).
2.7. Spatial Inference and Output Generation
For each EA, posterior inference was performed to obtain:
- Posterior class probabilities for each disposal pathway;
- Expected values, representing the probability-weighted mean of ordinal bins;
- Probability of the highest-risk bin (P(high)), useful for identifying priority areas.
- To explicitly represent uncertainty and information gain, two additional diagnostics were computed:
- Posterior entropy, measuring the dispersion of posterior probabilities (higher values indicate greater uncertainty);
- Kullback–Leibler (KL) divergence, quantifying the degree to which observed data update prior expectations.
2.8. Model Evaluation and Validation
Model performance was assessed using a hold-out validation strategy, in which a subset of EAs was reserved for testing. Evaluation metrics included (Table 2):
- Root Mean Square Error (RMSE) and Mean Absolute Error (MAE) for expected values;
- Confusion matrices for ordinal class predictions;
- Calibration plots, comparing predicted probabilities against observed frequencies.
Emphasis was placed on calibration and ordinal misclassification patterns, as these are more informative for policy applications than single summary accuracy metrics [44].
All data processing, modelling, and spatial analyses were implemented using reproducible R scripts in open-source environments. Model artefact - including BN structures, MI rankings, calibration plots, entropy maps, and KL divergence surfaces - were retained to support transparency and future reuse.
3. Results
3.1. Overall Model Performance across Waste Disposal Pathways
The SBN framework demonstrated consistently strong predictive performance across all six waste disposal pathways modelled at enumeration-area (EA) level (n = 2,326). Performance metrics derived from the independent hold-out validation set indicate that the models reliably capture both the dominant disposal behaviour and the underlying ordinal intensity gradients (Table 3).
Across all targets, root mean square error (RMSE) values were below 0.15, while mean absolute error (MAE) values were below 0.10 for expected-value predictions, confirming good agreement between predicted and observed EA-level disposal proportions. Confusion matrix analysis further shows that over 85% of misclassifications occurred between adjacent ordinal bins, rather than between low and high extremes. This pattern is critical from a policy perspective, as it indicates that the models rarely confuse fundamentally different disposal regimes (e.g., formal collection versus open burning) but instead capture gradational transitions between similar behavioural states.
Calibration plots comparing predicted posterior probabilities with observed frequencies reveal generally well-calibrated models across the probability spectrum. Minor deviations were observed at the highest probability bins for undesignated disposal and open burning, where predicted probabilities slightly exceeded observed frequencies. Given the known under-reporting of informal and environmentally undesirable practices in household surveys, this behaviour is consistent with structural reporting bias rather than model overfitting.
3.2. Feature Importance and Bayesian Network Structures
Mutual Information (MI) analysis conducted during feature selection highlights a consistent hierarchy of drivers across waste disposal pathways. For all six targets, the neighbourhood-context (spatial lag) variable emerged as the most informative predictor, accounting for approximately 30–40% of total explanatory power, depending on the pathway (Figure S1). This finding underscores the importance of spatial diffusion, shared infrastructure, and collective behavioural norms in shaping household waste practices.
Beyond neighbourhood effects, electricity access, travel time to towns or cities, road density and traffic proxies, and night-time light intensity consistently ranked among the top predictors. These variables collectively represent infrastructural connectivity and service accessibility, indicating that disposal behaviour in Eswatini is primarily shaped by structural conditions rather than individual household preferences alone.
Demographic indicators - such as youth proportion, household composition, and socio-economic proxies - entered the networks as secondary drivers, often mediating or reinforcing infrastructural effects rather than acting independently.
The learned Tree-Augmented Naïve Bayes (TAN) structures (Figure 2) provide interpretable visual representations of these dependencies. In particular, networks for undesignated disposal and open burning exhibit denser interconnections among predictors, reflecting the complexity and heterogeneity of informal disposal behaviours compared to formal collection pathways.
3.3. Spatial Distribution of Formal Waste Collection
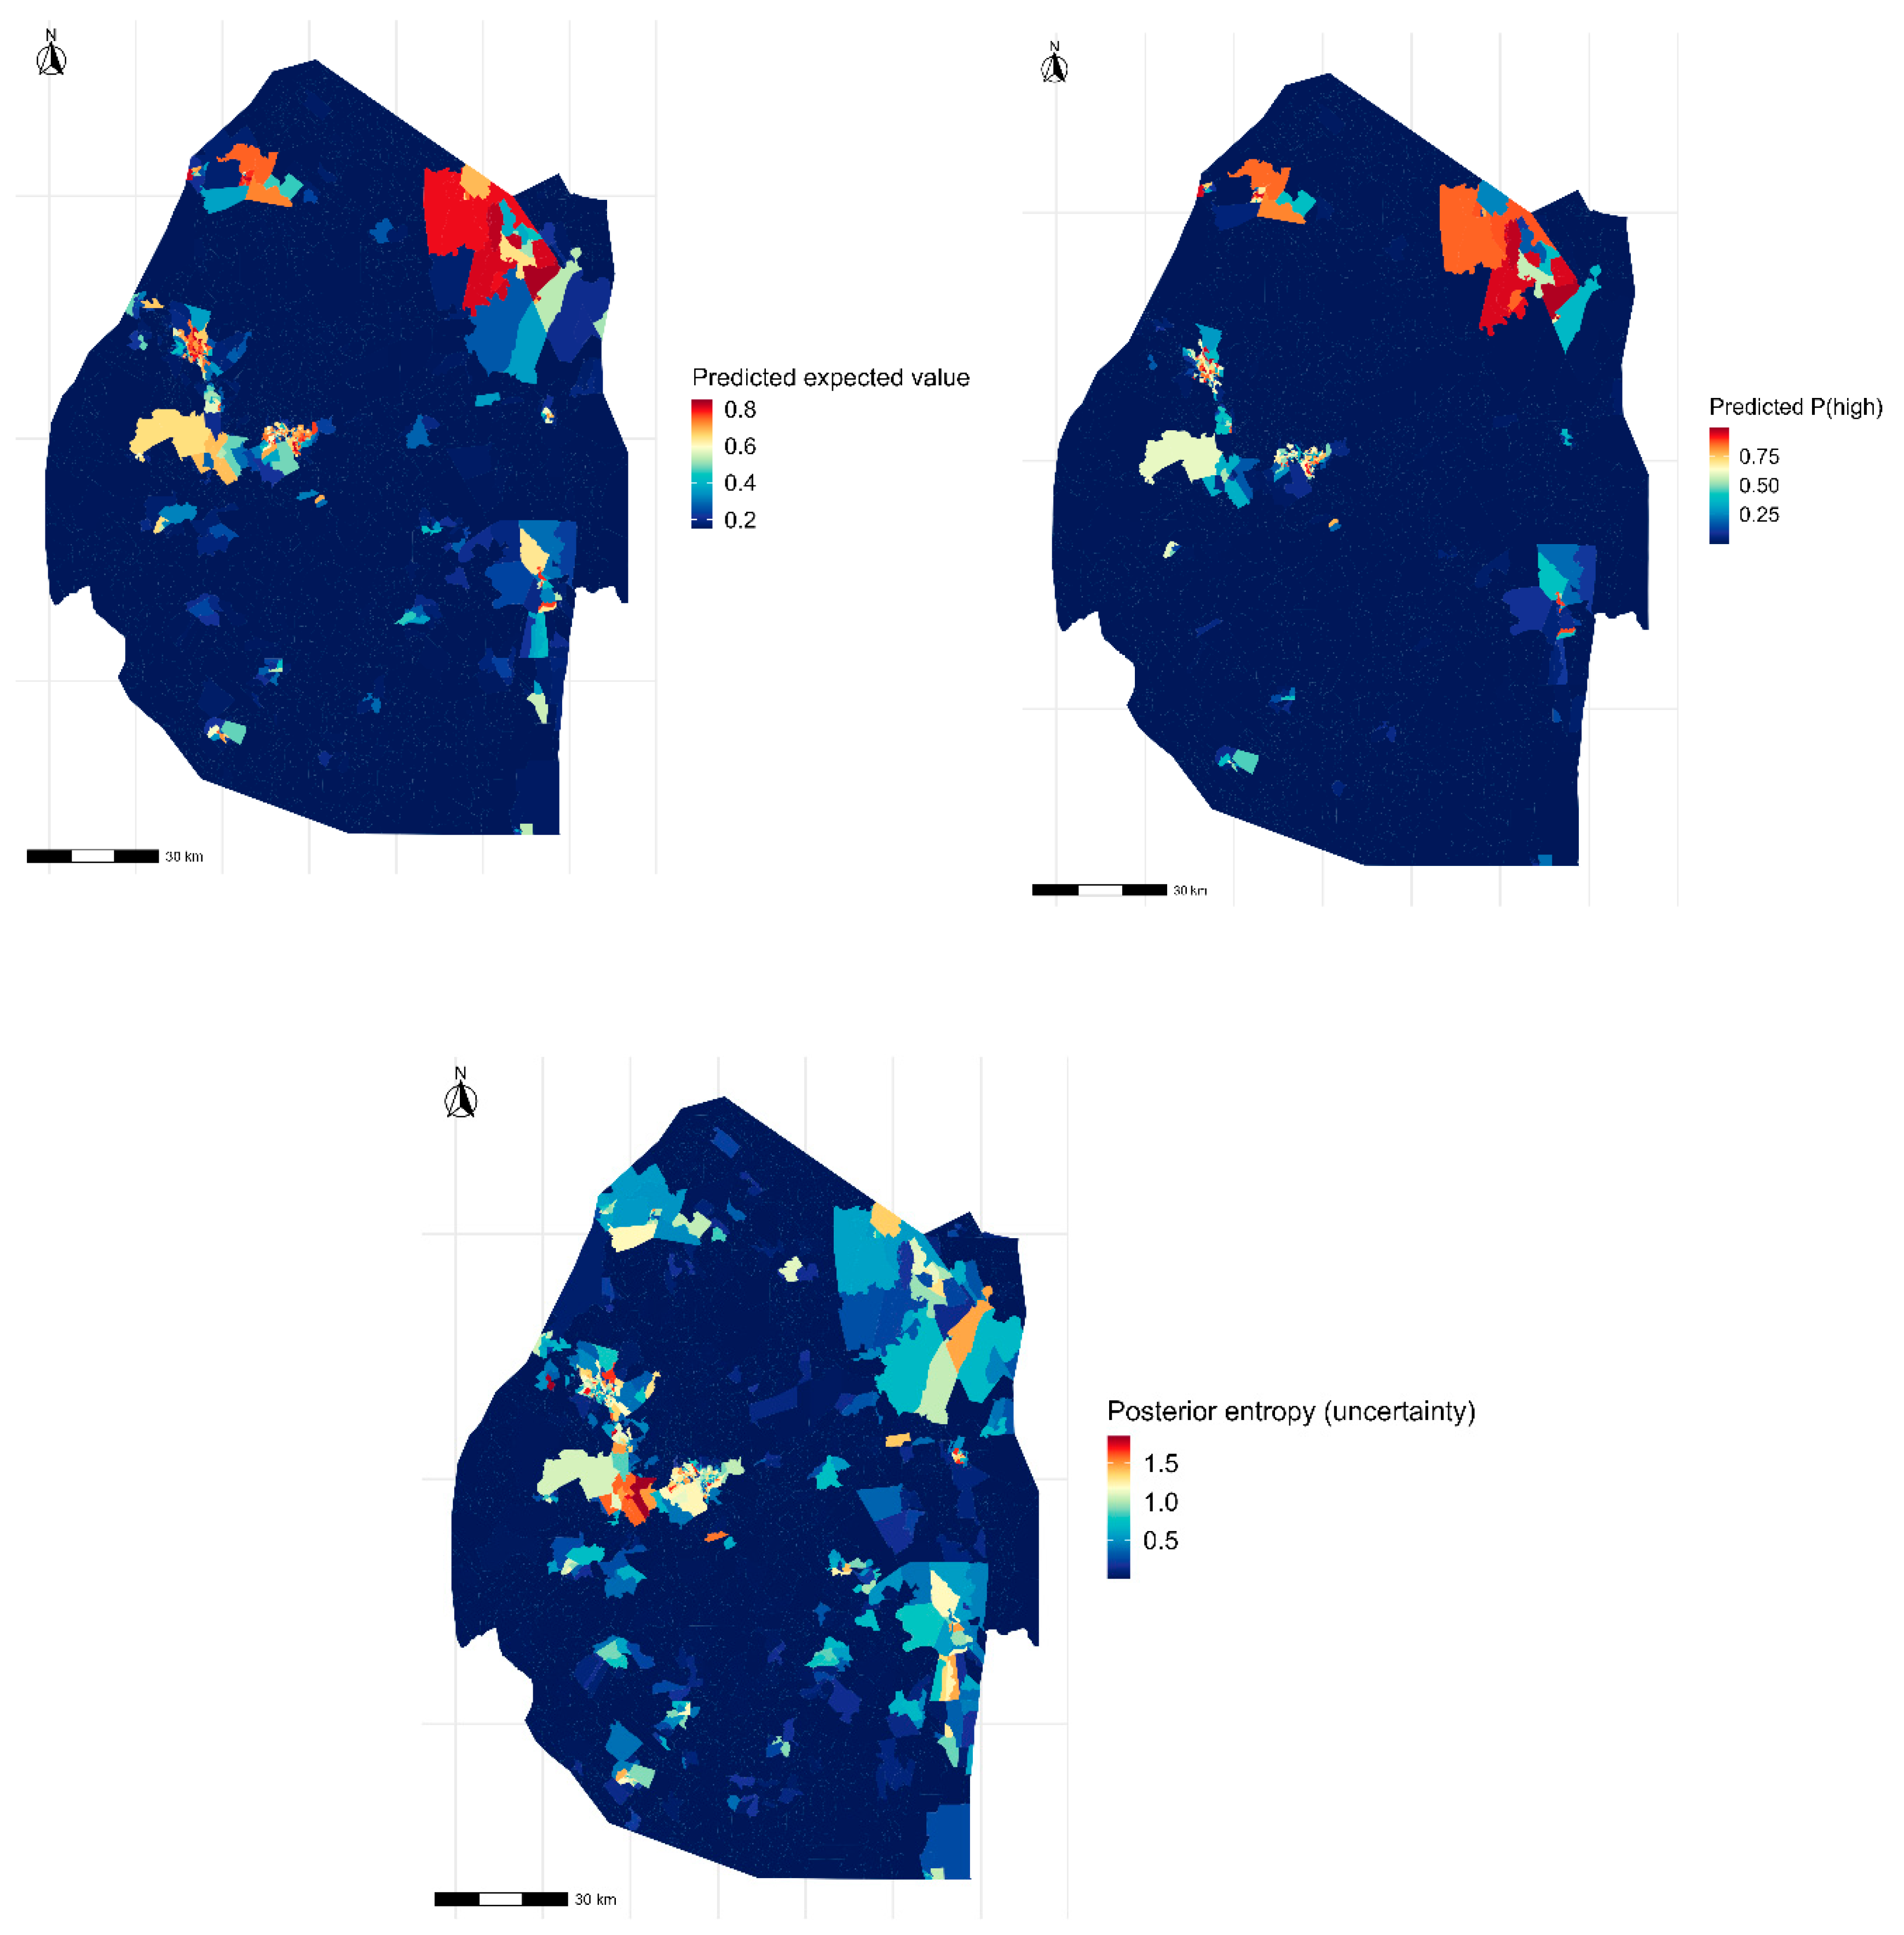
3.3.1. Regular Collection
Predicted expected-value and probability-of-highest-bin (P(high)) maps for regular waste collection reveal strong spatial concentration in urban cores and established peri-urban areas. High-probability EAs are predominantly located in and around Mbabane and Manzini, where electricity access exceeds national averages, road networks are dense, and travel times to service centres are minimal.
Quantitatively, regular collection dominates in fewer than one-third of EAs nationally, highlighting the limited spatial reach of consistent municipal waste services. Low posterior entropy values in these areas indicate high model confidence, reflecting relatively homogeneous infrastructural and socio-economic conditions.
Figure 3.
Spatial distribution of predicted expected value and P(high) for regular waste collection, with corresponding posterior entropy surface.
Figure 3.
Spatial distribution of predicted expected value and P(high) for regular waste collection, with corresponding posterior entropy surface.
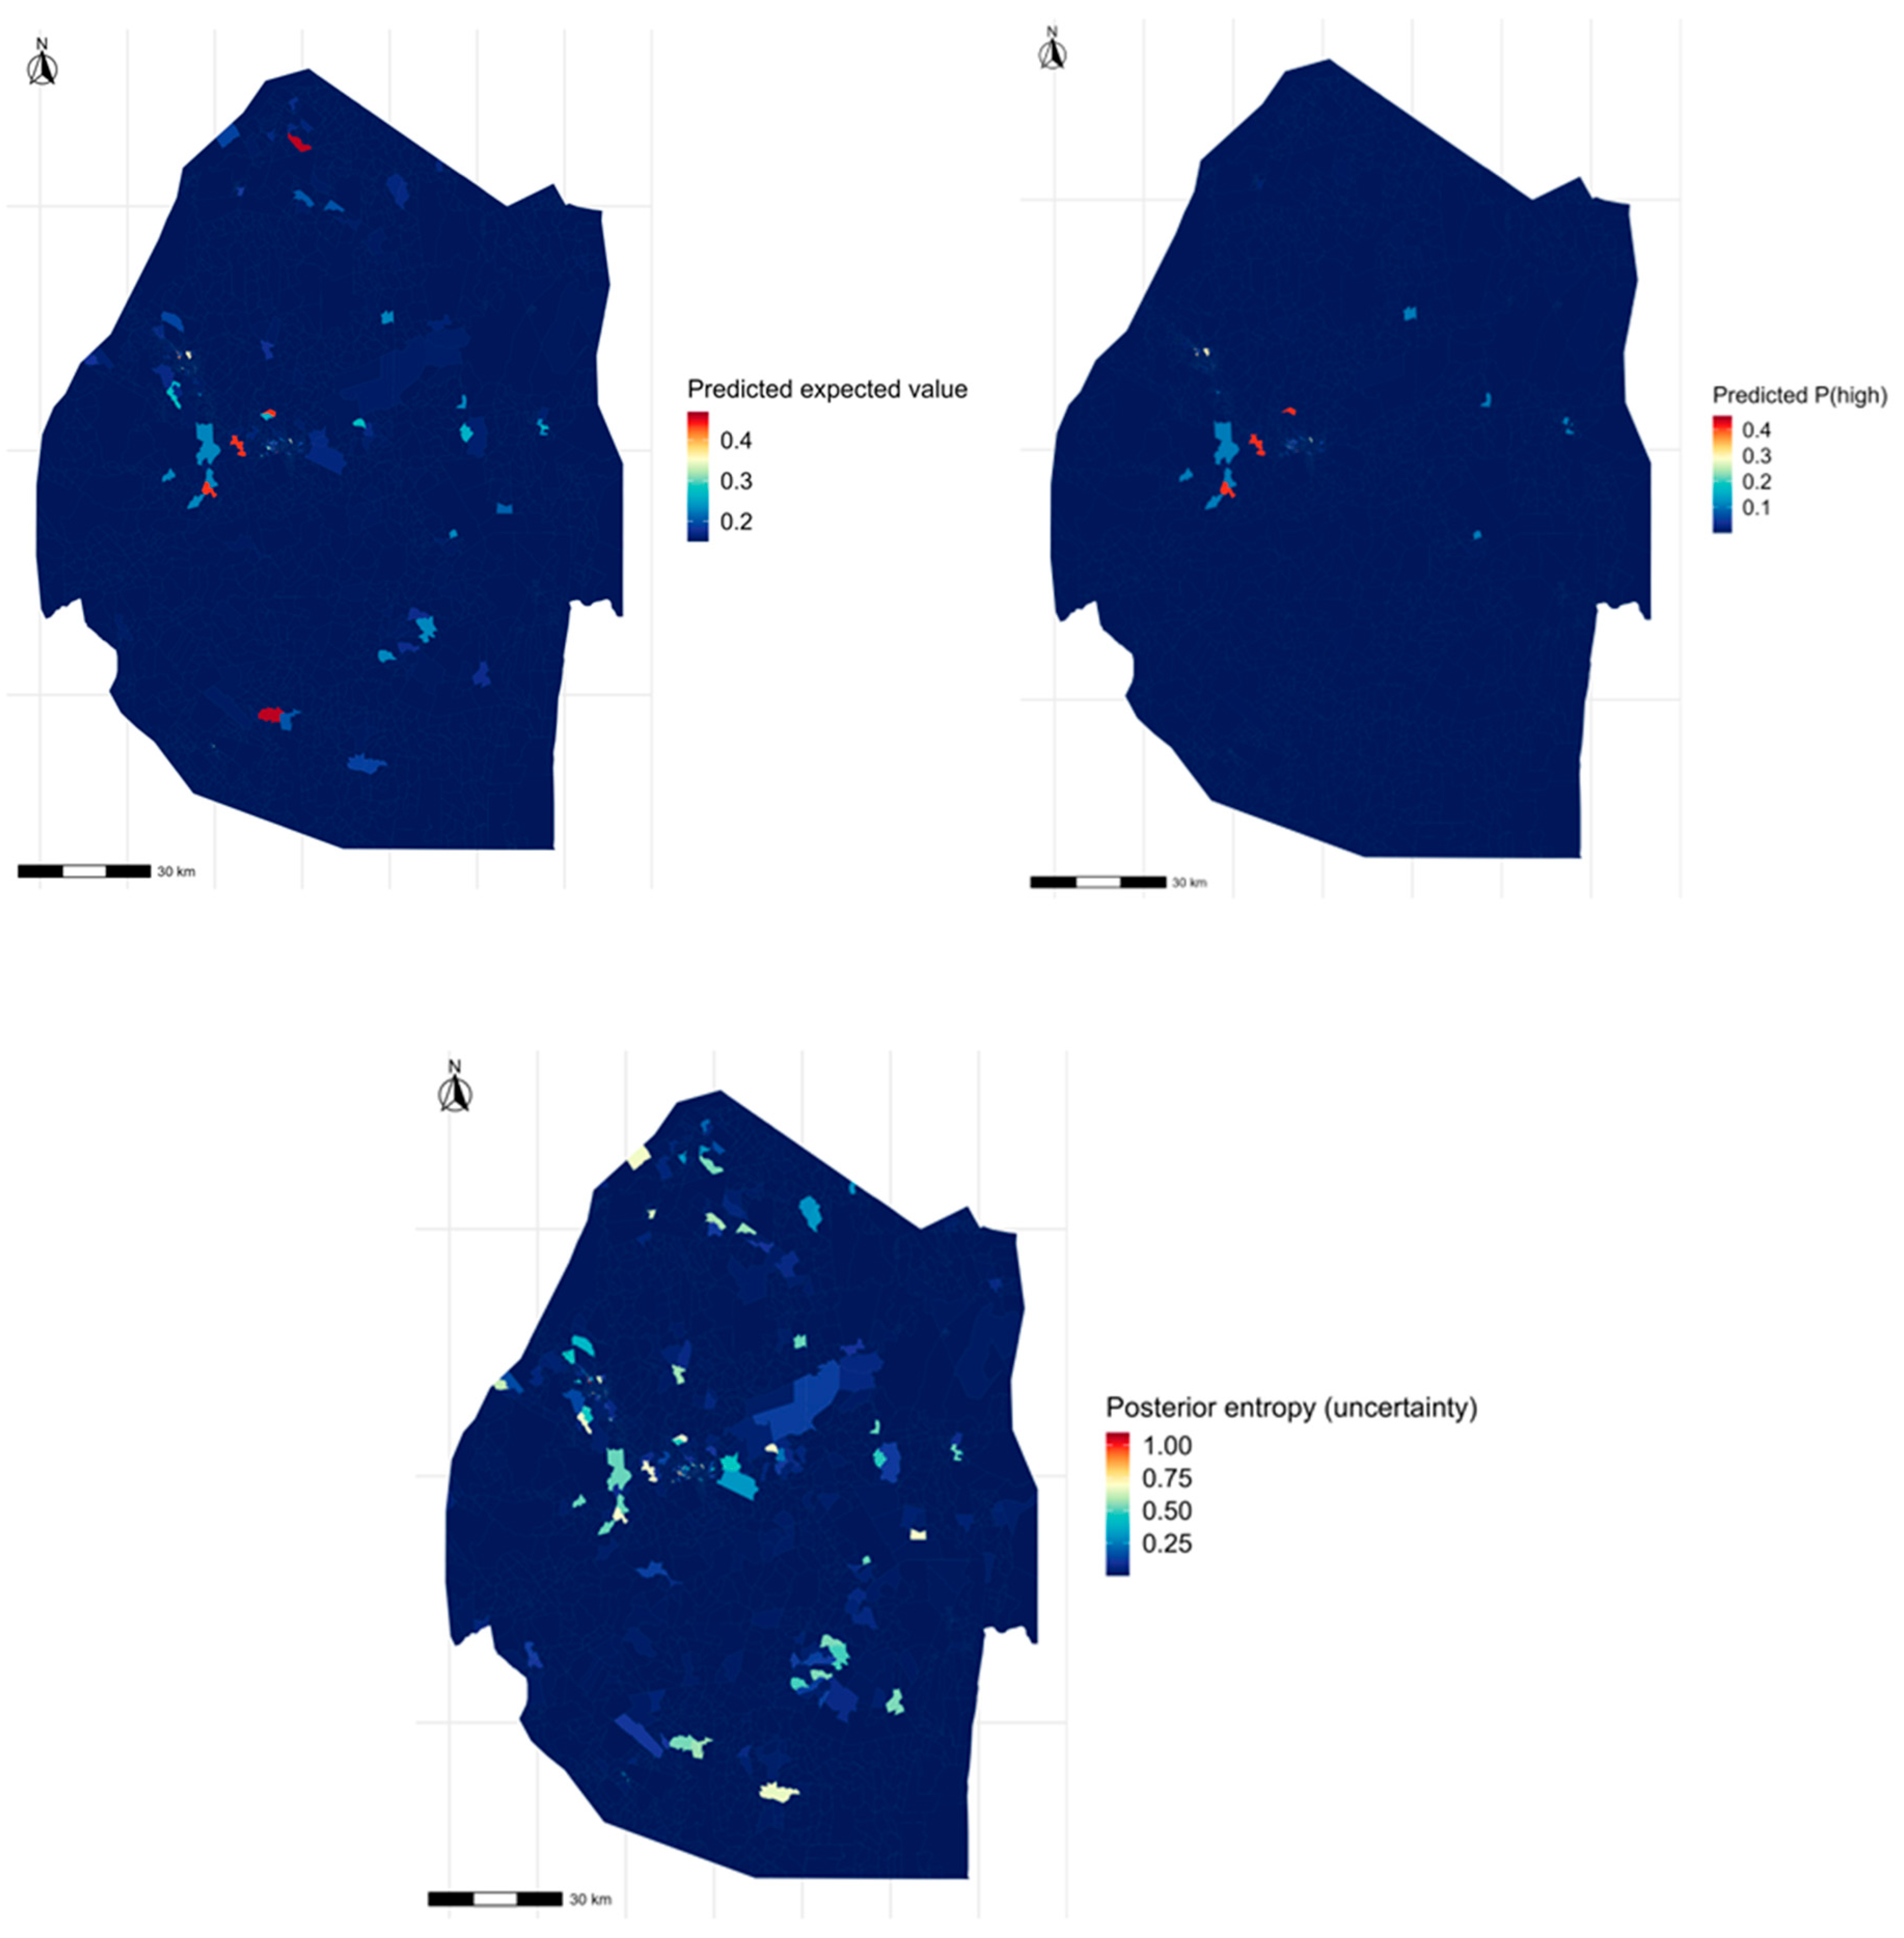
3.3.2. Irregular Collection
Irregular collection exhibits a transitional spatial pattern. High-probability EAs cluster around urban fringes and expanding peri-urban settlements, where service provision exists but is inconsistent. These areas typically show moderate electricity access and road connectivity but higher travel times compared to urban cores.
Posterior entropy for irregular collection is notably higher than for regular collection, reflecting greater behavioural variability and instability. This suggests that irregular collection represents a critical tipping state, where improvements in service reliability could shift behaviour toward regular collection, while service deterioration could push households toward informal disposal.
Figure 4.
Predicted spatial patterns of irregular waste collection, including expected values, P(high), and entropy.
Figure 4.
Predicted spatial patterns of irregular waste collection, including expected values, P(high), and entropy.
3.4. Spatial Patterns of Informal and High-Risk Disposal Practices
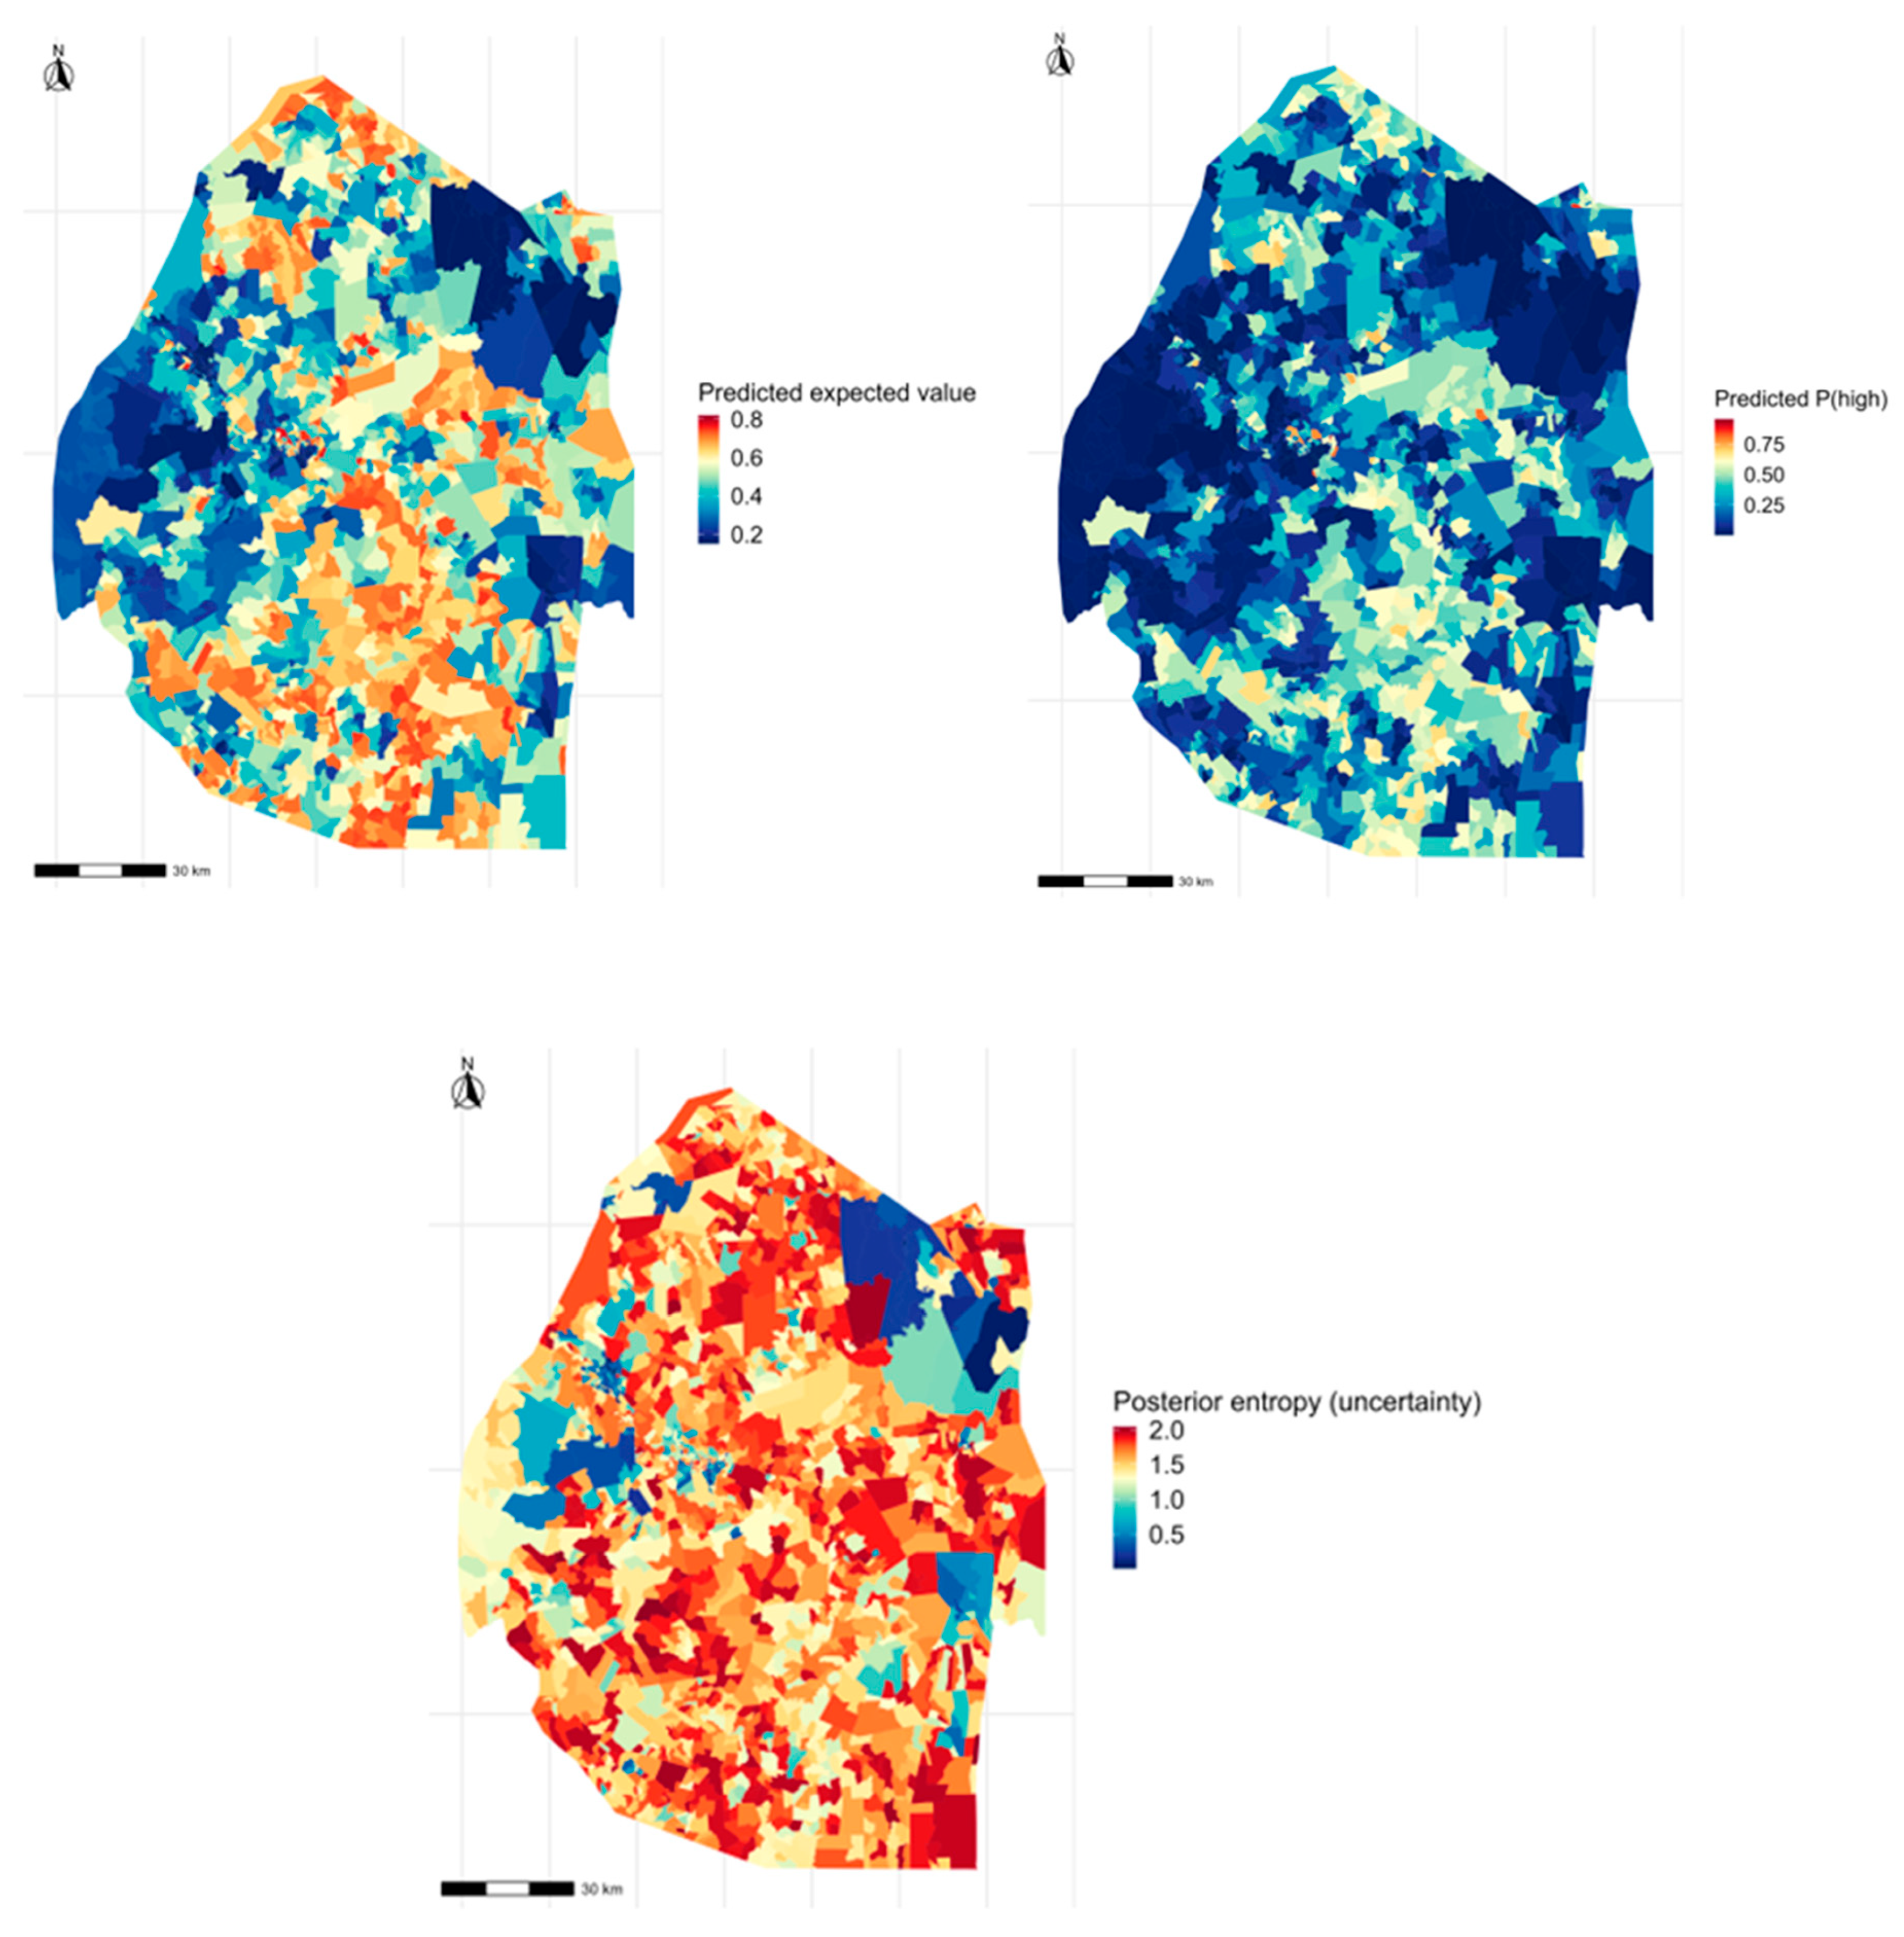
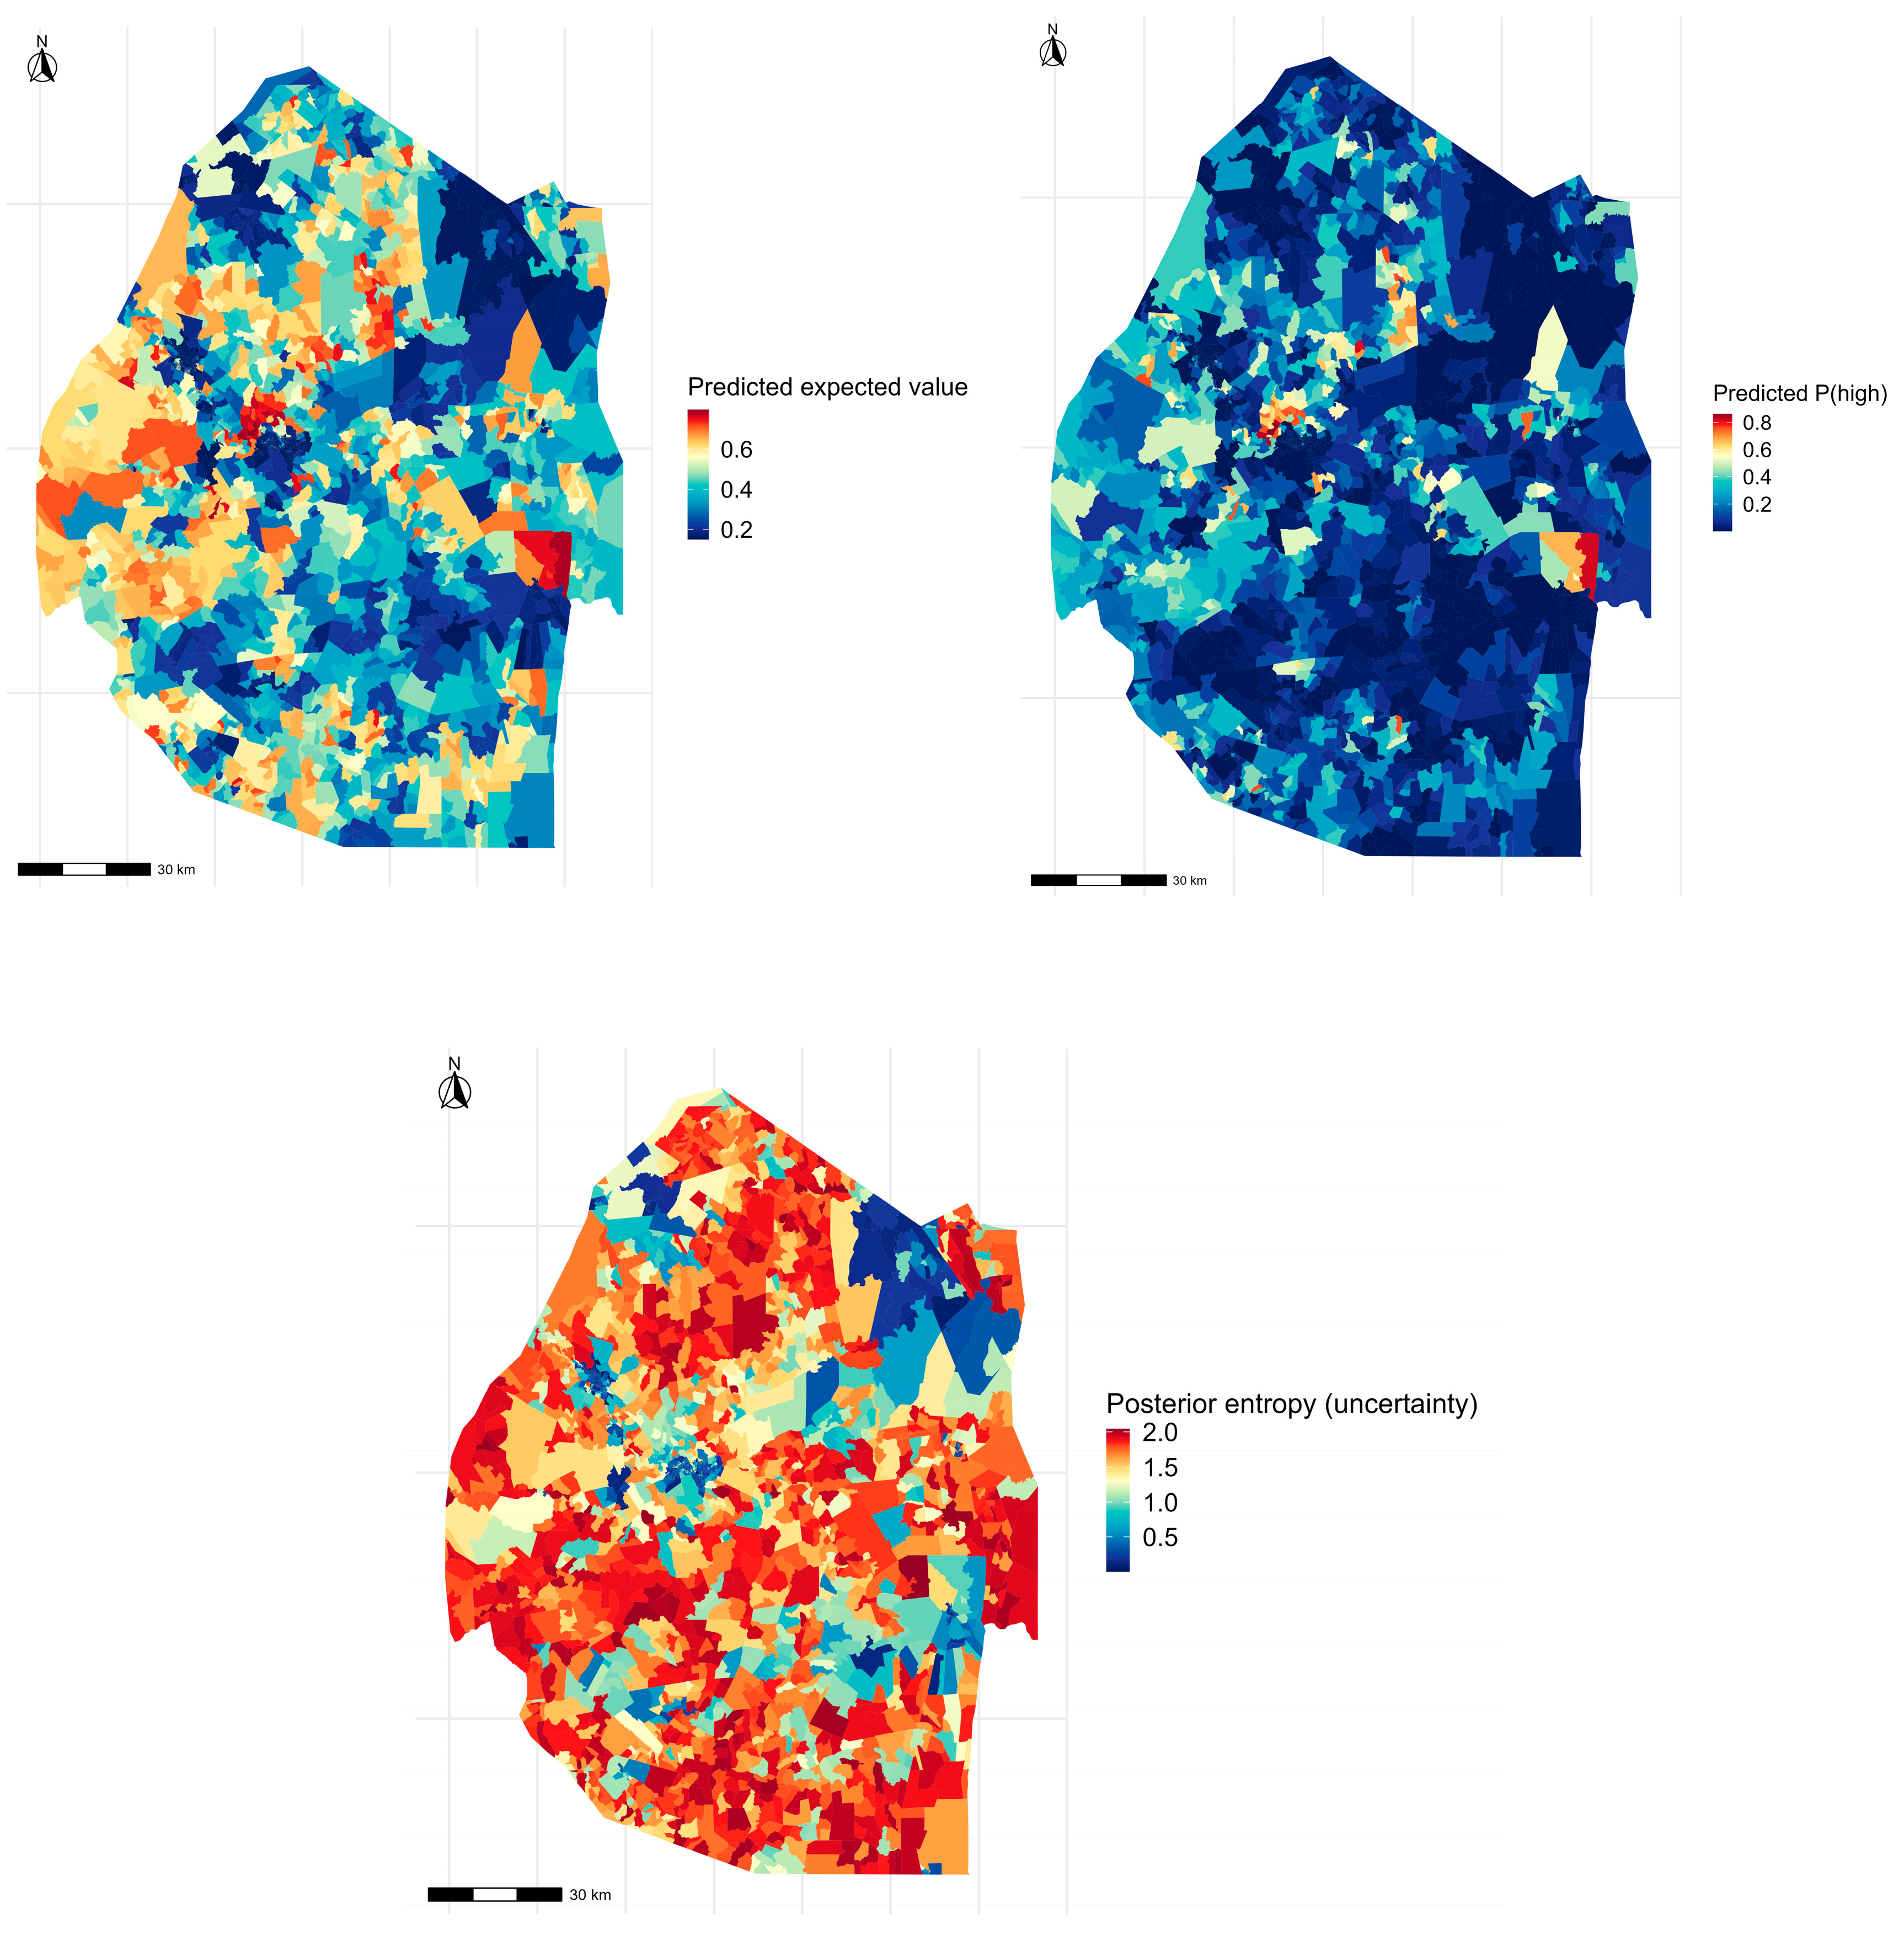
3.4.1. Open Burning
Open burning of household waste is predicted to dominate in large portions of rural Eswatini and in peri-urban zones with limited infrastructure. High expected values and P(high) probabilities coincide with EAs characterised by low electricity access, sparse road networks, and long travel times to towns.
Nationally, open burning dominates in a substantial share of EAs, contributing significantly to local air pollution and short-lived climate pollutant emissions. Posterior entropy is moderate to high in peri-urban transition zones, indicating uncertainty where households may alternate between burning and other informal practices depending on seasonal or service-related factors.
Figure 5.
Predicted expected value, P(high), and posterior entropy for open burning of household waste.
Figure 5.
Predicted expected value, P(high), and posterior entropy for open burning of household waste.
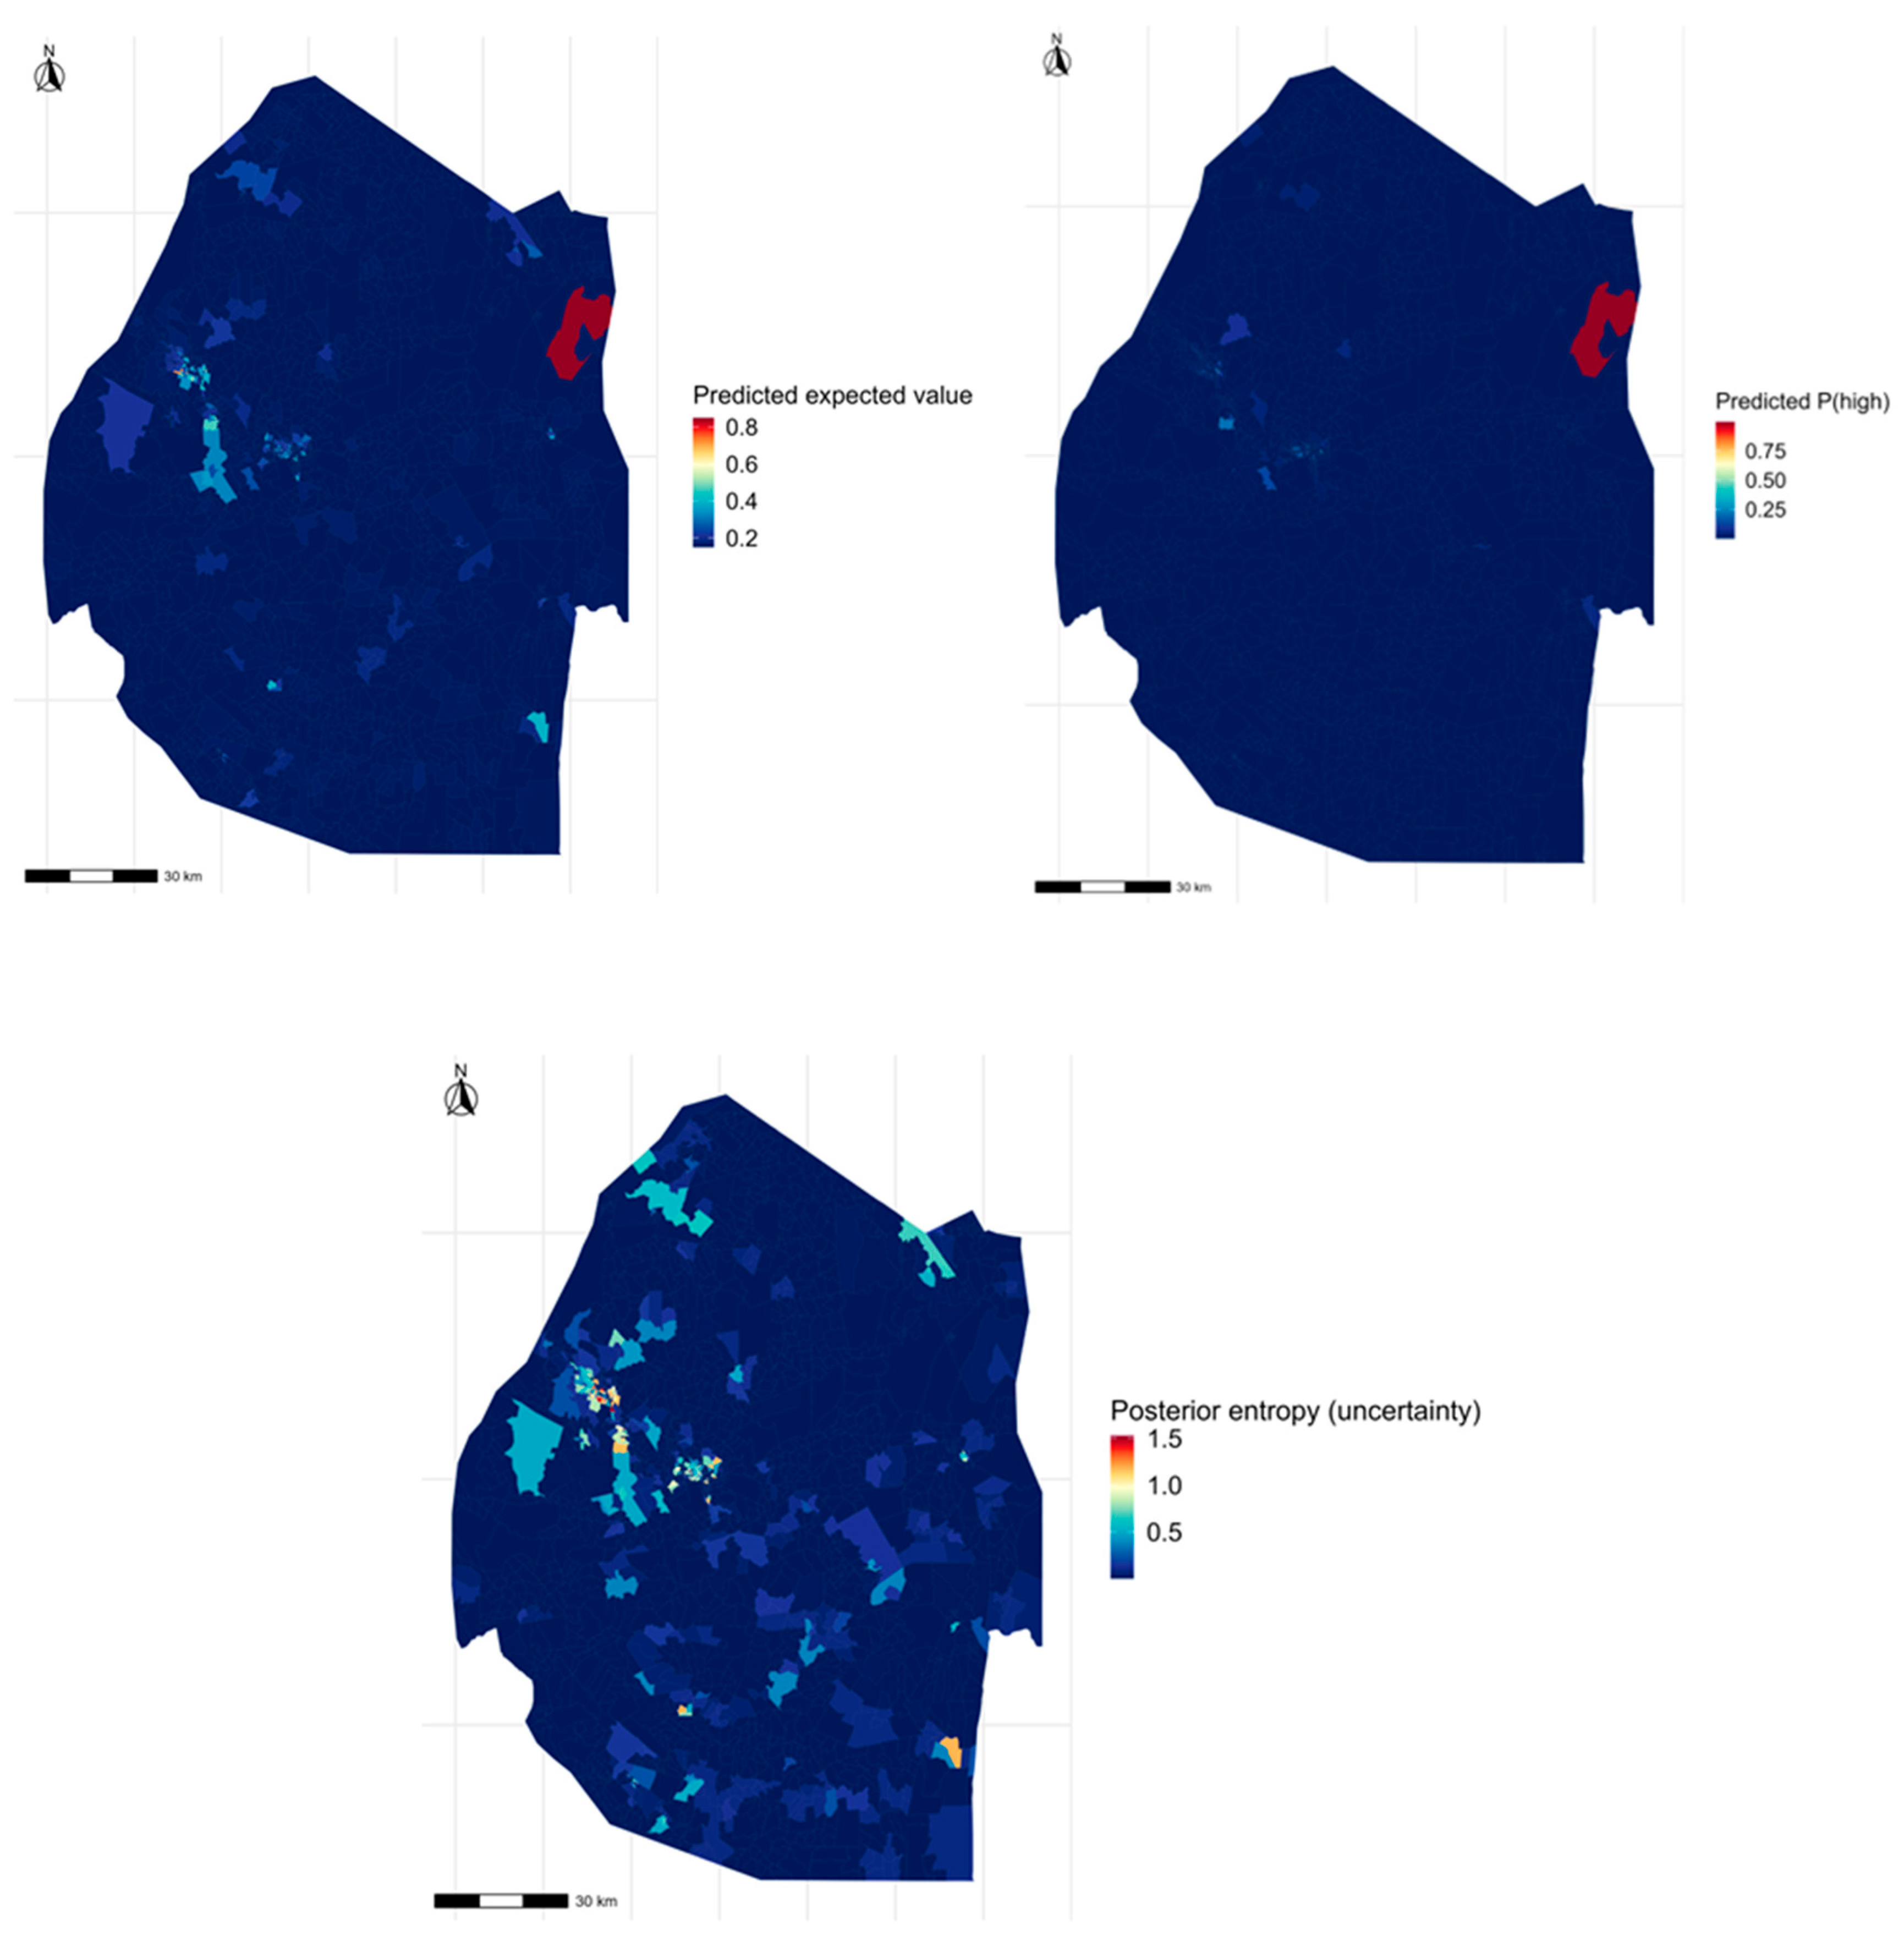
3.4.2. Public and Illegal Dumping
Public or illegal dumping displays a heterogeneous spatial pattern, with hotspots near transport corridors, settlement edges, and environmentally marginal land such as riverbanks or undeveloped communal areas. While dumping is less spatially extensive than open burning, it exhibits high spatial clustering, as confirmed by the strong influence of neighbourhood-context predictors.
KL divergence maps reveal several EAs with exceptionally high divergence values, indicating locations where local dumping behaviour strongly deviates from national patterns. These EAs represent critical points for targeted enforcement, community engagement, or infrastructure provision.
Figure 6.
Spatial distribution and uncertainty diagnostics for public and illegal dumping, including the entropy map.
Figure 6.
Spatial distribution and uncertainty diagnostics for public and illegal dumping, including the entropy map.
3.5. Backyard Pit and Undesignated Disposal Pathways
Backyard pit disposal emerges as an intermediate pathway between formal collection and high-risk informal practices. Predicted high-probability areas are predominantly rural, characterised by moderate land availability and limited service access. While often perceived as a culturally acceptable practice, backyard pits pose environmental risks in areas with shallow groundwater or high rainfall variability.
Undesignated disposal exhibits the strongest spatial clustering and neighbourhood dependence of all pathways. High expected values and P(high) probabilities dominate in structurally marginalised EAs, often far from towns and lacking basic infrastructure. The BN structure for this pathway shows dense interdependencies among accessibility, infrastructure, and neighbourhood predictors, reflecting the reinforcing nature of undesignated disposal practices.
Posterior entropy for undesignated disposal is high in peri-urban and transitional rural areas, signalling zones where behaviour is unstable and potentially responsive to targeted interventions.
Figure 7.
Predicted expected value, P(high), and entropy for backyard pit and undesignated disposal pathways.
Figure 7.
Predicted expected value, P(high), and entropy for backyard pit and undesignated disposal pathways.
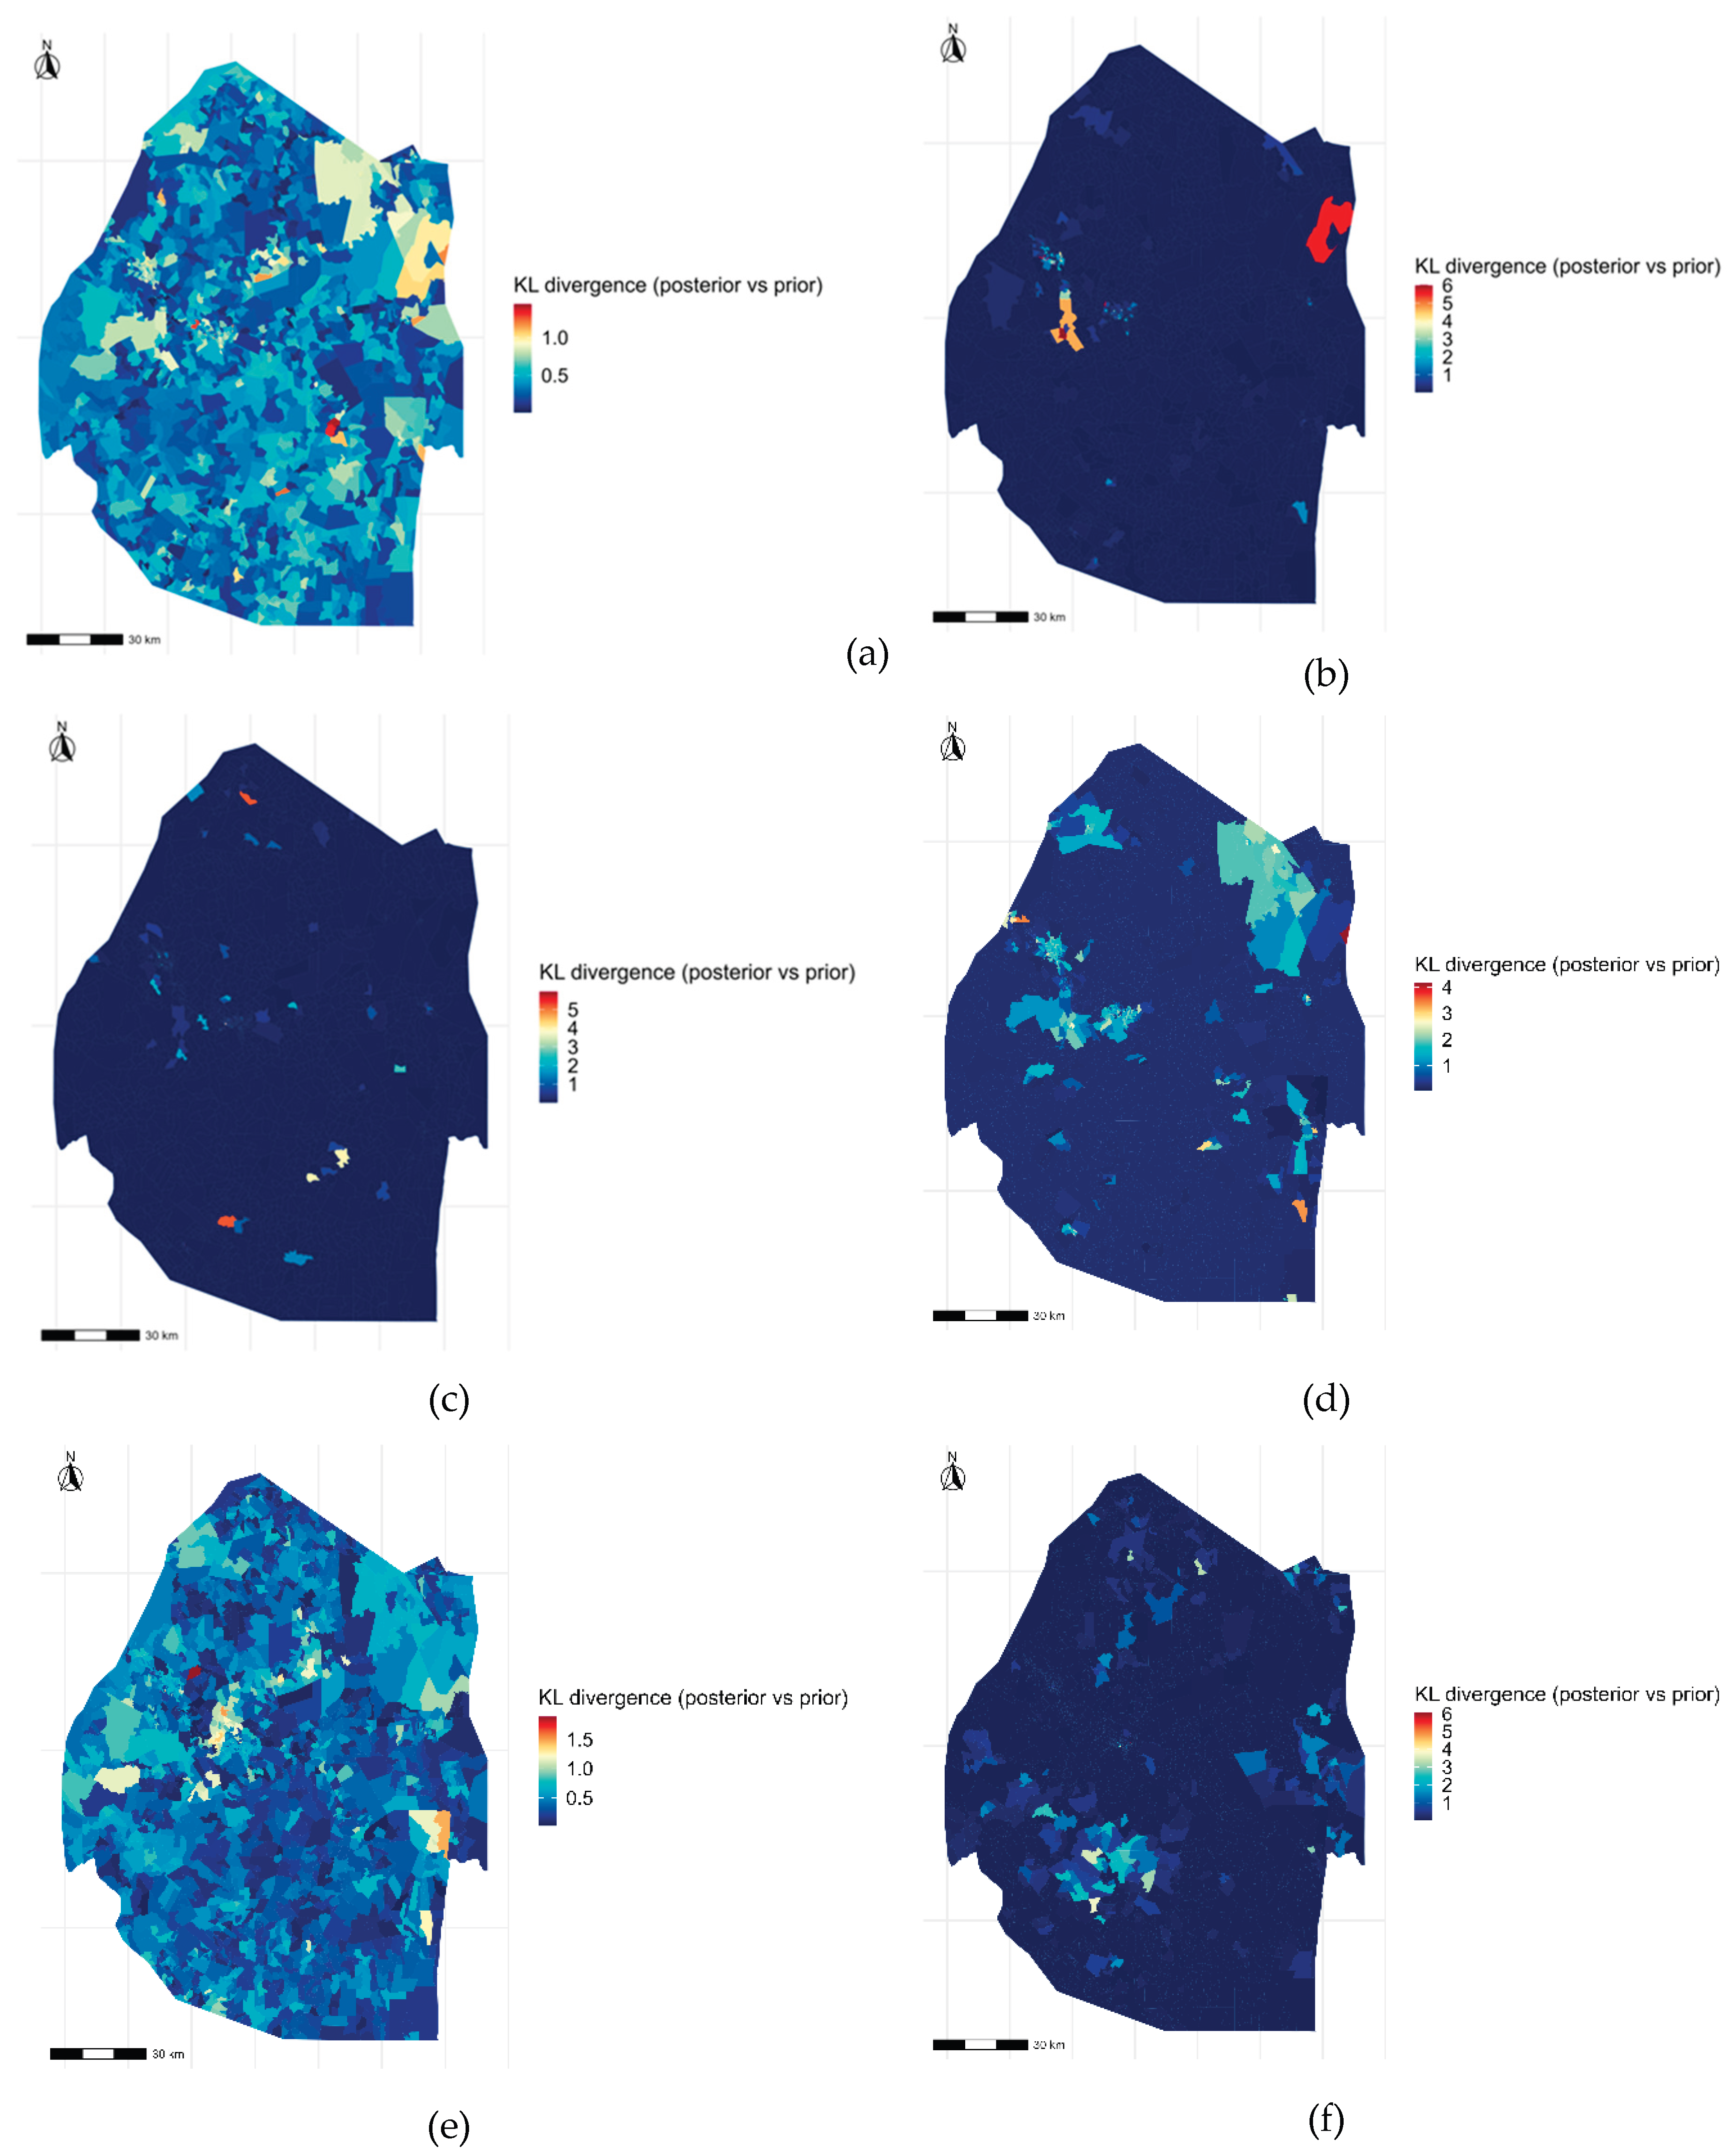
3.6. Uncertainty Diagnostics and Information Gain
Across all waste disposal pathways, posterior entropy and KL divergence diagnostics provide critical insights beyond point predictions. Entropy surfaces show a clear spatial pattern: low uncertainty in homogeneous urban cores and high uncertainty in peri-urban and transitional rural zones. These high-entropy areas correspond to mixed infrastructural signals and competing disposal practices.
KL divergence histograms are right-skewed, indicating that a relatively small subset of EAs contributes disproportionately to information gain. These EAs are often located in rapidly changing settlement contexts, where census-derived predictors strongly update prior expectations.
From a planning perspective, areas with high predicted risk and low uncertainty represent immediate priorities for intervention, while areas with high risk and high uncertainty warrant adaptive strategies, further data collection, and participatory engagement before large-scale investment.
Figure 8.
Maps of KL divergence distributions across all waste disposal pathways: (a) open burning, (b) public/community pits, (c) irregular collection, (d) regular collection, (e) backyard pits and (f) undesignated sites.
Figure 8.
Maps of KL divergence distributions across all waste disposal pathways: (a) open burning, (b) public/community pits, (c) irregular collection, (d) regular collection, (e) backyard pits and (f) undesignated sites.
4. Discussion
4.1. Household Waste Disposal Behaviour through a Sustainability Lens
This study provides the first national, enumeration-area-scale, probabilistic characterisation of household solid waste disposal behaviours in Eswatini that explicitly incorporates spatial dependence and uncertainty. From a sustainability perspective, the results reinforce a critical insight: unsustainable waste disposal practices in Eswatini are primarily structurally driven, rather than the outcome of individual household choice alone. The dominance of accessibility, infrastructure, and neighbourhood-context variables across all BN models confirms that disposal behaviour is embedded within broader socio-technical systems, consistent with sustainability transitions theory and empirical evidence from other low- and middle-income countries [45,46,47].
The finding that regular waste collection dominates in fewer than one-third of enumeration areas, while informal pathways collectively dominate in more than 45%, has direct implications for environmental protection, public health, and equity. It highlights a persistent service gap that cannot be addressed solely through awareness campaigns or enforcement, but instead requires coordinated investments in infrastructure, institutional capacity, and inclusive service design. From a sustainability standpoint, this reinforces the principle that environmental outcomes are inseparable from social and infrastructural conditions [48].
4.2. Spatial Diffusion, Neighbourhood Effects, and Area-Based Interventions
One of the most salient findings is the overwhelming explanatory power of neighbourhood-context variables, accounting for approximately 30–40% of total mutual information across all waste disposal pathways. This provides quantitative evidence that waste disposal behaviours in Eswatini exhibit strong spatial diffusion and collective dynamics, whereby households are influenced by shared service environments, social norms, and local enforcement realities.
This result has important implications for policy design. Conventional approaches that target households in isolation - through fines, messaging, or behaviour-change campaigns - are unlikely to be effective where neighbourhood conditions remain unchanged. Instead, the results support area-based intervention strategies, such as upgrading services at the chiefdom or EA-cluster level, implementing communal infrastructure solutions, and coordinating interventions across contiguous settlements. Similar conclusions have been drawn in sustainability and urban services research, where neighbourhood-scale interventions are shown to outperform household-level approaches in contexts of shared constraints [49,50,51].
4.3. Implications for SDG 11.6.1 Monitoring and Reporting
SDG 11.6.1 seeks to measure the proportion of municipal solid waste that is collected and managed in controlled facilities. In practice, national reporting often relies on coarse administrative summaries that mask sub-national disparities and fail to capture informal disposal pathways [52]. The probabilistic outputs generated in this study - particularly expected values and P(high) surfaces - offer a defensible mechanism for sub-national SDG monitoring, allowing Eswatini to identify precisely where progress toward SDG 11.6.1 is being made and where it is lagging.
Importantly, the integration of uncertainty diagnostics (entropy and KL divergence) provides additional policy value. High-uncertainty areas indicate where SDG-related indicators are least reliable and where investments in improved data collection or service audits may be warranted. This aligns with recent calls within the SDG community to move beyond point estimates and incorporate uncertainty into indicator reporting, particularly in data-constrained environments [53,54].
4.4. Climate Co-Benefits and the Role of Open Burning Reduction
Open burning of household waste emerged as one of the most spatially extensive informal disposal practices, particularly in rural and peri-urban EAs with limited infrastructure. From a climate and air-quality perspective, this finding is highly significant. Open burning is a well-documented source of short-lived climate pollutants (SLCPs), including black carbon and methane, as well as toxic compounds such as dioxins and furans [55,56,57]. Reducing open burning therefore offers substantial climate co-benefits, alongside improvements in public health and local environmental quality.
For Eswatini, where climate mitigation strategies increasingly recognise the importance of non-CO₂ pollutants, these results suggest that waste sector interventions could contribute meaningfully to national climate objectives and Nationally Determined Contribution (NDC) implementation. Targeting high-probability, low-uncertainty open-burning hotspots identified by the model would enable “no-regrets” interventions with immediate climate and health payoffs [58,59].
4.5. Aligning Results with National Waste Governance Frameworks
Eswatini's waste governance framework-anchored in the Environment Management Act (2002) and subsequent waste regulations-emphasises environmentally sound waste handling and the prevention of practices that pose risks to human health and ecosystems [60,61]. However, enforcement capacity and service provision remain uneven, particularly outside major urban centres.
The spatial patterns revealed in this study offer a concrete evidence base to support more targeted and differentiated policy implementation. For example:
- EAs with high predicted regular collection and low uncertainty represent areas where existing governance arrangements are functioning and should be consolidated.
- Peri-urban EAs with high entropy and mixed disposal behaviours are priority zones for pilot interventions, service expansion, and participatory planning.
- Structurally marginalised rural EAs dominated by undesignated disposal and open burning require integrated approaches combining service provision, community engagement, and enforcement support.
Such differentiation aligns with contemporary sustainability governance principles that emphasise context-specific solutions rather than uniform national prescriptions [62].
4.6. Uncertainty as a Planning Asset Rather Than a Limitation
A key contribution of this study is its explicit treatment of uncertainty as a planning-relevant output rather than a modelling inconvenience. Posterior entropy and KL divergence surfaces reveal where predictions are robust and where behaviour is unstable or poorly explained by available predictors. High-uncertainty areas often correspond to rapidly transforming peri-urban zones, where settlement expansion, informal tenure, and evolving service arrangements complicate planning.
From a sustainability policy perspective, these areas represent opportunities for adaptive management. Rather than committing to fixed infrastructure solutions prematurely, planners can use uncertainty maps to prioritise incremental interventions, data collection, and stakeholder engagement. This approach is increasingly advocated in sustainability science, where adaptive and learning-oriented governance is viewed as essential under conditions of complexity and uncertainty [63,64,65].
4.7. Methodological Contributions to Sustainable Waste Planning
Methodologically, the SBN framework developed in this study advances sustainable waste planning in several ways. First, it demonstrates that routinely collected census data—often underutilised beyond descriptive reporting—can support sophisticated probabilistic modelling when combined with spatial indicators and neighbourhood effects. Second, the use of Tree-Augmented Naïve Bayes strikes a balance between interpretability and performance, making model outputs accessible to policy audiences while retaining analytical rigour. Third, the transparent production of model artefacts (network structures, MI rankings, calibration plots, uncertainty diagnostics) enhances reproducibility and accountability, addressing common critiques of “black-box” modelling in sustainability policy contexts [66,67].
4.8. Limitations and Directions for Policy-Relevant Future Research
While the results are robust and policy-relevant, several limitations merit discussion. The analysis relies on self-reported census data, which may under-represent informal or socially undesirable practices such as dumping and burning. Temporal dynamics are not explicitly captured, limiting the ability to analyse behavioural change over time. In addition, the EA scale, while appropriate for planning, may mask intra-EA heterogeneity in densely populated informal settlements.
Future research could address these limitations by integrating longitudinal data, targeted household surveys, participatory mapping, and environmental monitoring (e.g., air quality or waste composition studies). Coupling the current behavioural model with emissions estimation or health-risk assessment frameworks would further strengthen its relevance for integrated sustainability planning.
5. Conclusions and Policy Recommendations
5.1. Conclusions
This study developed and applied a spatially explicit BN framework to model household solid waste disposal behaviours across Eswatini at enumeration-area scale, explicitly accounting for spatial dependence and uncertainty. The results demonstrate pronounced spatial heterogeneity in disposal practices, with formal waste collection dominating in fewer than one-third of enumeration areas, while informal pathways-particularly open burning, dumping, and undesignated disposal-remain widespread, especially in rural and peri-urban contexts.
Across all disposal pathways, neighbourhood effects emerged as the most influential determinant, confirming that waste disposal behaviour in Eswatini is strongly shaped by shared service environments and spatial diffusion rather than isolated household choice. Infrastructure access - especially electricity, road connectivity, and proximity to towns -consistently outweighed demographic factors, underscoring the structural nature of unsustainable disposal practices.
By integrating posterior entropy and Kullback-Leibler divergence, the study moves beyond deterministic mapping to reveal where predictions are robust and where behavioural uncertainty is high. These uncertainty diagnostics identify peri-urban transition zones as critical leverage points for intervention, data improvement, and adaptive planning. Overall, the findings demonstrate that probabilistic, uncertainty - aware spatial modelling provides a robust and interpretable evidence base for sustainable waste management planning in data - constrained settings.
5.2. Policy Recommendations
Based on the results, the following policy-relevant recommendations are proposed for Eswatini:
- Adopt area-based service interventions: Given the strong neighbourhood effects observed, waste management interventions should be planned and implemented at community or EA-cluster scale, rather than targeting households in isolation.
- Prioritise peri-urban transition zones: Areas with high predicted risk and high uncertainty should be prioritised for pilot service expansion, participatory planning, and incremental infrastructure investments, to prevent the entrenchment of unsustainable disposal practices.
- Integrate waste planning with infrastructure development: Investments in electrification, road access, and urban connectivity should be explicitly aligned with waste management strategies, recognising their strong co-benefits for service uptake and environmental outcomes.
- Leverage waste interventions for climate co-benefits: Reducing open burning in high-probability hotspots offers immediate benefits for air quality and short-lived climate pollutant mitigation, supporting Eswatini's broader climate objectives and NDC implementation.
- Strengthen SDG 11.6.1 sub-national monitoring: The probabilistic outputs generated in this study provide a defensible basis for sub-national tracking of waste collection and management, complementing national reporting and improving accountability.
- Institutionalise uncertainty-aware planning: Posterior entropy and KL divergence maps can be used routinely to guide adaptive decision-making, prioritising learning and data collection where uncertainty is highest.
In conclusion, this study demonstrates that sustainable waste governance in Eswatini requires structurally informed, spatially targeted, and uncertainty-aware approaches. The modelling framework presented here offers a scalable and transferable tool to support evidence-based policy design, implementation, and monitoring in Eswatini and other countries facing similar sustainability challenges.
Supplementary Materials
The following supporting information can be downloaded at the website of this paper posted on Preprints.org, Figure S1: Mutual information between the target variable and the predictor variables across all waste disposal pathways: (a) open burning, (b) public/community pits, (c) irregular collection, (d) regular collection, (e) backyard pits and (f) undesignated sites.; Figure S2: Scatter graphs of predicted expected values and posterior entropy across all waste disposal pathways: (a) open burning, (b) public/community pits, (c) irregular collection, (d) regular collection, (e) backyard pits and (f) undesignated sites.
Author Contributions
Conceptualization, methodology, software, validation, formal analysis, investigation, resources, data curation, writing-original draft preparation, writing-review and editing, visualization, supervision, project administration: W.M.D.
Funding
This research received no external funding.
Institutional Review Board Statement
Not applicable.
Informed Consent Statement
Not applicable.
Data Availability Statement
Restrictions apply to the availability of these data. The data were obtained from the Central Statistical Office (Government of the Kingdom of Eswatini) and are available from the same with the permission of the Central Statistical Office.
Acknowledgments
The author acknowledges the Central Statistical Office of Eswatini for providing access to the Population and Housing Census data used in this study. Institutional support from the University of Eswatini, particularly through the Centre for Climate Change and Sustainability Research, is also gratefully acknowledged.
Conflicts of Interest
The author declares no conflict of interest.
Abbreviations
The following abbreviations are used in this manuscript:
| BN | Bayesian Network |
| EA | Enumeration Area |
| KL | Kullback–Leibler Divergence |
| MAE | Mean Absolute Error |
| MI | Mutual Information |
| MSW | Municipal Solid Waste |
| NDC | Nationally Determined Contribution |
| RMSE | Root Mean Square Error |
| SDG | Sustainable Development Goal |
| SBN | Spatial Bayesian Network |
| SLCP | Short-Lived Climate Pollutant |
| TAN | Tree-Augmented Naïve Bayes |
Appendix A
- Figure S1: Spatial distribution of posterior entropy and Kullback–Leibler divergence for all household waste disposal pathways, illustrating predictive uncertainty and information gain at enumeration-area level across Eswatini.
- Table S1: Summary of predictor variables, discretisation thresholds, and Mutual Information (MI) scores used in the Tree-Augmented Naïve Bayes models for each waste disposal pathway.
- Video S1: Animated visualization of spatial transitions in predicted household waste disposal behaviours and associated uncertainty surfaces across Eswatini.
References
- Kaza, S.; Yao, L.; Bhada-Tata, P.; Van Woerden, F. What a Waste 2.0: A Global Snapshot of Solid Waste Management to 2050; World Bank: Washington, DC, USA, 2018. [Google Scholar]
- United Nations Environment Programme (UNEP); International Solid Waste Association (ISWA). Global Waste Management Outlook; UNEP: Nairobi, Kenya, 2015. [Google Scholar]
- United Nations Human Settlements Programme (UN-Habitat). Solid Waste Management in the World’s Cities: Water and Sanitation in the World’s Cities 2010; Earthscan: London, UK, 2010. [Google Scholar]
- Hoornweg, D.; Bhada-Tata, P. What a Waste: A Global Review of Solid Waste Management. In Urban Development Series Knowledge Papers; World Bank: Washington, DC, USA, 2012. [Google Scholar]
- Wilson, D.C.; Rodic, L.; Scheinberg, A.; Velis, C.; Alabaster, G. Comparative analysis of solid waste management in 20 cities. Waste Manag. Res. 2012, 30, 237–254. [Google Scholar] [CrossRef] [PubMed]
- Guerrero, L.A.; Maas, G.; Hogland, W. Solid waste management challenges for cities in developing countries. Waste Manag. 2013, 33, 220–232. [Google Scholar] [CrossRef]
- Zurbrügg, C.; Gfrerer, M.; Ashadi, H.; Brenner, W.; Küper, D. Determinants of sustainability in solid waste management—The context of developing countries. Sustain. Sci. 2012, 7, 125–138. [Google Scholar]
- Uusitalo, L. Advantages and challenges of Bayesian networks in environmental modelling. Ecol. Model. 2007, 203, 312–318. [Google Scholar] [CrossRef]
- Aguilera, P.A.; Fernández, A.; Fernández, R.; Rumí, R.; Salmerón, A. Bayesian networks in environmental modelling. Environ. Model. Softw. 2011, 26, 1376–1388. [Google Scholar] [CrossRef]
- Marcot, B.G.; Steventon, J.D.; Sutherland, G.D.; McCann, R.K. Guidelines for developing and updating Bayesian belief networks applied to ecological modeling and conservation. Can. J. For. Res. 2006, 36, 3063–3074. [Google Scholar] [CrossRef]
- Eswatini, Kingdom of. Environment Management Act, 2002; Government Gazette/Statute: Mbabane, Eswatini, 2002. [Google Scholar]
- Eswatini Legal Information Institute (EswatiniLII). Environment Management Act, 2002 (Act No. 5 of 2002); EswatiniLII: Mbabane, Eswatini.
- Municipality of Piggs Peak (Eswatini). Integrated Waste Management Plan (IWMP); Eswatini: Piggs Peak.
- Central Statistical Office (CSO); Kingdom of Eswatini. 2017 Population and Housing Census; CSO: Mbabane, Eswatini, 2017. [Google Scholar]
- Pearl, J. Probabilistic Reasoning in Intelligent Systems: Networks of Plausible Inference; Morgan Kaufmann: San Mateo, CA, USA, 1988. [Google Scholar]
- Koller, D.; Friedman, N. Probabilistic Graphical Models: Principles and Techniques; MIT Press: Cambridge, MA, USA, 2009. [Google Scholar]
- Jensen, F.V.; Nielsen, T.D. Bayesian Networks and Decision Graphs, 2nd ed.; Springer: New York, NY, USA, 2007. [Google Scholar]
- Spiegelhalter, D.J.; Best, N.G.; Carlin, B.P.; van der Linde, A. Bayesian measures of model complexity and fit. J. R. Stat. Soc. B 2002, 64, 583–639. [Google Scholar] [CrossRef]
- Wilson, D.C.; Velis, C.; Rodic, L. Integrated sustainable waste management in developing countries. Proc. Inst. Civ. Eng. Waste Resour. Manag. 2013, 166, 52–68. [Google Scholar] [CrossRef]
- Gavidia, S.; Barranco, R.; Bovea, M.D. A review of municipal solid waste management in developing countries: A focus on policy and institutional aspects. J. Clean. Prod. 2022, 355, 131747. [Google Scholar]
- Friedman, N.; Geiger, D.; Goldszmidt, M. Bayesian network classifiers. Mach. Learn. 1997, 29, 131–163. [Google Scholar] [CrossRef]
- Chow, C.K.; Liu, C.N. Approximating discrete probability distributions with dependence trees. IEEE Trans. Inf. Theory 1968, 14, 462–467. [Google Scholar] [CrossRef]
- Heckerman, D. A tutorial on learning with Bayesian networks. In Learning in Graphical Models; Jordan, M.I., Ed.; MIT Press: Cambridge, MA, USA, 1999; pp. 301–354. [Google Scholar]
- Tobler, W.R. A computer movie simulating urban growth in the Detroit region. Econ. Geogr. 1970, 46 (Suppl.), 234–240. [Google Scholar] [CrossRef]
- Anselin, L. Spatial Econometrics: Methods and Models; Kluwer Academic: Dordrecht, The Netherlands, 1988. [Google Scholar]
- LeSage, J.; Pace, R.K. Introduction to Spatial Econometrics; CRC Press: Boca Raton, FL, USA, 2009. [Google Scholar]
- Elvidge, C.D.; Baugh, K.E.; Zhizhin, M.; Hsu, F.-C.; Ghosh, T. VIIRS night-time lights. Remote Sens. 2017, 9, 1–18. [Google Scholar] [CrossRef]
- Small, C.; Elvidge, C.D. Night on Earth: Mapping decadal changes of anthropogenic light. Remote Sens. 2013, 5, 1–25. [Google Scholar]
- Weiss, D.J.; Nelson, A.; Gibson, H.S.; et al. A global map of travel time to cities. Nature 2018, 553, 333–336. [Google Scholar] [CrossRef]
- Agresti, A. Analysis of Ordinal Categorical Data, 2nd ed.; Wiley: Hoboken, NJ, USA, 2010. [Google Scholar]
- Cliff, A.D.; Ord, J.K. Spatial Processes: Models & Applications; Pion: London, UK, 1981. [Google Scholar]
- Bivand, R.; Pebesma, E.; Gómez-Rubio, V. Applied Spatial Data Analysis with R, 2nd ed.; Springer: New York, NY, USA, 2013. [Google Scholar]
- Cressie, N. Statistics for Spatial Data, revised ed.; Wiley: New York, NY, USA, 1993. [Google Scholar]
- Barton, D.N.; Kuikka, S.; Varis, O.; et al. Bayesian networks in environmental decision support. Environ. Model. Softw. 2008, 23, 125–135. [Google Scholar]
- McCann, R.K.; Marcot, B.G.; Ellis, R. Bayesian belief networks: Applications in ecology and natural resource management. Can. J. For. Res. 2006, 36, 3053–3062. [Google Scholar] [CrossRef]
- Borsuk, M.E.; Stow, C.A.; Reckhow, K.H. A Bayesian network of eutrophication models for synthesis, prediction, and uncertainty analysis. Ecol. Model. 2004, 173, 219–239. [Google Scholar] [CrossRef]
- Langley, P.; Sage, S. Induction of selective Bayesian classifiers. In Proceedings of the Tenth Conference on Uncertainty in Artificial Intelligence (UAI), 1994. [Google Scholar]
- Sahami, M. Learning limited dependence Bayesian classifiers. In Proceedings of the Second International Conference on Knowledge Discovery and Data Mining (KDD), 1996. [Google Scholar]
- Fayyad, U.M.; Irani, K.B. Multi-interval discretization of continuous-valued attributes for classification learning. Proceedings of IJCAI, 1993. [Google Scholar]
- Peng, H.; Long, F.; Ding, C. Feature selection based on mutual information: Criteria of max-dependency, max-relevance, and min-redundancy. IEEE Trans. Pattern Anal. Mach. Intell. 2005, 27, 1226–1238. [Google Scholar] [CrossRef] [PubMed]
- Shannon, C.E. A mathematical theory of communication. Bell Syst. Tech. J. 1948, 27, 379–423, 623–656. [Google Scholar] [CrossRef]
- Kullback, S.; Leibler, R.A. On information and sufficiency. Ann. Math. Stat. 1951, 22, 79–86. [Google Scholar] [CrossRef]
- Cover, T.M.; Thomas, J.A. Elements of Information Theory, 2nd ed.; Wiley: Hoboken, NJ, USA, 2006. [Google Scholar]
- Murphy, K.P. Machine Learning: A Probabilistic Perspective; MIT Press: Cambridge, MA, USA, 2012. [Google Scholar]
- Geels, F.W. Technological transitions as evolutionary reconfiguration processes. Res. Policy 2002, 31, 1257–1274. [Google Scholar] [CrossRef]
- Markard, J.; Raven, R.; Truffer, B. Sustainability transitions: An emerging field. Res. Policy 2012, 41, 955–967. [Google Scholar] [CrossRef]
- Loorbach, D.; Frantzeskaki, N.; Avelino, F. Sustainability transitions research: Transforming science and practice. Annu. Rev. Environ. Resour. 2017, 42, 599–626. [Google Scholar] [CrossRef]
- Leach, M.; Scoones, I.; Stirling, A. Dynamic Sustainabilities; Earthscan: London, UK, 2010. [Google Scholar]
- Ostrom, E. A general framework for analyzing sustainability of social-ecological systems. Science 2009, 325, 419–422. [Google Scholar] [CrossRef]
- Bulkeley, H.; Betsill, M. Cities and Climate Change: Urban Sustainability and Global Environmental Governance; Routledge: London, UK, 2003. [Google Scholar]
- UN-Habitat. World Cities Report 2020: The Value of Sustainable Urbanization; UN-Habitat: Nairobi, Kenya, 2020. [Google Scholar]
- United Nations Statistical Commission / UN Statistics Division. SDG Indicator 11.6.1 Metadata (Proportion of municipal solid waste collected and managed in controlled facilities out of total municipal waste generated). UNStats.
- Forecast Verification: A Practitioner’s Guide in Atmospheric Science, 2nd ed.; Jolliffe, I.T., Stephenson, D.B., Eds.; Wiley: Chichester, UK, 2012. [Google Scholar]
- Gneiting, T.; Raftery, A.E. Strictly proper scoring rules, prediction, and estimation. J. Am. Stat. Assoc. 2007, 102, 359–378. [Google Scholar] [CrossRef]
- Wiedinmyer, C.; Yokelson, R.J.; Gullett, B.K. Global emissions of trace gases, particulate matter, and hazardous air pollutants from open burning of domestic waste. Environ. Sci. Technol. 2014, 48, 9523–9530. [Google Scholar] [CrossRef] [PubMed]
- Lemieux, P.M.; Lutes, C.C.; Santoianni, D.A. Emissions of organic air toxics from open burning. J. Air Waste Manag. Assoc. 2004, 54, 1473–1484. [Google Scholar]
- UNEP. Integrated Assessment of Black Carbon and Tropospheric Ozone; United Nations Environment Programme: Nairobi, Kenya, 2011. [Google Scholar]
- Intergovernmental Panel on Climate Change (IPCC). 2006 IPCC Guidelines for National Greenhouse Gas Inventories. In Waste; IGES: Hayama, Japan, 2006; Volume 5. [Google Scholar]
- IPCC. 2019 Refinement to the 2006 IPCC Guidelines for National Greenhouse Gas Inventories; IPCC: Geneva, Switzerland, 2019. [Google Scholar]
- Stockholm Convention on Persistent Organic Pollutants. Guidelines on Best Available Techniques and Best Environmental Practices (BAT/BEP) Relevant to Article 5 and Annex C; UNEP/POPs: Geneva, Switzerland.
- World Health Organization (WHO). Dioxins and Their Effects on Human Health (Fact Sheet); WHO: Geneva, Switzerland.
- Meadowcroft, J. Engaging with the politics of sustainability transitions. Environ. Innov. Soc. Transit. 2011, 1, 70–75. [Google Scholar] [CrossRef]
- Folke, C.; Hahn, T.; Olsson, P.; Norberg, J. Adaptive governance of social-ecological systems. Annu. Rev. Environ. Resour. 2005, 30, 441–473. [Google Scholar] [CrossRef]
- Pahl-Wostl, C. A conceptual framework for analysing adaptive capacity and multi-level learning processes in resource governance regimes. Glob. Environ. Chang. 2009, 19, 354–365. [Google Scholar] [CrossRef]
- Allen, C.R.; Gunderson, L.H. Pathology and failure in the design and implementation of adaptive management. J. Environ. Manag. 2011, 92, 1379–1384. [Google Scholar] [CrossRef] [PubMed]
- Breiman, L. Statistical modeling: The two cultures. Stat. Sci. 2001, 16, 199–231. [Google Scholar] [CrossRef]
- Rudin, C. Stop explaining black box machine learning models for high stakes decisions and use interpretable models instead. Nat. Mach. Intell. 2019, 1, 206–215. [Google Scholar] [CrossRef] [PubMed]
Figure 1.
Schematic representation of the Tree-Augmented Naïve Bayes (TAN) structure used for modelling household waste disposal behaviours in Eswatini.
Figure 1.
Schematic representation of the Tree-Augmented Naïve Bayes (TAN) structure used for modelling household waste disposal behaviours in Eswatini.
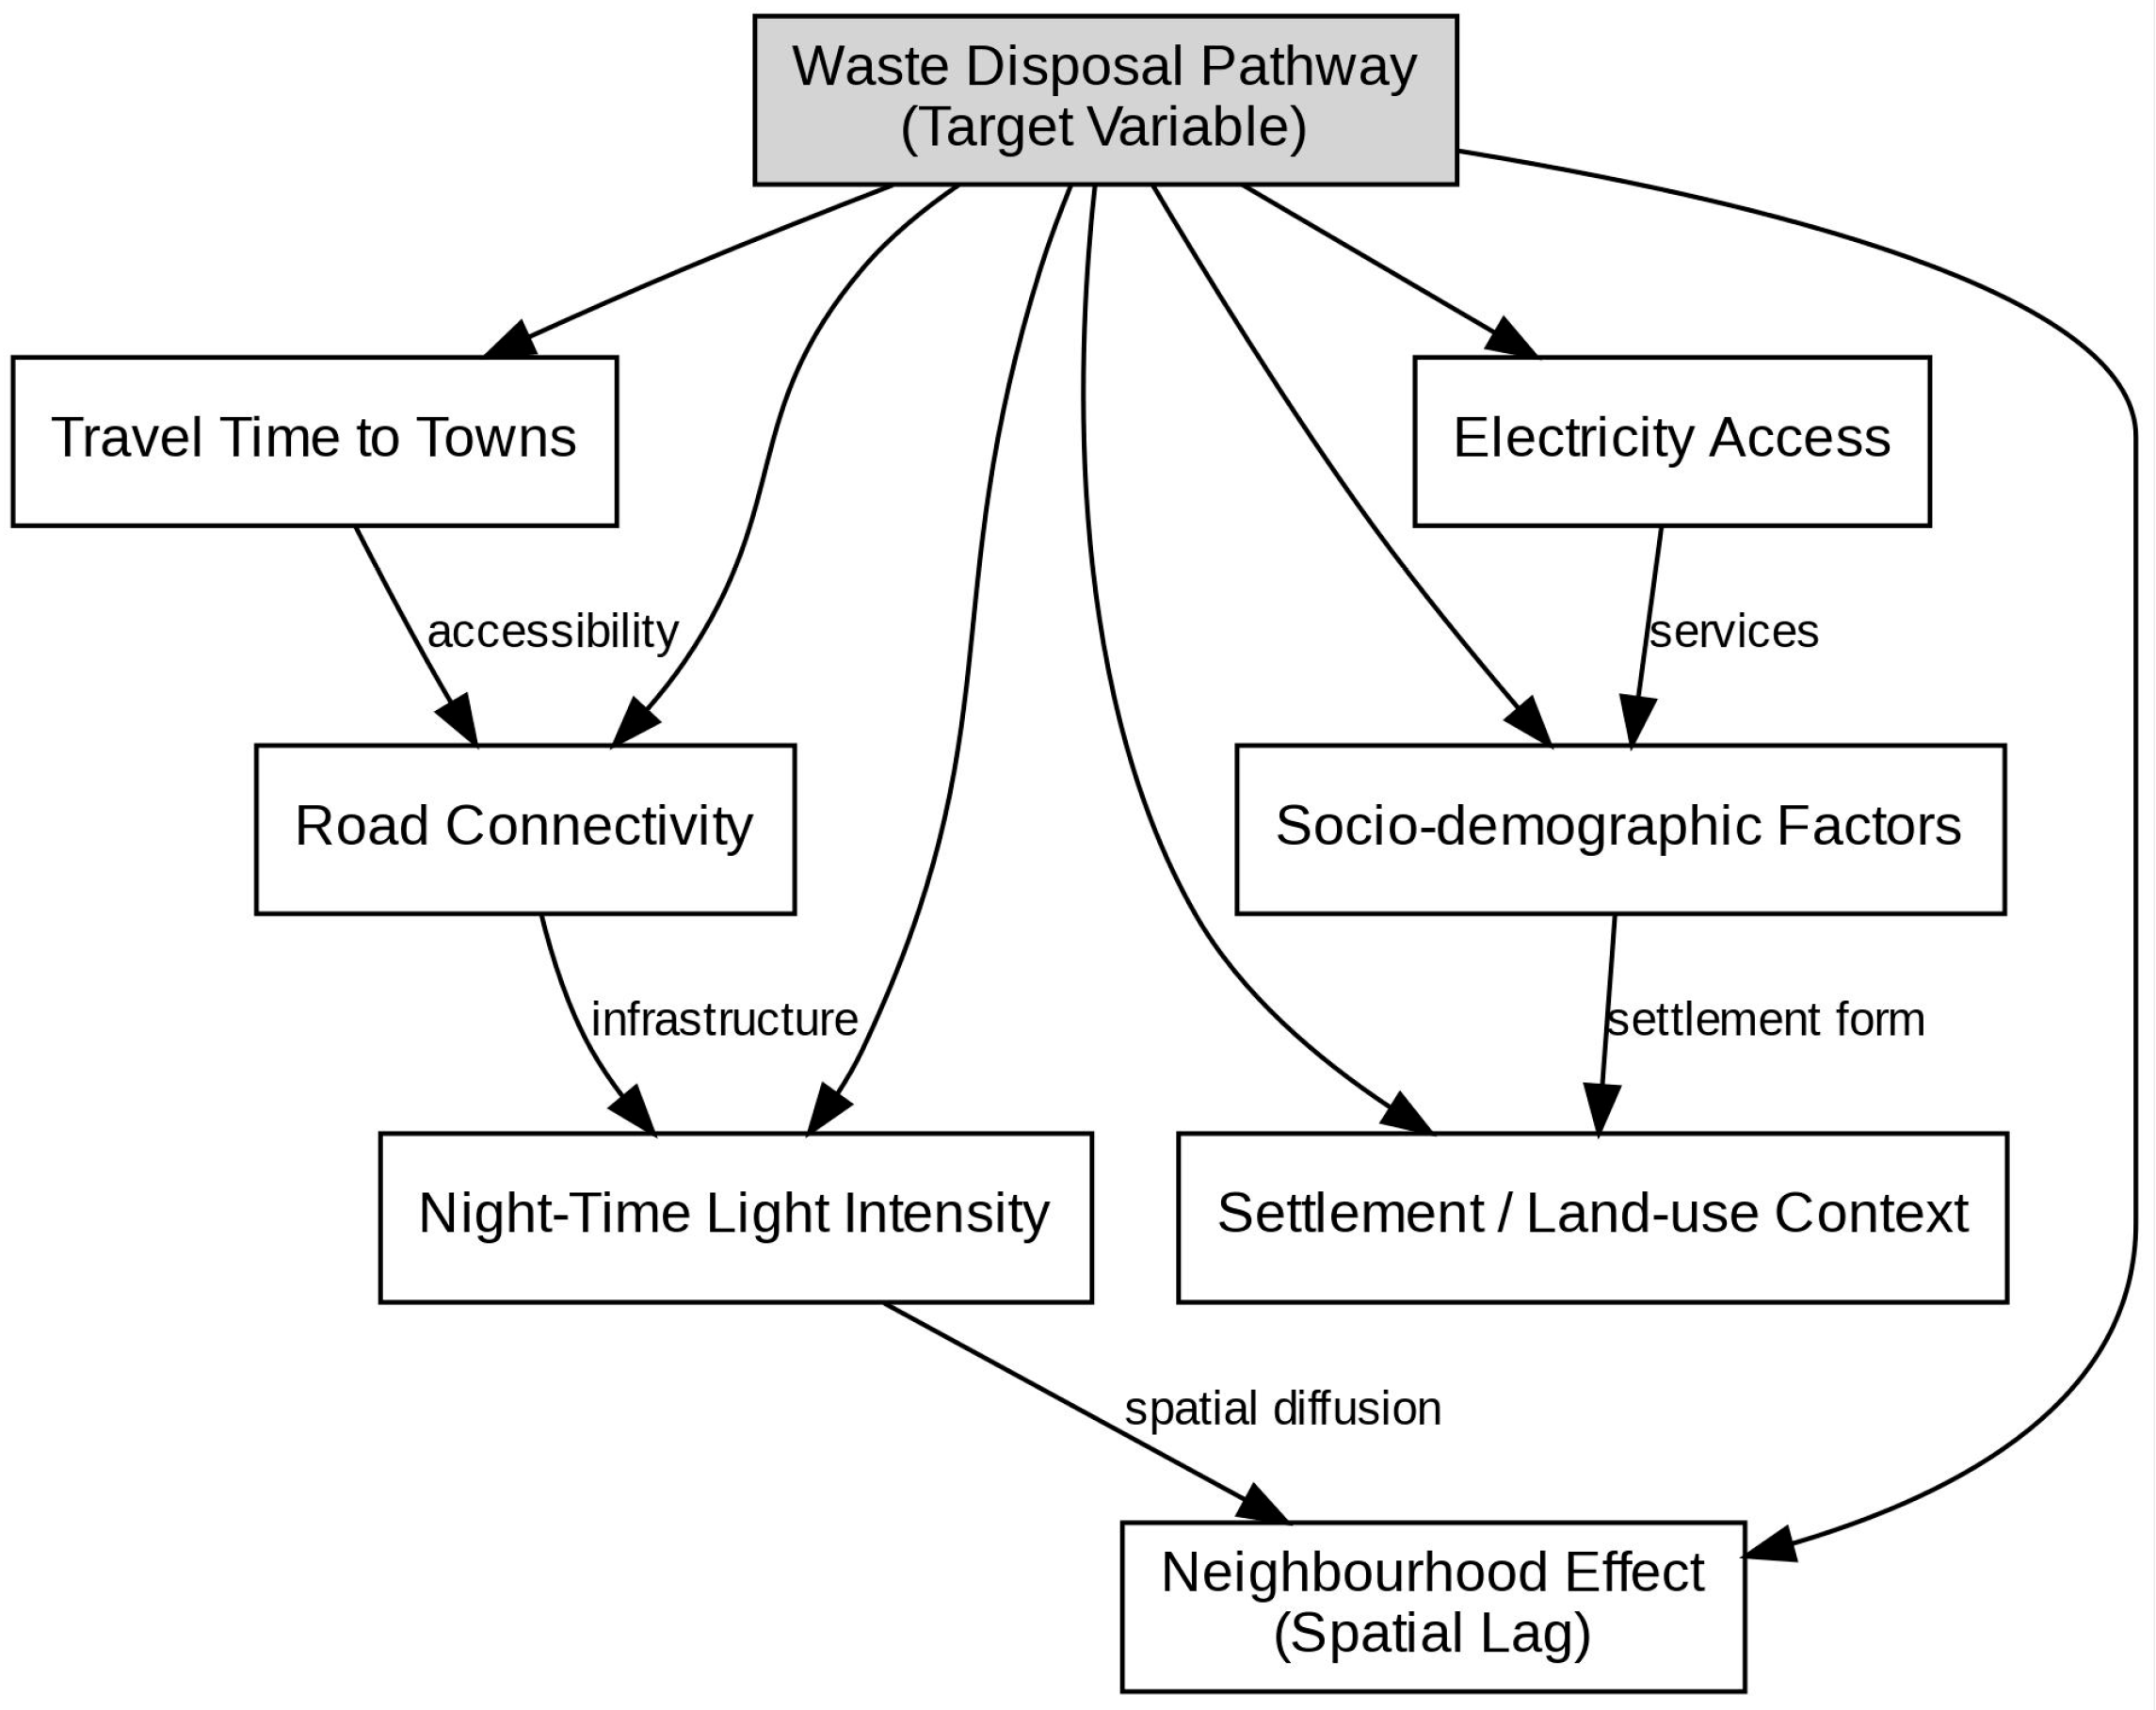
Figure 2.
Bayesian network (BN) structures for each waste disposal pathway, illustrating dominant conditional dependencies among predictors: (a) open burning, (b) public/community pits, (c) irregular collection, (d) regular collection, (e) backyard pits and (f) undesignated sites.
Figure 2.
Bayesian network (BN) structures for each waste disposal pathway, illustrating dominant conditional dependencies among predictors: (a) open burning, (b) public/community pits, (c) irregular collection, (d) regular collection, (e) backyard pits and (f) undesignated sites.
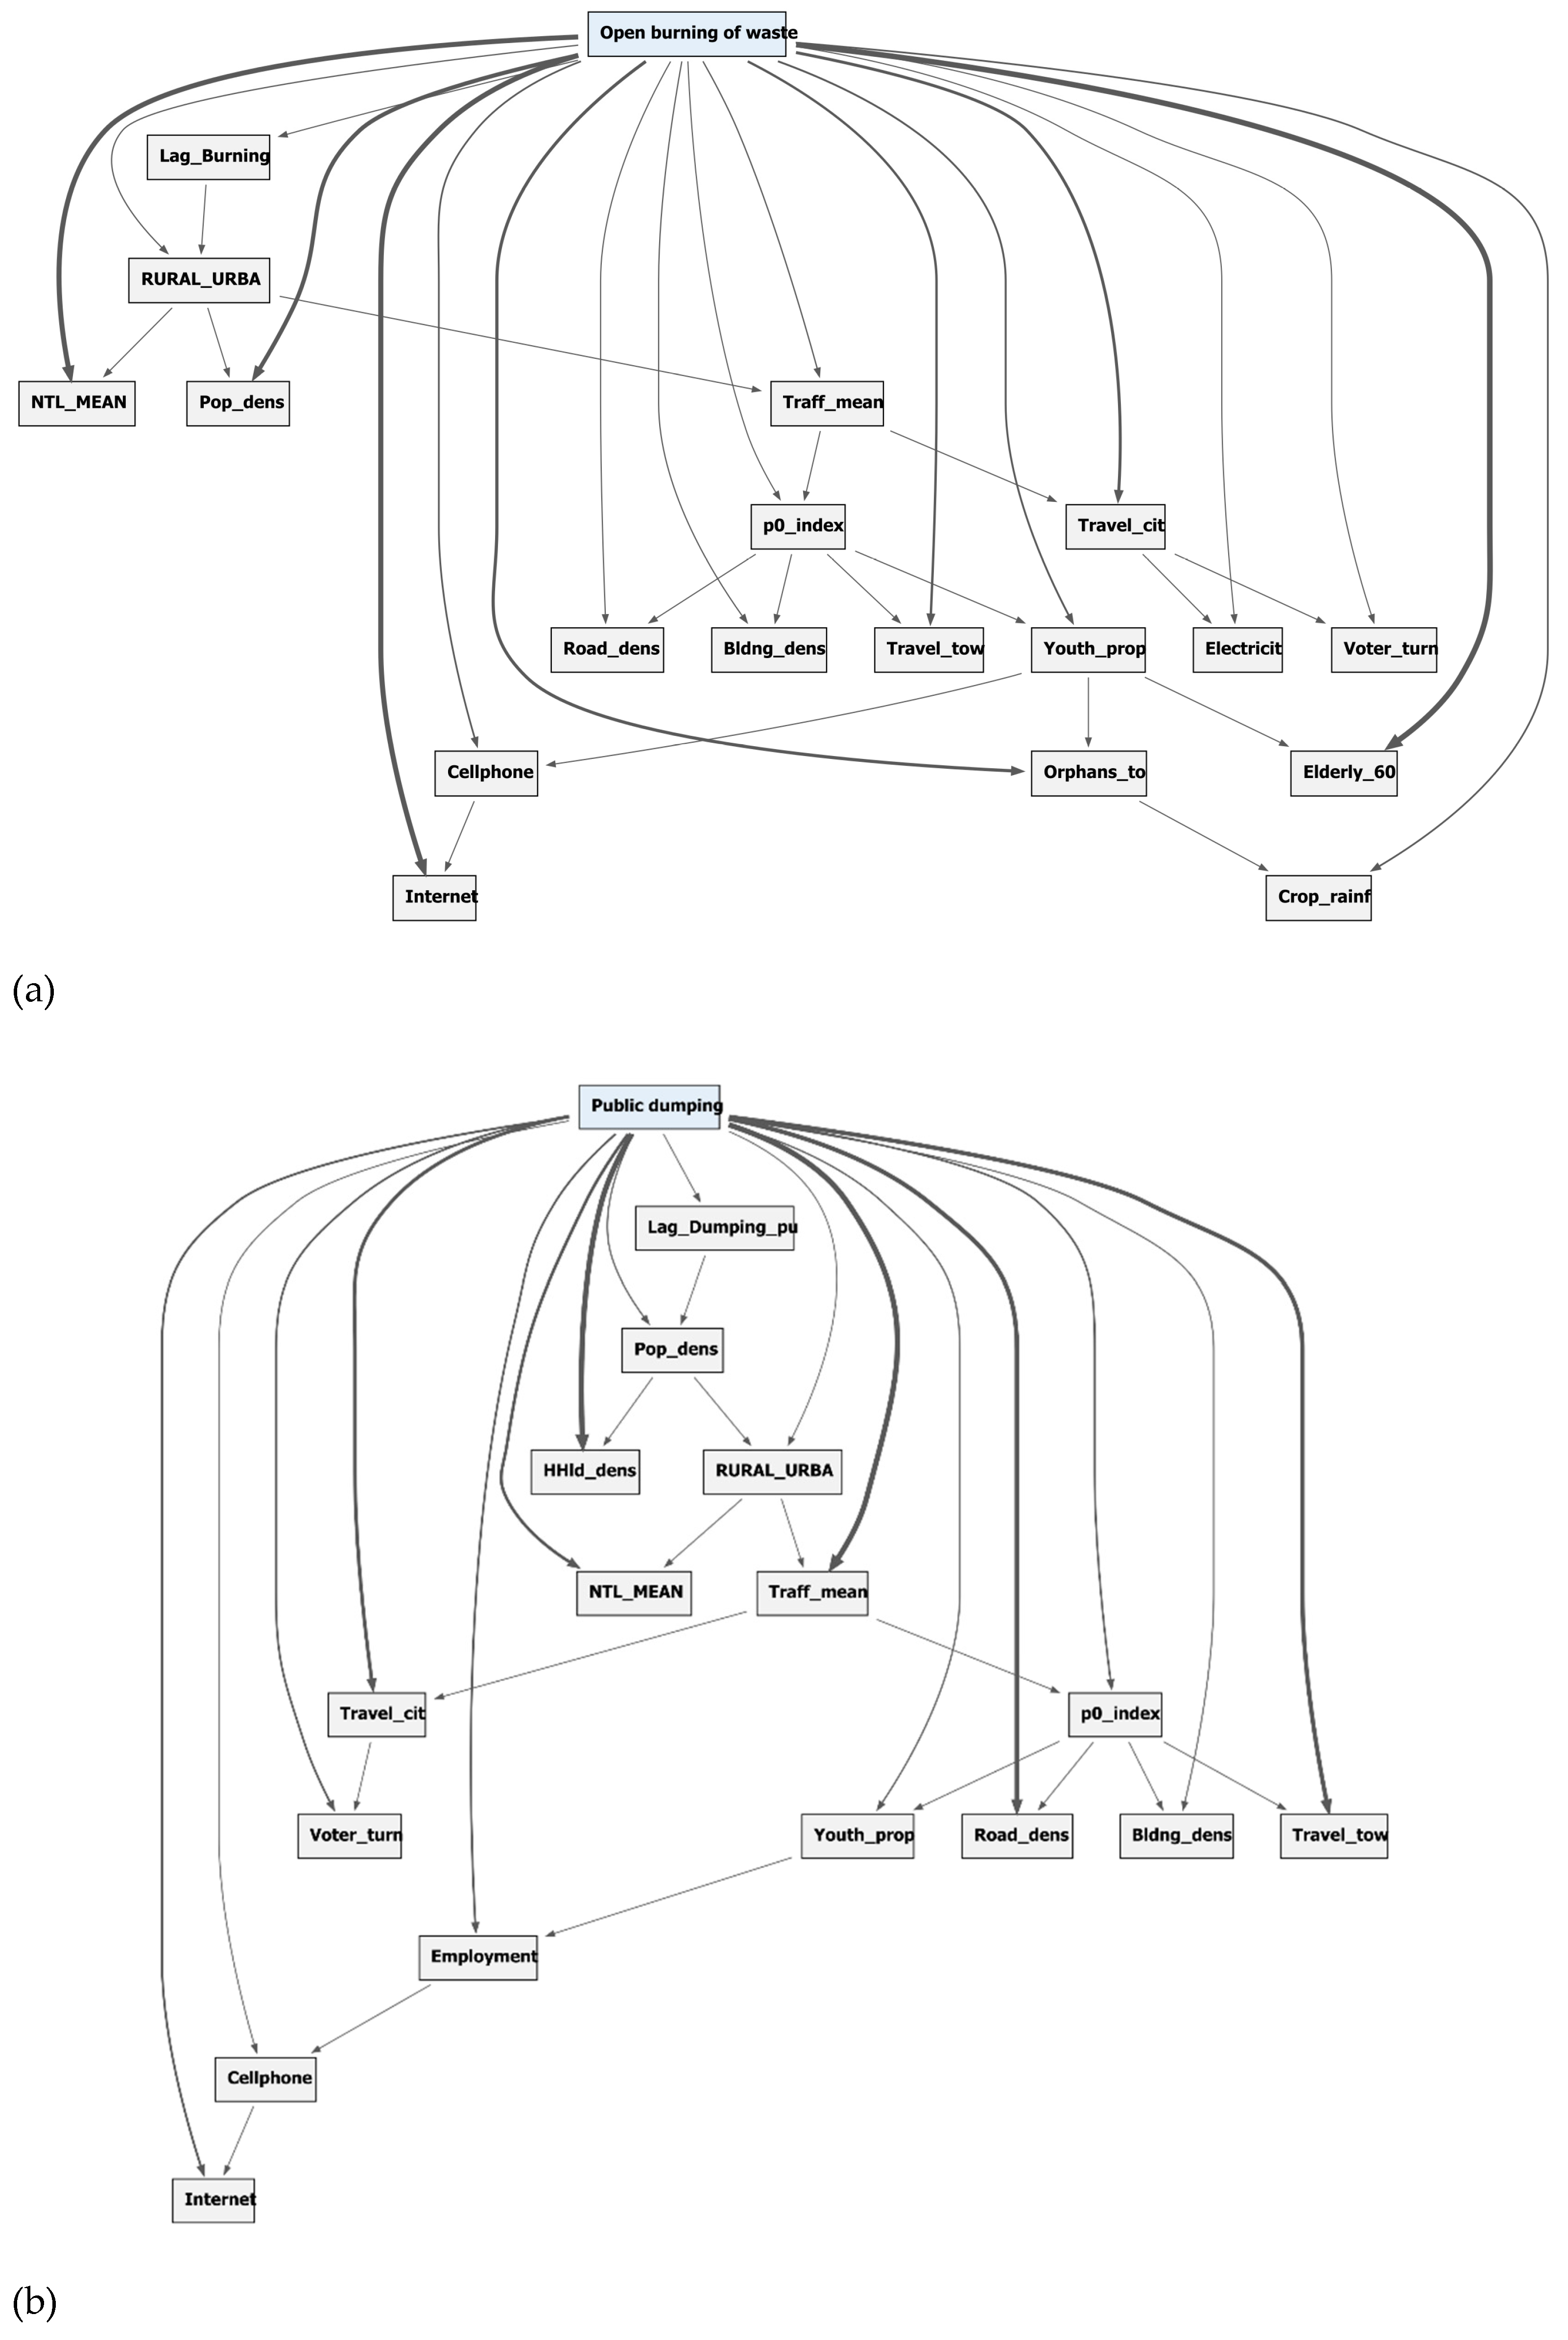
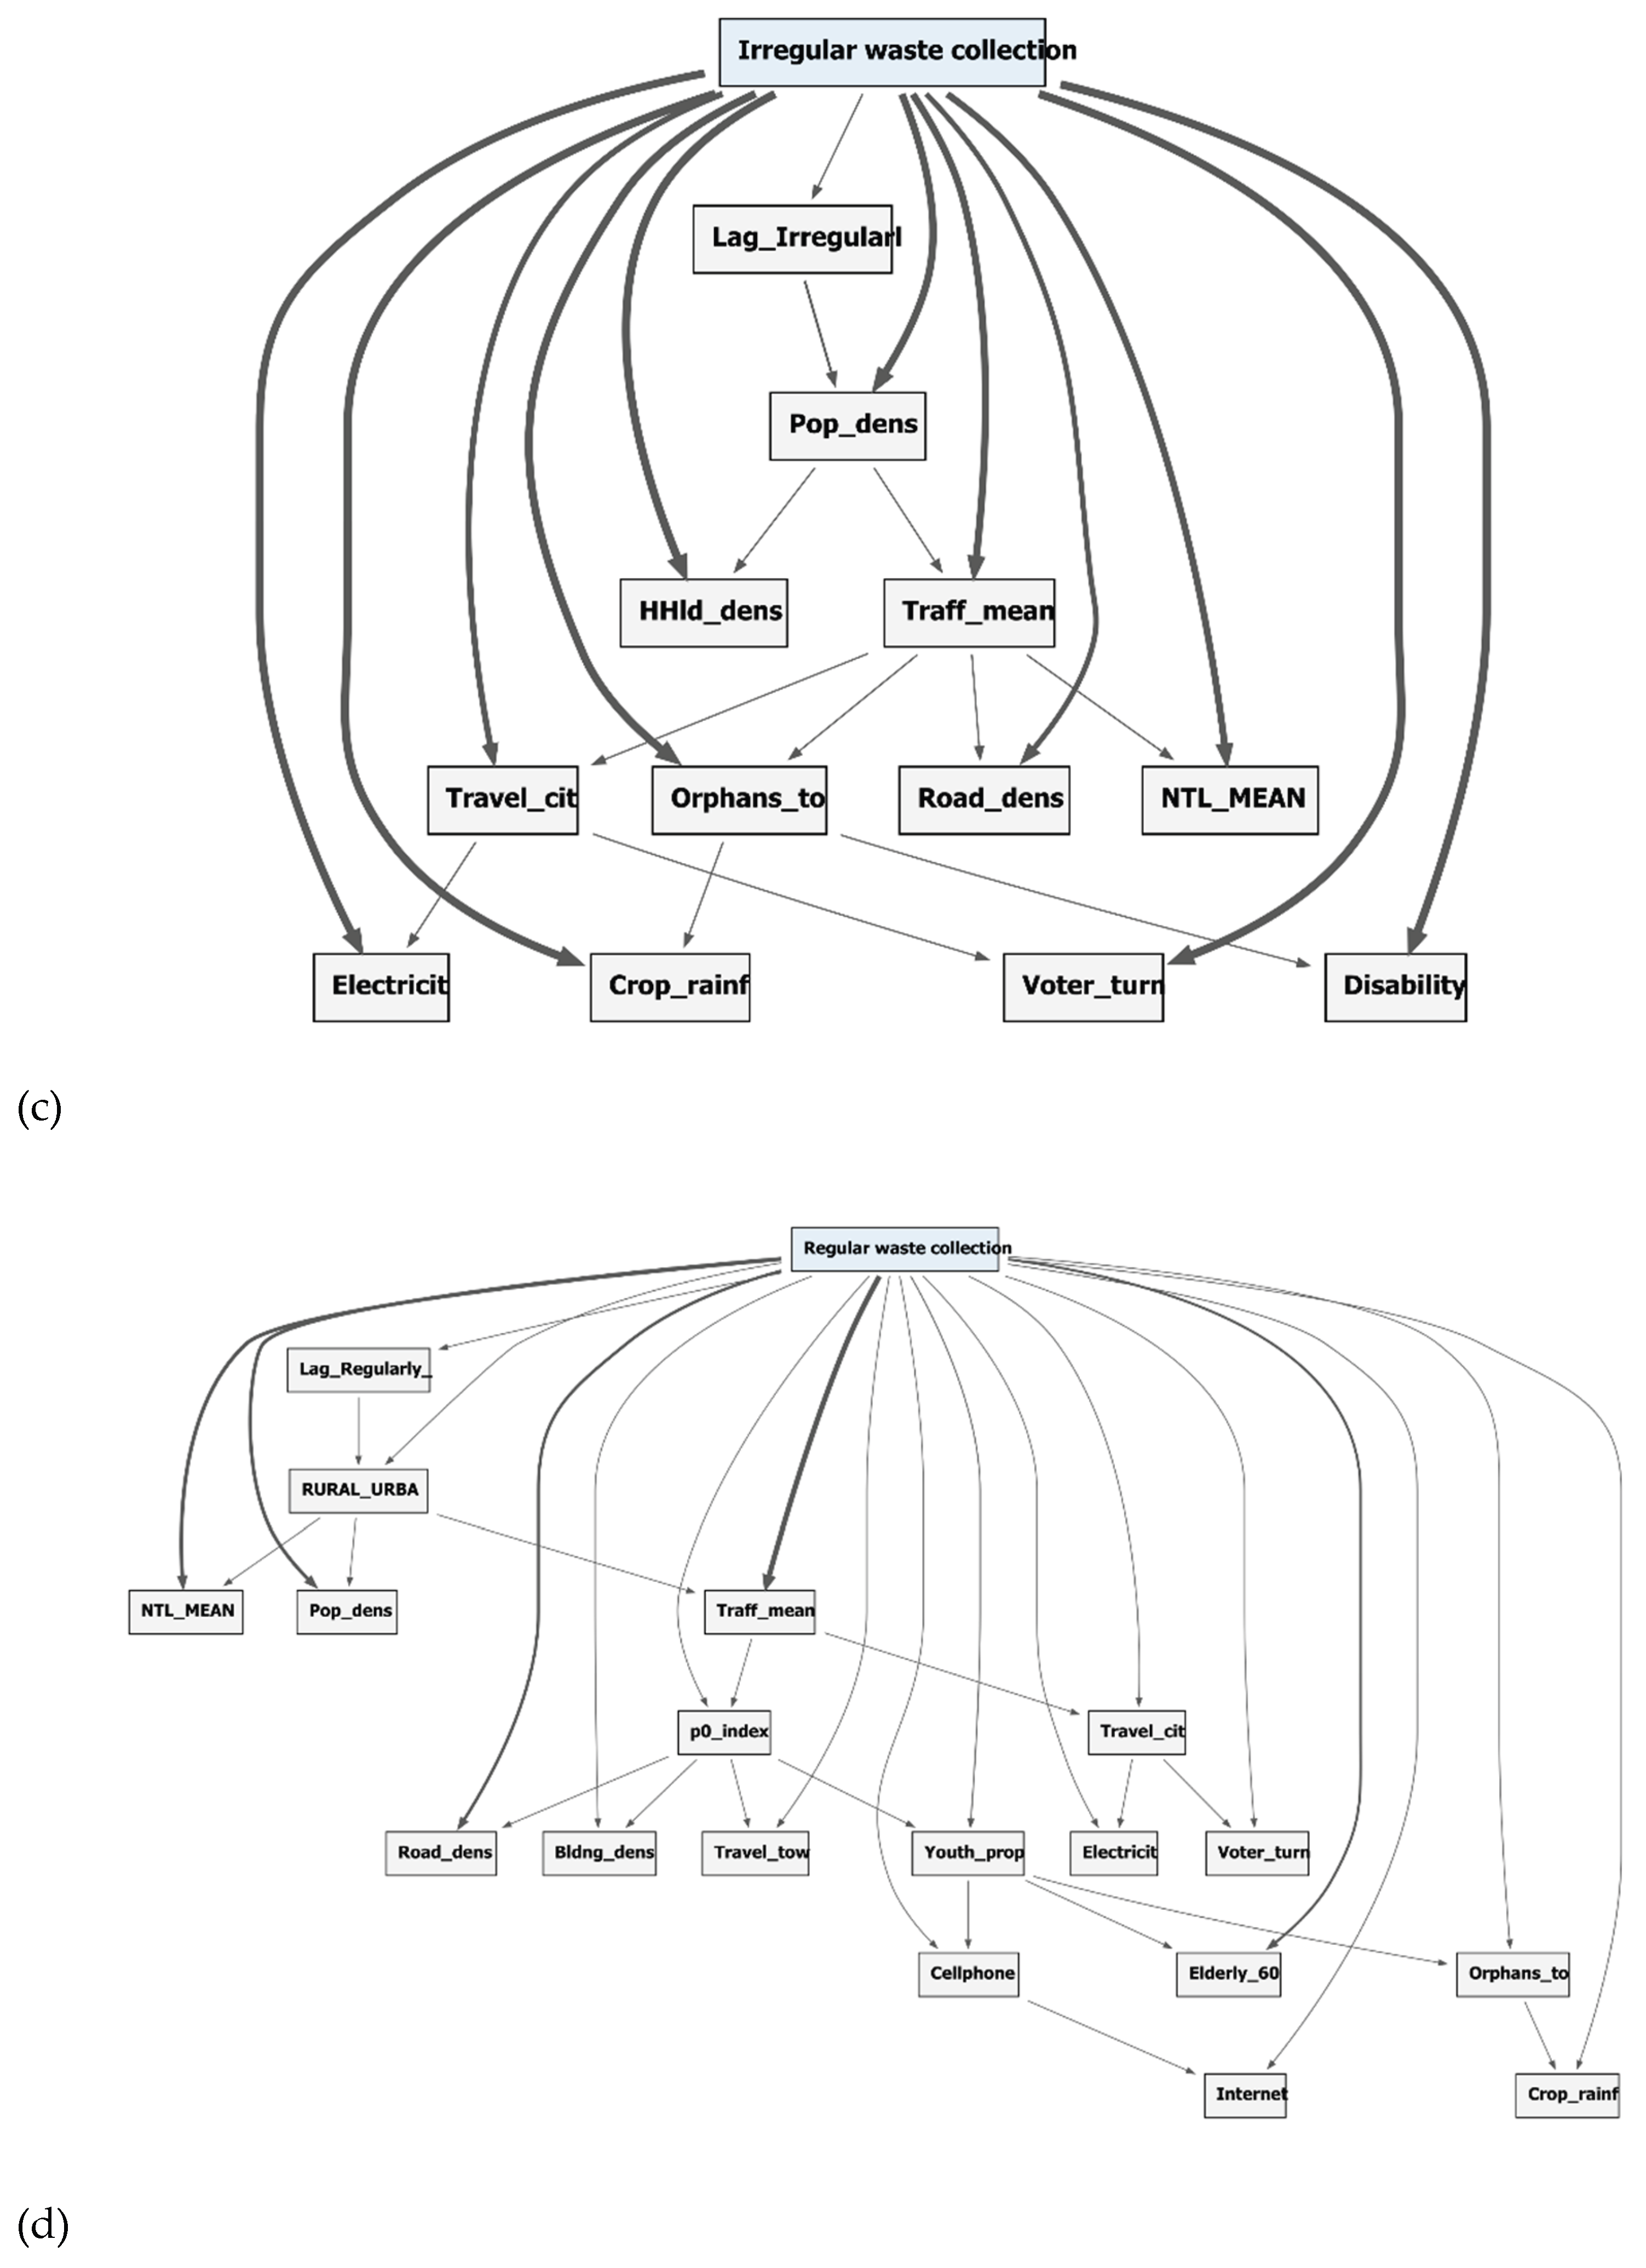
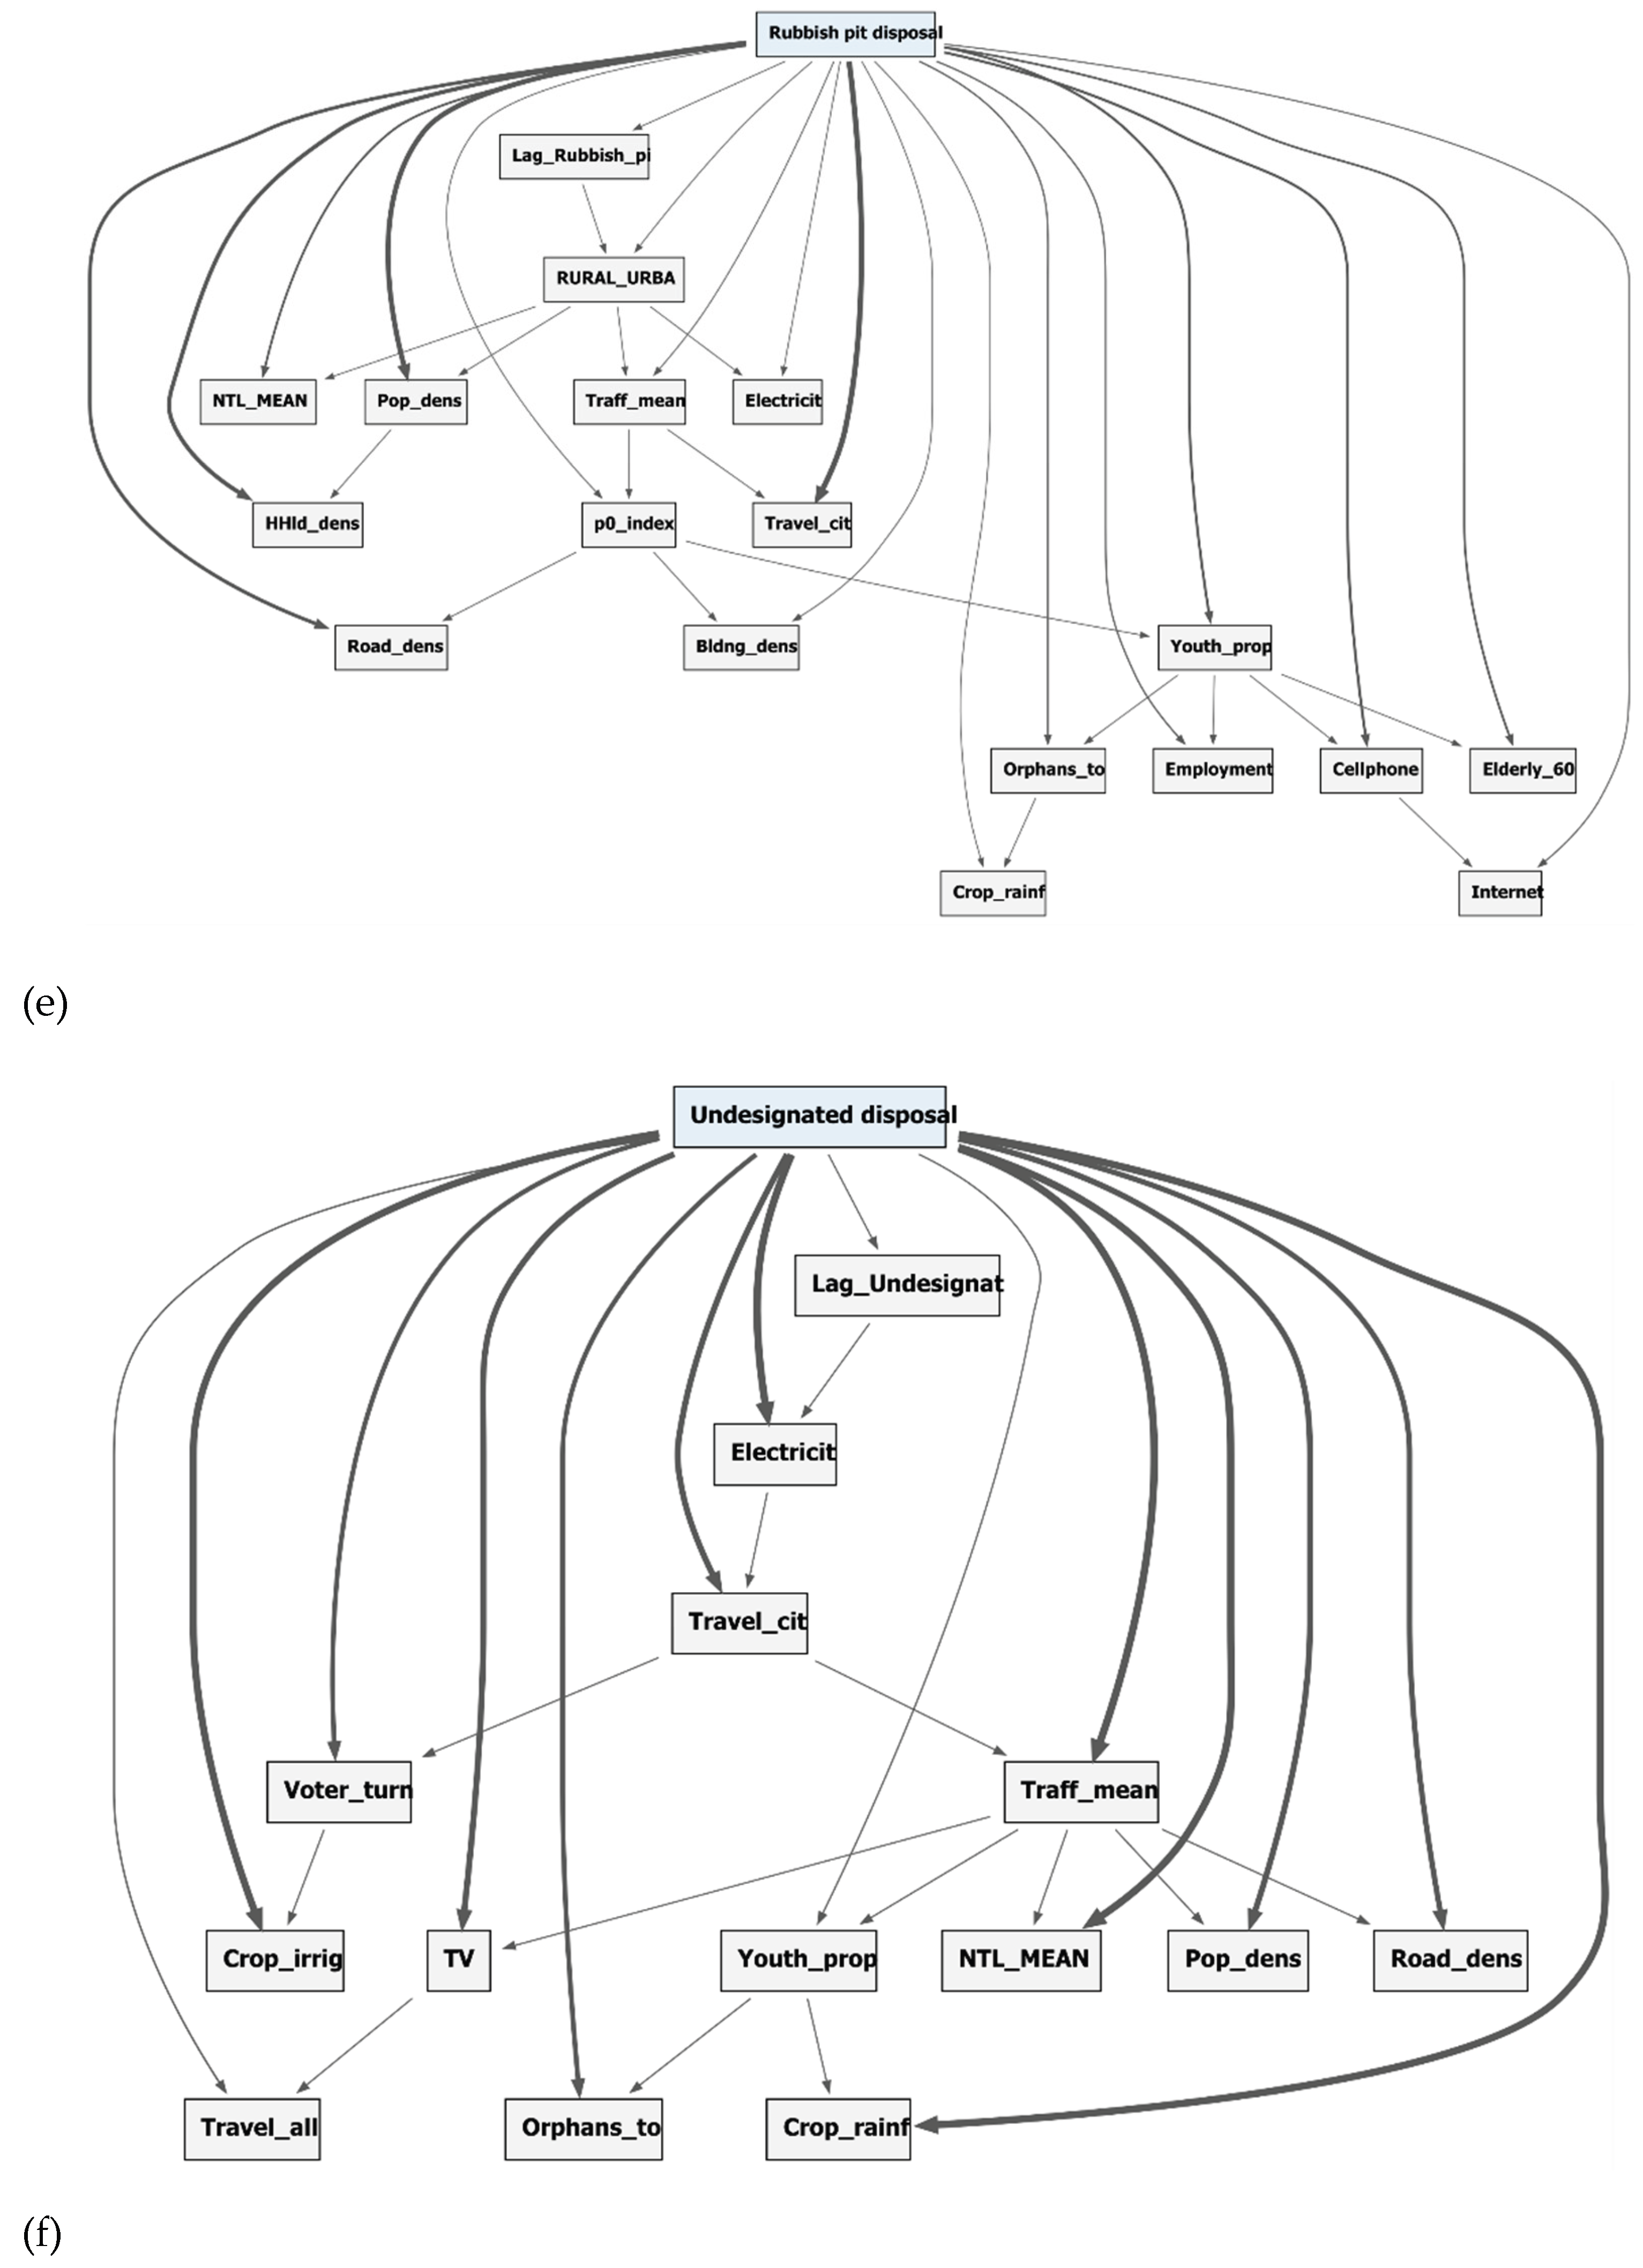

Table 1.
List of variables used in the analysis and their description.
| Domain | Key Variables (reported) | Actual data abbreviations (field names) | Description/Rationale |
| Spatial dependence (derived) | kNN spatial lag of outcome | Lag_<target> | Lag_Regularly_; Lag_Burning; Lag_Undesignat; Lag_Rubbish_pi; Lag_Irregularl; Lag_Dumping_pu |
| Demographics & settlement intensity | Population density; household density; household size | Pop_dens; HHld_dens; HHld_size | Population/household pressure influences waste generation and service feasibility; household size affects per-household waste practices and coping strategies. |
| Demographics (age structure) | Youth share; elderly share | Youth_prop; Elderly_60 | Age structure may influence environmental awareness, risk perceptions, and disposal practices. |
| Socio-economics (status/proxies) | Employment; poverty | Employment; p0_index | Economic status shapes ability to pay for formal services and likelihood of informal dumping/burning. |
| Connectivity & assets (status/proxies) | Internet; TV; cellphone ownership/access | Internet; TV; Cellphone | Proxies for wealth and access to information, linked to awareness and adoption of safer disposal options. |
| Energy access & fuel use (behavioural context) | Electricity access; wood reliance | Electricit; Wood | Energy profile is a proxy for poverty/modernisation and can relate to burning practices and household coping behaviours. |
| Infrastructure & built environment | Road density; building density | Road_dens; Bldng_dens | Physical accessibility and settlement compactness; influences collection logistics and likelihood of informal disposal hotspots. |
| Mobility & accessibility | Travel time to city/town/major centres; overall accessibility | Travel_cit; Travel_tow; Travel_maj; Travel_all | Access to services, markets, and enforcement; remoteness often correlates with service gaps and informal practices. |
| Transport/economic activity (proxy) | Traffic intensity | Traff_mean | Proxy for corridor development and accessibility; relates to exposure to services and potential dumping along transport routes. |
| Economic activity (proxy) | Nighttime lights | NTL_MEAN | Independent proxy for local economic activity/urbanisation intensity; linked to service availability and waste generation patterns. |
| Land cover / livelihoods context | Forest plantations; rangelands; irrigated and rainfed cropping | Forest_pla; Rangelands; Crop_irrig; Crop_rainf | Captures surrounding land-use context, settlement–environment interface, and livelihood systems that shape waste handling behaviours and service coverage. |
| Social vulnerability / household structure | Disability prevalence; single women; child-headed households; orphans | Disability; Single_wom; Child_head; Orphans_to | Vulnerability/household structure may constrain ability to access services, transport waste, or adopt safer practices. |
| Governance / civic engagement (proxy) | Voter turnout | Voter_turn | Proxy indicator of civic participation and potential service accountability/engagement (context-dependent). |
| Geography (classification) | Rural/urban classification | RURAL_URBA | Captures systematic differences in service coverage, enforcement, infrastructure density, and settlement form. |
Table 2.
Summary of evaluation metrics used to assess model performance across waste disposal pathways.
Table 2.
Summary of evaluation metrics used to assess model performance across waste disposal pathways.
| Metric | Output Type Evaluated | Relevance for This Study |
| Accuracy | Discrete ordinal class (predicted bin/state) | Provides an intuitive measure of correct classification for each waste disposal pathway after discretisation |
| Confusion matrix (ordinal) | Discrete ordinal class | Enables assessment of whether misclassifications occur between adjacent (similar) categories rather than extreme classes |
| RMSE | Continuous expected value (posterior mean) | Evaluates how well the probabilistic model reproduces EA-level intensity of each disposal behaviour |
| MAE | Continuous expected value (posterior mean) | |
| R² | Continuous expected value (posterior mean) | Indicates how much spatial variability in each disposal pathway is explained by the model |
| Calibration curve | Posterior probabilities (including P(high)) | Critical for policy use of probability thresholds (e.g., identifying high-risk EAs) |
| Brier score* | Posterior probabilities | Proper scoring rule for evaluating probability forecasts, complementing calibration plots |
| Log loss / cross-entropy* | Posterior probabilities | Penalises overconfident incorrect predictions; supports comparison of probabilistic models |
Notes: Expected value refers to the probability-weighted mean of ordinal bins derived from the posterior distribution for each enumeration area; P(high) denotes the posterior probability of the highest-risk or highest-dominance disposal category for a given pathway; Metrics marked with * were used where probabilistic outputs were directly evaluated and are recommended best practice for uncertainty-aware sustainability modelling.
Table 3.
Summary model performance statistics (RMSE, MAE, ordinal accuracy, and calibration diagnostics) for all six waste disposal pathways.
Table 3.
Summary model performance statistics (RMSE, MAE, ordinal accuracy, and calibration diagnostics) for all six waste disposal pathways.
| Target Variable | Accuracy | R2 | RMSE | MAE | Brier score | Log loss |
| Regularly Collected | 0.865 | 0.88 | 0.231 | 0.190 | 0.221 | 0.752 |
| Irregularly Collected | 0.963 | 0.74 | 0.089 | 0.045 | 0.017 | 1.995 |
| Public/Communal Pit | 0.957 | 0.79 | 0.103 | 0.057 | 0.101 | 0.404 |
| Burning | 0.503 | 0.85 | 0.275 | 0.234 | 0.776 | 1.995 |
| Backyard Pit | 0.443 | 0.82 | 0.315 | 0.264 | 0.770 | 2.180 |
| Illegal Dumping | 0.961 | 0.76 | 0.069 | 0.032 | 0.071 | 0.328 |
Disclaimer/Publisher’s Note: The statements, opinions and data contained in all publications are solely those of the individual author(s) and contributor(s) and not of MDPI and/or the editor(s). MDPI and/or the editor(s) disclaim responsibility for any injury to people or property resulting from any ideas, methods, instructions or products referred to in the content. |
© 2026 by the author. Licensee MDPI, Basel, Switzerland. This article is an open access article distributed under the terms and conditions of the Creative Commons Attribution (CC BY) license.
Copyright: This open access article is published under a Creative Commons CC BY 4.0 license, which permit the free download, distribution, and reuse, provided that the author and preprint are cited in any reuse.


