Submitted:
09 February 2026
Posted:
09 February 2026
You are already at the latest version
Abstract
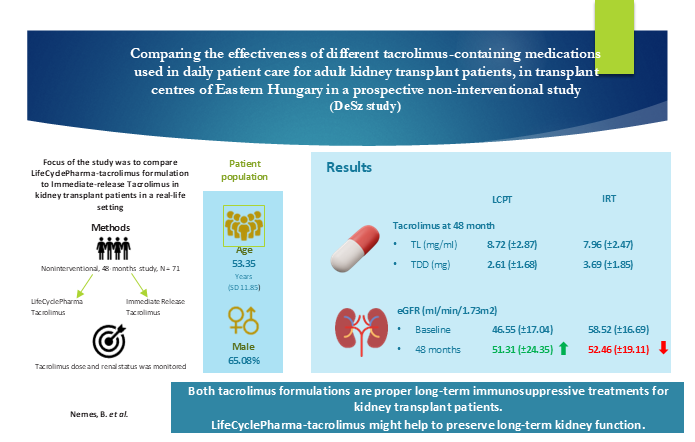
Background and hypothesis: Because of the narrow therapeutic range and inter-individual differences in tacrolimus trough levels, the total daily dose and their ratio are commonly used to determine proper tacrolimus. In our study, the Life-Cycle Pharma-tacrolimus formulation was compared to Immediate-release Tacrolimus in a real-life setting.
Methods: This longitudinal observational study included kidney transplant patients at two Hungarian university clinic’s study centers. Sixty-three (63) patients completed the study and were included in the statistical analysis. They received either Life-Cycle Pharma-tacrolimus (n=40) or Immediate-release Tacrolimus (n=23) maintenance therapy as the two study arms, all combined with everolimus or mycophenolic acid and corticosteroid. Patients were enrolled in the study 4-6 weeks after transplantation and were observed for 48 months.
Tacrolimus trough level, total daily dose and their ratio were recorded at each of the seven follow-up visits, during the 48 months study period. Epidemiology data, patient characteristics, blood parameters (including eGFR, de novo DSA, CMV and BK virus incidence), and the acute rejection episodes were monitored.
Results: Mean age at enrolment was 53.35 years, males n=41 (65.08%). A steady, therapeutic maintenance trough level was achieved in both study arms. Dosing of Life-Cycle Pharma-tacrolimus required a 30% lower total daily dose compared to Immediate-release Tacrolimus to achieve the therapeutic trough level. A slow deterioration of eGFR was observed (mean decrease of 6.06 mL/min/1.73m2 over 4 years) in the Immediate-release Tacrolimus arm in contrast to the Life-Cycle Pharma tacrolimus arm, where the eGFR increased (by 4.76 mL/min/1.73m2) in 4 years period.
Conclusions: Both formulations were both proper long-term immunosuppressive treatments for kidney transplant patients, maintaining a stable trough level. Life-Cycle Pharma tacrolimus might serve as a valuable choice in avoiding drug-specific side effects, reducing calcineurin-induced nephrotoxicity.
Keywords:
eGFR
; immunosuppression
; kidney transplantation
; LCPT
; tacrolimus
Introduction
For kidney transplant (KT) patients the prevention of graft rejection is essential, therefore they receive continuous immunosuppressive therapy. The goal of immunosuppressive treatment is to maximize the function and longevity of the transplanted organ while ensuring that the side effects of immunosuppression remain minimal, thereby enabling the patient to maintain a good quality of life.
Current immunosuppression treatment regimens are based on the active substance tacrolimus, which belongs to the group of calcineurin inhibitors and serves as the basis of immunosuppression both during induction and maintenance treatment [1,2,3]. Tacrolimus is most often combined with mycophenolic acid (MPA) or a mammalian target of rapamycin (mTOR) kinase inhibitor and corticosteroids (CS).
Several formulations of tacrolimus have been released to improve the bioavailability, patient adherence, and compliance, as well as the overall effectiveness and safety of the active ingredient. Currently, three formulations are available: immediate-release tacrolimus capsules taken twice-daily (IRT: Prograf, Astellas Pharma); a once-daily MeltDose tablet formulation (Life-Cycle Pharma Tacrolimus - LCPT; Envarsus, Chiesi Farmaceutici SpA) and a once-daily extended-release tacrolimus capsule (ERT; Advagraf, Astellas Pharma).
Tacrolimus levels below the lower serum threshold may trigger organ-rejection processes, with imminent graft loss. Over-exposition with levels beyond the upper serum threshold leads to an increased risk of opportunistic infections, malignancies, nephrotoxicity, tremor, diabetes, hypertension, and other metabolic side effects [4].
Tacrolimus has a narrow therapeutic range and shows a high degree of both inter- and intra-personal variability in terms of absorption and metabolism among the patients [4,5,6]. The total daily dose (TDD) is not considered to be a reliable predictive factor of drug levels [5,7]. The regularly monitored trough level (TL) of tacrolimus itself is accepted as a valid measure of target tacrolimus levels and is now the gold standard to monitor the effectiveness of tacrolimus maintenance therapy by keeping the serum levels in the range of 5-10 ng/ml during the first year after transplantation, assuming that the combination therapies are MPA and CS after antiCD25 monoclonal antibody induction [5,8,9].
The ratio of TL/TDD (CD) was reported to be a potential marker supporting the determination of the necessary daily dose. CD could serve as a potential marker for identifying fast-, slow- and intermediate-metabolizer patients [10,11]. In addition to being an indicator of the required dose, patients with low CD (fast metabolizers) were also shown to be associated with worse outcomes, such as reduced graft survival, faster eGFR decline, higher rejection rates, higher CNI nephrotoxicity and BK nephropathy [10,11,12].
Increased daily dose of tacrolimus may increase cardiovascular morbidity and mortality and may have a direct harmful effect on epithelial cells in the kidney resulting in calcineurin (CNI) toxicity, deterioration of eGFR, and possible graft loss, increased incidence of infections and cancer. Beyond the daily dose itself, higher peak level concentrations were suggested as the main factor in neurotoxicity as well as renal histology defects [12]. CNIs, including tacrolimus, are also known for resulting and increasing tremor, occurring in 34-54% of patients taking tacrolimus, imposing a considerable burden on their quality of life. Reducing daily dose for the prevention of tremor is a major challenge, as an excessive reduction may increase the risk of graft rejection. Several tacrolimus-sparing methods have been investigated to decrease the toxic effects of tacrolimus, and at the same time increase patient survival. Due to its better bioavailability, LCPT could also be a choice reducing the burden of tacrolimus toxicity for patients [12,13,14,15].
Mycophenolic acid as the standard immunosuppressant compound and the second generation mTORi everolimus (EVE) has been proven also to be a promising combination therapy to reduce the dose of tacrolimus. Corticosteroids are generally used as additional options to complete the immunosuppressive protocol [16,17,18].
Based on the above considerations, a non-interventional, observational study was designed to assess the efficacy and safety profile of the currently used tacrolimus-containing medications in adult KT patients, as well as to measure the adherence of the patients in a real-life setting.
Materials and Methods
Study Design and Protocol
This non-interventional study was conducted in two Hungarian transplant centres (Medical University Clinics of Debrecen and Szeged). The first patient-first visit (FPFV) was in 3rd May 2018, and the last patient’s last visit (LPLV) was conducted in 31st October 2023. The study was a longitudinal real-world study of adult patients taking tacrolimus-containing medications.
Patients were enrolled 4-6 weeks after KT. After the baseline visit, six further visits were performed as part of standard-of-care, during 48 months follow-up period, at 3, 6, 12, 24, 36 and 48 months. Tacrolimus TL was determined at each visit and dosing was modified to ensure the TL was consistently within the 5-20 ng/ml standard reference range. At each visit the patients were assessed according to the standard of care, with the relevant parameters recorded.
The study design is depicted in Table 1.
Baseline visit contains: patient identification number, medical history, age, gender, height, education, family, education and social background, date of transplantation, type of transplantation, HLA A B C DR DQ mismatch number, baseline disease, comorbidities, dialysis time, dialysis type, induction therapy, tacrolimus therapy, applied tacrolimus total daily dose, further medication for immunosuppressive combination, DSA, systolic blood pressure, diastolic blood pressure, heart rate, weight, BMI, tacrolimus trough level, CD, panel reactive antibody, hematology and blood chemistry (including renal parameters: creatinine, urea and eGFR, ion levels, liver profile, lipid profile, CRP,) urinalysis, renal ultrasound according to local standard-of-care.
Complex visits: type of tacrolimus medication, applied tacrolimus total daily dose, further medication for immunosuppressive combination, DSA, systolic blood pressure, diastolic blood pressure, heart rate, weight, BMI, tacrolimus trough level, CD, hematology and blood chemistry (including renal parameters: creatinine, urea and eGFR, ion levels, liver profile, lipid profile, CRP,) urinalysis, renal ultrasound, mortality, graft loss, biopsy-proven acute rejection, lost to follow-up, infections (viral, bacterial), malignity, adverse events, BAASIS questionnaire according to local standard-of-care.
Simple visits: type of tacrolimus medication, applied tacrolimus total daily dose, further medication for immunosuppressive combination, systolic blood pressure, diastolic blood pressure, heart rate, weight, BMI, tacrolimus trough level, CD, hematology and blood chemistry (including renal parameters: creatinine, urea and eGFR, ion levels, CRP) urinalysis, renal ultrasound, mortality, graft loss, biopsy-proven acute rejection, lost to follow-up, infections (viral, bacterial), malignity, adverse events, BAASIS questionnaire according to local standard-of-care.
Study Population
Adult KT recipients receiving oral tacrolimus as part of the triple maintenance immunosuppressant treatment at the study centres were eligible to be enrolled.
Other inclusion criteria were as follows: signed informed consent, age above 18 years, without contraindication for taking any formulas of tacrolimus based on the summary of product characteristics (SmPC), KT 4 - 6 weeks before the enrolment, tacrolimus-based immunosuppressant therapy already initiated at least 4 weeks before enrolment, patients receiving tacrolimus medication as a part of triple combination for maintenance immunosuppressive therapy as per local protocol (MPA/mycophenolate mofetil (MMF)+ CS or mTOR inhibitor + corticosteroids given in combination with tacrolimus).
Exclusion criteria were: contraindications in the SmPC of the tacrolimus-containing medications; failure to achieve stable TL (5-20 mg/ml during the first three months after KT and 5-15 ng/ml after three months; infection within 2 weeks before enrolment, acute rejection, graft dysfunction or surgical complications influencing graft function (graft blood supply disorder, ureter anomaly), hospitalization due to drug reaction; taking medication/medications known to affect tacrolimus levels within one week before study enrolment, or the need for long-term use of such medication/medications; kidney transplanted from an ABO incompatible donor; over 30 hours of cold-ischaemic time before implantation of the donor organ; hypersensitivity to tacrolimus; known pregnancy at enrolment.
Objectives
The objective of the study was to assess the efficacy of tacrolimus maintenance treatment and patient adherence.
TL, TDD, and change in eGFR were observed as the primary efficacy endpoints of the study.
Secondary efficacy endpoints included incidence of acute rejection, graft failure, vital parameters, routine laboratory parameters, and dose adjustments.
Safety parameters included incidence of viral and other infections and mortality.
Variables
Parameters were assessed as part of standard-of-care using the local equipment and procedures of the transplant centres.
Systolic and diastolic blood pressure and heart rate were measured by standard international protocols after 10 minutes of rest in the study centres’ outpatient office.
Tacrolimus TL was measured by standardized immunoassay.
Standard laboratory methods were applied for measuring routine parameters, such as blood count (fluorescent flow cytometry), kidney function and liver function parameters, lipid profile and CRP, metabolic parameters, and urine protein level (photometric and immunochemistry methods); while measurements of ion levels were completed by using of ion-selective electrodes.
Further routine laboratory parameters were determined by means of standardized assays. Fasting blood glucose, HBA1c, lipid profile (triglyceride, cholesterol, LDL-cholesterol, HDL-cholesterol), renal function parameters (eGFR, creatinine, CN – blood urea nitrogen). EGFR was determined by CKD EPI formulas suggested by KDIGO.
Patient adherence was assessed using the Basel Assessment of Adherence to Immunosuppressive Medication Scale (BAASIS) questionnaire. The BAASIS questionnaire is a validated measure of medication adherence, by the method of patient interview. [19] In the adherence visual analog scale (VAS) (of 0-100) a score above 80 was assessed as sufficiently adherent.
Addressing Potential Sources of Bias
The patients received standard maintenance immunosuppression as per current local protocols after KT. Patients were enrolled in the study after signing informed consent forms. Due to the observational nature of the study, treatment was guided by the physicians’ usual practice and not influenced in any way, fulfilling the criteria of a non-interventional study. In the real-life setting, randomization could not be implemented, therefore selection bias could not be ruled out and must be considered while interpreting the results.
There were no systemic differences in outcome measurements between groups and the protocol was planned considering the patient standard-of-care to avoid detection bias throughout the study.
Missing values were not replaced and were reported as missing.
Statistical Analysis
Descriptive analysis was performed for numerical variables: mean, standard deviation (SD), median minimum and maximum values; for categorical variables: number and percentage of patients were calculated. The random effect model was used to assess the estimation of the potential effects of different predictors on TDD, TL and CD ratios.
No official statistical hypothesis testing or power analysis had been performed beforehand. All derived statistical tests and calculated confidence intervals were evaluated in an exploratory method. The vital parameters were presented using descriptive statistical methods (n, mean, SD, median, range) in relation to the observed values. The laboratory test results were presented with descriptive statistical methods (n, mean, SD, median, IQR) in relation to the observed values.
P<0.05 was considered as statistically significant. During the statistical analysis the “R” version 4.3.1 evaluation program was applied in processing the data.
Mixed models were used to assess the estimation of the association of different predictors with TDD, TL, CD ratios and eGFR. The random intercept was the patient, among the explanatory variables were type of tacrolimus product, immunosuppressive combination product, gender, time from the start of the study, time between the transplantation and the start of the study, distance from the residential address, log-creatinine value, presence of diabetes and their paired interactions in the full model. We selected a simpler model by removing non-relevant interactions and variables.
Results
A total of 71 patients were enrolled in the study by the 2 study centres. Patient treatment was determined according to the local standard of care. A total of 40 patients (56.34%) were treated with LCPT; 23 (32.39%) were treated with IRT; and a further 8 patients (11.27%) were treated with ERT. Due to the low number, ERT patients were not included in the statistical analysis, therefore all numbers in further analyses reflect the LCPT and IRT arms only, including a total of 63 patients.
During the long-term follow-up of the study, the COVID-19 pandemic had a major impact on the care of immunosuppressed patients. Many outpatient visits were postponed in this period, and later patient care returned to the usual standards during the long-term follow-up. Nevertheless, these changes affected the recording of certain laboratory parameters, resulting in multiple missing data, making the interpretation of some secondary endpoints difficult.
Baseline Characteristics
63 patients were included in the statistical analysis (age 53.35 ± 11.85 years; males n=41 (65.08%)). 49 patients (77.78%) were enrolled at the University Clinic of Debrecen, and 14 patients (22.22%) at the University Clinic of Szeged.
Each patient enrolled in the study had already received IRT tacrolimus medication for at least 4 weeks, 40 patients (63.49%) were enrolled in the LCPT arm and 23 (36.51%) continued maintenance treatment in the IRT arm. Most of the patients received MPA or MMF in both arms as per the standard of care. 1 patient in the IRT arm received mTORi as a second immunosuppressant, while in the LCPT arm initially 2 patients received mTORi (the numbers varied during the study, the highest were 6 patients on mTORi at 36 months). There were no significant differences between the treatment arms in either type of mycophenolate combinations or its doses.
Demographic characteristics (age, gender, height) were similar in both treatment arms. For the majority of the patients (n=55; 87.3%) this was their first kidney transplantation, while there were a few cases (n=7; 11.11%) of second transplantation, and a single patient (1; 1.59%) received the third transplantation. The distribution was similar between study centres and treatment arms. Almost all patients (62; 98.41%) received a kidney from a cadaver donor, with a single case (1; 1.59%) of living donor transplant. Patient education levels ranged from primary school to university degree with a similar distribution in both arms; the same was observed according to employment conditions: during the observation period 30.16% of patients had full-time jobs, 25.4% of patients received social care due to disability status, other patients with part-time jobs. Patients with unemployed status and retired patients were enrolled also. There were no significant differences in the results, based on the patients’ inhabitation distance from transplant centres.
Among the clinical characteristics, there were no significant differences between treatment groups regarding diastolic blood pressure, pulse rate, weight, height, BMI, type of dialysis preceding KT, matching HLA antibodies, underlying diseases, incidence of delayed graft function after KT, clinical laboratory parameters (ALT, serum Na, K, Cl, glucose, HbA1c, BUN, GOT, GPT, GGT, bilirubin, ALP, LDH, triglyceride, cholesterol, white blood cell and platelet count, CRP, urine parameters including proteinuria and urine ACR ratio).
Baseline differences were observed in some parameters between the two arms. Systolic blood pressure was higher in the LCPT group (146.95 Hgmm, SD: 19.09) compared to the IRT arm (137.39 Hgmm, SD: 16.3) p = 0.0404. Time spent with dialysis was longer in the IRT arm (61.90 months SD: 35.35) versus the LCPT arm (34.92 months, SD: 25.44) p = 0.0042. Almost all patients participating in the study received induction therapy after transplantation (1 -1 patient in each arm were an exception from this rule). While in the LCPT arm 79.49% received anti-thymocyte globulin (ATG), and 20.51% basiliximab; in the IRT arm 50-50% of the patients received ATG and basiliximab.
Baseline creatinine and eGFR levels were significantly different between the two arms: mean creatinine level in the LCPT arm was 148.98 µmol/l (SD: 52.24), for IRT 119.22 µmol/l (SD: 30.34) p = 0.0058, while mean eGFR for LCPT arm was 46.55 ml/min/1.73m2 (SD: 17.04), for IRT arm 58.52 ml/min/1.73m2 (SD: 16.69) p = 0.0091. Haemoglobin and red blood cell count were higher in the IRT arm, with hemoglobin: 128.48 g/l, SD: 17.08, and red blood cell count: 4.29 T/l, SD: 0.72; LCPT arm hemoglobin: 116.38 g/l, SD: 12.54, red blood cell count: 3.89 T/l, SD: 0.45; p = 0.0053 and 0.024 respectively.
During Visit 1 tacrolimus TL values did not show significant differences between LCPT and IRT treatment groups (LCPT: 11.76 ng/ml, SD: 4.69; IRT: 10.22 ng/ml, SD: 3.22; p = 0.1299); while TDD was significantly lower in the LCPT arm (LCPT: 6.24 mg, SD: 2.83 ; IRT: 8.96 mg, SD: 3.4; p = 0.0024) resulting in a significantly higher CD in the LCPT arm (LCPT: 2.25 (ng/ml)/mg, SD: 1.18 ; IRT: 1.30 (ng/ml)/mg, SD: 0.63; p = 0.0001).
A summary of Baseline characteristics is depicted in Table 2.
Outcomes
A total of 63 patients started the study in the IRT and LCPT arms. During the 4-year follow-up period, 13 patients did not finish the study: 6 patients died; further 7 patients were lost to follow-up (11 in the LCPT arm and 2 in the IRT arm), and in the case of 11 patients the formulation of tacrolimus medication was changed during the study period (of 3 in the LCPT arm and of 8 in the IRT arm). After the maintenance therapy change, their data were not included in the statistical analysis. A total number of 39 patients (combined in the IRT and LCPT arms) finished the study according to protocol. Table 3. shows the numbers of patient disposition.
BMI
The body weight and BMI of the patients increased during the first year. After this period, it was stable in the LCPT arm, while continued to increase in the IRT arm. In the mixed model analysis BMI showed to be associated with type of tacrolimus treatment, time from start of study, time between transplantation and study start, and logarithm of blood creatinine.
Figure 1.
BMI mean and 95% CI during the study.
Renal function
An unplanned significant difference in renal function (eGFR and creatinine) was observed between the arms at baseline.
Baseline creatinine values in the LCPT arm were: 148.97 µmol/l, SD: 52.24; IRT: 119.22 µmol/l, SD: 30.34, p = 0.0058. During the follow-up visits creatinine values showed a quick decrease, but this trend changed after kidney function restoration at 6 months for the IRT arm, while it proved to be more stable in the case of LCPT patients, as shown in Figure 2.
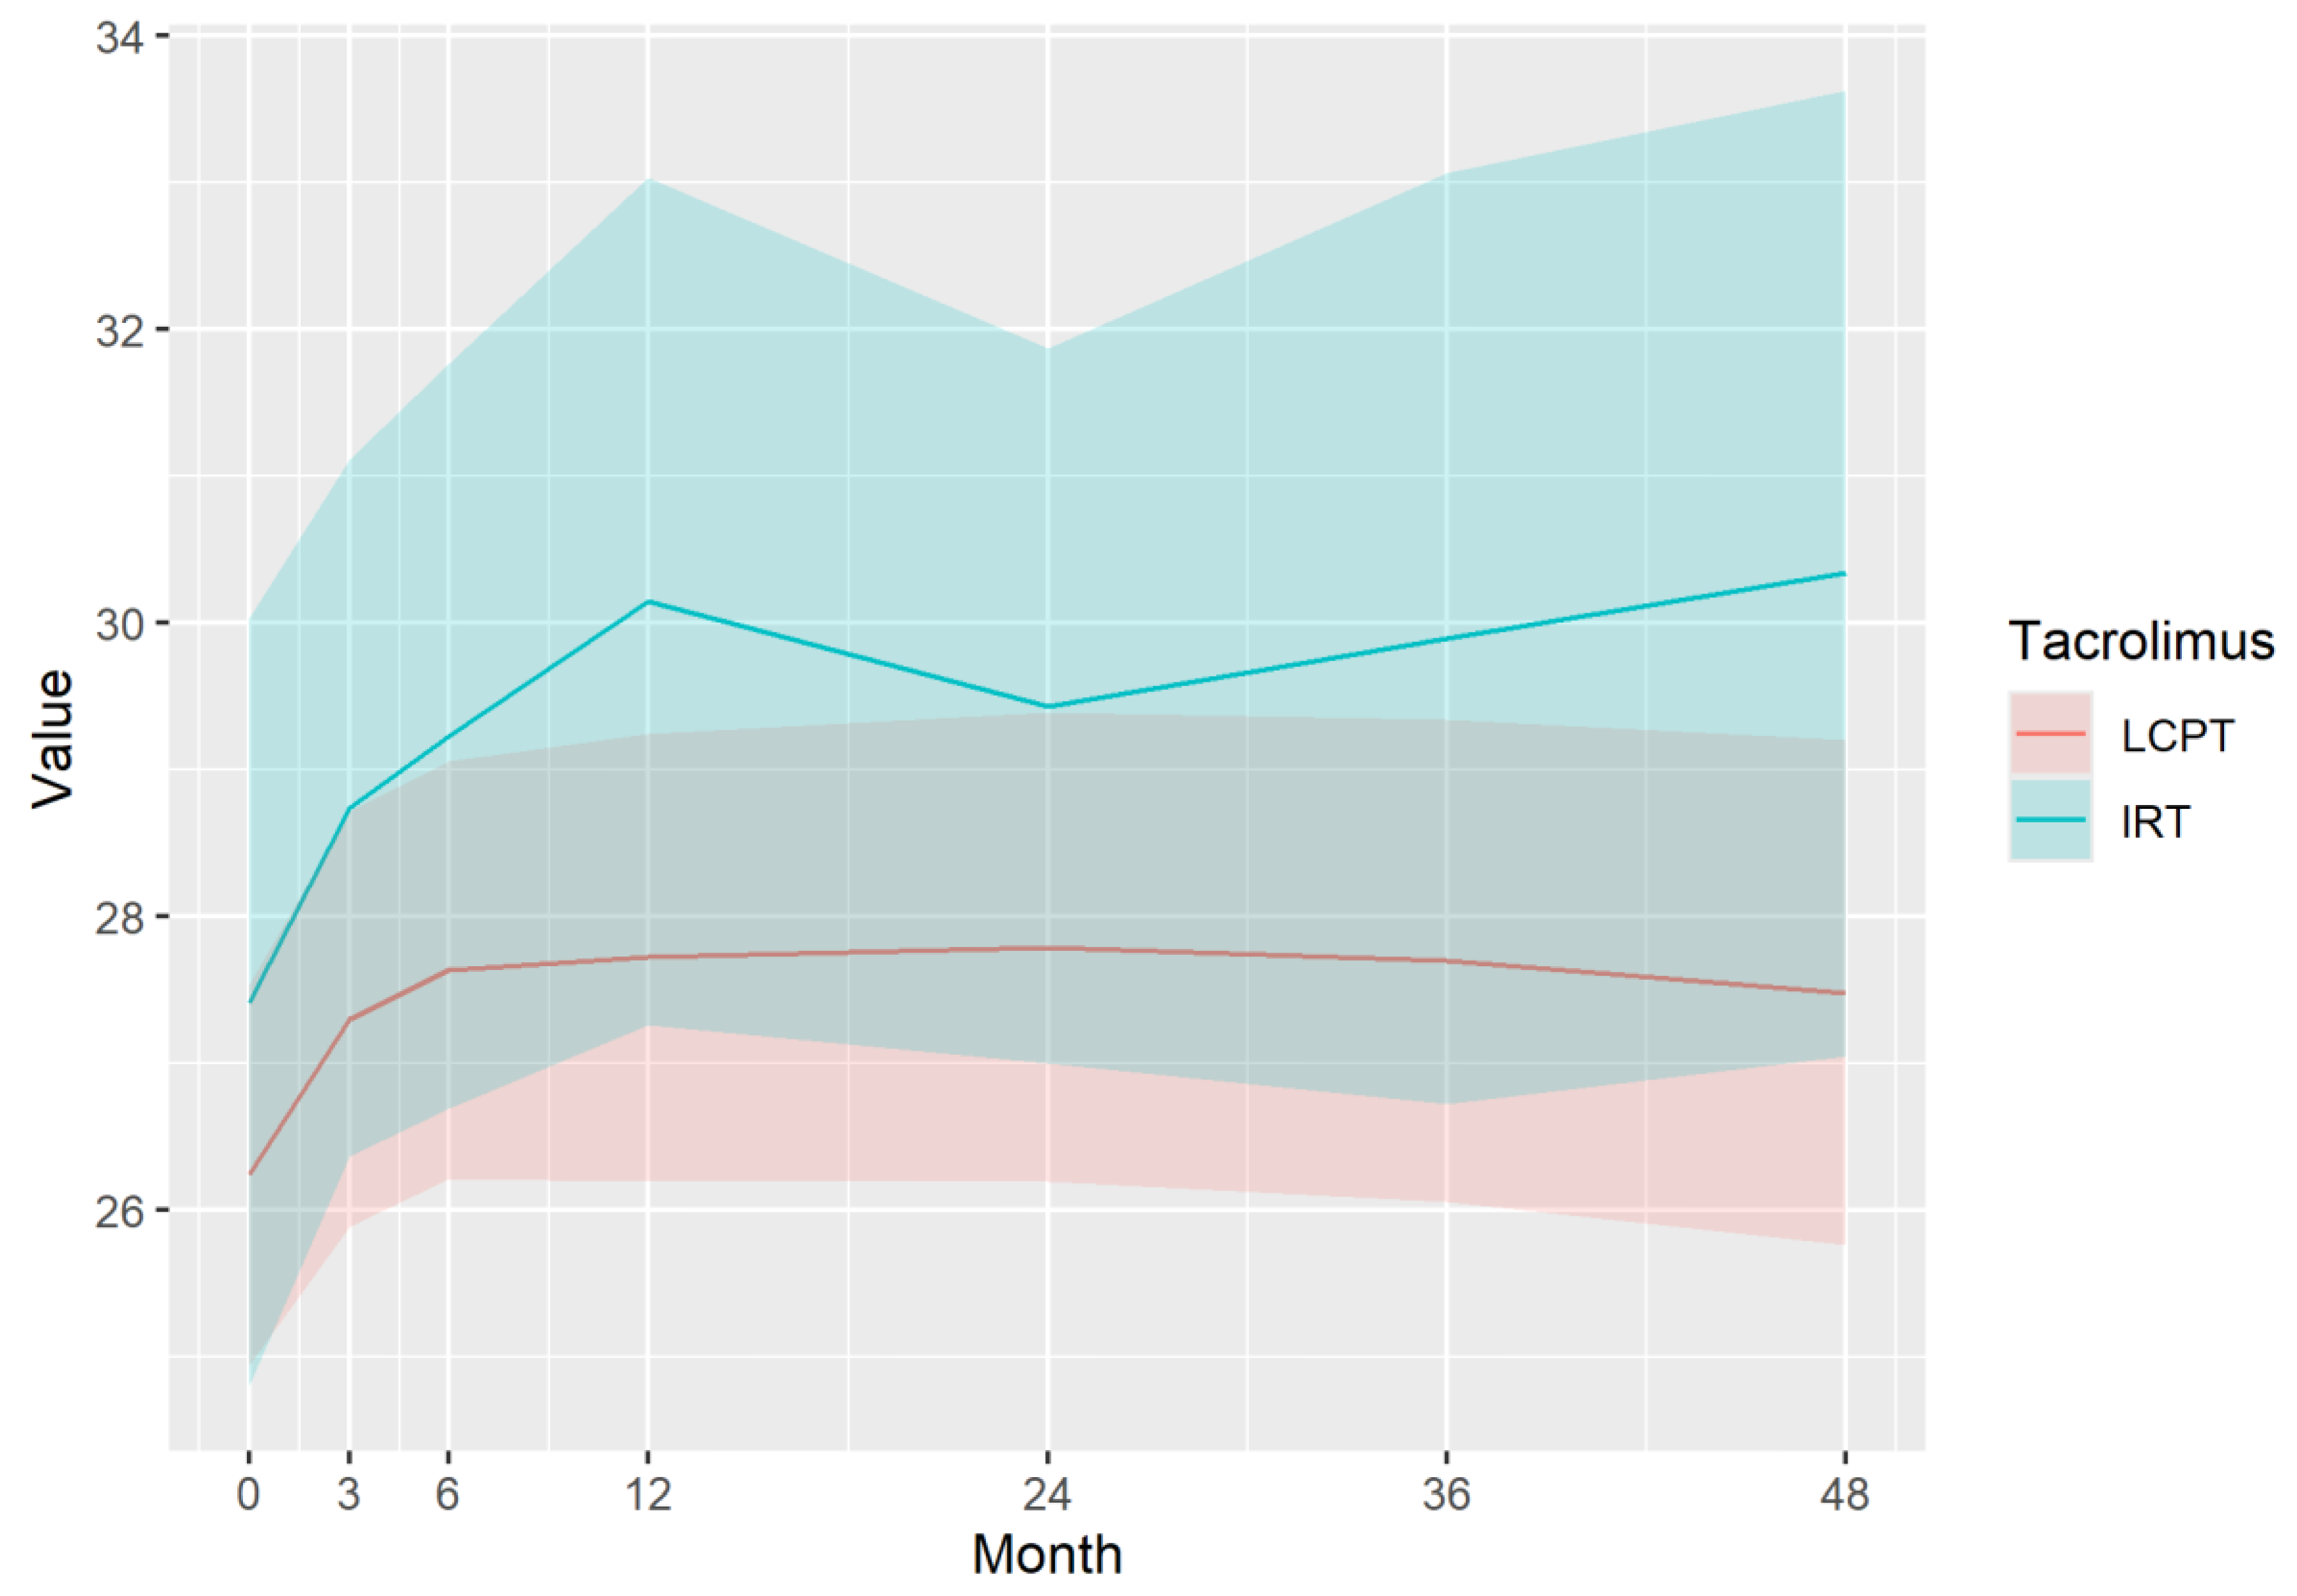
eGFR baseline values in the LCPT arm were: 46.55 ml/min/1.73m2, SD: 17.04; in the IRT arm: 58.52 ml/min/1.73m2, SD: 16.69, p = 0.0091. During the follow-up period eGFR increased in the LCPT arm and decreased in the IRT arm, resulting in almost identical eGFR values at the end of the follow-up (LCPT: 51.31, SD: 24.35; IRT: 52.46, SD: 19.11), as shown in Figure 3.
The mixed-model analysis showed that eGFR correlated with time from the start of the study and the type of tacrolimus maintenance treatment. eGFR = 46.99 + 10.9*δ(IRT) + 0.07*month − 0.14*month*δ(IRT). With LCPT the model showed a yearly 0.84 increase, while a similar decrease for the IRT arm.
Immunosuppressive Profile of Tacrolimus
Tacrolimus Total Daily Dose
Tacrolimus TDD was higher in the IRT group (8.96 mg, SD: 3.40) at baseline, compared to the LCPT patients (6.24 mg, SD: 2.83) p = 0.0024. In both arms, the doses decreased steeply during the first 3-6 months and continued with a slower decrease during the follow-up period, while maintaining the initial difference. In the LCPT arm, daily dose reduction was observed during the first 3 months (with a 4.18 mg mean TDD), and a steady but slower decline was observed from this point to an average of 2.61 mg TDD at 48 months. In the IRT arm, the daily dose reduction continued (though to a smaller degree) until month 6 (with 5.93 mg at 3 months and 5.33 mg at 6 months). From this time point, a steady, slow decline was observed with a slight increase at the final visit. Figure 4
The mixed-model analysis of TDD over the time period showed that the logarithm of TDD was related to tacrolimus medication type and the logarithm of time since the start of the study, using the following equations: TDD = 5.42*(month + 1)−0.23 for LCPT and TDD = 5.42*(month + 1)−0.23 *1.41 for IRT.
Tacrolimus Trough Level
There was no significant difference in tacrolimus TL between the treatment groups at baseline. In both arms a lower TL was achieved in the long-term. IRT medication achieved a steady TL by Visits 3-4 and remained relatively stable from this point. LCPT medication achieved a steady TL earlier, already at Visit 2, and remained at this level during the follow-up period. (Figure 5) The mixed-model analysis showed that TL was in correlation with the type of tacrolimus therapy, the second combination immunosuppressant, gender, and creatinine (renal function). TL was slightly higher for LCPT and was reduced by a 0.68 multiplier if the patients received mTORi as a combination immunosuppressant.
CD: TL/TDD ratio
The CD ratio showed a significant difference at baseline: LCPT 2.25 (ng/ml)/mg, SD: 1.18; IRT 1.30 (ng/ml)/mg, SD: 0.63, p = 0.0001. In both arms, CD increased over time, and the difference between the arms was maintained during the follow-up period. Figure 6
By the mixed-model analysis, CD corresponded with the formulation of tacrolimus maintenance therapy and increased over time. CD = 2.54 − 0.96*δ(IRT) + 0.03*month − 0.62*δ (mTORi) has shown that CD increased yearly with an average of 0.36; was 0.96 times lower for IRT treatment and 0.62 times lower for patients receiving mTORi.
In Table 4. TDD, CD and eGFR data based on the results of mixed-model analysis is summarized by graphic visualization to show the tendency of change: the highest values are marked with green, and the lowest with yellow. Combination with mTORi was shown to have a significant effect on the CD ratio, the numbers in the table reflect the model for patients who did not receive mTORi.
Treatment adherence
Excellent adherence to immunosuppression medication was observed during the study based on the BAASIS questionnaire. Patient adherence scores on a 100 VAS scale in the LCPT arm were with a minimum of 90-99 and, maximum 100 (median 100) during the study; in the IRT arm with a minimum of 80-100, a maximum of 100 (median 100) during the study period. Patients in both arms were adherent in taking the anti-rejection medication based on the questionnaire.
Safety
During the long-term follow up 6 patients died in the LCPT arm (causes: cardiac arrest, pancreas tumor, stroke, Hepatitis B reactivation, 2 unknown reasons) all reported cases were on the LCPT arm and were assessed by the study investigators as not related to study medication. A total of 36 adverse events were reported, 30 in the LCPT arm, and 6 in the IRT arm. 27 of these were serious adverse events, 24 in the LCPT arm and 3 in the IRT arm. No serious unexpected drug reactions were reported during the study.
There was a total of 4 BK viremia cases in 3 patients in the LCPT arm, and 2 cases in 2 patients in the IRT arm. 1 case of CMV viremia was reported in the LCPT arm and 1 during IRT treatment. In the LCPT arm, 10 patients were reported with 12 cases of other infections, and 3 patients with total of 4 infections in the IRT arm.
Due to the low patient and event numbers, comparisons of infection events between the two treatment arms were not possible for statistical analysis.
The incidence of biopsy-proven acute rejection was 3 patients in the LCPT arm, and none was observed in the IRT arm. Due to the low case numbers, the difference is well within random variation.
No graft failure was recorded on either arm.
Due to the low case numbers, neither survival analysis, nor logistic regression was performed.
Discussion
This observational study provides valuable long-term real-world data on the treatment of KT patients. Baseline demographic data show that patients from a wide social background are eligible for kidney transplantation in Hungary due to the national social insurance policy.
There were differences observed in the baseline characteristics among the patients in the two arms: renal function (eGFR and creatinine), and haematology status (red blood cell count, haemoglobin, and blood pressure) showed significantly less favourable values in the LCPT group. According to the KDIGO guideline, ATG is preferred for patients with a higher immunology risk, which is reflected in the predominant ATG induction therapy in the LCPT arm [3]. On the other hand, time spent with dialysis was significantly less in the LCPT arm, which is a major factor influencing patient mortality and graft survival [20,21]. These initial differences indicate that selection bias could not be excluded and should be considered while interpreting the results.
The mortality rate in the LCPT arm was close to, but somewhat higher than 10%, as reported in literature among kidney transplant patients treated with tacrolimus [22]. Although mortality cases were only reported in the LCPT arm, due to the low case numbers the difference is well within random variation (p = 0.1645 with Fischer’s exact test). This could have also been influenced by the worse patient baseline characteristics observed in the LCPT arm.
LCPT and IRT both proved to be efficient for the long-term immunosuppressive maintenance treatment of KT patients. Both IRT and LCPT maintenance treatment achieved stable therapeutic TL after the first few months of the transplantation. In both arms beyond the initial months, TL remained stable throughout the 4-year follow-up period. TL was somewhat lower in the LCPT arm (mean value at 7.75-8.72 ng/ml from 3 months) than in the IRT arm (mean value at 7.05-7.96 ng/ml from 6 months), but both were within the therapeutic range. The steady state of TL was achieved already at 3 months (4-5 months after the transplantation) for LCPT patients, while in the IRT arm, the steady state of TL was achieved at 6-12 months.
Due to its potential side effects, tacrolimus sparing is an important consideration during immunosuppressant maintenance treatment. Due to its better bioavailability, LCPT formulation is known to require lower TDD to achieve the same TL. Furthermore, the peak-to-peak fluctuations during 24 hours are 30% lower in the case of LCPT medication, compared to IRT or ERT formulations. LCPT also shows fewer fluctuations between trough and peak levels, in comparison to other formulations and a prolonged time to maximum concentration [23]. During our study the therapeutic TL levels required 30% lower TDD with LCPT which is in line with the SMPC. Additionally, LCPT combined with mTOR inhibitors is further supported to reduce the TDD and thereby can be an additional option for tacrolimus-sparing combination therapy (regardless of tacrolimus formulation).
The ratio of TL/TDD, or CD may be used for two separate assessments. It can be used as a value to characterize the patient’s tacrolimus metabolism, which shows significant interpatient differences. Tacrolimus metabolism is affected by age, sex, and BMI and others. It is mainly metabolized by cytochrome P450 enzymes (CYP3A4 and CYP3A5) and glycoprotein P. Patients expressing CYP3A5*1 are generally characterised as fast tacrolimus metabolizers, while slow metabolizers mostly express CYP3A5*3; with the metabolism rate usually decreasing with age in both groups [24]. For fast metabolizers significantly higher TDD is required to achieve the same TL, therefore these patients are characterized by a lower CD ratio. A lower CD ratio is associated with delayed graft function, higher rejection rate, more frequent and severe drug reactions, and mortality [10,11]. During the conduct of the study CYP 3A5 genotyping was not performed in routine patient care. Moreover, due to the low case numbers, no subgroups could have been formed based on patient CD values during statistical analysis. Therefore, this specific aspect could not be further assessed but can be an interesting area for further research.
Another use of the CD ratio is to characterize the treatment formula: the higher the CD ratio, the lower the tacrolimus burden for the patients. Consistent with the differences in TDD (with a very similar TL) it was observed that CD increased in both groups in the observation period and was higher in the LCPT group. CD ratio was further increased in patients receiving mTORi, underlining the importance of combination therapy as additional potential for tacrolimus sparing.
Renal toxicity is one of the major concerns of calcineurin inhibitors. Acute renal toxicity can be observed shortly after kidney transplantation and is potentially reversible with lower drug levels. Tacrolimus is associated with vasoconstriction of the afferent arterioles in the glomerulus of the kidney. Another reported harmful effect of tacrolimus is to cause progressive chronic, irreversible interstitial fibrosis and tubular atrophy, which contribute to the outcome of poor graft function [25].
During our study patients in the LCPT arm showed an improvement in renal function over time, despite starting from a lower baseline eGFR level, in contrast to the eGFR deterioration in the IRT arm. This result is in line with the observation of other studies. This may be due to the lower tacrolimus dose, resulting in less renal toxicity and a recovery of kidney function. Several possible explanations have been hypothesized to explain the nephron-protective properties of LCPT: lower TDD, and a more balanced PK profile resulting in a lower peak serum concentration (Cmax); the smaller Cmax/Cmin fluctuation ratio; and/or the reduced cumulative tacrolimus dose [14,26,27,28,29]. An important question for future research is which characteristics define or trigger tacrolimus-related adverse drug reactions.
This real-life longitudinal study provided valuable data on Hungary’s standard-of-care treatment for kidney transplant patients. Patients from different educational backgrounds (from primary school education to university level) and social background (unemployed, pensioners, disability pensioners, and full-time employees) were included in the 4-year observation after kidney transplant surgery.
Despite its results, the study has certain limitations, due to its observational nature, meaning only data available through standard-of-care were available. Lack of randomization resulted in an initial selection bias resulting from the real-life setting. Baseline renal and haematological differences indicate that despite no differences in the treatment guidelines, physicians tend to treat a more severe patient population with LCPT. Furthermore, the low case numbers and only two study centres contributed to lower power and the possible underestimation of the differences between the two groups. Low patient numbers also meant that subgroup analysis was not possible during the study. The effect of the COVID-19 pandemic situation should be mentioned among the limitations. (to minimize the risk of possible viral infection to the immunosuppressed patients during the visits, only the most important laboratory procedures have been performed, thus reducing the numbers of the recorded parameters in this period.
In conclusion, it was observed that both LCPT and IRT were effective for long-term immunosuppressive maintenance treatment in KT patients and maintained a stable TL. The use of LCPT required a 30% lower TDD compared to IRT to achieve the therapeutic TL. Furthermore, a slow deterioration of eGFR was observed (mean decrease of 6.06 ml/min/1.73m2 over 4 years) in the IRT arm, in contrast to the LCPT arm where the eGFR increased by a similar magnitude (4.76 ml/min/1.73m2). The results suggest that LCPT might serve as a valuable choice for tacrolimus sparing and reducing calcineurin-induced nephrotoxicity.
Supplementary Materials
The following supporting information can be downloaded at the website of this paper posted on Preprints.org. Detailed data on tacrolimus TDD, TL, CD ; creatinine and eGFR levels and the results for the Mixed-model analysis for these parameters are available as supplementary materials.
Funding
This study was supported by Chiesi Hungary Ltd., a local representative of the marketing authorization holder Chiesi Farmaceutici S.p.A. of LCPT (Envarsus). This study reflects real-life experiences represented as a prospective observational study.
Data Availability Statement
The data underlying this article are available in the article and in its online supplementary material.
Acknowledgements
We would like to thank all transplant nephrologists, professional workers and nurses having worked at the transplantation departments of the study centres for their help in carrying out the study.
Institutional Review Board Statement
The study was planned and conducted according to the principles of the Helsinki Declaration and the relevant Hungarian regulation for non-interventional studies (Decree of the Minister for Health 23/2002. (V. 9) EüM on medicinal research on humans’ subjects). The study was initiated after the receipt of the supporting opinion of the central ethical committee (ETT TUKEB - Hungarian Medical Research Council, Scientific, and Research Ethical Committee) as a special authority and by the protocol approved by the National Institute of Pharmacy and Nutrition (OGYÉI/57465-4/2017).
Informed Consent Statement and Data Protection
Personal data was processed confidentially during the study. Act CXII of 2011 on informational self-determination and freedom of information of Hungary and Act XLVII of 1997 on the processing and protection of health and related personal data of Hungary were followed during study planning and conduct. The investigator or designee recorded pseudonymized data in an electronic case report form (eCRF: Mythos CDMS by AdWare Research Ltd.). Patients were identified via unique patient numbers, and no patient identification data were recorded in the eCRF. The investigators were responsible for record-keeping and retention during and after the course of the study. Data was monitored by the study Sponsor to ensure the validity and reliability of reported data. Patients were informed about the main goals and procedures of the study including data processing. Each patient signed a written informed consent form before enrollment, and data collection started after the signed consent. Patient treatment and care followed the local standard of care and was not influenced by study participation.
Author’s contributions
Conceptualization, BN, ESz and ÁSz.; Formal Analysis, ZsAT.; Investigation, BN, Esz, OB, AD.; Data Curation, ÁSz.; Writing – Original Draft Preparation, DF.; Writing – Review & Editing, BN, ÁSz; Supervision, ÁSz; Project Administration, ÁSz; Funding Acquisition, ÁSz.
Conflict of Interest
Author Ász is an employee of the Chiesi Hungary Ltd (the sponsor of the study), and BN received a honorarium from Chiesi Hungary Ltd as a scientific consultant.
References
- Ekberg, H; Tedesco-Silva, H; Demirbas, A; et al. Reduced exposure to calcineurin inhibitors in renal transplantation. N Engl J Med 2007, 357, 2562–75. [Google Scholar] [CrossRef]
- Azzi, JR; Sayegh, MH; Mallat, SG. Calcineurin inhibitors: 40 years later, can’t live without. J Immunol 2013, 191, 5785–91. [Google Scholar] [CrossRef]
- Kidney Disease: Improving Global Outcomes (KDIGO) Transplant Work Group. KDIGO clinical practice guideline for the care of kidney transplant recipients. Am J Transplant. 2009, 9 Suppl 3, S1–155. [CrossRef] [PubMed]
- Ruiz, R; Kirk, AD. Long-Term Toxicity of Immunosuppressive Therapy. Transplantation of the Liver 2015, 1354–63, Epub 2015 Apr 3. [Google Scholar] [CrossRef] [PubMed Central]
- Wallemacq, P; Armstrong, VW; Brunet, M; Haufroid, V; Holt, DW; Johnston, A; Kuypers, D; Le Meur, Y; Marquet, P; Oellerich, M; Thervet, E; Toenshoff, B; Undre, N; Weber, LT; Westley, IS; Mourad, M. Opportunities to optimize tacrolimus therapy in solid organ transplantation: report of the European consensus conference. Ther Drug Monit 2009, 31(2), 139–52. [Google Scholar] [CrossRef] [PubMed]
- Sapir-Pichhadze, R; Wang, Y; Famure, O; Li, Y; Kim, SJ. Time-dependent variability in tacrolimus trough blood levels is a risk factor for late kidney transplant failure. Kidney Int. 2014, 85(6), 1404–11, Epub 2013 Dec 11. Erratum in: Kidney Int. 2016 Jan;89(1):248. doi: 10.1016/j.kint.2015.10.003. [Google Scholar] [CrossRef] [PubMed]
- Bentata, Y. Tacrolimus: 20 years of use in adult kidney transplantation. What we should know about its nephrotoxicity. Artif Organs 2020, 44(2), 140–152, Epub 2019 Sep 4. [Google Scholar] [CrossRef] [PubMed]
- Ekberg, H; Mamelok, RD; Pearson, TC; Vincenti, F; Tedesco-Silva, H; Daloze, P. The challenge of achieving target drug concentrations in clinical trials: experience from the Symphony study. Transplantation 2009, 87(9), 1360–6. [Google Scholar] [CrossRef] [PubMed]
- Grinyó, JM; Ekberg, H; Mamelok, RD; et al. The pharmacokinetics of mycophenolate mofetil in renal transplant recipients receiving standard-dose or low-dose cyclosporine, low-dose tacrolimus or low-dose sirolimus: the Symphony pharmacokinetic substudy. Nephrol Dial Transplant 2009, 24, 2269–76. [Google Scholar] [CrossRef]
- Nowicka, M; Górska, M; Nowicka, Z; Edyko, K; Edyko, P; Wiślicki, S; Zawiasa-Bryszewska, A; Strzelczyk, J; Matych, J; Kurnatowska, I. Tacrolimus: Influence of the Posttransplant Concentration/Dose Ratio on Kidney Graft Function in a Two-Year Follow-Up. Kidney Blood Press Res. 2019, 44(5), 1075–1088, Epub 2019 Sep 13. [Google Scholar] [CrossRef] [PubMed]
- Schütte-Nütgen, K; Thölking, G; Steinke, J; Pavenstädt, H; Schmidt, R; Suwelack, B; Reuter, S. Fast Tac Metabolizers at Risk ⁻ It is Time for a C/D Ratio Calculation. J Clin Med. 2019, 8(5), 587, Erratum in: J Clin Med. 2019 Nov 04;8(11):E1870. doi: 10.3390/jcm8111870. [Google Scholar] [CrossRef] [PubMed] [PubMed Central]
- Thölking, G; Schütte-Nütgen, K; Schmitz, J; et al. A Low Tacrolimus Concentration/Dose Ratio Increases the Risk for the Development of Acute Calcineurin Inhibitor-Induced Nephrotoxicity. J Clin Med 2019, 8. [Google Scholar] [CrossRef]
- Wiseman, A; Alhamad, T; Alloway, RR; et al. Use of LCP-Tacrolimus (LCPT) in Kidney Transplantation: A Delphi Consensus Survey of Expert Clinicians. Ann Transplant 2024, 29, e943498. [Google Scholar] [CrossRef] [PubMed]
- Bunnapradist, S; Ciechanowski, K; West-Thielke, P; et al. Conversion from twice-daily tacrolimus to once-daily extended-release tacrolimus (LCPT): the phase III randomized MELT trial. Am J Transplant 2013, 13, 760. [Google Scholar] [CrossRef]
- Thölking, G; Tosun-Koç, F; Jehn, U; et al. Improved Kidney Allograft Function after Early Conversion of Fast IR-Tac Metabolizers to LCP-Tac. J Clin Med 2022, 11. [Google Scholar] [CrossRef]
- Oberbauer, R; Bestard, O; Furian, L; et al. Optimization of tacrolimus in kidney transplantation: New pharmacokinetic perspectives. Transplant Rev (Orlando) 2020, 34, 100531. [Google Scholar] [CrossRef]
- Berger, SP; Sommerer, C; Witzke, O; et al. Two-year outcomes in de novo renal transplant recipients receiving everolimus-facilitated calcineurin inhibitor reduction regimen from the TRANSFORM study. Am J Transplant 2019, 19, 3018–34. [Google Scholar] [CrossRef]
- Nunes Ficher K, Dreige Y, Gessolo Lins PR, Nicolau Ferreira A, Toniato de Rezende Freschi J, Linhares K, Stopa Martins S, Custodio L, Cristelli M, Viana L, Wagner Santos D, de Marco R, Gerbase-DeLima M, Proença H, Aguiar W, Nakamura M, Rosso Felipe C, Medina Pestana J, Tedesco Silva H Jr. Long-term Efficacy and Safety of Everolimus Versus Mycophenolate in Kidney Transplant Recipients Receiving Tacrolimus. Transplantation. 2022 Feb 1;106(2):381-390. [CrossRef] [PubMed]
- Available online: https://baasis.nursing.unibas.ch/.
- Meier-Kriesche, HU; Kaplan, B. Waiting time on dialysis as the strongest modifiable risk factor for renal transplant outcomes: a paired donor kidney analysis. Transplantation 2002, 74(10), 1377–81. [Google Scholar] [CrossRef] [PubMed]
- Meier-Kriesche, HU.; Port, FK.; Ojo, AO.; Rudich, SM.; Hanson, JA.; Cibrik, DM.; Leichtman, AB.; Kaplan, B. Effect of waiting time on renal transplant outcome. Kidney Int. 2000, 58(3), 1311–7. [Google Scholar] [CrossRef] [PubMed]
- Loucaidou, M.1; McLean, A. G.; Cairns, T. D.H.; Griffith, M.; Hakim, N.; Palmer, A.; Papalois, V.; Van Tromp, J.; Loucaides, C.; Welsh, K. I.; Taube, D.. Five-year results of kidney transplantation under tacrolimus-based regimes: the persisting significance of vascular rejection. Transplantation 76(7):p 1120-1122, October 15, 2003. [CrossRef]
- Tremblay, S; Nigro, V; Weinberg, J; Woodle, ES; Alloway, RR. A Steady-State Head-to-Head Pharmacokinetic Comparison of All FK-506 (Tacrolimus) Formulations (ASTCOFF): An Open-Label, Prospective, Randomized, Two-Arm, Three-Period Crossover Study. Am J Transplant. 2017, 17(2), 432–442, Epub 2016 Aug 2. [Google Scholar] [CrossRef] [PubMed] [PubMed Central]
- Masuda, S; Inui, K. An up-to-date review on individualized dosage adjustment of calcineurin inhibitors in organ transplant patients. Pharmacol Ther 2006, 112(1), 184–98. [Google Scholar] [CrossRef] [PubMed]
- Naesens, M; Kuypers, DR; Sarwal, M. Calcineurin inhibitor nephrotoxicity. Clin J Am Soc Nephrol 2009, 4(2), 481–508. [Google Scholar] [CrossRef]
- von Einsiedel, J; Thölking, G; Wilms, C; Vorona, E; Bokemeyer, A; Schmidt, HH; Kabar, I; Hüsing-Kabar, A. Conversion from Standard-Release Tacrolimus to MeltDose® Tacrolimus (LCPT) Improves Renal Function after Liver Transplantation. J Clin Med. 2020, 9(6), 1654. [Google Scholar] [CrossRef] [PubMed] [PubMed Central]
- Baraldo, M. Meltdose Tacrolimus Pharmacokinetics. Transplant. Proc. 2016, 48, 420–423. [Google Scholar] [CrossRef]
- Bunnapradist, S.; Rostaing, L.; Alloway, R.R.; West-Thielke, P.; Denny, J.; Mulgaonkar, S.; Budde, K. LCPT once-daily extended-release tacrolimus tablets versus twice-daily capsules: A pooled analysis of two phase 3 trials in important de novo and stable kidney transplant recipient subgroups. Transpl. Int. 2016, 29, 603–611. [Google Scholar] [CrossRef] [PubMed]
- Suwelack, B; Bunnapradist, S; Meier-Kriesche, U; Stevens, DR; Procaccianti, C; Morganti, R; Budde, K. Effect of Concentration/Dose Ratio in De Novo Kidney Transplant Recipients Receiving LCP-Tacrolimus or Immediate-Release Tacrolimus: Post Hoc Analysis of a Phase 3 Clinical Trial. Ann Transplant. 2020, 25, e923278. [Google Scholar] [CrossRef] [PubMed] [PubMed Central]
Figure 2.
Creatinine mean value and 95% CI during the study.
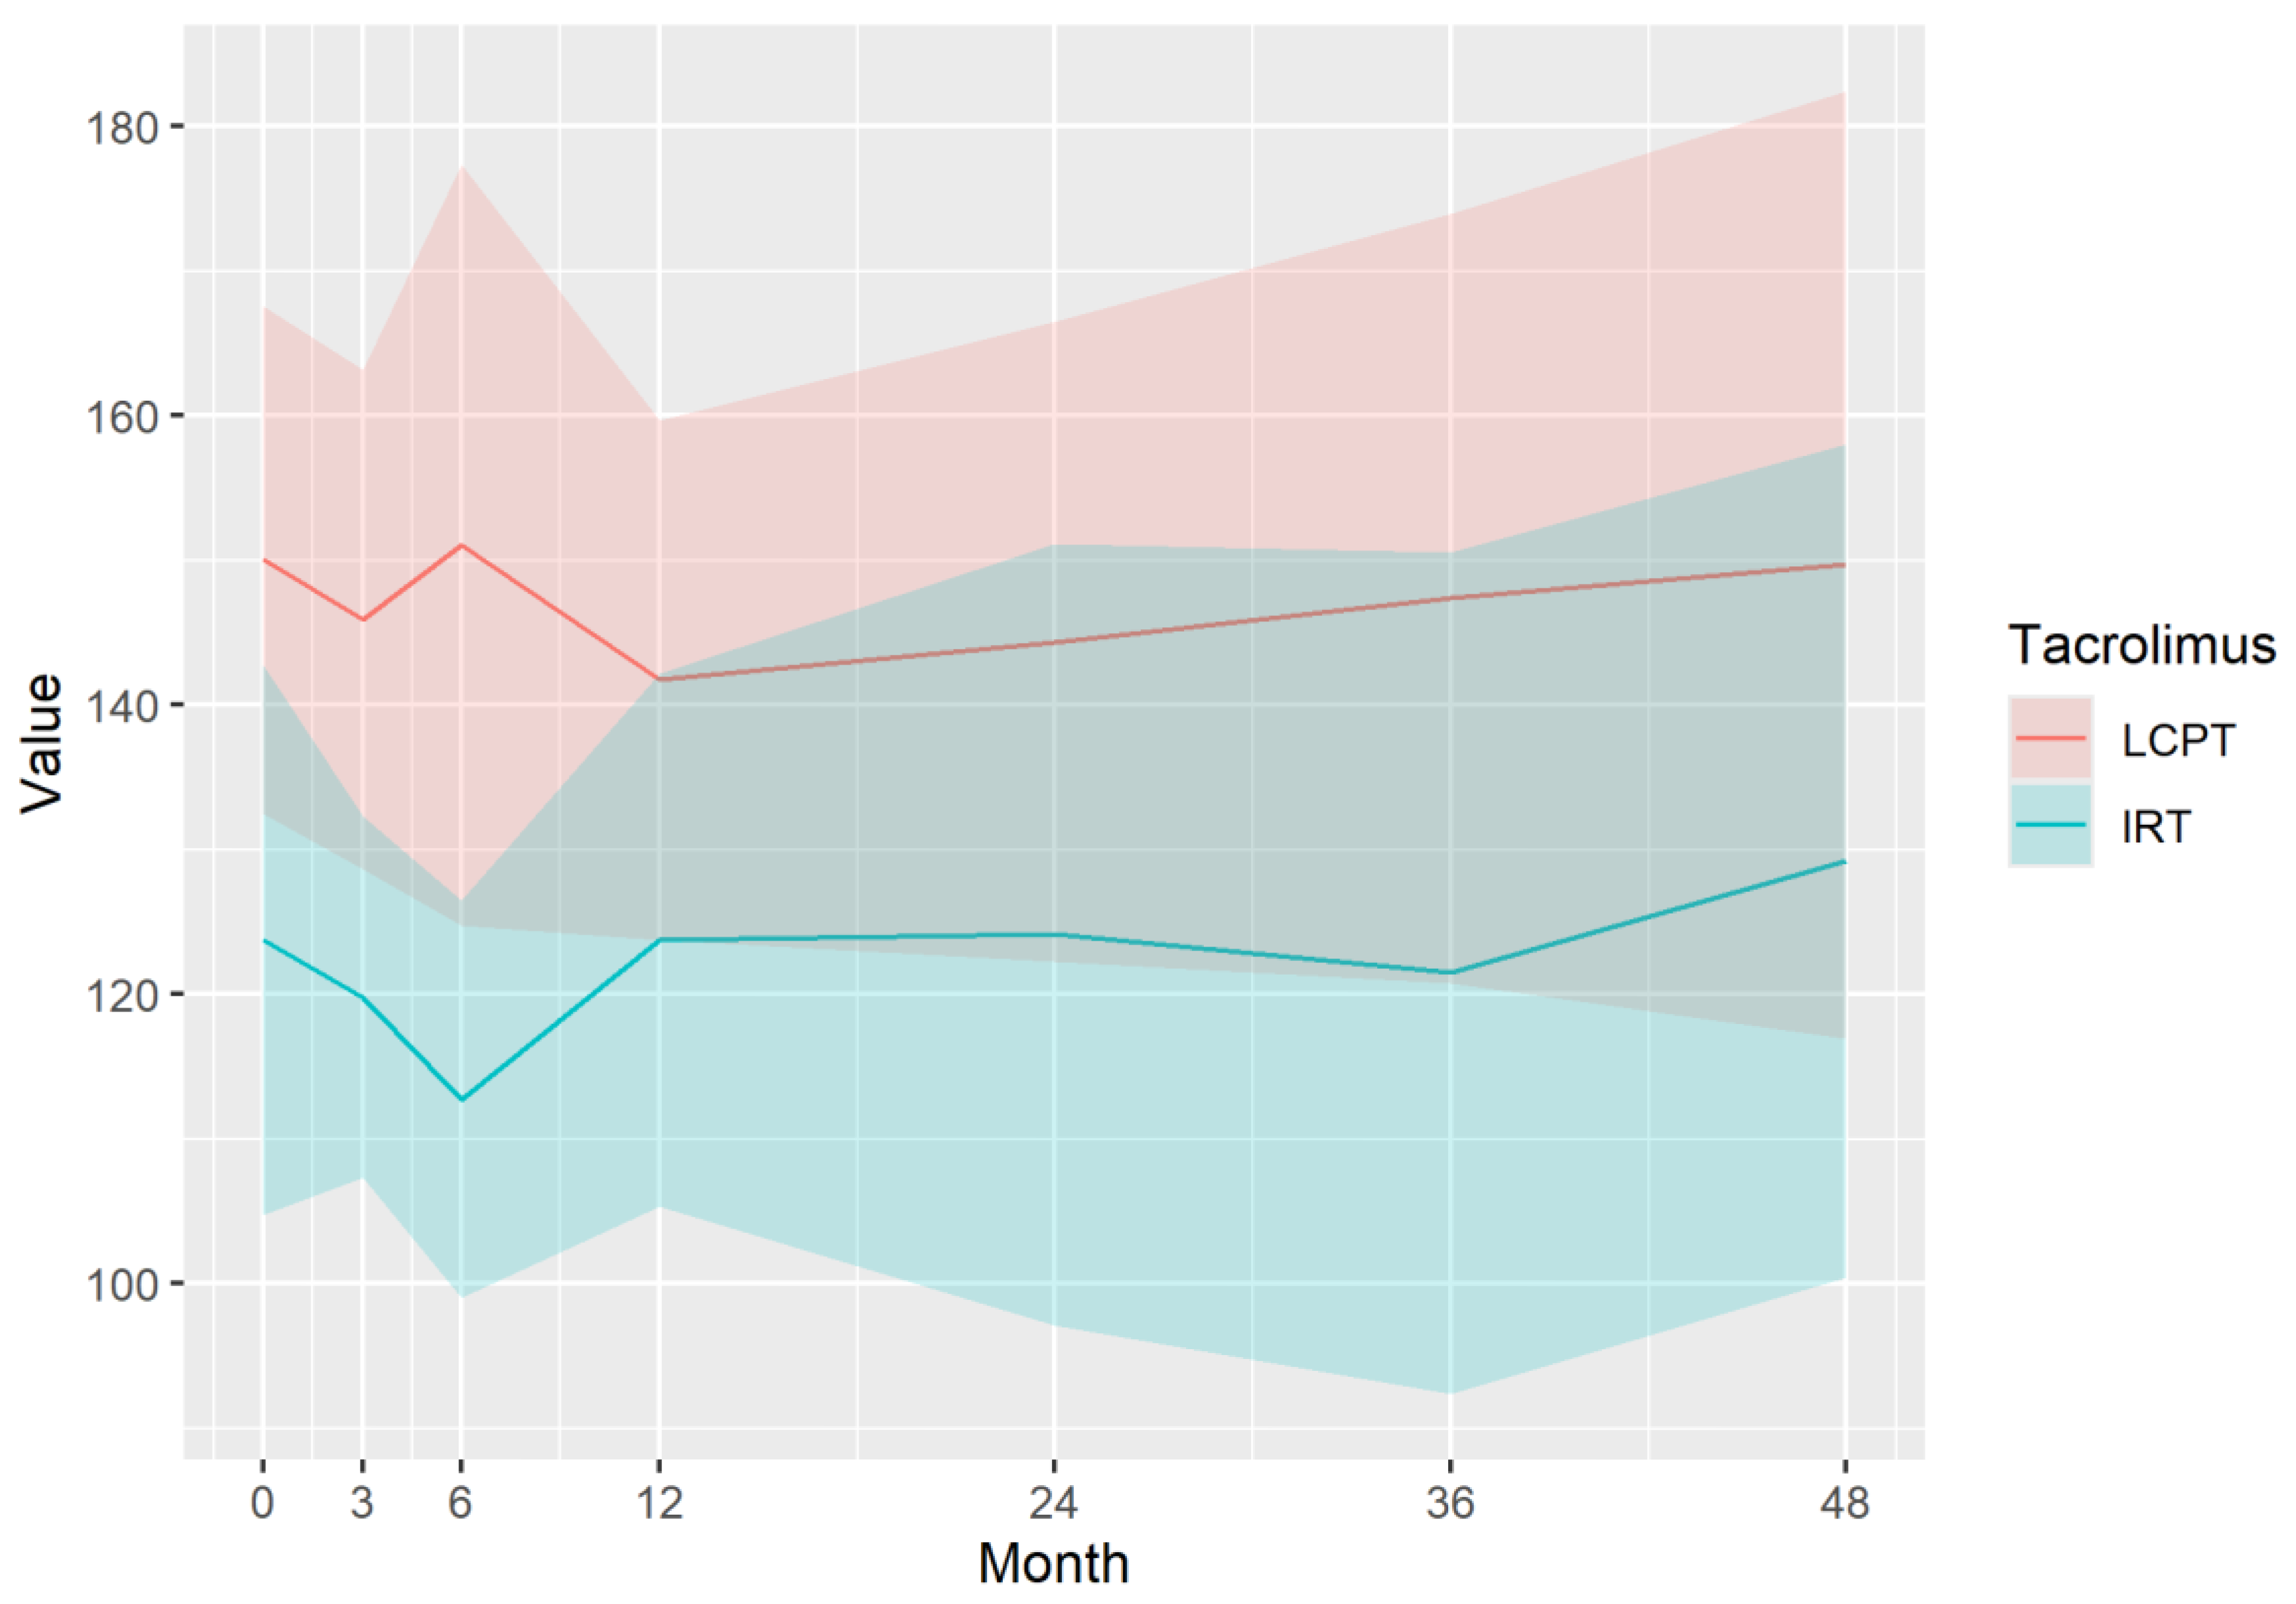
Figure 3.
eGFR mean value and 95% CI during the study.
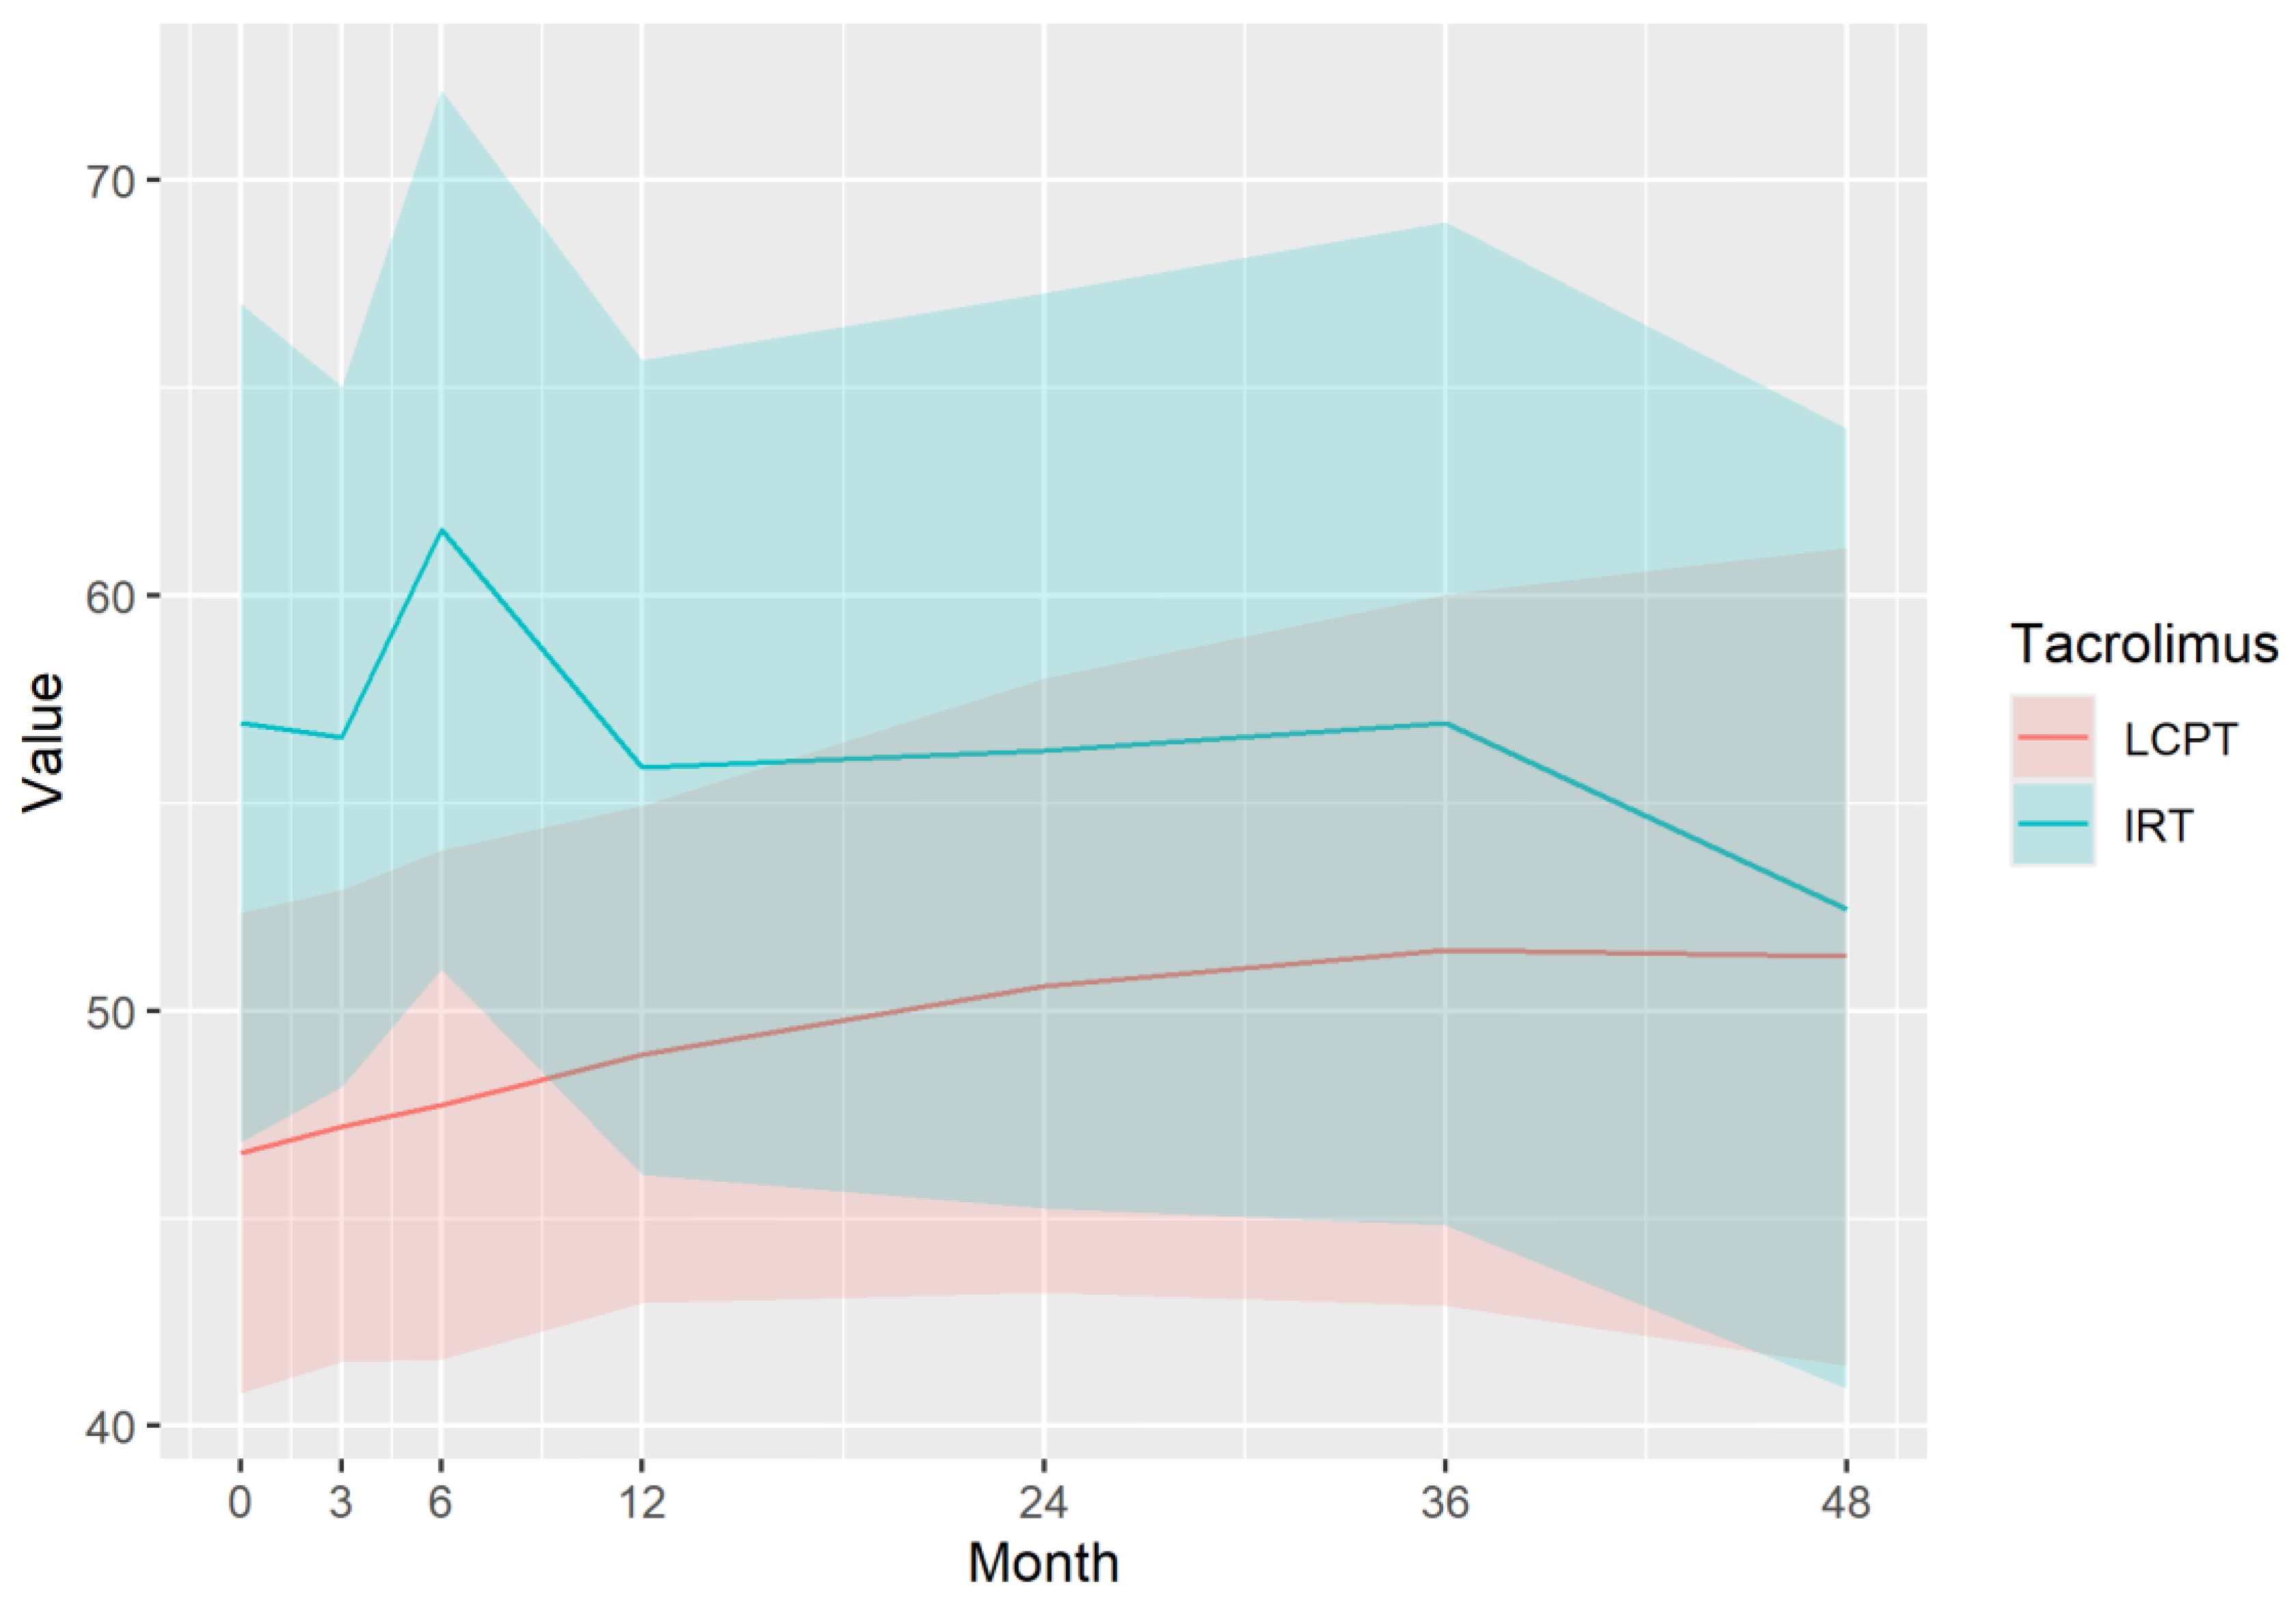
Figure 4.
Tacrolimus TDD mean and 95% CI during the study.
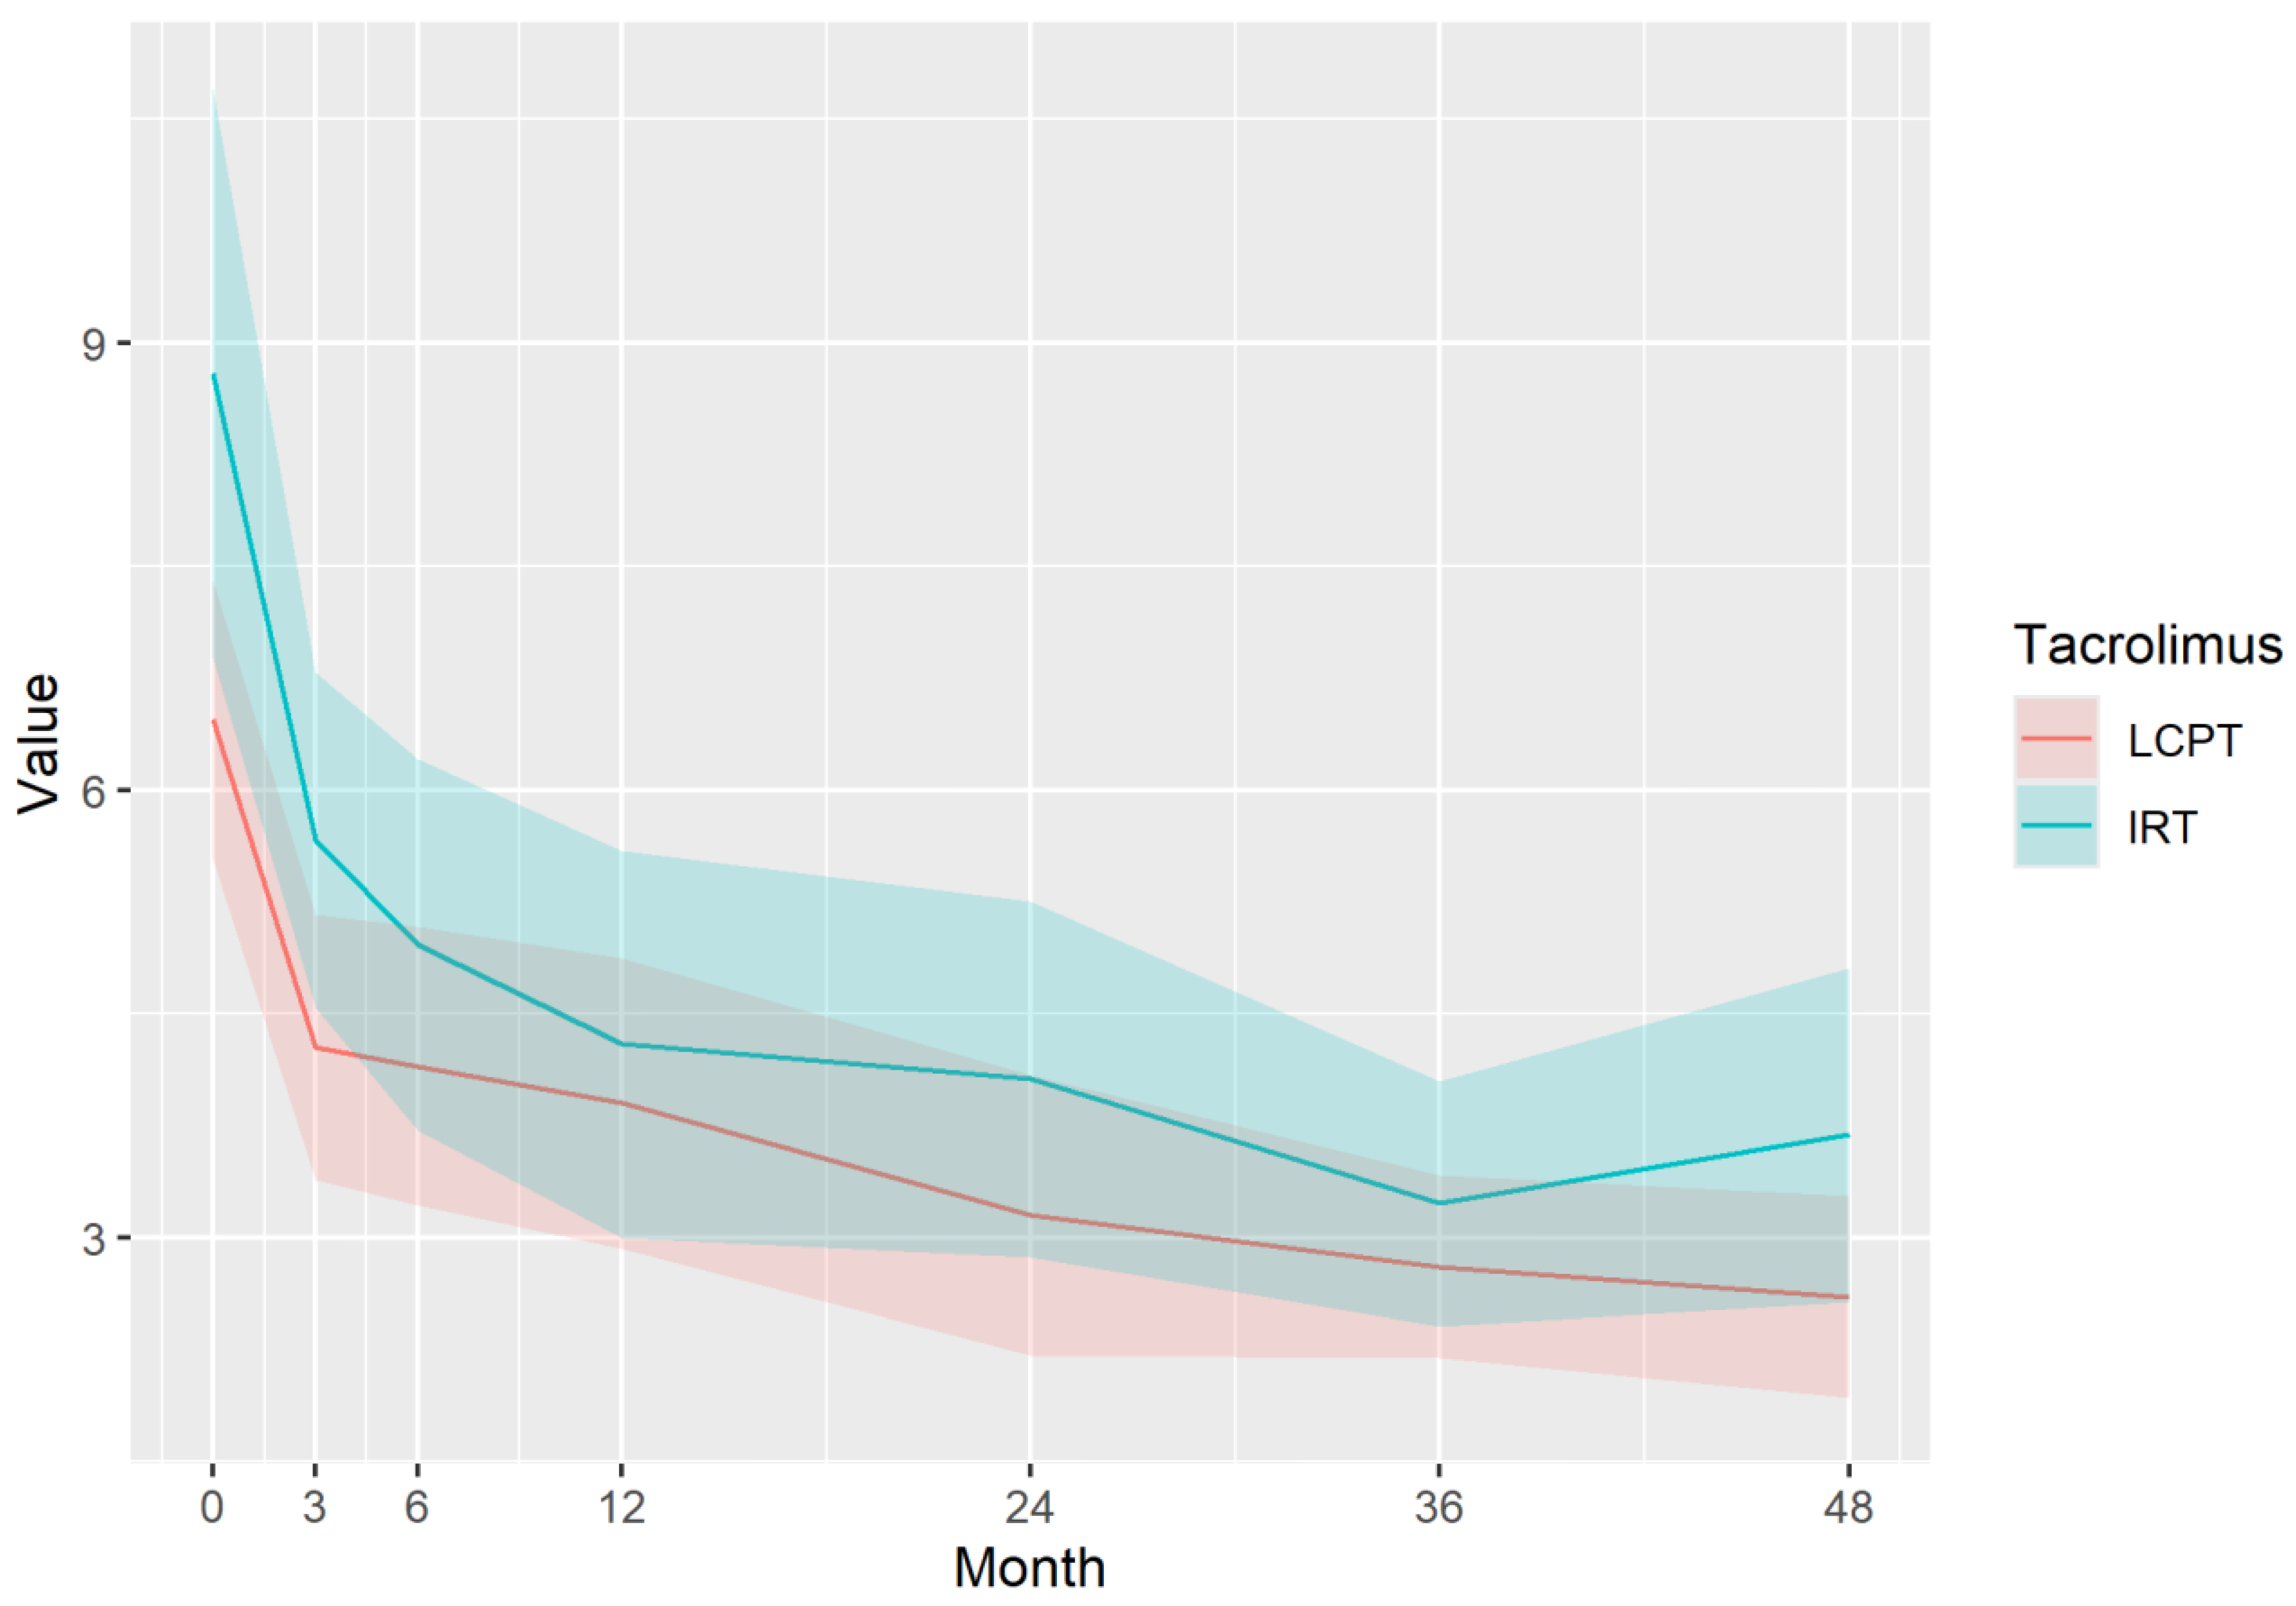
Figure 5.
Tacrolimus TL mean and 95% CI during the study.
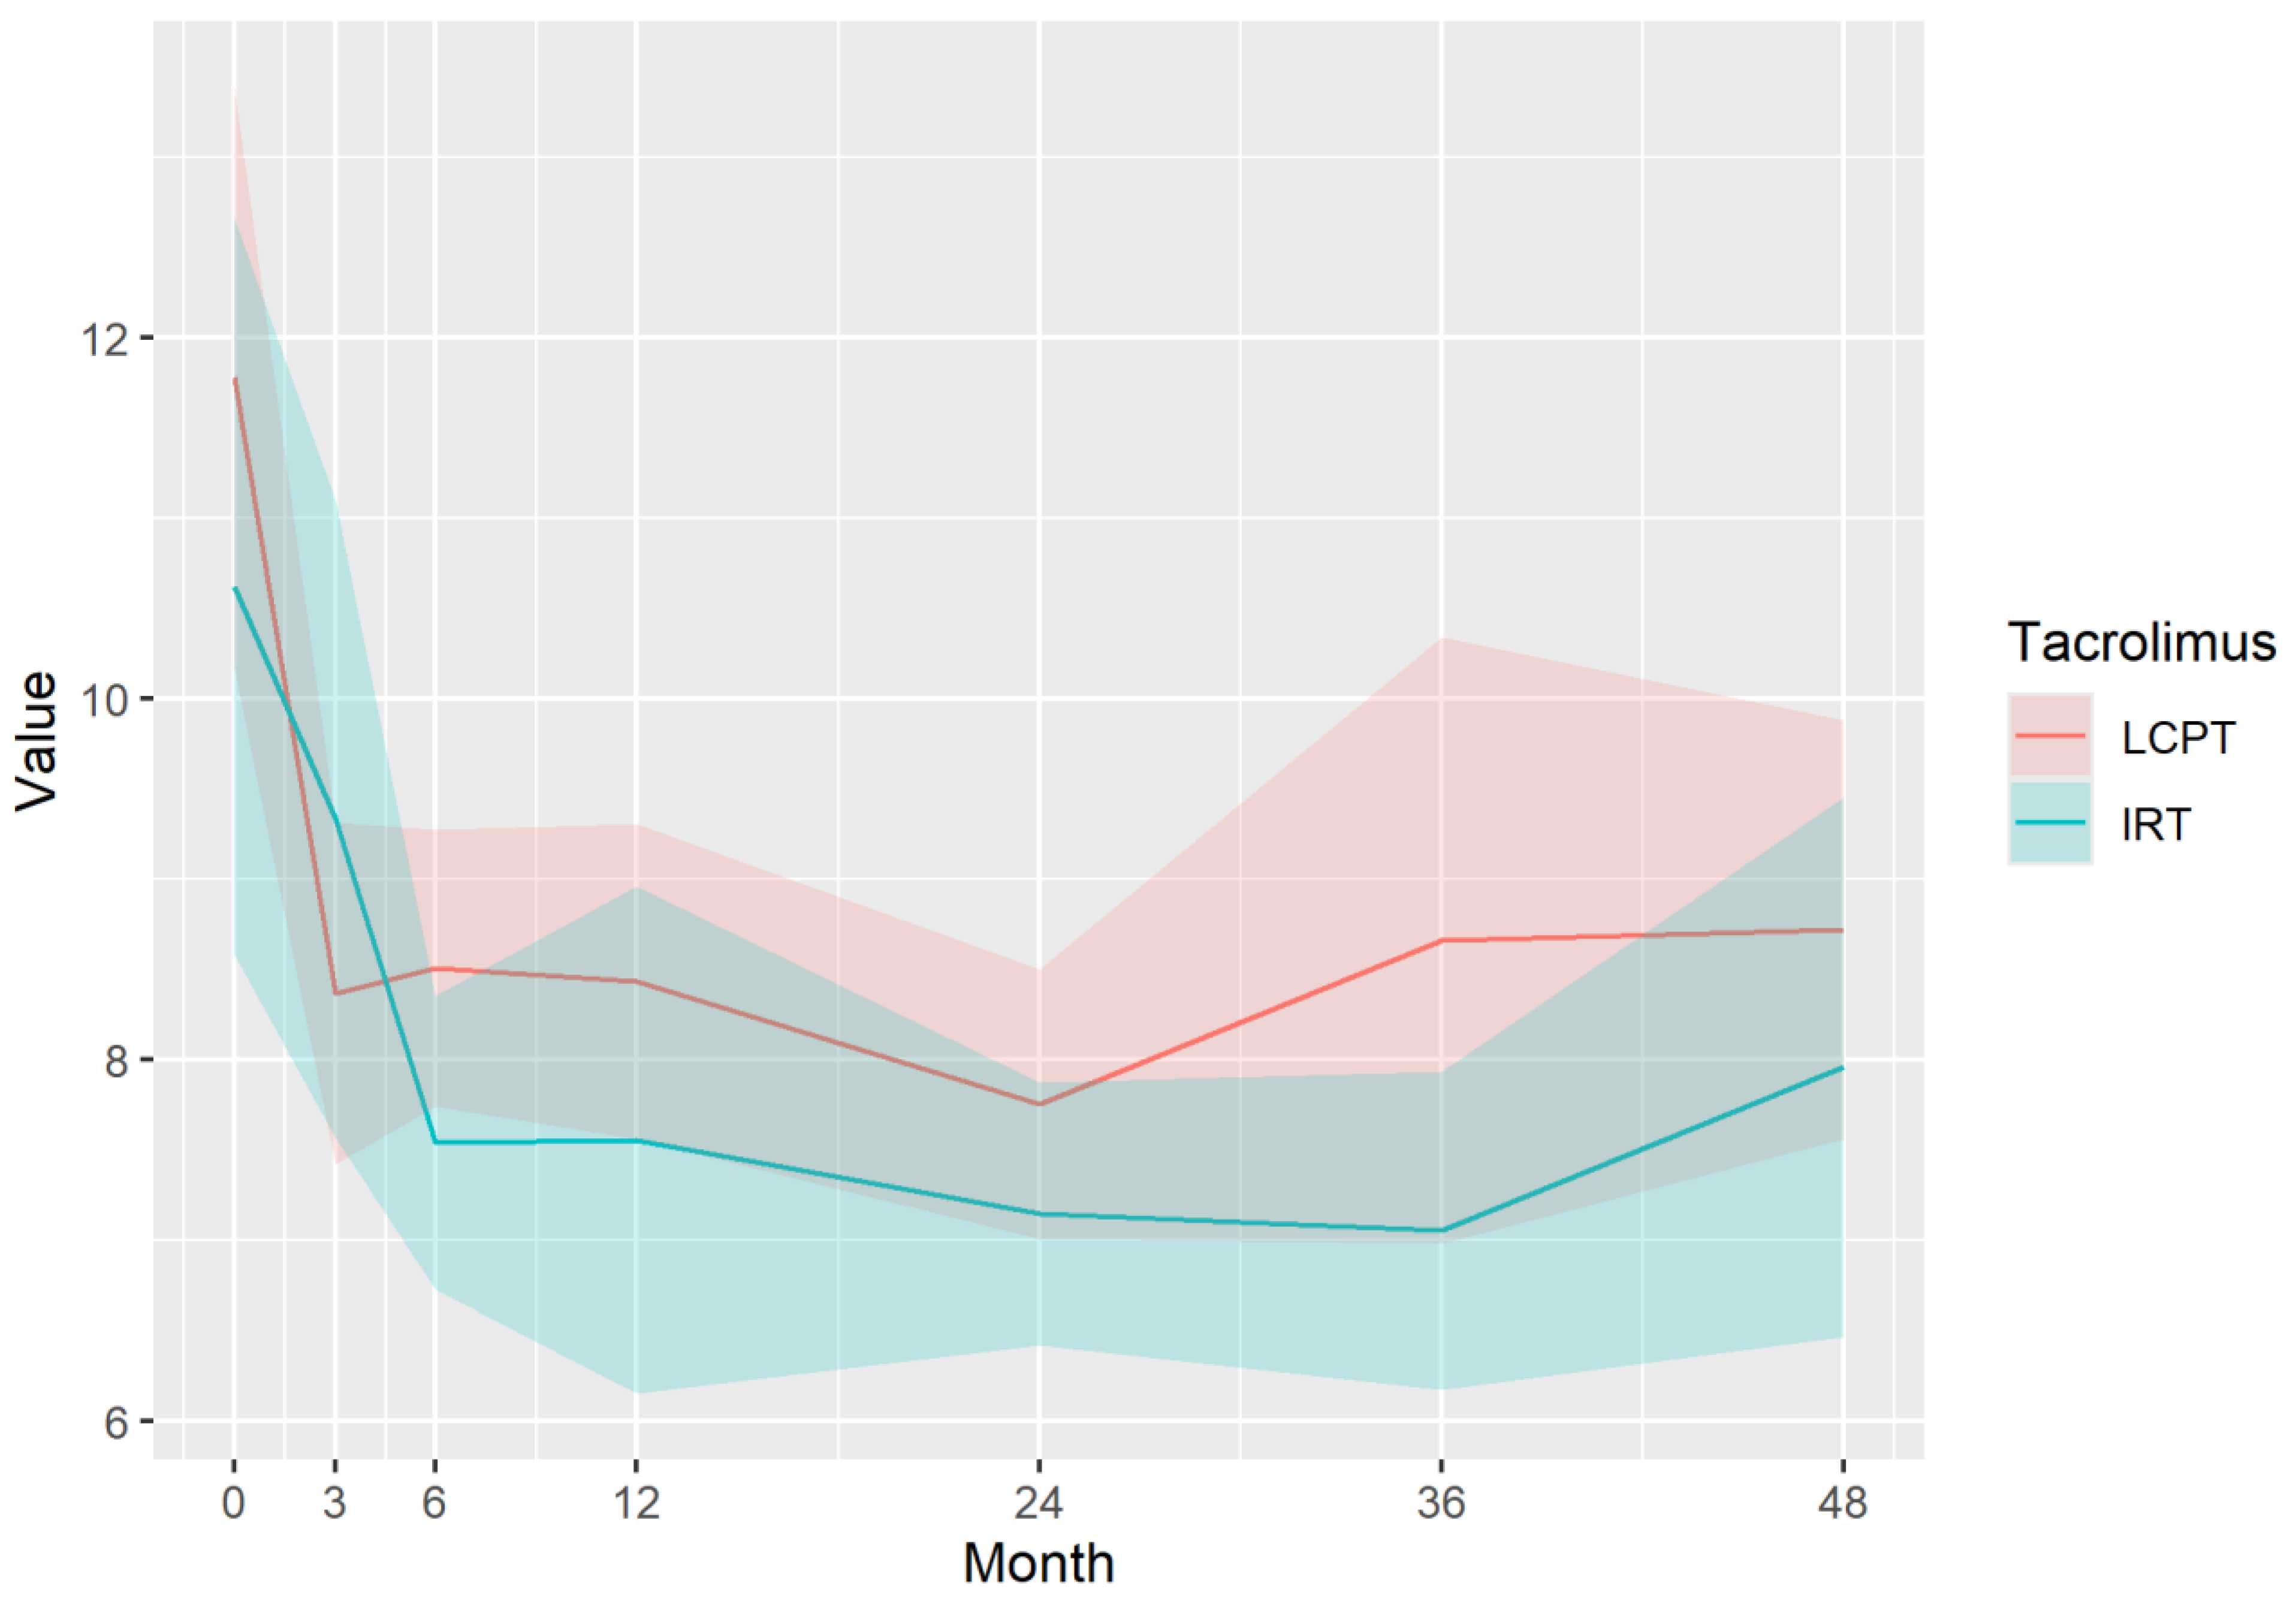
Figure 6.
Tacrolimus CD mean value and 95% CI during the study.
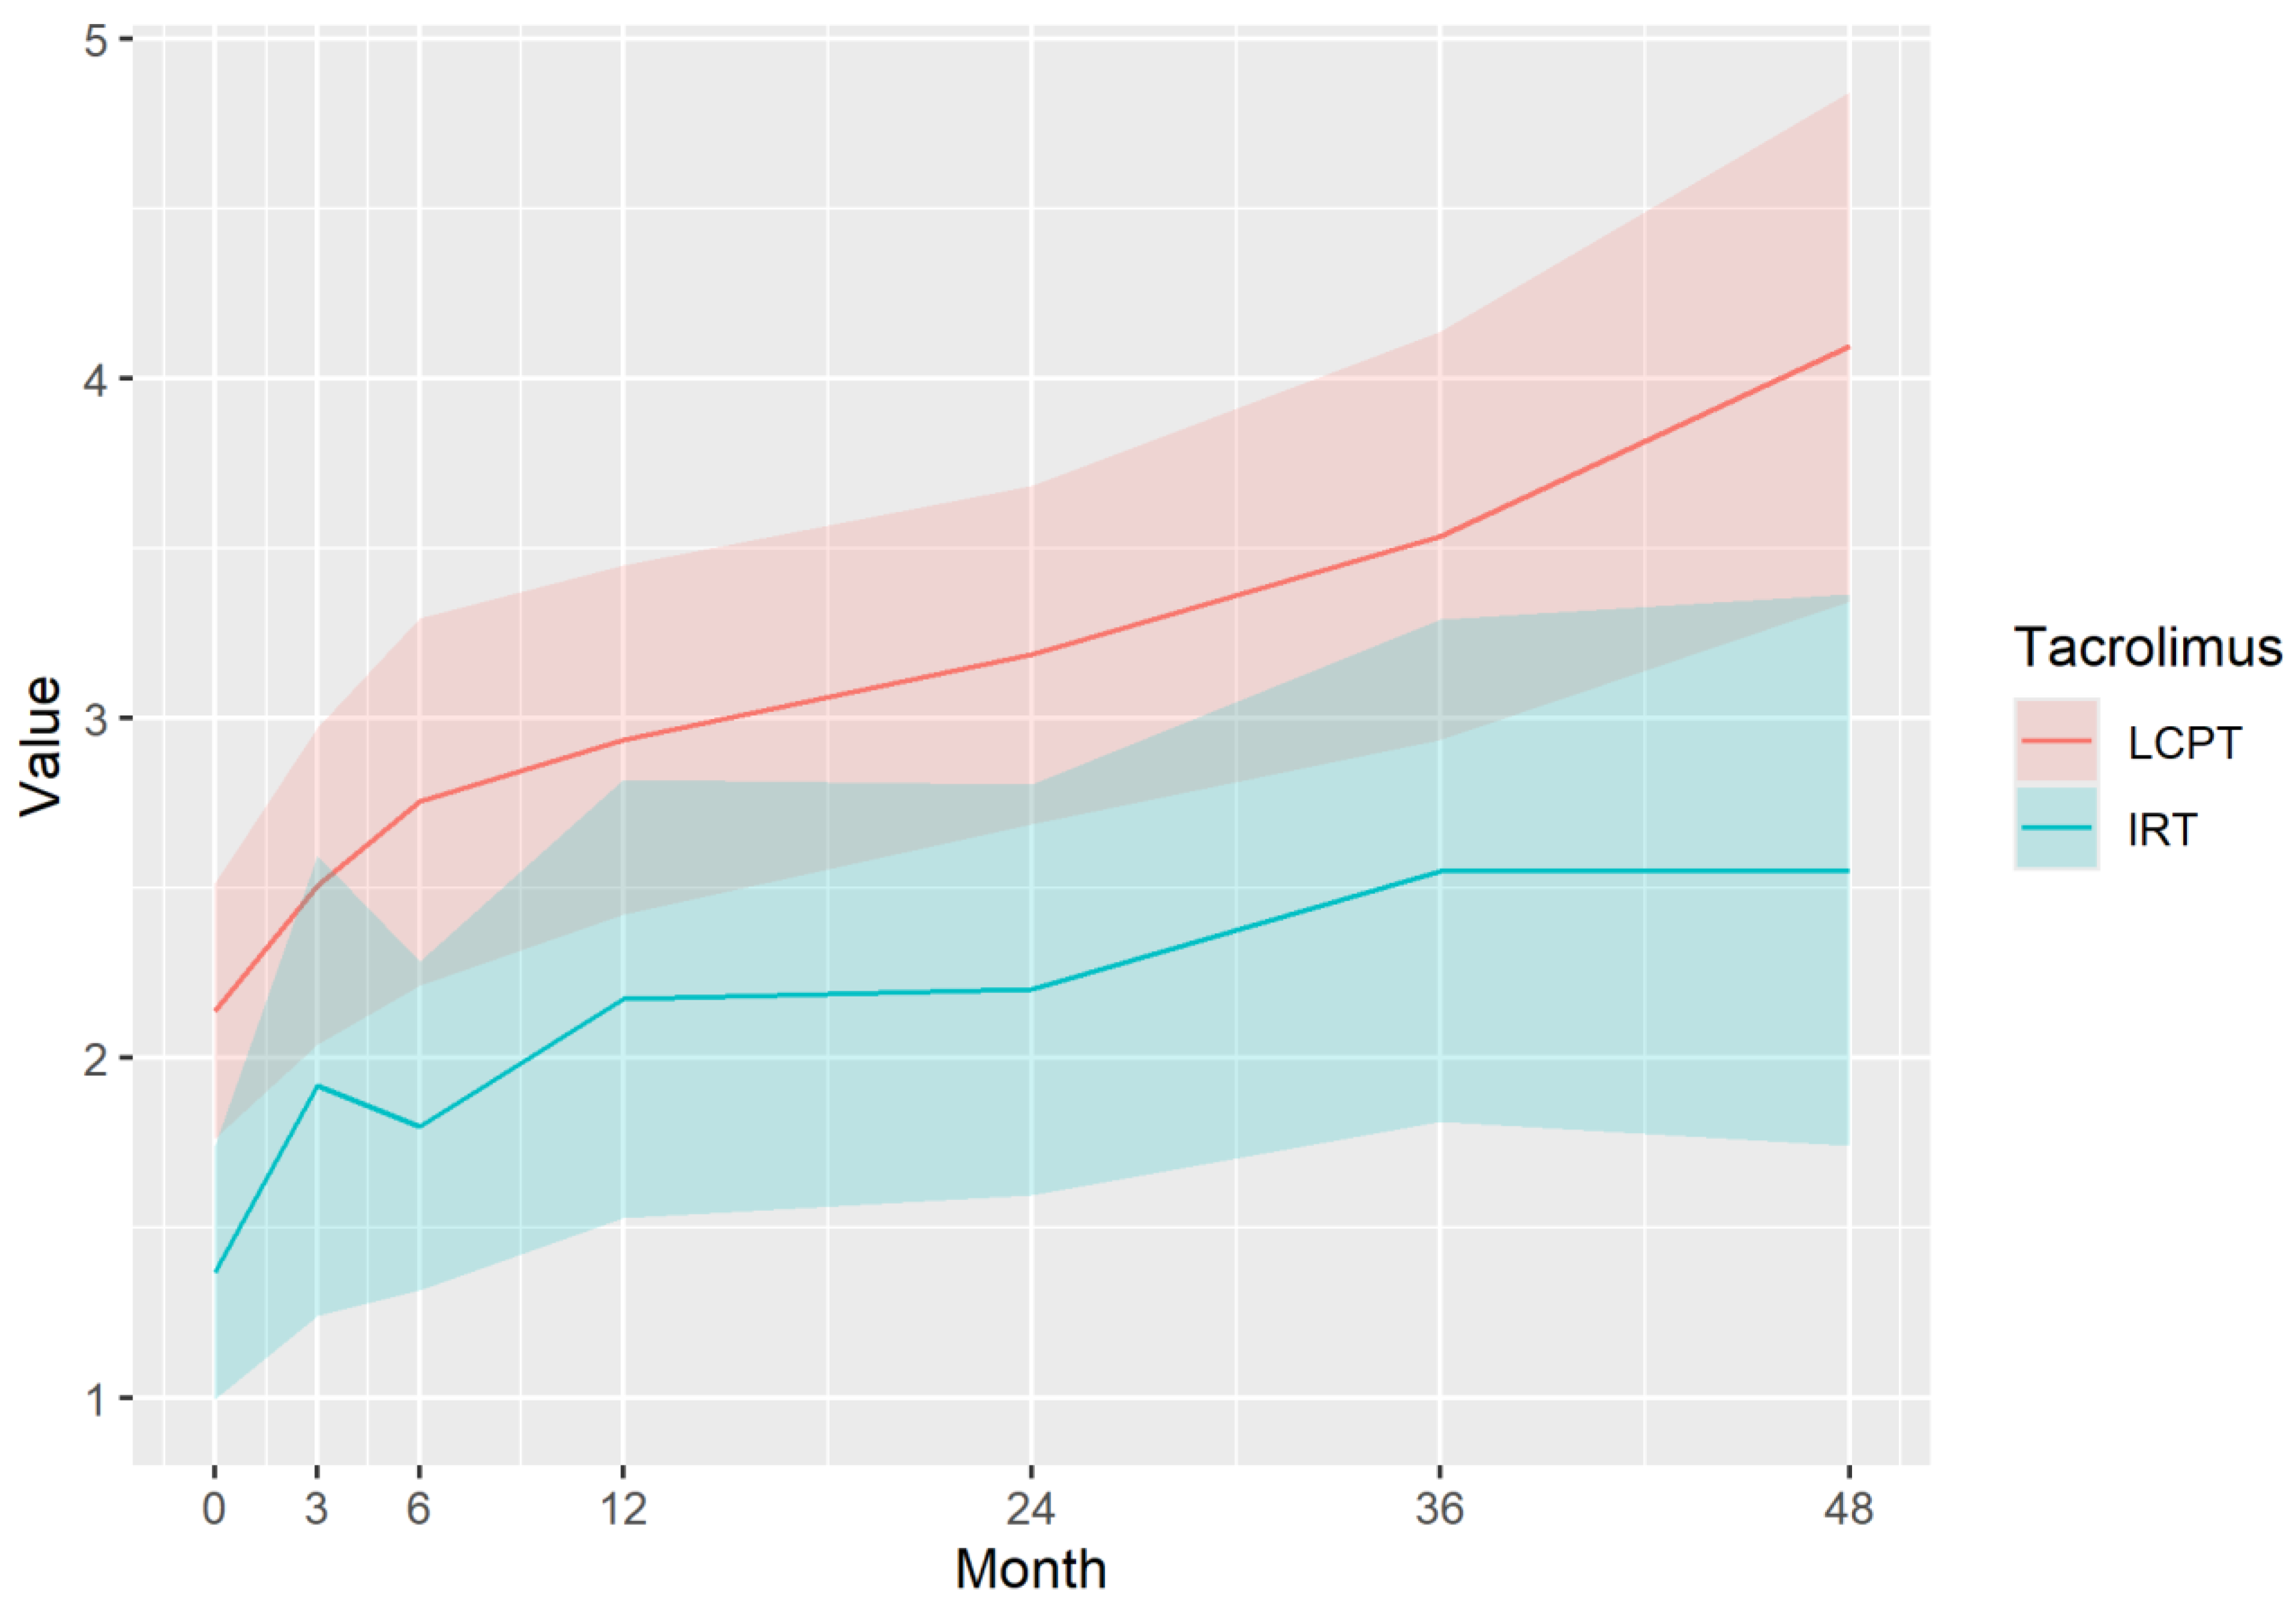

Table 1.
Study protocol flowchart.
| Visit number | 1 - Baseline | 2 | 3 | 4 | 5 | 6 | 7 – End of Study |
|---|---|---|---|---|---|---|---|
| Schedule since Baseline (months) | 0 | 3 | 6 | 12 | 24 | 36 | 48 |
| Simple visit | X | X | |||||
| Complex visit | Baseline | X | X | X | X |
Table 2.
Baseline characteristics.
| Variables | All | LCPT | IRT | p-value |
|---|---|---|---|---|
| Recipient specific factors | ||||
| n (%) | 63 (100%) | 40 (63.49%) | 23 (36.51%) | NA |
| Age (year) | 53.35 (±11.85) | 54.05 (±12.25) | 52.13 (±11.28) | 0.5315 |
| Gender (males, %) | 41 (65.08%) | 26 (65.0%) | 15 (65.22%) | 1.000 |
| Height (cm) | 170.29 (±8.82) | 169.88 (±8.22) | 171.00 (±9.92) | 0.6476 |
| Systolic blood pressure (Hgmm) | 143.46 (±18.58) | 146.95 (±19.09) | 137.39 (±16.30) | 0.0404 |
| Diastolic blood pressure (Hgmm) | 83.33 (±12.18) | 83.45 (±11.33) | 83.13 (±13.80) | 0.9254 |
| Pulse (/min) | 86.33 (±17.15) | 84.70 (±15.03) | 89.17 (±20.37) | 0.3641 |
| Weight (kg) | 76.76 (±13.6) | 75.73 (±12.17) | 78.55 (±15.91) | 0.4774 |
| BMI (kg/m2) | 26.52 (±3.88) | 26.28 (±3.70) | 26.93 (±4.23) | 0.5541 |
| Education level (n, %) | 0.3038 | |||
| Elementary school | 11 (17.46%) | 8 (20%) | 3 (13.04%) | |
| Apprenticeship | 23 (36.51%) | 11 (27.50%) | 12 (52.17%) | |
| High school | 18 (28.57%) | 13 (32.5%) | 5 (21.74%) | |
| University | 11 (17.46%) | 8 (20%) | 3 (13.04%) | |
| Work circumstances (n, %) | 0.1869 | |||
| Full time | 19 (30.16%) | 15 (37.5%) | 4 (17.39%) | |
| Part-time | 6 (9.52%) | 3 (7.5%) | 3 (13.04%) | |
| Unemployed | 4 (6.35%) | 2 (5%) | 2 (8.7%) | |
| Disabled | 16 (25.40%) | 7 (17.5%) | 9 (39.13%) | |
| Retired | 18 (28.57%) | 13 (32.5%) | 5 (21.74%) | |
| Social environment (n, %) In family |
55 (87.3%) | 34 (85%) | 21 (91.3%) | 0.6977 |
| Distance between home and the Transplant Centre (km) | 81.71 (±45.08) | 86 (±44.01) | 74.24 (±46.49) | 0.3328 |
| Blood parameters | ||||
| Na (mmol/l) | 138.46 (±3.2) | 138.32 (±3.38) | 138.70 (±2.90) | 0.6481 |
| K (mmol/l) | 4.69 (±0.61) | 4.70 (±0.65) | 4.68 (±0.56) | 0.9145 |
| Cl (mmol/l) | 104.21 (±4.02) | 103.95 (±4.11) | 104.65 (±3.93) | 0.5049 |
| Glucose (mmol/l) | 6.27 (±2.95) | 6.2 (±2.63) | 6.39 (±3.50) | 0.8235 |
| HbA1C (%) | 5.61 (±0.86) | 5.67(±0.68) | 5.52 (±1.09) | 0.6512 |
| Creatinine (µmol/l) | 138.11 (±47.46) | 148.97 (±52.24) | 119.22 (±30.34) | 0.0058 |
| Urea (mmol/l) | 9.08 (±3.3) | 9.62 (±3.58) | 8.14 (±2.55) | 0.0614 |
| GFR (ml/min/1.73m2) | 50.92 (±17.75) | 46.55 (±17.04) | 58.52 (±16.69) | 0.0091 |
| GOT (U/l) | 13.9 (±6.07) | 13.77 (±6.64) | 14.14 (±4.97) | 0.8067 |
| GPT (U/l) | 26.07 (±19.3) | 24.33 (±15.42) | 29.29 (±25.11) | 0.4168 |
| GGT (U/l) | 46.55 (±41.97) | 49.38 (±50.12) | 41.29 (±19.43) | 0.3763 |
| Total bilirubin (µmol/l) | 7.68 (±3.35) | 7.41 (±3.41) | 8.22 (±3.26) | 0.3796 |
| ALP (U/l) | 94.65 (±51.22) | 87.59 (±29.95) | 107.76 (±75.88) | 0.2537 |
| LDH (U/l) | 244.89 (±53.47) | 244.88 (±52.58) | 244.90 (±55.81) | 0.9988 |
| Triglyceride (mmol/l) | 2.1 (±1.14) | 2.1 (±1.25) | 2.1 (±0.93) | 0.9989 |
| Total cholesterol (mmol/l) | 5.32 (±1.28) | 5.27 (±1.31) | 5.42 (±1.25) | 0.6861 |
| LDL cholesterol (mmol/l) | 3.05 (±1.12) | 2.94 (±1.12) | 3.24 (±1.12) | 0.3478 |
| HDL cholesterol (mmol/l) | 1.63 (±0.44) | 1.64 (±0.42) | 1.60 (±0.50) | 0.7595 |
| Hgb (g/l) | 120.79 (±15.39) | 116.38 (±12.54) | 128.48 (±17.08) | 0.0053 |
| RBC (T/l) | 4.04 (±0.59) | 3.89 (±0.45) | 4.29 (±0.72) | 0.024 |
| RDV (%) | 14.86 (±1.02) | 14.84 (±0.94) | 14.91 (±1.16) | 0.8033 |
| WBC (Giga/l) | 8.22 (±2.56) | 8.04 (±2.40) | 8.53 (±2.84) | 0.4986 |
| Platelets (Giga/l) | 221.7 (±71.93) | 224.95 (±75.72) | 216.04 (±66.04) | 0.6267 |
| CRP (mg/l) | 4.2 (±8.22) | 3.08 (±3.74) | 6.15 (±12.62) | 0.2655 |
| Urine parameters | ||||
| pH | 5.7 (±0.55) | 5.7 (±0.55) | 5.7 (±0.57) | 0.9759 |
| Protein-quantitative (g/l) | 0.13 (±0.22) | 0.13 (±0.18) | 0.14 (±0.26) | 0.8338 |
| Albumin-creatine ratio (mg/mmol) | 10.89 (±21.35) | 10.38 (±18.74) | 12.17 (±27.75) | 0.8403 |
| Protein-creatinine ratio (mg/mmol) | 43.31 (±45.11) | 51.88 (±49.35) | 32.77 (±38.55) | 0.252 |
| Urine culture (positive) | 11 (17.46%) | 2 (5%) | 9 (39.13%) | 0.0005 |
| Comorbidities (yes n, %) | ||||
| Previous heart attack | 1 (1.59%) | 0 (0%) | 1 (4.35%) | 0.3503 |
| Congestive heart failure | 1 (1.59%) | 0 (0%) | 1 (4.35%) | 0.3503 |
| Peripheral vascular disease | 6 (9.52%) | 5 (12.50%) | 1 (4.35%) | 0.3913 |
| Cerebrovascular disease without residual symptoms | 8 (12.7%) | 6 (15%) | 2 (8.70%) | 0.6977 |
| Cerebrovascular disease with hemiplegia | 2 (3.17%) | 1 (2.50%) | 1 (4.35%) | 1 |
| Chronic lung disease | 8 (12.7%) | 3 (7.50%) | 5 (21.74%) | 0.1209 |
| Connective tissue disease | 1 (1.59%) | 0 (0%) | 1 (4.35%) | 0.3503 |
| Peptic ulcer | 3 (4.76%) | 2 (5.00%) | 1 (4.35%) | 1 |
| Mild liver disease | 3 (4.76%) | 1 (2.50%) | 2 (8.70%) | 0.5427 |
| Moderate or severe liver disease | 1 (1.59%) | 1 (2.50%) | 0 (0%) | 1 |
| Diabetes - no complications | 2 (3.17%) | 1 (2.50%) | 1 (4.35%) | 1 |
| Diabetes with complications | 8 (12.7%) | 4 (10%) | 4 (17.39%) | 0.4393 |
| Tumour. leucaemia or lymphoma | 1 (1.59%) | 1 (2.50%) | 0 (0%) | 1 |
| Charlson comorbidity index (points) | 2.92 (± 1.25) | 2.83 (± 1.32) | 3.09 (± 1.12) | 0.4076 |
| Transplant specific factors | ||||
| Number of kidney transplants (n, %) | 0.8186 | |||
| First kidney transplant | 55 (87.3%) | 34 (85%) | 21 (91.3%) | |
| Second kidney transplant | 7 (11.11%) | 5 (12.5%) | 2 (8.7%) | |
| Third kidney transplant | 1 (1.59%) | 1 (2.5%) | 0 (0%) | |
| Origin of transplanted organ (cadaver, %) | 62 (98.41%) | 39 (97.5%) | 23 (100%) | 1 |
| Previous member of chronic dialysis program (yes, %) | 59 (93.65%) | 38 (95.00%) | 21 (91.3%) | 0.6222 |
| Previously time spent on dialysis (months) | 44.53 (±31.84) | 34.92 (±25.44) | 61.90 (±35.35) | 0.0042 |
| Previous dialysis type (peritoneal dialysis, %) | 17 (28.81%) | 14 (36.84%) | 3 (14.29%) | 0.1257 |
| HLA-A mismatch (n, %) | ||||
| HLA-A | 0.084 | |||
| HLA-A 0 | 11 (17.46%) | 4 (10%) | 7 (30.43%) | |
| HLA-A 1 | 43 (68.25%) | 31 (77.5%) | 12 (52.17%) | |
| HLA-A 2 | 9 (14.29) | 5 (12.5%) | 4 (17.39%) | |
| HLA-B | 0.3533 | |||
| HLA-B 0 | 20 (31.75%) | 13 (32.5%) | 7 (30.43%) | |
| HLA-B 1 | 30 (47.62%) | 21 (52.5%) | 9 (39.13%) | |
| HLA-B 2 | 13 (20.63%) | 6 (15%) | 7 (30.43%) | |
| HLA-C | 0.1769 | |||
| HLA-C 0 | 24 (38.10%) | 13 (32.5%) | 11 (47.83%) | |
| HLA-C 1 | 29 (46.03%) | 22 (55%) | 7 (30.43%) | |
| HLA-C 2 | 10 (15.87%) | 5 (12.5%) | 5 (21.74%) | |
| HLA-DR | 0.1624 | |||
| HLA-DR 0 | 12 (19.05%) | 7 (17.5%) | 5 (21.74%) | |
| HLA-DR 1 | 26 (41.27%) | 20 (50%) | 6 (26.09%) | |
| HLA-DR 2 | 25 (39.68%) | 13 (32.5%) | 12 (52.17%) | |
| HLA-DQ | 0.1059 | |||
| HLA-DQ 1 | 11 (17.46%) | 7 (17.5%) | 4 (17.39%) | |
| HLA-DQ 1 | 21 (33.33%) | 17 (42.5%) | 4 (17.39%) | |
| HLA-DQ 2 | 31 (49.21%) | 16 (40%) | 15 (65.22%) | |
| Previous circulating antigen before present transplant (yes, %) | 10 (15.87%) | 7 (17.5%) | 3 (13.04%) | 0.7341 |
| Pretransplant DSA (yes, %) | 4 (7.02%) | 1 (2.7%) | 3 (15%) | 0.1184 |
| Delayed Graft Function (yes, %) | 12 (19.05%) | 8 (20%) | 4 (17.39%) | 1 |
| Baseline treatment data | ||||
| Received induction therapy for this implantation (yes, %) | 61 (96.83%) | 39 (97.5%) | 22 (95.65%) | 1 |
| Induction therapy | 0.0357 | |||
| Basiliximab | 19 (31.15%) | 8 (20.51%) | 11 (50%) | |
| ATG | 42 (68.85%) | 31 (79.49%) | 11 (50%) | |
| Tacrolimus TDD (mg) | 7.23 (± 3.3) | 6.24 (± 2.83) | 8.96 (± 3.40) | 0.0024 |
| Tacrolimus TL (ng/ml) | 11.2 (± 4.25) | 11.76 (± 4.69) | 10.22 (±3.22) | 0.1299 |
| CD: TL/TDD ratio (ng/ml)/mg | 1.91 (±1.11) | 2.25 (±1.18) | 1.30 (±0.63) | 0.0001 |
| Time between the last dose of tacrolimus and blood draw (min) | 1277.14 (±348.07) | 1520.62 (±116.22) | 853.70 (±149.11) | 0 |
| second immunosuppressant | 0.0917 | |||
| mycophenolate mofetil | 23 (36.51%) | 11 (27.5%) | 12 (52.17%) | |
| mycophenol acid | 40 (63.49%) | 29 (72.5%) | 11 (47.83%) | |
| daily dose of mycophenol (mg) | 1360.95 (±536.75) | 1253 (±444.58) | 1548.7 (±635.20) | 0.0566 |
| transplanted kidney US-RI value | 0.69 (±0.12) | 0.70 (±0.09) | 0.67 (±0.16) | 0.4688 |
| transplanted kidney abnormality on US (yes, %) | 34 (57.63%) | 19 (51.35%) | 15 (68.18%) | 0.3209 |
| transplanted kidney biopsy (yes, %) | 6 (9.52%) | 5 (12.5%) | 1 (4.35%) | 0.3988 |
| First biopsy type (indicated) | 3 (50%) | 3 (60%) | 0 (0%) | 1 |
| Adherence | ||||
| Patient agrees to complete the BAASIS questionnaire (yes, %) | 59 (93.65%) | 36 (90%) | 23 (100%) | 0.2744 |
| Missed any dose during the last 4 weeks (yes, %) | 1 (1.72%) | 0 (0%) | 1 (4.35%) | 0.3833 |
| Patient adherence self-assessment (of 100) | 99.12 (±3.26) | 99.69 (±1.18) | 98.26 (±4.91) | 0.1848 |
Statistically significant differences (p<0.05) are highlighted in bold text.
Table 3.
Patient disposition per study centre and treatment.
| Centre/arm Visits |
Timing | Debrecen centre | Szeged centre | Total | ||
|---|---|---|---|---|---|---|
| LCPT | IRT | LCPT | IRT | |||
| Visit 1 | 0 months (4-6 weeks after KT) |
26 | 23 | 14 | 0 | 63 |
| Visit 2 | 3 months | 24 | 23 | 14 | 0 | 61 |
| Visit 3 | 6 months | 23 | 21 | 14 | 0 | 58 |
| Visit 4 | 12 months | 22 | 21 | 14 | 0 | 57 |
| Visit 5 | 24 months | 20 | 18 | 12 | 0 | 50 |
| Visit 6 | 36 months | 19 | 13 | 12 | 0 | 44 |
| Visit 7 | 48 months | 14 | 13 | 12 | 0 | 39 |
Table 4.
Summary table: results of the mixed-model analysis on tacrolimus TDD, CD, and eGFR during the study period.
Table 4.
Summary table: results of the mixed-model analysis on tacrolimus TDD, CD, and eGFR during the study period.
| Months | 0 | 3 | 6 | 12 | 24 | 36 | 48 | |
| TDD | LCPT | 5.42 | 3.94 | 3.46 | 3.00 | 2.59 | 2.36 | 2.21 |
| IRT | 7.64 | 5.56 | 4.88 | 4.24 | 3.64 | 3.33 | 3.12 | |
| CD* | LCPT | 2.54 | 2.63 | 2.72 | 2.9 | 3.26 | 3.62 | 3.98 |
| IRT | 1.58 | 1.67 | 1.76 | 1.94 | 2.3 | 2.66 | 3.02 | |
| eGFR | LCPT | 46.99 | 47.20 | 47.41 | 47.83 | 48.67 | 49.51 | 50.35 |
| IRT | 57.89 | 57.47 | 57.05 | 56.21 | 54.53 | 52.85 | 51.17 | |
| * for patients who were not treated by mTORi | ||||||||
| In each category yellow is the lowest, and green is the highest value | ||||||||
Disclaimer/Publisher’s Note: The statements, opinions and data contained in all publications are solely those of the individual author(s) and contributor(s) and not of MDPI and/or the editor(s). MDPI and/or the editor(s) disclaim responsibility for any injury to people or property resulting from any ideas, methods, instructions or products referred to in the content. |
© 2026 by the authors. Licensee MDPI, Basel, Switzerland. This article is an open access article distributed under the terms and conditions of the Creative Commons Attribution (CC BY) license (http://creativecommons.org/licenses/by/4.0/).
Copyright: This open access article is published under a Creative Commons CC BY 4.0 license, which permit the free download, distribution, and reuse, provided that the author and preprint are cited in any reuse.


