
Submitted:
06 February 2026
Posted:
09 February 2026
You are already at the latest version
Abstract
Background: Estimates of survival for people with disabilities are rare and tend to focus on individuals with specific diseases. The health conditions of people with disabilities are often very poor, which is reflected in their significantly lower life expectancy com-pared to the rest of the population. Objectives This study aims to estimate the life ex-pectancy of people with severe disabilities in Italy. Methods: Data from the 1999–2000 Health Interview Survey, linked to the register of causes of death up to 2012, were uti-lized for the purpose of this study. Survival was analyzed using a Weibull regression model. Hazard ratios for subjects with and without disabilities were employed to es-timate the mortality risk among subjects with disabilities compared to all subjects sur-veyed. These ratios were then employed to construct a life table for people with disa-bilities by multiplying the death probabilities of the general population by the ratio. Results: The life expectancy at 15 years for people with disabilities was found to be 59.1 years for males and 66.2 years for females. The LE gap between people with disabilities and the general population at 15 years was 6.6 years for men and 4.1 years for women. Conclusions: These findings provide valid and robust information on the life expectancy gap between people with and without disabilities and can be used as a reference point when evaluating policies aimed at people with disabilities.
Keywords:
survival
; disability
; life expectancy
; policy implications
1. Introduction
Estimates of survival of people with disabilities in Italy are rare and mainly concern people with specific diseases. Even at the international level, survival data are available concerning specific disability-inducing conditions, while estimates concerning the condition of disability, regardless of the specific cause of disability, are scarce.
The estimation of survival of persons with disabilities has been conducted with different approaches. A study conducted in California analyzed four chronic disability conditions: cerebral palsy, spinal cord injury, Down syndrome, and mental retardation (not resulting from Down syndrome). Stratifying the analysis by the presence of quadriplegia and severe mental retardation, the authors estimated a life expectancy at 10 years of 40 years for people with quadriplegia, 59 years for those with mild or moderate mental retardation, and 50 years for those with severe mental retardation [1]. These estimates have been produced from cross-sectional studies and, in general, provide more pessimistic estimates than those coming from other studies, again, however, limited to specific pathological conditions. Moreover, these estimates seem to be valid when applied to young subjects with severe disabilities, onset at birth or in the first years of life.
In the case of disability onset in adulthood, more reliable information on survival would be inferred by calculating a penalty coefficient to be attributed to the different factors causing the disability condition to be combined with life expectancy at various ages computed from mortality tables for the general population [2].
A study conducted in the Netherlands between 2001 and 2006 with more than 60 thousand respondents completing the "health module" of the Ongoing Population Survey investigated the survival of people with disabilities, where disability status was defined according to the inability to perform at least one out of five activities daily living (ADLs) "normally"[3]. The eventual death of respondents was verified by linkage of OPS data with municipal population registers as of December 31, 2007. The Hazard Ratio (HR) (the risk of death of people with disabilities compared with that of people without disabilities) and life expectancy at age 55 separately for men and women were then calculated using a Cox model. The HR for men was 7.8 and life expectancy at 55 years among people with disabilities was 15.9; for women the HR was 6.14 and life expectancy at 55 years was 21.3 [4]. A recent Italian study estimated a life expectancy with disability ranging from 8.1 years to 12.6 years in subjects between 50 and 79 years based on a series of longitudinal population surveys [5].
The objective of the study is to estimate the life expectancy of people with severe disabilities in Italy based on a cross-sectional population survey linked with data from death registries of the following 13 years.
2. Materials and Methods
2.1. Data
The data were taken from the 1999-2000 Health Interview Survey (HIS) and linked to the Register of causes of death up to 2012, to ascertain the vital status of those who participated in the HIS. The HIS focuses on the key aspects of population health conditions and health services utilization. The survey is based on a sample of approximately 52,300 households and was conducted by the Italian National Institute of Statistics (ISTAT) in four quarterly waves between September 1999 and March 2000. The Causes of Death Register contains demographic data (e.g. age and sex) which is provided by the Civil Status Officer of the municipality, as well as data on causes of death which is provided by the physician. ISTAT annually collects, processes and publishes data on mortality by cause. The data used for the analyses were derived from a database created using a deterministic linkage procedure between individuals enrolled in the 1999–2000 HIS (140,011 individuals, of whom 128,818 were linkable with the death records archive, equaling 92% of the sample) and the causes of death register for the years 1999–2012. This procedure identified a total of 14,912 deaths in total.
2.2. Methods
2.2.1. Definition of the Population Under Study
Since 1990, ISTAT has employed a set of questions developed by an OECD working group based on the World Health Organization’s International Classification of Impairments, Disabilities and Handicaps to estimate disability prevalence. The questionnaire includes a scale assessing difficulty in performing activities of daily living (ADLs), originally proposed by Katz in the 1960s [6]. In this study, we adopt the OECD-endorsed definition of disability based on Katz, [7] which identifies people with severe disabilities with those who are unable to perform at least one of the functions of ADL [8]. These activities include walking, climbing stairs, stooping, lying down, sitting, dressing, washing, bathing and eating, as well as sensory functions such as hearing, seeing and speaking. Confinement to bed, a chair (excluding a wheelchair), or home is also considered. This battery has been shown to classify disability severity effectively [9]. The study population therefore comprised individuals who were confined to bed or a chair, or who had at least one severe functional limitation. Disability status was assessed using responses from the 1999–2000 HIS questionnaire. No follow-up assessment of disability status was conducted during the subsequent study period (2000–2012).
2.2.2. Statistical Methods
The methodological approach consisted of four main steps. First, we estimated the transition probability from a healthy state to a disabled state. Second, we calculated age-specific probabilities of death for people with disabilities. Third, we estimated the relative risk of death for individuals with disabilities compared with those without disabilities. Finally, we applied these relative risks to the life table of the general population to estimate life expectancy among people with disabilities.
2.2.3. Estimation of Transition Probabilities
Probabilities of death were calculated by assigning each death occurring during the observation period (1999–2012) to the corresponding age group of the individual at risk. Because disability status was measured only at the time of the 1999–2000 survey, age- and sex-specific transition probabilities from a healthy state to a state of severe disability were estimated to approximate the evolution of disability prevalence during the 13-year follow-up. Although reliable estimation of transition probabilities in multistate health models ideally requires longitudinal data [10], only a limited number of Italian studies have attempted this using longitudinal surveys [5], and these rely on a different definition of disability. In those studies, disability was simplified into a dichotomous variable, irrespective of severity and allowing for recovery—an approach inconsistent with our framework and likely to overestimate transition probabilities. As an alternative, transition probabilities may be inferred from cross-sectional data, which capture health status at a single time point [11,12,13].
In our study, because longitudinal data required for direct estimation of transition probabilities was unavailable, we relied on cross-sectional data. However, such data do not capture individual-level transitions over time, making estimation inherently challenging. Cross-sectional surveys observe different individuals at different points of time rather than following the same individuals over time, which prevents direct observation of transitions between health states [14]. As a result, identification of unobserved transitions is feasible only by imposing assumptions on states and time. Following Rickayzen [15] and Hariyanto [16], we applied a logistic function to estimate one-year transition probabilities across multiple health states, assuming a stationary population structure. Model parameters were calibrated so that the resulting age- and sex-specific prevalence rates closely matched those observed in the 1999–2000 HIS (Table 1).
2.2.4. Estimation of the Excess Risk of Deaths Among Person with Disability
The excess mortality risk associated with severe disability was estimated using survival models. Although the Cox proportional hazards model is widely regarded as the standard analytical approach, it relies on the assumption of proportional hazards across covariates. This assumption was evaluated using statistical tests and graphical diagnostics based on scaled Schoenfeld residuals [17], which indicated violations primarily due to time since baseline influencing risk. Consequently, we adopted a Weibull regression model, which provided a better fit and allowed greater flexibility. Hazard ratios were derived from interaction terms between age group and disability status, in models that also included the main effects of age group and disability.
2.2.5. Building a Modified Life Tables Through the Excess of the Death Risk of Persons with Disability
Hazard ratios were then used to estimate the ratio of mortality risk for persons with severe disability relative to all survey participants within each age class. These ratios were applied as multiplicative factors to age-specific death probabilities from the general population life tables to construct a life table for persons with disabilities, under the assumption that the study sample reflects the general population. To obtain probabilities of death for each single year of age, ratios estimated for ten-year age groups were interpolated using an exponential spline function [1]. The resulting life expectancy estimates represent the expected remaining years of life for individuals assumed to remain either nondisabled or disabled for the rest of their lifetime
3. Results
The number of persons with a disability ascertained in the study sample was 5,908. Among them, the number of deaths in the observation period (1999-2012) was 3,694 (60%). In the entire survey population, the number of deaths was 14,912, indicating that 11.6% of the study population has died during the observation period.

Table 1.
Number of subjects, number of deaths and person-years by disability status and age group. Observation period:1999-2012.
Table 1.
Number of subjects, number of deaths and person-years by disability status and age group. Observation period:1999-2012.
| Persons with disabilities | Persons without disabilities | |||||
|---|---|---|---|---|---|---|
| Age class | #subjects | # deaths | person-years | #subjects | # deaths | person-years |
| 6-14 | 156 | 0 | 2,028 | 12,668 | 27 | 164,54 |
| 15-24 | 125 | 6 | 1,576 | 16,569 | 84 | 214,88 |
| 25-34 | 151 | 11 | 1,859 | 19,955 | 159 | 258,56 |
| 35-44 | 172 | 24 | 2,096 | 20,42 | 386 | 263,613 |
| 45-54 | 275 | 54 | 3,26 | 18,654 | 869 | 238,419 |
| 55-64 | 565 | 212 | 5,932 | 15,06 | 1,855 | 186,557 |
| 65-74 | 1253 | 721 | 11,734 | 12,234 | 3,727 | 140,565 |
| 75-84 | 1841 | 1,436 | 14,099 | 5,406 | 3,277 | 52,718 |
| 85+ | 1370 | 1,23 | 7,304 | 966 | 832 | 6,913 |
| Total | 5908 | 3,694 | 49,888 | 122,91 | 11,218 | 1,539,469 |
Age-specific transition probabilities from a healthy state to a state of severe disability were estimated using the model proposed by Rickayzen [15]: the transition probabilities for females at age x were equal to A + (D-A) /(1+BC-x) where the parameter A is the probability of being disabled at young ages; D is the probability of being disabled at extremely high ages; the parameters B and C determine how rapidly the probabilities change between the two extreme values; for males a multiplicative correction term is added: 1-1/3 exp [-(x-E)/4)2], with the extra parameter, E, gives the age at which there is a “kink” in the transition probability function. The values of used parameters are the following ones: (for Males) A=0.006, B=1.106, C=93.511, D=0.452, E=7.300; (for females) A=0.006, B=1.093, C=103.600, D=0.613, E=not used. This model incorporates age-related prevalence patterns observed in HIS and provides a smoothed trajectory of transition risk over the life course. Parameters of the model were calibrated separately for males and females to closely reproduce observed disability prevalence in the baseline survey. The transition probabilities by age and gender are reported in Figure 1.
A longitudinal 12-year panel of subjects interviewed during 1999-2000 HIS was then reconstructed linking the date of the occurrence of deaths from the death registries 1999-2012 and attributing the disability condition both using the information collected with the HIS at the start of the observation and the annual transition probabilities to the health subjects in the following 12 years. Because severe disability was treated as an absorbing state, individuals who transitioned into disability were assumed to remain disabled for the remainder of follow-up.
Mortality risks for individuals with and without disability were estimated using a Weibull survival model. The Cox proportional hazards model was initially evaluated but rejected due to violations of the proportional hazard assumption based on scaled Schoenfeld residual diagnostics. The Weibull model, which accommodates non-proportional hazards, provided a better fit to the observed data. Interaction terms between age class and disability status were used to derive age-specific hazard ratios. The hazard risks of the subject with disability compared to those without disability was therefore estimated with the following Weibull model H(t)=λ t λ-1× exp – λ [b0+b1x1+b2x2+b3x1x2], where x1, x2 represent the predictor variables (x1=age-class, x2=presence of disability) and λ is a shape parameter. The fitting of the model was tested using the linktest function of Stata 17 [18]. The risk ratio (RR) between the risk of dying among persons with disabilities, by ten-year age groups, and the risk of dying of all subjects participating in the 1999-2000 HIS was then calculated. The RR shows its highest value in the age group 25-34 years, decreases gradually in the next age groups, reaching values close to the parity over 75 years old. Estimation for the age class 6-14 was not represented because not estimable through the adopted Weibull model (Table 2)
Estimates of RRs for ten-year age classes were interpolated with spline cubic equation, yielding estimates for one-year age group. (Figure 2)
The interpolated hazard ratios were applied as multiplicative adjustments to age-specific mortality probabilities from the 2012 general population life tables, producing separate life tables for males and females with severe disability. Because mortality data below age 15 were insufficiently reliable, life expectancy was calculated beginning at age 15. The resulting estimates reflect remaining life expectancy under the assumption that the individual remains in the same disability state throughout life.
Life expectancy at 15 years for people with disability was 59.1 years for men and 66.2 for women. The gap of LE at 15 years between persons with disability and general population was 6.6 years for men and 4.1 years for women. Life expectancy at 30 years for people with disability was 46.4 years for men and 52.2 for women., with a gap 4.6 years for males and 3.3 year for females. The gap in LE tends to be lower in later ages, as expected: -1.9 at 55 years, -1.5 at 65 years and -1.1 at 75 years among males; -1.5 at 55 years, -1.2 at 65 years and -0.9 at 75 years among females. The estimated life expectancies at the various ages of people with disabilities, with associated confidence intervals, compared with those of the general population are reported, separately by gender, in Figure 3 and Figure 4.
4. Discussion
This study provides new evidence on the life expectancy of individuals with severe disabilities in Italy, drawing on data from the principal national sample survey on population health, which was linked to the national register of causes of death. At age 15, life expectancy was 6.6 years lower for men and 4.1 years lower for women compared with the general population. The Risk Ratio (RR) of death for persons with severe disabilities, compared with those without, ranged from 7.6 in the 25–34 age group to 1.1 in the 75+ age group. These results are broadly consistent with findings reported in the existing literature.
Strauss and colleagues [19] reported that individuals with no mobility capacity had a nearly fivefold increase in the risk of death at age 15 relative to peers with good mobility, whereas individuals with reduced mobility had twice the risk [20]. Similarly, Majer et al [4], in a Dutch study, estimated life expectancy at age 55 among persons with disabilities to be 15.9 years for men and 21.3 years for women—values in line with those obtained in the present study, which provides a more comprehensive picture by estimating life expectancy from age 15 onwards. Life expectancies for people with physical disabilities in China were lower than for the general population, with gaps in male and female life expectancy at birth of 17.1 and 12.7 years, respectively [21].
A recent study investigated the mortality and life expectancy among people with disabilities according to disability type in Korea using 10-year combined data between 2008 and 2017. The life expectancy at birth of people with disability was 65.2 (C.I. 95%: 64.9 - 65.5) with a gap between the disabled and non-disabled population of 17.6 years [22].
A recent systematic review estimated the mortality rate ratios of people with and without disabilities by age group. The pooled hazard ratio was estimated to be 4.46 (95% CI 3.01–6.59) for children aged 0–15, 3.53 (95% CI 1.29–9.66) for adults aged 15–59, and 1.97 (95% CI 1.63–2.38) for adults aged over 60 [23]. These estimates are comparable with those produced in our study. A recent Italian study estimated life expectancy with disability between 50 and 79 years ranged from 8.1 years to 12.6. [5] These figures are hard to compare because concern a wide age span (from 50 to 79 years) and are not distinguished by gender. Anyway, the LEs of this study are like those estimated in our study at the age of 79.
Unlike the general population, the surveyed population considered in our study is free-living. Cambois [24] estimated the difference in life expectancy between free-living and institutionalized populations. In the younger age groups, where the prevalence of disability is very low, the difference in life expectancy between free-living and institutionalized people is estimated to be around seven months. As age increases and disability becomes more common, this difference decreases until it disappears.
In our study the OECD indicator was preferred to GALI, whose validity to accurately categorize the degree of severity of an individual’s disability was not considered so high, due to its limited sensitivity [25]. For these reasons the OECD indicator, which has been used for many years with reliable and objective validity in assessing the severity of disability, was instead used.
4.1. Strengths and Limitations
One of the main strengths of this study is that it is, to the best of our knowledge, the first to provide life expectancy estimates for people with disabilities in Italy using data from a national survey. It is also one of the few such studies available worldwide. Another strength is that the estimation of survival measures is based on a large, representative survey of free-living people who were followed up for 13 years.
However, this study has several limitations. Firstly, the disability data were self-reported, which can result in under- or overreporting of disability and may therefore bias the outcomes. However, measurement of functional limitations by self-report has been shown to be consistently associated with performance and to reflect similar assessments of function [26].
The probabilities of death were not calculated for a generation of contemporaries as usual, but rather by observing subjects at follow-up entry for the subsequent 13 years. Therefore, it is assumed that the relationship between the risk of death among people with disabilities and the entire observed population remains constant throughout the observation period.
To address the issue that disability status was only ascertained at the start of the follow-up period, transition probabilities (TP) were used to predict changes in state from absence to presence of disability, categorized by age and gender. TP were estimated by assuming a stationary population structure through a function with parameters calibrated to closely replicate the age- and gender-specific prevalence rates of disability at entry. Both assumptions have a margin of uncertainty that cannot be tested, although large deviations from these assumptions are quite unlikely.
Finally, the data does not permit the calculation of accurate RRs for individuals below 15 years of age. Furthermore, many factors that interact with life expectancy could not be considered due to the limitations of the available data. The scientific literature has highlighted that each individual factor (immobility, incontinence, swallowing problems and the presence and level of intellectual disability) has a distinct negative impact on life expectancy. Therefore, it is reasonable to assume that life expectancy decreases with the presence of multiple factors [2].
Lastly, the linkage procedure between the survey population and death records was successful in 92% of cases. It is possible that there may be a selection bias in the remaining 8% of the study population, although this would have a limited impact on the results. However, health status is unlikely to affect the record linkage result because the key is based on sociodemographic variables.
5. Conclusions
This study provides robust and population-representative evidence on the life expectancy gap between individuals with and without disabilities, offering valuable insights for policy evaluation and planning. In Italy, 47.7% of people with disabilities under the age of 40 live with two parents, 15.3% live with a single parent and 9.5% live alone. These individuals are at risk of being left without assistance in the future. Therefore, it is essential to understand the life expectancy of people with disabilities for policy planning, particularly when designing interventions to support those who lose parental or spousal care. Due to the lack of a registry for the disabled population or longitudinal studies on this group, estimating survival is highly complex. Without certain assumptions, it would have been impossible to produce estimates based on cross-sectional data. The resulting estimates indicate a low level of uncertainty, as evidenced by the confidence intervals associated with the point estimates. Future efforts to improve these estimates will aim to replicate the methodology using data from multiple health surveys and additional years of mortality data.
In conclusion, the life expectancy of a 15-year-old boy is 59.1 years, whereas for a 15-year-old girl it is 66.2 years. This is lower than the life expectancy in the general population, where the expected years of life at age 15 are 66.8 for men and 70.8 for women. Based on these estimates, a 15-year-old boy living with one or two 40-year-old parents, on average, would expect to spend 5 to 8 years without at least one parent. This aspect is important for planning policies for families with persons with disabilities.
Author Contributions
Aldo Rosano (AR), Alessandro Solipaca (AS), and Luisa Frova (LF) contributed to the conceptualization and design of the study. Stefano Marchetti (SM), Gabriella Sebastiani (GS) Paola Di Filippo (PdF) and Lucilla Scarnicchia (LS) were responsible for data collection. AR was responsible for data analysis, AR and AS contributed to data interpretation. AR and AS wrote the original draft of the manuscript. LF and SM provided critical revisions. All authors have read and approved the final version of the manuscript.
Funding
This research received no external funding
Data Availability Statement
Data used in this study may be obtained from the Italian Health Interview Survey 1999-2000 (HIS) linked to the Italian Register of causes of death through 2012 and are not publicly available.
Acknowledgments
This paper is the result of a collaboration agreement between ISTAT and INAPP (ISTAT COD08 No. 3/PRES/20.01.2016)
Conflicts of Interest
The authors declare no conflicts of interest
Abbreviations
The following abbreviations are used in this manuscript:
| ADL | Activities Daily Living |
| CI | Confidence Intervals |
| HIS | Health Interview Survey |
| HR | Hazard Ration |
| OECD | Organization for Economic Co-operation and Development |
| RR | Risk Ratio |
| TP | Transition probabilities |
References
- Strauss, D.; Shavelle, R. Life Expectancy of Persons with Chronic Disabilities. Journal of Insurance Medicine 1998, 30, 96–108. [Google Scholar] [PubMed]
- Thomas, R.; Barnes, M. Life Expectancy for People with Disabilities. NeuroRehabilitation 2010, 27, 201–209. [Google Scholar] [CrossRef] [PubMed]
- Verbrugge, L.M.; Jette, A.M. The Disablement Process. Social science & medicine 1994, 38, 1–14. [Google Scholar] [CrossRef]
- Majer, I.M.; Nusselder, W.J.; Mackenbach, J.P.; Klijs, B.; Van Baal, P.H. Mortality Risk Associated with Disability: A Population-Based Record Linkage Study. American journal of public health 2011, 101, e9–e15. [Google Scholar] [CrossRef]
- Moretti, M.; Riffe, T.; Lorenti, A. Multistate Analysis and Decomposition of Disability-Free Life Expectancy Trends at Mid-to-Older Ages in Italy, 2004–19. Population Studies 2025, 1–16. [Google Scholar] [CrossRef]
- McWhinnie, J.R. Disability Assessment in Population Surveys: Results of the OECD Common Development Effort. Revue d’épidémiologie et de santé publique 1981, 29, 413–419. [Google Scholar] [PubMed]
- Katz, S.; Downs, T.D.; Cash, H.R.; Grotz, R.C. Progress in Development of the Index of ADL. The gerontologist 1970, 10, 20–30. [Google Scholar] [CrossRef]
- Katz, S. Assessing Self-Maintenance: Activities of Daily Living, Mobility, and Instrumental Activities of Daily Living. Journal of the American Geriatrics Society 1983, 31, 721–727. [Google Scholar] [CrossRef]
- Jee, M.; Or, Z. Health Outcomes in OECD Countries: A Framework of Health Indicators for Outcome-Oriented Policymaking; 1999. [Google Scholar] [CrossRef]
- Kabuche, D.; Sherris, M.; Villegas, A.M.; Ziveyi, J. Pooling Functional Disability and Mortality in Long-Term Care Insurance and Care Annuities: A Matrix Approach for Multi-State Pools. Insurance: Mathematics and Economics 2024, 116, 165–188. [Google Scholar] [CrossRef]
- Fong, J.H.; Shao, A.W.; Sherris, M. Multistate Actuarial Models of Functional Disability. North American Actuarial Journal 2015, 19, 41–59. [Google Scholar] [CrossRef]
- Kessy, S.; Shen, Y.; Sherris, M.; Temple, J.; Ziveyi, J. Estimating Transition Probabilities Using Repeated Cross-Sectional Data. In UNSW Business School Research Paper Forthcoming; 2024. [Google Scholar] [CrossRef]
- Albarran, I.; Ayuso, M.; Guillén, M.; Monteverde, M. A Multiple State Model for Disability Using the Decomposition of Death Probabilities and Cross-Sectional Data. Communications in Statistics—Theory and Methods 2005, 34, 2063–2075. [Google Scholar] [CrossRef]
- Moffitt, R. Identification and Estimation of Dynamic Models with a Time Series of Repeated Cross-Sections. Journal of econometrics 1993, 59, 99–123. [Google Scholar] [CrossRef]
- Rickayzen, B.D.; Walsh, D.E. A Multi-State Model of Disability for the United Kingdom: Implications for Future Need for Long-Term Care for the Elderly. British Actuarial Journal 2002, 8, 341–393. [Google Scholar] [CrossRef]
- Hariyanto, E.A.; Dickson, D.C.; Pitt, D.G. Estimation of Disability Transition Probabilities in Australia II: Implementation. Annals of Actuarial Science 2014, 8, 156–175. [Google Scholar] [CrossRef]
- Schoenfeld, D. Partial Residuals for the Proportional Hazards Regression Model. Biometrika 1982, 69, 239–241. [Google Scholar] [CrossRef]
- Pregibon, D. Goodness of Link Tests for Generalized Linear Models. Journal of the Royal Statistical Society Series C: Applied Statistics 1980, 29, 15–24. [Google Scholar] [CrossRef]
- Strauss, D.J.; Shavelle, R.M.; Anderson, T.W. Long-Term Survival of Children and Adolescents after Traumatic Brain Injury. Archives of physical medicine and rehabilitation 1998, 79, 1095–1100. [Google Scholar] [CrossRef]
- Strauss, D.J.; Shavelle, R.M.; Anderson, T.W. Life Expectancy of Children with Cerebral Palsy. Pediatric neurology 1998, 18, 143–149. [Google Scholar] [CrossRef]
- Zheng, X.; Chen, S. Life Expectancy of People with Physical Disabilities in China. Zhonghua liu Xing Bing xue za zhi= Zhonghua Liuxingbingxue Zazhi 2011, 32, 693–696. [Google Scholar] [PubMed]
- Bahk, J.; Kang, H.-Y.; Khang, Y.-H. Disability Type–Specific Mortality Patterns and Life Expectancy among Disabled People in South Korea Using 10-Year Combined Data between 2008 and 2017. Preventive Medicine Reports 2022, 29, 101958. [Google Scholar] [CrossRef] [PubMed]
- Smythe, T.; Kuper, H. The Association between Disability and All-Cause Mortality in Low-Income and Middle-Income Countries: A Systematic Review and Meta-Analysis. The Lancet Global Health 2024, 12, e756–e770. [Google Scholar] [CrossRef] [PubMed]
- Cambois E Population Estimates of Disability. The Impact of Including or Not the Population Living in Institutions. Presented at the Meeting of the 9th Washington group, Dar Es Salaam, 2009.
- Tarazona, B.; González-Enríquez, J.; Almazan-Isla, J.; Alcalde-Cabero, E.; de Pedro-Cuesta, J.; Galan, I. Validity of the Global Activity Limitation Indicator (GALI) to Evaluate Severity of Disability. European Journal of Public Health 2021, 31, 539–540. [Google Scholar] [CrossRef] [PubMed]
- Van Den Brink, C.L.; Tijhuis, M.; Kalmijn, S.; Klazinga, N.S.; Nissinen, A.; Giampaoli, S.; Kivinen, P.; Kromhout, D.; Van Den Bos, G.A. Self-Reported Disability and Its Association with Performance-Based Limitation in Elderly Men: A Comparison of Three European Countries. Journal of the American Geriatrics Society 2003, 51, 782–788. [Google Scholar] [CrossRef] [PubMed]
Figure 1.
Transition probabilities from health status to disability status by age and sex.
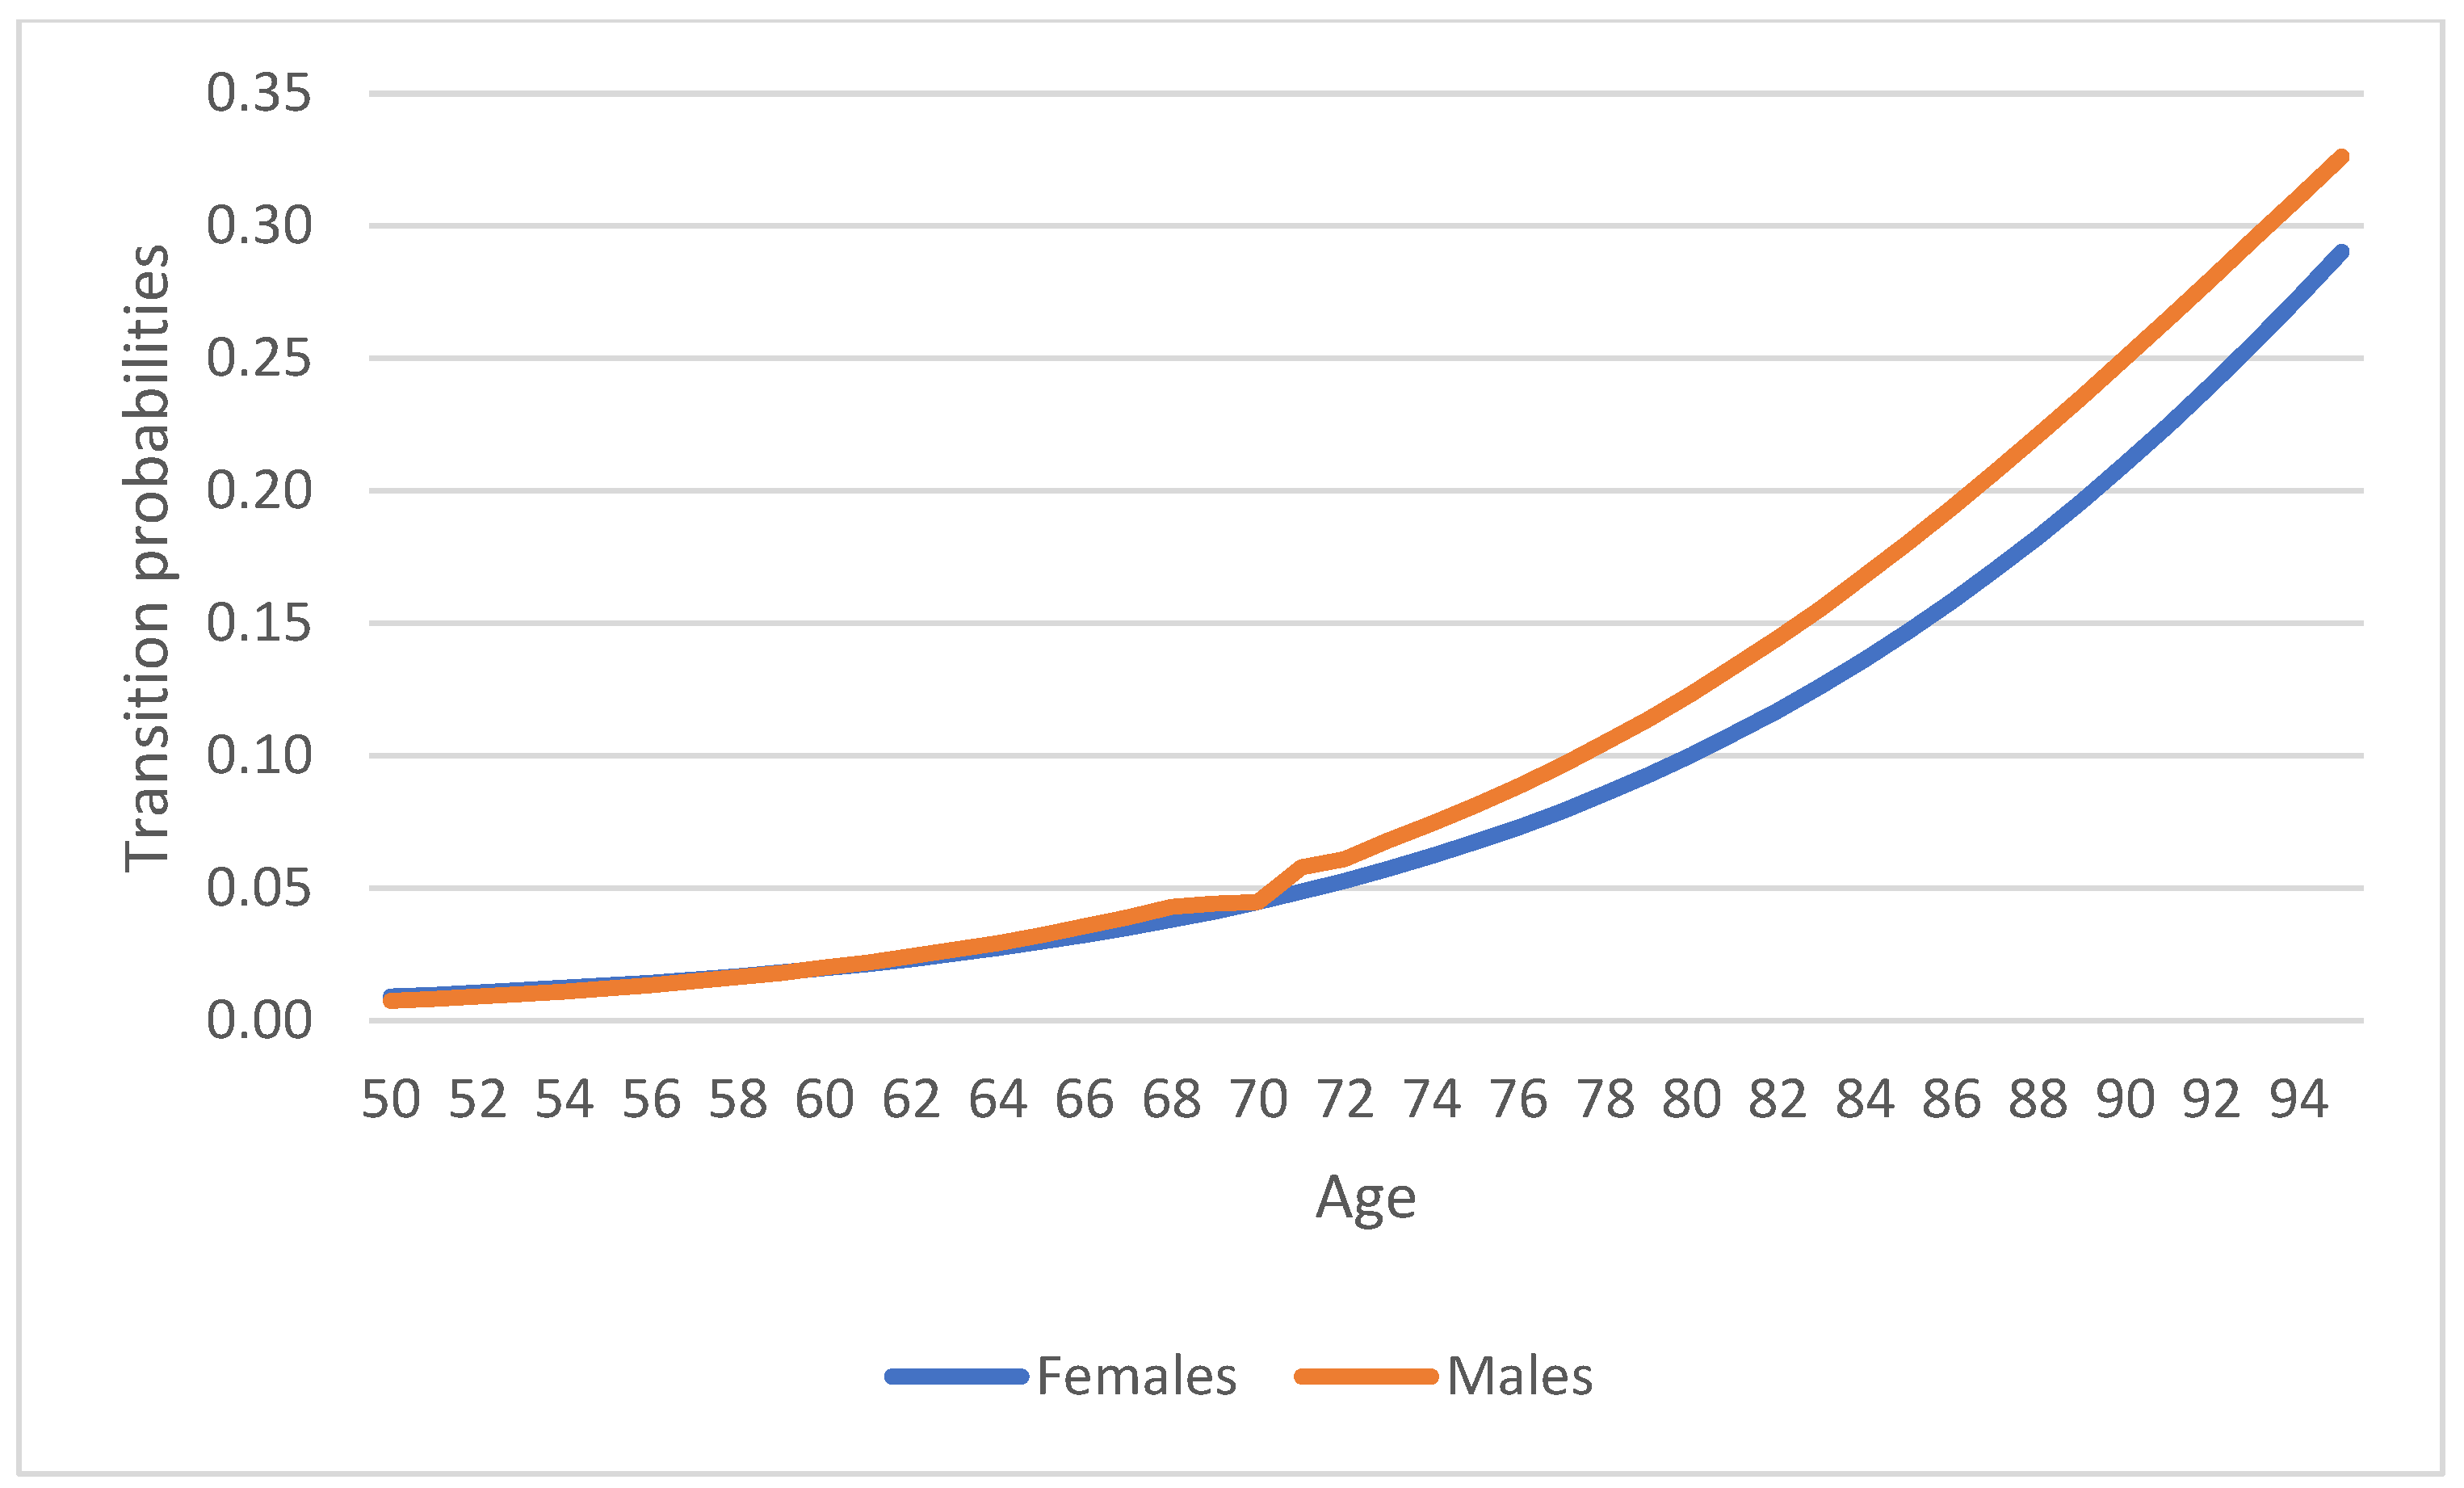
Figure 2.
Interpolation of RRs with a spline cubic equation.
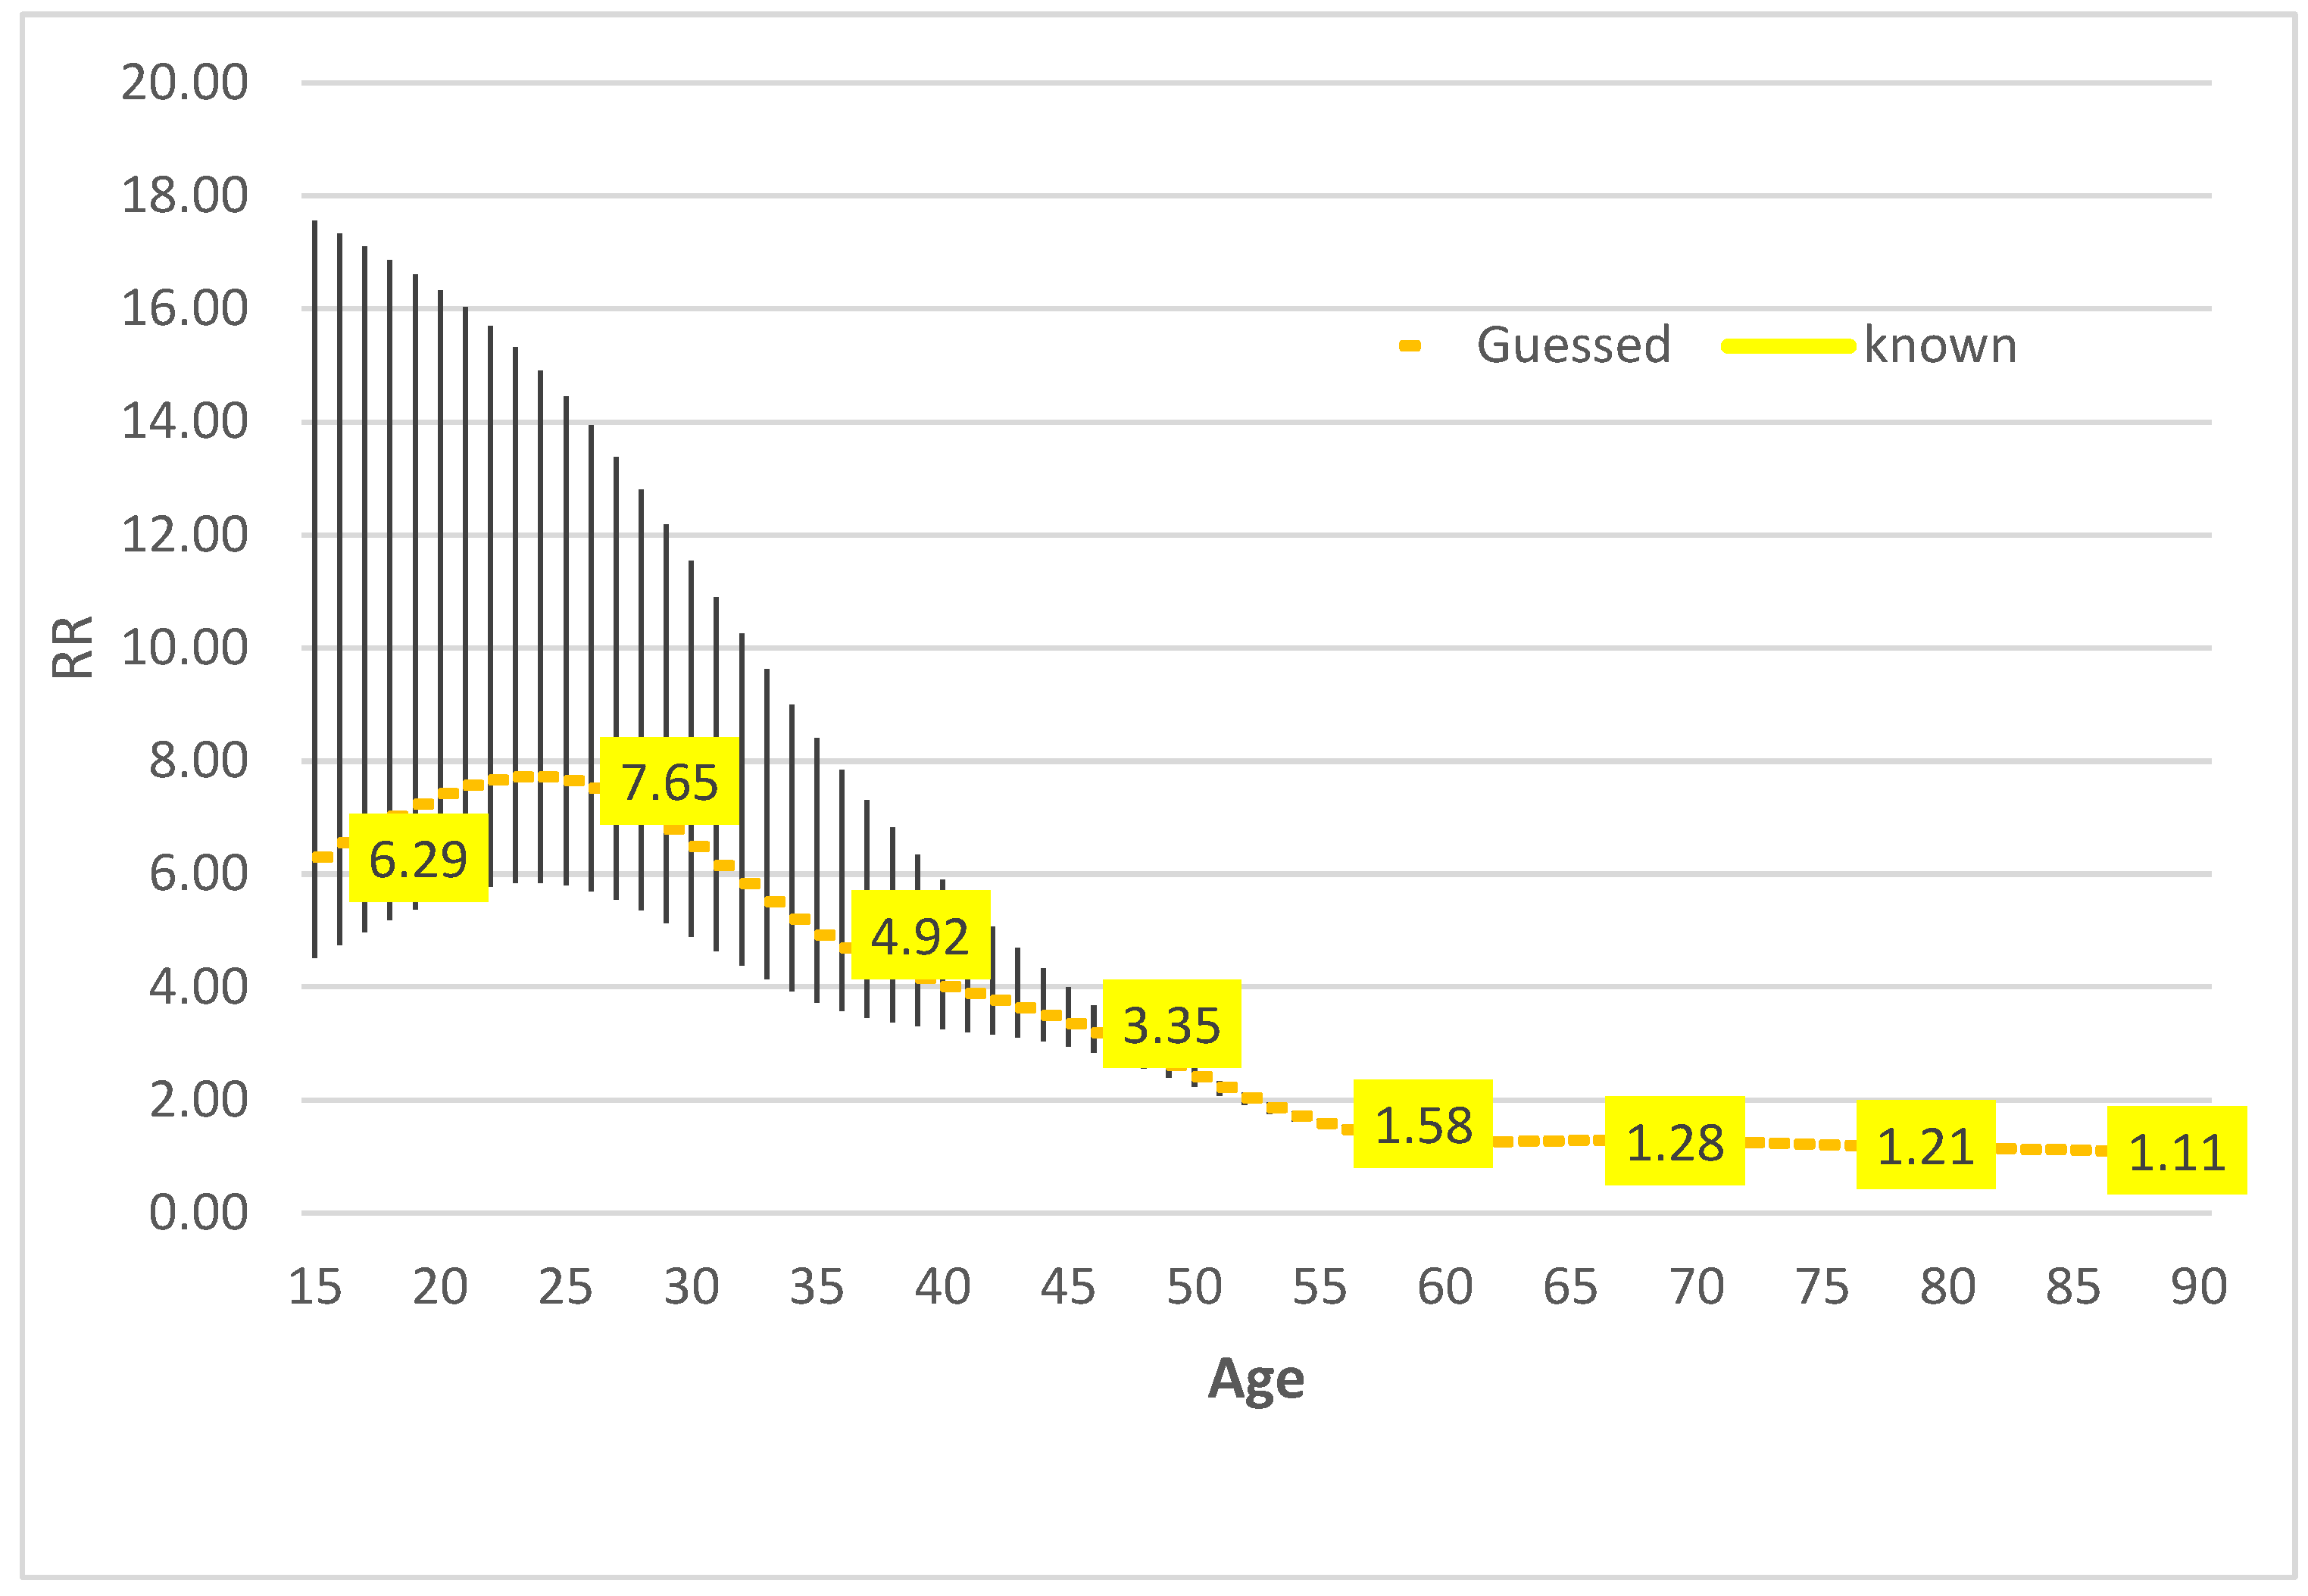
Figure 3.
Life expectancy (LE) of general population and persons with disabilities, with 95% confidence intervals (LL=Lower Limits; UL= Upper Limits) – Females.
Figure 3.
Life expectancy (LE) of general population and persons with disabilities, with 95% confidence intervals (LL=Lower Limits; UL= Upper Limits) – Females.
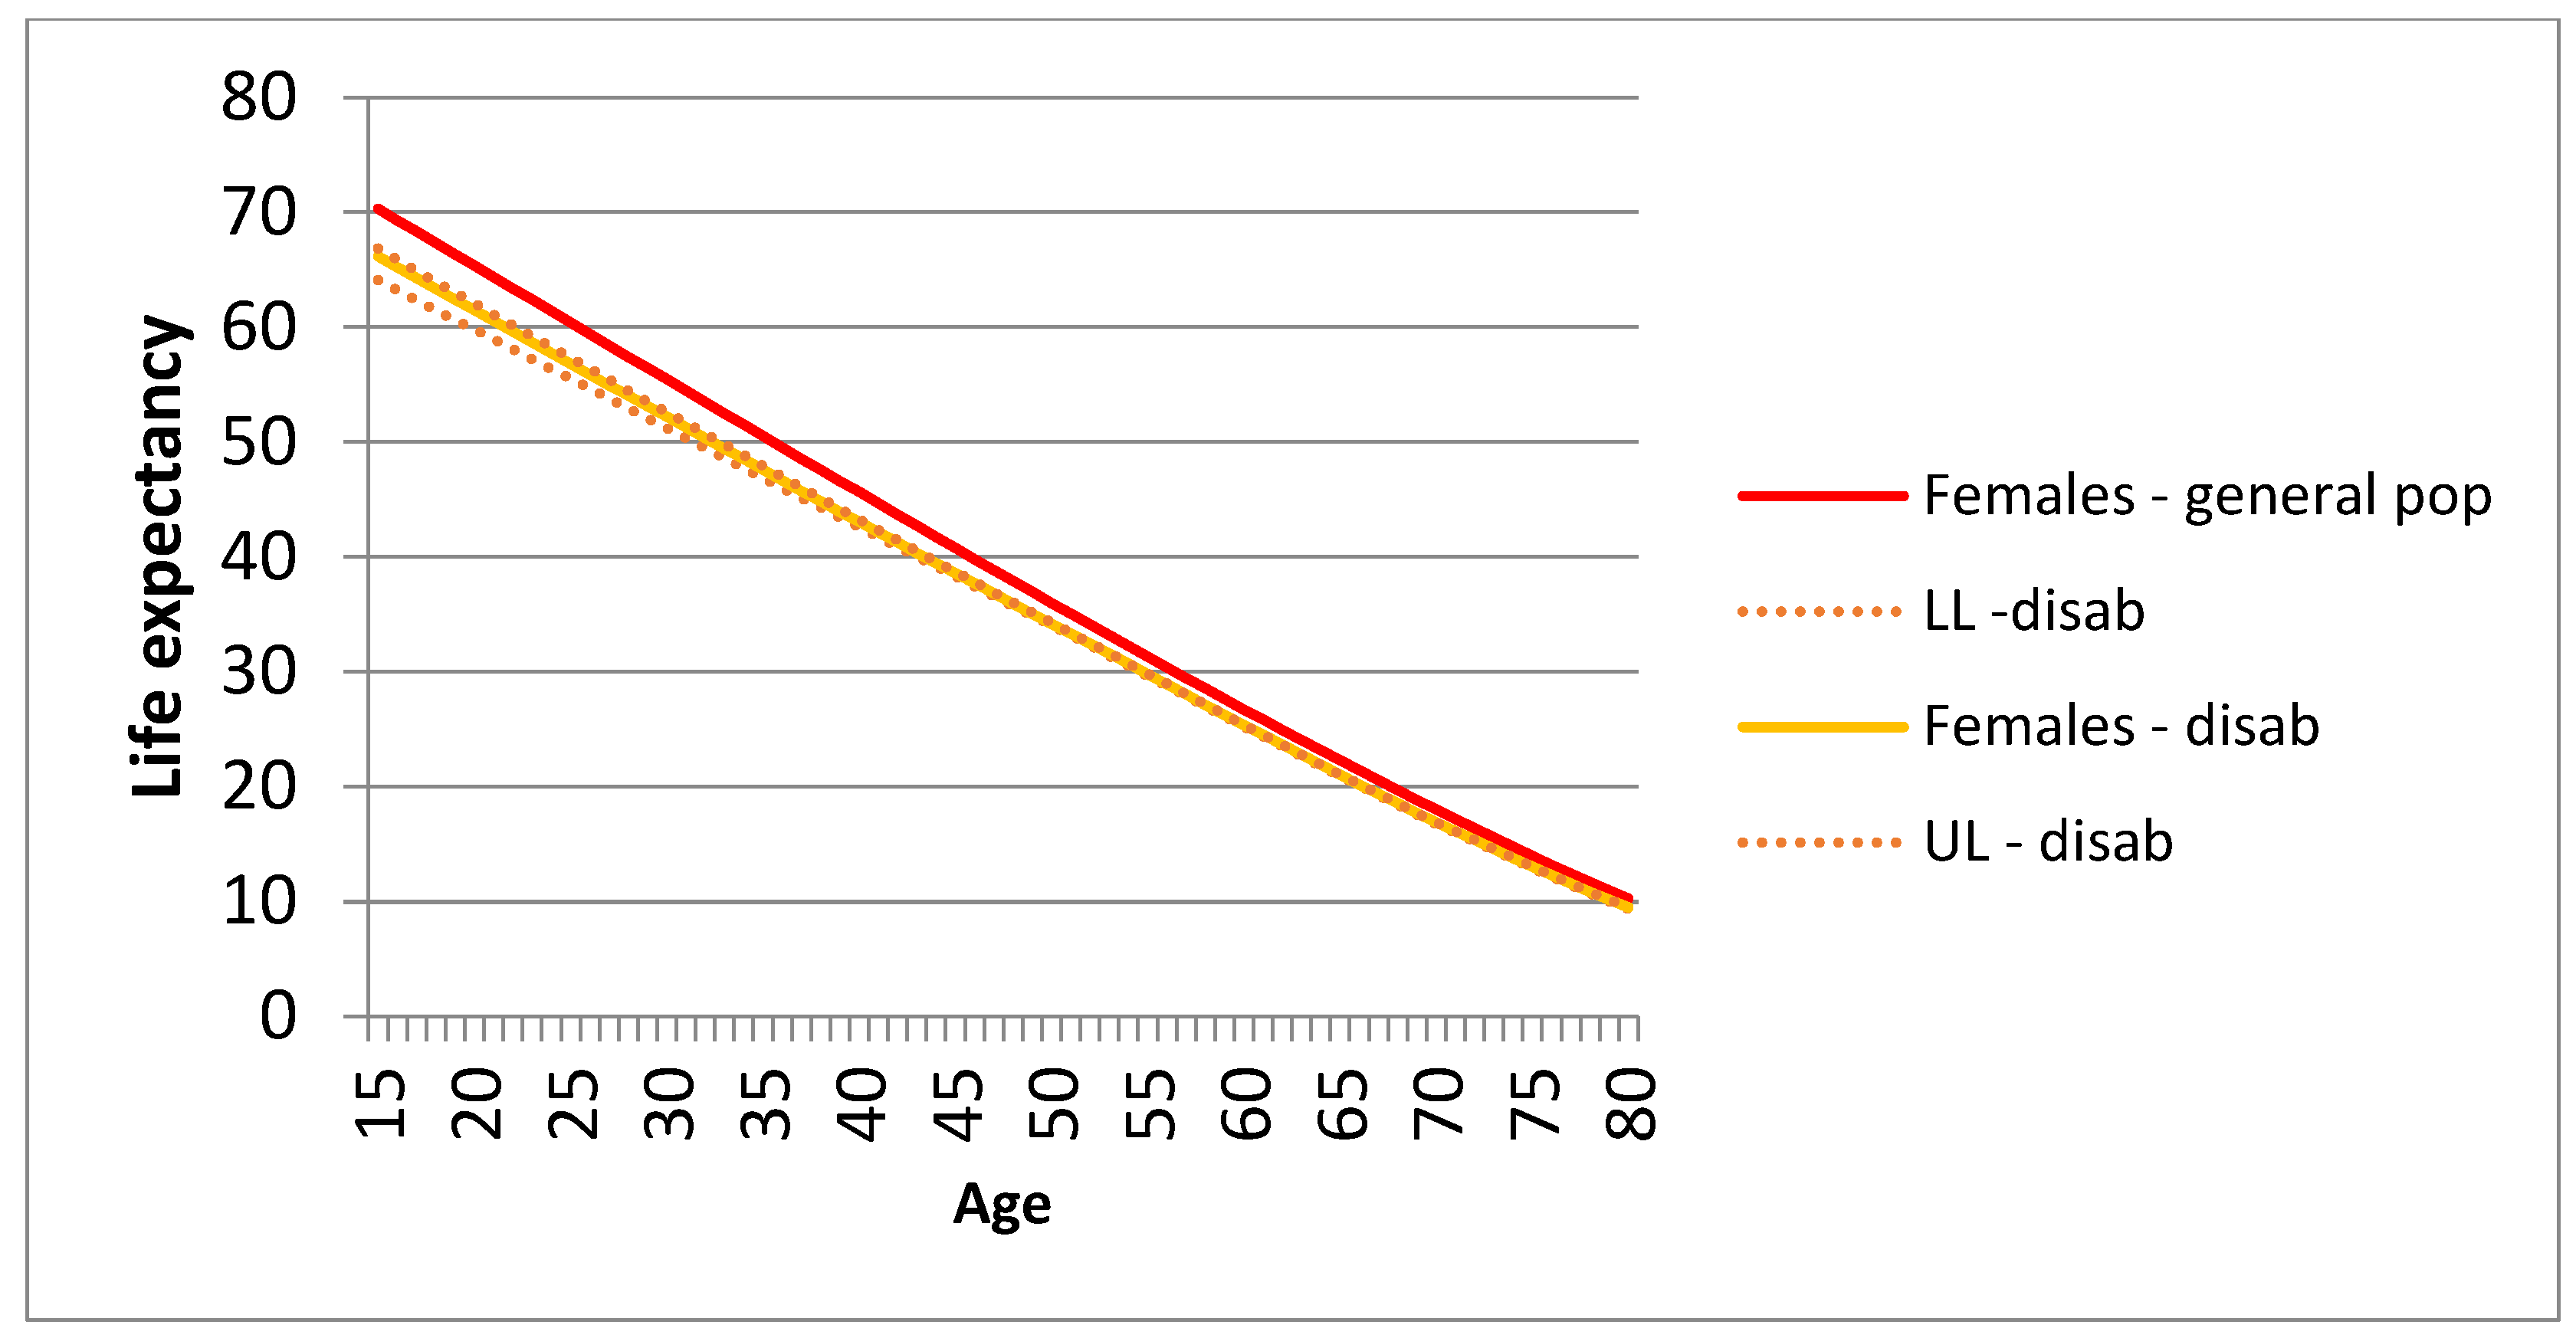
Figure 4.
Life expectancy (LE) of general population and persons with disabilities, with 95% confidence intervals (LL=Lower Limits; UL= Upper Limits) – Males.
Figure 4.
Life expectancy (LE) of general population and persons with disabilities, with 95% confidence intervals (LL=Lower Limits; UL= Upper Limits) – Males.
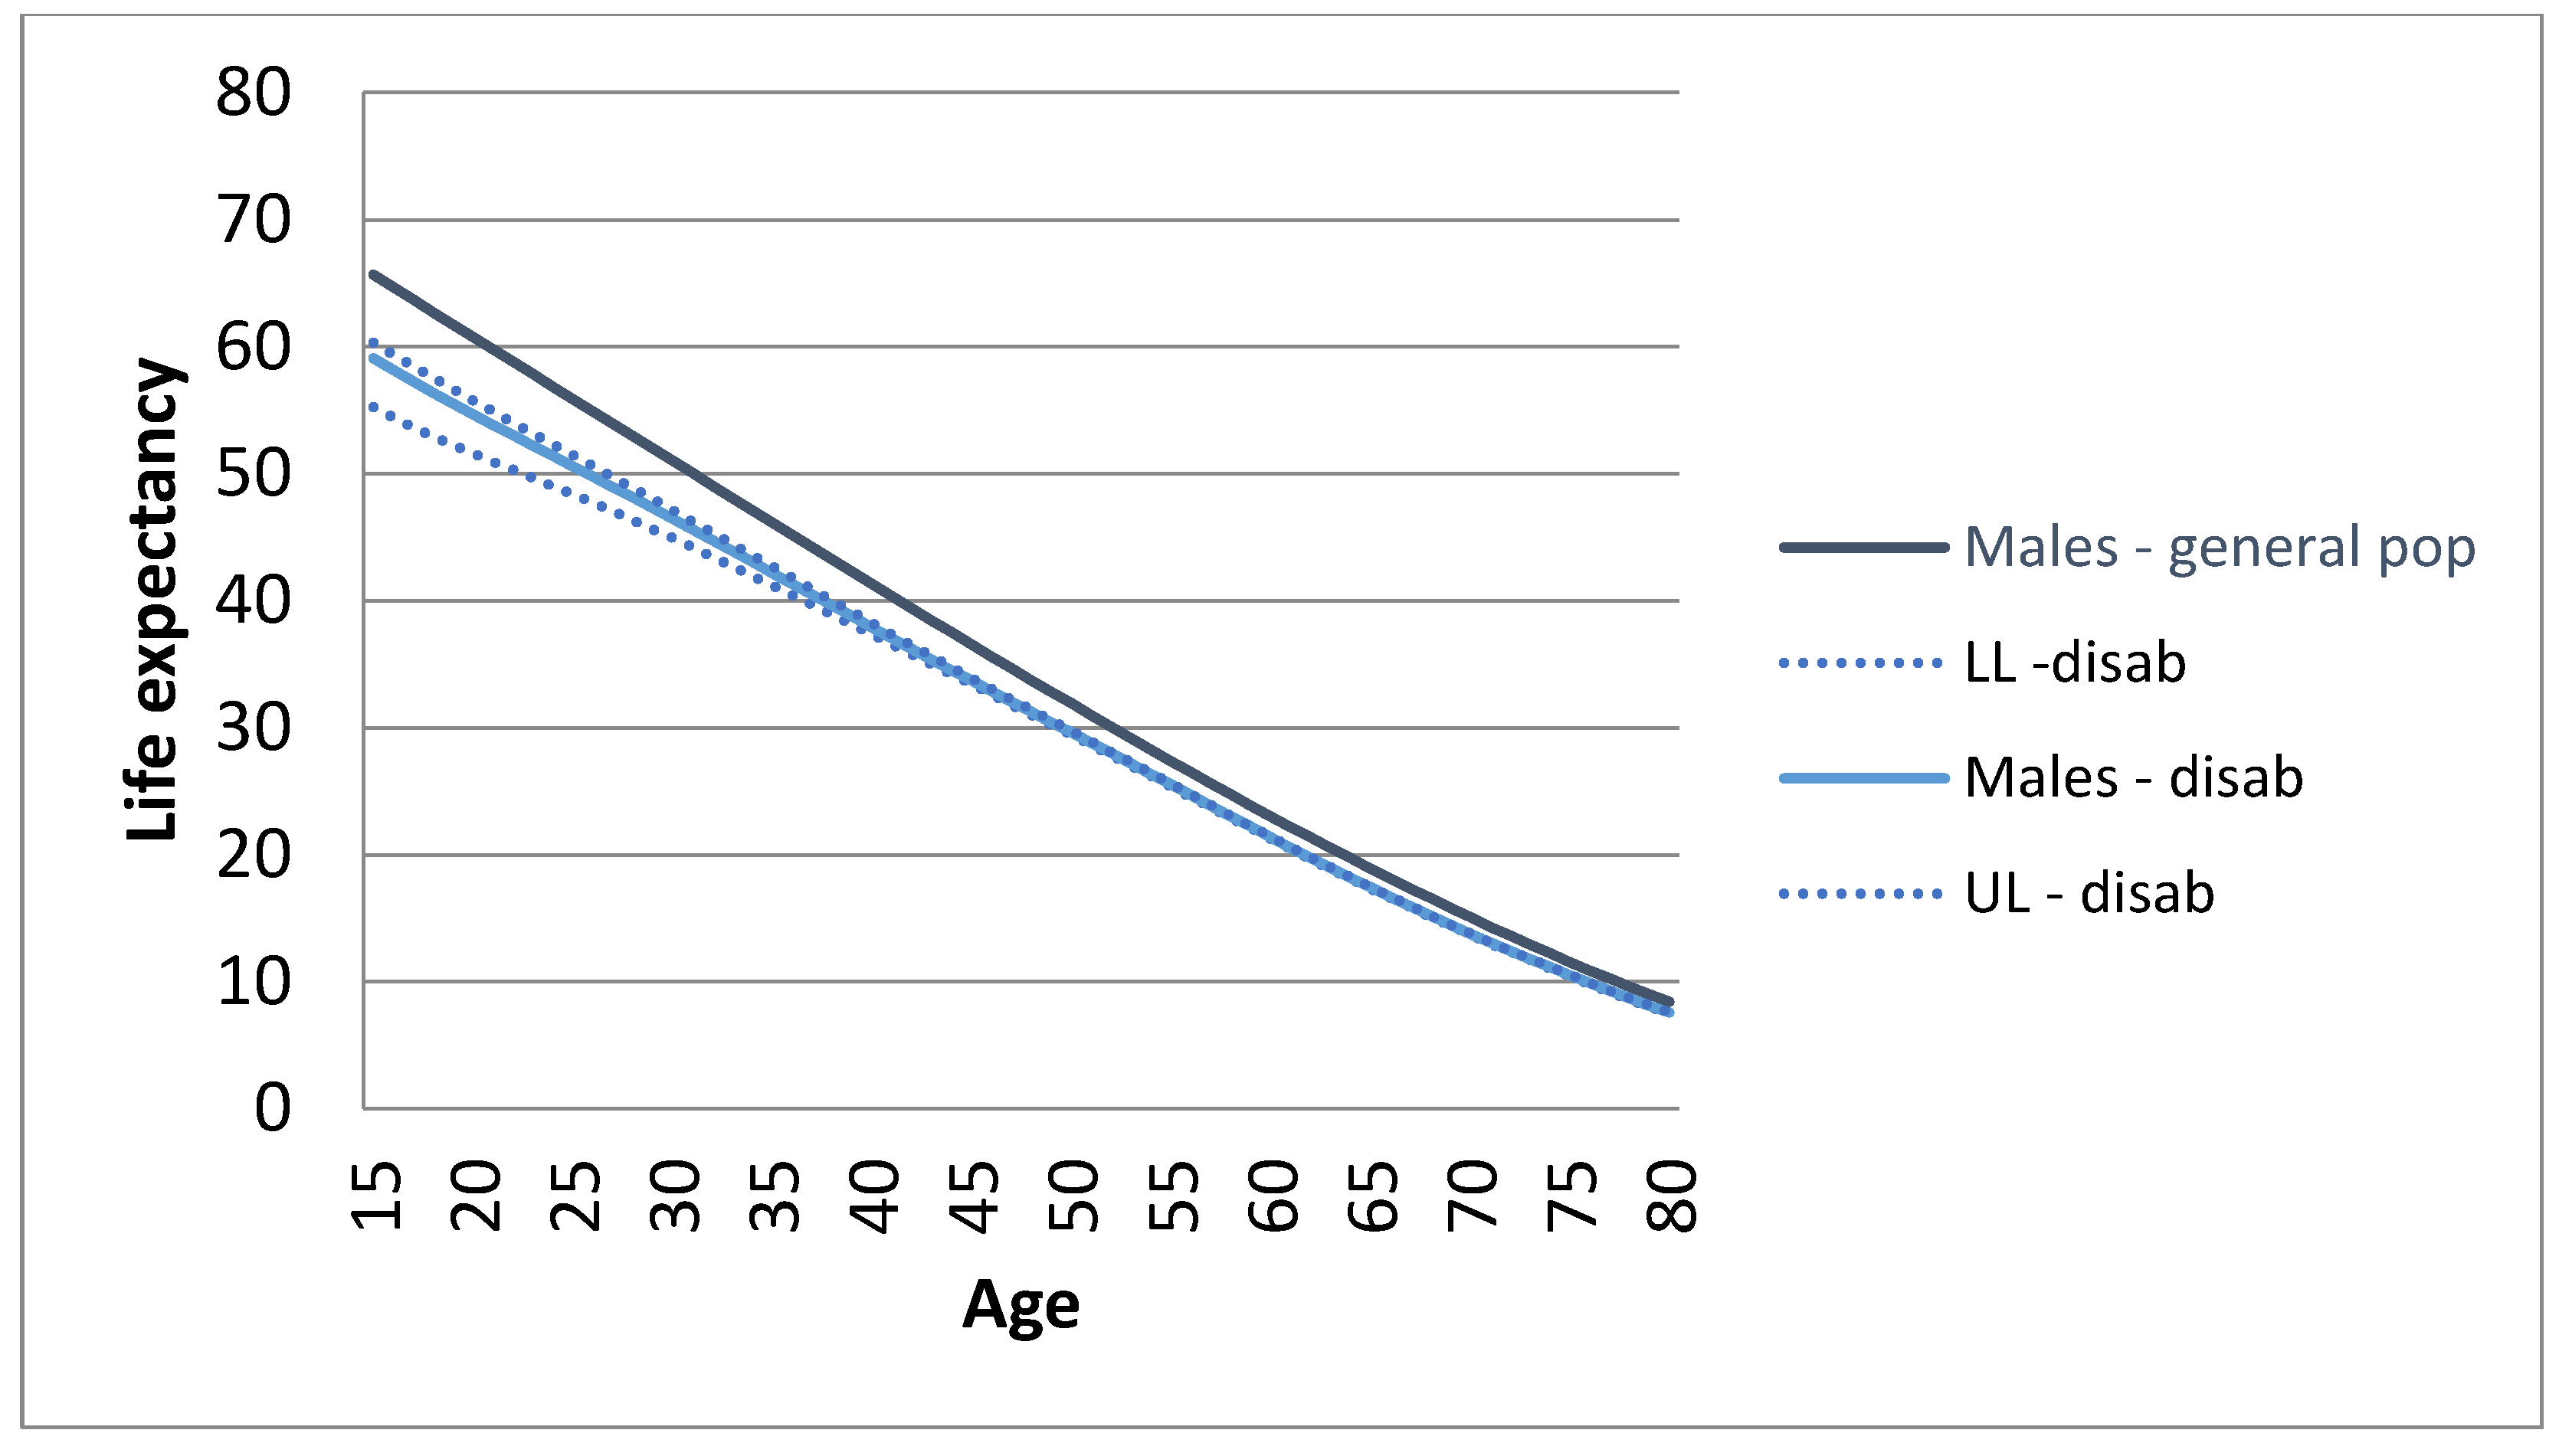
Table 2.
Ratio of the risk of death (RR) of persons with disabilities compared that of all respondents in the 1999-2000 HIS, and 95% confidence intervals: lower limits (LL) upper limits (UL).
Table 2.
Ratio of the risk of death (RR) of persons with disabilities compared that of all respondents in the 1999-2000 HIS, and 95% confidence intervals: lower limits (LL) upper limits (UL).
| Age class | RR | LL | UL |
|---|---|---|---|
| 15-24 | 6.29 | 4.52 | 17.56 |
| 25-34 | 7.65 | 5.80 | 14.45 |
| 35-44 | 4.92 | 3.73 | 8.41 |
| 45-54 | 3.35 | 2.95 | 3.99 |
| 55-64 | 1.58 | 1.51 | 1.66 |
| 65-74 | 1.28 | 1.26 | 1.29 |
| 75-84 | 1.21 | 1.22 | 1.21 |
| 85+ | 1.11 | 1.13 | 1.10 |
Disclaimer/Publisher’s Note: The statements, opinions and data contained in all publications are solely those of the individual author(s) and contributor(s) and not of MDPI and/or the editor(s). MDPI and/or the editor(s) disclaim responsibility for any injury to people or property resulting from any ideas, methods, instructions or products referred to in the content. |
© 2026 by the authors. Licensee MDPI, Basel, Switzerland. This article is an open access article distributed under the terms and conditions of the Creative Commons Attribution (CC BY) license (http://creativecommons.org/licenses/by/4.0/).
Copyright: This open access article is published under a Creative Commons CC BY 4.0 license, which permit the free download, distribution, and reuse, provided that the author and preprint are cited in any reuse.


